These documents and resources are provided solely to members of the Environmental Bankers Association, Inc. (EBA) for informational purposes only. EBA members are authorized to use these materials for internal reference or training purposes, but are not authorized to disseminate or publish any portion of the document to non-EBA members or the general public without prior written consent from EBA. Non-EBA members are not authorized to use these materials for any purpose without the prior written approval of the EBA. Neither the EBA, nor any of its directors, officers, employees or agents, nor any of the Authors makes any representations or warranties, express or implied, or assumes any legal liability for the completeness, reliability, timeliness, currency, accuracy or usefulness of the information provided herein, or for the applicability of the information provided herein to the facts and circumstances particular to any specific use, including but not limited to information found through any links or references to resources, case studies, projects and/or services referred to within these resources.
The viewpoints and information provided by the Authors is their personal viewpoints and information, and not the viewpoints or information of the organizations of which they are employed or affiliated.
Any action taken based upon the information provided in or through these documents and resources is done so strictly at your own risk. Neither the EBA nor any of the Authors shall be liable for any damages of any nature incurred as a result of or in connection with the use of this information. These materials and the information herein do not constitute legal or other professional advice or opinion. It is recommended that you seek appropriate legal or other professional advice to determine whether any advice, actions or practices referenced within these resources is appropriate or legally correct in your jurisdiction.
Some of the material provided herein has been published with permission of the copyright holder and is not the copyrighted content of the EBA. Where applicable, attribution to the copyright holder has been given herein. No permission is granted to republish any such content without seeking express permission of the copyright holder.
A Higher Standard: Understanding the SBA’s Environmental Due Diligence Requirements
Spotlighting New Members
EBA Committee Updates
Highlights from Recent Developments in Standards and Training
Navigating the Complex Community Engagement Requirements as Part of Site Cleanups
Resiliency: a unifying concept of ESG, Disaster Risk Management and Sustainable Development
What is This?
Part Two: the Science Behind the Future of Brownfields Redevelopment Using LowImpact Low-Cost Soil and Groundwater Biostimulation Strategies
Mid-Year PFAS Regulatory Update
Creating PFAS Risk Matrices for Your ERM Team
82-83 PFAS Was Identified in Your Phase I: Now What? 81-82 A Funny Thing Happened on My Way to a Phase I…
81-82 How FEMA’s Hazus Model Helps Stage 2 of ASTM’s Forthcoming Property Resilience Assessment (PRA) Guide
81-82 How Learning Together Sparked Discussion about the Future of Environmental Careers
Developing Self-Awareness: A Key to Successful Leadership and Teaming
Welcome to EBA
A Message from the President
A MESSAGE FROM THE PRESIDENT
EBA President
David Lambert, Wells Fargo Bank
Welcome to EBA’s 2024 Virtual Conference! I hope you enjoy the great value afforded by the inclusivity of the virtual format. It allows greater participation from traditional environmental risk staff while opening the door to other functions within member organizations. As always, the volunteers of the Conference Committee, chaired by Jennifer Bellamy, have put together a fantastic agenda full of relevant hot topics like climate risk, PFAS, and perspectives from regulators that will help us understand and manage environmental risk. I can’t recall a time in the environmental industry when keeping abreast of industry developments is more important than it is today.
BUILDING OUR FUTURE
Since the San Diego Annual Conference in February, the volunteers of EBA’s Board of Governors (BOG) and Committees have continued accomplishing the important work of building the EBA’s future. We made fantastic progress on our top strategic goal: increasing membership value by enhancing the depth, breadth, and quality of educational opportunities. Given the very heavy lift involved, I can’t thank each and every volunteer enough! Some highlights:
➢ Environmental Risk Manager Certificate Program Launch: The first cohort was successfully completed in April/May with 20 members attending. This cohort represents the first certificates issued by EBA. A feedback session was conducted to refine course content, logistics, and instruction techniques. I’m happy to report the second cohort of 25 is sold out and will commence in September.
➢ Education Program Strategic Plan: This plan is a roadmap for future educational offerings and associated organizational needs which will inform EBA’s budgeting cycles, provide direction for committees, and guide course development. Next on the docket will be development of an ESG course in the coming months. Additionally, we are finalizing the work necessary for formal International Accreditors for Continuing Education and Training (IACET) accreditation of the EBA’s training program.
➢ Annual Conference: We finalized the hotel contract and have begun preparations for the 2025 Annual Conference to be held at the Loews Vanderbilt Hotel in Nashville, TN on February 3rd - 6th. I look forward to seeing everyone in person early next year.
➢ New Board Member: Siri Hill of Woodforest National Bank was appointed to an open Board seat earlier in the year. Welcome Siri!
➢ Board Election Nominations: BOG elections will occur in the coming months. There are open positions for Treasurer, Secretary, Governors, and Affiliate Governor. The Nomination Committee has been formed and will begin recruiting candidates. If you are interested in serving, please reach out to John Rybak or me.
A big thank you to our sponsors for supporting EBA’s mission, inclusive of this conference! Please make a point of visiting the virtual exhibits and thanking them personally. Likewise, the BOG is here to serve the membership, so feel free to provide feedback or ask questions.
At the start of 2024, the most bullish forecasters expected that the Fed would begin to lower interest rates by the second quarter, sending a positive signal that the high borrowing costs that curtailed lending for much of 2023 were in the rear-view mirror. Instead, in the first five FOMC meetings of the year, the Fed held fast to its ‘higher for longer’ position, and as of the end of August, interest rates have not budged in more than a year. The market is working through a challenging chapter with occupancy and rental rates in flux in some segments, as well as continued price uncertainty, and high operating and financing costs.
The good news is that the interplay of factors that challenged commercial real estate activity last year a bid-ask gap between buyers and sellers, the lack of price certainty, and financing challenges—are finally showing signs of modest improvement. Notable transactions are helping with price discovery and in some asset classes, signaling that prices are bottoming out and the window of opportunity may be opening. As the market approaches the end of the 3rd quarter and a divisive Presidential election, several trends are worth noting that have implications for commercial real estate lending and property risk management.
1) A promising July inflation report paved the way to a likely September rate cut.
2024 has been a year of pushing out projections of a Fed interest rate cut from March to June to July and now September. In what may be the most promising news for the market this summer, July’s inflation rate dipped below 3% for the first time since 2021, almost ensuring that the Fed will cut rates in midSeptember. While that will certainly provide some relief to commercial real estate lenders, concerns about the impact of a growing wave of distressed assets are intensifying.
2) The turnover of struggling office assets is underway.
Recent sales prices, especially for struggling downtown Class B and C office properties, have been disappointing and lender portfolios of foreclosed and seized office buildings, apartments and other commercial properties grew 13% in the second quarter to its highest level since 2015. The office sector is challenged by rising operating costs, record-high vacancy rates in some metros, and declining values. The turnover of office assets that has only just begun could result in a significant transfer of ownership in some metros like New York City, Chicago, and San Francisco. The post-COVID period of adjustment to lower demand for office space, the transfer of struggling assets, and, in some cases, the redevelopment of office towers into alternative uses is now underway, leading to losses for some and opportunities for others.
3) US Phase I ESA activity continues slow growth trajectory.
Despite concerns about distress, still-high rates and general market uncertainty, Q2 2024 delivered the second consecutive quarter of increases in Phase I environmental site assessment (ESA) activity. After hitting a three-year low in Q4 2023, Phase I ESA activity increased by 11% in Q1 and another 13% in the latest quarter. This recent path closely mirrors 2023, but with notable differences in market conditions. Q2 volume sits just 7% below the quarterly average denoted by the dashed line in the figure, compared to a gap of 18% in Q1. While it is very unlikely that Phase I ESA volume will recover back to the record-high levels of 2021 and early 2022, it could very well surpass the quarterly average in late 2024 or early 2025 if interest rates begin to come down and sellers show more willingness to adjust pricing to the expectations of today’s buyers.
4) Pessimism is transitioning to cautious optimism as capital moves into play.
Evidence that early movers are ready to deploy capital for the right transactions is growing, adding to a growing sense of cautious optimism. Phase I ESA industry leaders on the new LightBox Market Advisory Council (many of whom are EBA members) reported early signs of opportunistic private capital deployment in Q2 as the market more generally accepts high rates as the “new normal.” In lending, traditional banks are still slow to rebound, while some Advisory Council members report large CMBS issuers bringing deals to market, which is “pressuring other market makers to compete.”
5) Loan sales and modifications are on the rise.
The wall of loan maturities that many forecasted has not translated into massive defaults thus far. Portfolios of non-performing loans are changing hands as banks and debt funds attempt to limit their exposure to CRE risk and increase liquidity, as often happens at this stage of the market cycle. Loan modifications are up which is limiting the volume of distress on the selling block. In one deal, Morgan Stanley announced plans to buy about $700 million of CRE loans on the books of failed Signature Bank. In another, Washington Federal sold nearly $3 billion of loans to Bank of America, another example that banks selling loans are finding willing buyers. While some are predicting widespread bank failures ahead, the fact that private capital is jumping in to buy discounted CRE loans should mitigate any significant risks to the banking system.
The second half of 2024 will not be without its challenges, but the industry is in a critical period of transition and has begun the long process of unraveling distress. Valuations and the shortage of reliablecomparables continue to challenge deal closings, but this should improve with more transactions. Headlines by big name investors like Blackstone, Goldman Sachs and others using terms like “opportunity of a lifetime” send strong messages to other investors that the time to move may be here. The gradual increase in transactions will serve to bring pricing into sharper focus, a clarity that was largely absent for much of last year.
A growing number of redevelopment projects is also moving forward, despite market uncertainty, to meet demand for converting obsolete office space to apartments, condos or student housing, or converting old malls and shopping centers to residential or mixed-use projects. For risk-averse lenders in a priceuncertain market, the input of skilled environmental professionals is more important than ever. Lenders are leaning more on their environmental consultants to understand a property’s risk, and even requiring Phase II sampling, before proceeding with a loan.
On the headwinds side, there are potentially significant factors with implications for the near-term forecast. If past election years are any indication, the presidential election may spur some investors to take a waitand-see stance and postpone investment decisions until later in the year. That, combined with seasonally slower Q4s in recent years, puts downward pressure on the forecast. In the short term, notwithstanding any significant market developments, the LightBox Phase I ESA Activity Index will likely remain relatively flat to modestly increasing through the end of the year, dependent on the timing of rate cuts and only a moderate disruption from the election and building on the momentum of late Q1 and Q2. Although market predictions are complicated by the wide range of uncertainties clouding the near-term forecast, it is worth noting that environmental professionals are more optimistic at midyear than they were in Q1 with guarded optimism for more opportunities in Q3 and Q4.
ABOUT THE AUTHOR
Dianne Crocker is the Research Director at Lightbox, and co-host of the new CRE Weekly Digest podcast. She is a highly respected expert on commercial real estate market trends and forecasting, property due diligence and risk management. With more than 20 years’ experience in the commercial real estate industry, she has analyzed the market through three cyclical downturns. In 2024, Globe St. Real Estate Forum recognized Dianne on its list of 9 professionals deserving of the Special Recognition: Mentor award. She was also honored to receive the Environmental Bankers Association’s 2023 Community Impact Award. In 2022, GlobeSt. included Dianne on their Women of Influence list that recognizes female CRE professionals for career achievements, community outreach and mentorship. She was also selected by Connect Media as one of ten national winners of the 2020 Women in Real Estate Awards, which honors the achievements and inspirational stories of women who have reached respected positions of leadership and play key mentorship roles for others. She is also a co-founder of LightBox’s Developing Leaders mentoring program, now in its sixth year of connecting young environmental professionals in the consulting and lending sectors with veteran mentors. Dianne is a passionate member of CREW Boston and CREW Network, and currently serves as a CREW Foundation Director.
A Higher Standard: Understanding the SBA’s Environmental Due Diligence Requirements
By Derek Ezovski, President, ORMS LLC
The U.S. Small Business Administration (SBA) offers lenders a flexible and lowrisk way to support small and growing businesses that may not qualify for conventional business loans. However, it’s important to keep in mind that the SBA’s environmental due diligence requirements are notably more rigorous than those demanded of standard lenders. The SBA’s latest Standard Operating Procedure (SOP 50 10 7.1, effective 11/15/23) is the best place to start when understanding environmental due diligence procedures for loans secured by commercial real estate.
Here are some key differences:
1. Reliance Letters: The SBA mandates the use of specific reliance letters for Phase I and Phase II Environmental site Assessments (ESAs), as well as for transaction screens. Although reliance letters are a common requirement for all types of lenders, the SBA goes a step further by requiring the firm conducting the assessment to submit the data in a specific format (i.e., ASTM E1527-21) and on an approved SBA form template.
2. Environmental Questionnaires: For loans up to $250,000, the SBA requires the borrower to complete an environmental questionnaire. The current owner or operator of the property must sign the form. If the owner refuses to sign, the SBA will require a more detailed transaction screen.
3. Records Search with Risk Assessment (RSRA): For loans exceeding $250,000, the SBA requires completion of an RSRA in addition to the environmental questionnaire. This assessment involves a thorough search of historical records and government databases to identify any potential contamination risks. This scrutiny level is more detailed than the typical due diligence performed by non-SBA lenders.
4. Phase I and Phase II ESAs: If initial assessments (like the RSRA) reveal potential environmental contamination, the SBA requires a Phase I ESA to be completed. If the Phase I ESA uncovers any recognized environmental conditions (RECs), then a Phase II will also be required. This tiered approach ensures a thorough investigation of potential environmental hazards, which may not always be required for conventional business loans.
5. Special-Use Facilities: In addition to the above general due diligence requirements, the SBA has carved out specific requirements for special-use properties like childoccupied facilities, dry cleaners, and gas stations. For example, child-occupied facilities (such as daycare centers) constructed before 1978 must undergo a Lead Risk Assessment (LRA), and all water sources must be tested for lead. In addition, dry cleaning facilities must undergo a Phase II ESA regardless of whether a REC has been identified. These requirements often exceed those imposed by state regulations.
6. Contamination and Remediation Plans: If contamination is confirmed, the SBA requires detailed remediation plans, including past and planned remediation activities, methodologies, costs, and potential impacts on collateral value. The SBA needs assurance that risks are sufficiently mitigated before proceeding with the loan.
7. Phase I ESA Requirements for High-Risk Properties: Properties identified on the NAICS Codes List of Environmentally Sensitive Industries (e.g., certain manufacturing sites) always require a Phase I ESA, regardless of the loan amount. This is a stricter standard than those generally applied by conventional lenders.
These enhanced due diligence requirements reflect the SBA's increased emphasis on minimizing environmental risks and protecting the borrower and the lender from potential liabilities.
Because the SBA’s environmental requirements are generally stricter than many states, the latest SOP serves as an excellent risk management roadmap for lenders of all stripes, whether or not you intend to make any SBA-guaranteed loans. As professional risk management consultants, we recommend all commercial lenders follow the SBA’s environmental due diligence guidance to ensure any potential risks are mitigated, and the institution is protected from liability and loss of collateral.
If you are already making SBA loans, we strongly recommend reviewing, understanding, and consulting the full SOP 50 10 7.1 to ensure that all new and existing environmental due diligence requirements are incorporated into your projects. We also urge you to consult with outside risk management professionals for help navigating and interpreting the latest guidance.
Spotlighting New Members
EBA would like to extend a warm welcome to all new members who have recently joined. We are excited to grow with you!
Affiliate Members
Bank Members
Can you Guess the AI Image?
Can you guess what prompt was entered to generate this AI image?
The prompts are related to the environmental industry.
Credit: Google Gemini
Answers Can be found on page 98.
Image 1
Image 2
Image 3
EBA Committee Updates
EBA Gives Back: Support Adaptive Wilderness Within Reach (AWWR)
Founded in 2022 by Sean & Jill Leary, AWWR’s mission is to make wild places more accessible for people with physical disabilities. Sean was paralyzed (SCI T11/12) in a motor vehicle accident in 2001 and graduated from Saint John’s University in 2006. Prior to his accident, Sean was an avid canoe and camping enthusiast. Sean and Jill met while Jill was guiding canoe trips and they married in 2010. Jill teaches high school Spanish and Sean is an environmental consultant. As Sean & Jill raise their family, they prioritize exploring nature and understand how challenging it is for people with physical disabilities to access the wilderness. AWWR hopes to change this reality for their participants by breaking down barriers to access and making outdoor adventures more inclusive.
“People with disabilities haven’t had equal access to recreational opportunities in the wilderness of the Superior National Forest and BWCA. We want to do our part to change that.”
~ Sean Leary
LEARN MORE AND DONATE
Gives Back Committee
By Jonathan Green, Gives Back Committee Chair
Greetings all, and happy summer! The members of the EBA Gives Back committee are pleased to continue our on-going efforts to give back to underprivileged communities, both locally in cities where the EBA hosts its annual conferences and nationally where we can find organizations who align with our core values.
Remember, the EBA Gives Back committee is always interested in hearing ways to make a difference, and we invite you to bring great ideas to our attention. We are always on the lookout for opportunities to partner with missions, homeless shelters, and organizations who share our vision of making a difference wherever we go.
Please consider showing your support for AWWR by clicking the above link and donating to this worthy cause.
EBA Committee Updates
DEI Committee Gains Momentum
By Lori McKinnon (she/her), DEI Committee Chair
Sustaining and progressing the Diversity, Equity and Inclusion (“DEI”) conversation is a huge driving force for the EBA DEI Committee. Out of the gate this year, the DEI Committee kicked off an Environmental Justice (“EJ”) series, led by Charlette Clark (with AEI), at the February 2024 EBA Winter Conference. EBA Members Rachel McShane and Michael Nesteroff rounded out the panel providing much needed introduction to EJ topics, resources, and case studies. In addition, this panel was supported by a topical book for the DEI Quarterly Book Club (Evicted: Poverty and Profit in the American City) with a very well attended discussion session the morning after the session.
In the wake of much media divisiveness, the DEI Committee felt a strong desire this year to learn more about Gender Identity. Through a choose-your-own format, during the last quarterly Book Club session, EBA members were able to select from several books and Ted Talks to promote discussion and exploration of Gender Identity topics. The materials highlighted the importance of language and how to be an ally to the transgender community. One participant commented during the May 2024 discussion that, “The gender identity topics helped me to identify and question some of my previously unknown biases.” We are encouraged that this format can inspire more participation and interest for EBA members. As always, EBA members are encouraged to send recommendations for future Book Club sessions and refer to the EBA DEI Resource Page for a list of books and resources for this and all prior Book Club sessions.
Don’t forget to answer the EBA Monthly Trivia Questions. The winner receives a choice of any past
or current EBA DEI Book Club selections.
The EBA DEI Committee and EBA’s Environmental, Social and Governance (“ESG”) Committee, have been working on the second installment of the EJ series focusing on Community Investment and Climate Resiliency. We look forward to showcasing this panel discussion, with some incredible speakers, at the EBA Virtual Conference in September 2024. As a precursor, please join us in reading and discussing for the next quarterly DEI Book Club, The Great Displacement: Climate Change and the Next American Migration (by Jake Bittle), on Tuesday, September 10, 2024.
We will also see traction on a collaboration with the EBA’s Continuing Education Committee to work towards developing content for an online webinar or workshop surrounding Environmental Justice. Finally, this year, DEI Committee Members are working towards updating the EBA DEI Resource Page. If you have any suggestions for content feel free to send to any of the DEI Committee Members. As always, if you would like to be more involved in any of these initiatives orwith the DEI Committee reach out to me or DEI Co-Chair Cate Landry. The DEI Committee meets virtually at 2:00pm ET on the second Tuesday of each month unless otherwise notified.
“Diversity is a mix, and inclusion is making the mix work.” – Andrés Tapia
Highlights from Recent Developments in Standards and Training
By Meghan Conan, ASTM and Elizabeth Krol, Ramboll
1. Officers Training Workshop – September 25th to 26th
In September, ASTM’s Officers Training workshop will be held at the headquarters in Conshohocken, PA. This training is intended primarily for Committee Officers, Subcommittee Chairs, Technical Contacts, or others in leadership positions who aspire to become officers. It will provide valuable information that will enable you to manage your ASTM responsibilities efficiently.
2. New Standards Under Development in E50.02
The E50.02 committee is actively working on several new standards that will have a profound impact on various sectors:
• WK86230 Standard Guide for Drone Assessments of Commercial Real Estate: This guide aims to establish best practices for utilizing drone technology in the assessment of commercial properties, enhancing accuracy and efficiency in evaluations.
• WK88985 Standard Guide for Construction Progress Reporting and Monitoring: This standard will provide a framework for consistent reporting and monitoring of construction progress, ensuring transparency and accountability throughout the project lifecycle.
• WK90234 Standard Guide for Upfront Document and Cost Review: This guide focuses on the early stages of project planning, emphasizing the importance of thorough document and cost reviews to mitigate risks and ensure project success.
• WK90529 Standard Guide for Zoning Analysis Assessment: This standard will offer a comprehensive approach to zoning analysis, aiding professionals in navigating complex regulatory environments and making informed decisions.
3. ESG Standard E3377-24
The newly developed ASTM 3377-24 Standard Guide for Environmental, Social, and Governance (ESG) Disclosure Related to Climate and Community provides an overview of frameworks used for environmental, social, and governance (ESG) disclosures applicable to a variety of organizations. This guide provides users with information on the history of ESG disclosure frameworks, the components that comprise ESG disclosures, the target audience of these disclosures, and the challenges associated with this topic.
4. Environmental Professional Certification
It is estimated that between 300-500,000 Phase I ESAs are completed every year in the U.S. in connection with the sale, purchase, financing, and development of commercial real estate. While there are standards in place for these assessments, quality and consistency between environmental professionals is of concern to many. The ASTM Certified Environmental Professional personnel certification program has been designed to evaluate competency in how to how to properly perform a Phase I ESA as well as how to document and report the results as per the ASTM E1527 standard. Applications for the beta examination are expected to open by the end of August 2024. If you have any questions, please contact ASTM at credentialing@astm.org
5. Environmental Liabilities Certification
In response to growing concerns about environmental risks, the ASTM Certified Environmental Liabilities Professional Level I personnel certification program was developed and officially launched in June 2024. This certification is designed to evaluate competency in how to properly identify, value, characterize, and explain environmental liabilities and validate the skills of professionals to assess and manage potential environmental liabilities effectively.
6. Committee Week Participation – October is ORLANDO!
Looking ahead, October brings the much-anticipated Committee Week in Orlando. This event will provide a platform for professionals to engage with peers, share insights, and collaborate on the development of standards and best practices. Participants can look forward to a week of networking, learning, and shaping the future of the industry. You don’t have to be an ASTM member to attend! Register here.
In summary, these developments highlight the ongoing efforts to improve standards and practices within the industry, emphasizing the importance of training, certification, and collaboration in fostering a sustainable future.
Navigating the Complex Community Engagement Requirements as Part of Site Cleanups
Brownfield Sites: Inequitable Impacts
The more than 450,000 brownfield sites scattered across the country are a reality that cities must contend with. Brownfields, which are monitored under the United States Environmental Protection Agency (USEPA) Brownfields Program, are defined as “properties that contain or may contain a hazardous substance, pollutant or contaminant, complicating efforts to expand, redevelop or reuse them.” (USEPA 2024) These areas present varying levels of risk to nearby community members due to lingering contamination resulting from historic industrial uses. Brownfield sites are frequently located in communities already burdened by environmental and socioeconomic factors such as poor air quality, high traffic impact, low household income, and high unemployment rates. These factors often overlap with high populations of people of color and communities that primarily speak languages other than English.
Elizabeth Krol, Kun Zhao, Leo Rebele, Sofia Leotta, Alma Feldpausch, & Elizabeth Miesner– Ramboll Americas Engineering Solutions, Inc.
John Yonai & Lauren Yonai – Tierra West Advisors, Inc.
Because vulnerable and disadvantaged communities are, in fact, disproportionally impacted by Brownfield sites, specific attention must be given to a community’s wants and needs when embarking upon cleanup programs. Such efforts are considered crucial not only to repair generations of broken trust between community and government due to lack of community engagement and meaningful support but also to ensure that cleanup work is done in a safe and holistic manner to benefit the people the restoration is intended to serve.
Historically, regulatory and redevelopment legislation has not focused on environmental justice principles, such as community engagement and inclusive decision-making, resulting in ill-conceived remedies or significant oversights negatively affecting the surrounding community despite the good intentions to remove blight or contamination. These oversights must be acknowledged and addressed moving forward. Considering that sites are frequently located in vulnerable and disadvantaged communities, the longterm success of any Brownfield cleanup project often hinges on how the proponents of the projects approach environmental justice issues.
The Status of Brownfield Sites in Lynwood, California
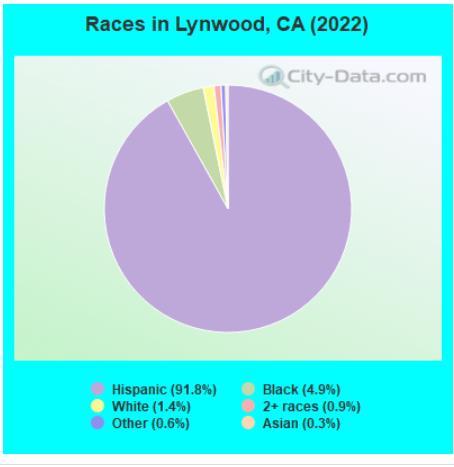
The City of Lynwood in California is a case study on successfully integrating environmental justice into cleanup work at Brownfield sites. South of Los Angeles, and home to 65,505 people, Lynwood’s community members are over 90% Hispanic. A smaller portion of community members are African American, and an even smaller percentage are White. The median household income of Lynwood is $61,695, compared to the much higher $91,551 statewide median household income (US Census Bureau 2022). Lynwood’s poverty rate is 18.1% and only 6.8% of community members have a bachelor’s degree or higher. When comparing air pollution levels to the average U.S. air quality index of 75, Lynwood’s is almost double at 149. Similarly, the city’s crime index is 351.7, which ranks above the average U.S. crime index of 280.5. In the California Communities Environmental Health Screening Tool (CalEnviroScreen 4.0), which was released in October 2021 by the Office of Environmental Health Hazard Assessment (OEHHA) and can be used to help identify California communities disproportionately burdened by multiple sources of pollution, Lynwood’s CalEnviroscreen 4.0 score stands at 91%, meaning that the city’s residents bear higher higher environmental and/or socioeconomic burdens than all but nine percent of the rest of California communities.
Figure 1: Races in Lynwood, CA
Figure 2: Lynwood Map with CalEnviroScreen 4.0 Percentile Results
Figure 3: Lynwood City Crime Data
Lynwood faces a heavy environmental burden. Maps generated by CalEnviroScreen 4.0 reveal the presence of many clean-up and hazardous waste sites in the city. The area also ranks above the 90th percentile (statewide) for toxic releases, traffic impact, and poor air quality.
Figure 4: Key Environmental Burdens in Lynwood (CalEnviroScreen 4.0)
Environmental concerns are heightened by social vulnerabilities in Lynwood. Most parts of the city are above the 80th percentile statewide for poverty, unemployment, poor health, housing burden, and low education levels.
Community members in Lynwood face overlapping obstacles that make cleaning up contaminated sites especially crucial.
Figure 5: Key Socioeconomic Burdens in Lynwood (CalEnviroScreen 4.0)
Lynwood’s Industrial Past
Present-day environmental and social factors can be explained by the city’s past. During and after World War II, the city was transformed by a rapid uptick in industrial activity. Lynwood manufactured various materials for the military, including supplies for aircraft, ships, electronics, and more (Lynwood Partners Educational Foundation [LPEF] 2021). The population of Lynwood more than doubled in the ten years following the onset of World War II. Beginning in the 1960s, large construction projects transformed the city. In the present day, Long Beach Freeway (I-710) and Century Freeway (I-105) pass through Lynwood, and the I-105 Freeway essentially divided the community, creating further blight.
Figure 6: Lynwood Photo Timeline
Lynwood’s Polluted Present
With two major highways impacting the area, poor air quality and noise pollution have become a reality, as documented by the CalEnviroscreen score. Lynwood is also home to various Brownfield sites reflecting the city’s heavy manufacturing and industrial history. A combination of socioeconomic challenges, poor air quality, and contaminated sites present considerable health risks to Lynwood residents. Approximately 15 years ago, the city determined that it would benefit greatly from site cleanups, provided that restoration work prioritized community needs. The City prepared its Brownfield Cleanup Strategic Plan (BCSP) to help guide and prioritize its Brownfield redevelopment/cleanup projects.
Figure 7: Brownfields in Lynwood City
As shown in Figure 7 from the BCSP, there are multiple Brownfield priority sites impacting the city: Plaza Mexico Expansion, Lynwood Springs, Alameda Triangle, and Alameda South. City transit lines run through the city, and there are numerous individual cleanup sites scattered throughout the Lynwood Transit Area. While cleaning up the region may seem like a daunting task, transforming contaminated sites is not just a challenge but also an opportunity for growth.
The environmental consultants and environmental financial advisors have worked closely with the city, the stakeholders, and the community members to achieve a series of accomplishments, including:
• Development of a Geographic Information System (GIS) and Brownfield Ranking System. This allowed them to identify Brownfield priorities in the city and plan to clean up sites that would have the greatest positive impact on residents.
• Sought cost recovery for cleanup activities from private parties through environmental litigation.
• Applied for brownfield assessment grants which helped characterize the nature and extent of contamination at various sites.
• Received and implemented cleanup funds from the Equitable Communities Revitalization Grant (ECRG) program to remediate contamination at the Lynwood Springs project site.
• Prepared a Transit Oriented Development (TOD) Master Plan to facilitate planning within the area that is the subject of the BCSP.
• Developed partnerships with interested parties and planned extensive community outreach activities.
Meanwhile, key challenges and barriers remain that impact work in the region. Top among these is sufficient funding to continue cleanup activities. Remediation can quickly get expensive, especially when extra steps to engage community members are prioritized. Lynwood also must work with varying degrees of political momentum for cleanup work in the area and the availability of parties responsible for contamination. Balancing environmental justice needs with available resources is an ongoing challenge. At the end of the day, outcomes and work must be prioritized to serve a project’s goals most efficiently. A key shift in modern site cleanups is that these goals increasingly center around environmental justice. As an example, environmental justice considerations have become important considerations in the evaluation and implementation of the State’s ECRG funding program. Grant recipients are required to ensure that cleanups comply with specific program expectations related to environmental justice considerations. Accordingly, Lynwood has been working with DTSC to ensure that the remedial action plans and community outreach programs comprehensively address the ECRG environmental justice requirements.
Environmental Justice Integrated into Law
In the past, regulatory work rarely, if ever, prioritized environmental justice. This is rapidly changing. With a big push by the Biden administration to elevate environmental and climate justice in all federal government operations and decision-making, a new mindset towards regulatory work has been mirrored at the state level. Environmental justice can support various programs and permitting processes led by state agencies. This will likely only expand as the years go by. Cleanup programs increasingly emphasize environmental justice, as demonstrated by the ECRG program. The feasibility of different environmental justice strategies can be affected by the stage stakeholders are at in the regulatory process, the agencies’ relationship with the community, the presence of organized community or non-profit organizations, and the relationship with regulatory oversight staff in the region.
In the Lynwood area, various actions were used to work towards community outreach and environmental justice goals. Communication in multiple forms of media was used by teams running cleanup efforts. The team has developed an informational sheet for community events, available in English and Spanish. A website with a QR code for easy access was also created to keep the community updated on grants Lynwood sites had received. From billboards to social media, advertisements kept the city informed. Environmental justice groups across the city were also directly contacted, and a health risk assessment was conducted to better understand public health concerns in the region.
Lynwood ECRG Program Implementation
The ECRG is one of the various environmental justice grants and funding opportunities that advance environmental justice goals to benefit underserved and overburdened communities. The grant operates under new California legislation signed in 2021, referred to as the Cleanup in Vulnerable Communities Initiative (Department of Toxic Substances Control [ DTSC] 2024). This new effort picks up where old regulatory legislation often fell short by allocating $500 million to speed up cleanup efforts, especially in historically underserved communities.
Lynwood received its ECRG funds in 2022. The grant’s mission is to “EnCouRaGe beneficial reuse of land through assessment, investigation, and cleanup while advancing environmental justice goals through concerted support and deep investment in vulnerable and underserved communities.” The ECRG requires direct community outreach and can only be awarded to regions with a CalEnviroscreen score greater than 75%, indicating particularly disadvantaged communities. Grant funds were allocated to two sites in Lynwood, the Alameda Triangle area and Lynwood Springs, which received $400,000 in assessment funds and $4.6 million in remediation funds, respectively.
Case Study: Alameda Triangle
The Alameda Triangle is located on the west side of the city, at the northwest corner of the intersection of Imperial Highway and Fernwood Avenue. Alameda Triangle is a prime example of the prevailing impact of 20th-century construction work – most of which was done when environmental justice rarely influenced decisions made for industrial and other development projects. Contamination in the Alameda Triangle can be attributed to the construction of the Century 105 Freeway, the aerospace industry, and chemical manufacturing (Alameda RAP 2024). What remains today is a complex “soup” of contamination, including lead, arsenic, total petroleum hydrocarbons, and polychlorinated biphenyls. Soil vapor under the Alameda Triangle also poses potential health risk due to the presence of volatile organic compounds. The ECRG funds will be used to clean up the northern portion of the Alameda Triangle project area.
The site that is the subject of the ECRG funds requires remediation in preparation for redevelopment as a mixed-use commercial/residential project. As required by the ECRG program’s environmental justice component, contamination in the soil must be brought back to background levels. Current site cleanup efforts are planned for 2024-2025. Alameda Triangle brings its own unique challenges. The Alameda Triangle project area is split into multiple parcels with varying ownerships. From the City of Lynwood to the California Department of Transportation, communication with a range of parties is required for a successful site cleanup.
Figure 8: Alameda Triangle Site Map
Community safety is an integral part of environmental justice. What good is a site cleanup if the act of cleaning up a site puts community members at even more risk? This applies both to residents in the area, as well as workers who make the cleanup possible. Unsafe working conditions for individuals directly involved in cleanup work would only exacerbate the environmental injustices experienced in Lynwood. Work in the Alameda triangle region addressed this by following federal safety regulations, employing confirmation sampling to check for the successful removal of contaminants, and transporting excavated soils to a proper disposal facility that can handle pollutants. Additional safety measures were also employed to protect nearby residents during cleanup work. These included perimeter fencing, dust control methods, dust monitoring, stockpile management of soil being removed, and utilizing truck traffic haul routes that are minimally impacting to the community.
The DTSC has also made leaps in community engagement by developing a more robust public participation strategy. Their intention is not to just inform residents of cleanup work, which can often be treated as a second thought and give residents no transparency in the process. DTSC instead provided opportunities for community members to be involved in the decision-making process for the site through community fact sheets, a public comment period, and a public meeting.
Case Study: Lynwood Springs
Adjacent to the transit station is the Lynwood Springs project area. Located in the southeast corner of the intersection of the I-105 freeway and Long Beach Boulevard, Lynwood Springs is a flat 3.7-acre site, which was formerly developed as a retail center and residences. Beginning in the 1950s, the region saw increasing commercial development. Lynwood Springs became home to a gasoline service station and dry-cleaning facility, both of which are responsible for the extensive contamination in the area today. Leaking underground fuel storage tanks caused gasoline releases and dry-cleaning operations led to tetrachloroethylene (PCE) contamination in soil and groundwater beneath the site.
The site has convenient access to I-105 on- and off-ramps and the Lynwood transit station. However, it proves to be a serious contamination hazard, especially in the community context. Several school facilities are located within a half-mile radius of the site. Residents in the area are also more likely to be challenged by factors such as low income and high unemployment rates. No viable responsible parties remain to pay for the extensive cleanup efforts required.
Figure 9: Lynwood Springs Site Map
Figure 10: Lynwood Springs Contamination Map
This is where grant funding comes in. EPA and State Brownfields funding supports cleanup work in Lynwood Springs. The region has applied for and acquired the following grant funding:
• EPA Assessment Grant ($200K for petroleum and $200K for chlorinated solvents)
• Eergency Abandoned and Recalcitrant (EAR) Site Program (~$1.5 Million)
• ECRG Grant ($4.6 Million)
Despite the various available funds, funding remains insufficient for a full site cleanup of Lynwood Springs. Nevertheless, with the help of a developer, Northgate Gonzalez Markets, an interim remedy was negotiated with the Regional Water Quality Control Board to remediate priority areas to make the site safe for the intended use and remove contamination sources that previously posed risks to off-site residents.
Redevelopment in Lynwood Springs does not just mean removing contamination. It means making structural changes to alleviate burdens experienced by the community. The city can be considered a “Food Desert,” meaning community members lack access to quality, convenient food options. Through the redevelopment of Lynwood Springs into a much-needed major grocery store and associated retail center, Northgate Markets will add a reliable access point for food to the area. The proposed project creates more than 200 permanent local long-term jobs and 250 short-term construction jobs. The Lynwood Springs redevelopment project is also expected to have a major positive effect on the community by serving as a catalyst for additional surrounding transit-oriented development in the neighborhood.
Conclusion: Brownfield Sites as an Opportunity
Environmental justice should be a driving factor in site cleanups. Neglecting community involvement in cleanup work leaves room for continued cycles of distrust and performative action. Vulnerable and disadvantaged communities, with few financial resources to allocate towards cleanups, should be prioritized first. These residents are more at risk from the negative impacts of Brownfield sites, with compounding factors at play, including lack of access to quality healthcare, food, and employment options. Lynwood demonstrates the feasibility and methods behind a systematic plan to clean up its Brownfield sites with attention to environmental justice. State funding, such as the ECRG grant, made much of the work possible in recent years. However, it is the grant regulations and cleanup plans specifically that prioritized community members’ needs.
From ensuring that residents were aware of cleanup work, establishing partnerships, holding public meetings, and accepting comments, Lynwood’s brownfield sites are a case study for successfully incorporating environmental justice cleanup strategies. Redevelopment plans tell how a community might grow after contamination is no longer present. Plans for Lynwood intentionally address community problems, such as the city’s Food Desert challenges. Strategies consider transit-oriented development in thinking about how to turn what were once just pollution hazards into opportunities for community development. Lynwood is located in a busy, high-traffic region, so community members should benefit from this proximity first and foremost. Development agreements further prioritize local residents by requiring local hiring, which would lead to salary and benefits of an estimated $20 million per year. Affordable housing is another cornerstone of Lynwood's plans. The community is expected to benefit from 100 affordable housing units from the Alameda Triangle project alone.
Brownfield sites are much more than a blight on communities. The mere existence of these sites can bring attention to regions that otherwise would be unable to receive significant funding for community improvements. Brownfield sites are an opportunity for both contamination removal and redevelopment that leaves an entire community better off in the long run by also serving as catalysts for future development. However, these sites present unique challenges. From complicated property claims to vulnerable communities that may have been previously shut out of site decisions, Brownfield sites should always be considered in relation to environmental justice. With a growing shift in regulatory frameworks and more grant funding availability focused on vulnerable and disadvantaged communities, there are increasingly more opportunities for cleanups that intentionally prioritize community needs. Engagement and stakeholder involvement are crucial. Community members should not only be aware of cleanup work but also be invited to provide input and actively benefit from redevelopment. Environmental justice, a once missing component in the regulatory framework, is the best way to ensure positive community impacts result from site restoration work across the country.
References:
DTSC. 2024, March 1. Equitable Community Revitalization Grant. Department of Toxic Substances Control. https://dtsc.ca.gov/ecrg/
LPEF. 2021. Mission and History - Lynwood Partners Educational Foundation. https://www.lynwoodedfoundation.org/mission-and-history
Ramboll. 2021. Feasibility Study and Interim Remedial Action Plan: Lynwood Springs Project Area.
Ramboll. 2024. Remedial Action Plan: Alameda Triangle - Areas 1 & 6 Proposed Mixed-Used Development Lynwood, California.
US Census Bureau. 2022. California - Census Bureau Profile. https://data.census.gov/profile/California?g=040XX00US06
USEPA. 2024, May 10. About Brownfields [Overviews and Factsheets]. https://www.epa.gov/brownfields/about
Resiliency: a unifying concept of ESG, Disaster Risk Management and Sustainable Development
ABSTRACT
The interrelated topics of ESG, climate change, disaster, and sustainable development present multifaceted challenges and opportunities for policymakers, researchers, and industries worldwide. The paper will examine the complex connections among these critical scenarios and phenomena, exploring their causes, effects, and impacts on global sustainability efforts.
Drawing on ADEC Innovations' experience in delivering sustainability solutions and services, the presentation aims to present proactive measures and resilience-building initiatives to enhance societal preparedness, minimize loss and damage, and foster inclusive, equitable development pathways in the face of climate-induced shocks and stress.
I. Introduction
Sustainable Development is a bold global ambition that countries are committed to achieving by 2030. Embarked by the United Nations and its member states in 2015, it aims to meet the needs of the present without compromising the ability of future generations. It involves achieving economic prosperity, social inclusion, and environmental sustainability in a balanced and integrated manner. Sustainable development recognizes that economic growth must be inclusive, social progress must be equitable, and environmental protection must be a priority.
Envirosite an ADEC Innovation
It is impossible to discuss the topic of Sustainable Development without recognizing its interconnection to ESG, Climate Change, and Disaster Risk. Climate Change refers to long-term shifts in temperatures and other aspects of the climate system. It poses a major threat to sustainable development in many ways:
First, on Environmental Impact. Climate Change leads to environmental degradation, including loss of biodiversity, habitat destruction, and pollution, which undermines the Earth's capacity to support life.
The second is on Social Impact. Climate Change exacerbates existing social inequalities and vulnerabilities, affecting communities, and can lead to food and water scarcity, displacement, conflict, and loss of livelihood. We have seen and experienced how each summer gets hotter and stronger typhoons during the rainy season year after year. Unfortunately, the trajectory suggests that conditions will only deteriorate further.
Finally, Climate Change has its Economic Impacts. It has significant economic consequences, including damage to infrastructure, loss of agricultural productivity, increased cost of healthcare and other social services, and disruptions to supply chains and markets. These impacts can hinder economic growth and development efforts. The resources allocated to forward-thinking projects and investments will instead be redirected toward disaster recovery and response efforts.
Addressing climate change is essential for achieving sustainable development. Mitigation efforts, such as reducing greenhouse gas emissions and transitioning to renewable energy sources, are crucial for limiting future climate change impacts. Adaptation measures, such as building climateresilient infrastructure, enhancing disaster preparedness, and promoting sustainable land management practices, are also necessary to cope with climate change's existing and projected impacts.
Another fundamental factor is Disaster Risk Management, which involves identifying, assessing, and reducing the risks associated with natural and human-induced hazards.
Effective disaster risk management is essential for sustainable development to increase resilience. Investing in disaster risk reduction measures, such as early warning systems, resilient infrastructure, and community-based preparedness initiatives, enhances the resilience of communities, ecosystems, and economies to withstand and recover from disasters. Another factor is to strengthen adaptation, disaster risk management and climate change adaptation are closely linked, as both aim to reduce vulnerability and enhance resilience to environmental risks. There is a need to address the underlying drivers of vulnerability, such as inequality, and unsustainable land use practices to allow broader adaptation efforts.
ESG considerations, sustainable development, climate change, and disaster risk management are interconnected and mutually reinforcing. Natural disasters slow down progress, destroy physical infrastructure, and worsen development processes. Achieving sustainable development requires addressing the root causes of environmental degradation, building resilience to climate-related hazards, and integrating disaster risk management into planning and decisionmaking processes. By taking coordinated and holistic approaches, we can create a more resilient and sustainable future for all.
Over the past 50 years, the world has experienced one disaster every day as a result of weather and climate hazards. That’s an average figure provided by the World Meteorological Organization (WMO), which also says the number of such disasters has increased fivefold since the 1970s.
The increasing frequency of disasters and extreme weather events presents a profound challenge to communities, economies, and ecosystems worldwide. Every year, we witness a rising number of hurricanes, floods, wildfires, droughts, and other natural hazards, exacerbated by the impacts of climate change. These events not only result in significant economic losses, but also pose grave threats to human lives, livelihoods, and well-being.
Unsurprisingly, the economic cost of these events is increasing.
The cost of climate change and disasters extends far beyond immediate economic losses encompassing human, social, and environmental impacts.
Investing in climate resilience, disaster risk reduction, and adaptation measures is not only a moral imperative but also an economic necessity. A comprehensive strategy to address climate action and disaster planning effectively demands increased investment in both financial resources and capacity development programs.
This investment need is on top of the existing challenge of bridging the annual financing gap of $4.3 trillion to achieve the Sustainable Development Goals. By mobilizing resources, building partnerships across all sectors, and adopting a proactive and integrated approach to addressing climate-related risks, we can create a resilient and sustainable future.
An integrated approach to climate risk and disasters demands increased resilience of governments, industries, and communities.
Governments and industries, particularly in the United States, have an immense role to play in advancing ESG practices and sustainable development. The Securities and Exchange Commission (SEC) is enhancing disclosure requirements for publicly traded companies regarding their ESG practices, including proposing new rules for climate-related disclosures to provide investors with more consistent and reliable information. The Federal Reserve is also integrating climate risk into its financial stability assessments, examining how climate change could impact the financial system to promote a more resilient economy. These initiatives reflect a broad effort by the U.S. government to integrate ESG considerations into policy-making and regulation, aiming to foster a more sustainable, equitable, and transparent society.
II. Resilience as a Unifying Concept
Resilience serves as a unifying concept in addressing ESG factors, climate change and disaster risk, offering a holistic approach to building adaptive capacity and reducing vulnerability in the face of environmental threats. At its core, resilience encompasses the ability of individuals, communities, ecosystems, and societies to withstand, adapt to, and recover from adverse events, whether they are sudden disasters or gradual environmental changes.
By integrating resilience into climate change and disaster risk management strategies, policymakers, practitioners, and stakeholders can promote synergies and coherence across various sectors and disciplines. Incorporating resilience into climate change and disaster risk management requires a shift towards more flexible, adaptive approaches that prioritize learning, innovation, and collaboration.
By embracing uncertainty and complexity, resilience encourages decisionmakers to anticipate future risks, identify potential trade-offs, and explore alternative pathways toward sustainable development. It also emphasizes the importance of continuous monitoring, evaluation, and feedback loops to adjust strategies and interventions in light of changing conditions and emerging threats.
Ultimately, resilience provides a unifying framework for addressing ESG factors, climate change, and disaster risk that transcends traditional disciplinary boundaries and sectoral silos. Resilience enables communities and societies to navigate the uncertainties of a changing climate while fostering sustainable development and human well-being. Failure to understand the intricacies and magnitude of risks poses a significant barrier to the effective implementation of climate action and disaster risk management strategies.
When stakeholders, including policymakers, communities, and businesses, lack a clear understanding of the complex and evolving nature of environmental risks, they may underestimate the urgency and severity of the threats they face. This can lead to a reluctance to allocate resources, implement proactive measures, or prioritize resilience-building initiatives, leaving communities vulnerable to the impacts of climate change and natural disasters.
III. Way Forward
Addressing the risk barriers requires concerted efforts to enhance awareness, education, and communication around ESG, climate change, and disaster risks.
This involves providing accessible and timely information on the nature, magnitude, and impacts of environmental hazards, as well as promoting risk-informed decisionmaking processes and behavior change at all levels of society. By empowering stakeholders with the knowledge, tools, and resources they need to assess, mitigate, and adapt to risks, we can overcome the barrier of risk and advance towards a more resilient future.
In closing, living beyond the world's tipping point of 1.5 degrees Celsius demands urgent and decisive action. This means we need to brace ourselves to confront the changing climate and environment. The stakes are high, but so are the opportunities for positive change. Let us commit to bold measures, innovative solutions, and collective efforts to mitigate climate change and build a sustainable future for generations to come.
The time to act is now, and together, we can make a difference.
What Is This?
Stephanie Trueb
ESA Technical Director – Real Estate Services
Consulting
I love maps – paper maps, historic maps, online maps, weather maps, topo maps, the old, dog-eared State Farm atlas my dad used every time we went out of town, and of course who can live without Google Maps and Google Earth, especially the satellite imagery. I also love aerial photography – getting a bird’s eye view of the landscape and seeing how places have evolved over the decades.
As EPs, we get to immerse ourselves in a world of maps and images every day. Working on an ESA is like solving a puzzle – figuring out how all the various pieces fit together to form a picture. Sometimes I can go down a rabbit hole looking at all the maps and aerials and Google, spending way too much time investigating what’s in them. But what happens when you have a map or aerial and you can’t for the life of you figure out what you are looking at? Ever have a Sanborn with a symbol that isn’t on any legend or key and can’t be found no matter how hard you search online? Or what about an aerial that shows a bunch of structures that don’t match any obvious uses? You are stumped.
In these situations, I always defer to my reviewer team brain trust – we collaborate daily – inevitably one of us figures out what it is, and we solve the mystery. Over the next few journals, we want to highlight some of those mysteries that have us stumped and welcome you, our readers, to submit your own. What some think of as a mystery might be another’s everyday experience depending on the region where they work. So, send in your wacky photos or bizarre aerials with a short backstory and you just might get published! Who knows, you may be helping a fellow EP or client solve their own mystery.
EBI
What is This?
Here is an aerial photograph from the 1960s showing multiple elongated features surrounding equal-size fenced squares with mounds in the middle. Research showed the entire area was historically agricultural but figuring out what specifically occurred within the Subject Property boundaries was a bit of a conundrum. Folks who live in certain areas of the country would probably have no trouble identifying these features. After consulting with colleagues who knew exactly what they were, our reviewer found the answer. Do you know what this is? Answer can be found below.
Answer: This is a cattle feed lot. Each fenced coral holds so many cows with manure piled up in the middle of each coral. The elongated features are silage covered in black plastic.
Part Two: the Science Behind the Future of Brownfields Redevelopment Using
LowImpact Low-Cost Soil and Groundwater Biostimulation Strategies
BY KENT C. ARMSTRONG, TERRASTRYKE PRODUCTS LLC
Previous Discussion – Reversing Lost Opportunities
In my last article published in the 2024 Winter EBA Journal we discussed how past site use of abandoned existing structures (Brownfields) predominately in urban areas are passed by for redevelopment due to environmental management concerns. We discussed currently acceptable remediation strategies (traditional) including both inorganic and chemical. Most importantly we introduced the microbial processes associated with Quorum Sensing and Signaling (QSS) to which I presented Biostimulation and its ability to support QSS as the new way to achieve low-impact, cost-effective remediation of soil and groundwater contaminants. Contaminants to which this discussion relates are petroleum hydrocarbons (PHCs), organo-halide contaminants such as chlorinated volatile organic compounds (cVOCs), and Dioxins.
Unnecessary and Costly
Historic and current remediation techniques often assume aggressive manufactured systems with extensive subsurface and aboveground infrastructure are necessary to physically ‘clean’ Site contaminants from the soil and/or groundwater. Often, physical processes fail to remove the last of the sorbed (attached) contaminant mass. Until removed, the sorbed residual mass will naturally liberate from the soil to the groundwater as dissolved phase at rates equal to the concentration gradients between the two: soil, and groundwater. This liberation is called ‘rebound’ and simply stated, is a long-term source of groundwater contamination. Good news, rebound can be avoided using biostimulation strategies that harness the 4+ billion years of nature’s experience.
As I noted in my previous article, regardless of the activity, ‘traditions’ often yield encouraging results that provide hope for success but often, after time, continue to fail at meeting project objectives and serve as continued delays to redevelopment. This hope, provided intentionally or unintentionally, prevents the pursuit of innovative strategies to address historic and newly emerging concerns.
Trend to Sustainability
The goal of current trends in redevelopment towards sustainability are to benefit the environment, the community, and the occupants within each building. This includes development and use of ‘Green’ design. This movement focuses on Leadership in Energy and Environmental Design (LEEDs) and efforts project and corporate goals to obtain Environmental Social Governance (ESG) in all aspects of their operations; including but not limited to, building construction, subsurface remediation, and aboveground landscaping.
Ironically, this collective of LEED/ESG inspired practitioners is exactly what indigenous microbes can do when biostimulated and allowed to work in unison with a collective focus on exploiting energy efficiently. This ability to establish protected collectives that exploit energy as effectively as possible is the process of Quorum Sensing and Signaling (QSS). QSS is the mechanism by which microbes communicate, share information, and collectively establish single and multiple specie biofilms. Biofilm is the LEED structure(s) microbes establish in every ecosystem on the Planet. Biofilm is a collection of dedicated microbes working as one while adhering to ESG principles. When life began, QSS was established by Mother Nature to protect microbes so they could safely grow and effectively destroy (recycle) organic matter as efficiently as possible. In fact, bacterial growth of biofilm is the most predominant in all mega and micro-habitats.
What Does this Mean to You
As an Owner, Investor, Developer or Stakeholder, Biostimulation represents expedited remediation that eliminates rebound up front and is sustainable. Biostimulation generates no noise, emissions, or adverse vapors and requires minimal expenditure of capital to achieve maximum performance. Biostimulation allows redevelopment concurrent with remediation. In order to further demonstrate how we first need to trudge through a little Science, I promise, no math!
Infections and Contaminated Sites
QSS is a mechanism by which bacteria regulate gene expression in accordance with population density through the use of signal molecules. Quorum sensing allows bacterial populations to communicate and coordinate group behaviours. Current understandings of QSS focus on the ability of established pathogens (disease causing organisms) to enhance their resistance while operating in a biofilm. As a result, the medical, dental, infectious waste industries recognize QSS and biofilm as one of the greatest causes of disease and the infection processes. Biofilm associated infections cause and cost tens of thousands of lives and billions of dollars a year in the U.S. alone. In fact, today there are no approved antimicrobials to treat biofilms. The only way to treat a biofilm is to physically remove it from the body.
History
Biofilm was first observed in the mid-1770’s by the ‘Father of Microbiology’, Dutch researcher Antonie von Leeuwenhoek, while examining dental plaque through the lens of his creation, the microscope. Not until the mid1960s did Hungarian-born microbiologist Alexander Tomasz first observe and note QSS behaviours in his studies on the ability of Pneumococcus (later known as Streptococcus pneumoniae) to take up free DNA from its environment (competency). Then, 1967 Dr. William Costerton, The ‘Father of Biofilm’, first employed the term Biofilm in his classic tutorial, ‘The Biofilm Primer’.
QSS Mechanisms
Standard quorum-sensing pathways consist of bacteria populations, signal molecules, and behavioral genes, all of which can be measured, monitored, and used as future tools in the evaluation of remediation performance. The signal molecules, known as autoinducers, are secreted into the environment by the bacteria and gradually increase in concentration as the bacteria population grows. After reaching a certain concentration threshold, or Quorum Level, the communication molecules become detectable to the increasing bacterial population, which then activate corresponding response genes that regulate various behaviours, such as virulence, information sharing via horizontal gene transfer (HGT), biofilm formation, and competence (the ability to take up DNA).
Biofilm actually allows for the ‘recruitment’ and ‘teaching’ of metabolically similar bacteria and stimulates all involved to abandon their role as a swimmer, assume a role that benefits the population as a whole, and while housed in the biofilm collectively exploit energy.
QSS is a key behaviour-coordination mechanism in the majority of microbes for the formation of biofilm. Microbes in biofilm is what matters for long-term remediation performance, not the swimmers. Swimming is a transitory phase. Swimming is when microbes leave a mature biofilm, reenter the bulk water as ‘scouts’ to seek out places to establish a new biofilm and start all over. This assumes that as a planktonic swimmer, you aren’t consumed, you don’t become desiccated, you don’t end up in a nutritive poor location, and don’t get outcompeted for little is there. If the latter happens, the microbes at your site have simply gone dormant waiting to be biostimulated and spring to life again. Remember, in terms of performance, it is when they aren’t swimming that truly matters.
The Myth of the Swimmers
Historically bioremediation has focused on the swimming planktonic bacteria which represent less than 1% of the bacteria performing at any given site. Traditional remediation practitioners will spend thousands of your dollars on analytical testing that identifies who is there and if there are enough to ‘ensure’ proper performance. Furthermore, if the data indicated the density of who was there was insufficient and/or even though some are there, they aren’t the right ones, traditionalists buckle up and spend more of your money to do bench studies and introduce laboratory grown ‘smart’ bugs.
I’m here to say, yes, such analyses provide fascinating data but it in terms of identification, the report is only as good as the genetic catalogue of the analyzing facility. Also, unless you are researching the endless minutia of microbial based remediation, these tests are proven to be a waste of yes, your money. Brownfield redevelopment projects are macroscopic, deal with the macroscopic, dirt and groundwater is significantly macroscopic. Brownfield redevelopment projects are not laboratories and typically don’t need microscopic. As most today agree, in spite of baseline data, the bacteria you fear, or need, are there.
Misinterpretation of the Swimmers
Therein lies the myth of current bioremediation: an unwavering belief that planktonic bacteria (swimmers) are something we need to spend money on rather than, recognizing the need to understand indigenous microbes don’t leave, don’t die, just go dormant and if one nourishes the ecosystem in which they live, they leave dormancy and come back to productive life. This myth has been told, continues to be told, and is stoically maintained as ‘truth’ by the laboratories providing the information and your consultants diligently trying to use the data as best they understand. In fact, this ‘truth’ is a misrepresentation of reality. It disregards science. It completely goes against what the medical, dental, and artificial implant communities; the infectious wastes, wastewater, and pipeline industries, and so many others have known and fought to eradicate for decades. In our world of soil/groundwater remediation and redevelopment, we ironically grow ‘beneficial’ infections and in doing so, turn contaminant(s) into a beneficial resource(s).
Science clearly supports our observations that, regardless of background information telling you otherwise, indigenous microbes are present at a contaminated site but are stressed and in a dormant condition. The stress is the contamination itself which ironically is an energy source they would use, but without biostimulation the sheer volume of contaminant introduced to the subsurface has completely ‘scavenged’ the nutrients, food and/or respiratory sources making existence difficult at best. As repeatedly noted, instead of dying they simply lay in wait dormant as an Ultramicrobacterium (UMB) until the ecosystem becomes nutritively supportive again. Once biostimulated they re-emerge and start swimming and. As densities swell communication increases and QSS process increase. If Quorum Levels are attained, they collectively stop swimming, form biofilm, and work in a manner we call an infection that ruthlessly exploits either protons/electrons (PHCs/cVOCs) as energy.
The Father of Biofilm
Earlier we mentioned Dr. William Costerton, the ‘Father of Biofilm’. He noted in his book ‘The Biofilm Primer’ (1967), ‘First, we discovered that starved bacterial cells are converted to very small dormant ‘Ultramicrobacterium’ (UMB) that retain their full genomic complement and resuscitate to full size and metabolic activity when nutrients again become available’.
Dr. Costerton went on to say ‘…these dormant prokaryotes (sic. UMBs) are present in virtually every ecosystem in which nutrient content varies from feast to famine. Therefore, in all ecosystems, a vast library of genomes is available….can be mobilized and mixed and matched….to capitalize on any nutrient opportunities that are presented.’
What Dr. Costerton and the vast majority of microbiologists understand is microbes are ubiquitous in the world. Whether that world is a human body, a decaying fish, a decomposing log in the woods, or organic contaminants in a groundwater system, the microbes are there to infect and exploit available energy as long as the ecosystem in which they work is nutritively supportive. If not, they again become UMBs to simply lay in wait, undetectable in your groundwater samples, until nutrients return. Doesn’t matter how much energy may be around, they can’t use it unless they can live to use it and that demands a nutritively supportive ecosystem.
Of the examples noted above, all but the contaminated groundwater system is nutritively supportive. In that world they can communicate, increase in densities, and attain Quorum Levels to establish biofilm and work together to exploit whatever form of energy is present, in whatever way they most efficiently can. At a contaminated site the nutrients to support QSS have been scavenged, taken away, by the overwhelming volume of either protons (PHCs) or electrons (cVOCs) that engulfed the ecosystem. Unfortunately for us in terms of medicine, microbes don’t die; fortunate for us and in particular at remediation sites, microbes don’t die (UMBs!) and because of this the best thing is, biostimulation alone ‘brings the ground to life’.
The Truth about Swimmers
So, what is the truth? As noted above, bacterium in the planktonic form are in a transitory state. Science knows that over 99% of all bacteria live in a biofilm and up to 80% of them, do so exclusively. It’s amazing traditional bioremediation continues to focus on <1% of the trillions of bacteria present. In this dialogue our industry correctly suggests you need elevated densities of planktonic bacteria to realize increased performance; however, their interpretation is flawed when they suggest if you don’t, you need to introduce (augment) laboratory grown ‘smart’ bugs. This demonstrates the lack of understanding of biofilm. No, you don’t need smart bugs, no to more augmentation, yes to the new era of bioremediation, biostimulation.
The ‘golden rule’ of biostimulation is, for indigenous microbes to effectively perform we must support their establishment of biofilm by restoring the nutritive capacity of the indigenous microbial ecosystem. Sure, during the transitory phase more swimmers will often increase performance just because there are more of them; however, as the ‘good’ ones increase in numbers so do the ‘lazy’ and unfortunately, the ‘bad’ ones. If lucky, at your site the good outweighs the bad and positive performance is realized; if not, the opposite is true. Current bioremediation fails to recognize that it’s not about getting more swimmers for swimmers sake. The real important thing about swimmers is we need to support their ability to not simply grow in numbers, we need to support their ability to increase to Quorum Levels, stop swimming, stop behaving selfishly and establish a biofilm to work collectively with a laser focus to use site contaminants organically as a beneficial resource!
Actual Site Conditions
As noted previously, because of the introduction of massive amounts of contamination the impacted subsurface is typically anaerobic, if not methanogenic, and basically devoid of O2. Under such conditions PHC degraders cannot respire (breathe) and such, can’t eat, so they become a dormant UMB. Historically, remedial practitioners Oxygenate the subsurface to facilitate growth of aerobic bacteria. Unfortunately, oxygenation inhibits the growth of anaerobes and heterotrophs and the development of beneficial biofilm. Furthermore, a significant percentage of the O2 your dollars introduced are inefficiently spent efforting the return to an aerobic world. If we simply leave the system anaerobic and employ biostimulation, QSS is initiated allowing the swimmers to communicate and attain Quorum Levels. As they collectively develop biofilm an organic machine is established employing the >99% of bacteria your strategy is not.
The fact is, without biostimulation and maintenance of anaerobic conditions, regardless of your input, the microbes you support aerobically are not equipped to establish biofilm. As a planktonic you share your information up to 10,000-times slower than in a biofilm. As a swimmer you can’t stop behaving selfishly, and most important, will never work as a unified collective with a laser focus on exploiting contaminant-based energy, i.e. organic contaminants.
The Cooperation of Biostimulation
In terms of microbial behaviours and capabilities, like us, we all have our talents. Some things we do well and some not so well, and then there are the tasks that, well, we just don’t even think about trying. The same is true with microbes when in a planktonic (swimming) state; some are degraders, some generate methane (methanogens), while others do their thing whatever that may be. Both direct field observations and laboratory data consistently demonstrate microbial behaviours are different when their ecosystem is restored via biostimulated. Biostimulation alone can remove the environmental stresses created by PHCs and organo-halide contaminants. Biostimulation restores the microbial habitat and QSS behaviours.
Biostimulation and the collective development of biofilm allows for the creation of syntrophic relationships between various bacteria. Biostimulation allows unicellular organisms to combine and unify their metabolic capabilities to focus on the utilization, i.e. degradation of substrate(s), that neither could utilize/degrade alone. For example, many bacteria can ferment many different organic compounds; however, most can’t ‘touch’ Hydrogen (H2) which if H2 buildups, it retards PHC degradation. Then there are many Archaea (methanogens) who can ferment H2 and Carbon Dioxide (CO2) but are incapable of degrading organic compounds.
State of Affairs
Effective biostimulation strategies restore the indigenous microbial ecosystem by providing a blend of macro-micro-nutrients combined with Nitrates (NO3) to supply a source of microbial respiration, other than Oxygen (O2), enhancing the environment while maintaining anaerobic conditions. In doing Quorum Sensing and Signaling (QSS) is stimulated, microbial densities increase allowing communication signals to reach concentrations that ‘convince’ the entire population (multiple species) to collectively change their phenotypic (appearance) from a planktonic (swimming) to sessile (attached) form. As attachment to surfaces begins microbes increase in densities further but not as swimmers; rather, by creating ‘hog-piles’. Concurrently the microbes collectively secrete substances protecting the ‘hogpile’ within from predation and bulk water conditions. This protected ‘hogpile’ is the only place where the beneficial syntrophic relationship between fermenters and Archaea can be established.
Remediation practitioners are continuing to apply traditional techniques and strategies to affect emerging contaminates while ignoring a clear method to approach both classic and emerging contaminants; that of the microbial ecosystem. This requires holistic viewpoints to incorporate the hydrogeochemical-microbiological conditions at the Site and use them for beneficial remediation purposes. This change in mindset creates an entirely new world in biofilm research, remediation practitioner, instrumentation changes and inventions, and regulatory responses that favour biostimulation and Green remediation.
Positive Change
The goal is to look back into history and our understanding of the world of prokaryote microbes. No longer are they understood to be lone, solitary entities capable of little. No longer are they assumed to be at their ‘best’ when in a planktonic (swimming) state. No longer do baseline densities of planktonic bacteria have to be massive at the start to achieve successful remediation.
For decades the dental, medical, and numerous other industries have recognized planktonic densities don’t matter in terms of the presence/absence of microbes. It is now recognized that single cell procaryotic microbes are capable of massive destruction, as well as huge benefits, when they work as a consortium adhered to the contaminated surface. It is now recognized prokaryotes are not solitary loners; rather, when swimming they are aggressive scouts searching for nutrient supportive environments where energy may be exploited while in a protective world referred to as a biofilm.
Conclusions
Bacterial communities respond to stimuli in a consorted manner, completely different than planktonic bacteria. Bacterial growth in biofilm is the most predominant terrestrial form on the planet, and it affects all walks of life without judgment. One mechanism of this coordinated behaviour is QSS, a process where microbes behave like an orchestra rather than a lone musician on a city street. Using a biostimulation strategy to induce QSS behaviours allows the orchestra to unpack their instruments, allows the microbes to come out of dormancy, and play the music all in tune.
Brownfield redevelopment is more and more facilitating ‘Green’ projects that follow LEED/SGE ethics with an intent on minimizing impacts associated with greenhouse gas emissions while maximizing the benefits of the environs. Biostimulation is this very ethos: a collective of individual entities coming together, shaking off unnecessary extras, to work collectively towards the good of the project, structure, and community.
Biostimulation will ultimately be seen as the most cost-effective strategy to attain long-term and sustainable remediation in concert with redevelopment. Biostimulation will be accepted as the remediation strategy that allows realization of redevelopment efforts faster, with less delays, with less impacts and less costs. Biostimulation is the answer to remediation cost concerns preventing progress; and biostimulation facilitates the rebirth of an existing culture(s), families, and community of any City efforting progress by working with Nature concurrently with redevelopment.
ABOUT THE AUTHOR
Kent Armstrong is a Graduate of California State University Long Beach, ‘The Beach’; B.S. Terrestrial Ecology (Zoology), minor in Philosophy/Religious Studies, with Graduate Studies in Palynology (fossil pollen) and Paleoecology. After numerous jobs as a butcher, human anatomy instructor, ravioli maker, warehouse and parts dispatch operator…real work began with the Los Angeles County Sanitation District as Plant Laboratory Chemist and then as a Treatment Plant Operator. Over the next 35 years, Kent would work for and aid both government and corporate businesses with remediation strategies as a contractor, consultant, and general nice guy. The culmination of these experiences afforded Kent the opportunity to participate in a wide variety of environmental investigation, remediation, and management projects combining numerous methods of physical, chemical, and biological strategies. It also, 20+ years ago, led to the realization of a far-fetched concept in 2018, the inception of TerraStryke Products LLC. Since then we have efforted the development of sustainable biostimulation additives designed to leverage existing site conditions and enhance indigenous microbial populations to realize safe, low-impact and cost-effective destruction of organic soil and groundwater contaminants, mimicking that which Mother Nature has done in every other ecosystem on the planet.
PFAS CORNER
Mid-Year PFAS Regulatory Update
By Dianne R. Phillips
2024 has been a busy year so far for folks following regulatory developments related to per- and polyfluoroalkyl substances (PFAS). Building on its plans in the 2021 PFAS Strategic Road Map and its 2023 Second Annual Progress Report the U.S. Environmental Protection Agency (EPA) continued its fastpaced regulatory activity in anticipation of the Congressional Review Act’s lookback deadline, after which Congress has the right to review and potentially disapprove final regulations. In addition, previously promulgated rules require significant actions in 2024. Summaries of key developments are below.
RCRA
On Feb. 8, 2024, EPA advanced efforts to address PFAS under the Resource Conservation Recovery Act (RCRA) by proposing to add nine PFAS compounds, their associated salts and structural isomers to a list of hazardous constituents considered in the RCRA Corrective Action Program. In addition, EPA proposed to expand the scope of hazardous waste requiring corrective action to include chemicals that meet the statutory definition but may not be explicitly defined by RCRA regulations. EPA argues this change will allow the agency to enforce RCRA corrective action requirements as was intended in the law. Additionally, these revisions will grant the agency the authority to address PFAS and other emerging contaminants that have not yet been explicitly defined as hazardous waste at RCRA-permitted treatment, storage and disposal facilities. According to EPA’s Spring 2024 Agency Rule List, EPA expects to finalize these rules in December 2024.
SDWA
EPA announced the National Primary Drinking Water Regulation (NPDWR) on April 10, 2024. The final rule set legally enforceable levels, called Maximum Contaminant Levels (MCLs), for six PFAS in drinking water. PFOA, PFOS, PFHxS, PFNA, and HFPO-DA as contaminants with individual MCLs, and PFAS mixtures containing at least two or more of PFHxS, PFNA, HFPO-DA, and PFBS using a Hazard Index MCL to account for the combined and cooccurring levels of these PFAS in drinking water. EPA also finalized healthbased, non-enforceable Maximum Contaminant Level Goals (MCLGs) for these PFAS.
Public water systems will have three years after the rule promulgation to comply with monitoring requirements, at which point they must begin reporting the results of their monitoring. The initial monitoring requirements will mandate four quarterly samples for larger systems serving populations over ten thousand people and biannual samples from smaller systems serving populations of ten thousand or fewer. Beginning five years after promulgation, if the levels of PFAS detected in these samples exceed the MCLs, public water systems must notify their served communities and take steps to reduce levels of PFAS in their drinking water.
Over the last few years, multiple states –Maine, Massachusetts, Michigan, New Hampshire, New Jersey, New York, Pennsylvania, Rhode Island, Vermont, Washington and Wisconsin – established enforceable drinking water standards for certain PFAS in drinking water under state law. Several states including Delaware and Virginia are also in the process of considering MCLs for certain PFAS. Other states, such as Connecticut, Maryland, and Oregon, have established nonenforceable "action levels" or drinking water guidelines. Some states such as California and Utah have begun monitoring programs in addition to EPA's Unregulated Contaminant Monitoring Rule. All of this adds another layer of complexity to the matter and confusion to consumers and regulated entities.
On June 7, 2024, two organizations filed a petition challenging the NPDWR under the Safe Drinking Water Act in the Circuit Court of Appeals for the District of Columbia in Docket No. 24-1188. On June 10, 2024, more organizations also filed a similar petitions in the same court as Docket No. 241191 and Docket No. 24-1192. All three cases have been consolidated under Docket No. 21-1188. Several additional parties have moved to intervene. Procedural motions will be due in mid-July. According to one party’s Nonbinding Statement of Issues, several of the challenges relate to use of the Hazard Index MCL, the regulation of mixtures, and the feasibility of achieving the MCLs, among other things.
CERCLA
On April 19, 2024, EPA announced its final rule designating two PFAS compounds – perfluorooctanoic acid (PFOA) and perfluorooctanesulfonic acid (PFOS), including their salts and structural isomers – as “hazardous substances” under the Comprehensive Environmental Response, Compensation, and Liability Act (CERCLA or Superfund). The rule was published in the Federal Register on May 8, 2024 with an effective date of July 8, 2024. The following obligations and ramifications are implicated:
• PFOA and PFOS releases of one pound or more in a 24-hour period must be reported.
• EPA may include an evaluation of PFOA and PFOS in its 5-year Review of sites included on the National Priority List (Superfund sites).
• EPA may order investigations and cleanups of PFOA and PFOS and recover such costs from responsible parties.
• Private parties that conduct cleanups consistent with the National Contingency Plan may seek to recover cleanup costs associated with PFOA and PFOS from other responsible parties including contribution for costs paid.
• Federal entities that transfer or sell property must provide notice about the storage, release or disposal of PFOA or PFOS on the property, as well as guarantee that any PFOA or PFOS contamination has been cleaned up or, if needed, that additional cleanup will occur in the future.
• Compliance with the “All Appropriate Inquiry” rule, 40 C.F.R. Part 312, will require consideration of PFOA and/or PFOS to qualify for CERCLA Landowner Liability Protections.
On June 10, 2024, three organizations filed a petition challenging the CERCLA designation under the Administrative Procedure Act in the Circuit Court of Appeals for the District of Columbia in Docket No. 24-1193. Several parties have moved to intervene in support of EPA. Procedural motions are due in July 2024.
TSCA
EPA published a final rule in October 2023 to amend Section 8 reporting requirements under the Toxic Substances Control Act (TSCA) that requires persons who manufacture (including import) or have manufactured or imported these chemical substances, or products including these substances, in any year between Jan. 1, 2011 and December 31, 2022, to electronically report information regarding PFAS uses, production volumes, disposal, exposures and hazards. The new regulations, 40 C.F.R. Part 705, which became effective on November 13, 2023, have enormous implications.
The rule applies not only to traditional chemical manufacturers but to all importers of products (Product Importers) that may contain one or more PFAS compounds. PFAS are used in a large number of product categories, such as electronics, wires and cables, pipes, cooking and bakeware, textiles, automotive applications, toys, water- and stain- resistant clothing, cleaning supplies, dental floss, toilet paper, paints, varnishes, carpets, and many other industrial and consumer products, so the potential universe of regulated parties is vast. There are no exemptions for low-levels or small amounts of PFAS use. Exemptions are provided for PFAS used in certain types of products regulated by other agencies and programs, such as food additives and medical devices. For many Product Importers, this will be an entirely new process giving rise to many questions, some of which are answered in the EPA's recently published Frequently Asked Questions (May 2024) and Instructions for Reporting PFAS Under TSCA Section 8(a)(7) (May 2024). Reporting on a compound-by-compound basis by is due by May 8, 2025 (or November 10, 2025 for small entities).
TRI
EPA published a final rule changing reporting requirements for PFAS listed in the Toxic Release Inventory (TRI) on October 31, 2023. The final rule includes PFAS currently on the TRI and automatically includes additional PFAS added pursuant to sections 7231(b) and (c) of the 2020 National Defense Authorization Act to the list of as chemicals of special concern, eliminates the de minimis exemption for “Supplier Notification Requirements” for all chemicals of special concern, and limits the use of range reporting. EPA contends that elimination of the de minimis exemption and range reporting options will provide a more complete picture of PFAS releases and waste management quantities. As described by EPA, some requirements become effective for reporting year 2023 (forms due July 1, 2024), but the most significant changes will be implemented in reporting year 2024 (forms due July 1, 2025).
NPDES
EPA has not promulgated any binding changes to the National Pollutant Discharge Elimination System (NPDES) permitting programs as of now, but they have issued guidance for state environmental agencies and NDPES permit issuers that recommends adopting the full suite of PFAS monitoring techniques being used by the EPA. According to EPA’s Spring 2024 Agency Rule List, EPA expects to issue a proposed rule in June 2025 to update NPDES application regulations, 40 C.F.R. 122.21.
In a similar vein, the EPA has not released actionable Effluent Limitation Guidelines (ELGs) to restrict PFAS discharges as of now. In the Strategic Roadmap, EPA predicted that they will make “significant” ELG regulatory work by the end of 2024. According to EPA’s Spring 2024 Agency Rule List, EPA expects to issue a proposed rule (ELG) revising the existing Organic Chemicals, Plastics, and Synthetic Fibers ELG (40 CFR Part 414) by September 2024. Currently, the EPA is continuing their multi-industry study of PFAS discharges and is utilizing the ELG program to conduct industry-specific studies, as described in Effluent Guidelines Program Plan 15 (Plan 15). Specifically, EPA is evaluating the Textile Mills Industry (40 CFR part 410), Concentrated Animal Feeding Operations (40 CFR part 412), and nationwide data on industrial discharges of PFAS to publicly owned treatment works. To date, through Plan 15, EPA has determined that revisions to the effluent guidelines and standards for the Landfills (40 CFR part 445) are warranted, and will not be pursuing further action regarding Electrical and Electronic Components Industry (40 CFR part 469). However, it will continue to monitor PFAS discharges from the Electrical and Electronic Components Industry, Pulp, Paper, and Paperboard Category (40 CFR part 430), and airports. EPA also intends to propose updates to its Clean Water Act Part 136 monitoring methods to incorporate multi-laboratory validated methods for analyzing PFAS in January 2025.
CONCLUSION
In summary, there is a lot going on in the world of PFAS and it takes a scorecard to keep track. EPA does not appear to be letting up and we can expect further developments in the fall of 2024 and early 2025.
Creating PFAS Risk Matrices for Your ERM Team
By Victor DeTroy
If we consider Benjamin Franklin’s pithy quote “guests, like fish, begin to smell after three days” in light of the PFOA/PFOS CERCLA designation, PFAS are really starting to reek. The new PFAS reality is here, and it smells horrible.
How are we supposed to live in this new reality without making the entire CRE industry turn into pickled herring? Are we really going to have to drill and sample every single site that maybe used PFAS at one point in time? Is the once booming investment in the industrial sector going to instantly dry up? Will we never be able to lend on car washes again?
Have no fear, there is a solution. Time to swallow the red pill and enter the Matrix… the Risk Matrix that is.
PFAS Risk Matrices
The purpose of developing a risk matrix is to help provide a consistent approach for a bank’s ERM team. The hope is that the matrix will help the ERM team comply with the bank’s internal risk appetite.
Let’s start with this general PFAS risk matrix for any type of property use:
The main factors that go into determining the risk are 1) how likely is it that PFAS were used/handled at the site and 2) how likely is it that releases could have occurred at the site. Essentially this matrix aims at determining how likely it is that a release of PFAS occurred at your site.
The main three categories of risk are Low, Moderate, and High, with shades in between. Below is an example ERM risk appetite approach using this matrix:
Low Risk – A Phase II is not necessary
Moderate Risk – Generally a Phase II is not necessary; however, this may be reviewed on a case-by-case basis
High Risk – A Phase II or other mitigation measure (e.g., insurance) is required
This is by no means the only approach. One ERM team may decide that any risk rated “Moderate” or higher will require sampling, while another group may determine that they will only consider (not require) a Phase II for “Very High Risk.”
Let’s look at an example site to see how this risk matrix works in action.
Example 1 - Print Dudes
1) 2,000 SF print shop
2) Operational from 1990-2005
3) No drains, sumps, clarifiers or any subsurface conduits
4) Listed on the federal EPA ECHO database as a facility that likely handles PFAS (based on the provided NACIS code of the business)
Conclusion: Low to Low/Moderate Risk
1) PFAS Handling: Since the site was listed on the EPA ECHO database as a likely handler of PFAS it may be considered “likely” that PFAS were used/handled. However, there is no other evidence that PFAS were used, so the argument can be made that PFAS use is “potential” not “likely.”
2) 2) Exposure Pathways: However, there are no exposure pathways that would have resulted in a likely release to the subsurface. Therefore, a release is considered unlikely.
Example 2 - Print Czar
1) 100,000 SF industrial printing facility
2) Operational from 1955-1989
3) Several floor drains within the facility (lead to sump and clarifiers)
4) Two clarifiers and one sump
5) NPDES records identify large-scale industrial wastewater discharges leading to an on-site dry well
6) NOT listed on the EPA ECHO database as a likely handler of PFAS
7) Known release of solvents did not include analysis of target PFAS
Conclusion: High Risk
1) PFAS Handling: although the site is not listed on the EPA ECHO database as a facility that likely handled PFAS, it should be noted that this database is based on available NAICS codes provided to the EPA. This is more accurate for current and recent tenants and appears to fall off a steep cliff when dealing with older historical tenants. Based on the nature of site operations and a review of the industrial printing process, it is considered likely that PFAS were utilized by this former facility.
2) Exposure Pathways: Given the floor drains, sump, and clarifiers that ultimately drain to the on-site dry well, PFAS contamination is considered likely.
Industry-specific Risk Matrices
Using this risk matrix methodology, you can also break this down using various industry specific factors. Let’s use car washes as an example.
To date, there are not a ton of studies that have really delved into the likelihood that car washes are the source of PFAS contamination. Of those present, the information is conflicting. A study conducted in New York conducted soil sampling at various potential sources of PFAS including a car wash. One sample collected on the car wash showed a concentration of PFOS in soil at 11 ppb, however, the NYSDEC concluded that this was not significant, and the car wash was not considered a source of PFAS contamination in the area (1). A separate study conducted in northern California found that PFAS were present in the wastewater effluent (at higher concentrations then the influent) from the three different car washes that were sampled (2). Total Oxidizable Precursors (TOP) measured at car washes were higher than those measured at other industrial sites (including a paper mill, semiconductor manufacturer, and a hard chrome plating facility). However, target PFAS such as PFOA and PFOS were relatively lower in comparison. Furthermore, no extremely high values were detected at the car washes and the general discharge flow rates were identified to be lower than other sources such as an industrial laundry. Additionally, since only influent and effluent were sampled, it is unclear how often car wash operations actually resulted in a release to the subsurface.
PFAS are used in car wash operations for their waterrepellent properties. Some car washes utilize PFAScontaining products because they repel water, oil and dirt. Car washes use PFAS in various forms, such as sprays, waxes, coatings and rinses. These products are applied to vehicles to create a barrier that prevents the buildup of water, oil, and dirt. In particular, vehicle spray on waxes and coatings containing PFTE (i.e. Teflon) or similar spray on waxes/coatings containing PFAS are considered a likely source of PFAS at car washes. In 1989, Turtle Wax was first identified in newspaper advertisements as the “only wax with Teflon.” By the early to mid-1990s, several other firms developed waxes and coatings for car washes that contained PFAS. By circa 2010, car waxes containing “Teflon” were gradually phased out of the marketplace. Therefore, car washes that operated from 1989 to 2010 are considered to have the highest risk of potential PFAS contamination.
The other major concern for car washes is if they drain directly to a municipal source or to an on-site dry well, septic system or any other type of injection well.
Using these factors, a risk matrix can be tailored for PFAS at car washes:
Let’s say you have a car wash that has operated since 2010. Oh no, is this an automatic REC and Phase II? Not necessarily. Looking at the risk matrix, we can see that this would fall into the “short term use” category since it only operated during the period of concern for a short period of time (2005-2010). If you are able to review current Safety Data Sheets (there are no PFAS identified) and according to an interview with the owner, the waxes used on site have been the same since 2005, potential PFAS uses seem even less likely. If you also factor in the fact that the site is connected to a city sewer system, you can ultimately conclude that you have a low risk of PFAS contamination on your hands.
Closing
I’m glad you took the red pill and went down the PFAS risk rabbit hole with me. As more studies are published, we will be able to refine the risk even more. The hope is to whittle the giant amorphous PFAS monster risk down so that it fits into a manageable enclosure.
Sources:
1) April 2023 COMMUNITY UPDATE - POESTENKILLAREAPFAS CONTAMINATION: Multiple Low Level Sources of PFAS Are Likely Cause https://extapps.dec.ny.gov/data/der/factsheet/poestenkillupdate0423.pdf
2) February 2024 - BayArea Clean Water Agencies and San Francisco Estuary Institute - Study of PFAS in BayArea Wastewater https://bacwa.org/wp-content/uploads/2024/02/BACWA-PFAS-StudySummary-2024-02-07.pdf
PFAS Was Identified in Your Phase I: Now What?
By Kathryn Peacock, Principal; Suzi Rosen, PG, CHg, Principal & Managing Director; and Steve Luzkow, Technical Director | Partner Engineering and Science, Inc.
The EPA’s PFAS Ruling
In April 2024, the EPA issued a final rule to designate two of the most widely used categories of PFAS, perfluorooctanoic acid (PFOA) andperfluorooctane sulfonate acid (PFOS), and their isomers and salts, as hazardous substances under the Comprehensive Environmental Response, Compensation, and Liability Act (CERCLA) also known as Superfund. This rule became effective as of July 8, 2024.
PFAS has now joined other chemicals classified as hazardous substances that could expose real estate investors, developers, owners, and operators to cleanup obligations and costs. Additionally, they may face environmental damages and liability for human health risks from exposure to these substances. This means that to have certain liability protections afforded under CERCLA, prospective purchasers must evaluate PFAS within the scope of the All Appropriate Inquiries (AAI) standard established under the CERCLA Act (42 U.S. § 9601). As a result, PFAS risk is now evaluated in Phase I Environmental Site Assessments (ESAs) in the same manner as other hazardous substances.
PFAS and the Phase I ESA
PFAS can be released into the environment in many ways, including through wastewater and stormwater discharges, accidental releases, use for metal dust suppression, air emissions, and solid waste. Some of the most widely known PFAS-contributing industries include commercial printing, electronics, plating, fabric and textiles, cosmetics manufacturers, fire protection, food packaging, mining, airports, and potentially carwashes, drycleaners, and laundries. The Association of State Drinking Water Administrators publishes a list of NAICS codes identified as PFAS manufacturers, which serves as a great starting point when identifying PFAS risk. However, keep in mind that if an industry is on this list, it does not automatically mean there is a recognized environmental condition (REC) or a release of PFAS.
When evaluating PFAS risk in a Phase I ESA, the following factors are typically considered:
• Pathways: Presence of drains, sumps, pits, or other surface and subsurface pathways through which PFAS can enter the environment.
• Topography: Transport of PFAS throughout the site or offsite via surface drainage.
• Waste Discharges: Discharges that could contain PFAS, impacting surface waters and wastewater treatment systems.
• Air: Emissions that could disperse PFAS.
• Wells: Groundwater sources used for potable water, industrial uses, and irrigation are potentially impacted by PFAS.
These factors are not exhaustive, and the presence of other PFAS forms as emerging contaminants may also need to be considered based on statespecific criteria and future regulatory changes. In addition to traditional factors used to determine risk in a Phase I ESA, such as groundwater depth, groundwater gradient, and other physical setting features, the property's existing and future use needs to be considered when assessing PFAS risk.
Phase II ESAs
Phase II Environmental Site Assessments (Phase II ESAs) for sites known or suspected to be impacted by PFAS present unique challenges that differentiate them from those performed for other hazardous materials. These challenges include:
• Cost and Timing: Phase II ESAs for PFAS are generally more expensive and time-consuming. This is due to the longer analysis time and high cost per sample for PFAS lab tests. Although some recently approved methods take less time, they are not yet widely used.
• Vapor Intrusion Considerations: The science and technology around PFAS and vapor intrusion are still evolving. Currently, vapor intrusion assessments are not standard practice for PFAS. Some research suggests that certain forms of PFAS are volatile; however, lab analysis technology and regulatory screening level standards are still in development. As the regulatory environment and analysis methods continue to evolve, the vapor intrusion pathway may become a consideration in the future.
• Sampling Techniques: Field sampling techniques for PFAS are unique and require additional measures to prevent crosscontamination, which can occur if the sampler’s own PFAS-containing items, such as personal hygiene products, water-resistant clothing, fast food wrappers, and/or cosmetics, come into contact with the samples.
• Regulations: In April 2024, the EPA finalized the National Primary Drinking Water Regulation (NPDWR) for six PFAS chemicals, establishing Maximum Contaminant Levels (MCLs) for safe drinking water. Without statespecific regulations, these MCLs often serve as the default regulatory screening levels for Phase II ESAs, even if groundwater is not used for potable use. Note that some states have more conservative MCLs, which would take precedence over the EPA’s standards.
So, What’s Next?
Evolving Remediation Technology: Due to its inherent chemical stability, PFAS is resistant to many traditional remediation technologies, such as chemical oxidation/reduction or bioremediation, normally used for other common contaminants. This makes "old school" methods like dig-and-haul for soil and pump-and-treat for groundwater the most obvious cleanup options, though both can be expensive. More sophisticated remediation technologies such as thermal treatment, injection of carbon substrate materials, and supercritical water oxidation are already on the market and proven effective. However, these technologies are often more expensive, time-consuming, and challenging to implement compared to remediation for other contaminants like volatile organic compounds or petroleum hydrocarbons. Of course, remediation technology is evolving right alongside regulations. The good news is that these PFAS remediation technologies will generally also remediate other common co-contaminants.
Monitoring as a Mitigation Measure: PFAS remediation can be expensive and lengthy due to the current state of remediation technologies and uncertainties with regulatory closure criteria, alternative options may be considered when PFAS is present at a property. One such option is longer-term monitoring of sites with PFAS-impacted groundwater. While full remediation can be costly, monitoring a PFAS groundwater plume to ensure it does not migrate toward water bodies or potable supply wells, along with some limited groundwater injection for transport control, can be an option when performed in conjunction with regulatory agency oversight. Although this approach is not true remediation, it can be considered part of its feasibility analysis.
Wastewater Effluent: Above-ground technologies for managing wastewater streams, treating groundwater as part of a pump-and-treat remediation system, and/or treating private water supplies are well-established. These technologies typically use carbon or other absorptive/adsorptive media to remove PFAS from the waste stream. While effective, they still include disposal costs for the PFASimpacted waste media, often resulting in significant disposal costs. These methods are typically utilized at sites such as plating facilities, airports, drycleaners and laundries, and sites that use or manufacture PFAS.
Remedial Cost Estimating: Because of PFAS’ unique chemical makeup, addressing PFAS as a contaminant cannot be a simple "add-on" to proposed or existing remediation approaches used for other contaminants, such as chlorinated solvents or petroleum hydrocarbons, which are commonly found at dry cleaners, gas stations, or historical industrial sites. When PFAS is a contaminant, it will drive the overall remediation strategy and associated cleanup costs. Due to the rapidly evolving regulatory environment and uncertainty about reaching regulatory closure for PFAS sites, industry professionals can expect a higher level of uncertainty and wider ranges within remedial cost estimates (RCEs).
A major challenge with PFAS is the lack of regulatory closure criteria and precedence for remediating and closing sites with PFAS as hazardous substances under CERCLA. While the EPA has set six MCLs for groundwater and some states have soil and/or groundwater cleanup levels, the overall process (including timing and cost) for achieving No Further Action (NFA) or regulatory closure status for PFAS sites is still largely in development across the United States. Due to PFAS being newly regulated, even at the state level, predicting closure costs presents unique challenges due to the uncertainty surrounding closure criteria.
Insurance: Often, policies without a PFAS exclusion are still attainable. However, factors such as previous use and geographic location may affect the carrier’s decision to include or exclude PFAS coverage. When a policy without a PFAS exclusion is available, coverage typically extends to remediation, thirdparty liability, legal defense, transportation, and non-owned disposal sites. For policies with a PFAS exclusion, it may be possible to limit the exclusion to only certain areas of coverage.
Lender liability policies remain widely available without a PFAS exclusion. These policies are typically underwritten based on the borrower’s financials and provide protection solely to the lender. Since these policies are only triggered in the event of default and the discovery of a pollution condition, Environmental Lender Liability policies can be a good option for banks that want to forgo a Phase II ESA and keep the loan on the books.
Moving Forward
Regarding PFAS risk and liability, assembling a team of experts is crucial. It is advisable that you rely on the expertise, guidance, and insights of an experienced environmental consultant, a knowledgeable environmental attorney, and a skilled insurance broker familiar with emerging contaminants. As with other emerging issues, it is of paramount importance to stay abreast of the rapidly changing regulatory environment. In addition, being proactive and engaging with the regulatory community helps understand potential exposures and liabilities. Having a team of trusted advisors is important to help guide you through how the dynamics of this ruling will impact your business, offering expertise in due diligence, monitoring, treatment, cleanup, and other technologies.
A Funny Thing Happened on My Way to a Phase I…
Fascinating tales and stories submitted anonymously.
1) I had to tell a property owner that his property was contaminated. The lab samples had just come back after completing a Phase II. He offered to slip $800 in my pocket if I took some samples of ocean water and pretended that those were the real samples. Although it was tempting to take that $800 and retire for the rest of my life, I realized my mattress wasn’t nearly big enough to hide it all and I had to politely decline.
2) I once had a broker tell me that his client’s property (that was formerly an auto wrecking yard) could not possibly be contaminated. The reason? The property was currently utilized as a yoga retreat. “This is a place of ‘clean living,’ there is no way it could by dirty!”
3. We were working on an SBA deal and there turned out to be a 500-gallon UST at the site. Instead of hiring a firm to close it, the borrower decided to roll up their sleeves and fill it with bags of concrete from Home Depot. When I tried to explain that this was wrong on so many levels and that he didn’t even take any soil samples, he responded that he also bought a shovel from Home Depot and he could go get some soil as soon as he got off the phone!
4. We were conducting a Phase I ESA for a property owner. The property had a long history of industrial uses as well as auto repair operations. According to an interview with the owner, a Phase II was reportedly conducted that found contamination at the property. When we asked the owner for a copy of the Phase II, he responded “you need to stop asking for items that aren’t in the big picture relevant.”
Do you have a tale to tell? Submit it here (You can list “anonymous” in the required fields).
How Learning Together Sparked Discussion about the Future of Environmental Careers
By Shian Knouse, TTI Environmental, Inc.
Throughout my academic and professional career, I have heard discussions about the importance of developing a “network” or a group of relationships with other professionals in your industry. After graduating with my bachelor’s degree amid the 2020 COVID-19 pandemic, this seemed extremely difficult. Fast-forward three and a half years to November 2023, when my boss encouraged me to join a mentorship program. I took his advice and was lucky to be accepted into a program with Marty Walters as my assigned mentor.
I was matched with Marty as a mentor because I expressed interest in the ever-changing realm of Environmental Social Governance (ESG) risk. I am an avid environmentalist who consistently strives to reduce my own environmental footprin. Still, I was unsure how I could transition that mentality and incorporate one of my biggest passions into my professional career if that was even a possibility. Marty has been in the environmental field for decades and offered me a wealth of knowledge. She has experience dealing with hazardous waste management, disaster recovery, and risk management. Marty and I were both new to the mentorship program and spent our first few meetings discussing our shared interests. Among those shared interests was incorporating more ESG initiatives into our day-to-day work life.
After discussing my senior capstone project, which included conducting a greenhouse gas inventory and a subsequent climate action plan for a small township in Central Pennsylvania, we determined that this idea was something we could run with. We decided to learn together, completing training for EPA's Energy Star Portfolio and sparking deep conversations about where each of us is going next in our careers. I expressed interest in measuring my company’s current environmental footprint with the goal of reducing our overall environmental impact.
After coming up with a long list of potential projects and available resources, we dove headfirst into EPA’s Energy Star Portfolio training. The training helped us to develop property profiles on Energy Star’s Portfolio Manager. Portfolio Manager is a unique (and free) online software designed to benchmark energy use, water use, and waste production of a specific building. We paged through months of electric and gas usage data and input the information to identify property baseline energy usage throughout a calendar year. We will use this baseline to set usage targets and plan energy improvements to meet those targets. This project is still in the works, but the goal is to reduce energy consumption and resulting greenhouse gas emissions on a scale larger than that of a single homeowner.
This unique opportunity turned into a journey not just to learn the practical skills involved with understanding energy benchmarking but also an exploration of the connection between our personal and professional lives and how to think about resilience not just as a singular person or for a singular property but as a career path. In a world filled with greenwashing and false sustainability claims, it is a breath of fresh air to work on something tangible that will make a lasting difference. I am excited to continue learning about ESG initiatives in the consulting world and beyond. The journey has just begun…
Additional information about Portfolio Manager can be found using the links below:
By: Albert J. Slap, President, RiskFootprint and Bill Bohn, CEO, Community Resilience Consulting
The forthcomingASTM Property Resilience Assessment Guide provides an overview of a generalized, systematic approach for conducting a Property ResilienceAssessment (PRA) consisting of first, identifying the natural hazards likely to affect a property; next, evaluating the risks posed by those hazards along with the capacity of the property to prepare for, adapt to, withstand and recover from those hazards; and then finally, identifying conceptual resilience measures to enhance property-level performance and recovery. The PRA includes, at minimum, a baseline assessment of safety, damage, functional recovery time, and a limited consideration of community resilience or other material dependencies, such as the ability of utilities to deliver service to a property following a hazard event.
Stage 1 of the PRA, or the hazard assessment, which was part of a panel at the EBA’s 2024 Annual Conference in February and recently the focus of a webinar from EBA’s ESG Committee, has been colloquially called the “WHAT?” stage. That is, what hazards and climate change impacts can (underscore “can”) affect a building or property that is under consideration for purchase, sale, borrowing, insuring, or otherwise investing in. Stage 2, the “Risk and ResilienceAssessment”, colloquially called the “SO WHAT?” stage, examines the potential vulnerability of and, as referenced by many Users, the “value-at-risk” to, a building from specific hazards – mainly hazards in the here and now. However, depending on the purpose of the assessment (whether for current hazard assessment or climate risk reporting) and other considerations such as hold time, future climate considerations may also be relevant.
Risk is a function of hazard, exposure, and vulnerability. Therefore, it is necessary to understand if a building that is exposed to a hazard is actually vulnerable to that hazard and, if the field-verified vulnerability could lead to damage/loss that is significant to the owner/lender, then, additional desktop modeling may be required. This damage assessment is paired with a site inspection by an engineer or architect who makes observations regarding the age, type and condition of current building components and the presence of existing resilience measures, if any.
So, the question naturally comes up, what methods and models are available to help buyers, sellers, lenders, insurers, and investors, etc., quantify potential damage and value-at-risk in the “SO WHAT” or Stage 2 of a PRA?Although the PRAdoes not explicitly endorse or recommend any specific approach, one of the most tried and true models available is FEMA’s Hazus model. FEMA's Hazus is a nationally standardized risk modeling methodology. It identifies areas with high risk for natural hazards and estimates physical, economic, and social impacts of earthquakes, hurricanes, floods, and tsunamis. Hazus is used for mitigation, recovery, preparedness, and response – and more recently for property resilience assessments. Note that the Hazus model does not cover all hazards, such as tornados, wildfire, and hail. Mitigation planners, GIS specialists, and emergency managers have used Hazus for many years to determine potential losses from disasters and to identify the most effective mitigation actions for minimizing those losses. Hazus supports the risk assessment requirements in the mitigation planning process. Hazus can quantify and map risk information such as:
• Physical damage to residential and commercial buildings, schools, critical facilities, and infrastructure.
• Economic loss, including lost jobs, business interruptions, repair, and reconstruction costs.
• Social impacts, including estimates of displaced households, shelter requirements, and populations exposed to floods, earthquakes, hurricanes, and tsunamis.
• Cost-effectiveness of common mitigation strategies, such as elevating structures in a floodplain or retrofitting unreinforced masonry buildings.
Hazus uses inventory information (buildings, infrastructure, and population), hazard extent and intensity data, and damage functions to estimate the impacts of hazards and disasters.The estimated impacts include building damages, economic losses, displaced households, casualties, debris, and the loss of function for essential facilities. Hazus uses a variety of engineering data and engineering-based damage functions to estimate potential losses from natural disasters.
It is also useful for PRA users to understand the differences between the terms current Valueat-Risk and Climate Value at Risk (CVaR), although the Guide itself does not use either term, because commercial hazard screening products are being produced using this terminology. The Guide encourages users and providers to determine the goals of the assessment at the outset of a project so that the focus on current hazards or future, climate-change related hazards can be specified. In any case, understanding the difference between current damage potential and future climate change-related damage potential is critical.
Although the Guide does not endorse any particular methodology for calculating either future or current damage (deferring instead to the professional judgment of the PRAProfessional), one approach to determining current Value-at-Risk is the output expressed by FEMA's Hazus model, which is a percentage damage/loss for a building structure, its contents, and restoration times.
Climate Value at Risk (CVaR), on the other hand, is generally defined as a measure used to estimate the potential financial losses that a company or portfolio of assets could incur in the future as a result of climate change. CVaR provides a forward-looking and return-based valuation assessment to measure climate-related risks and opportunities. CVaR is most often used to gauge the impacts of climate change on investment or loan portfolios in the aggregate and not on an individual asset basis; however, CVaR tools are available at the asset level.
The output typically spans both physical and transition risk so is not comparable to an output from a tool such as Hazus. In summary, CVaR is specifically designed for assessing financial risks related to climate change, particularly for fund investors. Hazus, on the other hand, is more focused on assessing the physical and economic impacts of hazards and natural disasters in the present day.
While Hazus has traditionally been used by local governments for hazard mitigation planning, it has been used more recently at the individual building level to quantify the percentage damage and loss to structures, contents and business interruptions from such natural hazards and floods, wind, hurricanes and earthquakes.The PRAStage 2 output is becoming increasingly valuable to REITs and other building owners, commercial lenders, and even large tenants, who may be displaced by natural hazards.
Below is an example of Hazus-based vulnerability and value-at-risk outputs that were used “hypothetically” in a panel discussion at the Environmental BankersAssociation Annual Conference in February 2024. These RiskFootprint MaxDamage Tables were derived from a RiskFootprint report that was prepared for the panel discussion regarding an apartment building in LosAngeles. The RiskFootprint report provides both the PRA Stage 1 hazard input (the “WHAT”) and vulnerability input to the Hazus model for: flood depths, wind speeds, and earthquake “peak ground acceleration”. With this hazard and vulnerability information (and some additional information about the building structure itself), the Hazus model output provides maximum percentage losses to the building’s structure in terms of replacement costs. In the case of this apartment building, the Hazus maximum flood loss was 13%; the maximum wind loss was 3%; and, the maximum earthquake loss was 40%. The Hazus earthquake output can be set at the maximum hazard threat present at the site (% g) or lesser thresholds. The usual, bank-required Seismic RiskAssessment (SRA) (Theil and Zsutty Methodology) estimates structural loss as a percentage for the 50th percentile scenario (SEL) and 90th percentile scenario (SUL). The Hazus output goes further than the SRAby including direct building losses - structural and non-structural content losses, business inventory, business interruption, lost wages, relocation costs, and injuries, etc.
According to Holly Neber, CEO of AEI Consultants, and the Chair of the ASTM Property Resilience Assessment Task Group, she is aware of several other methods of supporting PRAStage 2 assessments, including hazardspecific approaches, the insurance industry’s climate-conditioned catastrophe (CAT) model approach, and an approach modeled after Property Condition Assessment (PCA) repair/replacement cost calculations, among others. There are pros, cons and uncertainties associated with all of the approaches, which is why it is critical to understand the client’s goals prior to undertaking a PRAso that the appropriate methodology or combination of approaches can be selected. “The more that Stage 2 PRAs are based on both the most up-to-date, hazard models and actual, building-specific information, the greater the likelihood that the outputs of Stage 2 will be useful to the clients,” offered Ms. Neber.
In conclusion, while the draft ASTM Guide does not specify any particular tool, the FEMA Hazus model offers users of the PRA Stage 2 with a fast, accurate and affordable method for assessment of current day hazards, vulnerability, and value-at-risk based on a nationally standardized risk modeling methodology.
Developing Self-Awareness: A Key to Successful Leadership and Teaming
By Alison Marandola, Chief People Officer; and Kathryn Peacock, Principal of Partner Engineering and Science, Inc.
In today’s fast-paced and ever-evolving workplace, the ability to adapt and lead effectively is paramount. Central to this is the development of selfawareness. By understanding one’s own strengths, weaknesses, and behavioral patterns, leaders can better manage change, engage their teams, and foster a positive organizational culture. Even the most effective leaders have room to grow, and by demonstrating self-awareness, reflecting, and taking action, they can improve even further. This article discusses the importance of self-awareness in leadership and offers five practical strategies for its cultivation.
1) Active Listening
Listening is a fundamental skill that significantly impacts job effectiveness and the quality of our relationships. Despite its importance, most of us remember only 25% to 50% of what we hear. Active listening is a technique that can help bridge this gap. It involves making a conscious effort to not only hear the words but also understand the complete message being communicated.
Key elements of active listening include:
• Paying close attention and staying focused;
• avoiding distractions and returning to the conversation if you stray;
• demonstrating that you are listening through nods, smiles, and brief verbal acknowledgments like "uh huh”’’:
• paraphrasing and restating to ensure understanding;
• not interrupting and remaining open, honest, and candid in your responses; and
• building on the conversation and comparing differing views without suggesting the other person is wrong.
Leaders who embody effective listening often employ various non-verbal actions to show their engagement and openness to listen and learn. For instance, they might maintain eye contact to build trust, or lean slightly forward to express interest.Additionally, an open posture with uncrossed arms, relaxed shoulders and a receptive stance conveys their readiness to listen and learn from the speaker’s message.
2) Communicating Effectively
Effective communication is vital to organizational success. It boosts morale, increases engagement, improves team collaboration and cooperation, heightens accountability, and drives better results for individuals, teams, and organizations.
To communicate effectively:
• Be respectful in both words and behaviors,
• actively listen and remain polite and professional, and
• handle challenging situations with grace by learning to manage ambiguity while maintaining a professional demeanor.
3) Embracing (Constructive) Conflicts
Conflict, when approached correctly, can be a gift. It offers a chance to gain insights into our strengths and weaknesses through feedback and reflection.Amy Gallo, a writer, speaker, and coach, emphasizes the importance of seeing conflict as an opportunity to understand different perspectives. She explains that while many people naturally avoid conflict, expressing disagreement constructively can lead to productive outcomes when approached with compassion and kindness.
Below are some tips she offers on how to navigate conflicts productively:
• Wait for the Right Moment:Address issues when emotions have settled, and your brain’s amygdala is no longer in a fight-or-flight mode.
• Prepare Thoroughly: Clearly define what you need from the conversation, such as resolving a specific issue or meeting a deadline.
• Consider Perspectives: Empathize with the other person’s viewpoint.
• Focus on Data and Facts: Concentrate on what is actually being disputed, relying on observable data rather than assumptions about the other person’s motives.
• Approach Calmly and Confidently: Maintain a composed demeanor and approach the issue with confidence.
• Assume Positive Intent:Apply the most generous interpretation to the other person’s actions.
• Demonstrate Compassion and Kindness: Handle disagreements with empathy. Recognize that not every conflict will resolve perfectly but approaching it with compassion helps navigate these situations gracefully.
4) Developing Self-Awareness
Self-awareness is crucial for effective leadership and more successful interactions. It involves understanding our strengths, weaknesses, and blind spots through feedback and reflection. Here’s how to enhance your selfawareness:
• Objective Data:Analyze data objectively to distinguish between perception and fact.
• Reflect on Impact: Regularly reflect on your actions and their effects on others.
• Seek Honest Feedback: Request candid feedback from multiple sources and accept it without defensiveness. Respond simply with ‘Thank You’ versus explaining why you did or said something.
• Practice Active Listening: Fully engage with others by listening to their perspectives and feelings.
• Admit Mistakes:Acknowledge and learn from your errors to demonstrate humility.
• Continuous Learning: Recognize what you don’t know and seek growth opportunities.
• Observe Yourself: Monitor your behavior and reactions without judgment.
• TakeAction: Use feedback constructively to make improvements.
Enhancing one’s self-awareness is key to personal and professional growth.
5) Identifying and Addressing Counterproductive Behaviors
Marshall Goldsmith’s book, What Got You Here Won’t Get You There, identifies 20 bad leadership habits that create challenges in interactions. Examples include winning too much, adding too much value, making destructive comments, and not listening. Overcoming these habits requires openness, courage, humility, and discipline. By identifying these behaviors and actively working to change them, leaders can create a more positive and productive work environment.
Figure 1 provides a comprehensive list of these behaviors. To effectively address and overcome these habits, consider implementing the following approach:
1. Conduct a Self-Assessment: Review the behaviors listed in Figure 1 and identify the two to three habits that are most relevant to your leadership practices. If you are unsure which you do, ask people in your professional or personal life for their observations.
2. Engage anAccountability Partner: Partner with a colleague, mentor, or coach who can provide honest feedback and hold you accountable for progress.
3. Implement Regular Check-Ins: Schedule monthly/periodic reviews (10 minutes maximum) with your accountability partner to evaluate progress, discuss challenges, and make necessary adjustments to your action plan. Ask if they see a difference, what you can do to improve, and say ‘Thank You’.,
Conclusion
Remember that true growth comes through practice and experience when applying the insights shared here. Learning isn’t just about attending events or receiving coaching; it’s about applying what you’ve learned in real situations. Be open to feedback, express gratitude, and acknowledge mistakes when they occur. Changing habits that don’t serve you and being willing to be vulnerable with colleagues will enhance accountability and support your growth. To deepen your self-awareness and emotional intelligence, consider exploring Daniel Goleman’s work, which highlights self-awareness as a core component of emotional intelligence.
Increasing self-awareness is a journey that requires continuous effort, practice, and a willingness to be vulnerable. While these approaches may seem straightforward, they require effective implementation of openness, courage, discipline, and humility. By doing so, we can enhance our leadership and teaming abilities, leading to more effective and meaningful interactions in both our professional and personal lives.
Trivia Answers
COMMITTEE ROUND-UP
The EBA has several committees meeting regularly. In fact, it is due to our volunteer members who dedicate their time, talent, and expertise, that most of the EBA's content exists, including this Journal.
All EBA members are invited to join these open committees and get involved! Contact eba@envirobank.org to learn more.
Conference
Committee
Plans the EBA conference agenda and conference experience.
2024 Chair: Jennifer Bellamy, U.S. Bank
Continuing Education Committee
Oversees EBA educational content, including webinar planning and execution, and recommended topics for conference sessions.
2024 Chairs: Rita Wiggin, First Bank and John Rybak, Truist Bank
DEI Committee
Identifies and organizes opportunities we can make EBA and our industry more diverse, equitable, and inclusive.
2024 Chair: Lori McKinnon, Zions Bancorporation
ESG Committee
Assesses environmental, social, and governance risk management as it relates to financial institution regulation, risk management industry standards, and development of methods for assessing and mitigating risks.
2024 Chair: Kate Flaherty, Wells Fargo Bank
Gives Back
Committee
Identifies and organizes opportunities where our members can make an impact through contributions to charitable organizations.
2024 Chair: Jonathan Green, Green Environmental Management
Membership
Committee
Builds connections with members to ensure they’re making the most of their EBA membership, as well as identifies and makes initial outreach to future members.
2024 Chair: Onamia Chun, Zions Bancorporation
Journal
Committee
Collects, writes, edits, and assembles articles our members contribute to our 2x annual publication.