


WINTER/SPRING 2025

Getting sound economic guidance is not a one-time event. It requires access to the latest data and a dependable source of insight to drive the best financial decisions — both in life and in business.
At Entegra, we are proud to be your partner in business performance improvement. We provide the insights, tools and expertise to help you navigate the economic landscape with confidence. Our Entegra Cost Outlook is central to this mission. Delivered quarterly, it’s a commodity forecast designed to give you a clear view of the factors influencing what you pay for essential goods and services.
The Entegra Cost Outlook doesn’t just inform—it empowers you to prepare for what’s next. With intelligence from supply chain and economic experts, it’s a valuable resource that allows you to anticipate future trends, plan strategically and manage expenses effectively.
From fluctuating prices in dairy, meats, vegetables and grains to fuel, we understand the critical importance of tracking these changes and how they impact your bottom line. Our goal is to provide actionable insights that help you make informed decisions and set the right prices for your customers.
Explore all that Entegra offers to meet your business goals. Beyond the Entegra Cost Outlook, our suite of resources is built to empower your success:
• Advisory Services: Entegra provides personalized support through programs in corporate social responsibility, culinary consulting and energy management — tools to help you unlock limitless performance potential.
Thank you for placing your trust in Entegra to deliver cost-saving programs, expert advisory services and timely market guidance. We value your partnership and are always here to provide personalized solutions tailored to your unique needs. Please don’t hesitate to reach out to your Entegra advisor for support.

Damien Calderini President and Global CEO
Entegra
Dear trusted partners,
Welcome to the fourth edition of the Entegra Cost Outlook.
Since our spring/summer 2024 issue, we’ve seen more positive shifts in the marketplace, including stabilizing pork indices and a strong labor market. However, we continue to operate in an inflationary environment, with meat and eggs presenting ongoing challenges.
The start of our new fiscal year presented some major, unexpected challenges. As always, our team mobilized, working closely with our vendors and distributors, implementing strategies and protocols to mitigate the potential impact of these obstacles, ensuring minimal disruption to Entegra’s operations wherever possible. However, these events may have longer-term implications on food costs over the next several months.
The data provided within Entegra Cost Outlook is a valuable resource you should be mining regularly to proactively boost your bottom line.
We closely research and implement all data sources available to us for forecasting, planning, etc. Please keep in mind that while the content provided within this resource is thoroughly analyzed, we cannot make guarantees as market fluctuations are unpredictable.
Thank you for your continued trust in the Supply Management team. Together, we truly make a difference.

David Kourie Chief Purchasing Officer and Senior Vice President Supply Management
There are multiple indices used to measure and report on inflation.
Price
The Consumer Price Index for All Urban Consumers (CPI-U) measures changes in consumer prices based on a representative basket of goods and services.
• CPI-U only measures inflation as experienced by consumers, not producers.
• This basket of goods and services is compiled by the Bureau of Labor Statistics, which tracks 94,000 prices monthly to assess inflation for more than 200 categories of products and services.
• Broad consumer spending categories like food, energy, apparel and services include subcategories tracking inflation for everything from apples and premium unleaded gasoline to men’s underwear and funerals.
The Consumer Price Index (CPI) can be further broken down into Food at Home (FAH) and Food Away from Home (FAFH).
• The CPI for Food at Home (FAH) includes categories such as cereals and bakery products, meats, poultry, fish, eggs, dairy, fruits and vegetables, and beverages that are designed for home consumption. It also includes products that are obtained through traditional food shopping outlets such as grocery stores, convenience stores and supercenters.
• This index covers the “sale of food meant for home or off-site consumption” — food at home.
• The CPI Food Away from Home (FAFH) covers full-service restaurants, limited-service restaurants, drinking places, hotels, motels, retail stores, vending machines, recreational places, schools and colleges.
• This index covers the “sale of food meant for immediate consumption” — generally onsite and away from home.
This index resembles a CPI and reflects changes over time. However, instead of retail prices, the PPI provides a measure of the average prices paid to domestic producers for their output.
• Think “industry,” “farm” and “wholesale” instead of individual consumer.
• PPIs are reported for nearly every industry in the goods-producing sector of the economy.
• PPI is typically more volatile than CPI, as price volatility decreases as products move from farm to wholesale to retail.
• CPI typically lags movements in the PPI.
When reporting on inflation, Entegra uses a blended approach from all indices designed to cover all various Entegra contract types and segment-specific requirements.
Inflation continues to moderate from highs reached in June 2022.
• In September 2024, the CPI rose by 2.4% vs. a year ago — continuing to ease toward the Fed’s stated target of 2%.
• Consumer food prices have also moderated, now rising at a 2.3% annual rate.
• Wholesale food prices (PPI-Food) are also slowing, now rising at a 1.9% annual rate.
• We are expecting both the CPI-Food and PPIFood to continue to rise at a rate near 2% vs. a year ago through 2025.
CPI (Food): Home vs. Away from Home vs. Limited Service Away
The world crude market is, almost by nature, extremely volatile — the price of crude typically varies by more than $25/barrel in any given year. Changes in energy costs have a dramatic impact on commodity markets.
• Crude oil prices remain volatile but are trending lower.
• Geopolitical concerns (Russia/Ukraine, Middle East tensions) have supported the market and led to wider swings in the price of crude oil over the past three years.
• However, beyond geopolitical concerns, the market has more favorable supply/demand fundamentals for the next year.
· Continued weak economic growth in China has reduced crude oil demand.
· The U.S. and Canada had record crude oil output in 2023 and again in 2024.
· OPEC+ continues to be compelled to limit their output to avoid having excess supplies drive crude oil prices sharply lower.
· Crude oil futures are expected to remain volatile, but trend to sub-$70/barrel.
• Retail gasoline prices have declined from $3.80/gallon in April 2024 to $3.20/gallon in recent months.
• On-road diesel fuel prices have declined to a three-year low of $3.60.
Concerns about further escalation in the Middle East loom as a key risk — from current levels of near $75/bb, even a short-term supply disruption could drive crude oil futures to $90 or higher for a short period of time.
• Frequently, changes in the value of the U.S. dollar over a period of time are cited as a key driver of commodity prices. Since the beginning of 2021, the value of the U.S. dollar (relative to other currencies) has gained roughly 10% in value — a trend that should generally lead to downward pressure (or less upward pressure) on most commodity prices.
• There are several reasons why the value of the U.S. dollar can affect commodity prices:
· When the value of the U.S. dollar strengthens, it can make commodities more expensive for buyers using other currencies; this can reduce demand for commodities and put downward pressure on prices.
· Conversely, when the value of the U.S. dollar weakens, it can make commodities relatively cheaper for foreign buyers, which can increase demand and put upward pressure on prices.
· The value of the U.S. dollar can also affect the cost of production for commodity producers. If the U.S. dollar strengthens, it can make it more expensive for producers to purchase inputs like labor and raw materials, which can reduce supply and put upward pressure on prices.
· Additionally, changes in the value of the U.S. dollar can impact global trade and economic activity, which can also affect the demand and supply of commodities and their prices.
• Overall, the value of the U.S. dollar is an important factor to consider when analyzing and predicting commodity prices, and many investors and traders monitor changes in the U.S. dollar exchange rate closely to help forecast future movements in commodity prices.

Due primarily to demographic trends, the availability of labor is going to be a challenge that will persist for the foreseeable future. Despite rising wages, the ability to track and retain employees will be a key challenge confronting businesses in the years ahead.
• Job growth has been mixed to strong through September 2024 — over the past 12 months, the U.S. economy has added a relatively strong 200K jobs per month.
• In the third quarter of 2024, Canada added 66,000 jobs, a slowdown compared to the 115,700 jobs gained in the second quarter. The unemployment rate increased from an average of 6.2% in Q2 to 6.5% in Q3, marking a full percentage point rise since Q3 2023.
• The U.S. unemployment rate has remained low, currently at 4.1%.
• Canada's population growth, driven by significant immigration, has outpaced employment growth, contributing to a rising unemployment rate. As of November 2024, Canada's unemployment rate increased to 6.8%, up from 6.5% in October. This marks the highest rate since January 2017, excluding the COVID-19 pandemic years.

The Canadian dairy industry operates under a supply-managed system in which production quotas based on domestic consumption, and milk pricing is established using farm cost of production, with milk pricing to dairy processors fragmented according to end use.
Milk Production: Raw milk production in September 2024 increased by 2.58% compared to August, with notable growth in milk, cream, cheese, and butter processing activities.
Dairy Consumption: During the past 12 months ending September 2024 consumption increased in most categories: Milk: +1.5%, Cream: +2.2%, Yogurt: +1.5%, Ice Cream: +0.7%, Cheese: +2.1%, and Butter: -1.2%.
Imports: In Canada, dairy product imports are a key component of the quota system. To prevent surplus situations, imports are subtracted from the total requirements which reduces the national quota.
Over the 12 months ending in September 2024, imports reached 24.5 million kg of butterfat, a 3.11% increase from last year due to free trade agreements like CUSMA expanding market access until 2025.
Other Market Influences: Avian Influenza — unlike the poultry industry, the Canadian dairy sector has not reported any cases of avian influenza in cattle. Authorities confirm that the H5N1 strain affecting poultry poses no risk to dairy cattle or milk production. Dairy product supplies and prices remain stable.

There is no support price for cheese to influence wholesale cheese pricing. Rather, cheese pricing is driven by the pricing of milk used to make cheese, processor costs, and general supply and demand including imports, which are increasingly significant in the Canadian market.

Imports: As of Sept 2024, imports of cheddar cheese were 11% higher that the same period in 2023 at 6.4 million kilograms. *
Production: Cheddar cheese production in Sept 2024 was just over 12,500 tonnes, 7.6% higher than Sept 2023. Production for the 12-month period ending Sept 2024 was just over 163K tonnes, about 2.1% higher than the previous period.
Stocks: Cold storage cheddar cheese stocks at the end of October 2024 were 41,271 tonnes, only .7% higher than the same month in 2023. Cold storage stocks of variety cheese, which includes mozzarella, were 35,681 tonnes, 1.1% higher than the same month in 2023.
Q1-2022Q2-2022Q3-2022Q4-2022Q1-2023Q2-2023Q3-2023Q4-2023Q1-2024Q2-2024Q3-2024Q4-2024Q1-2025Q2-2025Q3-2025Q4-2025Q1-2026Q2-2026Q3-2026Q4-2026

Wholesale butter prices in Canada are heavily influenced by the support price for butter maintained by the Canadian Dairy Commission (CDC). To maintain price support, the CDC trades butter in the domestic and international markets.
Butter Price: The CDC will decrease the support price for butter slightly from $10.3505 to $10.3489 per kilogram on February 1, 2025.
Butter Production: As of Sept 2024, Canadian butter production was 4.6% lower than 2023 at 81.7 thousand tonnes.
Butter Stocks: Total butter stocks in Sept 2024 were 33,532 tonnes, 6,229 tonnes higher than a year ago but down by 2,338 tonnes from August 2024.
Other Market Influences: The growing use of fats and oils in renewable diesel and sustainable aviation fuel production has increased demand for commodities like yellow grease, tallow, and vegetable oils (soybean, canola, palm). This trend indirectly affects butter prices due to the interconnectedness of the fats and oils market and can lead to price volatility in wholesale butter prices due to fluctuations in the support price, lower storage levels. The increasing demand for fats and oils in renewable energy sectors could exert upward pressure on butter prices.
*


• After three years of tight stocks and corn prices trading mostly in the $6 to $8 range, the extreme tightness in the corn market (and other crops) has reversed itself.
• Nearby corn futures have declined toward $4 (near the pre-2020 levels) as inventories are set to rebound substantially over the next 18 months.
• Corn prices are important due to the size of the U.S. crop (relative to other crops), as well as the large-scale use of corn to feed livestock.


• Soyoil demand remains strong but the availability of adequate feedstocks for biofuels has allowed soyoil prices to relax from elevated levels.
• Growth in renewable diesel capacity, driven by California’s Low Carbon Fuel Standard (LCFS), continues despite narrowing margins.
• The dramatic increase in alternative feedstocks (used cooking oil, tallow, etc.) has reduced the market’s dependence upon soyoil, but action by Congress or the President could limit imports and drive soyoil prices higher.
• After trading in a 75-cent to 80-cent range, soyoil futures have declined into a 45-cent to 50-cent range, which appears to be the likely range over the next year.

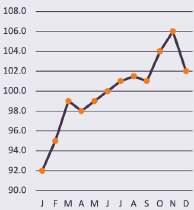

* Wheat * • Wheat prices (KC futures) have declined to below $6 per bushel and are expected to trade mostly in the $5.50 to $6 range.
• Wheat prices peaked during May 2022 as supply concerns (Russia/Ukraine war) drove futures (KC) to over $13 per bushel.
• With the worst fears not being realized, prices have fallen by 50% over the past 24 months.
• Favorable weather has resulted in 2024 wheat output rising by 9% to a seven-year high.


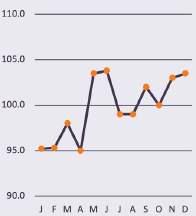
• Rice futures have declined sharply as larger U.S. supplies, as well as declining corn/wheat prices, have helped relax markets.
• The United States remains Canada's primary trading partner for rice, both as the largest supplier and the top export destination.
• An increase in U.S. rice supply is expected to lead stocks to climb to a four-year high.
• A modest increase in global exportable supplies is expected to increase world prices.
• Rice prices have declined into a $14-to-$16 range, and barring any major foreign supply disruptions, should remain in this price range.
• In Canada, the market is projected to grow by 16.43% between 2024 and 2029, with an anticipated market volume of approximately $47.88 million by 2029.

*
• There remain no signs of expansion in the cattle herd, and cattle inventories remain historically low (down 1.9%).
· The beef cow herd is down 2.5% and expected to be lower next year.
· Beef replacement heifer numbers are the lowest since 1950 at 1.4%; this number may very likely be lower in 2025.
• Beef prices will remain high while the industry remains at these historical low inventory levels.
• Heifer retention — when producers (cow/calf operations) hold back heifers to breed to expand — has not appeared to happen.
· Cattle on feed numbers are still showing that 38% to 39% of the animals on feed are heifers.
· This means that cow/calf producers are sending unbred female cattle to feed out for harvest instead of holding them back to breed to ultimately expand the cattle herd.
• We expect the rebuild to be slow — very unlike the rebuild in 2014 to 2016.
• There are several factors that could impact the rebuild.
· The threat of a continuing and redeveloping drought — we have seen drought in the cattle inventory areas increase from 14%to 35% in the last 2.5 months.
· Hay/forage prices remain higher than in the previous rebuilding cycle.
· Beef prices remain at record highs, and while feed costs have softened the higher beef prices, they appear to be pushing operators to sell for cash flow today.
• Once expansion for the cattle industry does begin, supplies will tighten up further as producers hold back animals for breeding. It takes approximately more than two years for cattle to be ready for harvesting, including while the cow is pregnant.


* CONTINUED

• Beef 90s prices for 2025 will remain historically high as cow slaughter remains constrained.
· It was down about 15% in 2024, and we expect something similar or even lower in 2025.
· While imports have increased to help supplement supply, it likely won’t be enough to offset the lack of domestic supply.
• Beef 50s are a bright spot compared to the rest of the beef complex.
· Overall weights remain well above last year’s levels, and that is adding fatty beef to the ground beef supply and keeping beef 50s from surging like we saw in 2023.
• The beef cutout has remained elevated, and there has been some trade from middle meats into end meats and ground beef.
· In some cases, it even makes sense financially with expensive ground beef prices for a primal-like round to be used in grinding for ground beef. That has kept the round primal elevated and has contributed to the cutout staying firm.


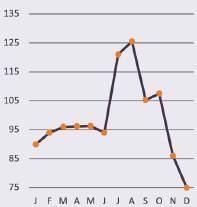
• Moving into 2024, pork demand has b een higher, and production for 2024 will be positive.
• Pro duction is remaining above last year’s levels, but freezer stocks are lower. Much of that is due to the increase in demand both globally and domestically and keeping pricing a little higher into Q4 than anticipated.
• Sow slaughter has slowed.
· This will stabilize the breeding herd moving forward.
· Low sow slaughter could also impact trim availability, so that should be watched.
• Margins were very poor for the better part of two years until spring 2024.
· The improvement was marginally due to higher prices and lower feed costs.
· If margins remain high, we will continue to see slow breeding herd reductions and will keep production positive in 2025.

*Indicates anticipated price direction for 2024
The Canadian poultry industry operates under a supply management system, which controls production, and allows predictable imports to meet domestic demand. It encompasses chicken, turkey, and egg production. Farm prices are established using a cost of production formula.
• Chicken Consumption: In 2023, chicken remained Canada’s most consumed meat, with a per capita consumption of 35.2 kilograms, a slight decrease from 36.1 kilograms in 2022. This decline may be attributed to factors such as inflation and supply chain disruptions, which have influenced consumer purchasing behaviors.
• Turkey Consumption: Turkey consumption is highly seasonal. In 2023, 37% of the total whole turkeys were purchased at Thanksgiving and 46% of the annual total at Christmas. In 2023 Canadians consumed 134.2 million kilograms of turkey, with a per capita consumption of 3.3 kilograms.
• Egg Consumption: In 2023, egg consumption rose by 2% to 883 thousand dozen.
Other Market Influences: Avian Influenza
• Outbreaks of avian influenza (H5N1) in Canada has led to disruptions in poultry production. High mortality rates and mandatory culling of infected flocks have reduced supply, particularly in regions like British Columbia.
• Reduced poultry supplies have resulted in price increases for wholesale buyers. Companies should anticipate the potential for short-term price volatility in poultry products.


Canadian chicken production generated $4.1 billion in 2023, contributing 4.1% of cash receipts from agricultural operations. In total, 1.4 billion kilograms of chicken were produced by 2,853 regulated producers.
• Slaughter: Chicken slaughter was 113 thousand tonnes in Nov 2024, down 4.7% compared with Nov 2023, but slightly ahead of the same 12-month period at 1.38 million tonnes.
• Stocks: As of November 2024, total chicken stocks stood at 61.7 million kilograms, 14% lower than January 2024 levels. Boneless chicken breast stocks, however, increased slightly to 6.3 million kilograms, 1% higher than January.
• Imports: Imports of boneless chicken breasts as of Nov 2024 is 13.3 million kilograms. If Dec imports are the same as 2023, then 2024 imports would come in at 14.6 million kilograms, which would be just under 5% less than 2023.
Q1-2019Q2-2019Q3-2019Q4-2019Q1-2020Q2-2020Q3-2020Q4-2020Q1-2021Q2-2021Q3-2021Q4-2021Q1-2022Q2-2022Q3-2022Q4-2022Q1-2023Q2-2023Q3-2023Q4-2023Q1-2024Q2-2024Q3-2024Q4-2024Q1-2025Q2-2025Q3-2025Q4-2025Q1-2026Q2-2026Q3-2026Q4-2026
* In 2023, Canadian turkey producers generated 159 million kilograms of turkey meat, valued at $487 million in farm cash receipts.

Unlike chicken, trade in turkey is primarily in frozen product. Also, unlike other supply managed products, Canada tends to be a net exporter- largely comprised of exports of dark meat cuts that are less preferred in the Canadian markets, and with significant imports of white/breast meat products.
• Slaughter: turkey slaughter was 12 thousand tonnes in Nov 2024, down 12% compared with Nov 2023, but slightly ahead of the same 12-month period at 159 thousand tonnes.
• Stocks: cold storage stocks of turkey are notoriously seasonal, with inventories building from a low in January up to a peak in September, and then falling sharply through the fall. The swings in inventory are overwhelmingly driven by smaller whole birds served as whole turkey, especially at Thanksgiving and Christmas, with further processed products steady.
As of November 2024, total turkey stocks were 29 million kilograms, 65% higher than January 2024 levels due to seasonal demand.
• Imports: in 2024 declined significantly, totaling approximately 5 million kilograms—20% lower than in 2023.
*
The egg market in Canada is divided into two categories, table eggs and processed eggs. The table egg market, mostly supplying the retail and food service market, accounts for approximately 66% of the Canadian egg production. Meanwhile, the egg processing sector, supplying the industrial, food service and retail sectors, accounts for the balance (approximately 33%).
• Production: Egg production in Canada is stable, with shell egg production in 2023 of just under 800 million dozen.
• Processing Eggs: In 2023, a total of 44.8 million dozen of shell eggs, mostly for breaking, and 2.5 million kilograms of processed eggs in the form of liquid, frozen and dried were imported into Canada.
• Liquid Processing Eggs: As of week 48, 2024, year to date declarations of eggs for breaking were 213 million dozen, ahead of 2023 by 11.2% (195 million dozen). At the end of Nov 2024 liquid egg processing was just over 110 thousand tonnes for the year, which is 9% behind the same period in 2023.
• Stocks: Frozen whole egg stocks are ending 2024 at close to 5-year lows at 250,000 kilograms, down 22% from Nov 2023.
• Liquid and Frozen Whole Egg Imports: liquid and frozen egg imports fluctuated significantly between 2023 and Nov 2024. Liquid eggs declined by 80% while frozen whole eggs increased. Combined imports declined 27% to 236 thousand kilograms from 2023.
• Shell Egg Imports: to date in 2024 shell egg imports are 20% higher than 2023 at just over 48 million dozen.
Q1-2019Q2-2019Q3-2019Q4-2019Q1-2020Q2-2020Q3-2020Q4-2020Q1-2021Q2-2021Q3-2021Q4-2021Q1-2022Q2-2022Q3-2022Q4-2022Q1-2023Q2-2023Q3-2023Q4-2023Q1-2024Q2-2024Q3-2024Q4-2024Q1-2025Q2-2025Q3-2025Q4-2025Q1-2026Q2-2026Q3-2026Q4-2026

• Total seafood supply increased approximately 10% from January to June 2024 compared to the same time period last year despite lower imports of shrimp, salmon and groundfish.
• Tariffs on shrimp have slowed shrimp imports, while salmon imports showed an 8% decline in Chilean salmon production.
• Overall seafood supply and demand are expected to increase in 2025, but the growth may be uneven across species categories.
· Lobster and crab may be constrained by declining landings or quota, and salmon is expected to rebound.
• Seafood market cost will increase moderately as most species categories find a new balance in supply and demand after the dramatic ups and downs during and through the pandemic. New tariffs will raise prices on shrimp, the most popular seafood.
• As the most internationally traded protein, seafood remains vulnerable to geopolitical risks. The increasing impact of climate change from global warming is a new variable in seafood production and can add additional uncertainty on supply.


• After increasing sharply from $3,000/tonne to over $10,000/tonne earlier this year, cocoa prices have declined slightly to the $6,500/ tonne to $8,000/tonne range.
• Driven by disease and drought, a reduction in supplies in key growing regions (primarily Ivory Coast) has been the key driver of market tightness. More favorable weather in West Africa has provided some slightly improved production outlooks.
• It will take multiple years for world cocoa production to recover, and thus prices may remain near current elevated levels for an extended period.


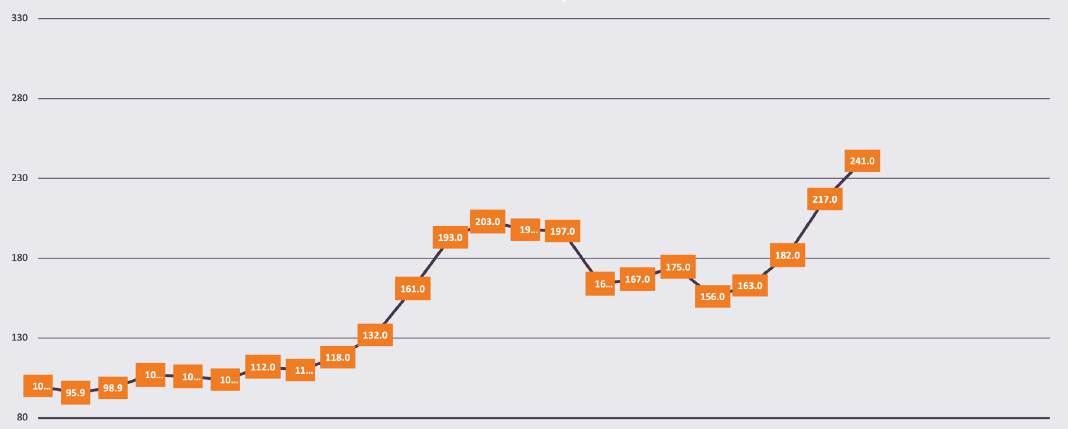
• The coffee market has been volatile — the December contract reached a record high of 2.73 at the end of September and has since been on a downward trend towards 2.45.
• Drought conditions in Vietnam and Brazil have led to ongoing production concerns — particularly for Vietnam’s Robusta crop.
• The EU Deforestation Regulation was set to go into effect at the end of the year, but the EU Commission recently proposed to delay implementation to December 2025. EU importers had strong demand earlier this year to increase stocks before this was expected to go into effect.
• These have all been known, ongoing concerns, but the market has remained volatile. Coffee prices will likely remain high and volatile through 2025.

*Indicates anticipated price direction for 2024

• Beet sugar spot prices were steady in July and August at 55 cents/lb., and bulk refined beet sugar prices were steady at 45 cents/lb. to 49 cents/lb.
• The No. 11 world sugar prices reached a low of $17.57 in late August before spiking to almost $20 after fires damaged sugar cane in Brazil. Concerns about drought in Brazil have led to some volatility and spikes in the world sugar market.
• Higher ending stocks from 2023 to 2024, a record large sugar crop for 2024 to 2025, and an adequate sugar crop from Mexico all indicate ample supplies.
• Prices are expected to decrease significantly in 2024 to 2025.

Source: Fresh Concepts

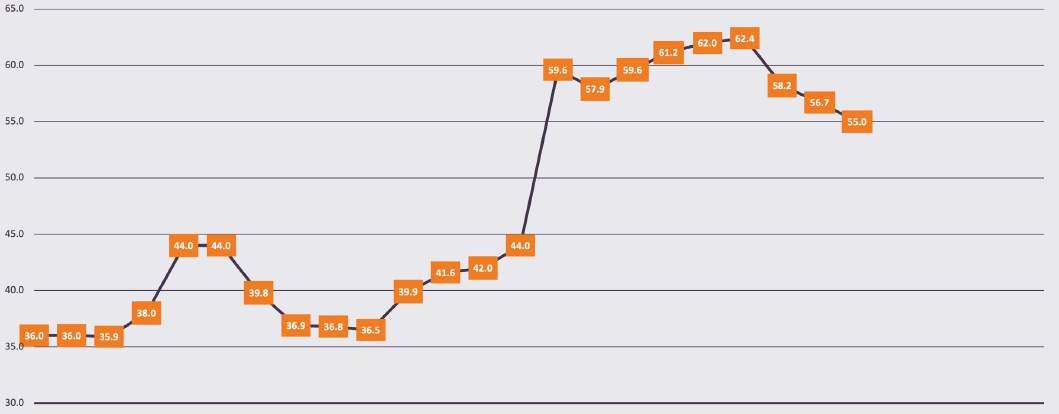
As Mexico’s growing region is moving fully into the new flora loca crop, overall volumes are strong, and growers are not expecting any major interruptions with supply. Due to inclement weather, sizing is trending slightly towards larger fruit.
During the fall and winter seasons, the avocado market relies almost exclusively on Mexico for production, so any weather or harvest issues that Mexican growers run into would inevitably have a major impact on the overall avocado market.
Going into Q1, there is historically a significant uptick in demand due to the Super Bowl, which does cause pricing to increase around that timeframe. In the spring, there is typically a slight gap in harvests during Mexico’s Holy Week, which will occur in mid-April 2025. This harvest gap can also have a brief impact on pricing.
$80.00
$70.00 $60.00
*Indicates anticipated price direction for 2024

Red bell peppers are in limited supply, and these conditions are expected to remain through late December. Thereafter, growers will transition to the winter growing region, at which point supplies are expected to remain stable through May of 2025.
Green bell peppers are seeing better supply, which is expected to remain for the duration of September.
It is still unknown whether Tropical Storm Francine’s heavy rains will have an impact on fields or harvests. However, any negative impacts from the storm would be reflected during the winter months.
*Indicates anticipated price direction for 2024

The iceberg market is seeing a strong finish to Q3 with both very good supply and quality. The transition from the Salinas growing region to Yuma growing region in November will likely come with typical supply gaps for good quality product, and growers are expecting typical seasonal quality issues leading up to that point.
The markets will be completely dependent on weather going into the Yuma season. Any severe inclement weather or early-season freezes would have a significant impact on both quality and available supply.
Even if iceberg supplies remain strong through the transition, the iceberg market can still be significantly impacted if there are any issues with romaine or leaf lettuce, as demand typically pivots to iceberg when romaine and leaf lettuce are in short supply.
*Indicates anticipated price direction for 2024
$20.00

Supplies for both red and yellow onions have begun to stabilize as the transition to the Northwest crops is now complete. The Northwest growing region saw much higher temperatures than normal, which will limit supplies for colossal and super colossal sizes.
This size trend may cause demand for the other sizes to increase, which in turn would lead to higher pricing.
*Indicates anticipated price direction for 2024
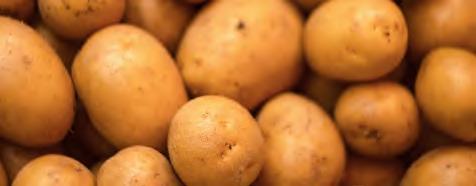
Idaho has fully transitioned to the new storage crop. With that, growers are seeing a size trend on the larger side, 40s-70s primarily. As potato growers have one shot at harvests, this size trend is expected to last for the duration of the season.
The size gap may cause pricing to increase towards the end of Q1 and into Q2, first for smaller potatoes, and potentially for larger sizes as demand picks up.
Red and Yukon potatoes have been in steady supply out of their growing regions in the Midwest. As production picks up in Florida during the winter, supplies will be heavily dependent on favorable weather.
In Canada, Alberta remains the largest potatoproducing province, accounting for 23.7% of Canada's total production in 2024. Manitoba and Prince Edward Island follow, contributing 21.6% and 20.4% respectively. Notably, New Brunswick and Quebec experienced significant production increases of 14.3% and 17.5%, respectively, recovering from wet growing conditions in 2023.
*Indicates anticipated price direction for 2024

Historically, the tomato market sees a very high degree of volatility from October to December, and this year it is well on track for this same pattern. In both the East and West Coast growing regions, volumes are already light, and these conditions are expected to persist through December.
In September 2024, Canada's tomato exports totaled approximately C$57 million, a 2.12% decrease from the same period in 2023. Conversely, imports increased by 39.4% during the same period, reaching C$35.9 million.
*Indicates anticipated price direction for 2024
2024’s winter season saw an incredibly volatile Q1 caused by inclement weather. However, typically the tomato market returns to stable levels by the end of January, and growers are hoping for the same going into 2025.
* Source: AES, Pactiv

• Linerboard increased in June and has held firm since.
· There is expectation that there could be increases in early 2025.
· Global mergers force further consolidation:
‧ $7.2 billion International Paper acquires DS Smith
‧ $11 billion acquisition of WestRock by Smurfit Kappa
‧ Distribution — Veritiv acquires Orora
· Folding carton demand is down as food volumes slow and beverages had a rough summer.
• Tropical weather this year has impacted resin plants in the Gulf and has made resin pricing a bit volatile.
· Natural gas and crude along with demand will drive the resin market this year.
• We expect 2025 to be a somewhat unpredictable year in the packaging commodity space.
· The wars in Russia/Ukraine and the Middle East continue with moderate likelihood of escalation.
· There are looming recession risks in pockets of Asia and Europe.
· The health of the economy in China is also a factor.
· These known risks are incremental to the standard risks associated with a “normal” planning year: contagion, weather, natural disaster, etc.
A muted supply/demand market with flat input costs
vs 24 market
Lower monomer costs assumed with better PDH uptime in 2025
Demand could surprise to the upside
vs 24 market
Higher freight costs assumed particularly on the West Coast
vs 24 market
Forecasting a robust demand picture
vs 24 market
Upward risk in market consolidation/ concentration
Anniversary the June 2024 increase and possibility for another movement in 2025
vs 24 market
Assuming a standard inflation rate: Risk in higher ocean freight rates
vs 24 market
Structural global undersupply, higher price needed to spur capacity investment.

Many cost pressures are impacting the previous downward trend of aluminum and stainless steel.
• Pricing is still significantly above prerun-up levels.
• Aluminum tracking is causing some concern and is hard to obtain.
• The dock workers’ strike caused pricing pressure.
• Labor and freight costs continue to increase upwards of 40%.
Source: Cambro, Vollrath, US Dept. of Labor and Statistics
Key factors impacting pricing include:
• Import transportation costs are impacted by hostilities in and around the Red Sea. Global freight indices are up 90% in the last six months as attacks in the Red Sea have created longer transit times and container imbalances.
• As of July 2024, the overall TAC Baltic Airfreight Index had increased 13.4% year over year, reflecting high demand in air cargo due to ocean freight disruptions.
• Domestic transportation and labor costs continue to increase.
• After a short-term increase in Q1 of 2024, cotton is down 8% to 10% from its stable range in 2023. We expect to see somewhat stable cotton price conditions for the foreseeable future.
• Polyester in China is down slightly, around 4% in the last few months.

2025 outlook:
• Cotton and polyester prices are expected to remain stable.
• Global transportation rates are expected to cool slightly as global demand shows signs of weakening.
• Consumer countries are introducing trade barriers to protect their own industries
• Sourcing and operating costs continue to increase for retailers and apparel brands as new regulations are rapidly introduced in global markets. These new regulations cover environmental protection, fair labor, ethical sourcing, consumer safety and greenwashing.
We expect pricing to remain the same into 2025.
• The inflation of steel, aluminum and PVC is holding.
• Markups for OEM parts, rising energy costs and labor expenses have stalled.
• Fluctuations in demand and delays in delivery have become predictable.


Entegra is the procurement partner that helps hospitality-driven businesses to shine. Wtih significant savings, digital tools and strategic services, we make it easy to meet your business goals. Visit EntegraPS.ca for more resources


Energy solutions
Don’t tackle energy price mitigation alone. Entegra’s advisors can help you mitigate the ever-rising costs of energy with our comprehensive Energy Management Solutions.
See our energy solutions
Read the energy service white paper

Navigating a tight labor market requires expertise in retention, training and efficiency. Entegra’s advisors will work with you on solutions to improve employee upskilling, secure temporary labor, drive operational efficiency and more.
See our labor solutions
Read our labor solutions white paper
resources from Entegra
EXCLUSIVE CONTENT • The Guide to Greater Savings
• Commodity Reports
• Inflation Rep orts
• Program and Pricing Updates
• Bringing Hospitality to Life
• 9 Questions To Ask When Choosing A GPO
