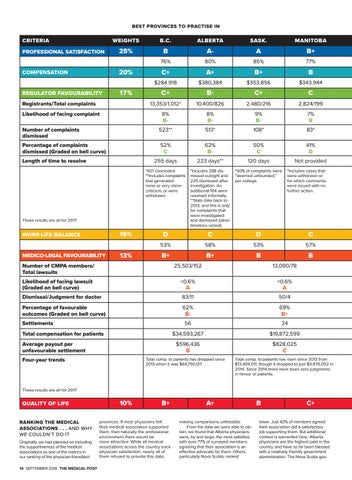
BEST PROVINCES TO PRACTISE IN
CRITERIA
WEIGHTS
B.C.
ALBERTA
SASK.
MANITOBA
25%
B
A-
A
B+
76%
80%
85%
77%
C+
A+
B+
B
$284,918
$380,384
$353,856
$343,944
C+
B-
C+
C
13,353/1,012*
10,400/826
2,480/216
2,824/199
8% B-
8% B-
9% B-
7% B
Number of complaints dismissed
523**
513*
108*
83*
Percentage of complaints dismissed (Graded on bell curve)
52% C
62% B-
50% C
41% D
255 days
223 days**
120 days
Not provided
*921 concluded. **Includes complaints that generated none or very minor criticism, or were withdrawn.
*Includes 288 dismissed outright and 225 dismissed after investigation. An additional 104 were resolved informally. **Stats date back to 2013, and this is only for complaints that were investigated and dismissed (other timelines varied).
*50% of complaints were “deemed unfounded,” per college.
D
C
D
C
53%
58%
53%
57%
B+
B+
B
B
PROFESSIONAL SATISFACTION
20%
COMPENSATION REGULATOR FAVOURABILITY
17%
Registrants/Total complaints Likelihood of facing complaint
Length of time to resolve
These results are all for 2017
15%
WORK-LIFE BALANCE MEDICO-LEGAL FAVOURABILITY
13%
*Includes cases that were withdrawn or for which comments were issued with no further action.
Number of CMPA members/ Total lawsuits
25,503/152
13,090/78
Likelihood of facing lawsuit (Graded on bell curve)
<0.6% A
<0.6% A
Dismissal/Judgment for doctor
83/11
50/4
Percentage of favourable outcomes (Graded on bell curve)
62% B-
69% B+
56
24
$34,593,267
$19,872,599
$596,436 B
$828,025 C
Settlements Total compensation for patients Average payout per unfavourable settlement Four-year trends
Total comp. to patients has dropped since 2013 when it was $64,750,127.
Total comp. to patients has risen since 2013 from $13,404,011, though it dropped to just $3,876,052 in 2014. Since 2014 there have been zero judgments in favour of patients.
These results are all for 2017
QUALITY OF LIFE RANKING THE MEDICAL ASSOCIATIONS . . . AND WHY WE COULDN’T DO IT Originally, we had planned on including the supportiveness of the medical associations as one of the metrics in our ranking of the physician-friendliest 14 SEPTEMBER 2018 THE MEDICAL POST
10%
B+
provinces. If most physicians felt their medical association supported them, then naturally the professional environment there would be more attractive. While all medical associations across the country track physician satisfaction, nearly all of them refused to provide this data,
A+ making comparisons unfeasible. From the data we were able to obtain, we found that Alberta physicians were, by and large, the most satisfied, with over 77% of surveyed members agreeing that their association is an effective advocate for them. Others, particularly Nova Scotia, ranked
B
C+
lower. Just 42% of members agreed their association did a satisfactory job supporting them. But additional context is warranted here. Alberta physicians are the highest paid in the country, and have so far been blessed with a relatively friendly government administration. The Nova Scotia gov-