Fig. 12
In-Store Sales by Category
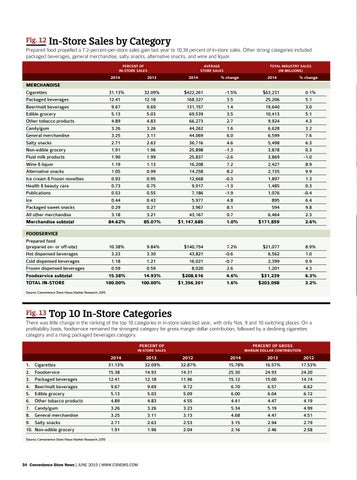
Prepared food propelled a 7.2-percent-per-store sales gain last year to 10.38 percent of in-store sales. Other strong categories included packaged beverages, general merchandise, salty snacks, alternative snacks, and wine and liquor. perCenT oF In-STore SaLeS
2014
2013
aVeraGe STore SaLeS
2014
ToTaL InDUSTrY SaLeS (In MILLIonS)
% change
2014
% change
MERCHANDISE Cigarettes Packaged beverages Beer/malt beverages Edible grocery Other tobacco products Candy/gum general merchandise Salty snacks Non-edible grocery Fluid milk products Wine & liquor Alternative snacks Ice cream & frozen novelties Health & beauty care Publications Ice Packaged sweet snacks All other merchandise Merchandise subtotal
31.13% 12.41 9.67 5.13 4.89 3.26 3.25 2.71 1.91 1.90 1.19 1.05 0.93 0.73 0.53 0.44 0.29 3.18 84.62%
32.09% 12.18 9.69 5.03 4.83 3.26 3.11 2.63 1.96 1.99 1.13 0.99 0.95 0.75 0.55 0.43 0.27 3.21 85.07%
$422,261 168,327 131,157 69,539 66,273 44,262 44,069 36,716 25,898 25,837 16,208 14,258 12,668 9,917 7,186 5,977 3,967 43,167 $1,147,685
-1.5% 3.5 1.4 3.5 2.7 1.6 6.0 4.6 -1.3 -2.6 7.2 8.2 -0.3 -1.3 -1.9 4.8 8.1 0.7 1.0%
$63,231 25,206 19,640 10,413 9,924 6,628 6,599 5,498 3,878 3,869 2,427 2,135 1,897 1,485 1,076 895 594 6,464 $171,859
0.1% 5.1 3.0 5.1 4.3 3.2 7.6 6.3 0.3 -1.0 8.9 9.9 1.3 0.3 -0.4 6.4 9.8 2.3 2.6%
FOODSERVICE Prepared food (prepared on- or off-site) Hot dispensed beverages Cold dispensed beverages Frozen dispensed beverages Foodservice subtotal TOTAL IN-STORE
10.38% 3.23 1.18 0.59 15.38% 100.00%
9.84% 3.30 1.21 0.59 14.93% 100.00%
$140,754 43,821 16,021 8,020 $208,616 $1,356,301
7.2% -0.6 -0.7 2.6 4.6% 1.6%
$21,077 6,562 2,399 1,201 $31,239 $203,098
8.9% 1.0 0.9 4.3 6.3% 3.2%
Source: Convenience Store News Market Research, 2015
Fig. 13
Top 10 In-Store Categories
There was little change in the ranking of the top 10 categories in in-store sales last year, with only Nos. 9 and 10 switching places. On a profitability basis, foodservice remained the strongest category for gross margin dollar contribution, followed by a declining cigarettes category and a rising packaged beverages category. perCenT oF
perCenT oF GroSS
In-STore SaLeS
1. 2. 3. 4. 5. 6. 7. 8. 9. 10.
Cigarettes Foodservice Packaged beverages Beer/malt beverages Edible grocery Other tobacco products Candy/gum general merchandise Salty snacks Non-edible grocery
2014 31.13% 15.38 12.41 9.67 5.13 4.89 3.26 3.25 2.71 1.91
Source: Convenience Store News Market Research, 2015
34 Convenience Store News | JUNE 2015 | WWW.CSNEWS.COM
2013 32.09% 14.93 12.18 9.69 5.03 4.83 3.26 3.11 2.63 1.96
MarGIn DoLLar ConTrIBUTIon
2012 32.87% 14.31 11.96 9.72 5.09 4.55 3.23 3.13 2.53 2.04
2014 15.78% 25.30 15.12 6.70 6.00 4.41 5.34 4.68 3.15 2.16
2013 16.57% 24.93 15.00 6.57 6.04 4.47 5.19 4.47 2.94 2.46
2012 17.53% 24.20 14.74 6.62 6.12 4.19 4.99 4.51 2.79 2.58