8 minute read
5. Result and discussion


methacrylate and screws to also recorded the data and used for getting more accurate result. Finally, the temperature sensors will be installed on both side of polymethylmethacrylate board and on the steel plate to measure the temperature during the test.
Figure 52 layout of VTBB
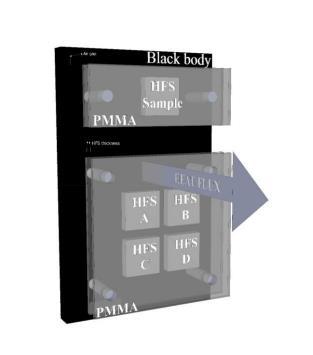
Figure 53 settings for MECr
HFM method
Among all the HFM tests, the U-value results with the smallest error are the HFM test 3-4, they have 0.23 W/m2K with 39.5% difference compare with the reference value
52
calculate based on hot plate data, this test also has the lowest heat flux standard deviation (42.3%,3σ). The worst (has biggest difference percentage) one test is HFM test 7, the heat flux standard deviation is also the biggest with 93% (3σ) in all the HFM test, these two tests also have the 2 smallest average heat flux value. In addition, it can be found in the data of HFM test 7 that when the cooling system was turned off, the heat flux reading was not only extremely unstable, but also oscillated around 0 within a period of time. This situation greatly interferes with the calculation of U value, making the final result seriously far away from the reference value.
Except the test 7 and test 8, most of HFM tests have a U-value over 0.2 W/m2K. The HFM test 1 has only 0.18 W/m2K, compare with the similar condition test HFM test 2, according to the data that they have almost same average heat flux and standard deviation, the only one different parameter is the temperature difference between 2 sides (will call △T in the later parts) since the test 2 does not take the too high temperature reading in Zone 1, it makes the surface temperature in Zone 1 is smaller than the value in HFM test 1. Another one test has U-value result smaller than 0.2 W/m2K is HFM test 6-SP 40. This test was done after dynamic test 1, the Zone 1 sensor 2 was placed into the EPS layer, and the other 2 PT100s were put closer to the middle area near the heat flux sensor. Compare the △T with test previous test, it can be found the △T is higher than the all the previous test when the set point is 40℃ in the warm side, this may be due to the fact that the remaining two thermometers are too close to the middle area and are directly heated by the heating device, which causes the high temperature reading. Too high temperature will also increase the temperature difference, so that the result of U-value will also be smaller.
In order to explore whether the higher temperature difference would affect the test results, the team conducted two sets of tests. They have all the same environmental factors except the set air temperature of the warm side, first one is 40 ℃ and the second one is 50 ℃. In the HFM test 4, 2 tests have a really close U-value with 0.23 W/m2K, but the other parameters like the standard deviation of heat flux and temperature are smaller than the value under set point 40℃. In the HFM test 6, the U-value is even better when the set point is 50℃ in Zone 1. In this set of comparative data, it can be observed that the heat flux and temperature standard deviation are almost same, the standard deviation of heat flux are 1.01 and 1.04, the temperature deviation are 0.19 and 0.14. In this case, according to the calculation equation of measured uncertainty, the one with the higher denominator (average value) will inevitably have a smaller percentage, resulting in more accurate data. These two sets of test data show that a higher temperature difference has a beneficial effect on the results, which can make the calculation results more accurate and have a smaller uncertainty value. However, whether it is possible to get closer to the reference value requires more experimental support.
53
IR test
Although IR test 1 does have the problem that the IR surface thermometer does not point to the target area, the error of the data is still unreasonable. The IR test 1 only has 0.126 W/m2K, the error of up to 25% from the reference value is mainly due to the high uncertainty of the heat flux. The other two experiments are relatively more reasonable and similar to most HFM test results. The two experiments are 0.21 W/m2K and 0.23 W/m2K. One of the more obvious problems in the three experiments is the surface temperature of the cold side. In IR test 1, the temperature of the cold side was always maintained at around 15.5℃-16℃, while in IR tests 2 and 3, the temperature of the cold side was always maintained at 21.5 ℃ - 22 ℃ . Although the laser thermometer on the cold side of IR test 1 did not point to the area covered by the black electrical tape, according to subsequent tests, the temperature difference between the surface of the OSB board and the black electrical tape would not exceed 1 degree. Obviously, an experiment result was wrong when the temperature was 15 ℃ in 3 tests. In the dynamic test, the PT100 placed between the EPS board and the OSB board shows that the temperature is generally much higher than the cold side temperature. It can be inferred from dynamic temperature readings that the data of IR test 2 and 3 are more reasonable than IR test 1. Unfortunately, due to the shortage of manpower and time in experiment, further research and the influence of temperature difference on IR test cannot be carried out.
Dynamic test
The all 3 dynamic tests have the error percentage range from around 40% to 50%, dynamic test 3 has the lowest error 41.8% compare with reference value. The dynamic test 2 is a little bit higher than dynamic test 3, the U-value is as same as dynamic test 1 value (0.22 W/m2K), the error is 42.4. The dynamic test 1 U-value has the value almost half of the reference value. Different with test 1 has much bigger thermal mass value than the reference value, the test 2 and test 3 show 2 very small number, the test 2 thermal mass only has 8215 J/m2K and test 3 has the lowest 6108 J/m2K. The simulate thermal mass temperature area all bellowed the measured temperature, dynamic test 3 has the highest T0 temperature 19.7℃ but it is still smaller than the 27.3℃ based on the measured data. Dynamic test 1 simulated T0 is the smallest one which is 9.2 ℃, the one in the test is a little bit higher (12.6 ℃). Both have a too low simulate T0, even lower than the cold side air temperature, this will not happen which means the dynamic tests are failed.
The low T0 temperature and different cold side surface temperature between 2 IR tests also draw attention to the question: if the temperature readings are also affected by the cooling system. During the dynamic test, the measured thermal mass temperature is 10K higher than the cold side surface temperature, this caused a problem because there is only a layer of OSB board between the thermal mass temperature measured
54
PT100 and PT100s on cold side surface. According to the hot plate data, this thin layer cannot create so huge temperature difference with only 13mm thickness. This discovery led the team to suspect that the cold side surface PT100s was affected by the excessive cooling system. However, there is another explanation that the PT100 is not fixed between the two layers but stays in the EPS layers. Unfortunately, since the limited manpower and time, this investigation could not be carried out.
Unstable heat flux readings inevitably make the calculation of U-value more difficult and inaccurate. In addition, due to equipment limitations, the hot box cannot be closed properly, which is also suspected of causing negative effects.
If the three methods are compared based on the existing results, when the U-value results calculated by the three methods are generally not much different (ignoring the failed tests like HFM test 7 and 8, IR test 1, dynamic test 1), U-value measurement by IR thermometer is the most suitable on-site Useful. The IRT has the shortest testing time period by only 40 minutes. The single thermal mass method also shows a similar U-value result, but it requires high level of theory understanding and numerical simulation ability, in addition, the dynamic test has longer test period than the IRT. The HFM has the longest test period and also the smallest error rate in 3 methods. HFM method can be used when the in-situ U-value measurement is the case where the goal is the closest to the real value, then the HFM should be used although it normally requires much more time to finish the test.
Compare with the literature, the tests made have much more error percentage than most of literature value, although some documents also show a high degree of error, most of the errors are less than the experimental value and are in the acceptable range.
55
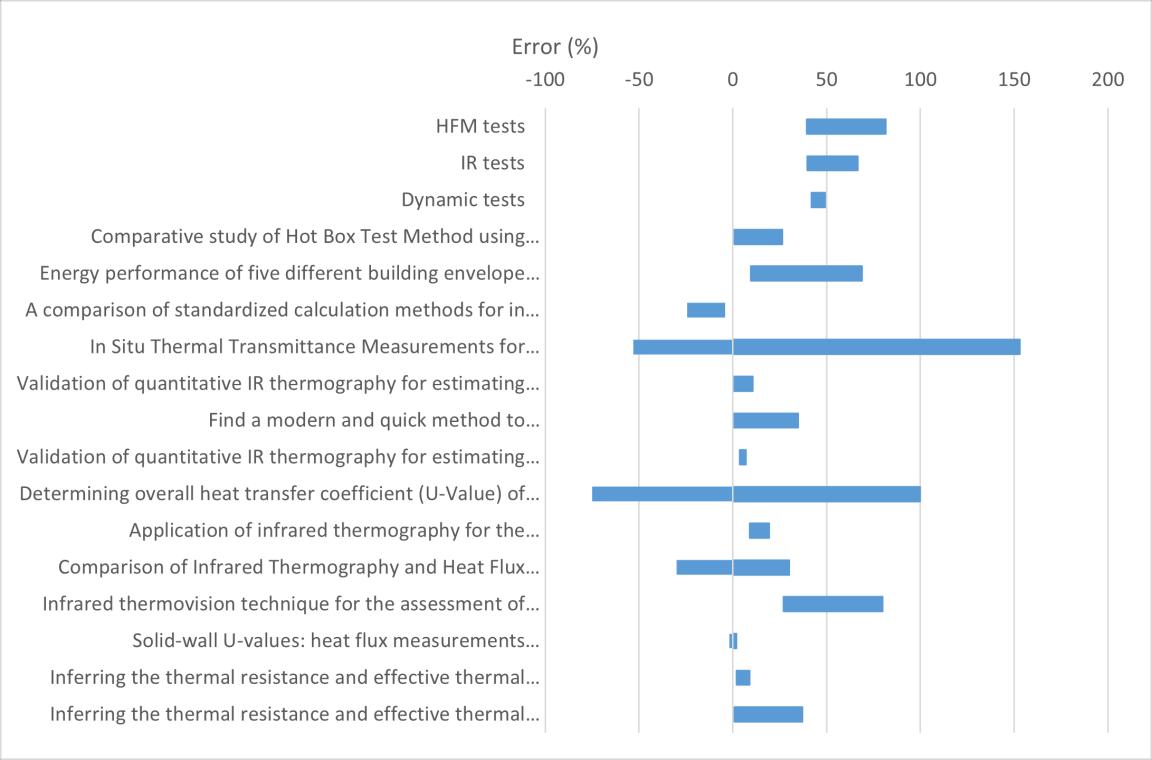
Figure 54 compare table- all tests with literatures Paper name: 1. Comparative study of Hot Box Test Method using laboratory evaluation of thermal properties of a given building envelope system type 2. Energy performance of five different building envelope structures 3. A comparison of standardized calculation methods for in situ measurements of facades U-value 4. In Situ Thermal Transmittance Measurements for investigating Differences between Wall Models and actual Building Performance 5. Validation of quantitative IR thermography for estimating the U-value by a hot box apparatus 6. Find a modern and quick method to determine the U value and the thermal characteristics of a building envelope using an IR camera 7. Validation of quantitative IR thermography for estimating the U-value by a hot box apparatus 8. Determining overall heat transfer coefficient (U-Value) of wood-framed wall assemblies in Canada using external infrared thermography 9. Application of infrared thermography for the determination of the overall heat transfer coefficient (U-Value) in building envelopes 10. Comparison of Infrared Thermography and Heat Flux Method for Dynamic Thermal transmittance Determination 11. Infrared thermo vision technique for the assessment of thermal transmittance value of opaque building elements on site 12. Solid-wall U-values: heat flux measurements compared with standard assumptions 13. Inferring the thermal resistance and effective thermal mass distribution of a wall
56


