
IN THE INTEREST OF SOCIETY

In the interest of society
At Elia Group, we are helping to make the energy transition hap pen. That involves many challenges. We are delivering the transmission infrastructure of the future. We are having to rethink our infrastructure and the way we keep the electricity system balanced, with safety as a top priority. We are also helping the market to evolve by developing new tools and processes, and strengthening our collaborations with all mar ket players.
The energy world is changing. New technologies and societal devel opments are emerging every day. The Elia Group incorporates these el ements into its strategy and is already developing new methods to up grade its grid, taking the latest trends into account.


We anticipate the needs of society and the expectations of our stakeholders and we make sure we are ready to take on new tasks - all this while maintaining an affordable, reliable and secure grid. Put simply: at Elia Group, we work in the interest of society.
CONTENTS
In the interest of society
Interview with Chris Peeters and Bernard Gustin* 2

The Elia group* 6
Key figures 2017 10
2017 Highlights 12
Group priorities* 18
Sustainability reporting* 21

1. We ensure a secure, reliable and efficient grid* 24
2. We deliver the transmission infrastructure of the future* 36

ELIA ANNUAL REPORT 2017 - 12 ELIA ANNUAL REPORT 2017 How can Elia ensure that our industry remains competitive with other countries?

3. We develop the electricity system and markets* 50
4. We cooperate to strengthen our TSO position* 62
5. We align culture with strategy* 80
6. We have our eyes wide open for innovation & growth opportunities* 90
Corporate governance statements* 100
Composition of the management bodies as at 31 December 2017 101
Remuneration report 109
Risks and uncertainties facing the company 114

Features of the internal control and risk management systems 118
The Elia share in 2017 122
Management discussion and analysis of the 2017 results* 124
Consolidated financial statements* 128
Consolidated statement of profit or loss* 128
Consolidated statement of profit or loss and comprehensive income* 129
Consolidated statement of financial position* 130
Consolidated statement of changes in equity* 131
Consolidated statement of cash flows* 132
* These chapters form the annual report cf. article 119 of the Belgian company code.
Discover our corporate video https://youtu.be/d_cR6En2Jtg
How can Elia integrate large quantities of renewable energy?
How does Elia stay up-to-date with technological developments to make the energy transition happen?
How will Elia return our beach to its former glory once the cable works have been completed?
How can I be sure I’m in the best role at every stage of my career?
How can Elia guarantee round-the-clock, year-round power for my business?
36 90 62
24 50 80
In the interest of stakeholders
SHAREHOLDERS AND INVESTORS
PUBLIC AUTHORITIES
REGULATORY AUTHORITIES
SUPPLIERS AND PARTNERS
TRANSMISSION
PRODUCTION
RENEWABLE
ENERGY SUPPLIERS
EUROPEAN SYSTEM OPERATORS
ACTIVITIES
PRESS & GENERAL PUBLIC
DISTRIBUTION
How can Elia guarantee round-the-clock, year-round power for my business?
How can Elia ensure that our industry remains competitive with other countries?
LOCAL COMMUNITIES
How can I be sure I’m in the best role at every stage of my career?
DISTRIBUTION SYSTEM OPERATORS
NGO
ACADEMICS & ENERGY PROFESIONNALS
INDUSTRIAL CLIENTS
ELIA ANNUAL REPORT 2017 3
GRI 102-40 24 50 80
EUROPEAN PRODUCTION
EMPLOYEES
s AND FEDERATIONS 3
ENERGIES CLASSIC ENERGIES MANAGING THE INFRASTRUCTURE BALANCING THE ELECTRICITY SYSTEM FACILITATING THE MARKET
Time to accelerate in the interest of society
The Elia Group can look back on a successful 2017. The annual results reflect its efforts to continuously enhance the performance of its core activities. In Belgium, Elia is delivering major investment projects on time, within budget and with the required quality. In Germany, 50Hertz has seen a strong improvement in operational efficiency, due in part to the commissioning of new infrastructure. The changes wrought by the energy transition are becoming more and more tangible, leading to a new dynamic within the company. It is time to accelerate.
The large-scale infrastructure works being undertaken by the Elia Group must fea ture in any review of 2017. With total investments of €486 million at Elia and €461 million at 50Hertz, some import ant milestones were reached, such as the commissioning of the Stevin pro ject in Belgium and the South-West Interconnector in Germany.
How do you see the investment programme evolving?
Chris Peeters, CEO of the Elia Group: “The changing backdrop of the energy transi tion requires a new configuration for the power grid. As we integrate more and more variable renewable energy gen eration and as electricity exchanges at European level increase, our investment programme is vitally important to guaran tee a reliable, affordable and sustainable energy system in the future. For example, now that the Modular Offshore Grid has been given the go-ahead and work has started on the subsea interconnector with the UK, Belgium will soon have its first off shore power grid. The experience that 50Hertz has in this field is a great help to us. At the same time, we’re also looking to the longer term and examining what our needs will be further down the line.”
Hence the study that Elia published in late 2017?
Chris Peeters “In ‘Electricity Scenarios for Belgium towards 2050’, we did exactly what Elia is expected to do, namely sup port policymaking. We crystallised the challenges in what is a highly technical and complex debate, drawing on num erous interactions with our various stake holders and Belgium’s four energy min
“IN ‘ELECTRICITY SCENARIOS
FOR BELGIUM TOWARDS 2050’, WE DID EXACTLY WHAT ELIA IS EXPECTED TO DO, NAMELY SUP PORT POLICYMAKING. WE CRYS TALLISED THE CHALLENGES IN WHAT IS A HIGHLY TECHNICAL AND COMPLEX DEBATE.”
isters. Together with the sector, we are thinking about how our energy system should evolve. This isn’t just about doing our own homework and then pointing the finger at others for failing to grasp the technicalities of the issues involved. Our role has evolved, in other words, and that is being recognised - which is a positive thing.”
Bernard Gustin, Chairman of the Elia Group: “I agree entirely with Chris’s analy sis. Elia isn’t just an industrial company, it also has an important role as an advisor. It’s our social responsibility to say what the situation is. We could have waited until the problems materialised, but then we’d have had to take steps that would have been viewed very negatively. Elia tackled the problem proactively and in an extremely professional way. That’s import ant for our credibility and image, because, at the end of the day, responsibility for security of supply lies with us. In my view, Elia is one of Belgium’s most strategically important companies, especially with all the challenges heading our way.”

INVESTMENTS (ELIA)
€486 mio €461 mio
INVESTMENTS (50HERTZ)
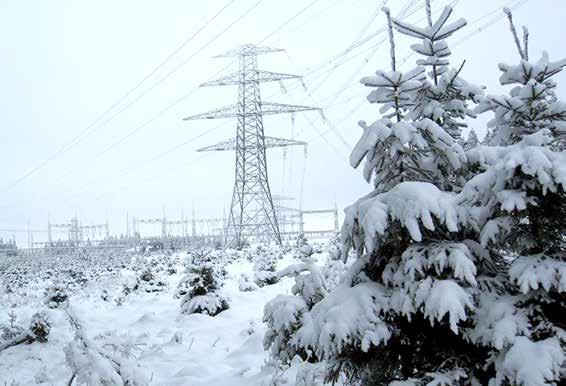
Chris Peeters: “A prolonged cold spell in early 2017 led to a very tense situa tion on the European electricity market, which lasted for several days. If tempor ary shortages go unnoticed by consum ers, it’s because our people work with immense passion, dedication and exper tise to ensure security of supply in today’s changing world. This is emblematic of our company’s culture, in which people put their heart and soul into their work.”

Bernard Gustin : “As well as the great sense of responsibility and profession alism, another thing that surprises me about the Elia Group is its internation alism. We are one of the few European transmission system operators to oper ate in two countries. That gives another dimension to the company. It’s not just Elia, but the Elia Group. The idea of being a group is very important because it allows us to share experiences. We must absolutely value and preserve that inter national dimension.”
“WE ARE ONE OF THE FEW EUROPEAN TRANSMISSION SYSTEM OPERATORS TO OPERATE IN TWO COUNTRIES. IT’S NOT JUST ELIA, BUT THE ELIA GROUP. THAT IDEA OF BEING A GROUP IS VERY IM PORTANT BECAUSE IT ALLOWS US TO SHARE EXPERIENCES. WE MUST ABSOLUTELY VALUE AND PRESERVE THAT INTERNATIONAL DIMENSION.”
Chris Peeters CEO of the Elia Group Bernard Gustin Chairman of the Elia GroupDoes keeping the lights on feel less easy than it once did?Chris Peeters Bernard Gustin Interview with Chris Peeters and Bernard Gustin, CEO and Chairman of the Elia Group
ELIA ANNUAL REPORT 2017 - 32 - ELIA ANNUAL REPORT 2017
“IF MARKET SHORTAGES GO UNNOTICED BY CONSUMERS, IT’S BECAUSE OUR PEOPLE WORK WITH IMMENSE PAS SION, DEDICATION AND EX PERTISE TO ENSURE SECUR ITY OF SUPPLY IN TODAY’S CHANGING WORLD. THIS IS EMBLEMATIC OF OUR COM PANY’S CULTURE, IN WHICH PEOPLE PUT THEIR HEART AND SOUL INTO THEIR WORK.”
Bernard Gustin “The traditional regu lated business will remain very import ant, but I also see a future in the group dynamic. We live in a world where tal ented engineers choose Google and Amazon rather than industrial compan ies. If we want to attract them, we have to show that we are innovative with an inter national outlook.”
Chris Peeters “I’d also add that in our complex world, the exchange of exper tise is extremely important. Our German subsidiary is well ahead of the game on renewables, integrating 53.4% of power from renewable sources on average, while Belgium, as a small country, was inter connected at a European level very early on, and led the way in setting up mar ket platforms. Our expertise is therefore
highly complementary and is increasingly being shared at Group level. At the same time, our corporate structure enables both entities to respect their local con texts. In addition, our joint consulting company Elia Grid International allows us to develop our talent internationally: our engineers learn what’s going on in the world and return to the Group with new and fresh ideas.”
partly because the construction sector applies different safety standards. But we’re gradually gaining traction. Our sub contractors see it as an opportunity to professionalise themselves. This is another way that Elia contributes to society, by acting as a catalyst for the further profes sionalisation of the supply sector.”
What challenges lie ahead in 2018?
Chris Peeters: “As more and more renew able energy is integrated, congestion problems on the European network are set to worsen. At 50Hertz, we’ve seen that this can be remedied by additional infra structure, which led to an immediate sav ing on redispatch measures in 2017. At the same time, we need to think about the energy system of the future as end cus tomers start looking for ways to lever age their own flexibility. How can I get more out of my solar panels? What are the market models for this? Does the sys tem need to be adapted? We’ll continue to work on these issues in 2018. As far as the infrastructure works are concerned, we’re well on track because we started strengthening our organisational struc tures back in 2016.”
“WE LIVE IN A WORLD WHERE TALENTED ENGIN EERS CHOOSE GOOGLE AND AMAZON RATHER THAN INDUSTRIAL COMPANIES. IF WE WANT TO ATTRACT THEM, WE HAVE TO SHOW THAT WE ARE INNOVATIVE WITH AN INTERNATIONAL OUTLOOK.”
What are your personal ambitions?
Chris Peeters: “I want Elia to become the most important energy company in Belgium. Ditto for 50Hertz in Germany. And in fact we’re not far off that already. We’re shaping the energy debate and in the longer term we’ll have a crucial role to play in meeting the goals of the Paris cli mate agreement. We are relevant and intend to fully claim that status: not out of any kind of arrogance but because we want to serve the public interest.”
Bernard Gustin: “Fifteen years ago I was working as a consultant in the energy sec tor. Since then, I’ve been really impressed at how Elia has established itself as a stra tegic asset. This country’s energy strategy is determined by what Elia does. It’s no longer the generators which are setting the direction. That is a major change.”
Chris Peeters: “Safety is something we work at every single day. Our ‘Go for Zero’ safety programme is a 3-5 year endeav our, but we’re already seeing an increase in maturity. In 2017, we also launched the ‘Safety for Contractors’ programme. There’s still a long way to go with that,
Chris Peeters: “I would like to thank the four energy ministers for their con structive cooperation. We also worked well with our regulators in both Belgium and Germany. The users of our grid are important too, as are the employees of course who work day in day out to keep the lights on, while expanding our infra structure and developing the system of the future.”
Bernard Gustin : “I particularly wish to thank the management and Board of Directors for placing their trust in me. It’s a great honour for me to be the chair man of such a highly respected company as Elia. Having returned, in part, to the energy sector after 15 years, I’m excited to be able to participate in it from a different angle.”


As Chairman of the Board of Directors, how do you see the Elia Group evolving?
Who would you like to thank in 2017?
Safety is a top priority for the Elia Group. What are the latest developments in this area?Chris Peeters Bernard Gustin Interview with Chris Peeters and Bernard Gustin, CEO and Chairman of the Elia Group
ELIA ANNUAL REPORT 2017 - 54 - ELIA ANNUAL REPORT 2017
The Elia Group
_Who? One of Europe’s top 5 players
The Elia Group is active in electricity transmis sion. With subsidiaries in Belgium (Elia) and northeast Germany (50Hertz), we operate 18,600 km of high-voltage connections that supply power to 30 million end users. As such, our Group is one of Europe’s top 5. With a reliability level of 99.999%, we provide society with a robust power grid.
_How?
Through cooperation and innovation
We operate and develop our grid infrastructure in close collaboration with all stakeholders. We are highly focused on safety and our goal is zero accidents. We are committed to innovation and con
tinuously improve our operational sys tems. We develop new market products enabling new technologies and market players to access our grid. This is how we make the energy transition happen.
Our core tasks _What?
Operating the electricity system
Supply and demand must be kept balanced at all times. Operating the elec tricity system is an increasingly complex task due to the sharp rise in renewable generation sources, the arrival of new players and technologies and the de velopment of supranational coordina tion. To ensure a reliable supply and ef ficient operational management of the medium- and high-voltage grid, Elia monitors the electricity system in real time. This requires sophisticated tools and processes, as well as specialist know ledge.
Facilitating the market
The Elia Group makes its infra structure available to all market players in a transparent, non-discriminatory way. Elia develops services and mechanisms allowing the market to trade on differ ent platforms, which promotes economic competitiveness and the wellbeing of all.
Managing the infrastructure
The Elia Group maintains and de velops high-voltage equipment and infra structure: lines, cables, transformers, and so on. The Group uses advanced technologies to modernise and extend its grid to enable it to integrate more renewable units.
_Why?
In the interest of society
The power grid is a key pillar of the energy policy that supports our socio-economic prosperity. The Elia Group aspires to be a catalyst for a successful energy transition and consequently, a reliable, sustainable and affordable energy system. By building interconnectors and integrating renewable energy generation, the Elia Group promotes both the integration of the European energy market and the decarbonisation of our society.
ELIA ANNUAL REPORT 2017 76 - ELIA ANNUAL REPORT 2017
The Elia Group
_Shareholder structure
In addition to its activities as a transmission system operator in Belgium and Germany, the Elia Group provides various consulting services to international customers through its subsidiary Elia Grid International (EGI). Elia is also part of the Nemo Link joint venture that is building the first subsea electrical interconnector between Belgium and the United Kingdom.
Elia
Elia is Belgium’s electricity transmis sion system operator (TSO).
50Hertz
50Hertz is one of the four German TSOs and operates in the north-east of Germany. It is owned by Elia (60%) and Industry Funds Management (IFM) (40%).
Elia Grid International
With offices in Brussels, Berlin and Dubai, Elia Grid International (EGI) pro vides consulting and engineering ser vices to the international energy mar ket and develops power grid projects for third parties in all areas of electricity transmission (30-400 kV).

Nemo Link
Nemo Link is a joint venture between Elia in Belgium and National Grid Nemo Link Limited, a subsidiary of the British transmission system operator National Grid Plc. It is building a subsea interconnector between Belgium and the United Kingdom, which is due to be oper ational in 2019.
Eurogrid International
Eurogrid International is a com pany owned and managed by Elia (60%) and the Australian investment fund IFM Investors (40%). Based in Brussels, Eurogrid International provides support services to its customers.
GridLad GmbH

In 2008, 50Hertz Transmission GmbH and the Brandenburg University of Technology worked together to develop a grid simulator for the electricity system. In December 2010, the simulator was trans ferred to GridLab, a subsidiary of Eurogrid International and therefore of the Elia Group.
Belgian municipalities 47.47% Free Float 52,53%
The Elia Group is a listed company that operates under the legal entity Elia System Operator. Its core shareholder is the municipal holding company Publi-T.
- Elia System Operator nv 100% - Elia Asset nv 99.99%
60%
Eurogrid International CVBA
ELIA ANNUAL REPORT 2017 - 98 - ELIA ANNUAL REPORT 2017 The Elia Group Nemo Link 50% GridLab GmbH 100%

- Eurogrid GmbH - 100%
- 50Hertz Transmission - 100%
Elia Grid International 50% - 50%
——
Belgian regulated activities
German regulated activities
Specific regulation —— Non-regulated
GRI 102-45
FINANCIAL
ELIA ANNUAL REPORT 2017 - 1110 ELIA ANNUAL REPORT 2017 Key figures 2017 Key figures 2017 OPERATIONAL ENVIRONMENTAL SOCIAL OF HIGH VOLTAGE LINES (Elia Group) RELIABILITY RATE OF THE GRID (Elia) RENEWABLE ENERGY (50Hertz) END USERS (Elia Group) GROSS DIVIDEND DIVIDEND YIELD (closing price 2017) NORMALIZED REVENUE IT MATERIAL WHICH GOT A SECOND LIFE (Elia) OF BIRD PROTECTION IN BELGIUM (Elia) TREES PLANTED THANKS TO THE LIFE PROJECT (Elia) EMPLOYEES (Elia Group) NEW HIRES (Elia Group) NATIONALITIES (Elia Group) 18,600 km 222 99.999% 53.4% 24 30 Mio € 1.62 3.4 %€ 216.6 mio 1,749.6 kg 13.62 km 34,000 2,343
Elia in 2017
ELIA PUBLISHES STUDY ON THE FUTURE OF THE BELGIAN ELECTRICITY SYSTEM TOWARDS 2050


In 2017, Elia made a fundamental contribution to the public debate on the future of the Belgian energy system by publishing the quantified study ‘Electricity Scenarios for Belgium towards 2050’. In its conclusions, Elia called on the relevant authorities to take swift action to safeguard the Belgian energy system. The publication is widely considered a land mark document and it triggered a heated political and social debate on such issues as the statutory closure of Belgium’s nuclear power stations in 2025. [ Page 59 ]
OPENING OF THE NATIONAL CONTROL CENTRE
On 19 October, Elia opened its newly-renovated National Control Centre in the presence of the Federal Energy Minister Marie Christine Marghem.

[ Page 33
COMMISSIONING OF STEVIN
On 21 November, Elia officially inaugurated the Stevin high-voltage line in the presence of Prime Minister Charles Michel and Federal Energy Minister Marie Christine Marghem. [ Page 43 ]

KEY MILESTONES FOR THE MOG

2017 was an important year for the ‘electricity plug’ or Modular Offshore Grid (MOG). Elia’s Board of Directors approved the investment for the project in mid-April. [ Page 42


PERMITS ACQUIRED FOR ALEGRO AND BRABO II


In 2017, Elia acquired the permits needed for ALEGrO and Brabo II, allowing work on both projects to start in 2018. ALEGrO is the first electri city interconnector between Belgium and Germany, while Brabo II aims to strengthen the high-voltage grid and consolidate security of supply in the Port of Antwerp and Belgium as a whole. [ Pages 41 & 44 ]
IMPROVING SAFETY FOR OUR CONTRACTORS TOO
Safety is a top priority for Elia, which is why it launched the ‘Safety for Contractors’ programme in early April to further strengthen safety awareness amongst contractors.

[ Page 29 ]
START OF WORK TO LAY NEMO LINK SUBMARINE CABLE

On 7 September, Nemo Link, the joint venture between Elia and National Grid that will operate the first electri city interconnector between Belgium and the UK, started laying the first 59 km of the double submarine cable. [ Page 40 ]


LAUNCH OF BIDLADDER
Late June saw the launch of BidLadder, a market platform developed by Elia enabling it to further boost liquidity on the bal ancing market and optimise its technical and economic perform ance. [ Page 57 ]
www.elia.be NOVEMBER 2017 ELECTRICITY SCENARIOS FOR BELGIUM TOWARDS 2050 ELIA’S QUANTIFIED STUDY ON THE ENERGY TRANSITION IN 2030 AND 2040 ELIA ANNUAL REPORT 2017 - 1312 - ELIA ANNUAL REPORT 2017 2017 Highlights
50Hertz in 2017
NEW SUBSTATIONS
SOUTH-WEST INTERCONNECTOR FULLY OPERATIONAL
The 200-km-long - thereof 161km in 50Hertz control area - South-West Interconnector - is fully operational after 15 years of development and construction. The 380 kV line between north-eastern Germany and Bavaria will ensure that Bavaria still has a reliable power supply follow ing Germany’s nuclear phase-out. The new line is having an immediate effect with improved congestion management and significant redispatch savings.

50Hertz commissioned five new substations in 2017 in Wolmirstedt, Heinersdorf, Hamburg, Putlitz and Altentreptow. Phase-shifting transformers were also commissioned in Röhrsdorf, on the border with the Czech Republic.

WORK STARTED ON BACK-TO-BACK CONVERTER IN BENTWISCH

50HERTZ TURNS 15
In 2017, 50Hertz celebrated its 15th birthday! On 28th June 2002, 50Hertz Transmission GmbH was entered in the trade register - at that point of time still carrying the official title “Vattenfall Transmission GmbH”. On 28 June 2002, Vattenfall Europe turned the high-voltage grid into an independent company and it was renamed 50Hertz. Elia and Australian investment group Industry Funds Management bought 50Hertz in the spring of 2010.

COMPACTLINE PILOT CONSTRUCTION STARTED
In early October, 50Hertz started constructing a pilot for a new type of line. The CompactLine will make it possible to reduce landscape and nature intervention in sensitive areas caused by overhead lines. The com pact design offers a good opportunity to integrate a new 380 kV line into sections of existing 220 kV lines. 50Hertz and its partners have been researching and developing CompactLine for three years. [ Page 99 ]
The 9th of May marked the start of the installation of the back-to-back converter at the Bentwisch high-voltage substation. This back-to-back converter is part of the Combined Grid Solution project, the first inter connector that will link the Baltic Sea wind farms, Kriegers Flak (Denmark) and Baltic 2 (Germany). [ Page 49 ]

AUDIT TO ACQUIRE ISMS
CERTIFICATE
To improve the safety of the company as a whole, 50Hertz took part in an audit in 2017 to acquire ISMS certifica tion in January 2018.
2030 NETWORK DEVELOPMENT PLAN
In early 2017, 50Hertz and Germany’s other three transmission system operators released a 2017 version of the 2030 Network Development Plan, which sets out various future scenarios depending on how quickly Germany wants to implement the energy transition.
50HERTZ’S DIALOG MOBIL WINS RGI AWARD

On 1 June in Copenhagen, 50Hertz’s Mobile Citizen’s Office - or Dialog Mobil - received a prize from the Renewables Grid Initiative (RGI) for its innov ative public participation and its closeness with citizens. Dialog Mobil is a van that drives around areas where information events are held, providing varied and important information on the expansion of the electricity grid.
[
ELIA ANNUAL REPORT 2017 - 1514 - ELIA ANNUAL REPORT 2017
Page 79 ] 2017 Highlights
Elia Grid International in 2017
MEMORANDUM OF UNDERSTANDING WITH MALAYSIAN TSO

On 29 September, Elia and the Malaysian transmission system operator Tenaga Nasional Berhad (TNB) signed a Memorandum of Understanding with a view to establishing a strategic collaboration. The cooperation will cover a number of areas: asset management, cross-boundary system and market operations, grid development, network studies and renewable integration.
TSO ASSESSMENT PROJECT IN VIETNAM
In March 2017, the Vietnamese power transmission system (NPT) asked EGI to perform a broad assessment of its activities and to propose a road map, which will enable it to be compliant with international best prac tices by 2030. The results of this analysis were delivered end 2017. This is the first EGI project in South-East Asia, where the company intends to increase its activities.

On 11 December, EGI entered into a strategic alliance with EuroAsia Interconnector, the official EU project developer of the 2,000 MW interconnect or between Israel, Cyprus and Greece. The agreement formal ises cooperation on the develop ment and implementation of the interconnector.

EGI TO COLLABORATE ON INTERCONNECTOR BETWEEN ISRAEL, CYPRUS AND GREECE
HELPING GERMANY TO ACHIEVE THE ENERGY TRANSITION

In order to integrate even more wind energy into the grid, 50Hertz is plan ning the construction of new sub stations and lines to reinforce its net work. EGI built and commissioned the new 380 kV substation ‘Heiners dorf’ in June.


HVDC PROJECT COMBINED GRID SOLUTIONS
EGI plays an important role in the HVDC project Combined Grid Solutions, a back-to-back converter synchronising the Danish and German grid via a 30 km submarine line between the wind farms Kriegers Flak (Denmark) and Baltic 2 (Germany), located in the Baltic Sea. EGI works as the owner’s engineer on the interface between the owner (50Hertz and EndK) and the Engineering, Procurement and Construction (EPC) contractor, for the construction of the converter station in Bentwisch, Germany. This project is an opportunity for EGI to expand its expertise in owner’s engineer services, especially for HVDC projects.
ASSET MANAGEMENT EXCELLENCE IN SAUDI ARABIA
National Grid SA is facing a broad range of challenges in managing the power system, such as a high growth in demand, a large area over which the assets are operated, and increasing integration of renewable energy sources and nuclear capacity. A detailed gap analysis performed by EGI in 2013 identified the optimal solution for dealing with these challenges.
ELIA ANNUAL REPORT 2017 - 1716 - ELIA ANNUAL REPORT 2017
2017 Highlights
Group priorities
_ We make the energy transition happen
As transmission system operator, Elia as pires to be a catalyst for the energy transi tion. After all, the power grid has a crucial role to play in the decarbonisation of the energy sector and of society in general.
CHRIS PEETERS, CEO OF THE ELIA GROUP
“THE ENERGY TRANSITION MAKES MANAGING THE ELEC TRICITY NETWORK MORE COM PLEX. INNOVATION AND TECH NOLOGICAL ADVANCES WILL HELP TO GUARANTEE THE SE CURITY OF SUPPLY IN THE FU TURE.”
As well as the rise of renewable energy generation, the energy transition is also bringing other changes. Increasing digi talisation is driving the emergence of new market players and new technologies such as electric cars, battery storage, and so on.
The rise of digitalisation also means a big ger role for end users. As such, managing the network is more complex now than ever before. To guarantee continued sec urity of supply in the future, the Elia Group is investing in grid infrastructure, innova tion and technological advances.
However, these changes are not confined to national borders. With the growth in interconnectors and closer supranational cooperation, we are moving towards an integrated European electricity system.
In short, the energy transition is in full swing and it is irreversible.
Our strategy
The building blocks of our strategy
Our strategy sets out how we aim to fulfil our mission and consists of six building blocks:
OUR VISION = OUR AMBITION
“WE WILL LEAD THE WAY IN THE ENERGY REVOLUTION BY DEVELOPING DIVERSIFIED, SUSTAINABLE AND RELI ABLE ON- AND OFFSHORE ELECTRICITY SYSTEMS, THAT OPEN UP NEW POSSIBILITIES.”
OUR MISSION = WHAT WE WANT TO ACHIEVE AND HOW
“WE DELIVER THE INFRASTRUCTURE OF THE FUTURE AND INNOVATE IN SERVICES THAT WILL PAVE THE WAY TO A RELIABLE AND SUSTAINABLE ELECTRICITY SYSTEM, PLACING THE COMMUNITY’S INTEREST AT THE HEART OF ALL OUR DECISIONS. WE WILL CONTINUE ENSURING SECURITY OF SUPPLY AND SERVING OUR CUSTOMERS IN AN EFFICIENT, NON-DISCRIMINATORY WAY, WHILST PRO TECTING THE SAFETY OF OUR PERSONNEL AND SUBCON TRACTORS.”
An evolving electricity system
INCREASING RENEWABLE INTEGRATION AT EUROPEAN LEVEL
EMERGENCE OF NEW TECHNOLOGIES AND PLAYERS DRIVEN BY INCREASING DIGITALISATION
EUROPEAN INTEGRATION OF THE ELECTRICITY SYSTEM
— GUARANTEEING A SECURE, RELIABLE AND EFFICIENT GRID:
We ensure a high level of security of supply by fully exploiting the possibil ities offered by our system.
— DELIVERING THE TRANSMISSION INFRASTRUCTURE OF THE FUTURE: We ensure that the investments needed to achieve the energy tran sition are implemented on time, on budget and in line with our quality requirements. We work to promote public acceptance of our projects through close cooperation, transpar ency and dialogue.
— FURTHER DEVELOPING THE ELECTRICITY SYSTEM AND MARKETS:
We promote European market coup ling and decentralised integration by granting access to new players, de veloping new products and working more closely with distribution system operators.
LOOKING OUT FOR INNOVATION AND GROWTH OPPORTUNITIES: We prepare the company for the fu ture and remain alert to innovation and future developments.
ALIGNING OUR CULTURE WITH OUR STRATEGY:
So that they support and reinforce each other. A change of culture is needed.
STRENGTHENING OUR POSITION BY FOCUSING ON COOPERATION:
We make the energy transition hap pen by collaborating intensively with other system operators and market players. We are customer-oriented and work with other stakeholders to develop the market.
ELIA ANNUAL REPORT 2017 - 1918 - ELIA ANNUAL REPORT 2017 1 2 3 56 4 Group priorities
_
_ Safety a top priority
The safety of everyone, everywhere, is always our number one priority. We continuously invest in safety and work in a responsible and safe manner. Our goal is zero accidents. Every employee and contractor knows the principles of our Go for Zero programme. We ensure that Elia’s safety instructions are properly applied in order to prevent incidents.


Innovation
Elia integrates innovative technology and keeps up with the latest de velopments in the energy sector. Through a range of initiatives, we encourage our employees to be at the forefront of the energy transition, not only with ideas, but
also with practical applications for system operation, asset management and mar ket development. In so doing, we draw on our own expertise but are also keen to learn about and develop ideas from out side the Group through open innovation.
Sustainability reporting
The Elia Group sees serving society as one of its core responsibilities, so it is a logical step for us to report on our corporate social responsibility (CSR) performance. In this annual report we discuss our financial, economic, social and environmental performance. For the GRI reference table, please consult the annex available on our website.
The Elia Group sees the Sustainability Report as a useful tool for managing and monitoring our CSR performance, helping us to do things better both inter nally and externally.
Materiality matrix
GRI 102-44, 46 & 47
The topics are clustered around the following sustainability enablers: Transmission Services, Organisational Structure, Employees, Environment, Fair Operating Practices and Community In volvement.
In the interest of society
A strong transmission system oper ator that always puts society first is key to successfully implementing the energy transition and to ensure that the grid is not only reliable but also sustainable and affordable. We believe that our technical
knowledge and analyses support policy making and make an important contri bution to the debate about the future of the energy system. This is always done in consultation with our many diverse stake holders.
“AS OPERATOR OF THE HIGH-VOLTAGE GRID, THE ELIA GROUP REFUSES TO STAND ON THE SIDELINES. WE HIGHLIGHT THE CHAL LENGES THAT EXIST, AS WELL AS THE OPPORTUN ITIES.”
The Elia Group will phase in its sutainability reporting over several years. Our focus this year is laying a solid foun dation on which to build a robust sustain ability programme.
The topics derived from the above standards were used as input to define the Elia Group’s materiality matrix. This matrix determines the relevant sustaina bility topics for the Elia Group’s manage ment and stakeholders.
The results of the materiality matrix are summarised on page 22. The import ance of the material topics is shown on the vertical axis, while the horizontal axis indi cates Elia’s performance in those areas.
HAND-PICKED SUSTAINABILITY TOPICS
We used existing international sustainability standards to identify a number of relevant topics:
— Global Reporting Initiative (GRI)
- sector supplement Electric Utilities
— Sustainability Accounting Standards Board (SASB)
- Infrastructure StandardsElectric Utilities
ELIA ANNUAL REPORT 2017 - 2120 ELIA ANNUAL REPORT 2017 — ISO 26000 standards
— A RELIABLE SYSTEM:
An energy mix that allows demand to be met at all times, promoting economic activity and safeguarding our prosperity.
— AN AFFORDABLE SYSTEM: Thanks to its well-developed grid, Bel gium has access to the most efficient sources of energy, both at home and abroad. This ensures price convergence with neighbouring countries and makes us more competitive.
€— A SUSTAINABLE SYSTEM: Through renewable integration that fully exploits domestic potential and supple ments this with renewable energy gen eration from abroad via additional inter connectors.

Sustainability reporting
_
_
Group priorities
TRANSMISSION SERVICES
1 Availability, Reliability and Future power system
2 Demand-side Management
3 Research and Development
4 Systemic risk management (Disaster/ Emergency planning and response)
ORGANIZATIONAL GOVERNANCE
5 Organizational Structure & decision making
6 Board Independence
7 Business ethics
EMPLOYEES
8 Conditions of work and social protection
9 Social dialogue and stakeholder relations
10 Employee Health, safety and wellbeing at work
11 Human development and training in the workplace
12 Diversity
13 Accident & Incident Management
14 Discrimination and vulnerable groups
15 Economic, social and cultural rights
16 Fundamental principles and rights at work
ENVIRONMENT
17 Environmental Management System
18 Waste and Hazardous Materials Management
19 Air pollution
20 Greenhouse Gas emissions
21 Energy Resource planning
22 Sustainable products & services
23 Biodiversity Impacts
24 Protecting consumers’ health andsafety
FAIR OPERATING PRACTICES
25 Corruption and Bribery
26 Legal & regulatory environment
27 Promoting social responsibility in the value chain/Supply chain
28 Respect for property rights
COMMUNITY INVOLVEMENT
29 Community involvement (including education and culture)
30 Employment creation and skills development
31 Technology development impacting community
The materiality matrix indicates the following topics as the most material:
Topics that are considered less ma terial by internal stakeholders are the fol lowing:
Overview of Elia’s engagement with stakeholders
GRI 102-42 & 43
Elia has many stakeholders’ initia tives. The method and frequency of en gagement per stakeholder group and the link to the material topics have been sum marised in the table right.
Elia regularly organises Users’ Group panels. Via these discussion groups, Elia can maintain an ongoing dialogue with its main customers and partners. With in the Users’ Group, there are three work ing groups and four task forces. The task forces are set up to handle specific issues when necessary.
For additional information, see the GRI-annex available on our website.
Stakeholder group Mode of engagement Frequency Main topics / expectations
Employees — Performance management
— Intranet — Donations
Customers — Customer satisfaction survey
— Users’ Group Working Groups
— Elia extranet
Society — Social events
— Engagement via own employees
— Regular — Employees - Human development
— Employees - Wellbeing
— Community involvement
— Annual — 4 to 6 times a year
Availability, reliability and future of the power system
This concerns providing informa tion on Elia’s plans and processes to ensure reliability, delivering sufficient capacity to the market and to facilitate the future power system to transport electri city to customers.
Accident & incident management
This topic concerns managing acci dent and incident risks for Elia’s own em ployees, as well as its subcontractors. This is translated into a robust programme aiming for zero accidents.
— Board independence is rated less ma terial due to the fact that this is a ma ture process at Elia. A clear corporate governance charter and internal pro cedures exist and are embedded in the organisation.
— Air pollution is considered as less ma terial because this is not relevant for a transmission system operator. Elia’s main activity is to transport electrical power using a fixed infrastructure.
— The internal stakeholders also rated Energy Resource Planning less materi al. This is potentially because the main part of its own electricity use is already from green electricity. Moreover, Elia’s own electricity use can be considered immaterial versus the energy transport ed on Elia’s grid.
Systematic risk management
This topic concerns the manage ment of risks such as damage to the grid due to bad weather, catastrophes, etc. to ensure power transmission can be guaranteed. This requires contin gency planning measures, disaster/emer gency management plans, training pro grammes and recovery plans.
Employee health, safety and wellbeing at work
This topic relates to the physical, mental and social wellbeing of workers and the prevention of working conditions causing an impact on health. It also re lates to the adaptation of the occupational environment to the physiological and psychological needs of our employees.
— Promoting social responsibility in the value chain/supply chain is also con sidered less material as the main part of the spend is in Europe, which has a high level of maturity concerning so cial responsibility topics (e.g. low risk of child labour, minimum wage).
Sustainable Development Goals
Elia has also looked at the United Nations Sustainable Development Goals (SDGs). The following overview shows which SDGs can be linked to Elia’s sus tainability topics.
Shareholders
Regulators
— Transmission services
— Environment
— Fair operating practices
— Regular — Community involvement
— Shareholder meeting — Regular — General corporate performance incl. the contribution to society
— Reports — Communication — Regular — Fair operating practices
Good health and wellbeing is about ensuring healthy lives and promoting wellbeing for all, at all ages. Enablers of this SDG are Elia’s activities on labour practices and employees.

The SDG on affordable and clean energy concerns access to affordable, reliable, sustainable and modern energy. Elia’s actions regarding transmission services are enablers for this SDG.

Decent work and economic growth relates to promoting sustainable, economic growth and productive, decent work. Elia’s efforts on the material topic ‘Employees’ is an enabler for decent work and economic growth.

Building resilient infrastructure, promoting inclusive and sustainable industrialisation and fostering innovation concerns the SDG industry, innovation and infrastructure. It is enabled by all actions on transmission services.

Sustainable cities and communities is about making cities and human settlements inclusive, safe, resilient and sustainable. The material topic on transmission services is an enabler for this SDG.

The SDG climate action relates to taking urgent action to combat climate change and its impact. Elia’s actions on minimising its carbon footprint and other environmental initiatives are enablers.

Life on land concerns protecting, restoring and promoting sustainable use of terrestrial ecosystems, sustainably managing forests, combating desertification, and halting and reversing land degradation and biodiversity losses. The sustainable enablers for this SDG are Elia’s efforts related to biodiversity within its environmental approach.

Partnerships for the goals relates to strengthening the means of implementation and revitalising the partnership for sustainable development. Elia has a strong partnership with Be Planet and other initiatives like Rising Youth. These partnerships are contributing to the realisation of this SDG.

ELIA ANNUAL REPORT 2017 - 2322 - ELIA ANNUAL REPORT 2017 Sustainability reporting
How can Elia guarantee round-the-clock, year-round power for my business?
#1_
WOUTER DE GEEST, CEO BASF ANTWERPEN

Energy is the lifeblood of our company. We’ve worked very hard – and successfully – over the past few years to make our processes more energy efficient, but a 24/7 production site like ours still requires a huge amount of electricity. If we want to continue to grow as a business and keep our operations here in the long term, a secure and competitively priced power supply is essential. How can I be sure that the supply of electricity is guar anteed all year round, and at affordable prices?
“The reliability of our high-voltage infra structure and security of supply are of vital concern to Elia. Thanks to the tireless dedi cation of our employees, Elia has one of the top performing grids in Europe. To ensure that this remains the case in the future, we are building tomorrow’s grid today. Our in vestment projects anticipate future develop ments such as the integration of renewable energy, increasing internationalisation and the emergence of new players and technol ogies. At the same time, we offer state-ofthe-art products that meet the increasing demand for flexibility. We also participate actively in the energy debate and use our ex pertise to support policymaking. We are not just committed to the security of supply but also to a reliable, sustainable and affordable electricity system for all market players and in particular our industrial consumers. We believe that the grid is crucial to the further economic development of our industry, of Belgium and of our prosperity in general.”
DAVID ZENNER, HEAD OF CUSTOMER RELATIONS AT ELIA — WITH THE COMPANY SINCE 1982, CEO SINCE 2007 — CHAIRMAN OF CHEMICAL INDUSTRY FEDERATION ESSENSCIAELIA ANNUAL REPORT 2017 - 2524 - ELIA ANNUAL REPORT 2017
RELIABILITY GRADE OF THE ELIA GRID 99.999% We ensure a secure, reliable and efficient grid
We ensure a secure, reliable and efficient grid

Elia has years of experience in managing its transmission grid and has built up indisputable technical expertise. As the energy transition progresses, the grid is having to accommodate increasing amounts of renewable energy. Such energy is more volatile, making the system operation more complex. In addition to the increased need for new flexible balancing products, Elia, like most infrastructure managers in Western Europe, is faced with ageing facilities.

Our ambitions
Safety at work
Safety is a top priority for Elia, which is why it applies the highest standards of safety to its employees, contractors and anyone exposed to its activities. Elia wants everyone to return home safely every day.

At Elia we insist that Health and Safety is at the very heart of the company. Our priorities are the Go for Zero safety behaviour programme and the burnout and stress prevention initiatives. We fa cilitate change and help our employees to be better prepared for the future tran sitions. We also strive to create more lo cal empowerment and ownership versus central control.
Operational excellence
As a grid operator, we aim to maximise the availability of our electri city system and keep the lights on at all times. To this end, we constantly optimise our critical and strategic processes in or der to minimise operational risks. At the same time, we strive for efficiency and cost savings.
Asset management
A sophisticated asset management strategy has been put in place to close ly monitor the functioning of critical infra structure components. Investment peaks are flattened thanks to a balanced re placement policy. As working methods evolve, staff need training to help them develop the requisite skills and tech niques. We provide professional training courses for both our own staff and our contractors.
A reliable grid 24/7
Elia strives to ensure a highly reli able power grid to support economic ac tivity and the well-being of the popula tion. To this end, optimal planning of its network and outages (scheduled outages for maintenance and projects) are vital, as well as efficient and safe, real-time oper ation of the electricity system.
OBJECTIVES
We are preparing the system of the future, integrating high levels of renewable energy and new types of consumption in a secure way, while giving the market maximum use of our infrastructure.
To cope with these changes, Elia is developing new maintenance policies aimed at maximising net work availability, smoothing out peaks in equipment replacement and mini mising costs. Elia is drawing on new technologies and methods to move to a system of decision-making based on the condition of equipment rather than just a predetermined maintenance or replacement frequency.
Electrical infrastructure is and always will be dangerous. Operational excel lence is key to safety, which is an abso lute priority. As part of its commitment to safety, Elia is working towards a zero accident rate.


It relies on its staff to meet these object ives. Continuous development of tech nical, managerial and behavioural com petencies is central to the remit of our Competence Centre.
FRÉDÉRIC DUNON, CHIEF ASSET OFFICER AT ELIA“OUR PRIMARY OBJECTIVE IS FOR ANYONE WHO WORKS ON OR NEAR OUR FACILITIES - BOTH ELIA EMPLOYEES AND EXTERNAL STAFF - TO RETURN HOME SAFE AND SOUND EVERY DAY. WE FIRMLY BELIEVE THAT EXCELLING IN THIS AREA IS A PREREQUISITE FOR OPERATIONAL EXCELLENCE.”
ELIA ANNUAL REPORT 2017 - 2726 - ELIA ANNUAL REPORT 2017
2015 2016 2017 NUMBER OF SAFETY INSPECTIONS (BELGIUM) 1,444 346 Safety Inspection by Safety Safety Inspection by Management 57 69 153 0 We ensure a secure, reliable and efficient grid
What we achieved in 2017
Safety always comes first GLOBAL PREVENTION PLAN TO ENHANCE SAFETY
Elia has developed a five-year Global Prevention Plan for 2016 to 2020. The plan outlines planned prevention activities for the five-year period, including risk analy sis, measures, objectives and required in struments. The comprehensive plan was put in place in close cooperation with stakeholders and was approved by Elia’s management.
THE GO FOR ZERO SAFETY PROGRAMME

Safety is our top priority. In 2017 Elia worked intensively in order to achieve its ongoing objective: zero accidents, for its employees but also for its contractors, colleagues from the distribution system operators and third parties in the vicinity of its installations. Efforts are coordinated via the Go for Zero programme, which is an Elia-wide initiative and includes all the projects that aim to optimise safety and its culture within Elia.
“IN OUR LINE OF WORK, SAFETY REQUIRES GOOD OPERATIONAL DIALOGUE BETWEEN ALL PARTIES OPERATING ON A WORKSITE. WE ARE STRENGTHENING OUR CAPABILITIES IN ORDER TO EXCEL IN THIS AREA, AS WELL AS IMPROVING OPERATIONAL DIALOGUE WITH OUR TECHNICIANS, WE WANTED TO ENHANCE THE SAFETY OF OUR CONTRACTORS AND THE DISTRIBUTION SYSTEM OPERATORS WE WORK WITH.”
01 People & technical skills
In an ever-changing world, everyone needs to hone their skills constantly and learn continuously. With that in mind, the People & Technical Skills project aims to catalogue the technical and behaviour al skills within Elia, then develop training paths to enhance the skills of Elia staff.
03 Operational & Safety Excellence with DSO
“WE CANNOT AND MUST NOT COMPROMISE ON SAFETY. IN VESTING IN SAFETY IS NOT A COST BUT A MARK OF RE SPECT FOR THE PEOPLE YOU WORK WITH.”
Elia shares a great many high-voltage sub stations with distribution system oper ators. In view of this fact, Elia and its col leagues in the distribution sector decided to launch a project to enhance safety. The project is based on an action plan split into four priorities: knowledge of each other’s organisations, stronger cooper ation through operational dialogue, clear definition of roles, responsibilities and operating limits, and improved collab orative procedures, particularly as regards earthing coordination.
ACCIDENT RATES (BELGIUM)
With this project, Elia wants to re inforce the safety culture. By teaching its employees the right methods and habits, Elia makes sure everyone works safely.
ELIA ANNUAL REPORT 2017 - 2928 - ELIA ANNUAL REPORT 2017 4.00% 3.50% 3.00% 2.50% 2.00% 1.50% 1.00% 0.50% 0.00%
02 Operational & safety excellence
Feedback, open dialogue and regu lar communication within and between teams are all absolutely vital if Elia’s am bitious targets on safety, efficiency and operational quality are to be met. As such, this project has two pillars: operational dialogue and continuous improvement.
Operational dialogue
entails implementing appropriate com munication systems for ensuring that planned activities can be carried out safe ly, efficiently, punctually, and with the highest possible level of quality.
Continuous improvement, on the other hand, entails researching and developing solutions to operational problems.

04 Safety For Contractors
In response to the energy transition, Elia is undertaking the most ambitious investment programme in its history. Between 500 and 800 subcontractor technicians are currently working on Elia projects to that end. Elia, in cooperation with its contractors, is striving to ensure that they, too, have optimal safety and zero accidents.
The Safety for Contractors pro gramme was launched on 30 March 2017, at the second Elia Contractors’ Day. The event was attended by over 120 partici pants, who took a keen interest in the new safety project.


The Safety for Contractors project focuses on three main areas: — introducing new collaborative ap proaches, — establishing new training for contract ors’ work supervisors, — developing a new qualification and evaluation process for selecting our contractors.
0.12% 0.10% 0.08% 0.06% 0.04% 0.02% 0.00%
05 Safety Leadership
In 2017, Elia wanted to strengthen its corporate culture so that it would be come second nature to all staff. With this in mind, it launched a programme aimed at structurally implementing a manage ment style that encourages employees to report risky behaviour and to work safe ly. Every manager must inspire and set an example, while also creating a climate of trust in which all employees adopt safe ty-oriented attitudes and behaviour and never compromise on safety.
CONTRACTOR 3.30% 0.01% 0.02%
2015 0.10%
2016 2017
GO FOR ZERO 01 People & technical skills 02 Operational & Safety Excellence 03 Operational & Safety Excellence with DSO 04 Safety For Contractors 05 Safety Leadership 3.60% 2.70%
Accident rate (%)
Accident severity (%)
ACCIDENTS (BELGIUM)
2015 2016 2017
Number of accidents contractors with & without lost time
Frequency injury rate contractors
Total recordable injury rate of contractors
MAARTEN KONINGS, QUALITY, COMPETENCE & METHODS MANAGER AT ELIA STÉPHANE OTTO, SAFETY MANAGER AT ELIAWe ensure a secure, reliable and efficient grid
52 50 48 46 44 42 40 38 16% 14% 12% 10% 8% 6% 4% 2% 0% 9.20% 8.70% 5.73% 46 43 51 9.80% 15.10% 11.10%
NUMBER OF STAFF INJURED WITH AT LEAST ONE DAY OF LOST TIME (BELGIUM)
WALTER GEELEN, MAINTENANCE & COMMISSIONING SOUTH AT ELIA

“SAFETY REMAINS OUR TOP PRIORITY. OUR GOAL IS ZERO ACCIDENTS. WE AIM TO ACHIEVE THIS BY PUTTING THE RIGHT SKILLS IN THE RIGHT PLACES AND FOCUSING ON GOOD OPER ATIONAL DIALOGUE BETWEEN TEAMS AND ON CONTINUOUS IMPROVEMENT. IN 2017, A NUM BER OF TEAMS NOTCHED UP 300 DAYS OF WORK WITHOUT AN AC CIDENT (WITHOUT INCAPACITY FOR WORK). SOME TEAMS HAVE EVEN REACHED 1,000 DAYS OF WORK WITHOUT AN ACCIDENT!”
SAFETY WEEKS
Each year, Elia organises Safety Weeks for its staff in May and September in an effort to raise their awareness about the importance of safety. The programme included various communications, train ing sessions and team exercises, designed to ensure that everyone got involved and took the messages on board.
In May 2017, we discussed psycho social risks and explained our compre hensive prevention plan for 2016-2020, as well as the importance of the safety cul ture within Elia. In September, the spot light was on non-negotiables, i.e. behaviours that we no longer wish to see in the company. First aid training was also of fered to our staff.
NUMBER OF FATAL OCCUPATIONAL ACCIDENTS BY GENDER (BELGIUM)
Managing our assets
ASSET MANAGEMENT EXCELLENCE

The Asset Management Excellence (AMEX) programme aims to ensure that every piece of equipment is worked on at the most appropriate time. To this end, Elia devises appropriate strategies for each category of assets depending on their age, condition and importance for the grid. These customised strategies help Elia to improve efficiency, boost asset reli ability and optimise the need for outages, whilst continuing to prioritise safety.
The aim of the AMEX programme is to help us better understand our assets so that we can take the right decisions in terms of managing equipment life cycles (design, maintenance, decommissioning, etc.) whilst optimising risks and costs. AMEX launched in early 2016 and will run for several years.
In 2017, the first round of work (wave 1) led to significant cost reductions (e.g. retrofitting transformers). Tailored maintenance policies are also easing the workload and allowing new activities to be developed.
The study phase for cables, batteries and diesel generators (wave 2) was com pleted in 2017, and that for digital protec tion devices and gas-insulated systems (wave 3) is being finalised. Wave 4 (over head lines and older-generation protec tion devices) started in October 2017 and will conclude in the first half of 2018. The fifth and final wave will take place in the second half of 2018 and 2019 and will cov er telecoms, metering, medium-voltage substations and buildings.
NEW INSTALLATIONS PUT INTO SERVICE IN 2017
ASSET CONTROL COMMAND (ACC)
Elia is one of the first system oper ators in Europe to have a control centre for its assets. All dynamic data (i.e. data that changes over time) relating to our assets is sent there. This allows informed asset management decisions to be taken. For example, each asset is given a ‘Health Index’ indicator which has a bearing on the scheduled maintenance activities.
MAINTENANCE & COMMISSIONING
The maintenance activities of Elia contribute significantly to our common goal of continuously delivering an out standing service to all our customers. Additionally, in the current tariff period, Elia has the ambition to achieve an un precedented level of investments in the high voltage grid compared to previous years.
In 2017, 306 new installations have been put into service, which is an increase of 10% on 2016 levels.
AWARENESS CAMPAIGN HIGHLIGHTING THE DANGERS OF ELIA FACILITIES
Safety is always Elia’s top priority, both for our own staff and for outside parties who work on or near our facilities. In 2017, the company continued its awareness campaign highlighting the risks for those working near its electrical infrastructure.
“As a result of this campaign, there was a sharp drop in the number of incidents during work near high-voltage lines in 2017. However, there are still instances of work being carried out without notifying Elia. As this is not only a safety issue but also a legal obligation, we urge anyone who is planning work to contact Elia beforehand so that safety measures can be communicated. More information is available on the website or from Elia’s Contact Centre.”


Céline Ghyselen, Contact Centre Manager at Elia
“OVERALL, THE AMEX PRO GRAMME WILL REDUCE MAINTENANCE COSTS BY SEVERAL MILLION EUROS A YEAR ON A LIKE-FOR-LIKE BASIS. AS WELL AS CUTTING COSTS, THE FIRST WAVE OF THE AMEX PROJECT HAS EASED THE WORKLOAD IN THE FIELD AND FREED UP STAFF TO FOCUS ON NEW ACTIVITIES.”
 STÉPHANIE HAMMER, AMEX MANAGER AT ELIA
ELIA ANNUAL REPORT 2017 - 3130 ELIA ANNUAL REPORT 2017
306
2015 2016 2017 2015 2016 2017 2 0 0 0 1 0 4 0 5 1 6 0 We ensure a secure, reliable and efficient grid
“USING CONNECTED CHECK LISTS, OUR TECHNICIANS CAN LOG THE CONDITION OF EQUIP MENT IN RECORD TIME. THIS INFORMATION IS SENT DIRECT LY TO THE ASSET MANAGER, WHICH KNOWS IMMEDIATELY WHICH TOOLS NEED TO BE RE PAIRED OR REPLACED. IN ADDI TION, THE NEW AUTOMATIC SYS TEM FOR DETECTING VISITORS ENTERING AND LEA-VING OUR SUBSTATIONS ENHANCES SEC URITY AND EFFICIENCY.”
OPTIMISING TRANSMISSION CAPACITY


Elia is continuing to invest in the development and use of Dynamic Line Rating in partnership with Ampacimon. This technology enables more accur ate assessment of the actual transmis sion capacity on lines on which it is fitted. This capacity can then be optimised in dependently of the weather conditions. Elia fitted Dynamic Line Rating equip ment on seven new 380 kV lines in 2017.
In addition, Real Time Thermal Rat ing (RTTR) equipment was installed on the Koksijde-Slijkens line. This technology calculates the line’s maximum transmis sion capacity in real time and is due to be rolled out in 2018.
Modern Way Of Working
Launched in 2016, the Modern Way of Working (MWOW) programme aims to digitalise, automate and improve the tasks performed by technicians using new technologies. These technologies al low field work to be done faster and more efficiently while also enhancing safety and quality.
Elia uses a range of methods to digi talise work in the field, including connect ed equipment (PCs, smartphones and smart devices), new mobile applications and the overhaul of current processes.
A reliable grid 24/7
CRISIS MANAGEMENT
Elia regularly holds crisis drills simu lating risk situations with the various stakeholders as preparation for managing real problems on the grid. These drills serve to test and improve the tools and processes in place and to ensure opti mal communication between the vari ous internal departments and the exter nal units involved in the crises. Both Elia employees and external partners (ARPs, distribution system operators, transmis sion system operators, etc.) take part in the exercises.
STEPS TO AVOID POWER SHORTAGES
Elia can detect a risk of power short age up to seven days in advance (D-7). When Elia notifies the government of this risk, a technical briefing is organised on the same day. A consultation meeting is then held the next day to decide on the measures to be taken to reduce demand. One day before the risk is due to materialise (D-1), Elia must confirm to the government that the shortage is ac tually imminent. If all the measures taken are not sufficient to prevent the shortage, Elia is mandated to activate one or more tranches of the load-shedding plan (de pending on the deficit). This measure is a last resort.
So far, Elia has not had to deal with a shortage, thanks to effective preparation and close cooperation with other system operators and partners. However, the pro cedure is designed to enable the problem to be dealt with as efficiently as possible.

BLACK START SERVICE FOR COPING WITH BLACKOUTS
In the event of a total blackout on the grid, Elia needs to gradually restore the power supply in predefined stages. If neighbouring electricity transmission grids are not available, Elia can rely on various generating units that are capable of performing a black start. These units can start without an external electricity supply, allowing the gradual restoration of power to the grid. This service is covered by a black start contract (black start being an ancillary service) between Elia and the power generators. In 2017, Elia conducted two tests to ensure that this service was operating correctly. The first took place at Ham on 7 July and the second at Herdersbrug on 30 September, and both were successful.
On Thursday 19 October 2017, the Federal Energy Minister Marie Christine Marghem opened Elia’s newly modernised National Control Centre (NCC). The upgrade was needed to cope with the growing integration of renewable energy, which is making system operation parameters (international flows, generation and consumption) less predictable and more volatile. The NCC therefore required better facilities for viewing the increasingly complex and large volumes of data. Among other improvements, operators now have a more ergonomic view thanks to a large wall of screens combining a view of the normal operating grid with an overview of renewable energies. Security and access controls have also been strengthened with the introduction of new technologies and additional protections.
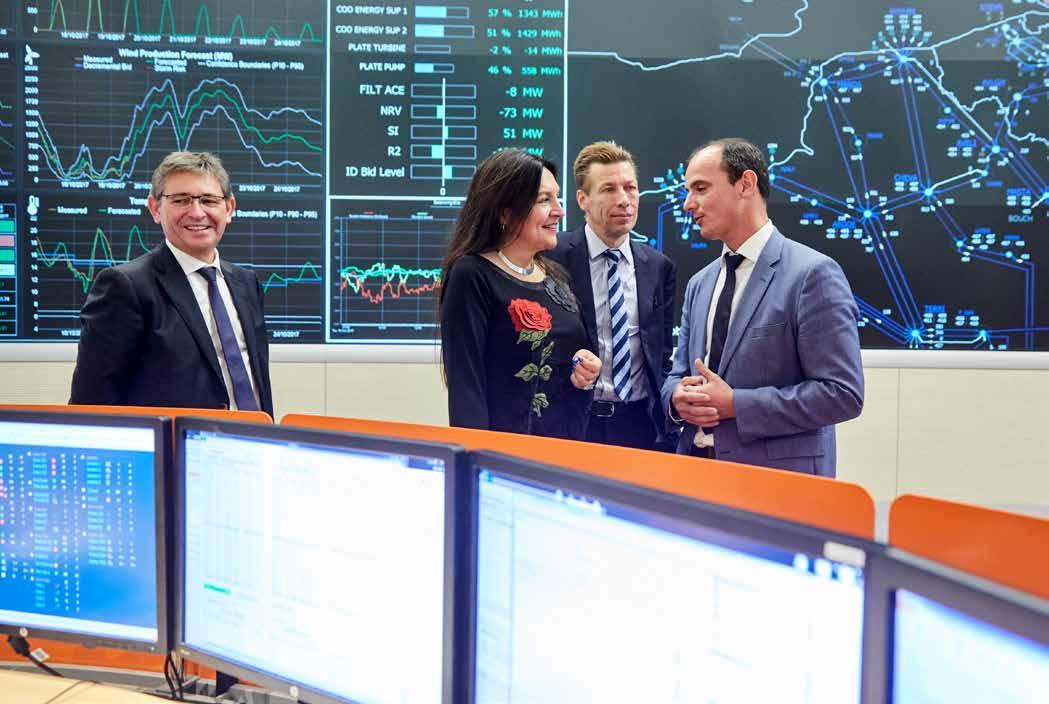
“With the challenges of the energy transition and the growing integration of renewable energy, our operators have an increasingly complex job. The refurbished NCC provides them with the best conditions and tools to accomplish their core task of managing the security and balance of the electricity network.”
Filip Carton, Head of the National Control Centre
 NICK DE DECKER, PROGRAM MANAGER AT ELIA
REFURBISHMENT OF ELIA’S NATIONAL CONTROL CENTRE
NICK DE DECKER, PROGRAM MANAGER AT ELIA
REFURBISHMENT OF ELIA’S NATIONAL CONTROL CENTRE
ELIA ANNUAL REPORT 2017 - 3332 - ELIA ANNUAL REPORT 2017
ELIA FITTED DYNAMIC LINE RATING EQUIPMENT ON SEVEN NEW 380 KV LINES IN 2017. 7 lines We ensure a secure, reliable and efficient grid
WHAT HAPPENED AT 50HERTZ ?
Promoting the right safety behaviours

53.4% renewable energy
50Hertz is one of the global leaders in inte grating renewable energy. On average in 2017, 53.4% of power in 50Hertz’s control area was generated from renewable energy sources (RES), and this was primarily from onshore wind.
Wind record on 28 October 2017
On 28 October 2017, autumn storm Herwart achieved a new wind feed-in record. Around 1pm on that day, 50Hertz integrated no less than 14,266 MW of wind energy: 13,934 MW from onshore wind and 332 MW generated offshore.
10th System Security Conference
50Hertz held its 10th System Security Conference in November 2017. The most prominent agenda items at the conference were the EU’s Clean Energy Package, exchan ges of electricity at European level, critical grid situations and data exchange.

An optimised redispatching platform
The redispatching processes at 50Hertz were optimised to better deal with grid conges tion problems. Combined with additional investments in grid infrastructure, such as the 380 kV South West Interconnector completed in September 2017, savings of no less than €181 million in redispatching costs were achieved in 2017.
Grid losses
In 2017, the grid losses of 50Hertz amounted to 2.4 TWh. The average grid losses of the extra-high voltage level were 231.7 MW and the substation accounted for 43.5 MW. 50Hertz has planned the first 400 kV, ultra-high voltage DC transmission line (HVDC) in its grid area, the ‘SüdOstLink’ between Saxony-Anhalt and Bavaria. This technique is better suited than conventional three-phase technology to trans fer large quantities of electricity as it facilitates optimum control targeted over long distances, which results in low network losses.
Six reportable occupational accidents occurred at 50Hertz. The targets set for acci dent frequency and severity rates were not yet achieved in 2017. Every accident was assessed in detail, and work safety measures were adopted and put in place to prevent future occupational accidents.
A full set of measures will be implemented in 2018, and workplace safety will once again be prioritised to increase employees’ awareness of safe behaviour.

...not forgetting contractors
Our occupational health and safety standards also apply to contracted companies work ing on 50Hertz construction sites. Our part ners must therefore sign up to instructions on guaranteeing occupational safety and environmental protection, which are a manda tory part of our tenders and contract awards. In 2017, we made these instructions more

specific and transparent. During the contract ing process and later via IT-supported con struction monitoring by specially trained 50Hertz employees, we ensure that our sup pliers comply with 50Hertzʼs strict safety requirements.
The number of work-related accidents in con tracted companies declined in 2017. However, the 16 recorded accidents involving con tracted companies are still more than 50Hertz would expect. Consequently, an Agreement on Quality Assurance on 50Hertz Construction Sites is included as an additional part of new contracts concluded from 1 July 2017. This allows us to carry out inspections without any restrictions. In 2018, we will be launching an internal communication campaign to further raise awareness among our workforce.
The quality assurance agreement for 50Hertz worksites forms part of new contracts con cluded after 1 July 2017. This includes an unlimited right for 50Hertz to perform inspections and a system for reporting devia tions from required standards.
ELIA ANNUAL REPORT 2017 - 3534 - ELIA ANNUAL REPORT 2017
(1) Accident rate: Number of occupational accidents requiring at least 1 day off work x 1,000,000 total number of hours worked. (2) Accident severity rate: Number of lost-time days resulting from occupational accidents expressed in calendar days x 1,000 / total number of hours worked. Occupational accidents also include accidents that occur during travel and commuting. No fatal accidents were recorded between 2015 and 2017. Accidents at 50Hertz 2015 2016 2017 Accident rate 1 3.0 2.0 4.5 Accident severity rate 2 0.05 0.16 0.23 53.4% 0.40% Gas (renewable) 17.90% Photovoltaic 0.80% Hydropower 21.70% Biomass 2.80% Offshore wind 56.40% Onshore wind FEED-IN OF RENEWABLE ENERGY IN 50HERTZ’S CONTROL AREA IN 2017 We ensure a secure, reliable and efficient grid
How can Elia integrate large quantities of renewable energy?
By 2020, the nine wind farms in the Belgian North Sea will be generating an average of 8 TWh of electricity each year. Thanks to the recent grid upgrade delivered by the Stevin project, all of this power will be able to reach consumers. A further 2,000 MW of offshore wind cap acity is likely to come online after 2020. How will Elia manage to integrate this additional power generation?
 TOM PIETERCIL, MOG PROGRAMME MANAGER AT ELIA

“Elia is actively preparing for the increase in offshore wind generation, which is why we started developing a power grid in the North Sea in 2016. By 2020, there will be a large SwitchYard platform 40 km off the coast of Zeebrugge. This Modular Offshore Grid (MOG) will bundle together the cables from the new wind farms, allowing 2.2 GW of offshore wind energy to be brought onshore. Should Belgium decide to further expand its offshore wind capacity after 2020, additional grid infrastructure will be needed to prevent bottlenecks. In that case, we will set out our future needs in the Federal Development Plan 2020-2030 to be published in late 2018. Wind energy is extremely variable, so accur ate weather forecasting is key to keeping the electricity system balanced. Elia has de veloped a whole range of balancing products to offset differences between supply and de mand.”
ANNEMIE VERMEYLEN, SECRETARY GENERAL OF BOP
a comparison with 2015 and 2016, we refer to the annex.
ELIA ANNUAL REPORT 2017 - 3736 - ELIA ANNUAL REPORT 2017
#2_
We deliver the transmission infrastructure of the future
— SECRETARY GENERAL OF BELGIAN OFFSHORE PLATFORM (BOP) SINCE 2012 — BOP IS AN ASSOCIATION THAT CHAMPIONS THE INTERESTS OF THE OFFSHORE WIND INDUSTRY TOTAL LENGTH OF THE NETWORK (BELGIUM) 8,495 Km 5,563 KM UNDERGROUND CABLING 2,932 KM OVERHEAD LINES For
future
The Elia Group is currently rolling out the biggest investment programme in its history. As well as modernising its existing facilities, it is also investing heavily in the integration of renewable energy, the development of an offshore high-voltage grid and the construction of interconnectors to facilitate the integration of the European energy market. Through all these measures Elia is driving the transition to tomorrow’s energy system.
Our ambitions
Delivering on time, budget and quality
We aim to deliver the future grid on time to allow Belgian society to grasp the benefits of the energy transition. We want to provide value-for-money power for society and take care of designing and constructing the grid with the highest quality standards in order to deliver a re liable grid that continues to support eco nomic activity.
Integrating renewables into both centralised and decentralised systems
With our infrastructure spanning from 380 kV down to 30 kV, we want to facilitate the uninterrupted flow of renew able energy from where it is produced to where it is consumed. Our grid is an ena bler of the energy transition. We want to become a leader in infrastructure devel opment to contribute to our sustainabil ity targets.
Developing strong grid interconnections together with neighbouring countries


We develop grid interconnections to support the competitiveness of our coun try: to find the cheapest energy wherever it is produced, while offering export op portunities to our domestic plants.
We build interconnections to ena ble the integration of renewable genera tion at European level, allowing us to com plement our domestic renewables with imported renewables produced abroad.
Our interconnections support the security of supply, by allowing imported energy to supplement the domestic re newable and conventional production, therefore satisfying demand at all times.


OBJECTIVES
We prepare to develop the grid of the future that strongly connects Belgium’s renewable energies, onshore or offshore, into the European system to give every player - large or small - access to an optimal performing energy market in order to create the highest levels of welfare for society:
— Delivering on time, budget and quality
— Integrating renewables into both centralised and decentralised systems
— Developing strong grid interconnections together with neighbouring countries
Best-in-class project management is absolutely vital if the implemen tation of our ambitious invest ment policy is to remain manageable. Elia uses specially tailored working methods and decision-making approaches and closely monitors progress on its investment projects, thus ensuring that projects are delivered on time and within the proposed budget and quality criteria.
At the same time, we are paying greater attention to public support for our infra structure work. Thanks to extensive stakeholder management, we engage constructively and transparently with all relevant parties throughout the deci sion-making process and during the implementation phase.
MARKUS BERGER, CHIEF INFRASTRUCTURE OFFICER AT ELIA
“WE ARE ON A GOOD TRACK TO WARDS DELIVERING OUR AM BITIOUS INVESTMENT PLAN TO FACILITATE THE INTEGRATION OF RENEWABLES AND ACCESS TO THE EUROPEAN MARKET, AS WELL AS CONTRIBUTING TO THE SECURITY OF SUPPLY.”
ELIA ANNUAL REPORT 2017 - 3938 - ELIA ANNUAL REPORT 2017
We deliver the transmission infrastructure of the
We deliver the transmission infrastructure of the future 2016 815 2017 814 2015 817 NUMBER OF SUBSTATION LOCATIONS (BELGIUM)
Infrastructure projects
Towards a more interconnected European grid
The Elia Group’s grids are part of the European continental interconnected system, which extends from Portugal to Bulgaria and from Norway to Italy. This interconnectivity safeguards secur ity of supply throughout Europe, allows renewable energy to be procured where it is generated and provides access to the cheap est energy available. Elia believes that these interconnections are important. As such, it is currently working on the construction of two interconnectors: Nemo Link and ALEGrO.
TIM SCHIJVENS, PROJECT MANAGER NEMO LINK AT ELIA
“NEMO LINK MARKS ANOTHER STEP IN THE INTEGRATION OF THE ELECTRICITY GRID BE TWEEN MAINLAND EUROPE AND THE UNITED KINGDOM. A WELL-INTEGRATED GRID BENE FITS CONSUMERS AND BOOSTS OVERALL PROSPERITY AS IT PROVIDES ACCESS TO CHEAP, RENEWABLE ENERGY ANY WHERE IN EUROPE AND AL LOWS EXCESS ENERGY TO BE EXPORTED WHEN NECESSARY.”
NEMO LINK
— First subsea electricity connection between the United Kingdom and Belgium
— Joint venture between Elia and National Grid
— 140 km of cable linking Richborough (Kent) and Herdersbrug (Bruges)
— Capacity of 1,000 MW
— Elia’s first direct-current (HVDC) project
— Due to be commissioned in early 2019
In September 2017, Nemo Link began laying the first 59 km of submarine cable between the UK onshore landing point and the French offshore section. On 11 September, the cable was pulled in at the beach of Pegwell Bay (Kent), marking a key milestone in the project.


The remaining 71 km will be installed in Belgian territorial waters during spring and summer 2018. The interconnector is scheduled to be commissioned in early 2019, allowing two-way energy transit be tween the United Kingdom and Belgium.

In 2017, civil engineering work took place at the site of the two converter sta tions in Richborough (Kent) and Herders brug (Bruges). These facilities will trans form the alternating current into direct current, and vice versa.
ALEGRO
— New interconnector between Germany and Belgium
— Joint venture between Elia and Amprion

— 90 km of cable (49 km in Belgium and 41 km in Germany)
— Will link the Lixhe (Visé) and Oberzier converter stations
— Capacity of 1,000 MW
— Elia’s second direct-current (HVDC) project
— Due to be commissioned in 2020
In November 2017, Elia acquired the permits and authorisations needed to launch the Belgian side of the Aachen Liège Electrical Grid Overlay (ALEGrO) project. ALEGrO will contribute to the in tegration of renewable sources of energy, price convergence between the markets and security of supply.
The connection will run under ground for the entire 90 km route (49 km in Belgium) and will mainly follow exist ing infrastructures (highways and rail ways). Work will begin in 2018, with com missioning due in 2020.
“PROJECTS LIKE ALEGRO HAVE A SCOPE THAT EXTENDS FAR BEYOND THE BOUNDARIES OF OUR MUNICIPALITY. IT’S IMPORTANT TO BEAR IN MIND THE WIDER PUBLIC INTEREST WHEN CONSIDERING THE ISSUES SURROUNDING SUCH PROJECTS. HOWEVER, THE VIEWS OF OUR RESIDENTS ALSO HAVE TO BE TAKEN INTO AC COUNT. COMPANIES LIKE ELIA HAVE LEARNED TO ANTICIPATE THIS AND ARE NOW ADOPTING A GENUINE POLICY OF TRANSPARENCY TOWARDS LOCAL RESIDENTS, BY HOLDING INFORMATION MEETINGS FOR EXAMPLE.”
MARCEL NEVEN,MAYOR OF VISÉ HerdersbrugELIA ANNUAL REPORT 2017 - 4140 ELIA ANNUAL REPORT 2017
CAPACITY (ALEGrO) OF CABLE (ALEGrO) OF CABLE (Nemo Link) 1,000 MW 90 KM 140 KM What we achieved in 2017 We deliver the transmission infrastructure of the future CAPACITY (Nemo Link) 1,000 MW HERSTAL OUPEYE VISÉ BLEGNY SOUMAGNE THIMISTER CLERMONTHERVE WELKENRAEDT LONTZEN LIMBOURG BAELEN EUPEN RAEREN Liaison Construction Allemagne par MT SC
Richborough — Nemo Link Belgium UK North sea
Facilitating offshore energy


With the MOG, Nemo Link and Stevin projects, Elia is making the neces sary upgrades and developments be tween Belgium’s interior and coast via an energy hub in the North Sea. As well as bolstering security of supply, they will also strengthen the development of inter connections with neighbouring countries.
MOG
— MOG = Modular Offshore Grid
— Two offshore platforms located around 40 km from the coast

— Will receive cables from the new off shore wind farms
— Connected directly to the Stevin sub station in Zeebrugge
In April 2017, Elia’s Board of Directors approved the investment for an ‘electri city plug’ or Modular Offshore Grid (MOG). The choice of a MOG is of strategic im portance for Belgium’s future in terms of its participation in the further develop ment of renewable energy in the North Sea.
The MOG will consist of two offshore platforms located approximately 40 km off the coast of Zeebrugge. They will act as a ‘plug’ for cables from the new off shore wind farms. Elia is currently build ing a platform called Offshore Switch yard (OSY), from where two cables will run to the Stevin substation to bring off shore wind power to the mainland. There will also be a third cable to the Stevin sub station from the platform built by Rentel. Elia will purchase this cable, which will become part of the MOG. It will also lay the cable between the OSY and Rentel platforms.
“AS EARLY AS 2010, ELIA ALREADY HAD PLANS TO DEVELOP ITS OFFSHORE ACTIVITIES. BY ENGAGING ACTIVELY WITH POLITICIANS, THE FEDERAL AND REGIONAL AUTHORITIES, THE REGULATOR AND NUMEROUS WIND FARM REPRE SENTATIVES, IT WAS ABLE TO PUT FORWARD THE MOG CONCEPT IN 2015. LESS THAN TWO YEARS LATER, WE’RE STARTING WORK ON THE PROJECT. THIS IS UNPREDEDENTED FOR A PROJECT OF SUCH MAGNITUDE AND COMPLEX ITY.”
STEVIN
— Double 380 kV line between Zee brugge and Zomergem (47 km)
— Capacity of 3,000 MW
— Key to the integration of offshore renew able energy, and vital for exchanging electricity with the United Kingdom (Nemo Link) and enhancing security of supply at the Port of Zeebrugge

— First 380 kV underground line in Bel gium (over 10 km)
With Stevin, Elia is forging one of the missing links to the coastal grid, allowing electricity generated by offshore wind farms and energy carried by the inter connector with the UK to be optimally integrated into the Belgian high-voltage grid.


This project is a vital link for ensuring a reliable electricity supply, particularly in coastal regions. Its aim is to reinforce the Belgian high-voltage grid by means of a double 380 kV high-voltage line between Zomergem and Zeebrugge, representing a distance of 47 km. A new substation in Zeebrugge and two new transition sub stations in Bruges and Damme will also be built.
With the link now operational, Elia is starting work on the second phase of the project: dismantling 53 km of existing lines (in Bruges, Damme, Maldegem and Eeklo), 35 km of which will be buried. This work will continue until 2020.
“THE STEVIN SUBSTATION IN ZEE BRUGGE IS BELGIUM’S LARGEST HIGH-VOLTAGE SUBSTATION. IT WORKS WITH THE THREE HIGH EST VOLTAGE LEVELS: 150 KV, 220 KV AND 380 KV. A UNIQUE CON FIGURATION!”
For environmental reasons, 10 km of the 47 km Stevin project runs underground. To maintain its 3,000 MW transmission capacity, the underground section was divided into four parallel copper wire systems. In addition, a double tunnel pipe was built to traverse the Boudewijn Canal. Each pipe is situated at a depth of 32 metres and has a diameter of 14 metres. Shafts were constructed on both sides of the canal, through which technicians can descend to carry out maintenance work. Placing the 380 kV connection underground was a major technical feat and a first for Belgium.
TOM TRAPPENIERS, INTERFACE & INTEGRATION MANAGER MOG AT ELIA ON 21 NOVEMBER 2017, THE STEVIN PROJECT WAS INAUGURATED IN THE PRESENCE OF PRIME MINISTER CHARLES MICHEL, FEDERAL ENERGY MINISTER MARIE CHRISTINE MARGHEM AND A HOST OF MARKET PLAYERS. DOUBLE TUNNEL PIPE UNDER THE BOUDEWIJN CANAL WILLIAM STAS, STEVIN PROJECT LEADER AT ELIA Brugge MaldegemELIA ANNUAL REPORT 2017 - 4342 - ELIA ANNUAL REPORT 2017
We deliver the transmission infrastructure of the future
Reinforcing the grid
Given the increasing complexity of the electricity system, Elia re mains committed to reinforcing the existing grid. Many projects are currently underway to address this need and accommodate local re newable energy generation.


 RAF VANDENBOER, ELIA’S PUBLIC ACCEPTANCE OFFICER FOR BRABO
BRABO
The final permit required for phase two of the Brabo project was granted in October 2017. The project aims to strengthen the high-voltage grid and con solidate security of supply in and around the Port of Antwerp and, more generally, to increase Belgium’s import/export capacity.
Brabo is divided into several phases, which Elia is implementing between 2016 and 2023.
Brabo I (the Doel-Zandvliet connec tion and Zandvliet substation): The up grade of the second high-voltage line be tween Doel and Zandvliet is complete and the line was commissioned on 25 Oc tober 2016. The additional phase-shifting transformers at Zandvliet were commis sioned in November 2015 and June 2016. This is a vital step towards greater security of supply during critical winter periods.
Brabo II (the Zandvliet-LilloLiefkenshoek connection): The existing 150 kV high-voltage line will be upgraded to a 380 kV connection on the right bank of the River Scheldt in the Antwerp dis trict of Berendrecht-Zandvliet-Lillo and the municipality of Stabroek. The con nection will follow the current route along the A12 between the high-voltage substations at Zandvliet (close to BASF) and Lillo (close to the Liefkenshoek tun nel). This connection will cross the River Scheldt to Be-veren on the left bank, where it will be connected to the existing 380 kV connection (Doel-Mercator). Elia began laying high-voltage cables (150 kV) under Scheldelaan and Kruisweg in Antwerp in March 2017.
Brabo III (the Liefkenshoek –Mercator connection): From Liefkenshoek, the existing 150 kV connection will be upgraded to 380 kV. This line will run over a distance of 19 km from Liefkenshoek (municipality of Beveren), via the Kallo high-voltage substation (municipal ity of Beveren), to the Mercator high-volt age substation (municipality of Kruibeke).
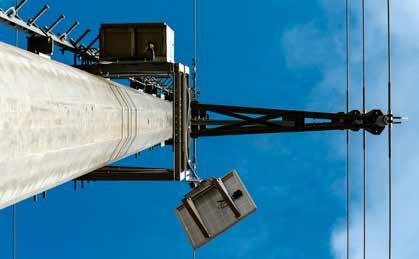
“IT WAS DIFFICULT BUT IN THE END, WE’VE ESTABLISHED A STRUCTURAL PARTNERSHIP WITH THE PORT OF ANT WERP COMMUNITY AND THE MUNICIPALITY OF STABROEK. A GREAT TAKE-OFF POINT FOR OUR NEXT STEPS IN THE BRABO II PROJECT!”
“THE GRID IN THE EAST OF THE PROVINCE IN LIÈGE IS SAT URATED AND CAN NO LONGER ACCOMMODATE EXTRA GEN ERATION FROM RENEWABLES. THIS PROJECT IS CRUCIAL FOR THE INTEGRATION OF RENEWABLES AND ALSO TO SE CURE GRID RELIABILITY.”
BOUCLE DE L’EST
In February 2017, Elia inaugurated the first stage of its mammoth project to modernise and upgrade the Boucle de l’Est (East Loop). This first upgrade con nects Malmedy, Waimes, Amel and Büt genbach. The project is part of the Wal loon power infrastructure development plan.
This project is vital for the develop ment of renewable energy generation in the region and key to ensuring reliable grid operation. It will enable a number of renewable energy projects (biomass, wind, etc.) to be developed and to inject their energy securely into the grid.
Stage 1 of the Boucle de l’Est project (the Bévercé-Bütgenbach-Amel connection) was commissioned in early December 2016.
Stage 2 of the project involves re placing and upgrading the overhead line connecting the Bévercé (Malmedy), Bron rome, Trois-Ponts (Coo) and Brume sites located in the municipalities of Malmédy, Stoumont, Stavelot, Spa and Malmedy. The work is scheduled for 2019-2022.
DORIEN JANNIS, BOUCLE DE L’EST PROGRAMME MANAGER AT ELIAELIA ANNUAL REPORT 2017 - 4544 - ELIA ANNUAL REPORT 2017
We deliver the transmission infrastructure of the future
abo abo abo N ZAN VLIET Antwerpen LIEFKENSHOEK KETENISSE KAL O LIL DOEL BEVEREN abo abo B abo III Scheldeoversteek
km
MERCATOR-AVELIN
Elia is planning to upgrade the 380 kV Mercator-Avelin overhead line, which is 110 km long and passes through 25 municipalities in Flanders and Wallo nia before continuing into France. The line upgrade is subdivided into three projects: Mercator-Horta, Horta-Avelgem and Avel gem-Avelin.


1. Mercator-Horta
Elia secured the planning permis sion, declaration of public utility and high way permit for the Mercator-Horta pro ject in May 2017. At the end of that month, work started on the Kruibeke (Mercator) high-voltage substation and on the line itself to strengthen the pylons and foun dations along the entire route. Work to replace the conductors with high-tem perature low-sag (HTLS) conductors will begin in April 2018.
The Mercator-Horta connection is an overhead high-voltage line linking Kruibeke and Zomergem, a distance of 49 km. It was built in the 1970s and cross es 12 municipalities. Elia wants to upgrade the line to help it cope with the increas ing integration of renewable generation units. Upgrading the line will also enable more power to be imported from/export ed to other countries.
2. Horta-Avelgem
The Horta-Avelgem line is a 380 kV high-voltage overhead connection built in the 1970s. It runs for 40 km from Zomergem (Horta high-voltage sub station) to Avelgem. The line is located in the provinces of East Flanders and West Flanders and crosses eight municipalities.
Between 2018 and 2021, Elia will replace the conductors on the existing high-voltage line, consolidate the pylons and their foundations, and modify the switchgear at the Avelgem high-voltage substation.
3. Avelgem-Avelin
Elia plans to upgrade the 380 kV high-voltage overhead connection link ing the Avelgem (Belgium) and Avelin (France) substations by 2021. This line also dates from the 1970s. This joint pro ject with the French high-voltage system operator RTE affects two Flemish and five Walloon municipalities. It covers a dis tance of 23 km and includes 54 pylons. The work is scheduled for 2018-2021.
SCHELLE-MALDERENMECHELEN
The Schelle-Malderen-Mechelen project comprises four subprojects:
— the reconfiguration of three high-volt age substations at Schelle, Malderen and Tisselt (to facilitate demolition of the lines and cable laying and to re place outdated equipment),
— the demolition of the 70 kV overhead line between Schelle and Mechelen,
— the laying of a new 150 kV cable con nection between Malderen, Tisselt and Mechelen,
— the demolition of the 70 kV overhead line between Malderen, Tisselt and Mechelen.
It aims to enhance the region’s security of supply.
In 2017, Elia dismantled the 70 kV line between Schelle and Mechelen and also began adapting the high-voltage substations at Schelle and Malderen. This is expected to be completed during the first quarter of 2019. The project is sched uled for completion in 2022.
AALTER
This project aims to upgrade the high-voltage grid in the Lakeland indus trial zone and boost its energy transit capacity in order to guarantee continued security of supply for households and lo cal businesses in Aalter, Knesselare and Wingene.

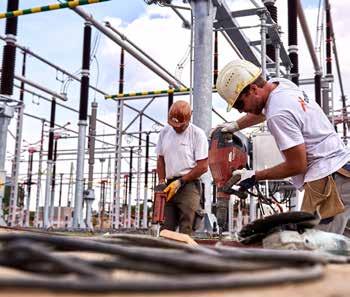


The project will also offer local busi nesses based in the industrial zone greater scope to expand: not only because of the planned expansion of grid capacity, but also thanks to the space freed up by moving the high-voltage substation to Léon Bekaertlaan, where Elia has a site ready to accommodate a new substation. The work is scheduled to take place from mid-2018 to late 2020.
RABOSÉE-BATTICE
Elia was granted planning permis sion for the Rabosée-Battice project in October 2017. Work will begin in 2018. To meet the various changing consumption and generation needs identified in the re gion, Elia proposes to build a new 150 kV underground electricity connection link ing the Battice substation and Rabosée (Wandre-Haut). Here, the underground link will be connected to the 150 kV Bres soux-Cheratte-Lixhe overhead connec tion, which will require the construction of a new transition substation at Rabosée.
ercator-AvelinELIA ANNUAL REPORT 2017 - 4746 - ELIA ANNUAL REPORT 2017
We deliver the transmission infrastructure of the future 110
(M
)
ILSE TANT, CHIEF PUBLIC ACCEPTANCE OFFICER AT ELIA

“IN ORDER TO REAP THE FULL BENEFITS OF AN INTEGRATED MARKET, WHILE AT THE SAME TIME MEETING OUR SUSTAIN ABILITY OBJECTIVES, IT IS VITAL THAT THE DEVELOPMENT OF BELGIUM’S GRID INFRASTRUCTURE STAYS AHEAD OF MARKET DEVELOPMENTS.
Cutting costs WHAT HAPPENED AT 50HERTZ ?
The BOOST project was launched in 2014 with the aim of optimising cost management. It was rolled out in three successive waves: underground engin eering, IT activities, and overhead lines and substations. Thanks to this initiative, Elia saved more than €20 million over the first two years of the 2016-2019 tar iff period.
“BOOST HAS HERALDED A NEW AP PROACH IN THE COMPANY, IN PAR TICULAR AN ACKNOWLEDGEMENT THAT TECHNICAL SPECIFICATIONS SHOULD BE CHALLENGED TO MAKE SURE THEY FIT WITH THE COMPANY’S NEEDS AND WHAT IS AVAILABLE ON THE MARKET.”
New substations
50Hertz commissioned five new substations in 2017 in Wolmirstedt, Heinersdorf, Hamburg, Putlitz and Altentreptow. Phase-shifting trans formers were also commissioned in Röhrsdorf, on the border with the Czech Republic.
South-West Interconnector
€20 mio
SAVINGS IN 2016 AND 2017
Federal Development Plan 2020-2030
In line with its legal obligation to draw up a federal development plan every four years, Elia began preparing a report on the medium-term future of the Belgian high-voltage grid (Federal De velopment Plan 2020-2030) in 2017.

Elia notes that a fundamental change in the context is underway as the network evolves from lagging to lead

ing, meaning that the electricity network is determining the speed at which the energy transition takes place. Elia there fore advocates an accelerated approach to infrastructure development in order to fully exploit the advantages of the energy transition. The Federal Development Plan 2020-2030 will be finalised in 2018 and put out to public consultation.
Combined Grid Solution is a world first!
This unique joint project between 50Hertz and the Danish system operator Energinet will be the world’s first interconnector between two offshore wind farms of different nationalities: the Kriegers Flack (DK) and Baltic 2 (DE) projects, which are located barely 30 km apart. Commissioning is scheduled to take place from late 2018.
The Hansa PowerBridge project

50Hertz and the Swedish transmission sys tem operator Svenska kraftnät have taken another step forward in the development of the Hansa PowerBridge project, the around 300 km, approximately 700 MW off shore interconnector between Germany and Sweden. On 19 January 2017, the two system operators signed a detailed cooperation agreement concerning the schedule and construction. With a planned commis sioning date of around 2025/2026, the sub marine cable will link Germany’s substantial wind generation output with the vast storage capacity of Swedish hydropower plants.
The South-West Interconnector between Saxony-Anhalt and Bavaria has been fully operational since September 2017 – an important milestone for 50Hertz. The development stage of the 200 km - thereof 161km in 50Hertz control area - connection lasted 15 years. The 380 kV line is intended to ensure a reliable power supply for Bavaria following Germany’s nuclear power phase-out. Since the new connection was fully commis sioned, there have been fewer congestion problems in 50Hertz’s control area, which has reduced costs incurred by redispatch measures considerably.
Ostwind1
50Hertz made substantial progress on a num ber of offshore projects in 2017. A second cable was laid for the Ostwind1 offshore grid con nection project, meaning that the Wikinger wind farm can be connected in 2018.


01 Minimising the construction of new infrastructure by giving priority to optimising and improving existing infrastructure.
02
communication
development process from a very early stage.
03
HARALD VAN OUTRYVE D’YDEWALLE, PURCHASING MANAGER AT ELIAand
WHEN IT COMES TO DEVELOPING THE POWER GRID OF THE FUTURE, ELIA IS COMMITTED TO THREE PRINCIPLES:
ELIA ANNUAL REPORT 2017 - 4948 - ELIA ANNUAL REPORT 2017
Open
and cooperation during the entire
Respect for people
the environment when building and operating our infrastructure.
We deliver the transmission infrastructure of the future
How can Elia ensure that our industry remains competitive with other countries?
PIETER TIMMERMANS, CEO OF THE FEDERATION OF ENTERPRISES IN BELGIUM (FEB)

If we want Belgian companies to remain competitive, our electricity price must be comparable to that of neighbouring coun tries. While our industries are energy-effi cient, they are more energy-intensive than those of our neighbours. As well as the various taxes and surcharges, the electron price and transmission tariffs are key fac tors. Securing an identical electron price to those of neighbouring countries is an objective in itself. The capacity available at the borders at any given time is the primary determinant for this price.
JAMES MATTHYS-DONNADIEU, HEAD OF MARKET DEVELOPMENT AT ELIA“The Belgian electricity market is linked to markets in neighbouring countries via interconnectors. This means that we can always use the most efficient generating facilities to meet demand, regardless of whether they are in Belgium or abroad. The desired outcome is convergence be tween the Belgian electricity price and those of neighbouring countries.
Elia is playing an active role in design ing the electricity system of the future to ensure that it remains reliable, sustain able and competitive against the back drop of the energy transition. Our recent study ‘Electricity Scenarios for Belgium towards 2050’ is a tangible example of this.”
ELIA ANNUAL REPORT 2017 - 5150 ELIA ANNUAL REPORT 2017 We develop the electricity system and markets
# 3_ — CHIEF EXECUTIVE OFFICER OF VBO/FEB SINCE 2012 — VBO/FEB IS A MULTI-SECTOR EMPLOYERS’ ORGANISATION REPRESENTING 50,000 BUSINESSES
We develop the electricity system and markets
Given the growth in renewable energies and their highly volatile generation, greater flexibility is needed within the electricity system to main tain a constant balance between supply and demand. Digitalisation and the latest technologies offer market players new opportunities to optimise their electricity management by selling their surplus energy or temporarily re ducing consumption (demand flexibility). By opening up the market to new players and technologies, Elia aims to boost the security of supply, while also making market prices more competitive.
PATRICK DE LEENER, CHIEF CUSTOMERS, MARKETS & SYSTEM OFFICER AT ELIA“IN 2017, ELIA AND THE DISTRIBUTION SYSTEM OPERATORS CARRIED OUT A PILOT PROJECT TO INTEGRATE FLEXIBILITY AT THE DISTRIBUTION LEVEL INTO SYSTEM OPERATION. THE LAUNCH OF THIS COOPERATION IS VITAL AGAINST THE BACKDROP OF INCREASING RENEWABLE ENERGY AND THE ASSOCIATED VARIABILITY.”
Our ambitions
Towards an integrated market
Making transmission capacity available to market players across inter national borders is a source of added economic value for the community as a whole. It makes energy markets more ac cessible and thus more competitive, as there is less of a focus on national mar kets. Consumers can access the cheapest energy wherever it is available.
Harmonising electricity market rules across Europe


Initiated by the European Commis sion, the European network codes are drawn up on the basis of proposals by the European transmission system operators and are designed to provide the energy market with a common legislative frame work applicable to all Member States.

The European Union (EU) is keen to strengthen the strategies in place to make the pan-European energy market a reliable, competitive and low-carbon sector. Furthermore, each network code forms an integral part of the drive to cre ate a single energy market and to achieve the EU’s 20-20-20 goals.
Our expertise at the community’s service
Elia is an active member of a num ber of national and European working groups and gladly makes its expertise available to help plan the energy system of the future. We regularly conduct indepth studies to enable us to give sound advice about the electricity system’s needs. Moreover, Elia is highly custom er-oriented and sets up specialised work ing groups in order to gain a better insight into market players’ needs and require ments and to identify the best solutions.

OBJECTIVES
We give every player access to the energy markets, regardless of their size, the kind of technology they deploy and their role in the market, so that they can fully exploit the economic benefits:

— Redesigning the Belgian balancing market to encompass all kinds of technologies and market players, independently from the grid they are connected to
— Integrating Belgium into a wider European balancing market
CLIENT INFORMATION AND COMPLAINTS REQUESTS (BELGIUM)
Developing these cross-border balancing mechanisms requires greater cooperation and coordin ation at the national and supranational levels, as well as an appropriate legis lative framework. To achieve this, Elia ensures that every market player has transparent, non-discriminatory access to the grid.
Elia wants to facilitate further market coupling, both in terms of distribution and at European level. We give new play ers and technologies a chance by innovating in our systems and by introducing new market products.
“IN ADDITION TO AN AMBITIOUS CHANGE PROGRAMME ADAPTED TO THE RAPIDLY EVOLVING ENVIRONMENT, WE ALSO REFLECT ON HOW TO MANAGE THE SCHEDULED NUCLEAR PHASE-OUT BY 2025 AND THE POSSIBLE TRANSI TION SCENARIOS FROM A MARKET AND SYSTEM PERSPECTIVE.”
PASCALE FONCK, CHIEF EXTERNAL RELATIONS OFFICER AT ELIAELIA ANNUAL REPORT 2017 - 5352 - ELIA ANNUAL REPORT 2017
We develop the electricity system and markets
Number of information requests Number of Client complaints 250 200 150 100 50 0 2015 2016 2017 11 7 76 131 197 160
What we achieved in 2017
Real-time balancing on a day-to-day basis
To make sure the grid runs smooth ly 24 hours a day, the operators acti vate the regulation tools needed to en sure that the grid remains balanced at all times, which resulted in a grid reliability rate of 99.999% in 2017. They have access to reserves to manage the electricity grid, commonly referred to as ‘ancillary servi ces’. These reserves contribute to main taining the frequency and voltage on the grid, managing congestion and balancing generation and consumption in real time.
The control centre coordinates energy flows on the grids, in close cooper ation with international coordination cen tres (such as Coreso and TSCNET) and transmission system operators in neigh bouring countries. The reliability of the electricity grid and the country’s security of supply depend on their collaboration.
THERE ARE THREE DIFFERENT SERVICES FOR KEEPING THE GRID BALANCED:
Frequency Containment Reserve (FCR) or primary reserve
Activated upwards and downwards automatically and on a continuous basis, almost instantly (within 0 to 30 seconds), as required to stabilise the frequency of the European grid. In the event of a devi ation, all of Europe’s transmission system operators work together, enabling them to provide enough power to cover two concurrent serious incidents (e.g. the loss of two 1,500 MW generation units) with in 15 minutes. This reserve is supplied by generation units or offtake sites.
Automatic Frequency Restoration Reserve (aFRR) or secondary reserve
Activated upwards and downwards automatically and on a continuous basis, in a timeframe of 30 seconds to 15 min utes, as required to handle sudden imbalances in the area managed by Elia. It is supplied by generation units.
Manual Frequency Restoration Reserve (mFRR) or tertiary reserve
Can be activated upwards manual ly at Elia’s request. It is used to address a major imbalance in the area managed by Elia and/or to deal with congestion problems. There are several types of tertiary reserve and the reserve can be supplied by generation units or offtake sites.
Extension of the primary control market to include new technologies

On 1 May 2017, Elia introduced a new contractual framework governing the provision of the primary frequency control service (FCR or R1). This allows new tech nologies such as batteries and decen tralised generation to participate in grid balancing. This development is in keep ing with the multiannual development plan drawn up by Elia in 2016 in close col laboration with the relevant distribution system operators and market players, fol lowing changes to Belgium’s generating facilities.
Integration of non-CIPU units into the secondary reserve
Since mid-2016, Elia has been examining the feasibility of integrating units, other than large gas-fired genera tion units, into the secondary reserve and opening participation to units of various sizes, fuelled by diverse technologies (e.g. biogas, cogeneration, heat pumps).
In 2017, Elia carried out a pilot pro ject entitled ‘R2 Non-CIPU’ in collabora tion with Actility, EDF Luminus and Next Kraftwerke. The results of this project sug gested it would be beneficial for the aFFR


(automatic Frequency Restoration Re serves or secondary reserve) market to be opened up to non-CIPU flexibility. Elia will develop a new design proposal for the aFRR including a technical and economic assessment of energy transfer implemen tation. This will be presented for stake holder consultation in 2018.
Extension of the current secondary reserve market
Elia conducted a study on the pos sible extension of the current secondary reserve market. After presenting the dif ferent scenarios and undertaking a stake holder survey, it put forward an imple mentation proposal in early March 2017, based on market feedback.
Previously, the secondary market was restricted to certain scenarios: for day-ahead it was only open to CIPU units and, for intraday, only if those CIPU units suffered an outage.

After consulting stakeholders, Elia suggested opening up the secondary market to all units (CIPU and non-CIPU) and in all circumstances (outage or other wise) from 31 December 2017.
This opening of the market clearly adds value and will allow Belgium to be come one of the frontrunners in Europe in terms of the exchange of reserves.
Study on dynamic dimensioning of reserve needs
In October 2017, Elia unveiled a new method to ‘dynamically’ size balancing reserve needs in near-real time based on day-ahead predicted system conditions, including offshore and onshore wind power, solar photovoltaics, electricity de mand, power plant schedules and trans mission assets.
The study demonstrates that the proposed alternative methodology im proves the reliability and efficiency of re serve procurement, particularly in future systems with increasing renewable gen eration. The actual application of dynam ic dimensioning is subject to a follow-up study on dynamic (‘daily’) procurement of the tertiary reserve in 2018.
Study on the pricing methodology used for the settlement of activated balancing energy
Elia analysed the advantages and disadvantages of moving to a ‘paidas-cleared’ methodology earlier than planned under EU legislation. The new methodology aims to introduce a bet ter market dynamic. Elia also set out an implementation plan and undertook a cost-benefit analysis.
Based on an initial estimate, the study concludes that the new pricing methodology could be implemented for mFRR in the second half of 2019 at the earliest, and for aFRR in late 2020 at the earliest, provided that there is sufficient li quidity in the relevant markets. This esti mate is liable to change based on further analysis and a detailed project schedule, as well as other priorities set by Elia, CREG and other market players.
“OUR AIM IS TO OPEN UP OUR BALANCING MARKET FOR NEW PLAYERS AND NEW TECHNOLOGIES BY INNOVATION IN OUR SYSTEMS AND MARKET PRODUCTS. THEREFORE WE HAVE EMBARKED ON AN AMBITIOUS CHANGE PROGRAMME FOR THE BALANCING MARKET.”
KRISTIEN CLEMENT-NYNS, ANCILLARY SERVICES MANAGER AT ELIA
ELIA ANNUAL REPORT 2017 - 5554 - ELIA ANNUAL REPORT 2017
Primary reserve FCR 1 Secondary reserve AFFR 2 Tertiary reserve MFRR 3 We develop the electricity system and markets
Strategic reserve
WHAT IS IT?
The strategic reserve is a concept that was implemented for the first time during the winter of 2014-2015. It is de signed to address the structural shortage of installed generation capacity in Bel gium brought about by the temporary or permanent shutdown of power stations (for either economic or technical reasons). The reserve is intended to help maintain security of supply during the winter period.
Ahead of each winter period and on the instructions of the Energy Minister, Elia organises a call for tenders for power stations that have announced that they will be shutting down and for de mand-side managers.

The reserve capacity established may be activated during the period from 1 November to 31 March; it may not be used for any other purpose. Each year, strategic reserve demand is assessed for the following winter.
WHEN IS IT ACTIVATED?
The strategic reserve is activated where a ‘structural capacity deficit’ is identified (according to economic or technical criteria) based on market fore casts or other information available to Elia the day ahead of a given day or several hours in advance.
In 2017 the Belgian and European authorities have been in contact to in vestigate if the Belgian mechanism of strategic reserve is compatible with the applicable EU State aid rules, and in par ticular with the ‘Guidelines on State aid for environmental protection and energy 2014 - 2020’ (EEAG).
Even though there is not yet a final, public decision from the European au thorities, Elia and CREG have been for mally informed of the commitments that the Federal Minister of Energy has taken towards the European Commission with the aim of obtaining a positive final deci sion. To the extent possible, these com mitments have already been taken into account for the next winter period 20182019.
The strategic reserve for winter 2017-2018
In line with the Electricity Act, Elia conducts an annual probabilistic analy sis of Belgium’s security of supply for the next winter by 15 November. This analysis, together with the opinion of DG Energy, is an important element to be taken into ac count by the Federal Minister for Energy to decide on the need for a volume of strategic reserve. On 15 January 2018 the Federal Minister of Energy instructed Elia to constitute a reserve of 500 MW for this winter (2018-19).
The BidLadder project
ENABLING MARKET PLAYERS TO PUT AVAILABLE FLEXIBILITY ON THE MARKET

The DataHub project FACILITATING FLEXIBILITY EXCHANGES WITH DISTRIBUTION SYSTEM OPERATORS


“BIDLADDER ALLOWS SMALLER UNITS TO PARTICIPATE IN FLEXIBILITY. UNTIL NOW, THIS WAS ONLY POSSIBLE FOR UNITS WITH A MINIMUM CAPACITY OF 25 MW. BIDLADDER OPENS UP THE BAL ANCING MARKET TO THE DEMAND SIDE AND DECENTRALISED GENERATION, THEREBY LEVERAGING THEIR FLEXIBIL ITY. THIS IN TURN, MEANS GREATER LI QUIDITY FOR ELIA.”
SITUATION ON THE GRID DURING THE COLD SPELL
“
Kristof
BidLadder is a market platform set up by Elia that has been operational since September 2017. It allows all market players to offer their flexibility on a daily basis to keep the grid balanced, regard less of the voltage level they are connected to and the technology they use (gen eration or demand-side management). This means that smaller units can partici pate with a high degree of flexibility. Until now, only large generation units with an installed capacity of at least 25 MW could offer their available energy, where as smaller generation units and demand flexibility were excluded. The platform has been operational since September 2017 for customers connected to the Elia grid, and will be available for the distribu tion system in early 2018.
Elia will facilitate data exchange within BidLadder by means of the DataHub platform, developed in collabor ation with distribution system operators.
On 1 January 2018, Elia and the distribution system operators (DSOs) launched a joint platform called T-DSO DataHub for exchanging data between them. This is needed for the verification and settlement of the flexibility volumes activated at Elia’s request, as part of the ancillary services designed to manage grid balance. T-DSO DataHub enables all market players and grid users to offer flex ibility to Elia.
Its development follows the launch, in late June 2017, of BidLadder, a platform allowing market players to provide Elia with all the flexibility they have in their portfolio. To open BidLadder to the distri bution system, Elia and the DSOs needed a tool to facilitate these data exchanges. DataHub is that tool.
Extension of the flowbased method
Elia is currently working to extend the flow-based method to include intra day for the Central West Europe (CWE) region. In August 2015, the flow-based method was launched for only dayahead. Elia is also seeking to extend the flow-based formula for the Eastern Euro pean (CORE) regions, in order to comply with the guidelines set out in the network codes.
Up to that point, international elec tricity exchanges in the CWE region had been governed by the transmission capacity available at each border.
The flow-based model is based on a more detailed simulation of network components and enables capacity to be allocated by high-voltage connection rather than by border. This more complex, but more accurate system, provides mar ket players with more detailed informa tion and offers them a wider range of im port and export options.
HANS VANDENBROUCKE, HEAD OF THE BELGIAN MARKET MODEL TEAM AT ELIAThe need for strategic reserve for winter 2018-19 and outlook for 2019-20 and 2020-21 ADEQUACY STUDY FOR BELGIUM NOVEMBER 2017 ELIA ANNUAL REPORT 2017 - 5756 ELIA ANNUAL REPORT 2017
During the winter of 2016-2017, a period of cold weather in Belgium and France led Elia to consider activating the strategic reserve in mid-January 2017. In the end this didn’t happen as weather conditions in France improved. Working in close coordination with other European transmission system operators, Elia managed to maintain security of supply without having to activate the strategic reserve. In Belgium, the various market players made every effort to ensure optimal generating facilities and to keep their customer portfolios balanced.”
Sleurs, Head of Operations NCC at Elia We develop the electricity system and markets
The ENCODE project IMPLEMENTATION OF EUROPEAN NETWORK CODES
In Belgium, Elia launched the EN CODE project designed to implement the EU network codes at national level and, at the request of the federal energy au thorities, initiated consultations with mar ket players via the Elia Users’ Group on the main aspects associated with imple menting the codes.

The aim is to submit a proposal for the amendment of the Federal Grid Code in May 2018 and, later in the year other proposals, based on the network codes, to the relevant authorities. All these pro posal submissions will be preceded by public consultations organised by Elia.
The MARI and PICASSO projects
BALANCING MARKET INTEGRATION
Elia signed two Memoranda of Understanding in 2017 related to the in tegration of the balancing markets. The MARI and PICASSO projects anticipated the EU Guideline on Electricity Balancing coming into force.

The MARI project - In early April 2017, as part of the MARI project, 19 Euro pean transmission system operators (TSOs) signed a Memorandum of Under standing for the design, implementation and operation of a new platform for the exchange of balancing energy from Fre quency Restoration Reserves with manu al activation or mFRR (R3 - tertiary re serves).
The PICASSO project - In July 2017, as part of the PICASSO project, eight TSOs signed a Memorandum of Understanding for the design, implementation and operation of a platform for common activa tion of balancing energy from automatic Frequency Restoration Reserves or aFRR (R2 - secondary reserves). The TSOs en sured that market players were involved early on in the design phase of these in tegrated markets, with public consulta tions launched in late 2017 to gather input from market participants. Under EU regu lations, these platforms should be up and running no later than the end of 2021.
The iCAROS project COORDINATION OF ELECTRICAL INSTALLATIONS
In a rapidly changing environ ment, Elia is reviewing its processes for coordinating the electrical installations of grid users (currently governed by the CIPU contract). As part of this review, it launched the iCAROS project (Integrated Coordination of Assets for Redispatching and Operational Security) in 2017. This will enable the implementation of new oper ational data exchanges for the coordination of electrical installations and the management of congestion risks, as well as the new roles required by the Euro pean Guideline on Electricity Transmis sion System Operation.
Elia issued a design note in 2017, which it put out for consultation in early December. In 2018, it will publish a new version of this note taking into account the feedback from market players, with a view to preparing the implementation.
The Loftie project IMPROVING GRID SIMULATIONS
Running grid simulations requires even more advanced tools as well as a grid model management integrating forecasts from one day to ten years ahead. New data and IT architecture has been developed and implemented within Elia to enable the relevant departments to perform all their analyses in a more mod ern and flexible environment.
The Loftie project (Load Flow Tools and Insourcing of Expertise) was launched in 2014. The new PowerFac tory tool was phased into service in 2017. It enables the incorporation of changes in the business processes of the operational planning and grid development depart ments, namely the modelling of renewable generation and medium-voltage substations (DSOs), increased automation to enable more scenarios to be imple mented, and compatibility with the new ENTSO-E codes and standards.
Operational planning migrated to PowerFactory in several phases, starting with weekly planning in June 2017. Daily planning was migrated in November 2017.
The next goal for Loftie in 2018 will be to fully model renewable generation in operational planning’s security calcu
lations. This major change will make it possible to move towards the conditional weekly planning of multi-scenario outages, while improving the quality of the daily planning simulations.
Our expertise at society’s service STUDY ON THE FUTURE OF THE BELGIAN ENERGY SYSTEM

In a new study on the future of the Belgian energy system, published in Nov ember 2017, Elia calls on the Belgian au thorities to take swift action. ‘Electricity Scenarios for Belgium towards 2050’ argues that it is high time to make de cisions that will safeguard the Belgian energy system and the country’s welfare and prosperity. The rapid and fundamen tal changes brought about by the energy transition create new needs and require ments and there is the additional chal lenge of the 2025 nuclear exit required by law. In addition to the many challen ges, Elia’s study also describes the indus trial opportunities for Belgium as Europe’s ‘Energy Roundabout’.
Elia published the report to sup port policymakers working on an interfederal Energy Pact. It looked at both the short term (statutory closure of all Belgian power stations in 2025) and longer term (achieving the COP 21 climate standards by 2050).
The study triggered a lively public debate in Belgium and is still widely re garded as a landmark document. Among other things, Elia noted that the replace ment capacity for nuclear energy in 2025 would not come from nowhere and that 3.6 GW of flexible thermal power plants would be needed – with a support mech anism – to absorb the shock of the nucle ar exit.
The study also showed that addi tional interconnectors are a ‘no regrets’ option. They contribute towards the achievement of Belgium’s climate goals and offer the best guarantee for ensuring prices that are competitive compared to neighbouring countries. Additional inter connectors also bring industrial oppor tunities for our domestic generation mar ket: Belgium can establish itself as a first mover to realise the concept of the Energy Roundabout within a European context.
The future study was presented in detail at Elia’s annual Stakeholders’ Day on 17 November 2017. The report was dis cussed in advance with numerous market players and interest groups and enjoyed widespread support in the sector when launched.
“OUR STUDY WAS AN EYE-OPENER FOR BOTH THE SECTOR AND POLICYMAKERS. WE SHOWED THAT NEW CAPACITY WILL BE NEEDED IN EVERY FUTURE SCENARIO, INCLUD ING A PARTIAL NUCLEAR EXTENSION. BY DOING NOTHING, BELGIUM WOULD ALMOST AUTOMATICALLY END UP IN A DOOMSDAY SCENARIO FROM 2025, IN WHICH AT LEAST 4 GW OF NUCLEAR CAPACITY WOULD HAVE TO BE EXTENDED AT SHORT NOTICE OR THERE WOULD BE SERIOUS SUPPLY ISSUES FOR YEARS TO COME, RESULTING IN SIGNIFICANT ECONOMIC DAMAGE TO THE COUNTRY.”

We develop the electricity system and markets
“ELIA’S NEW CALCULATION PLATFORM, POWERFACTORY, IS FLEXIBLE AND WILL MAKE IT EASIER TO DEVELOP NEW PRO CESSES FOR COPING WITH FU TURE CHALLENGES RELATING TO GRID SECURITY OR CAPACITY CALCULATIONS (DYNAMIC AND VOLTAGE STABILITY, INTRODUC TION OF HVDC, ETC.).”
SILVIO FERREIRA, PROJECT MANAGER AT ELIAROXANNE VANDE ZANDE, GRID CODES AND REGULATED CONTRACTS MANAGER AT ELIA
Discover the online version on: NOVEMBER 2017 ELECTRICITY SCENARIOS FOR BELGIUM TOWARDS 2050 ELECTRICITY SCENARIOS FOR BELGIUM TOWARDS 2050 ELIA’S QUANTIFIED STUDY ON THE ENERGY TRANSITION IN 2030 AND 2040 ELIA ANNUAL REPORT 2017 5958 ELIA ANNUAL REPORT 2017
Rewenables Grid Initiative
Since 2011, Elia has been a member of the Renewables Grid Initiative (RGI), a coalition of environmental organisations (such as the WWF and Birdlife) and sys tem operators. Their shared aim is to gen erate consensus around the grid expan sion needed to integrate renewables, while respecting biodiversity and the en vironment.
In 2017, RGI organised a number of webinars and workshops on commun ity compensation measures and improv ing public acceptance by underground ing high-voltage lines. In addition, various workshops were held to help the NGOs understand how transmission system operators develop and expand their net works, which led to a greater appreciation of the many obstacles that TSOs face.
Global Energy Interconnection Development and Cooperation Organisation
In November 2017, the Elia Group, via Elia Grid International, joined the Global Energy Interconnection Development and Cooperation Organisation (GEIDCO), an international body based in China. GEIDCO facilitates and promotes the es tablishment of a global system of energy interconnections. It does this by compil ing development plans and proposals for technical standards with the help of in dustry experts.
The Elia Group wishes to contribute its expertise to this international initiative for the development of interconnections.
OUR COLLEAGUES IN ENERGY ASSOCIATIONS
Elia is committed to cooperating and maintaining good relationships with all market players. This is helped by the fact that some of our managers are members of sectoral organisations. Pascale Fonck, Elia’s Chief External Relations Officer, became an ENTSO-E Board Member in June 2017. Patrick De Leener, now Chief Customers, Market & System Officer at Elia, was CEO of Coreso until November 2016, while Jan Van Roost, formerly Head of Settlement, Metering & Data Reporting at Elia, has held the position of Coreso COO since August 2017. Cécile Pellegrin, Elia’s Head of Network Operations, has been Head of Development at Coreso since August 2017.


WHAT HAPPENED AT 50HERTZ ?
WindNODE
The WindNODE project got under way in January 2017 with an initial consortium meeting at 50Hertz’s Netzquartier build ing attended by all partners. WindNODE is a joint research project in which over 70 part ners are coming together to develop new decentralised and sustainable solutions for the energy transition. The goal is to efficiently integrate large quantities of renewable elec tricity into the energy system while keeping power grids stable. WindNODE will use the possibilities offered by digitalisation to create a smart energy system and allow the coordin ated operation of many different partners in a decentralised system.

Berlin Energy Transition Dialogue
In March 2017, Elia and 50Hertz were jointly represented at the third Berlin Energy Transition Dialogue, a German federal govern ment organisation. The Elia Group supported a number of sessions at the two-day event, where we demonstrated our experience in integrating renewable energy and explained how the transmission system needs to be modified to cater for this.
 BORIS SCHUCHT, CEO 50HERTZ


“RENEWABLE ENERGY SOURCES HAVE EVOLVED INTO A DOMINANT SOURCE OF ENERGY, PARTICU LARLY IN OUR CONTROL AREA. INNOVATION AND SMART GRID CONTROL ARE ESSENTIAL FOR EN SURING THAT RENEWABLE ENERGY IS INTEGRAT ED SAFELY AND EFFICIENTLY. WINDNODE COM BINES BOTH OBJECTIVES.”
Roundtable for Europe’s Energy Forum
On 18 October, 50Hertz’s CEO Boris Schucht took part in an open discussion in Brussels on the future operation of the European elec tricity system as part of the Clean Energy Package. In a joint effort with other European transmission system operators, the Regional Energy Forum (REF) model was presented to Maroš Šefcovic, the European Commissioner for Energy Union. These REFs could improve coordination between existing Regional Security Centres (RSCs) such as Coreso and TSCNET.

ELIA ANNUAL REPORT 2017 6160 ELIA ANNUAL REPORT 2017
We develop the electricity system and markets
How will Elia return our beach to its former glory once the cable works have been completed?
LEON INKEBERGHEMANAGER OF ICARUS SURFCLUB, ZEEBRUGGEThe beach and shoreline form the back drop to our surf club so they have to look pristine. Our members also use the beach a lot to practice their surfing and leave their kites on the sand. We’re very grateful that Elia has consulted us about the works and is completing them as quickly as possible. However, having a safe and clean beach again afterwards is just as important.
— KEEN KITESURFER FOR THE PAST SIX YEARS
— NEW MANAGER OF ICARUS SURFCLUB IN ZEEBRUGGE


“Ensuring that the beach looks its best after the works is a priority for us. This means carrying out the work to a high standard to prevent subsidence, and not leaving any waste behind. We will there fore dig the work area to make it level and sift the sand. We determine and dis cuss our working method in advance with stakeholders, in this case the surf club.”
EACH
MATHIEU DONCHE –NEMO LINK BE PROJECT MANAGER AT ELIAELIA ANNUAL REPORT 2017 - 6362 - ELIA ANNUAL REPORT 2017 We cooperate to strengthen our TSO position
# 4_
THE SURFACE AREA OF SUSTAINABLE CORRIDORS CREATED
YEAR SINCE 2015 STEVIN PROJECT LINES INTEGRATED IN THE LANDSCAPE 85 ha 21,824 m
We cooperate to strengthen our TSO position
Our ambitions
Elia’s activities have an impact on the country’s socio-economic development. As a key player in the energy system, Elia is committed to improving dialogue and coordination with the various market parties. It also aims to be a sustainable and responsible company that works hard to help reduce the ecological footprint of its operations and develop projects for the community.
Economy
Elia upgrades its grid to enable greater renewable integration and thus supports Belgium’s energy mix and the EU’s ambitions on renewables.

Employment
Elia aspires to be a sustainable em ployer concerned for the safety of all. To achieve this, it relies on a motivational and robust corporate culture that allows it to meet all the challenges of the energy sec tor in an agile way.

OBJECTIVES
We realise the grid of the future through proactive dialogue with a variety of stakeholders, based on mutual respect and empathy to come to the best societal and environmental solutions.

— Having a positive impact on society by realising further grid development enabling proper integration of renewable energy in the EU grid of the future
Environment
Elia incorporates more environ mental targets into its activities in order to make the best possible contribution to the energy transition and promotes bio diversity around its facilities.
Society
Elia seeks to upgrade its grid in a spirit of dialogue and cooperation with lo cal residents. Its electricity system must be reliable and affordable, and must be maintained and developed in the interest of the community.
— Expanding dialogue with stakeholders and keeping them informed throughout the entire duration of projects
— Performing the necessary studies and analyses and acting as an advisor to the different governments with regard to the realisation of the energy transition in the interest of society
Elia wishes to take account of soci ety’s needs and concerns at every stage of its infrastructure pro jects. We approach our stakehold ers with empathy and integrity. To this

end, Elia has developed a policy defin ing its ambitions and actions on sustain able development. The policy focuses on four main areas: economy, environment, society and employment.
“WE STRENGTHEN DIALOGUE WITH ALL STAKEHOLDERS AND OUR INTERNA TIONAL COLLEAGUES TO PUT FORWARD SOLUTIONS THAT ARE IN THE INTEREST OF SOCIETY.”
ILSE TANT, CHIEF PUBLIC ACCEPTANCE OFFICER AT ELIA
ELIA ANNUAL REPORT 2017 - 6564 - ELIA ANNUAL REPORT 2017
We cooperate to strengthen our TSO position
What we achieved in 2017

Building a relationship on trust and dialogue
MEETINGS WITH LOCAL RESIDENTS AFFECTED BY INFRASTRUCTURE PROJECTS
COOPERATION WITH CUSTOMERS AND PARTNERS
BIODIVERSITYSTEVIN LANDSCAPING INTEGRATION
Informing and listening to residents impacted by its infrastructure projects is a priority for Elia. As such, the transmis sion system operator organises regular information sessions in partnership with affected municipalities. These sessions inform local residents about the impacts, objectives and challenges of upcoming works, as well as answering any questions they may have. Newsletters, websites and brochures are also used to ensure optimal communication throughout the works.
INVITING LOCAL RESIDENTS TO LEARN ABOUT WHAT WE DO
Elia is committed to maintaining good relations with its customers and its partners, the distribution system oper ators (DSOs). To this end, it adopts a num ber of approaches.
Naturally, it has key account managers who deal with these parties dir ectly on a day-to-day basis. In addition, events and meetings are organised to keep them informed of Elia’s activities, the various products it offers and how it sees the future of the grid in Belgium.
TargetStatus
Elia is keen to lessen the impact of its facilities on the landscape and plants large numbers of trees and shrubs on the land it owns. For more information about Elia’s sustainability measures, see the annex.
In May, Elia held an open day for the public at its brand new Stevin high-voltage substation in Zeebrugge. The visit was part of the Open Site Days, an initiative by the Belgian Construction Confederation which sees a number of projects opened to the general public. It was the first time Elia had taken part in the event. With over 2,000 people attending, the day proved such a suc cess that Elia plans to initiate another pro ject in 2018. For more information about Stevin, see page 43.
PHILIPPE CORNELIS, PUBLIC ACCEPTANCE OFFICER AT ELIA
“OUR AIM IS TO INVOLVE CITIZENS AND LOCAL AUTHORITIES AS EARLY AS POSSIBLE IN OR DER TO ACCOMMODATE THEIR NEEDS AND PRIORITIES. IT’S ALSO IMPORTANT TO MAINTAIN THE CLOSEST POSSIBLE CONTACT THROUGHOUT THE PROCESS SO THAT WE CAN REACT AS QUICKLY AS POSSIBLE.”
DIALOGUE AT THE HEART OF THE STEVIN PROJECT

Elia informed and involved hundreds of stakeholders at each stage of the Stevin project, from the eight municipal administrations through to local residents. In other words, it implemented the Stevin project in a way that took its surroundings into account. So how do local mayors feel about the project now?

Renaat Landuyt (Mayor of Bruges)
“The additional measures that Elia proposed were key to reaching a compromise. The Stevin substation blends in as well as it can and is surrounded by vegetation. The city council is happy with this solution as it allows us to protect our residents, while also enhancing their living environment.”
Joachim Coens (Mayor of Damme)
”Damme places a high value on the quality of its surroundings. We’re pleased that we were able to work with Elia to find a solution for those residents who were still being impacted visually. They were able to request free planting of vegetation to reduce the visual impact. The town council felt this was a very constructive way forward.”
Marleen Van Den Bussche (Mayor of Maldegem)
”Elia was always willing to reach a mutual agreement on a suitable route. We hope that it will continue to engage with us on a permanent basis as this is the best guarantee for the well-being of Maldegem’s residents.”

SCHOOLS’ DAY AT THE STEVIN SUBSTATION
On Friday 5 May, Elia organised a Schools’ Day at its Stevin site in Zeebrugge. The initiative helped to raise awareness among future generations about changes in the energy system. The unique experience of visiting a new, high-voltage substation proved a hit with students and teachers alike.


ELIA ANNUAL REPORT 2017 - 6766 ELIA ANNUAL REPORT 2017
We cooperate to strengthen our TSO position 21 824 12 000
ELIA’S USERS’ GROUPS
The Users’ Groups are specific dis cussion groups comprising representa tives of grid users, partner DSOs and other market players. They enable Elia to dis seminate information to market players and to consult them on specific issues relating to the operation of the electri city market. The Users’ Groups can convey views and problems to the relevant minister, administrative authority or regu lator, or undertake other initiatives. Three working groups are active: System Operation, Belgian Grid and European Market Design. Ad hoc groups may also be set up to address more specific topics.
Elia carries out a satisfaction survey every other year to gather feedback on its services from its customers and partners. This survey is a very important tool for Elia to find out about expectations and areas for improvement. The next one is due in late 2018.
In late June, CREG set the vari ous targets that Elia will be encouraged to achieve in 2018 within the framework created by the Tariff Methodology and left to CREG’s discretion. Among other things, the targets aim to promote a bet ter match between supply and demand.
CREG adopted a decision on the tariff balances for 2016 following Elia’s tariff report.
COOPERATION WITH REGULATORS
CREG
In late 2017, CREG approved a revision of all the levies that Elia receives in connection with its public service obli gations. The revised levies have been applied from 1 January 2018. The levy for Walloon green certificates was main tained at its existing level by freezing a certain volume of certificates in late sum mer 2017.
In the field of ancillary services, CREG granted approval for the method that Elia has developed to gauge the volumes of ancillary services that it will require to manage the electricity system safely and reliably.
CREG also adopted a series of deci sions relating to the integration of the European energy markets, in particu lar the Common Grid Model, as well as regional requirements for harmonised allocation rules and long-term transmission rights for the CORE Region. It also addressed the single allocation platform and its cost-sharing methodology.
The rules on the operation of the balancing market were amended to open up the primary reserve market to new technologies and to open up non-re served tertiary control power to non-CIPU technical units.
In late January, CREG approved the changes made to the Access Responsible Party contract, allowing the participation of free bids for tertiary energy control for non-CIPU technical units (BidLadder pro ject) among other things.
VREG
In 2017, the Flemish Electricity and Gas Regulatory Body, VREG, was required to approve the changes made to the Access Responsible Party contract. VREG also approved the Investment Plan that Elia prepared in order to develop the net works it operates at voltage levels of 70 kV and below, which is in line with the regula tory obligations incumbent on it as a local transmission system operator in Flanders.
CWAPE
The Walloon Energy Commission, CWaPE, approved the Adaptation Plan prepared by Elia for the development of the local transmission network in the Walloon Region. In addition, CWaPE and Elia exchanged information within the framework of the operation of the Walloon green certificates market and, more specifically, in the areas in which Elia has obligations.
BRUGEL
The Brussels Energy Regulator, Brugel, issued a favourable opinion on Elia’s Investment Plan for the regional transmission network that Elia operates in the Brussels Region.

GO15 ANNUAL MEETING IN BRUSSELS
The Elia Group organised GO15’s 2017 Annual Meeting, which took place in Brussels from 22 to 24 October. GO15 is an initiative launched by the world’s 19 largest system operators, which account for 70% of global electricity demand and provide electricity to 3.4 billion users on six continents. The Annual Meeting was an opportunity for the CEOs of participating TSOs to discuss the future of power grids and reaffirm their commitment to facilitating the energy transition.

INTERNATIONAL COOPERATION
Elia and 50Hertz are active mem bers of various international organisa tions that work to promote the security, sustainability and reliability of the world’s electricity grids.
ENTSO-E
The European Network of Transmis sion System Operators for Electricity (ENTSO-E) represents all European Union operators and other transmission sys tem operators that are connected to the European electricity grid. ENTSO-E acts as a point of contact for bodies such as the European Commission and the Agency for the Cooperation of Energy Regulators (ACER) for matters concerning technical problems and market-related issues.
CORESO
The regional technical coordination centre ‘Coordination of Electricity System Operators’ (Coreso) brings together vari ous European transmission system oper ators with a view to enhancing the oper


ational security of grids in Central West Europe. The development of intraday markets has triggered a rise in cross-bor der electricity flows. Coreso also strives to improve the region’s integration of renew able energy generation by exchanging data and expertise.
EPEX SPOT SE
Elia has a minority stake (17%) in the holding HGRT 1 which is a shareholder (49%) in the European Power Exchange SE. EPEX SPOT manages a number of electricity trading platforms, mainly in the Central West Europe region (i.e. Germany, France, the United Kingdom, the Nether lands, Belgium, Austria, Switzerland and Luxembourg). These markets account for 50% of Europe’s electricity consumption.

GO15
The Elia Group is a founding mem ber of GO15, a voluntary initiative that brings together the world’s 19 largest transmission system operators. The organisation represents 3.4 billion con sumers on six continents and draws up joint action plans designed to improve the security and reliability of the global electricity grid.
“ELIA ALSO ORGANISES A NUMBER OF ANNUAL EVENTS TO INFORM GRID USERS, OUR PARTNERS AND STAKEHOLD ERS MORE GENERALLY ABOUT OUR STRATEGY, ACTIVITIES AND PRODUCTS. THESE INCLUDE THE STAKEHOLDERS’ DAY, ARP DAY FOR ACCESS RESPONSIBLE PARTIES, AND CUSTOMERS’ DAY FOR CUSTOMERS DIRECTLY CONNECTED TO ELIA’S GRID AND OUR PARTNER DSOS.”
RAPHAËL BOURGEOIS, KEY ACCOUNT MANAGER AT ELIAHGRT stands for Holding de Gestionnaires de Réseau de Transport, a holding company com prising Amprion, APG, Elia, RTE, Swissgrid and TenneT.
ELIA ANNUAL REPORT 2017 - 6968 ELIA ANNUAL REPORT 2017
SATISFACTION SURVEY We cooperate to strengthen our TSO position
1..
Helping community projects
SUPPORTING PROJECTS OUR EMPLOYEES ARE INVOLVED IN
Any Elia employee involved in a community or charity-run project can request a contribution from Elia. The contribution is worth €250 and can be applied for once a year. Elia donated a total of €4,000 to 16 of these projects in 2017. Elia supported initiatives to pro vide meals for young refugees, construct new buildings for the Scouts and run arts workshops in a children’s hospital, amongst others.
HELPING YOUNG REFUGEES GET INTO WORK
In 2017, Elia took part in a train ing scheme for young refugees, ‘Rising Youth’, in partnership with the Flemish employment agency VDAB and IRIS Anticorrosion, a company specialising in the condition and maintenance of indus trial production sites.
“24 young refugees received train ing under the Rising Youth scheme, and 23 of them went on to get jobs. This is something we’re extremely proud of. In December 2017, the project won the Best Sustainable Partnership Award at an event organised by The Shift, the Belgian network association on sustainability. We intend to build on this momentum by organising another training session in spring 2018.” Valérie Legat, Environmental Expert at Elia
TEACHING YOUNG PEOPLE ABOUT THE CHALLENGES OF THE ENERGY TRANSITION


In October 2017, the system oper ators Elia, Eandis and Infrax launched ElectriCITY, a free educational pack for children aged 10 to 14. The pack aims to make young people aware of the import ance of electricity and the rational use of energy. In 2018, Elia will finalise the German and French versions with the dis tribution system operators in Brussels and Wallonia.
Partnering with experts
Elia is aware of the importance of taking advice from experts to boost the sustainable development of its activities. It therefore forges partnerships with organi sations that can guide it in its sustainable and socially responsible choices.
COLLABORATING WITH BE PLANET TO MAKE OUR ACTIONS MORE SUSTAINABLE
In February 2017, Elia became a partner of Be Planet, a ‘public utility foun dation’ (fondation d’utilité publique/sticht ing van openbaar nut). Be Planet supports innovative citizens’ initiatives that have a beneficial environmental impact and that could play a role in the energy transition.
IGOR LEFEBVRE, ENVIRONMENT MANAGER AT ELIA
“BE PLANET’S MISSION DOVETAILS PERFECTLY WITH OUR SOCIAL ROLE AS A GRID OPERATOR. BE PLANET HAS THE POTENTIAL TO HELP US BRIDGE THE GAP WITH LOCAL NET WORKS AND TO WORK BOTTOM-UP ON ENHANCING BIODIVERSITY AND ENERGY EFFICIENCY.”
Following a call for projects organised for Elia by Be Planet, six pro jects were selected:
— Bûûmplanters (focusing on biodiversity in Brussels),
— ‘Maximilian Park’s Farm’ (training the public to reuse waste and consider bio energy solutions),
— ‘Days Without Meat’ (raising partici pants’ awareness of their impact on the climate),
— ‘Terre@air’, (educating the public about sustainable energy),
— SeaWatch-B (addressing biodiversity in a maritime environment)
— ‘Samenwerking voor Agrarisch Landschap’/ the ‘Cooperation for Agricultural Landscape Association’ (dealing with reusing wood waste). These organisations were selected in con nection with Elia infrastructure projects to create and support environmental and social initiatives in the regions where Elia operates.
Reducing the impact of our activities
In addition to partnerships with organisations, Elia also works to minimise the impact of its activities on the environ ment, both in its activities in the field and in its administrative buildings.
GREENPULSE: FOR STRUCTURED ENVIRONMENTAL MANAGEMENT


In 2016, Elia set up an environ mental governance programme called Greenpulse to make a lasting contribu tion to the energy transition. Greenpulse defines Elia’s environmental mission and responsibility, its environmental priorities, and the applicable policies and proced ures. A three-year action plan was drafted in order to implement these changes. In time, the Greenpulse programme will enable Elia to establish an integrated environmental management system within the company.
SOIL STUDIES AND REMEDIATION
Elia has developed a new soil management policy. Its aim is to draw up an inventory of the soil condition of land belonging to Elia in the Walloon and Brussels regions. This will enable environ mental risks and the associated costs to be managed more effectively and a schedule of priorities to be drawn up in accordance with existing and future legislation. This policy will be amended in the Walloon Region in 2018, in response to likely changes in legislation.
NOISE MANAGEMENT
Elia’s facilities should not generate noise pollution. They are governed by acoustic standards, varying from region to region, which must be respected. Noise pollution can be caused, for example, by transformers in high-voltage sub stations, high-voltage lines and pylons. Underground lines do not make any noise.
In addition, noise studies are always carried out upstream of Elia’s infra structure projects to ensure that the stan dards are not exceeded.
“ELIA’S ENVIRONMENTAL POLICY ON NOISE AIMS NOT ONLY TO COMPLY WITH CURRENT LEGISLATION BUT ALSO TO MINIMISE NOISE POLLUTION, WHICH CAN SOMETIMES BE REPORTED BY PEOPLE LIVING NEAR OUR
ELIA ANNUAL REPORT 2017 - 7170 ELIA ANNUAL REPORT 2017
FACILITIES.” VALÉRIE JADOT, ENVIRONMENTAL EXPERT AT ELIA FLEMISH ENERGY MINISTER PLAYS ELECTRICITY The Flemish version of ElectriCITY was unveiled on 17 October 2017 during study days for teachers at Technopolis in Mechelen. Flemish Energy Minister Bart Tommelein came to support the initiative and was soon trying it out for himselfwith great enthusiasm! We cooperate to strengthen our TSO position CHARITY PROJECTS SUPPORTED 2015 2016 2017 1611 €2,750 €4,500 €4,000 18 SOIL STUDIES CARRIED OUT NOISE STUDIES CARRIED OUT 2014 2015 2016 2017 2015 2016 2017 19 32 10 14 10 21 18 - Number of employees who proposed a charity project - Total budget invested to support charity projects
SF 6
SF6 gas has been used for over 30 years as an electrical insulator in high-voltage devices, including gas-insu lated switchgear (GIS). GIS is often used in densely populated areas because it is much more compact when compared to traditional switchgear which uses air as an insulator.
Elia has developed an investment and maintenance policy to reduce the risk of SF6 leakage. Manufacturers must guarantee a very stringent maximum per centage of SF6 loss throughout the life time of the facilities. The maintenance policy aims to keep operations involving compartments filled with SF6 to a min imum. The volume of SF6 gas installed on the Elia grid (36 kV to 380 kV inclusive) is 98 tonnes.
Consumption of SF6 gas (as a replacement and as a top-up in the event of a leak) is closely monitored using a sys tem that tracks each cylinder of SF6 The SF6 leak rate for all Elia facilities was 0.59% in 2017.
ELECTRIC AND MAGNETIC FIELDS
The electric and magnetic fields given off by high-voltage infrastructure have a very low frequency (50 Hz). Elia is very much aware of local residents’ con cerns over the potential health risks posed by electromagnetic fields, and as such keeps them informed as much as possible.
Around 78 measurements were per formed in the field in 2017 at the request of local residents, and approximately 30 requests for information were handled.
Upon request, Elia offers free measurements of electromagnetic fields at properties close to its facilities. For more information, see the annex.
BBEMG PRESENTS FINDINGS ON ELECTROMAGNETIC RADIATION
The Belgian BioElectroMagnetics Group (BBEMG) held a seminar on 22 September 2017 to present the findings of its ongoing research into electromagnetic radiation. Such seminars are held every four years. Once again, the same conclusion was reached: there is no proof that magnetic fields have an effect on health but the research cannot entirely rule it out.
“We continue to cooperate fully with research into the possible impact of magnetic fields. We know that many people living near high-voltage lines wonder whether this has implications for their health. We have to take this into account and it is therefore in everyone’s interest that further scientific research is carried out.” Vincent Du Four, Environmental Expert at Elia
VALÉRIE LEGAT, ENVIRONMENTAL EXPERT AT ELIA

STRIPPING AND PAINTING OF PYLONS
As part of its facility maintenance activities, Elia regularly (every 15 years on average) strips and paints its pylons to protect them from corrosion. It subcon tracts this work to companies specialised in painting.

Elia’s grid still features a number of black steel pylons coated with lead paint; after all, lead paint treatment was very common in the past. To prevent lead dust or lead chips from spreading when the paint is stripped off the pylons, the pylons are wrapped up in tarpaulins before work begins. Once the pylons have been stripped, the tarpaulins are removed and the pylons are painted in the open air.
The paints used nowadays meet the highest environmental standards. When work is complete, Elia and its subcontract ors jointly inspect the ground around the pylons to make sure that their activities have not polluted the surrounding area.

CARBON ASSESSMENT
Elia has been conducting a carbon assessment since 2010 to identify direct and indirect emissions from its activities and is taking steps to reduce greenhouse gas emissions from its activities.
Elia has set a target of reducing emissions related to mobility and building consumption by 20% compared to 2010. It aims to:
reduce the carbon impact of mobil ity by, among other things, encouraging decentralised work (teleworking or sat ellite offices), promoting public trans port over cars, giving training in ecod riving and incorporating clean vehicles with low CO2 emissions into its fleet;
reduce the energy consumption of its administrative sites by conducting regular energy audits and integrating sustainability into day-to-day building management.
Developing a grid that allows the integration of renewable energies has a positive impact on the quality of the energy mix and will therefore be benefi cial in terms of loss-related emissions.

CARBON ASSESSMENT
“IN ADDITION, ELIA IS ROLLING OUT A PRO GRAMME TO MEASURE AND MONITOR CON SUMPTION AT HIGH-VOLTAGE SUBSTATIONS AND IS EXPLORING WAYS TO REDUCE CO 2 EMISSIONS FROM ANCILLARY-EQUIPMENT LOSSES AT SUBSTATIONS. ELIA IS THEREFORE DOING EVERYTHING IT CAN TO REDUCE SF 6 LEAKS.”
More details can be found on the annex.
Please note that these measurements are performed on third-party requests received at the contact centre
FOLLOW-UP OF REQUESTS FOR INFORMATION CONCERNING ELECTROMAGNETIC FIELDS 1
ELIA ANNUAL REPORT 2017 - 7372 - ELIA ANNUAL REPORT 2017
82% SCOPE 2 ndirect emissions energy consumption 5% SCOPE 1 D irect emissions 13% SCOPE 3 Other indirect emissions We cooperate to strengthen our TSO position
1.
Received Handled 2015 2016 2017 80 54 56
ELIA AWARDED ‘AWARENESS’ STATUS BY CDP

Elia completed the Carbon Disclosure Project (CDP) questionnaire for the first time in 2017. CDP is an organisa tion that evaluates companies’ environ mental measures. Elia was awarded a C classification (‘Awareness’). The assess ment shows that Elia has started to imple ment changes in its strategy by reducing greenhouse gas emissions or identifying risks and opportunities.
LIFE BIODIVERSITY PROJECT DELIVERS ITS CONCLUSIONS


The LIFE Elia-RTE project, which was launched in September 2011 with funding from the European Commission and the Walloon Region, delivered its conclusions in late December 2017. Aimed at trans forming the corridors under high-volt age lines into eco-corridors, the project exceeded its initial objectives by some margin. The corridors beneath high-volt age lines are now no longer considered as areas of no interest but rather as places in which local biodiversity can flourish. In view of these positive results, Elia decided to launch a five-year follow-up project, LIFE 2, but this time without any external funding.
In the past, trees were cut down and vegetation shredded. Now, Elia plants small trees, creates ponds or brings in sheep to graze the vegetation naturally. This method presents no risk to the grid or wildlife and encourages local fauna and flora, which are gradually reclaiming the land.
LIFE PROJECT EXTENDED TO FLANDERS
As it was co-funded by the Walloon Region, the LIFE project was initially only implemented in Wallonia. However, Elia has decided to extend the concept to Flanders by financing biodiversity measures itself. It has also allowed a shepherd to use some of the land under the 380 kV Zutendaal-Maaseik line. The area is now grazed by around 250 sheep, which help to manage the vegetation.

LANDSCAPING THE SPACE
BENEATH PYLONS
Keen to adopt a sustainable method for managing its pylons while strength ening the ecological network, Elia asked non-profit organisation Faune & Biotopes to implement biodiversity enhancement measures along the high-voltage line between Gramme and Achêne. Some 32 native shrub species and seven wild flower meadows were planted along the 70-pylon section in 2016.

The choice of landscaping at each pylon base is a compromise between bio diversity, landscape and the associated cost. Some pylons cannot be enhanced in this way, such as those situated along a boundary or hedge and those in grazed meadows. In any case, their location means that no additional boost to bio diversity is needed.
PROTECTING BIRDS FLYING NEAR OUR LINES
Elia wants its high-voltage overhead lines to have as little negative impact on birdlife as possible, in line with its environ mental policy aimed at preserving and enhancing biodiversity in Belgium. It has therefore developed a bird protection policy comprising a number of focal areas.

Installing bird markers
In 2015, a joint study by Elia, Natuurpunt, Natagora, Vogelbescherming Vlaanderen and the Flemish Institute for Nature and Forest Research (INBO) found that 3.4% of Elia’s network of over head lines was hazardous to birds. This is because some high-voltage lines are almost invisible to flying birds.
Based on precise mapping of the areas most at risk, Elia drew up an action plan to reduce the risk of bird mortality by installing bird markers. These spring-like devices are fitted on the lines and con siderably reduce the risk of collision.
Installing nest boxes on our facilities
Elia places nest boxes on some of its facilities to provide secure nesting places to help to preserve endangered species. The birds’ natural nesting periods are taken into consideration when installing these boxes.
Reducing nuisance caused by large flocks of birds
Where possible, Elia reduces the noise pollution caused by birds that sometimes congregate in large numbers on our facilities. Such animal behaviours are not always easy to control and also cause problems for Elia, such as paint cor rosion due to excrement.
Felling and pruning trees and bushes
When trees and bushes near its facilities need to be felled or pruned, Elia takes care to do so at the correct time of year to limit the disruption to bird habitats.
“AS WELL AS ENHANCING AND RE SPECTING LOCAL BIODIVERSITY, THE LIFE PROJECT ALSO SIGNIFICANTLY RE DUCES COSTS AND DIRECTLY CONTRIB UTES TO BETTER ACCEPTANCE AND INTEGRATION OF OUR LINES IN THEIR ENVIRONMENT.”
JOHAN MORTIER, LIFE PROJECT MANAGER AT ELIA
ELIA ANNUAL REPORT 2017 - 7574 - ELIA ANNUAL REPORT 2017
OF BIRD PROTECTION SINCE 2016 13.62 km We cooperate to strengthen our TSO position NUMBER OF SHRUBS PLANTED AS PART OF LIFE 2015 2016 2017 34,000 65,000 71,500
A SUSTAINABLE AND ECO-FRIENDLY WATER TREATMENT SOLUTION AT MONNOYER

As part of its commitment to sustainable buildings, Elia has developed an autonomous, sustainable and environmentally friendly solution for wastewater treatment at its Monnoyer site. For the site’s drainage system, which was virtually non-existent, it created a 1,700 m² pool complete with vegetation, which serves as a storm basin, a haven for biodiversity and a lagoon. A reed bed ensures natural purification of wastewater. There is also a rainwater recovery tank, which reduces the amount of mains water used.
“ELIA ALSO GIVES A SECOND LIFE TO ITS USED IT EQUIP MENT BY PARTNERING WITH SCHOOLS AND OTHER INTERESTED ORGANISATIONS.”
SUSTAINABLE-BUILDING POLICY

With regard to its buildings, Elia fol lows a policy of sustainable development and respect for the environment. New Elia buildings (Créalys and Monnoyer) comply with sustainable-building prin ciples as certified under the Building Research Establishment Environmental Assessment Method (BREEAM). This cer tification is based on nine analysis criteria (management, health and well-being, energy, transport, materials, waste, water, land use, ecology and pollution) and is the benchmark standard when it comes to sustainable construction.
A policy of sorting and reducing waste is also in place at each of Elia’s administrative sites. The company seeks to reduce the amount of paper it uses and has opted for fair trade and/or organic food in all of its canteens.
BEEHIVES ON ELIA SITES
In keeping with its sustainable building-management policy, Elia has two beehives at its Monnoyer site. Once a year, the honey harvested from the hives is sold to staff and the proceeds are donated to a good cause. Elia will set up three bee hives at its Créalys site near Gembloux in 2018, and in 2019 it will be the turn of the Merksem site to welcome bees.

As well as doing its bit to help bees, Elia is also involved in analysing air qual ity in Brussels. In late 2016, the company BeeOdiversity, which helped Elia set up its beehives, teamed up with Elia and a number of other Brussels-based com panies to take an inventory of biodivers ity and pollution in the Belgian capital. The results of the analysis are available on BeeOdiversity’s website.
WASTE MANAGEMENT
Elia has adopted a sustainable waste sorting policy that relies on the responsible behaviour of its employees. At its administrative sites, it has set up a sorting system facilitated by cen tralised islands, in which the staff restau rants participate. These sites also operate a comprehensive waste reduction policy, including measures to reduce excessive packaging, cut down on paper towels in the toilets and eliminate plastic cups in coffee machines. Plastic cups alone used to generate 3.3 tonnes of waste each year.

At its technical sites, Elia created two new waste facilities in 2017, ensuring optimal storage of all types of waste, including hazardous materials. A further four such facilities are planned. By taking these measures, Elia aims to guarantee high-quality sorting of each type of waste and to ensure that where possible, waste is recycled or reused.
PROMOTING SUSTAINABLE FOOD
As of September 2017, Elia’s new catering contract stipulates the introduc tion of the Good Food label, which helps businesses in the Brussels-Capital Region to serve sustainable food in their res taurants. The underlying reason for the label is that Elia wants to offer its employees sustainable food that adheres to its environmental, ethical and health com mitments. Elia therefore favours organic, local and seasonal produce, products with minimal packaging and/or products that are part of a fair trade scheme.

 PIERRE VAN BAMBEKE, IT INFRASTRUCTURE & OPERATIONAL SERVICES MANAGER AT ELIA
ELIA ANNUAL REPORT 2017 - 7776 - ELIA ANNUAL REPORT 2017
We cooperate to strengthen our TSO position 2015 2016 2017 3,127 1,750 IT EQUIPMENT GIVEN A SECOND LIFE (K g ) OFFICES OWNED BY ELIA (10 BUILDINGS) PRE-CERTIFIED BREEAM BUILDINGS CERTIFIED BREEAM BUILDINGS 1 1 (1) Elia also hires an office building. 9,012
WHAT HAPPENED AT 50HERTZ ?
50Hertz accepts its social responsibility and feels an obligation to support the common good. This includes active commitment to environmental and climate protection in our sphere of activity.
50Hertz protects flora, fauna and biodiversity, uses natural resources conservatively and keeps the energy consumption and emissions of our activities as low as possible.
Dialogue with stakeholders
GRI 102-43
Transparent and proactive dialogue with our stakeholders concerning grid development and the enhancement of existing grid capacity is very important to 50Hertz.
Dialogue with stakeholders begins at a very early planning stage. This includes consultation on the network development plan, as well as on grid reinforcement and expansion projects. Info-markets, district conferences, planning forums, expert workshops, theme-specific bro chures or freephone numbers are essential components of civic participation.
In 2017, Dialog Mobil received the “Good Practice of the Year Award” from the Renewables Grid Initiative (RGI). With the “Dialog Mobil”, 50Hertz informs local residents of cable construction projects in the affected regions and gives them the opportunity to get involved.

Environmentally conscious player
The development of the high-voltage grid is necessary for transporting steadily increasing amounts of renewable energies over long dis tances. 50Hertz works every day to keep the impact of its activities on people and nature to a minimum, from the reinforcement of its grid to its administrative activities. This is demon strated by the following two examples.
Grid losses
In 2017, grid losses amounted to 2.4 TWh. The average grid losses of the extra-high voltage level were 231.7 MW and those of the sub station were 43.5 MW. 50Hertz is rolling out new techniques which are better suited than conventional technology.
SF6
Since 2005, 50Hertz has been following the “Voluntary Commitment of SF6 Manufacturers and Users”. Its aim is to reduce the loss rate measured in the total stock from 0.8 percent in 2004 to 0.6 percent in 2020.
50Hertz achieved the reduction of the loss rate far below 0.6% already in 2017. The exact loss rate in 2017 was at 0.06%.
Protection of birds
High-voltage lines affect bird life but 50Hertz is making great efforts to minimise this impact.
In 2017, a new species-specific method was developed for the systematic determination of the effects on the species population in order to identify more targeted precautionary and compensatory measures. The installation of 30 km of bird protection markers in the existing network is planned for 2018.
50Hertz actively supported the establishment of a hotline developed by NABU, a German environmental association, so bird accidents with high-voltage lines can be reported and analysed.


50Hertz also carried out a comparative study on the effectiveness of spiral and flap markers and also installed cameras on two volt age fields of the electricity grid in a bird sanc tuary. All measures and projects are designed to prevent future collisions at such locations with even greater precision.
In 2017 the 50Hertz conference “Bird pro tection on extra-high voltage overhead lines - methods, scope and feasibility” took place. More than 80 representatives of public authorities, environmental associations, infra structure planners and experts exchanged views on how bird protection can succeed without endangering energy turnaround projects.
30 KM OF BIRD PROTECTION MARKERS PLANNED IN 2018
ELIA ANNUAL REPORT 2017 - 7978 - ELIA ANNUAL REPORT 2017
30 km
We cooperate to strengthen our TSO position
I used to work for Elia’s predecessor CPTE. In the first few years, I mostly worked in IT, dealing with all the technical aspects of national dispatching. When they asked me to take over as head of the regional dis patching centre, I felt completely outside my comfort zone. After that, I had the opportunity to work in the Infrastructure Division and in the field with Assets. All these changes meant that I got to know different Elia departments very well. It gave me a complete over view of the company. My latest challenge is setting up the Assets New Technologies Implementation De partment. We’re responsible for ensuring that Assets has the skills and expertise needed to launch and manage new technologies. My career to date has been extremely varied. But is that true for other col leagues too?
“At Elia, we have a system of career and competency management that encourages people to develop as in dividuals and thereby improve their performance. They work with their line managers to identify the right training for them. We also discuss their shortand longer-term career ambitions. Our talent team promotes mobility among executives to ensure cross-functional ity and cross-fertilisation between div isions. This is a win-win for both Elia and its employees, who get to experi ence a range of roles and can continue to learn and evolve throughout their career with us. This system creates a special dynamic within the company.”

How can I be sure I’m in the best role at every stage of my career?MARIANNE CELIS, BUSINESS PARTNER AT ELIA DIRK WELLENS, — ELECTRONICS ENGINEER ELIA EMPLOYEE SINCE THE COMPANY WAS FOUNDED IN 2000
ELIA ANNUAL REPORT 2017 - 8180 ELIA ANNUAL REPORT 2017
#5_
We align culture with strategy
—
COLLEAGUES (ELIA GROUP) COLLEAGUES (ELIA) 2,343 1,350
In 2017, Elia surveyed every one of its employees to see how much progress was being made. Where were they in relation to the new values? How much further did we still have to go? What pro cesses were needed to facilitate the cultural change currently tak ing place at Elia?
To implement this cultural change, Elia is adopting a top-down approach in which management sets an example for every employee. An action plan is currently being developed to bring Elia’s new culture to life. It will start with the management, then senior managers and gradually work its way down to all Elia employees.
We align culture with strategy
As a transmission system operator, Elia is committed to developing the competencies needed to cope with the many challenges of the future. It has to be an agile company with the right expertise, one that can change at the same pace as the world around it. The energy world is changing, so Elia has to change too. That is why, in 2016, Elia introduced a new set of values designed to inspire a new corporate culture, with the aim of strengthening its teams and activities and making sure it is all set to manage the grid of the future.
Our core values and aspirational values
Our core values
Our three core values reflect funda mental principles that are deeply rooted within Elia.
SAFETY ALWAYS COMES FIRST
Safety always comes first, every where and for everyone! As a company, we constantly invest in safety and expect our staff (both in the field and at administrative sites), our subcontractors, our col leagues - the distribution system operators -, and all others to work safely and responsibly at all times.

SERVING THE COMMUNITY
Elia wants to play its central role in the sector to the full and create value for the society. Elia’s employees keep that aim in mind in everything they do, con stantly asking themselves what the society wants, and how they can help make improvements.

TARGETING PERFORMANCE
Elia’s employees strive for maximum efficiency and quality so as to attain or, better yet, surpass their targets. They are results-oriented and deliver projects and services on time.
Our aspirational values
In a changing energy sector, four ‘revamped’ aspirational values are key to achieving Elia’s strategy. They are reflected in the behaviour and attitude of our staff.
WE ARE ENTREPRENEURIAL
Our staff work proactively and take initiatives with a view to improving how they work and exploring new ways of doing things.
WE COLLABORATE
Elia values collaboration, both within the company and with external partners. Our staff share their expertise and their information and question each other, thus enabling their ideas to mature. They seek fruitful collaborations and winwin partnerships.
WE ARE ACCOUNTABLE
All of our staff take full responsibility for their projects and tasks. They achieve their motivating, ambitious targets and work hard on their projects until they are completed.
WE ARE AGILE
In a world of constant change, our staff embrace new developments, are proactive and persevere.
OBJECTIVES
We want to attract the brightest talents by being the leading energy company in Belgium and a leading TSO in Europe.

— Establishing a new corporate culture with a new vision and ambition
— Developing an extended talent and organisational development programme


— Embedding a safety culture by increasing the safety awareness of employees and contractors
— Creating a high performance organisation to empower people to take more initiatives and enable quicker decision-making
“WE ARE COMMITTED TO EACH OTHER’S SUCCESS AND EACH OTHER’S IMPROVE MENT SO THAT EVERYONE WHO WORKS WITH US HAS OPPORTUNITIES TO PER FORM AT THEIR BEST, IN A WAY THAT IS SUSTAINABLE OVER TIME. WE ARE ONE TEAM WHERE EVERYONE COUNTS, IN ORDER TO SERVE THE SOCIETY.”
PETER MICHIELS, CHIEF HR & INTERNAL COMMUNICATION OFFICER AT ELIA
ELIA ANNUAL REPORT 2017 - 8382 - ELIA ANNUAL REPORT 2017
We align culture with strategy
Our ambitions
Elia as Top Employer
We strive to have a thorough under standing of the available and required tal ent in the organisation, to identify pos sible talent gaps and create action plans to fill them, including internal recruit ment and succession planning strategies. In order to ensure excellent performance at work, we encourage an open feedback culture, which outlines our expectations regarding competencies and behaviours. From these dialogues, we derive conse quences to keep performance at a high level.
SHANNA JACOBS, RECRUITMENT MANAGER AT ELIA“ELIA IS COMMITTED TO EQUAL OPPORTUNITIES FOR ALL CANDIDATES, REGARDLESS OF GENDER, AGE, BACK GROUND OR RELIGION. IT ALSO BELIEVES IN GIVING A CHANCE TO YOUNG PEOPLE AND LESS YOUNG PEOPLE, WHO CAN SOMETIMES FIND IT DIFFICULT TO LAND A JOB. ELIA REGULARLY ATTENDS JOB FAIRS TO MEET FUTURE CANDIDATES FROM ALL EDUCATIONAL BACKGROUNDS (ENGINEERS, TECHNICIANS, ETC.).”
Our culture is based on four pillars to ensure a strong and efficient team working towards the same vision:
GENDER DISTRIBUTION AT ELIA

WOMEN
MEN

The percentage of male employees is largely reflective of the energy sector, with most of the technicians working in the field being men. For more information about gender distribution within the Elia Group, see the annex.


Performance & career development
Since 2015, Elia has been devel oping a catalogue of specific technical competencies. It has identified priority competencies and the support needed to develop local competencies. A learning path has also been developed to train staff in priority competencies where necessary.
To develop a competency, Elia relies on three key components: a clear and shared understanding of the results to be achieved, proficiency indicators, and a continuous learning environment.
Diversity
People in all their diversity are what matter. Elia has staff spanning a range of nationalities, age groups and experien ces. Our activities require a multiplicity of talents, and we strive to form teams that excel at what they do. We believe that our teams are enriched by diversity. Because accountability and the good of the com munity are central to our culture, we aim to use our company’s diversity as a tool for social and professional integration.
INTERNATIONAL EXCHANGE PROGRAMME BETWEEN ELIA AND 50HERTZ
In 2017, Elia and 50Hertz developed a joint exchange programme for employees of the two companies. Eight employees were selected to take part for a period of two to six months. A report will be produced in the first months of 2018 to share the conclusions and give more details about a possible second round of exchanges.
“The exchange programme between Elia and 50Hertz is a great opportunity to expand our knowledge, share our respective experiences and forge new ties. It’s also a great way to strengthen intergroup cooperation. I’m only at the start of my time at 50Hertz but I’ve already learnt a lot about offshore projects in Germany.” Erwann Bauwens, Project Leader Nemo
Developing our employees’ competencies
Thanks to a large catalogue of work shops, we enable executives to develop and empower their teams, lead change and deliver results, thereby promoting leadership development. We pro vide training for technical, safety and soft competencies and establish continuous improvement routines to ensure consistent and sustainable safety behav iours. We incorporate public accept ance and transparency into day-today processes to promote and reward modest and responsible behaviours as well as assertive, yet collaborative communication.
 ELIA ANNUAL REPORT 2017 - 8584 - ELIA ANNUAL REPORT 2017 Leadership development Health and safety culture Acting in the interest of society Agility and initiative-taking
We align culture with strategy AVERAGE HOURS OF TRAINING BY GENDER (BELGIUM) WOMAN MAN 2015 2016 2017 37 28 11 59 62 29 256 1094
What we achieved in 2017
OF ELIA EMPLOYEES ARE OVER THE AGE OF 45
Horizon 2020: factoring in the impact of an ageing population


The ageing population is an undis puted fact and also has an impact on businesses and how they are structureda trend reinforced by changes to Belgian legislation governing pensions. The top of the age pyramid is widening and the number of older workers is on the rise. For example, almost 38% of Elia employ ees are over the age of 45. This situa tion requires a conversation between the employer and more experienced employees about career aspirations and prospects.
With this in mind, in 2014 Elia launched the Horizon 2020 project aimed at drawing up a HR and corporate policy factoring in age to provide an attract ive and sustainable career framework.

Mindful of the fact that there is no onesize-fits-all solution, Elia is currently work ing on a range of career development plans, all of which seek to strike an appro priate work-life balance.
New employer value proposition
Powering Your Future. What is your impact on Tomorrow? Elia’s new employer value proposition, unveiled in 2017, aims to give fresh impetus to its posi tioning as an employer and to exemplify its new values.

Care4Energy: promoting well-being
In 2016, Elia launched Care4Energy, an umbrella programme bringing together all of the company’s initiatives to promote well-being. It aims to work with employees and for employees to create a sustainable, healthy and safe environment based on well-being and respect, so that everyone has the energy and vitality they need to shape the energy landscape of the future together.
Elia’s focus in 2017 was on men tal and emotional health. Following a survey to identify employees’ stress levels and sources of stress, a general action plan was drawn up for each department. Training sessions about stress were a key component of this plan.
Cultural change
With decarbonisation, digitalisation and decentralisation, the energy sector is going through many changes at present. Elia is committed to developing the com petencies needed to cope with the chal lenges of the future. It has to be an agile company with the right expertise, one that can change at the same pace as the world around it.
That is why, in 2016, Elia introduced a new set of values designed to instil a new corporate culture that will stand us in good stead for managing the grid of the future.
In 2017, Elia surveyed every one of its employees to see how much progress was being made. Where were they in rela tion to the new values? How much fur ther did we still have to go? What meas ures were needed to facilitate the cultural change currently taking place at Elia?
To implement this transformation, Elia believes in an approach based on per sonal change, in which management sets an example for every employee. An action plan is currently being developed to bring Elia’s new culture to life. It will start with the management, then senior managers and gradually work its way down to all Elia employees.
Satisfaction surveys
In 2017, Elia’s HR Department con ducted numerous satisfaction surveys to find out how employees were feeling about the cultural changes currently underway. As a result, Elia has the infor mation it needs to implement an action plan to facilitate this change.

A survey of psychosocial risks among Elia employees enabled a bet ter assessment of the situation within the company and identified areas for atten tion to be included in the action plan that will be launched in 2018. In 2017, team workshops helped to deliver improve ments in psychosocial risks, and a training programme on awareness/management of stress and burnout was also rolled out.
Mobility at Elia
Congestion on the roads, and the time wasted as a result, are a strong argu ment for introducing a different approach to mobility. In addition to offering staff the option to work remotely, Elia is continu ing to apply its sustainable mobility policy, which aims to limit journeys and offer a flexible, varied range of solutions for get ting to work or travelling for other profes sional reasons.
TOTAL PARTICIPATION IN THE SURVEY ON PSYCHOSOCIAL RISKS
ELIA ANNUAL REPORT 2017 - 8786 ELIA ANNUAL REPORT 2017 583
PARTICIPANTS
PARTICIPANTS
WELCOME APP FOR NEW HIRES
June 2017 saw the launch of a mobile app for new Elia employees. The Welcome App allows new hires to learn about Elia in an interactive way between signing their contract and their first day at work.

“It’s important to us that we give each and every newcomer the best possible welcome. This new app ensures that every new hire has the key information they need well ahead of their first day so they feel more at ease and can hit the ground running from day one.”
Kimberly De Laet, Training & Development Manager at Elia
ORGANIZATIONAL COMMITMENT
ALIGNEMENTJOB ENGAGEMENT
TOTAL PARTICIPATION SURVEY ON SAFETY CULTURE
PARTICIPANTS
PARTICIPANTS
A survey on safety culture undertaken in 2017 found that Elia’s employees have a positive perception of safety within the company. The results were used to assess the suitability of the actions being taken and to determine the priorities that need to be worked on in order to continue improving safety.
In 2017, a satisfaction survey was conducted among all Elia employees. It found commitment levels among Elia staff remained high, except when it came to agility. More information about the survey can be found in the annex.

“CULTURAL CHANGE IS PIVOTAL IN ENABLING THE EXECUTION OF THE ELIA STRATEGY. WE ARE HITTING THE LIMITS OF WHAT WE CAN ACHIEVE IN THE CURRENT WAY OF WORKING.”
BARBARA VERHAEGEN, INTERNAL COMMUNICATION MANAGER AT ELIA
38%
AGILITY We align culture with strategy
85 89 84 65 NON
NON
868 870 256
WHAT HAPPENED AT 50HERTZ IN 2017?
50Hertz is convinced that the success of a company is entirely based on the success of its employees. It is the responsibility of the company to help employees develop their skills, to foster their health and commitment, involve them in decisions and guarantee equal opportunities for all.
Annedore-LeberBerufsbildungswerk
50Hertz gains OHSAS recertification
In December 2016, 50Hertz was again awarded Occupational Health and Safety Assessment (OHSAS) certification. OHSAS is a British standard that assesses and certifies companies’ occupational health and safety management systems. A successful, follow-up audit was conducted in November 2017. Security is also a top priority for 50Hertz.
Happy birthday, 50Hertz!
50Hertz celebrated its 15th birthday in 2017. And what better way to do it than in the company of all its employees?


EMPLOYEES
“Say it!”, 50Hertz’s comprehensive survey of employees, took place for the third time in 2017. Topics such as cooperation, crossdivisional processes and leadership behaviour were evaluated, and all employees, as well as members of the Management Board, were able to share their views openly. The detailed results will be discussed within the respective teams in workshops in the first quarter of 2018, and any necessary measures put in place. The survey participation rate was 91%.
Promoting diversity and equal opportunities at 50Hertz also means giving people with health impairments the same opportunities as their other colleagues. As early as 2013, an inclu sion agreement was concluded to promote people with health impairments in their work ing lives. In 2017, the proportion of severely dis abled employees in our workforce was 2.8 per cent. Depending on the job requirements in the commercial and technical areas, the quota will be successively increased in the future. In 2017, a cooperation agreement was concluded with the Annedore-Leber-Berufsbildungswerk and a special apprenticeship scheme for those with impairments was established.
Give the word to young employees
50Hertz is keen to give its youngest employees a voice, as they are the future of our economy. It therefore held the first trade union elections especially for young employees in 2017.

Further development of employees’ competencies
The average training costs per participating employee amounted to around 1350 euros in the reporting year 2017. In addition, executives can participate in 50Hertz tailor-made train ing modules to develop their own leadership skills. Since 2014, 94 employees have collabor ated on practical cases encountered in their day-to-day management across divisions and hierarchies.
Diversity
50Hertz is committed to promoting divers ity and strongly condemns any discriminatory act in the work environment. All employees have equal rights, regardless of their eth nic origin, age, gender, sexual identity, reli gious affiliation, political views, nationality, social background or other factors. The num ber of different nationalities among 50Hertz staff has increased significantly. The company employed its first severely disabled apprentice in 2017. There is also a very active women’s net work at 50Hertz.
For more information on the distribution of men and women at 50Hertz, see the annex.
“Say it!” - the employee satisfaction survey launched in 2017
ELIA ANNUAL REPORT 2017 8988 ELIA ANNUAL REPORT 2017
15 years SEVERELY DISABLED
2.8% We align culture with strategy
How does Elia stay upto-date with technological developments to make the energy transition happen?


Our electricity system is facing huge challenges. As small-scale generation and decentralisation increase, there is a greater need for digitalisation and platforms to facilitate multi-level cooperation. As well as integrating renewable energy, our grid will also have to be ca pable of transmitting substantial volumes of imported and exported power. Over the past 25 years we have imported an average of 6 TWh net per year, but this will be rising to 13-30 TWh by 2030, depending on the scenarios. Technology can play its part in keeping the grid secure and manageable, alongside cooperation and exchanges with our neighbours. However, it’s im portant that we have an accurate idea of their future generating facilities so that we can assess the needs of the Belgian system as efficiently as possible.
“Changes in the energy sector are gathering pace. Driven by the energy transition, new players are emerging and new economic models are being developed. Technology facilitates and accelerates these changes. However, innovation also offers opportunities for the transmission system operators of the future. Elia tests and integrates new tech nologies in collaboration with all the market players. In 2017, we carried out tests involving digital technologies such as robots, machine learning and blockchain. Our aim is to de termine whether these innovations can add value to our core business. This will help us to ensure that the market continues to operate efficiently in a new renewable and decen tralised energy system.”
DANIELLE DEVOGELAER, ENERGY EXPERT, FEDERAL PLANNING BUREAU ALEXANDRE TORREELE, ELIA STRATEGY & INNOVATIONELIA ANNUAL REPORT 2017 - 9190 - ELIA ANNUAL REPORT 2017 We have our eyes wide open for innovation & growth opportunities
#6_
— MEMBER OF THE FPB’S ENERGY AND TRANSPORT TEAM SINCE 2004 — ENERGY EXPERT SPECIALISING IN ELECTRICITY MODELLING
We have our eyes wide open for innovation & growth opportunities


Our ambitions
Excelling in managing assets on the grid of tomorrow

Renewable energy integration and increased interconnection demands more of our infrastructure. The adoption of new technologies allows Elia to improve the use of our assets in many ways, providing increased capacity, lower risk or higher efficiency and reliability without increas ing the impact of our infrastructure.
Developing and managing the electricity grid 2.0
Continuing to play a pioneering role in market facilitation

Elia is the market facilitator and design an efficient and transparent elec tricity market in Belgium to ensure a smooth transition to European market integration. Elia continuously collaborates with different stakeholders so the market can be adapted in line with the evolving needs of the power system. To keep this position, Elia is working on increasing the liquidity on the balancing market.
Open innovation through collaboration
OBJECTIVES
We create a culture of innovation and entrepreneurship to accelerate the energy transition.
Innovation is the catalyst for a swift energy transition. We are preparing for the future by keeping our eyes open for new developments in infrastructure management, system operation and the integration of our markets in a European context.
As well as continuing to integrate innovative technologies, we stay abreast of the latest developments in the energy sec tor. We see this as an opportunity and want to play a pioneering role. Elia has a range of initiatives that foster and reward innovative thinking, to ensure that our employees remain at the forefront of new developments.
In a rapidly changing energy landscape, innovation plays a key role in understanding, anticipating and promptly adopting the changes needed to ensure the transition towards a more reliable, affordable and efficient energy system. We continue to innovate in our industry, so the power sector can evolve and benefit us now and in the future.
”WE ARE COLLABORATING WITH DIFFERENT PLAYERS TO DEVELOP SOLUTIONS THAT WILL ALLOW US TO FURTHER DEVELOP THE GRID AND OPERATE THE SYSTEM IN A MORE DIGITAL, DECENTRAL AND RENEW ABLE WORLD.”
Elia designs the expansion and the reinforcement of the grid according to the expected needs. Today and certainly more in the future, Elia will have to cope with the increase of renewable energy within the energy system and progressive decentralisation, whereby more produc tion capacity is being installed in Belgian households. So, to meet future needs, Elia plans to develop and operate the power system 2.0.
In a world of widely distributed knowledge, Elia has decided to go for open innovation. We cannot afford to rely entirely on our own ideas and expertise to advance our technology. Buying or licensing processes or inventions from other companies, like start-ups, also makes a valuable contribution.
— We build an ecosystem to develop the tools and methods that will enable a more digital, decentralised and renewable energy system
MENNO JANSSENS, INNOVATION MANAGER AT ELIA
ELIA ANNUAL REPORT 2017 - 9392 - ELIA ANNUAL REPORT 2017
We have our eyes wide open for innovation & growth opportunities
What we achieved in 2017
Spatial imagery
Drones, photogrammetry, LIDAR, ground penetrating radar and more: new technologies with a spatial component are arriving at Elia, bringing both chal lenges and opportunities. The Spatial Imagery project aims to distribute know ledge about this technology, encouraging business departments to create oppor tunities that utilise it with a view to devel oping a structural and visionary approach.
Two types of spatial imagery tech nology are investigated:

— Photogrammetry = the art of obtaining reliable information about physical objects and the environment by recording, measuring and interpreting photographic images and patterns. This allows engineering teams to design high-quality 3D models quicker and more accurately. With photogrammetry, a series of photos can be used as a basis for creat ing a 3D model. This requires far less work than a manual 3D drawing.
“THE GROWTH TOWARDS A DIGITISED, MORE ACCURATE AND AI-SUPPORTED VIEW OF OUR GRID INFRA STRUCTURE IS EXPECTED TO GREATLY BENEFIT THE VALUE TRIANGLE: SAFETY, QUALITY AND EFFICIENCY.”
— LIDAR (Light Detection and Ranging technology) = extensively used for atmospheric research and meteorology. It is also being tested as a way of better managing vegetation under high-voltage corridors as it can model infrastructure and line sag more accurately. With LIDAR, a point cloud reflected by light can reveal what is happening on the ground. In practice, we can use LIDAR to put together a point cloud for all infra structures and the environment surround ing them. Once processing the data, the sag of high-voltage lines can be accurately modelled under various circumstances, thus improving efficiency and quality.
INNOVATIVE INSULATING ARMS FOR STEVIN


In 2017, two new technologies were commissioned in connection with the Stevin project.
Insulating arms were fitted to compact pylons to replace an existing 150 kV line. Transforming pylons in this way made it possible to increase the voltage level to 380 kV without having to increase the height of the new pylons. High-temperature low-sag (HTLS) conductors – which reduce the effects of sag when the temperature on the line is high – now make it possible to increase power on the new 380 kV lines.

3D printing at Elia
Starting with logistics and spare parts management, Elia is exploring the use of 3D printing throughout the com pany. The aim is to find cost-effective ways to deliver qualitative spare parts as and when they are needed. The first case has been successfully implemented in the field, representing a long-term cost saving.

Previously circuit breaker caps deteriorated prematurely due to the UV sensitivity of the material. For almost the same cost, Elia used 3D printing to develop a more qualitative spare part, which requires less maintenance, saving both time and money.

GARPUR
Historically in Europe, power system reliability management has been pre dominantly relying on the ‘N-1’ criterion – whereby the system should be able to withstand an unexpected failure or out age of a system component (power plant, transmission line or transformers) at all times.
Today, the increasing uncertainty of generation due to intermittent energy sources, and the growing complexity of the pan-European power system, increase the need for new reliability criteria with a better balance between reliability and costs.
The European project GARPUR aims to develop new probabilistic criteria and relevant indicators for assessing reliability at various stages (grid development, asset management and grid operation) and evaluate their practical use (compared to the current ‘N-1’ criterion).
To that end, GARPUR is examin ing every facet of the approach applied between the grid development stage (which is decided upon several years in advance) and real-time operation, and devising European recommendations to enable a gradual switch to a probabilistic approach.
Distributed flexibility
Having explored the industrial and residential sector, Elia wants to facilitate the medium sized consumers (tertiary sector) to unlock their flexibility. In order to get an initial idea about the needs and potential of the tertiary sector, Elia has conducted a demo on one of its own buildings that enabled it to assess the controllability of three devices: a chiller, an air handling unit and a humidifier.
The test showed that the chiller and the humidifier were able to deliver flexibility in an aggregated way, in other words their activation and hold-on times fulfilled provision requirements. Elia also paid attention to the lessons learnt during the test. The main one being that controllability of the load is not guaranteed. Devices sometimes cannot be curtailed as they are following a given operation schedule and are bound to strong interdependen cies with other devices.
“ACCESSING DECENTRALISED FLEXIBILITY IS A COMPLEX TASK THAT NEEDS TO BE TRANSLATED INTO SIMPLE, AUTOMATED ACTIONS THAT CONSUMERS CAN UNDER STAND AND TAKE ON BOARD.”
MICHIEL UWAERTS, INNOVATION EXPERT AT ELIA GIANNOPOULOS GEORGIOS, SYSTEM SERVICES PRODUCT MANAGER AT ELIAELIA ANNUAL REPORT 2017 - 9594 - ELIA ANNUAL REPORT 2017
We have our eyes wide open for innovation & growth opportunities
Advanced machine learning to support dispatching
The integration of renewable energy is making the grid more and more com plex; as a result, it is becoming vital to be able to predict grid imbalances within a very short time frame.


This project sets out to develop a model to detect the correlation between the various parameters influencing grid imbalance and predict any imbalance within a period of 15 minutes to an hour.
Elia hopes to first test and then demonstrate the usefulness of artificial intelligence in heightening the control centre engineers’ awareness of the situ ations they face and in supporting their decision-making.
“As a system operator it has become much harder to understand system imbalance scenarios. The impact of vari able generation, such as wind power and solar energy, is just one consideration, but there are also others, like increased activity on intraday markets, flexible generation units and so on. This means that system operators have to process and interpret huge quantities of data very quickly. Technologies and models built by data scientists will help to crunch down all this information and enable us to make correct decisions.” Matthias Masschelin, Head of Energy Scheduling & Balancing at Elia
ADRIEN GILLÈS, INNOVATION PROJECT LEADER AT ELIA
Blockchain
Blockchain is a new technology allowing validation and storage of trans actions between parties on a decentral ized level. The financial sector was the first to take an interest in this technology, but recent developments have expanded its scope and made it attractive to other industries. Organisations and start-ups around the world are now considering blockchain technology to be a poten tial solution for a decentralised energy system.
Blockchain should reduce trans action costs, enable the active involve ment of a larger number of participants and, consequently, accelerate the transi tion to a cleaner, more reliable and more affordable energy system.To assess the impact of blockchain technology on its sectors, Elia joined the Energy Web Foundation (EWF), an organisation that focuses on developing blockchain tech nology in the energy sector. Harnessing the EWF ecosystem, Elia aims to demon strate the potential of blockchain by test ing use cases based on actual internal processes.
GRASP
In collaboration with the Université Libre de Bruxelles (ULB), Elia is working on the development of new methods to plan and operate the Belgian power system within the PhD project GRASP.
GRASP seeks to develop a grid reli ability assessment model for the operational planning stage. This model would factor in the scope for forecasting errors regarding wind and solar power generation.
Moreover, GRASP is rooted in existing practices and suggests new procedures with a view to issuing recommen dations based on a prototype that can be tested directly using real-life situations in Belgium.
Enervalis
In September 2017, Elia acquired a stake in Enervalis, a start-up that develops energy management software. By part nering with Enervalis, Elia aims to innovate and strengthen its expertise in order to better contribute to the development of the future electricity system in which digitalisation and decentralisation will play an increasingly important role.


“The goal of our company is to deliver sustainable energy solutions that allow electricity producers, distributors and consumers to optimise energy supply, stor age and demand flexibility. I am convinced that our cooperation with Elia will bring these to a new scale and this will bene fit the community.” Stefan Lodeweyckx, founder and CEO of Enervalis.


HACK BELGIUM: INNOVATING FOR BELGIUM
Fifteen Elia employees took part in Hack Belgium on 4, 5 and 6 May. The event brought together experts from various sectors, entrepreneurs and other enthusiastic and talented individuals to develop innovative ideas that will benefit Belgian society. By participating in events such as Hack Belgium, Elia demonstrates its commitment to taking innovative and socially responsible action on behalf of the energy transition and Belgium’s future. This also allows Elia’s employees to cultivate the entrepreneurial and innovative mindset that is so important to the company’s future. Elia will be taking part in the next Hack Belgium between 26 and 28 April 2018.
“With the development of new technologies like Internet of Things and Electric Vehicles, interaction with different sectors like IT, Telecom and Automotive becomes increasingly important. The Hack was the perfect occasion to meet innovators from these industries and develop a new perspective on innovation projects for Elia.”
Manoël Rekinger, Innovation Project Manager at Elia“BLOCKCHAIN TECHNOLOGY HAS THE POTENTIAL TO PRO FOUNDLY ALTER HOW THE ENERGY SECTOR OPERATES.
BY ENABLING CITIZENS TO MAKE ELECTRICITY TRANS ACTIONS DIRECTLY BETWEEN EACH OTHER, BLOCKCHAIN COULD SERVE AS A VECTOR IN THE ENERGY TRANSITION.”
ELIA ANNUAL REPORT 2017 - 9796 ELIA ANNUAL REPORT 2017
We have our eyes wide open for innovation & growth opportunities
Local inertia
With the increasing penetration of renewable energy sources at the expense of conventional sources and the growth in storage solutions connected to the grid, the total inertia available on the network is decreasing. While this reduction does not pose a risk to the European contin ental grid, it does raise the issue of inertia distribution. If an imbalance in this distri bution occurs (as has already happened on the UK network), grid protection sys tems can be triggered, causing local power cuts.
This project investigates the phe nomena related to the distribution of inertial response that may significantly impact future power system operation. The research investigation will develop
modelling tools, techniques and expertise with specific regard to the effect of distri bution of inertia in the power grid, as well as considering related factors such as grid topology, RES penetration, and overall system security.
This project was granted financial support by the 2017 Energy Transition Fund. It aims to finance measures to encourage and support research and development in innovative energy pro jects, as well as to maintain or develop any system ensuring security of sup ply and the balance of the network. This fund is financed by a fee payable by Engie Electrabel, amounting to 20 million euros per year, in exchange for the extension of the reactors of Doel 1 and 2.

WHAT IS HAPPENING AT 50HERTZ ?
ELIA’S FIRST OPEN INNOVATION CONTEST
In October 2016, Elia organised the Open Innovation Challenge in order to identify start-ups that are proposing tools to enhance public acceptance of infrastructure projects. The contest was won on 16 February 2017 by Gilytics, a Zurich-based start-up.


Gilytics provides an interactive platform using 3D visualisation and augmented reality to improve public participation in the planning phases of new projects.

“The tool of Gilytics allows us to define various constraints (soil, habitat, protected nature area, technical limitations, etc.) and allocate them a specific weight. It then identifies the optimum route. In the proof of concept, the results converged with the route that Elia had proposed, which validated the work done by our experts.” Johan Maricq, Innovation Project Leader at Elia.
Pilot project with a new type of insulating gas
A new type of 110 kV, gas-insulated switchgear is being built at the Charlottenburg high-volt age substation. Instead of sulphur hexafluor ide (SF6), a mix of insulating gases with less environmental impact will be tested. The gas mixture, known as g³, has the same technical characteristics as SF6 but a global warming potential that is 99% lower.
CompactLine
In late 2017, 50Hertz began building a pilot of a new type of line with shorter, narrower pylons and therefore a reduced environmental impact.
The test line runs for two kilometres and will include five pylons. It is connected to the Jessen North substation. The design of CompactLine should enable a 220 kV line to be replaced with a 380 kV line, without alter ing the route. 50Hertz plans to start testing the pilot project from summer 2018.

Innovation Day @ 50Hertz
The company held its 5th Innovation Day on 13 November. 50Hertz employees were briefed on 19 ongoing research and development pro jects, and exchanged ideas about technical developments and process innovations.
99%
THE GAS MIXTURE, KNOWN AS G³, HAS THE SAME TECH NICAL CHARACTERISTICS AS SF6 BUT A GLOBAL WARM ING POTENTIAL THAT IS 99% LOWER.
ELIA ANNUAL REPORT 2017 9998 ELIA ANNUAL REPORT 2017
We have our eyes wide open for innovation & growth opportunities
Corporate Governance Statement
Elia satisfies specific obligations in terms of transparency, neutrality and non-discrimination towards all stakeholders involved in its activities.
At Elia, corporate governance is based on two pillars:
— the 2009 Corporate Governance Code1, which Elia has adopted as its benchmark code;
— the Act of 29 April 1999 on the organisation of the electricity market and the Royal Decree of 3 May 1999 on the management of the electricity transmission system applicable to Elia as a transmission system operator.
Board of Directors
Composition of the management bodies as at 31 December 2017
Board of Directors
CHAIRPERSON 2
— Bernard Gustin, independent director
DIRECTORS 3
— Michel Allé, independent director
— Luc De Temmerman, independent director
— Frank Donck, independent director
— Cécile Flandre, director appointed upon proposal of Publi-T

— Claude Grégoire, director appointed upon proposal of Publi-T

— Bernard Gustin, independent director4
— Philip Heylen, director appointed upon proposal of Publi-T
— Luc Hujoel, director appointed upon proposal of Publi-T
— Roberte Kesteman, independent director5
— Jane Murphy, independent director
— Dominique Offergeld, director appointed upon proposal of Publi-T
— Rudy Provoost, director appointed upon proposal of Publi-T6

— Saskia Van Uffelen, independent director
— Geert Versnick, director appointed upon proposal of Publi-T
REPRESENTATIVE OF THE FEDERAL GOVERNMENT WITH AN ADVISORY ROLE
— Nele Roobrouck
Advisory committees to the Board of Directors
CORPORATE GOVERNANCE COMMITTEE
— Luc Hujoel, Chairman
— Frank Donck
— Philip Heylen
— Jane Murphy
— Saskia Van Uffelen
AUDIT COMMITTEE
7
— Michel Allé, Acting Chairman
— Luc De Temmerman
— Frank Donck
— Dominique Offergeld
— Geert Versnick
REMUNERATION COMMITTEE 8
— Luc De Temmerman, Chairman
— Claude Grégoire
— Saskia Van Uffelen
Auditors 9
— KPMG Réviseurs d’Entreprises SCCRL, represented by Alexis Palm
— Ernst & Young Réviseurs d’Entreprises SCCRL, represented by Patrick Rottiers
Management Committee
10
— Chris Peeters, Chairman and Chief Executive Officer
— Markus Berger, Chief Infrastructure Officer
— Patrick De Leener, Chief Customers, Market & System Officer
— Frédéric Dunon, Chief Assets Officer
— Pascale Fonck, Chief Officer External Relations
— Peter Michiels, Chief Human Resources & Internal Communication Officer
— Ilse Tant, Chief Public Acceptance Officer
— Catherine Vandenborre, Chief Financial Officer
Secretary-General
— Gregory Pattou
(1) The Corporate Governance Code can be found on the website of the Corporate Governance Committee (www.corporategovernancecommittee.be).
(2) Miriam Maes, independent director, was chairwoman until 16 May 2017. Claude Grégoire was vice-chairman until 16 May 2017 and acting chairman from 16 May 2017 until 21 December 2017. Geert Versnick was vice-chairman until 16 May 2017. Bernard Gustin was appointed as chairman from 21 December 2017.


(3) Peter Vanvelthoven was appointed director upon the proposal of Publi-T until 19 March 2017. Jacques de Smet was appointed independent director until 16 May 2017. Miriam Maes was appointed independent director until 27 October 2017.

(4) Bernard Gustin was appointed director from 16 May 2017.
(5) Roberte Kesteman was appointed director from 27 October 2017.
(6) Rudy Provoost was appointed director from 16 May 2017.
(7) Jacques de Smet was chairman of the Audit Committee until 16 May 2017. Michel Allé was appointed acting chairman from 22 June 2017.


(8) Jacques de Smet was a member of the Remuneration Committee until 16 May 2017.
(9) KPMG Réviseurs d’Entreprises SCCRL was represented by Benoît Van Roost until 16 May 2017. Ernst & Young Réviseurs d’Entreprises SCCRL was represented by Marnix Van Dooren until 16 May 2017.
ELIA ANNUAL REPORT 2017 - 101100 ELIA ANNUAL REPORT 2017 Corporate governance statement (10) Peter Michiels was appointed member of the Management Committee from 3 January 2017 and Patrick De Leener was appointed member of the Management Committee from 1st February 2017. Frank Vandenberghe was Chief Customers, Market & System Officer until 1st February 2017.
 Bernard Gustin
Luc Hujoel
Saskia Van Uffelen
Claude Grégoire Luc De Temmerman
Roberte KestemanFrank Donck
Jane Murphy
Geert Versnick Cécile Flandre
Dominique Offergeld
Michel Allé Philip Heylen Rudy Provoost
Bernard Gustin
Luc Hujoel
Saskia Van Uffelen
Claude Grégoire Luc De Temmerman
Roberte KestemanFrank Donck
Jane Murphy
Geert Versnick Cécile Flandre
Dominique Offergeld
Michel Allé Philip Heylen Rudy Provoost
Board of Directors
The Boards of Directors of Elia System Operator and Elia Asset consist of 14 members, none of whom perform an executive role within either of those two companies.
The same directors sit on the Boards of both companies.
Half of the directors are independent dir ectors, satisfying the conditions set out in Article 526ter of the Belgian Com panies Code, Article 2(30) of the Act of 29 April 1999 on the organisation of the electricity market and in the articles of association, and having received a positive opinion (“avis conforme”/ “eensluitend advies”) by the CREG on their independ ence. The other half are non-independent directors appointed by the General Meet ing upon proposal of Publi-T, as per the current shareholder structure (see also the ‘Shareholder structure’ secti on on page 113 of this statement).
In accordance with provisions stipulated by legislation and the articles of associ ation, these Boards of Directors are sup ported by three committees – the Corporate Governance Committee, the Audit Committee and the Remuneration Com
mittee – which are the same for Elia Sys tem Operator and Elia Asset. The Boards of Directors ensure that these committees operate in an efficient manner.
In accordance with the Act of 29 April 1999 on the organisation of the electri city market, the Belgian Companies Code and the articles of association of Elia Sys tem Operator and Elia Asset, at least one third (1/3) of the Board members must be of the opposite gender to the remaining two thirds. This one-third rule is applied proportionately to the independent and non-independent directors.
In addition, in accordance with the Cor porate Governance Code 2009, the Inter nal Regulations of the Board of Direc tors and the Act of 3 September 2017 on the disclosure of non-financial informa tion and diversity information by certain large companies and groups, the com position of the Board of Directors is based on gender diversity and diversity in gen eral, as well as on the complementarity of skills, experience and knowledge.
When searching for and appointing new directors, special attention is paid to diversity parameters in terms of age, gender and complementarity.
DIVERSITY WITHIN THE BOARD OF DIRECTORS
Number of people on the Board of Directors of Elia System Operator and Elia Asset as at 31 December 2017
Men
Women
Unit 2017
Aged 30 - 50 2
Aged over 50 7
Aged 30 - 50 1
Aged over 50 4
CHANGES IN THE COMPOSITION OF THE BOARD OF DIRECTORS
The directorships of the following direc tors were renewed in 2017, having expired during the year:
— Jane Murphy was reappointed by the Ordinary General Meeting of 16 May 2017 as an independent director of Elia System Operator and Elia Asset.
— Cécile Flandre, Claude Grégoire, Philip Heylen and Dominique Offergeld were reappointed by the Ordinary Gen eral Meeting of 16 May 2017 as nonindependent directors of Elia System Operator and Elia Asset.
The following persons were appointed as directors of Elia System Operator and Elia Asset in 2017:
— Bernard Gustin was appointed by the Ordinary General Meeting of 16 May 2017 as an independent director of Elia System Operator and Elia Asset (suc ceeding Jacques de Smet).
— Rudy Provoost was appointed by the Ordinary General Meeting of 16 May 2017 as a non-independent director of Elia System Operator and Elia Asset (succeeding Peter Vanvelthoven, who resigned as a non-independent director of Elia System Operator and Elia Asset with effect from 19 March 2017).
— Roberte Kesteman was appointed by the Special General Meeting of 27 Octo ber 2017 as an independent director of Elia System Operator and Elia Asset (succeeding Miriam Maes).
In addition, Bernard Gustin was appointed Chairman of the Board of Directors on 21 December 2017, succeeding Claude Grégoire, who had been appointed Acting Chairman on 16 May 2017.
Michel Allé was appointed Acting Chair man of the Audit Committee from 22 June 2017.
TERM AND EXPIRY OF DIRECTORSHIPS AND APPOINTMENT PROCEDURE
The directors of Elia System Operator and Elia Asset are appointed or reappointed for a six-year term.
The directorships of all of the directors are due to expire after the 2023 Ordin
ary General Meeting of Elia System Oper ator and of Elia Asset for the financial year ending 31 December 2022, with the exception of the directors mentioned below, whose directorships expire on dif ferent dates.
Luc De Temmerman, Frank Donck, Luc Hujoel, Saskia Van Uffelen and Geert Ver snick’s directorships of Elia System Oper ator and Elia Asset will expire after the companies’ 2020 Ordinary General Meeting for the financial year ending 31 December 2019.
Michel Allé’s independent directorship of Elia System Operator and Elia Asset will expire after the companies’ 2022 Ordin ary General Meeting for the financial year ending 31 December 2021.
The six-year term of these directorships diverges from the term of four years rec ommended by the Belgian Corporate Governance Code, a fact justified by the technical, financial and legal specifici ties and complexities associated with the tasks of the transmission system operator, which call for greater experience in those areas.
It should be remembered that the appointment of independent and nonindependent directors of the Elia System Operator and Elia Asset Boards of Direc tors, as well as the composition and oper ation of their committees, are subject to specific corporate governance rules. These provisions are laid down in the Act of 29 April 1999 on the organisation of the electricity market and in the companies’ articles of association.
The Act of 29 April 1999 on the organi sation of the electricity market gave the Corporate Governance Committee an important task in the proposal of candi dates for the role of independent direc tor. The directors are appointed on the basis of a list of candidates drawn up by the Corporate Governance Commit tee. For each candidate, the Commit tee takes into account the up-to-date CV and their sworn declaration concern ing the independence criteria as stipu lated by legislation applying to Elia and the company’s articles of association. The General Meeting then appoints the independent directors. These appoint ments are submitted to the CREG for
its opinion (“avis conforme”/ “eenslui tend advies”) on the independence of each independent director. A similar procedure applies where an independent directorship becomes vacant during the relevant term of office and where the Board co-opts a candidate pro posed by the Corporate Governance Committee.
The Corporate Governance Committee therefore acts as a nominating commit tee for independent directors. For the appointment of non-independent direc tors, there is no nominating committee to make recommendations to the Board. This situation therefore deviates from that prescribed by the Corporate Governance Code. This divergence can be explained by the fact that the Board of Directors always strives, insofar as possible, for con sensus. Moreover, no significant decision can be made without a majority within the groups of independent directors and non-independent directors.
BOARD OF DIRECTORS’ ACTIVITY REPORT
The Board of Directors exercises at least the following powers (non-exhaustive list):
— It defines the general, financial and divi dends policy of the company, as well as its values and strategy. In transpos ing the values and strategy into primary guidelines, the Board of Directors takes into account corporate social respons ibility, gender diversity and diversity in general.
— It exercises the powers given to it by or pursuant to the Belgian Companies Code, by the Act of 29 April 1999 on the organisation of the electricity market and by the articles of association.
— It takes all action appropriate or neces sary to carry out the corporate purpose, excluding powers reserved for the Gen eral Meeting by law or the articles of association.
— It ensures oversight. Within this con text it provides, inter alia, general over sight of the Management Committee in accordance with legal restrictions con cerning access to commercial data and other confidential information relat ing to grid users and the processing of
such data; as part of this oversight it also monitors the way in which the busi ness of the company is carried out and developed in order to, among other things, assess whether the company is being properly managed. In addition, it monitors and evaluates the effective ness of the advisory committees to the Board and the manner in which busi ness is carried out.
The Boards of Directors of Elia System Operator and Elia Asset met 12 times in 2017.
Members who are unable to attend usually have a representative. In accord ance with Article 19.4 of the Elia System Operator articles of association and Arti cle 18.4 of the Elia Asset articles of asso ciation, members who are absent or unable to attend may grant a written proxy to another member of the Board to represent them at a given meeting of the Board of Directors and vote on their behalf at that meeting. However, no rep resentative can represent more than two directors.
EVALUATION
In 2016, the Board of Directors of Elia Sys tem Operator and Elia Asset organised a procedure for evaluating its own func tioning (including an evaluation of the overall contribution of directors), that of its committees and the interaction between the Board of Directors and the Manage ment Committee. In 2016, the Board did not organise an individual evaluation in accordance with provision 4.13 of the Cor porate Governance Code.
The evaluation procedure in 2016 was conducted in accordance with principle 4 of the Corporate Governance Code, which the company has adopted as its bench mark code.
A new evaluation will take place within the time frame stipulated by the Corporate Governance Charter.
ELIA ANNUAL REPORT 2017 - 103102 - ELIA ANNUAL REPORT 2017 Corporate governance statement
Auditors
The Ordinary General Meeting of Elia Sys tem Operator and Elia Asset held on 16 May 2017 reappointed Ernst & Young Réviseurs d’Entreprises SCCRL and KPMG Réviseurs d’Entreprises SCCRL as auditors of these companies for a period of three years. Their term of office will come to an end after the 2020 Ordinary General Meeting of Elia System Operator and Elia Asset relating to the financial year ending 31 December 2019.
Ernst & Young Réviseurs d’Entreprises SCCRL was represented for the exercise of this office by Marnix Van Dooren until 16 May 2017 and is represented as of this date by Patrick Rottiers.
KPMG Réviseurs d’Entreprises SCCRL was represented for the exercise of this office by Benoît Van Roost until 16 May 2017 and is represented by Alexis Palm as of this date.
Significant events in 2017
The total value of the 2017 capital increase (including share premium) was €391,087.26. 9,861 Class B shares in Elia System Operator were issued.
Following the 2017 capital increase, Arti cles 4.1 and 4.2 of the articles of asso ciation of Elia System Operator relat ing to the share capital and the number of shares were amended accordingly on 23 March 2017.
The latest version of Elia System Oper ator’s articles of association is available in full on the company’s website (www. eliagroup.eu, under ‘Investor Relations’ and www.elia.be, under ‘Elia’, ‘Corporate Governance’).
CHANGE IN THE COMPOSITION OF THE BOARD OF DIRECTORS AND THE MANAGEMENT COMMITTEE
For the change in the composition of the Board of Directors and the Manage ment Committee, reference is made to the ‘Board of Directors’ and ‘Management Committee’ sections of this corporate governance statement.
For the other significant events in 2017, see pages 12 to 17.
Management Committee. Accordingly, the Remuneration Committee evaluates the members of the Management Com mittee on the basis of a series of collective and individual targets of a quantita tive and qualitative nature and also taking into account feedback from internal and external stakeholders.
It should be noted that remuneration policy concerning the variable portion of the Management Committee’s remuner ation was adapted to take account of the implementation of multi-year tariffs. Con sequently, since 2008 the salary scheme for members of the Management Com mittee has included, among other things, an annual variable remuneration and long-term profit-sharing spread out over the multi-year regulation period. The annual variable remuneration has two parts: the attainment of collective quanti tative targets and individual performance, including progress on collective infra structure projects, safety and AIT (‘Average Interruption Time’ – average time of inter ruption of electricity supply)12
— following up on the statutory audit of annual accounts;
— evaluating and verifying the independ ence of auditors;
— making proposals to the Board of Dir ectors on the appointment and re-elec tion of auditors and on the terms of their appointment;
— investigating, where appropriate, any issues that resulted in the resignation of auditors and making proposals as to what actions, if any, should be taken in this respect;
— verifying the nature and extent of nonaudit services provided by auditors;
— verifying the effectiveness of external audit procedures.
Pursuant to Article 96, §1, 9° of the Belgian Companies Code and the articles of asso ciation, this report must contain justifica tion of the independence and account ing and auditing competence of at least one member of the Audit Committee.
ture capital investment company Promin vest SA. From 1988 to 2002 he was Chief Financial Officer and a member of the Management Committee of D’Ieteren SA and the Boards of Directors of all subsidi aries of the group, including AVIS EUROPE PLC and BELRON. Between 2002 and 2005, he was Chief Financial Officer of the Ziegler group. In 2009, he was appointed as a member of the Board of Directors of SABCA S.A. He has also been a mem ber of the Boards of Directors of UCO S.A. (1977-2001), LA LIEVE S.A. (1978-1996), LYSLIEVE S.A. (1975-1995), BELGO-KATANGA S.A. (1996-2000), IBEL S.A. (1995-2000) and President of the Financial Execu tives Institute of Belgium (2002-2013). Since 1986, he has been Managing Direc tor of GEFOR S.A. (a consultancy firm spe cialising in the area of corporate finance and, in particular, the negotiation of bank credit). He sits on the Boards of Directors of SABCA (as a permanent representative of GEFOR) and Wereldhave Belgium and is Chairman of the Audit Committees of these companies.
The Extraordinary General Meeting of Elia System Operator of 17 May 2016 approved the proposed capital increase reserved for members of staff of the company and its Belgian subsidiaries.
This capital increase took place in two stages, in December 2016 and March 2017, for a maximum total of €6 million (max imum of €5,300,000 in 2016 and max imum of €700,000 in 2017) subject to the issuing of new Class B shares, with can cellation of the preferential subscription right of existing shareholders in favour of staff members of the company and its Belgian subsidiaries, if necessary below the accounting par value of the existing shares in the same class.
The Extraordinary General Meeting decided to set the issue price for the 2017 capital increase at a price equal to the average of the closing prices on the 30 calendar days prior to 31 January 2017, less 16.66%.
Remuneration Committee
In addition to its usual support role to the Board of Directors, the Remuneration Committee is responsible, pursuant to Article 526quater of the Belgian Compan ies Code, the Act of 29 April 1999 on the organisation of the electricity market and the articles of association, for making rec ommendations to the Board of Directors regarding remuneration policy and the individual remuneration of members of the Management Committee and direc tors. The Remuneration Committee also draws up a remuneration report for pres entation at the Ordinary General Meeting.
The Remuneration Committee of Elia Sys tem Operator met six times in 2017 11. The Remuneration Committee of Elia Asset met five times in 2017.
The company evaluates its management staff on a yearly basis in accordance with its performance management policy. This policy also applies to members of the
The Remuneration Committee also approved the proposed collective targets for the Management Committee for 2017. In addition, the Remuneration Commit tee approved the remuneration report, which is part of the annual report for 2017, and issued a favourable opinion on the capital increase reserved for personnel.
Audit Committee
In addition to its usual support role to the Board of Directors, the Audit Committee is, pursuant to Article 526bis of the Bel gian Companies Code, the Act of 29 April 1999 on the organisation of the electri city market and the articles of association, responsible in particular for:
— examining accounts and controlling budgets;
— monitoring financial reporting procedures;
— ensuring the effectiveness of the com pany’s internal control and risk manage ment systems;
— following up on internal audits and their effectiveness;
The internal rules of procedure of the Audit Committee require, in this respect, that all members of the Audit Committee have the sufficient experience and exper tise required to exercise the role of the Audit Committee, particularly in terms of accounting, auditing and finance. On the basis of this rule, the professional experi ence of at least two members of the Audit Committee must be detailed in this report.
The experience of the Chairman of the Audit Committee (Jacques de Smet until 16 May 2017 and Michel Allé from that date), and Dominique Offergeld, mem ber of the Audit Committee, is described in detail below.
Jacques de Smet (independent direc tor and Chairman of the Audit Com mittee of Elia System Operator and Elia Asset until 16 May 2017) has an economics degree from the University of Brussels. He started his career as an auditor with Peat Marwick Mitchell & Co (now KPMG). He joined the Tractionel group (now Engie) in 1979, initially as assistant to the CEO of the holding company. He was subse quently assigned to the financial depart ment of the company of the Frima Viking SA group, later becoming CFO of Cha mebel SA. In 1987, he was a member of the Management Committee of the ven
Michel Allé (independent director of Elia System Operator and Elia Asset since 17 May 2016 and Acting Chairman of the Audit Committee from 22 June 2017) has degrees in physics civil engineer ing and economics (both from the Uni versité Libre de Bruxelles (ULB)). Along side his academic career as a professor of econo-mics and finance (Solvay Brussels School, ULB’s École Polytechnique), he worked for many years as a Chief Finan cial Officer. In 1979, he began his career at the Belgian Prime Minister’s Office, as an advisor in the Science Policy Office. He was appointed Director of the National Energy R&D Programme in 1982 and then Director in charge of Innovative Compan ies. In 1987, he joined the Cobepa group, where he held many positions including Vice President of Mosane from 1992 to 1995. From 1995 to 2000, he was a mem ber of the Cobepa group’s Executive Com mittee. He then served as Chief Financial Officer of BIAC between 2001 and 2005 and Chief Financial Officer of SNCB (Bel gian Railways) between 2005 and 2015. He also has extensive experience as a dir ector, including past and present roles at Telenet, Zetes, Eurvest, Mobistar and D’Ieteren. He has served on the Telenet Audit Committee and chaired the Zetes Audit Committee.
Dominique Offergeld (non-independ ent director of Elia System Operator and Elia Asset) has a degree in economics and social science (specialisation: public economics) from Université Notre-Dame de la Paix in Namur. She has taken vari ous extra-academic programmes, including the General Management Program at Cedep (INSEAD) in Fontainebleau (France). She started her career at Générale de Banque (now BNP Paribas Fortis) in the corporate finance department in 1988, and was subsequently appointed as specialist advisor to the vice-president and minister for economic affairs of the Walloon Region in 1999. In 2001, she became advisor to the Dep uty Prime Minister and Minister for For eign Affairs. Between 2004 and 2005, she was deputy director of the office of the minister for energy, subsequently becoming general advisor to the SNCB holding company in 2005. She was previously director of (among others) Publigaz and government commissioner at Fluxys. She was also Chairwoman of the Board of Dir ectors and of the Audit Committee of SNCB. Between 2014 and 2016, she was Director of the Minister for Mobility’s Strategy Unit, with responsibility for Belgocon trol and the SNCB. She has been CFO of ORES SCRL since August 2016, a position she also held between 2008 and 2014.
The Audit Committee may investigate any matter that falls within its remit. For this purpose, it is given the resources it needs to perform this task, has access to all information, with the exception of con fidential commercial data concerning grid users, and can call on internal and exter nal experts for advice.
The Audit Committee met six times in 2017.
The Committee examined the annual accounts for 2016, under both Belgian GAAP and IFRS. It also examined the halfyearly results as at 30 June 2017 and the 2017 quarterly results, in accordance with Belgian GAAP and IFRS rules.
The Committee took note of the internal audits carried out and the recommenda tions made.
AMENDMENTS TO THE ARTICLES OF ASSOCIATION FOLLOWING IMPLEMENTATION OF THE CAPITAL INCREASE RESERVED FOR STAFF MEMBERS
ELIA ANNUAL REPORT 2017 - 105104 - ELIA ANNUAL REPORT 2017 Corporate governance statement
(11) Including one meeting held before a notary in order to formally record the capital increase reserved for staff members. (12) Supply reliability indicator: number of minutes per consumer per year.
The Committee follows an action plan for each audit carried out in order to improve the efficiency, traceability and awareness of the areas audited and thereby reduce the associated risks and provide assur ance that the control environment and risk management are appropriate. The Committee followed the various action plans from a number of perspectives (timetable, results, priorities) on the basis, among other things, of an activity report from the internal audit department. The Audit Committee noted the strategic risks and the ad hoc risk analyses based on the environment in which the group operates. The Audit Committee also oversaw the monitoring of environmental issues.
Corporate Governance Committee
In addition to its usual support role to the Board of Directors, the Corporate Govern ance Committee is, pursuant to the Act of 29 April 1999 on the organisation of the electricity market and the articles of asso ciation, responsible for:


— proposing candidates to the General Meeting to be appointed as independ ent directors;
— giving prior approval for the appoint ment and/or removal (where applicable) of Management Committee members;
— examining, at the request of any independent director, the Chairman of the Management Committee or any competent federal and/or regional regulatory body or bodies for the elec tricity market, all cases of conflicts of interests between the system operator, on the one hand, and a domin ant shareholder, municipal shareholder or company associated with or linked to a dominant shareholder, on the other hand, and to report to the Board of Dir ectors on the matter. This responsib ility aims to strengthen the directors’ independence above and beyond the procedure detailed in Article 524 of the Belgian Companies Code, which the company also applies;
— deciding on cases of incompatibility on the part of members of the Manage ment Committee and personnel;
— ensuring the application within the company of provisions laid down by law, regulations, decrees and other instru
ments relating to the operation of elec tricity systems, evaluating their effect iveness in view of the objectives for the independent and impartial operation of those systems, and ensuring com pliance with Articles 4.4 and 13.1(2) and (3) of Elia System Operator’s articles of association. A report on this subject is submitted every year to the Board of Directors and the federal and/or regional body or bodies responsible for regulating the electricity market;
— convening, at the request of at least one third of the members, meetings of the Board of Directors in accordance with the formalities for calling meetings as laid down in the articles of association;
— examining, after notification by a direc tor, whether a director’s membership of the supervisory board, the board of dir ectors or bodies legally representing an undertaking which exercises con trol, directly or indirectly, over an electri city producer and/or supplier complies with Article 9.1b), c) and d) of Directive 2009/72/EC of the European Parliament and of the Council of 13 July 2009 con cerning common rules for the internal market in electricity, and reporting on this matter to the Board of Directors. As part of this examination, the Com mittee takes account of the role and influence that the director concerned has in the undertaking concerned and of the degree of control or influ ence that the undertaking concerned has over its subsidiary. The Committee also examines whether, in the exercising of the director’s role within the company, there is the potential or motive for favouring certain generation or supply interests as regards access to and investment in the grid, to the detri ment of other grid users;
— ensuring, prior to any appointment of a director, irrespective of whether such appointment concerns a new director or the re-election of an existing director, whether the candidate director takes account of the incompatibilities set forth in the company’s articles of associ ation. To this end, every candidate direc tor is required to provide the Commit tee with an overview of (i) any offices he or she holds on the board of directors, the supervisory board or any other body of other legal entities other than the company and (ii) any other functions or activities, paid or unpaid, which he or
she carries out for an undertaking per forming any of the following functions: the generation or supply of electricity.
The Committee met 10 times in 2017.
In line with its competences under the law and the articles of association and in compliance with confidentiality rules, the Committee deals in particular with the following matters: the prior approval for the appointment of new mem bers of the Management Committee, the proposal of candidates for independent directorships, the application and the compliance with the requirements of laws, regulations and the articles of asso ciation concerning the independence of the company’s independent directors, the analysis of compliance with requirements in the area of full ownership unbundling as provided for by law and the articles of association, and the preparation of the corporate governance statement.
Management Committee
Pursuant to Article 9(9) of the Act of 29 April 1999 on the organisation of the elec tricity market and the articles of associ ation, the Management Committee is responsible in particular for:
— the operational management of the electricity grids, including commercial, technical, financial, regulatory and per sonnel issues related to such operational management;
— day-to-day management of the system operator;
— the exercise of powers given to it under the articles of association;
— the exercise of powers delegated to it by the Board of Directors, in accordance with the general policy rules and princi ples and the resolutions adopted by the Board of Directors.
The Management Committee has all powers necessary, including the power of representation, and sufficient margin for manoeuvre to exercise the powers that have been delegated to it and to pro pose and implement a corporate strategy, without prejudice to the powers of the Board of Directors and the obligation on the part of the Board of Directors to observe the legal restrictions in terms of
access to commercial data and other con fidential data relating to grid users and the processing of such data.
The Management Committee generally meets formally at least once a month. Its members also attend informal weekly meetings. Members who are unable to attend usually have a representative. A written proxy, conveyed by any means (of which the authenticity of its source can be reasonably determined), can be given to another member of the Management Committee, in accordance with the inter nal rules of procedure of the Manage ment Committee. However, no repre sentative may represent more than two members.
In 2017, the Management Committee met on 20 occasions for Elia System Operator and on 20 occasions for Elia Asset.
Each quarter, the Management Com mittee reports to the Board of Direc tors on the company’s financial situation (in particular on the balance between the budget and the results stated). It also reports on transmission system manage ment at each meeting of the Board of Directors. As part of its reporting on management of the transmission system in 2017, the Management Committee kept the Board informed of strategic issues,
developments in legislation applying to the company, the company’s financial situation, the situation of its subsidiaries, the main decisions taken by regulators and administrations, as well as the monitoring and development of major invest ment projects.
Corporate social responsibility (CSR) at Elia System Operator and Elia Asset is the responsibility of the Chief Public Accept ance Officer.


 MANAGEMENT COMMITTEE
Chris Peeters
Peter Michiels
Markus Berger Ilse Tant
Patrick De Leener
Catherine Vandenborre
Frédéric Dunon Pascale Fonck
MANAGEMENT COMMITTEE
Chris Peeters
Peter Michiels
Markus Berger Ilse Tant
Patrick De Leener
Catherine Vandenborre
Frédéric Dunon Pascale Fonck
ELIA ANNUAL REPORT 2017 - 107106 - ELIA ANNUAL REPORT 2017 Corporate governance statement
Remuneration Report
REMUNERATION OF THE MEMBERS OF THE BOARD OF DIRECTORS AND THE MANAGEMENT COMMITTEECHANGES IN THE COMPOSITION OF THE MANAGEMENT COMMITTEE
Peter Michiels was appointed as a mem ber of the Management Committee from 3 January 2017. Peter Michiels holds the position of Chief Human Resources & Internal Communication Officer.
In addition, Patrick De Leener was appointed as a member of the Manage ment Committee from 1 February 2017, replacing Frank Vandenberghe. Patrick De Leener holds the position of Chief Cus tomers, Market & System Officer.
In accordance with the Act of 3 Septem ber 2017 on the disclosure of non-finan cial information and diversity information by certain large companies and groups, the composition of the Management Committee is based on gender diversity and diversity in general, as well as on the complementarity of skills, experience and knowledge.
When searching for and appointing new members of the Management Commit tee, special attention is paid to diversity parameters in terms of age, gender and complementarity.
CODE OF CONDUCT
Following the entry into force of European Regulation (EU) No. 596/2014 on mar ket abuse, Elia amended its Code of Con duct that aims to prevent staff and those with leadership responsibilities in the Elia Group from potentially breaking any laws on the use of privileged information and market manipulation. The Code of Con duct lays down a series of regulations and communication obligations for trans actions by those individuals in relation to their Elia System Operator securities, in accordance with the provisions of the Market Abuse Regulation and the Act of 2 August 2002 on monitoring of the finan cial sector and other financial services. This Code of Conduct is available on the company’s website (www.elia.be, under ‘Elia’, ‘Corporate Governance’).
CORPORATE GOVERNANCE CHARTER AND INTERNAL RULES OF PROCEDURE OF THE BOARD OF DIRECTORS, THE BOARD’S ADVISORY COMMITTEES AND THE MANAGEMENT COMMITTEE
The Corporate Governance Charter and the internal rules of procedure of the Board of Directors, the Board’s advisory committees and the Management Com mittee can be found on the company’s website (www.elia.be, under ‘Elia’, ‘Corpor ate Governance’).
TRANSPARENCY RULES - NOTIFICATIONS
On 17 January 2017, Elia System Operator received notifications within the meaning of the Act of 2 May 2007 on the disclosure of major shareholdings in issuers whose shares are admitted to trading on a regu lated market and laying down miscellan eous provisions, and within the meaning of the Royal Decree of 14 February 2008 on the disclosure of major sharehold ings. More specifically, following the cap ital increase reserved for Elia staff mem bers of 22 December 2016, on 17 January 2017 Publi-T notified Elia that its stake in Elia had fallen below the threshold of 45% of total Elia shares on 22 December 2016 and that its shareholding in Elia was now 44.97%. Société Fédérale de Participa tions et d’Investissement, with which Pub li-T acts in concert, also notified Elia on 17 January 2017 that its sharehold ing in Elia had decreased to 2.02% on 22 December 2016. Their total stake in Elia was therefore 46.99% on 22 Decem ber 2016. The change in the percentages of their shareholdings is passive in nature and is a result of the capital increase reserved for personnel in late 2016; the number of shares held by Publi-T and Société Fédérale de Participations et d’In vestissement did not change.
In accordance with Article 15 of the Act of 2 May 2007, on 4 April 2017 Elia System Operator gave notice of the realisation of the capital increase reserved for the per sonnel of Elia System Operator SA and its Belgian subsidiaries, which was formally recorded before a notary on 23 March 2017 and led to the issuing of 9,861 new shares in Elia System Operator. See also the press release of 4 April 2017, published on the company’s website.
The total number of shares issued by Elia is 60,901,019.
For more information about the share holder structure as at 31 December 2017, see the section ‘Shareholder structure on the closing date’.
In accordance with Articles 16.1 and 15.1 of the respective articles of association of Elia System Operator and Elia Asset, a draft remuneration policy for members of the Board of Directors and the Manage ment Committee was drawn up in 2016 by the Remuneration Committee and approved by the Boards of Directors of Elia System Operator and Elia Asset.
The draft remuneration policy for direc tors was approved by the General Mee ting of Shareholders of Elia System Opera tor and Elia Asset on 17 May 2016.
The Remuneration Committee also made recommendations regarding the remune ration policy and the remuneration of directors and Management Committee members.
The composition and activities of the Remuneration Committee are covered in greater detail on page 104 of the annual report.
Remuneration of members of the board of directors
Following the decision adopted by the Ordinary General Meeting of Elia System Operator and Elia Asset on 17 May 2016, the rules on the remuneration of directors were amended. The new rules, effective from 1 January 2016, are described below.
The total cost of gross remuneration paid to the 14 directors in 2017 was €872,583.54 (€437,177.27 for Elia System Operator and €435,406.27 for Elia Asset).
The table below lists the individual gross sums paid to each director for Elia System Operator and Elia Asset combined.
These amounts were calculated on the basis of 12 meetings of the Board of Direc tors of Elia System Operator and 12 mee tings of the Board of Directors of Elia Asset in 2017. In 2017, the Audit Com mittee met six times, the Corporate Governance Committee 10 times, the Remuneration Committee of Elia System Operator six times13 and the Remunera tion Committee of Elia Asset five times.
Directors’ remuneration consists of a basic remuneration of €25,000 per annum (€12,500 for Elia System Operator and €12,500 for Elia Asset) and an attendance fee of €1,500 (€750 for Elia System Ope rator and €750 for Elia Asset) per Board meeting, starting with the first Board meeting attended by the director. The basic annual remuneration and the atten dance fee are increased by 100% for the Chairman of the Board of Directors and by 30% for each Vice-Chairman of the Board of Directors.
For each company, additional basic remuneration for each member of an advisory committee to the Board of Direc tors (the Audit Committee, the Remune ration Committee and the Corporate Governance Committee) is set at €3,000 per annum per committee, and the atten dance fee for each member of a com mittee is €750 per committee meeting (starting with the first committee meeting attended by the member). Both the basic remuneration and the attendance fee are increased by 30% for each committee chairman.
The basic annual remuneration and the attendance fees are indexed in January each year on the basis of the consumer price index for January 2016.
The basic annual remuneration and the attendance fees cover all costs, except (a) any costs incurred by a director resident
outside Belgium in connection with the exercise of his/her office (such as travel and accommodation costs) providing that the director in question was resident out side Belgium at the time of appointment or, if the director changed his/her place of residence after appointment, provi ding that the Remuneration Committee gave its approval; (b) any costs incurred by a director in the event that a meeting of the Board of Directors is held outside Bel gium (e.g. in Germany); and (c) any costs incurred by a director travelling abroad in connection with the exercise of his/ her office upon the request of the Chair man or a Vice-Chairman of the Board of Directors. All remuneration and costs are included in the company’s operating costs.
Procedure approved in 2016 to define the remuneration policy and the remuneration of members of the board of directors and the management committee
ELIA ANNUAL REPORT 2017 - 109108 - ELIA ANNUAL REPORT 2017 Corporate governance statement
(13) Including one meeting held before a notary in order to formally record the capital increase reserved for staff members. DIVERSITY WITHIN THE MANAGEMENT COMMITTEE Number of people on the Management Committee of Elia System Operator and Elia Asset as at 31 December 2017 Unit 2017 Men Aged 30 - 50 1 Aged over 50 4 Women Aged 30 - 50 2 Aged over 50 1
BOARD OF DIRECTORS OF
BOARD OF DIRECTORS
AUDIT COMMITTEE OF
DIRECTOR REMUNERATION
SYSTEM OPERATOR
AUDIT COMMITTEE OF
ASSET
Michel ALLÉ €51,310.86 10/12 10/12 3/314 3/315
GOVERNANCE COMMITTEE OF ELIA SYSTEM OPERATOR
GOVERNANCE COMMITTEE OF ELIA ASSET
REMUNERATION COMMITTEE OF ELIA SYSTEM OPERATOR
Management committee remuneration policy
The remuneration of members of the Management Committee consists of the following components:
In 2017, the short-term variable remunera tion earned by the Chairman of the Mana gement Committee was €259,997.44.
ASPIRATIONS
REMUNERATION COMMITTEE OF ELIA ASSET
Jacques DE SMET16 €30,751.40 3/3 3/3 3/3 3/3 4/4 3/3
Luc DE TEMMERMAN17 €78,556.40 12/12 12/12 6/6 6/6 6/6 5/5
Frank DONCK18 €76,478.00 10/12 10/12 5/6 5/6 10/10 10/10
Cécile FLANDRE19 €37,982.00 8/12 8/12
Claude GRÉGOIRE20 €91,491.68 12/12 12/12 5/6 5/5
Bernard GUSTIN21 €29,000.30 8/9 8/9
Philip HEYLEN €58,000.00 10/12 10/12 7/10 7/10
Luc HUJOEL22 €69,087.40 10/12 10/12 10/10 10/10
Roberte KESTEMAN23 €10,779.16 4/4 4/4
Miriam MAES24 €41,317.78 4/8 4/8
Jane MURPHY €64,160.00 12/12 12/12 9/10 9/10
Dominique OFFERGELD €54,920.00 11/12 11/12 4/6 4/6
Rudy PROVOOST25 €30,027.06 9/9 9/9
Saskia VAN UFFELEN26 €78,018.00 12/12 12/12 9/10 9/10 5/6 5/5
Geert VERSNICK €63,774.48 12/12 12/12 6/6 6/6
Peter VANVELTHOVEN27 €6,929.02 1/1 1/1
(14) Michel Allé has been a member and Chairman of the Audit Committee of Elia System Operator since 22 June 2017.
(15) Michel Allé has been a member and Chairman of the Audit Committee of Elia Asset since 22 June 2017.
(16) Jacques de Smet’s directorship expired on 16 May 2017.
(17) Luc De Temmerman’s fees are paid to the company InDeBom Strategies Comm. V.
(18) Frank Donck’s fees are paid to the company Ibervest NV.
(19) Cécile Flandre’s fees are paid to the company Belfius Insurance SA.
(20) Claude Grégoire’s fees are paid to the company Socofe SA.
(21)Bernard Gustin has been a director since 16 May 2017. Bernard Gustin’s fees are paid to the company Bernard Gustin SPRL.
(22) Luc Hujoel’s fees are paid to the company Interfin CVBA.
(23) Roberte Kesteman has been a director since 27 October 2017. Roberte Kesteman’s fees are paid to the company Symvouli BVBA.
ELIA SYSTEM OPERATOR (26) Saskia Van Uffelen’s fees are paid to the company Quadrature SPRL.
OF ELIA ASSET (27) Peter Vanvelthoven resigned with effect from 19 March 2017.
All remuneration is paid on a pro rata basis according to the duration of the director’s term of office.
An advance on annual remuneration is paid to the directors at the end of the 1st, 2nd and 3rd quarter. A detailed account is prepared during the month of December for the current year.
Our remuneration system is designed to attract, retain and motivate the most talented individuals to achieve our shortand long-term goals within a consistent framework.
THE PRINCIPLES GOVERNING REMUNERATION OF THE GROUP’S EXECUTIVES ARE:
— Focus on safety first and work in the interests of the company by targeting operational performance
— Design a salary scheme that encour ages executives to live up to our core values of entrepreneurship, collabora tion, accountability and agility
— Attract, retain and nurture the best tal ent to achieve our strategy and goals in the short- and long-term
— Ensure that our variable remuneration rewards both team success at company level and individual contributions
— Develop a job classification and staff remuneration system based on an objective and measurable methodology
— Position the remuneration system at the appropriate point of reference in the marketplace to attract the talent we need and to be competitive, using data from multiple providers (including Hay)
— Do not discriminate between employ ees on any grounds whatsoever through our remuneration system
— Design our benefit plans to promote retention and provide a secure environ ment for our employees and their families
— basic salary;
— short-term variable remuneration;
— long-term variable remuneration;
— pension;
— other benefits.
In accordance with Article 17.9 of the articles of association of Elia System Operator, an exemption from the pro visions of Article 520ter(1) and (2) of the Belgian Companies Code is provi ded for members of the Management Committee.
As regards variable remuneration, the Remuneration Committee evaluates the members of the Management Com mittee at the end of each year based on a number of qualitative and quantitative targets. Since 2008, variable remunera tion has comprised two components: a short-term one and a long-term one.
BASIC REMUNERATION
All the members of the Management Committee of Elia System Operator and Elia Asset have employee status.
In 2017, the basic remuneration paid to the Chairman of the Management Com mittee was €409,647.13. The recurring remuneration paid to the other members of the Management Committee totalled €1,417,147.29 (€948,406.65 for manage ment employed by Elia System Opera tor and €468,740.64 for management employed by Elia Asset).
The variable remuneration earned by other members of the Management Committee in 2017 was €534,605.94 (€360,872.59 for management employed by Elia System Operator and €173,733.35 for management employed by Elia Asset).
A total of €794,603.37 in variable remune ration was therefore paid to members of the Management Committee in 2017.
The collective targets for 2017 were:
— Net financial result after tax
— OPEX efficiency
— Safety
— Implementation and monitoring of collective projects and our company transformation
— AIT (grid reliability)
TOTAL ANNUAL REMUNERATION
In 2017, the total remuneration paid to the Chairman of the Management Commit tee was €669,644.57.
The total annual remuneration of other members of the Management Com mittee was €1,951,753.23 (€1,309,279.24 for management employed by Elia Sys tem Operator and €642,473.99 for mana gement employed by Elia Asset).
Total annual remuneration for all mem bers of the Management Committee in 2017 was therefore €2,621,397.79.
LONG-TERM VARIABLE REMUNERATION
(24) Miriam Maes’s directorship expired on 27 October 2017.
Directors do not receive any other bene fits in kind, stock options, special loans or advances. Neither Elia System Opera tor nor Elia Asset has issued credit to or on behalf of any member of the Board of Directors.
The Remuneration Committee evaluates the members of the Management Com mittee once a year. Any change in the basic remuneration is linked to the posi tion of each member of the Management Committee with respect to the general benchmark salary in the market and the assessment of the member’s individual performance.
Since 2004, the Hay Group methodology has been used to define the weighting for each management position and to ensure that remuneration is in line with the going market rate.
Total basic remuneration of €1,826,794.42 was therefore paid to members of the Management Committee in 2017.
SHORT-TERM VARIABLE REMUNERATION
ELIA ANNUAL REPORT 2017 - 111110 - ELIA ANNUAL REPORT 2017 Corporate governance statement (25) Rudy Provoost has been a director since 16 May 2017.
The first component of variable remune ration is based on the attainment of a certain number of targets set by the Remuneration Committee at the start of the year, with a maximum of 25% of variable remuneration for the individual targets and 75% for the attainment of the Elia Group’s collective targets (‘short-term incentive plan’).
The second component of variable remuneration is based on multi-annual criteria covering a period of four years (‘long-term incentive plan’). The variable remuneration earned in 2017 can be esti mated at €56,671.96 (maximum amount in the event of full attainment of the multi-annual criteria for the tariff period concerned) for the Chairman of the Mana gement Committee for services rende red in 2017 and €363,328.50 for the other members of the Management Com mittee (€245,649.94 for management employed by Elia System Operator and €117,678.56 for management employed by Elia Asset).
ELIA
ELIA
These amounts are reviewed at the end of each year based on the achievement of the multi-annual criteria. The first part of the long-term variable remuneration for the 2016-2019 tariff period will be paid in 2018 and the balance in 2020. No other variable remuneration was paid in 2017. Remuneration is definitively acquired at the moment of payment.
CLAWBACK
Bonuses paid for the prior period may be clawed back in case of proven fraud or significant misstatements in financial reporting.
CONTRIBUTIONS TO THE SUPPLEMENTARY PENSION SCHEME
Since 2007, all pension plans for Manage ment Committee members have been defined contribution plans, where the amount paid, excluding tax, is calculated on the basis of annual remuneration. In 2017, Elia System Operator paid a total of €106,236.88 for the Chairman of the Management Committee.
For the other members of the Mana gement Committee, Elia paid a total of €317,684.72 (€203,078.31 for manage ment employed by Elia System Ope rator and €114,606.41 for management employed by Elia Asset).
OTHER BENEFITS
Other benefits awarded to members of the Management Committee, such as guaranteed income in the event of long-term illness or an accident, health care and hospitalisation insurance, invali dity insurance, life insurance, tariff bene fits, other allowances, assistance with public transport costs, provision of a com pany car, employer-borne costs and other minor benefits are in line with the regula tions applying to all company executives.
The cost of these other benefits for 2017 was valued at €40,701.54 for the Chair man of the Management Committee and at €209,718.96 for the other members of the Management Committee (€135,217.08 for management employed by Elia System Operator and €74,501.88 for management employed by Elia Asset).
There were no stock options awarded in Elia for the Management Committee in 2017.
PROVISIONS OF EMPLOYMENT CONTRACTS AND SEVERANCE BENEFITS OF MEMBERS OF THE MANAGEMENT COMMITTEE
The employment contracts of Manage ment Committee members concluded after 3 May 2010 were drawn up in accor dance with the prevailing legislation on notice periods and dismissal.
The employment contracts of members of the Management Committee hired before 3 May 2010 contain no specific pro visions regarding dismissal.
If the company decides to impose a 12-month non-compete restriction on a Management Committee member, that member is entitled to an additional six months’ compensation.
OTHER INFORMATION TO BE COMMUNICATED PURSUANT TO ARTICLE 96 OF THE BELGIAN COMPANIES CODE AND ARTICLE 34 OF THE ROYAL DECREE OF 14 NOVEMBER 2007 ON THE OBLIGATIONS OF ISSUERS OF FINANCIAL INSTRUMENTS ADMITTED TO TRADING ON A REGULATED MARKET
This section contains the information required to be disclosed under the afore mentioned legislation and not included in other parts of the annual report.
Information regarding special control rights of certain holders of securities In accordance with Article 4.3 of the arti cles of association of Elia System Oper ator and Elia Asset, all shares in these two companies have the same rights, irrespec tive of the class to which they belong, unless otherwise stated in the articles of association.
Information regarding the rules on amending the articles of association
In the event of the articles of association of Elia System Operator and Elia Asset being amended, Article 29 of the articles of association of Elia System Operator and Article 28 of the articles of association of Elia Asset are applicable.
Information regarding statutory limitations or limitations under the articles of association on transfers of securities
Transfers of securities within Elia System Operator are governed by Article 9 of the articles of association of Elia System Operator.
SHAREHOLDER STRUCTURE ON THE CLOSING DATE
Elia System Operator shares held by members of the Management Committee
The members of the Management Committee held the following number of shares as at 31 December 2017:
MEMBERS OF THE MANAGEMENT COMMITTEE 28 AS AT 31.12.2017 AS AT 31.12.2016
Chris PEETERS
Chief Executive OfficerChairman of the Executive Committee
1,844 1,805
Chief Infrastructure Officer 9,156 9,156
Markus BERGER
In this context, the articles of association state that specific rights are associated with Class A and Class C shares regard ing (i) the appointment of members of the Board of Directors (Article 13.5.2 of the articles of association of Elia System Operator and Article 12.5.2 of the arti cles of association of Elia Asset) and (ii) the approval of decisions by the General Meeting (Articles 28.2.1 and 28.2.2 of the articles of association of Elia System Oper ator and Article 27.2 of the articles of asso ciation of Elia Asset).
SHARES % SHARES % VOTING RIGHTS
Publi –T (Class B and C shares) 27,383,50731 44.96 44.96
Publipart (Class A shares) 1,526,756 2.51 2.51
Belfius Insurance (Société Fédérale de Participations et d’Investissement) (Class B shares)
1,134,76032 1.86 1.86
Chief Customers, Market & System Officer 3,125
Patrick DE LEENER29
Frédéric DUNON
Chief Assets Officer 2,852 2,833
Information regarding statutory limitations or limitations under the articles of association on the exercising of voting rights
Katoen Natie Group (Class B shares) 4,231,14832 6.95 6.95
Interfin (Class B shares) 2,598,143 4.27 4.27
Pascale FONCK
Chief Officer External Relations 661 661
Peter MICHIELS30
Chief Human Resources & Internal Communication Officer 0
Ilse TANT
Chief Public Acceptance Officer
Catherine VANDENBORRE
Chief Financial Officer
2,460 2,460
1,389 1,355
No stock options were awarded at Elia System Operator for the members of the Management Committee in 2017. Members of the Management Committee may pur chase shares via existing capital increases reserved for members of personnel or on the stock exchange.
In accordance with Article 4.3(3) of the articles of association of Elia System Ope rator and Elia Asset, the voting rights associated with shares held directly or indirectly by companies active in the generation and/or supply of electricity and/or natural gas are suspended.
Other Free float (Class B shares) 24,026,705 39.45 39.45
Total 60,901,019 100 100
(28) Positions held on 31/12/2017.
(29) Patrick De Leener was appointed Chief Customers, Market & System Officer from February 2017.
(30) Peter Michiels was appointed Chief Human Resources & Internal Communication Officer from 3 January 2017.
(31) Based on the Publi-T - Société Fédérale de Participations et d’Investissement declaration of trans parency of 17 January 2017. For more information on declarations of transparency, see ‘Transparency rules – Notifications’ above.
ELIA ANNUAL REPORT 2017 113112 ELIA ANNUAL REPORT 2017 Corporate governance statement (32) Based on the number of shares participating in the Ordinary General Meeting of Elia System Operator and Elia Asset on 16 May 2017.
Risks and uncertainties facing the company
1. Regulatory and income risks
INTERNATIONAL
The two transmission system operators in the Elia Group strive to proactively antici pate European legislation, new directives and regulations being prepared at EU level or awaiting transposition into Belgian and German law in order to minimise uncer tainties. Elia and 50Hertz are paying par ticularly close attention to ongoing dis cussions at European level – formalised by measures including the ‘winter package’ –that could have a significant influence on the duties and responsibilities of transmis sion system operators in future.
Both Elia and 50 Hertz have received cer tification as ownership unbundled trans mission system operators. They are thus considered to be fully independent of electricity and gas producers and suppli ers. They must constantly stay in line with the obligations arising from this certifica tion. In addition, both Elia and 50Hertz continue to actively participate in projects designed to arrive to the Single European Energy Market, as envisaged by the European Commission.
This authorisation is limited in time (20 years), but can be revoked earlier if Elia or 50Hertz do not have, inter alia, the human, technical and/or financial resour ces to guarantee the continuous and reli able operation of the grid in accordance with the applicable legislation, as well as the unbundling obligations as described in Article 9 of the EU Electricity Directive.
Such a revocation would have an adverse material impact on Elia and/or 50Hertz.
Elia and 50Hertz are also founding members of the European Network of Transmission System Operators for Electricity (ENTSO-E), which was set up in December 2008 and brings together 43 transmission system operators from
36 countries, including the EU Member States. Amongst other things, ENTSO-E performs the role of the European Network of Transmission System Operators provided for in the third package.
NATIONAL
The Belgian legal framework was estab lished when the first EU Directive on the internal electricity market was transposed by the Electricity Act of 29 April 1999. The amendment of 8 January 2012 adapted the Electricity Act to comply with the third package of European directives.
In accordance with Article 258 of the Treaty on the Functioning of the European Union, the European Commission mon itors the transposition of European dir ectives into national legislation. In this connection, it sent a reasoned opin ion to Belgium on 25 February 2016 in which it found – if the press release is to be believed – that Belgium had not cor rectly transposed certain rules on inter connections, the powers of the regulator, and consumers. The Belgian authorities are talking to the Commission about the measures that have been taken or should be taken to remedy the situation.
The company’s net profit is largely deter mined by a fair return mechanism and by a tariff incentive mechanism. For the per iod 2016-2019, various incentives distrib uted over four years were introduced.
Elia’s financial result is influenced annu ally by changes to Belgian linear bonds (10-year OLOs) and by a special mech anism that took effect in 2016. This mechanism includes an incentive linked to the progress of construction work for major projects mainly linked to inter connection capabilities, and a corrective term which reflects the gap between the real value of the OLO during the year and a benchmark value. Elia’s financial result is also influenced by its ability to realise and/ or exceed the factors for improving effi ciency, by the results achieved by various incentives established by the regulation; and by the analyses of the various budget items implemented ex post by the federal regulator.
On 3 December 2015, the tariffs and mechanisms determining Elia’s profitability as Belgium’s transmission system operator were approved by CREG for
a new four-year tariff period, effective 1 January 2016.
Elia’s turnover also depends on the energy transported via its grid, and therefore on the level of business activity of its cus tomers and the society it serves at large, including the rapid increase in decen tralised electricity generation being dir ectly injected to the distribution net works. The actual level of residential and household electricity consumption may result in differences between the elec tricity volumes actually transmitted and those estimates built into the 20162019 tariffs as approved by the regula tor. Any deficit and/or extra costs incurred as a result, such as additional financing requirements, must be offset by the tariffs for the following regulatory periods, under the prevailing regulations. The impact on the electricity consumption and injection of Elia’s various customer segments and the uncertainty surrounding the outlook for levels of business activity amongst industrial clients pose a risk to Elia’s cash flow.
The Electricity Act recently made the transmission system operator respon sible for developing a transmission grid in the marine areas over which Belgium can exercise its jurisdiction. Discussions are currently underway with CREG concerning a specific regulatory framework for this grid. This specific extension of the cur rent regulatory framework must, in par ticular, take account of the risks associated with such an activity, including regula tory, contractual and technical risks. The significant increase in energy expected from the new offshore wind farms will also be accompanied by a considerable rise in the levy to cover the purchase costs of new green certificates. Greater attention will be paid to managing the cash flow resulting from this situation.
Elia’s income is influenced by the divi dends received from companies in which it has shareholdings, in particular those of 50Hertz, via Eurogrid International.
The tariffs charged by 50Hertz are sub ject to regulation by the German federal regulatory agency, Bundesnetzagentur (BNetzA). Decisions made and actions taken by the BNetzA under the current regulatory framework may have a sub stantial impact on 50Hertz.
Furthermore, the German regulatory framework governing the activities of 50Hertz is subject to extensive European, national and regional legislation and regu lation. While 50Hertz tries to anticipate European legislation, new directives and regulations in preparation at European level or existing regulations and directives awaiting transposition into national law may always cause uncertainties.
Legislation and directives regarding renewable energy sources may also have a great impact on 50Hertz’s liquidity. Changes in the legislation may lead to sig nificant variations in the current regula tory and/or liquidity risk.
DIVISION OF POWERS
The regulatory and legal framework entails risks with regard to the division of powers between Belgium’s federal and regional entities. For instance, contra dictions between the various regulations, including the grid codes, could hinder the exercise of the company’s activities. The further development of and changes to these regulations may also impact the company’s liability in the event of a power outage on the grid or – in the context of a reform of the State – the division of pow ers between federal and regional authorities, potentially including the power to approve transmission tariffs.
As regards tariff levies, Wallonia’s regu lations were amended in 2017 and now lay out the principles for a new mechanism for freezing green certificates. Essentially, the mechanism provides that the Walloon Region will buy a set volume of green certificates from Elia each year, based on a proposal from GRTL and an opinion from CWaPE, in the aim of ensuring that the financial balance of the levy can be respected without the levy itself being increased. The Walloon Region will then hold onto the certificates until at least 2022 and will, if possible, gradually resell them on the market. After a nineyear ‘freeze’, any remaining certificates that could not be resold on the market will be resold to GRTL under a new Public Service Obligation placed on GRTL and covered by the levy. After the first freeze operation in September 2017, the regu latory receivable created by the levy was resorbed in full and should not, in prin ciple, reappear in the first few months of 2018. It is also worth noting that the Walloon Government, which has been in office since summer 2017, has expressed its intention to carry out an in-depth review of the regional subsidy scheme for new renewable generation and, by exten sion, the future operation of the market for green certificates. Vigilant oversight of the change in the green certificates mar ket therefore remains applicable. To a lesser extent, the ongoing saturation of the Flemish market for cogeneration cer tificates has led to the number of sales to Elia at the guaranteed minimum price remaining high, but nonetheless in line with forecasts.
2. Operational risks ENERGY BALANCE
Every year, Elia and 50Hertz Transmission seek to contract, at the lowest possible cost, the reserves needed to ensure con tinual balance between production and consumption in their respective zones. To that end, they analyse, both at national and European level, how the growing pro portion of intermittent renewable energy generation units can be safely integrated without compromising the energy balance. The growth across Europe in the number of cogeneration and renewable energy units connected to distribution systems and the connection of large off shore wind farms also create new challen ges for operational grid management and require the further development of their infrastructure.
A new and important development since 2014 has been the negative trend in Belgium’s national electricity production, as a result of closures and mothballing of production units, resulting in an overall decrease in the production capacity avail able to Belgian consumers and a growing dependency on electricity imports from foreign markets. A consequence of these supply conditions has been the creation of strategic electricity reserves for the win ter period. These reserves consist of ear marked and reserved electricity genera tion capacity sitting outside the electricity market, to be called upon by the TSO in the event of electricity shortages. The many events that occurred in recent years regard ing Belgian nuclear generating facilities illustrate the uncertainties impacting sup ply conditions. The actual availability and location of nuclear generation also inter act with maintenance and/or investment programmes on the 400 kV networks, as well as the conditions governing access to resources capable of providing the auxiliary services needed for system operation.
It cannot be ruled out that other electri city production units may be closed or mothballed in future, which will keep the supply situation under pressure. In a similar vein, uncertainty regarding the dwindling availability of France’s nuclear gener ation facilities may lead to a decrease in the quantities of energy imported from France. The need to continue resorting to strategic reserves and/or other mechanisms therefore remains a major concern for future years.
ELIA ANNUAL REPORT 2017 - 115114 ELIA ANNUAL REPORT 2017
Corporate governance statement
In addition, changing trends in offtake and injection and the enhancement of interconnection capacity between EU Member States are dependent on securing permits and approvals from local, regional, national and international authorities. The need to obtain such approvals and permits within certain timeframes represents a critical challenge to timely implementation. Moreover, these approvals and permits can be con tested in the relevant courts.
Finally, while volumes of decentralised intermittent electricity generation are rising and while centralised generation capacity continues to decrease, Elia is also facing an ageing asset base. All three fac tors complicate the task of maintaining balance on the network.
POWER OUTAGES
The reliability of the transmission sys tems operated by Elia and 50Hertz is among the best in Europe. Nonetheless, unforeseen events, such as unfavourable weather conditions, may occur to a degree which interrupts the smooth oper ation of one or more infrastructure com ponents. In most cases, these incidents have no impact on consumers’ power supply because the meshed structure of the grids operated by Elia and 50Hertz means that consumers can be reached via a number of different connections. However, in extreme cases an incident in the electricity system may lead to a local or widespread outage (known as a black out). Such outages may be caused by nat ural phenomena, unforeseen incidents or operational problems, either in Belgium or abroad. The Elia Group regularly holds crisis management drills so that it is ready to deal with the most unexpected and extreme situations. In the event of an error attributable to Elia, the general terms and conditions of its contracts limit the liability of Elia and 50Hertz to a reasonable level, while its insurance policy is designed to limit some of the financial repercussions of these risks.
RISKS ASSOCIATED WITH ELECTRONIC, IT AND TELECOMMUNICATION EQUIPMENT
The incorporation and embedding of electronic, IT and telecommunication technologies in electricity transmission systems for the purposes of operational management, communication and sur veillance (such as smart grids) modifies the nature of the electricity systems and infrastructure used by TSOs such as Elia and 50Hertz.
Failures in the telecommunications net work or IT systems used to operate the electricity system may harm the lat ter’s performance. Elia takes appropri ate measures to back up the IT network and associated systems to the maximum extent allowed by technical and finan cial considerations. It has drawn up and regularly tests recovery plans for the most critical IT systems. However, component failures in the telecommunication net work and IT systems are impossible to rule out. Where systems do fail, Elia will strive to minimise the impact on customers.
ENVIRONMENTAL RISK
Elia’s results may be affected by outgoings needed to keep up with environmental legislation, including costs associated with implementing preventive or corrective measures or settling third-party claims. The company’s environmental policy is developed and monitored in such a way as to manage these risks. Where Elia or 50Hertz might in any way be liable for decontamination, the appro priate provisions are set aside.
PERMITTING RISK
Both Elia and 50Hertz have a duty to build an electricity grid consistent with the energy needs of their respective client bases and with the move by the energy industry into decentralised electricity generation, which necessitates a reinforced electrical grid.
Consequently, electrical installations need to be upgraded or built new, which means obtaining building permits. Occasionally, obtaining permits takes place after lengthy dialogue with local populations and authorities, which may delay the building of the infrastructure.
RISKS ASSOCIATED WITH THE SUPPLIERS OF INFRASTRUCTURE WORK
In 2017, like in 2016, Elia’s infrastructure objectives were exposed to a greater risk of capacity problems affecting several key suppliers. This situation has arisen because demand is increasing steadily on the European market, while sup ply has remained relatively stable. To limit this risk, Elia will conduct regular for ward-looking market capacity analyses.
The difficult economic situation on the European market (see also the ‘Macroeconomic risks’ section) may also jeopardise suppliers’ financial health, pre venting them from fulfilling their obliga tions. Infrastructure construction may be delayed as a result.
RISK OF LEGAL DISPUTES
Although the company operates in such a way as to minimise the risk of legal disputes, it may nonetheless become involved in such disputes. Where neces sary, the appropriate provisions are laid aside for this.
SAFETY AND WELFARE
The Elia Group operates facilities where accidents or external attacks may cause bodily harm to persons. Persons working in or near electricity transmission facili ties may be exposed, in the event of an accident, error or negligence, to the risk of electrocution. The safety and welfare of individuals (both Elia personnel and third parties) is a daily priority for the Elia Group’s management, supervisory staff and personnel. Elia has in place a health and safety policy, undertakes safety analy ses and promotes a safety culture.
RISKS ASSOCIATED WITH INEFFICIENT INTERNAL CONTROL MECHANISMS
All internal processes can have an impact on the company’s results in some way. The multi-year tariff mechanism increases the need for year-on-year increases in the company’s overall efficiency. To this end, the efficiency of internal processes is monitored regularly, using performance indicators and/or audits, to ensure they are kept under proper control. This is over seen by the Audit Committee, which con trols and monitors the work of the Internal Audit & Enterprise Risk Management Department.
3. Financial risks
The Group is exposed to various financial risks in the exercise of its activities: market risk (namely interest rate risk, inflation risk, tax risk and limited exchange risk), liquid ity risk and credit risk. The risks the com pany faces are identified and analysed in order to establish appropriate limits and controls and monitor risks and com pliance with such limits. To this end, the Group has defined responsibilities and procedures specifically for the financial instruments to be used and the operating limits for managing them. These procedures and related systems are revised on a regular basis to reflect any changes in market conditions and the activities of the Group. The financial impact of these risks is limited, as Elia and 50Hertz operate under the Belgian or German regulatory framework. See the ‘Regulatory frame work’ section for further details.
To finance their investments and achieve their short- and long-term strategic goals, Elia and 50Hertz turn to the capital mar kets, which are heavily influenced by macroeconomic trends. In 2018, these will mainly be shaped by a potential tightening of monetary policy in both the US and the eurozone and by a possible escalation of current geopolitical tensions. There is also continued uncertainty about the outcome of Brexit. All of these macro economic factors are reflected at mar ket level by major volatility, which could have a negative impact on the growth of Elia and 50Hertz and on the pursuit of their objectives. However, both Elia and Eurogrid GmbH (50Hertz’s parent com pany) have credit facilities in place to mitigate the risk of short-term financing difficulties.
Elia and Eurogrid GmbH are rated by S&P and Moody’s respectively. Specific measures in connection with these evalua tions are not foreseeable and could have an impact on financing. With the advent of Belgian laws and regulations governing decentralised or renewable energy generation, notably via photovoltaic solar panels and wind turbines, the Federal and Regional governments authorised the issuance of so-called ‘green certifi cates’, which are used as a financial sup port mechanism for renewable energy. Elia’s obligation to buy these certifi cates at a guaranteed minimum price poses a cash flow risk, as ‘green certifi cates’ are effectively used as ‘call’ options and their execution is sometimes uncer tain. Consequently, Elia is subject to unforeseeable influxes of large numbers of ‘green certificates’, which it is obliged to purchase, representing a risk to Elia’s cash flow. In so far as there are regula tions requiring the cancellation of certain certificates, the compensation for costs incurred by Elia requires the application of an appropriate levy. However, Elia has the option of asking CREG to adapt the tariffs so as to fill any gaps between expenses due to public service obligations and the cash flow generated by the periodically approved levies meant to cover such expenses. Elia has established regulatory and cash planning mechanisms allowing it to partially reduce the cash impact that this risk may pose.
Similarly, 50Hertz is exposed to a cash flow risk as it is obliged to buy the electri city generated by renewable sources for a fixed price, but to sell it at variable prices dictated by the market.
4. Contextual factors
MACROECONOMIC RISKS
The European economy has performed much better than expected this year, despite the continuing level of uncer tainty and volatility. This performance was mainly due to increased private con sumption, greater investment and falling unemployment.
The main risks are related to external fac tors, due to heightened geopolitical ten sions, the possible tightening of financial conditions worldwide, and the upsurge in protectionist policies. In the European Union specifically, downward risks are linked to the outcome of the Brexit nego tiations, the stronger euro, and higher interest rates in the long term.
HUMAN RESOURCES RISK
Elia pursues an active branding and recruitment policy to maintain an appro priate level of expertise and knowhow in a tight labour market. This is an ongoing risk, bearing in mind the highly specialised and complex nature of its business.
IMAGE RISK
Generally speaking, circumstances may arise that have a negative impact on the company’s image. Elia has an internal control mechanism to guarantee the con fidentiality of data. Despite this, external parties may pass on information in their possession that could have an impact on the company’s share price.
MISCELLANEOUS
Elia realises that there might be other risks of which the company is not yet aware. Some risks may seem limited today but could increase in the future. The subdivisions used give no indication of the potential consequences of the listed risks.
ELIA ANNUAL REPORT 2017 117116 - ELIA ANNUAL REPORT 2017 Corporate governance statement
Features of the internal control and risk management systems
The reference framework for internal con trol and risk management, established by the Management Committee and approved by the Elia Board of Directors, is based on the COSO II framework. The framework has five closely linked basic components, providing an integrated procedure for internal control and risk management systems: control environ ment, risk management, control activities, information and communication, and monitoring. The use and inclusion of these concepts in Elia’s various procedures and activities enables the company to control its activities, improve the effectiveness of its operations, optimally deploy its resources, and ultimately achieve its objectives. The implementation of COSO II at Elia is described below.
1. Control environment
ORGANISATION OF INTERNAL CONTROL
Pursuant to the Elia articles of association, the Board of Directors has estab lished various committees to help it fulfil its duties: the Management Committee, the Audit Committee, the Remuneration Committee and the Corporate Governance Committee. The Board has charged the Audit Committee with the task of monitoring: (i) the finan cial reporting procedure; (ii) the effective ness of internal control and corporate risk management systems; (iii) the internal audit and its effectiveness; (iv) the statu tory audit of annual and consolidated accounts, including the follow-up of any issues raised or recommendations made by external auditors; (v) the independence of external auditors, (vi) examining accounts and controlling budgets.
The Audit Committee generally meets quarterly to discuss the above points.
The Finance Department helps the Management Committee by providing, in a timely manner, correct and reliable financial information to aid not only decision-making with a view to monitoring the profitability of activities, but also effective management of corpor ate financial services. External financial reporting – one of Elia’s duties – includes (i) statutory financial and tax reporting; (ii) consolidated financial reporting; (iii) specific reporting obligations applicable to public companies; (iv) reporting obli gations under the regulatory framework. The structured approach developed by Elia helps to ensure that financial data is both exhaustive and precise, taking into account the deadlines for activity reviews and the actions of key players so as to ensure adequate control and accounting.
INTEGRITY AND ETHICS
Elia’s integrity and ethics are a crucial aspect of its internal control environ ment. The Management Committee and management regularly communicate about these principles in order to clarify the mutual rights and obligations of the company and its employees. These rules are disseminated to all new employees, and compliance with them is formally included in employment contracts. The Code of Conduct also helps to prevent employees from breaching any Belgian legislation on the use of privileged infor mation or market manipulation and sus picious activities. Management con sistently ensures that employees comply with internal values and procedures and – where applicable – take any actions deemed necessary, as laid down in the company regulations and employment contracts.
The Ethical Code defines what Elia regards as correct ethical conduct and sets out the policy and a number of prin ciples on the avoidance of conflicts of interests. Acting honestly and independently with respect to all stakehold ers is a key guiding principle for all of our employees. Elia’s Ethical Code expressly states that the Group prohibits bribery in any form, misuse of prior knowledge and market manipulation. This is confirmed by the Elia Code of Conduct. Elia and its employees do not use gifts or entertain ment to gain competitive advantage. Facilitation payments are not permitted by Elia. Disguising gifts or entertainment
as charitable donations is also a violation of the Ethical Code. Moreover, the Ethical Code prohibits all forms of racism and dis crimination, promotes equal opportunities for all employees, and ensures the protection and confidential use of IT sys tems. All parties involved in procurement must abide by Elia’s Purchasing Code of Ethics and all associated regulations. Elia’s Purchasing Code of Ethics is published internally and externally and is based on four pillars: confidentiality, non-discrimina tory treatment of suppliers, transparency, and avoidance of conflicts of interest. The management of the employees involved in the procurement and payment pro cesses regularly provides opportunities for training and awareness-raising on these topics.
By virtue of its legal status as a power transmission system operator, Elia is sub ject to a large number of statutory and regulatory rules setting out three fun damental principles: non-discrimina tory conduct, confidential processing of information, and transparency towards all electricity market players as regards non-confidential market infor mation. With a view to meeting these specific obligations, Elia has drawn up an Engagement Programme, which has been approved by the Corporate Governance Committee. The Compliance Officer reports annually to the relevant regulatory bodies in this regard.
Any violations of these codes can be reported to the Compliance Officer, who handles them objectively and confiden tially. The Compliance Officer declares that no such violations were reported by internal employees or external stakeholders in 2017.
Internal Audit’s annual programme includes a number of actions and verifi cation audits designed to act as specific safeguards against fraud. Any findings are systematically reported to the Audit Committee. In 2017, no relevant findings relating to fraud were reported in the specific audit of employee expense claims, nor in the other audits making up the annual audit plan.
ROLES AND RESPONSIBILITIES
Elia’s internal control system relies on clearly defined roles and responsibilities at all levels of the organisation. The roles and responsibilities of the various committees established within Elia are primarily iden tified in the legal framework applicable to Elia, the articles of association and the Corporate Governance Charter.
Under the supervision of the Chief Financial Officer, the Accounting Department is responsible for statutory financial and tax reporting and the con solidation of the Elia Group’s various sub sidiaries. The Controlling Department monitors analytical accounting and reporting and assumes responsibility for all financial reporting in a regulatory con text. The Investor Relations Department is responsible for specific reporting applic able to companies listed on the stock exchange.
As regards the financial reporting pro cess, the tasks and responsibilities of all employees in the Accounting Department have been clearly defined with a view to producing financial results that accurately and honestly reflect Elia’s financial transactions. A detailed frame work of tasks and responsibilities has been drawn up to identify the main con trol duties and the frequency with which tasks and control duties are performed.
An IFRS Accounting Manual is used by all entities within the scope of consolida tion as a reference for accounting prin ciples and procedures, thus ensuring consistency, comparability and accurate accounting and reporting within the Group.
The Finance Department has the appro priate means (including IT tools) to per form its tasks; all entities within the scope of consolidation use the same ERP soft ware, which has a range of integrated controls and supports task separation as appropriate. Elia also clarifies the roles and responsibilities of all its employees by pro viding a description of each job in keep ing with the Business Process Excellence methodology.
COMPETENCIES
With a view to ensuring its various activities are performed reliably and effect ively, Elia clearly spells out the vital importance of its employees’ competen cies and expertise in its recruitment, training and retention procedures. The Human Resources Department has drawn up the appropriate policies and defined all jobs in order to identify the relevant roles and responsibilities as well as the qualifications needed to fulfil them.
Elia has drawn up a policy for the management of generic and specific competencies in line with the com pany’s values, and promotes training so as to enable all its employees to effectively perform the tasks allocated to them.
Requirements with regard to competency levels are continually analysed by means of formal and informal self-assessments at various stages of an employee’s career.
Training programmes on financial report ing are offered to all employees involved directly or indirectly with that task. The training emphasises the existing regula tory framework, accounting obligations and actual activities, with a high level of understanding enabling participants to address the appropriate issues.
2. Risk management
Risk management is another inter nal control system that is crucial in help ing Elia to achieve its strategic object ives as defined in its mission. The Board of Directors and the Risk Manager jointly and regularly identify, analyse and assess key strategic and tactical risks. The risks are assessed qualitatively and/or quanti tatively depending on their nature and potential effect. The Risk Manager then makes recommendations on how best to manage each risk considering the close interaction of Elia’s entire risk uni verse. Based on this assessment, preventive, remedial and/or corrective actions are implemented, including the strengthening of existing internal control activities where applicable.
As part of its responsibilities, Elia’s management establishes an effective internal control system to ensure, among other objectives, accurate financial reporting. It emphasises the importance of
risk management in financial reporting by taking into account, with the Audit Committee, a whole range of associated activities and risks. It ensures that risks are truly reflected in financial results and reports. In addition, Risk Management goes beyond those risks known to Elia and tries to anticipate the nature and characteristics of emerging risks, which may impact Elia’s objectives.
Financial risk assessments primarily involve the identification of:
1. significant financial reporting data and its purpose;
2. major risks involved in the attainment of objectives;
3. risk control mechanisms, where possible.
Financial reporting objectives include (i) ensuring financial statements comply with widely accepted accounting princi ples; (ii) ensuring that the information pre sented in financial results is both trans parent and accurate; (iii) using accounting principles appropriate to the sector and the company’s transactions; (iv) ensuring the accuracy and reliability of financial results.
The activities undertaken by Elia, as an electricity transmission system operator in relation to its physical installations, con tribute significantly to its financial results. Therefore, appropriate procedures and control systems have been established to ensure an exhaustive and realistic inven tory of physical installations. Risk manage ment is a company-wide activity, actively supported by the delegation of relevant responsibilities to all employees as part of their specific activities, as defined in the Policy.
ELIA ANNUAL REPORT 2017 - 119118 - ELIA ANNUAL REPORT 2017
Corporate governance statement
CONTINUOUS ASSESSMENT
Employing a simultaneously top-down and bottom-up approach enables Elia to identify and, where possible, antici pate forthcoming events and react to any incidents occurring inside or outside the organisation which might affect the attainment of objectives.
TOP-DOWN APPROACH BASED ON STRATEGIC RISKS
Elia’s strategic risk assessments are reviewed on a quarterly basis in the Audit Committee. Action plans or specific, theme-based risk assessments are car ried out whenever there is a perception of potential threats or opportunities.
BOTTOM-UP APPROACH WITH REGARD TO BUSINESS
With a view to identifying new risks or evaluating changes in existing risks, the Risk Manager and management remain in contact and look out for any changes that may call for the relevant risk assess ment and associated action plans to be amended. Various criteria are used to determine the need to re-evaluate finan cial reporting procedures and associated risks. Emphasis is put on risks associated with changes in the financial and regula tory context, industrial practices, account ing standards and corporate develop ments such as mergers and acquisitions.
Operational management assesses the relevant risks and puts forward action plans. Any significant changes to assess ment rules must be approved by the Board of Directors. Risk Management is instrumental for Elia to maintain its value for stakeholders and the community, works with all departments with a view to optimising Elia’s ability to achieve its stra tegic objectives, and advises the company regarding the nature and potential effects of future risks.
3. Control activities
MAIN CONTROL ACTIVITIES
Elia has established internal control mechanisms at its various structural levels so as to ensure compliance with stan dards and internal procedures geared to the proper management of identified risks. These include:
(i) clear task separation as part of procedures, preventing the same person from initiating, authorising and record ing a transaction – policies have been drawn up regarding access to infor mation systems and the delegation of powers;
(ii) integrated audit approach as part of internal procedures so as to link end results with the transactions sup porting them;
(iii) data security and integrity through the appropriate allocation of rights;
(iv) appropriate documentation of pro cedures through the use of the Business Process Excellence Intranet, which centralises policies and procedures.
Departmental managers are responsible for establishing activities to control the risks inherent to their department.
FINANCIAL REPORTING PROCEDURE
For all significant financial reporting risks, Elia sets out appropriate control mechanisms to minimise the probability of error. Roles and responsibilities have been defined in connection with the closing procedure for financial results. Measures have been established for the continuous follow-up of each stage, with a detailed agenda of all activities undertaken by Group subsidiaries; control activities are performed to ensure quality and compli ance with internal and external require ments and recommendations. During the financial closing period, a specific test is performed to ensure control over signifi cantly unusual transactions, accounting checks and adjustments at the end of the relevant financial period, company trans actions and critical estimates. The com bination of all these controls ensures the reliability of financial results. Regular inter nal and external audits also contribute to financial reporting quality.
In identifying those risks that may affect the achievement of financial reporting objectives, the management takes into account the possibility of misreporting associated with fraud and takes appropri ate action where internal control needs to be strengthened. Internal Audit performs specific audits based on the risk assess ment for potential fraud, with a view to avoiding and preventing any instances of fraud.
4. Information and communication
Elia communicates relevant informa tion to its employees to enable them to fulfil their responsibilities and achieve their objectives. Financial information is needed for budgeting, forecasts and ensuring compliance with the regula tory framework. Operational information is also vital for the production of various reports, essential for the well-functioning of the company. As such, Elia records recent and historical data needed for cor porate risk assessments. Multiple com munication channels are used: manu als, memos, emails, bulletin boards and intranet applications. Financial results are reported internally and validated at dif ferent levels. The management respon sible for financial reporting regularly meets other internal departments (oper ational and control departments) to iden tify financial reporting data. It validates and documents the critical assumptions underpinning booked reserves and the company’s accounts.
At Group level, consolidated results are broken down into segments and valid ated by means of a comparison with his torical figures and a comparative analy sis between forecasts and actual data. This financial information is reported monthly to the Management Committee and is discussed quarterly with the Audit Committee. The Chairman of the Audit Committee then reports to the Board of Directors.
5. Monitoring
Elia continually re-evaluates the adequacy of its risk management approach. Monitoring procedures include a combination of monitoring activities carried out as part of normal business operations, in addition to specific ad hoc assess ments on selected topics. Monitoring activities include (i) monthly reporting of strategic indicators to the Management Committee and the management; (ii) fol low-up on key operational indicators at departmental level; (iii) a monthly finan cial report including an assessment of variations as compared with the budget, comparisons with preceding periods and events liable to affect cost controlling. Consideration is also given to third-part y feedback from a range of sources, such as (i) stock market indices and reports by ratings agencies; (ii) share value; (iii) reports by federal and regional regulators on compliance with the legal and regu latory framework; (iv) reports by security and insurance companies. Comparing information from external sources with internally generated data and ensuing analyses allows Elia to keep on making improvements.
Internal Audit also plays a key role in monitoring activities by conducting independent reviews of key financial and operational procedures in view of the various regulations applicable to Elia. The findings of those reviews are reported to the Audit Committee to help it monitor internal control and risk management systems and corporate financial reporting procedures.
The Group’s legal entities are also sub ject to external audits, which generally entail an evaluation of internal control and remarks on (annual and quarterly) statutory and consolidated financial results. External auditors make recom mendations for improving internal con trol systems. In entities that have an Audit Committee, the recommendations, action plans and their implementation are reported annually to that Committee, which in turn reports to the Board of Directors on the independence of the auditor or statutory audit firm and drafts a motion for a resolution on the appoint ment of external auditors.
ELIA ANNUAL REPORT 2017 121120 - ELIA ANNUAL REPORT 2017 Corporate governance statement
The Elia share in 2017
Despite dropping out the BEL20 Index, the Elia share hit a new record high in 2017. It ended the year at a price of €49.90, some 3.6% lower than in 2016.
CATHERINE VANDENBORRE, CHIEF FINANCE OFFICER AT ELIA“DRIVEN BY IMPORTANT PRO GRESS IN DELIVERING THE TRANSMISSION INFRASTRUC TURE OF THE FUTURE, IN 2017 ELIA’S GROUP HAS REGIS TERED AN INCREASE IN NET PROFIT BOTH IN BELGIUM AS IN GERMANY.”
Elia on the stock exchange
200.000
The Elia share’s closing price at the end of 2017 was €47.90, down 3.59% from €49.685 at the end of 2016.
The lowest price in 2017 was €46.00 on 27 January, while the highest price was €52.85 on 26 May.
The liquidity of the share fell by 42.9% (from 49,197 shares per day on average in 2016 to 28.106 in 2017).
With 60,901,019 shares outstanding, the company’s market capitalisation stood at €2.917.158.810 at the end of December. In 2017, 7,167,757 Elia shares were traded on the Euronext Brussels market.
In March 2017, Elia dropped out of the BEL20 index and joint the BEL MID index.
Appointment of three liquidity providers for the Elia share
In late 2009 Elia concluded a liquid ity provider contract with KBC Securities and Bank Degroof, both of which are offi cially recognised by NYSE Euronext. In 2014, a third contract was concluded with Belfius Bank. These three financial institu tions have been continually are present in the order book for the Elia share and are involved in both sales and purchases.
Dividend
On 22 February 2018, the Elia Board of Directors decided to propose a nomi nal dividend of €98.66 million, or €1.62 per share (gross) to the general meeting of shareholders of 15 May 2018, in accord ance with the dividend policy and sub ject to approval of the profit appropria tion by the annual general meeting of shareholders.
This gives a net dividend of €1.134 per share.
The following paying agents will pay out dividends to shareholders: BNP Paribas Fortis, ING Belgium, KBC and Belfius. Dividend payouts for shares held in a stock account will be settled automati cally by the bank or stockbroker. Elia will pay out dividends on registered shares directly to shareholders.
Dividend policy
Elia is obliged by its articles of association to pay out at least 85% of profits earned in Belgium, after retaining 5% for the legal reserve, unless otherwise decided by the general meeting of shareholders.

The proposed dividend represents a pay out ratio of 45.6% based on normalised net IFRS result.
INVESTORS
For any questions regarding Elia and its shares, please contact:
Yannick Dekoninck
Investor Relations Manager, Boulevard de l’Empereur 20 1000 Brussels, Belgium
Tel.: +32 2 546 75 79
Fax: +32 2 546 71 80
E-mail: investor.relations@elia.be
Information about the Group (press releases, annual reports, share prices, disclosures, etc.) can be found on the Elia Group website www.eliagroup.eu.
EVOLUTION OF THE ELIA SHARE AGAINST ITS EUROPEAN COUNTERPARTS
ELIA ANNUAL REPORT 2017 123122 ELIA ANNUAL REPORT 2017 The Elia share in 2017
CONTRIBUTION OF GERMANY TO IFRS NORMALIZED RESULTS GROSS DIVIDEND PER SHARE 50 % € 1.62
SHAREHOLDER STRUCTURE 6.95% KATOEN NATIE GROUP 2.51% PUBLIPART 1.86% BELFIUS INSURANCE 39.45% FREE FLOAT 44.96% PUBLI-T 4.27% INTERFIN EVOLUTION IN THE ELIA SHARE AND TRADED VOLUMES
180.000 160.000 140.000 120.000 100.000 80.000 60.000 40.000 20.000 0 ELIA SYSTEM OPERATOR (ELI) VOLUME 55 53 51 49 47 45 43 41 39 37 35 01/02/17 02/01/17 03/01/17 04/01/17 05/01/17 06/01/17 07/01/17 08/01/17 09/01/17 10/01/17 11/01/17 12/31/17 ELIA SYSTEM OPERATOR (ELI) BEL20 ELIA TERNA NATIONAL GRID RED ELECTRICA EVOLUTION OF THE ELIA SHARE AGAINST THE BEL20 INDEX 115 110 105 100 95 90 120 115 110 105 100 95 90 85 80 01/02/17 02/01/17 03/01/17 04/01/17 05/01/17 06/01/17 07/01/17 08/01/17 09/01/17 10/01/17 11/01/17 12/31/17 01/02/17 02/01/17 03/01/17 04/01/17 05/01/17 06/01/17 07/01/17 08/01/17 09/01/17 10/01/17 11/01/17 12/31/17 NET DIVIDEND 2017 FINANCIAL CALENDAR 23 February 2018 Full year results 2017 Early April 2018 Publication of 2017 Annual Report 15 May 2018 2018 General Meeting 16 May 2018 Interim statement Q1 2018 Early June 2018 Payment of dividend for 2017 27 July 2018 Publication of 2018 half-yearly results 30 November 2018 Interim statement Q3 2018 € 1.134
Management discussion and analysis of the 2017 results
— The Elia Group realised grid investments of €486 million in Belgium and €461 million in Germany to secure further the uninterrupted supply of electricity and to accommodate increasing renewable energy flows.
— Normalised net profit 1 up 28.9% to €216.6 million (Eurogrid up 58.2%, Elia up 8.8%), driven by containment of operating costs in particular in Germany and, in Belgium, full realisation of the strategic investment programme.
— A dividend of € 1.62 will be proposed at the General Assembly of 15 May 2018.
— Elia and 50Hertz continue to provide very high system reliability (99.999%), benefiting 30 million end-users in Belgium and Germany.
Results
Total
Non-recurring
Normalised
Net
Net
Non-recurring
debt 2,557.3 2,689.1
CAPEX2 1,177.5 946.2
EBIT (Earnings Before Interest and Taxes) = Results from operating activities + Share of profit of equityaccounted investees (net of income tax)
EBITDA (Earnings Before Interest and Taxes, Depreciations and Amortisations) = EBIT + depreciation/amor tisation + changes in provisions
Normalised EBIT = EBIT – non-recurring items (see note 1 on the bellow of the page for the definition and page 127 for the reconciliation table)
1. The term “normalised” refers to performance measures (EBIT, Net Profit, EPS) before non-recurring items. Non-recurring items are either income or expenses which do not occur regularly as part of the normal activities of the company. They are presented separately because they are important for the understanding of the underlying sustainable performance of the company due to their size or nature.
2. CAPEX amount include 100% of the investment realised in Germany.
The Elia Group’s normalised net profit increased by 28.9% to €216.6 million, the combined result of an increase in net profit in both Belgium (up 8.8%) and Germany (up 58.2%).
In Belgium solid results were achieved, with a normalised net profit of €108.6 million, driven by the realisation of strate gic investments. In more detail: the reg ulated net profit increased by €7.5 mil lion thanks to the full realisation of the mark-up investments since the start of the tariff period in 2016 (up €9.5 million) and the increase in the yearly average OLO compared to 2016 (up €5.0 million). This was partially offset by lower contribu tions from incentives (down €5.2 million) and a regulatory settlement from prior year (down €1.7 million). Furthermore, the increasing investment programme also resulted in a significant increase in the customer contributions received (up €4.5 million), which was offset by a neg ative contribution from the movement in the pension provision (down €2.7 million) and a lower result recognised on associ ates (down €2.5 million). Finally, the nor
malised net profit benefited from lim ited damage to electrical installations (up €1.0 million).
In Germany the normalised net profit increased considerably on the back of a strong operational performance. After peaking in the maintenance activity cycle in 2016, due in part to sub stantial damage to electrical installa tions, and thanks to the containment of operating costs, following the launch of an efficiency programme, operational costs declined significantly in 2017 (up €72.4 million). Furthermore, there was increased investment cost coverage as a result of both onshore and offshore investment activities (up €38.7 million). These effects were partly offset by higher depreciations (down €11.5 million) follow ing commissionings that occurred during 2017. Together with higher taxes, this all resulted in a normalised net profit of €180.1 million for the German activities.
Taking into account the non-recurring items, which were slightly higher than in 2016, the reported Elia Group net profit increased by 27.4% to €229.1 million.
Capital expenditures
By expanding international connections and integrating ever-increasing amounts of renewable energy generation, the Elia Group promotes both the integration of the European energy market and the decarbonisation of our society. In 2017, progress was made on a number of stra tegic investment projects.
In Belgium the Stevin project was offi cially inaugurated in November. Stevin will carry energy inland from the future offshore wind farms and from 2019 will enable the exchange of energy with the United Kingdom via the subsea intercon nector Nemo Link.
Nemo Link, a joint venture between Elia and the British system operator National Grid, started laying the first 59 km of sub sea cable in mid-2017. Since then, electri cal works have started in Richborough (UK) and Bruges (BE) for the converter sta tions. Nemo Link commissioning is scheduled for Q1 2019.
Elia also obtained some important per mits in 2017. Work can continue in 2018 on the second phase of the Brabo project to upgrade the grid around the Port of Antwerp, and on construction of ALEGrO the first interconnector with Germany. The 90-km underground HVDC connection (of which 49 km is in Belgium) is being built in partnership with the German sys tem operator Amprion.
Another important milestone was the approval of the bill for the Modular Offshore Grid in the federal parliament cancelling the option for offshore wind farm developers to connect directly to the shore. As a result of this law, any current concession holder for an offshore wind farm without a direct connection permit will have no choice but to connect to the Modular Offshore Grid. Located around 40 km off the coast, this offshore switch yard is important for the further develop ment of an offshore grid in the Belgian
REGIONAL SECURITY
RENEWABLE
FUNCT. & TECH. CONFORMITY AND CUSTOMERS
North Sea. It will bundle together the cables from the new offshore wind farms and connect them to the mainland.
In Germany the full commissioning of the 200-km South-West Coupling Line between Saxony-Anhalt and Bavaria was a major highlight, marking the culmina tion of more than 10 years of project devel opment. The 380-kV line is intended to ensure a reliable power supply for Bavaria following Germany’s nuclear power phaseout. The new line between the north-east of Germany and Bavaria decreases con gestion on the grid and generates impor tant savings in redispatch measures, to the benefit of end consumers.
50Hertz also made major progress on the offshore projects Ostwind 1 and Combined Grid Solution In the 90-km offshore grid connection project Ostwind 1, the laying of the first and second cable system was completed. This means that the Wikinger wind farm can be con nected to the grid, according to the agreed schedule. Combined Grid Solution is a joint project with the Danish system operator Energinet and will be the world’s first interconnector between two offshore wind farms: the Kriegers Flack (DK) and Baltic 2 (DE) projects, which are located barely 30 km apart. Commissioning is scheduled to take place from late 2018.
50Hertz also commissioned a num ber of transformer substations in 2017, at Wolmirstedt, Heinersdorf and Altentreptow, as well as successfully run ning a trial operation for phase-shifting transformers in Röhrsdorf on the border with the Czech Republic.
ELIA ANNUAL REPORT 2017 125124 ELIA ANNUAL REPORT 2017 Management discussion 2017
ELIA GROUP (IN MILLION EUR) 2016 2017
revenues 868.1 887.5 EBITDA 425.0 475.5 EBIT 295.0 344.6
items 12.0 0.1
EBIT 283.0 344.5
financial costs (82.9) (76.5)
profit 179.8 229.1
items 11.8 12.5 Normalised net profit 168.0 216.6 Normalised earnings per share (EUR) 2.76 3.56 Net financial
INVESTMENTS
& DSOS
EVOLUTIONS
OF SUPPLY 9% 77% 14% EUROPEAN MARKETS AND SECURITY OF SUPPLY 34% MARK-UP INVESTMENTS 29% NEMO 6% 11% 20% 50HERTZ € 461 M (38%) ELIA € 486 M +10% 50% 50HERTZ 50% ELIA NORMALISED NET PROFIT
Net debt & credit metrics
(IN € MILLION) 2016 2017
Net debt 2,557.3 2,689.1
Leverage (D/D+EQ) 0.52x 0.52x
Net debt / EBITDA 6.0 5.7
EBITDA / Gross interest 4.7 5.8
Average cost of debt 3.06% 2.92%
% fixed of gross debt 89.0% 82.51%
The net financial debt increased slightly to €2,689.1 million (up 5.2%). Elia’s sizea ble CAPEX programme, 10% bigger than in 2016, was financed mainly by cash flows generated from operating activi ties (€370.2 million), the proceeds from the sale of 2.8 million green certificates to the Walloon Region leading to a cash inflow of €176.2 million and profit reservation from prior years. In addition, Elia Transmission issued a €250 million Eurobond in late March 2017.
The average cost of debt has further decreased as a result of a repayment of a €500 million bond in April 2016.
Elia Transmission in Belgium
(IN € MILLION) 2016 2017
Total revenues 868.1 887.5
EBIT 219.6 236.5
Normalised EBIT 214.7 236.5
Net finance costs (82.9) (76.5)
Net profit 104.5 121.0
Normalised net profit 99.8 108.6
Total assets 5,463.6 5,765.1
Total equity 1,999.1 2,075.0
Net financial debt 2,557.3 2,689.1
Free cash flow 98.8 (32.8)
Elia Transmission’s revenue increased by 2.2% compared with the same period the previous year, to €887.5 million. The increase in revenues is a result of a higher allowed regulated net profit, higher depreciations and higher taxes that are passed through into revenues. These increases were partly offset by lower costs, mainly for ancillary services and financing, which are all passed through into revenues to the benefit of consumers, and the lower revenues generated by Elia Grid International (EGI).
The reported EBITDA (up 5.1%) and EBIT (up 7.7%) were mainly impacted by increased regulated net profit, higher depreciations, lower financing costs to be passed on in the tariffs, partly offset by the lower contribution from EGI and the lower result of equity-accounted invest ments. As no non-recurring items were recognised in EBIT compared to 2016, the normalised EBIT increased more sharply by 10.2%.
In addition to this net finance costs (down 7.7%) fell by €6.4 million com pared with 2016, mainly due to the repay ment of a €500 million bond in April 2016. Also, with the settlement of the fis cal claim in 2016 and the cash inflow of € 176.2 million following the purchase of 2.8 million green certificates by the Walloon Region in September 2017, the financing was limited to the issuance of a €250 million Eurobond. Owing to strong inves tor interest and low market interest rates,
the Eurobond had a coupon of 1.375%. The lower lending costs are entirely to the benefit of consumers, in accordance with the regulatory framework.
This resulted in an increased reported net profit of € 121.0 million (up 15.8%), excluding the non-recurrent items a normalised net profit of € 108.6 million (up 8.8%).
Total assets increased by 5.5% to €5,765.1 million, mainly as a result of the investment programme. The equity increased mainly as a result of the reservation of the 2017 profit and payment of divi dends for 2016. Elia Transmissions ended the year with negative free cash flow of €32.8 million.
50Hertz Transmission in Germany
(IN € MILLION) 2016 2017
Total revenues 1,2 91.2 1,330.2
EBIT 237.2 321.7
Normalised EBIT 220.5 321.5
Net finance costs (55.4) (54.4)
Net profit 125.6 180.2
Normalised net profit 113.8 180.1
Total assets 5,663.6 6,196.0
Total equity 1,296.4 1,385.4
Net financial debt 1,623.5 1,435,6
Free cash flow (593.3) 283.8
50Hertz Transmission’s revenue increased by 3.0% compared with 2016. This was the result of increasing revenues following the increased onshore and off shore investments, as well as higher other revenues.
The EBITDA increased to €471.8 million (up 25.4%) mainly as a result of both the onshore and offshore investment activities (up €38.7 million) and lower operational expenditures (up €72.4 million). The mate rial costs dropped significantly mainly due to lower maintenance costs, after reach ing the peak in the maintenance activity cycle in 2016. Furthermore, with the sub stantial investment programme and lower maintenance activities, a higher portion of personnel cost could be allocated to
new investments, leading to higher own work capitalised revenues compared to 2016. Normalised EBIT (up 45.8%) was fur ther impacted by the increased depreci ations as a result of the commissioning of the Southwest Coupling Line and North Ring during 2017. Taking into account the non-recurring energy bonus realised in 2017 (€4.8 million), which decreased
compared to 2016 (€7.6 million), and the non-recurring regulatory settlements (-€4.6 million), the reported EBIT came in at €321.7 million.
Total assets increased by 9.4% to €6,196.0 million, mainly due to a favourable development of the EEG cash and the invest ments made.
Non-recurring items - reconciliation table
(IN € MILLION) - PERIOD ENDED 31 DECEMBER 2017
EBIT – Non-recurring items
Regulatory settlements prior year
ELIA TRANSMISSION 50HERTZ TRANSMISSION 100%
50Hertz ended the year with a positive free cash flow of €283.8 million linked to the positive EEG cash flows and the remu neration of the 2015 energy costs, recov ered in 2017. Consequently, the net finan cial debt decreased to €1,435.6 million compared to the end of 2016. The net debt includes an EEG cash position of €775.7 million.
CONSOLIDATION ENTRIES ELIA GROUP
0.0 (4.6) 4.6 0.0
Equity consolidation 50Hertz (60% net profit) 0.0 0.0 0.1 0.1
Energy bonuses 0.0 4.8 (4.8) 0.0
Total EBIT non-recurring items 0.0 0.2 (0.1) 0.1
Impact tax reform on deferred tax 12.4 0.0 0.0 12.4
Tax impact 0.0 (0.1) 0.1 0.0
Net profit – non recurring items 12.4 0.1 (0.1) 12.5
(IN € MILLION) - PERIOD ENDED 31 DECEMBER 2016
EBIT – Non-recurring items
ELIA TRANSMISSION 50HERTZ TRANSMISSION 100%
CONSOLIDATION ENTRIES ELIA GROUP
Regulatory settlements prior year 8.1 9.1 (9.1) 8.1
Reversal IFRS adjustment prior year not covered via tariffs (3.1) 0.0 0.0 (3.1)
Equity consolidation 50Hertz (60% net profit) 0.0 0.0 7.1 7.1
Energy bonuses 0.0 7.6 (7.6) 0.0
Total EBIT non-recurring items 4.9 16.7 (9.6) 12.0
ELIA ANNUAL REPORT 2017 127126 ELIA ANNUAL REPORT 2017 Impôt lié (0.2) (4.9) 4.9 (0.2)
Net profit – non recurring items 4.7 11.8 (4.7) 11.8
Following the approval of the legislation implementing the corporate income tax reform in late December 2017, Elia Transmission re-assessed its deferred tax assets and liabilities according to the new future tax rates that apply to the period when the asset will be realised or the liability will be settled, leading to a non-recurring result of €12.4 million for the period.
At 50Hertz Transmission these items are mainly linked to the energy bonus related to the management of energy cost compliant to the Korridor model and a regulatory settlement mainly to the treatment of building cost subsidies.
2016 2,557 (370) 511 (174) (57) 96 88 38 2,689 Operating CF Gross CAPEX WC Divi dends received Divi dends paid Interest paid Other 2017 2017 NET DEBT EVOLUTION Management discussion 2017
Consolidated financial statements
Consolidated statement of profit or loss
(IN € MILLION) - YEAR ENDED 31 DECEMBER NOTES 2017 2016
Continuing operations
Revenue (6.1) 828.5 800.1
Raw materials, consumables and goods for resale (6.3) (9.6) (18.8)
Other income (6.2) 59.0 68.0
Services and other goods (6.3) (344.4) (336.6)
Personnel expenses (6.3) (147.2) (143.9)
Depreciation, amortisation and impairment (6.3) (131.2) (124.8)
Changes in provisions (6.3) 0.4 (5.3)
Other expenses (6.3) (19.6) (22.1)
Results from operating activities 235.9 216.6
Share of profit of equity-accounted investees (net of tax) (5.1- 5.2) 108.7 78.4
EBIT* 344.6 295.0
Net finance costs (6.4) (76.5) (82.8)
Finance income 5.5 7.0
Finance costs (81.9) (89.9)
Profit before income tax 268.2 212.2
Income tax expense (6.5) (39.1) (32.0)
Profit from continuing operations 229.1 180.2
Profit for the period 229.1 180.2
Profit attributable to:
Owners of the company 229.1 179.9
Non-controlling interest 0.0 0.3
Profit for the period 229.1 180.2
Earnings per share (EUR)
Basic earnings per share (6.6) 3.76 2.95
Diluted earnings per share (6.6) 3.76 2.95
EBIT (Earnings Before Interest and Taxes) = Results from operating activities and share of profit of equity-accounted investees, net of income tax. The accompanying notes form an integral part of these consolidated financial statements.
Consolidated statement of profit or loss and comprehensive income
(IN € MILLION) - YEAR ENDED 31 DECEMBER NOTES 2017 2016
Profit for the period 229.1 180.2
Other comprehensive income (OCI)
Items that may be reclassified subsequently to profit or loss:
Effective portion of changes in fair value of cash flow hedges (6.7) 9.4 8.7
Related tax (3.2) (2.9)
Items that will not be reclassified to profit or loss:
Remeasurements of post-employment benefit obligations (7.12) (131.2) (124.8)
Equity-accounted investees - share of OCI 1.1 (0.6)
Related tax (7.12) 2.3 (0.4)
Other comprehensive income for the period, net of tax (4.1) 6.0
Total comprehensive income for the period 225.0 186.2
Total comprehensive income attributable to:
Owners of the company 225.0 185.9
Non-controlling interest 0.0 0.3
Total comprehensive income for the period 225.0 186.2
The accompanying notes form an integral part of these consolidated financial statements.
ELIA ANNUAL REPORT 2017 129128 - ELIA ANNUAL REPORT 2017
Consolidated financial statements
Consolidated statement of financial position
NOTES 31 DECEMBER 2017 31 DECEMBER 2016 ASSETS
NON-CURRENT ASSETS 6,093.3 5,653.9
Property, plant and equipment (7.1) 3,202.4 2,956.5
Intangible assets and goodwill (7.2) 1,738.6 1,735.8
Trade and other receivables (7.4) 147.8 63.0
Equity-accounted investees (5.1+5.2) 942.7 832.4
Other financial assets (including derivatives) (7.3) 60.8 65.4
Deferred tax assets (7.5) 1.0 0.8
CURRENT ASSETS 503.2 587.7
Inventories (7.6) 13.6 22.6
Trade and other receivables (7.7) 281.1 379.6
Current tax assets (7.8) 3.8 2.8
Cash and cash equivalents (7.9) 195.2 176.6
Deferred charges and accrued revenues (7.7) 9.5 6.1
Total assets 6,596.5 6,241.6
EQUITY AND LIABILITIES
EQUITY 2,641.8 2,512.6
Equity attributable to owners of the company (7.10) 2,640.7 2,511.4
Share capital 1,517.6 1,517.2
Share premium 11.9 11.8
Reserves 173.0 173.0
Hedging reserve 0.0 (6.2)
Retained earnings 938.2 815.6
Non-controlling interest 1.1 1.2
NON-CURRENT LIABILITIES 2,984.5 2,728.0
Loans and borrowings (7.11) 2,834.7 2,586.4
Employee benefits (7.12) 84.3 75.1
Derivatives (8.2) 0.0 9.4
Provisions (7.13) 20.8 23.3
Deferred tax liabilities (7.5) 40.9 28.7
Other liabilities (7.14) 3.8 5.1
CURRENT LIABILITIES 970.2 1,001.0
Loans and borrowings (7.11) 49.5 147.5
Provisions (7.13) 4.5 2.4
Trade and other payables (7.15) 378.6 390.8
Current tax liabilities 2.9 0.5
Accruals and deferred income (7.16) 534.7 459.8
Total equity and liabilities 6,596.5 6,241.6
The accompanying notes form an integral part of these consolidated financial statements.
Consolidated statement of changes in equity
(IN € MILLION)
NOTES
CAPITAL
PREMIUM
Balance at 1 January 2016 1,512.8 10.0 (11.9) 0.1 138.8 763.8 2,413.6 0.8 2,414.4
Profit for the period 179.8 179.8 0.3 180.2
Other comprehensive income net of tax (6.7) 5.8 0.2 6.0 6.0
Total comprehensive income for the period 5.8 180.0 185.8 0.3 186.2
Transactions with owners, recorded directly in equity
Contributions by and distributions to owners
Shares issued (7.10) 3.5 1.8 5.3 5.3
Share-based payment (6.3) 0.9 0.9 0.9
Transfer to legal reserve (7.10) 34.3 (34.3)
Dividends (7.10) (94.1) (94.1) (94.1)
Total contributions and distributions 4.4 1.8 34.3 (128.4) (88.0) (88.0)
Total transactions with owners 4.4 1.8 34.3 (128.4) (88.0) (88.0)
Balance at 31 December 2016 1,517.2 11.8 (6.1) 0.0 173.0 815.5 2,511.4 1.2 2,512.6
Balance at 1 January 2017 1,517.2 11.8 (6.1) 0.0 173.0 815.5 2,511.4 1.2 2,512.6
Profit for the period (6.7) 229.1 229.1 0.0 229.1
Other comprehensive income net of tax (6.7) 6.2 (10.3) (4.1) (4.1)
Total comprehensive income for the period 6.2 218.8 225.0 0.0 225.0
Transactions with owners, recorded directly in equity (3.2) (2.9)
Contributions by and distributions to owners
Shares issued (7.10) 0.2 0.1 0.3 0.3
Share-based payment (6.3) 0.1 0.1 0.1
Transfer to legal reserve (7.10)
Dividends (7.10) (96.2) (96.2) (96.2)
Total contributions and distributions 0.3 0.1 (96.2) (95.8) (95.8)
Total transactions with owners 0.3 0.1 (96.2) (95.8) (95.8)
Balance at 31 December 2017 1,517.6 11.9 0.0 0.0 173.0 938.2 2,640.7 1.1 2,641.8 The accompanying notes form an integral part of these consolidated financial statements.
ELIA ANNUAL REPORT 2017 131130 - ELIA ANNUAL REPORT 2017
(IN € MILLION)
Consolidated financial statements
SHARE
SHARE
HEDGING RESERVE FOREIGN CURRENCY TRANSLA TION RESERVES RETAINED EARNINGS TOTAL NONCON TROLLING INTERESTS TOTAL EQUITY
Consolidated statement of cash flows
(IN € MILLION) - YEAR ENDED 31 DECEMBER NOTES 2017 2016
Cash flows from operating activities
Profit for the period 229.1 179.9
Adjustments for:
Net finance costs (6.4) 76.5 82.9
Other non-cash items 0.1 1.0
Current income tax expense (6.5) 29.2 12.5
Profit or loss of equity accounted investees, net of tax (5.1 – 5.2) (108.7) (78.5)
Depreciation of PP&E and amortisation of intangible assets (7.1 - 7.2) 131.4 124.4
Gain on sale of property, plant and equipment and intangible assets (7.1 - 7.2) 6.5 8.8
Impairment losses of current assets (6.3) 0.0 0.6
Change in provisions (6.3) (5.3) (1.2)
Change in fair value of derivatives (8.2) 1.1 1.0
Change in deferred taxes (7.5) 9.9 19.4
Cash flow from operating activities 369.8 350.9
Change in inventories (7.6) 9.3 1.3
Change in trade and other receivables (7.7) 98.2 (61.4)
Change in other current assets (7.7) 4.8 3.9
Change in trade and other payables (7.15) (12.3) 80.5
Change in other current liabilities (7.14 - 7.16) 74.9 91.2
Changes in working capital 174.8 115.5
Interest paid (6.4) (88.4) (115.6)
Interest received (6.4) 1.7 56.5
Income tax paid (6.5) (27.6) 80.3
Net cash from operating activities 430.3 487.6
Cash flows from investing activities
Acquisition intangible assets (7.2) (10.6) (9.6)
Acquisition of property, plant and equipment (7.1) (369.1) (388.6)
Acquisition of equity-accounted investees (5.1) (57.2) (25.8)
Proceeds from sale of property, plant and equipment 1.5 3.2
Proceeds from sales of investments (7.3 - 8.1) 0.0 6.3
Proceeds from capital decrease from equity-accounted investees (5.1) 0.1 7.2
Dividend received from equity-accounted investees (5.1 - 5.2) 56.8 57.3
Loans to joint ventures (7.4) (84.6) (38.7)
Net cash used in investing activities (463.1) (388.7)
Cash flow from financing activities
Proceeds from issue share capital (7.10) 0.4 5.3
Expenses related to issue share capital 0.0 (0.1)
Dividends paid (-) (7.10) (96.2) (94.2)
Repayment of borrowings (-) (6.4) (100.0) (540.0)
Proceeds from withdrawal borrowings (+) (7.11) 247.2 80.0
Non-controlling interests 0.0 0.3

Net cash flow from (used in) financing activities 51.4 (548.7)
Net increase (decrease) in cash and cash equivalents 18.6 (449.8)
Cash and cash equivalents at 1 January 176.6 626.4
Cash and cash equivalents at 31 December 195.2 176.6
Net variations in cash and cash equivalents 18.6 (449.8)
The accompanying notes form an integral part of these consolidated financial statements.
Reporting parameters
Registered office
This report is limited to Elia System Oper ator and Elia Asset, which operate as a single economic entity under the names Elia and 50Hertz Transmission.
The registered office of Elia System Oper ator and Elia Asset is located at Boulevard de l’Empereur 20 1000 Brussels, Belgium
The registered office of 50Hertz GmbH is established at Heidestraße 2 D-10557 Berlin
The registered office of Eurogrid Inter national is located at Rue Joseph Stevens, 7 1000 Bruxelles, Belgique
Reporting period
This annual report covers the period from 1 January 2017 to 31 December 2017.
Contact
Corporate Communication Boulevard de l’Empereur 20 1000 Brussels info@elia.be
T +32 2 546 72 41
Head office Elia Boulevard de l’Empereur 20, B-1000 Bruxelles
T +32 2 546 70 11
F +32 2 546 70 10 info@elia.be
Editing and coordination
Eric De Schrijver, Yannick Dekoninck, Aude Gaudy, Lieve Kerckhof, Adrien Raicher, Mélodie Rollin, Wouter Temmerman, Mario Vandeputte, Kim Vander Haegen, Marleen Vanhecke, Gwendolyne Verstraelen.
Concept and editorial staff
Elia, Corporate Communication
Graphic design www.chriscom.be
Photos Elia
Antonio Caliaro - Elia, Mélodie Rollin - Elia, Pieter Clicteur
Eric Herchaft - Reporters, Thomas Léonard - Reporters, Frédéric Raevens - I Love Light, Olivier Anbergen - I Love Light, Blueclic, Elia photo library.
Photos 50Hertz
50Hertz archive
Editor
Pascale Fonck
Ce document est également disponible en français. Dit document is ook beschikbaar in het Nederlands. April 2018
We would like to thank everyone who contributed to this annual report.
132 ELIA ANNUAL REPORT 2017 Consolidated financial statements
DISCOVER OUR ONLINE REPORT http://annualreport.elia.be/2017
DECLARATION BY RESPONSIBLE PERSONS
The undersigned Chairman of the Management Committee and Chief Executive Officer Chris Peeters and Chief Financial Officer Catherine Vandenborre declare that to the best of their knowledge:
a. the consolidated financial statements for the year ended 31 December 2017 have been prepared in accordance with the International Financial Reporting Standards (IFRS) as adopted by the European Union, and give a true and fair view of the consolidated financial position and results of the Elia Group and of its subsidiaries included in the consolidation;
b. the annual report for the year ended 31 December 2017 gives, in all material aspects, a true and fair view of the evolution of the business, the results and the situation of the Elia Group and of its entities included in the consolidation, as well as a description of the most significant risks and uncertainties the Elia Group is facing
Brussels, 22 March 2018
Catherine Vandenborre Chris Peeters Chief Financial Officer Chief Executive Officer1
CONSOLIDATED FINANCIAL STATEMENTS
Consolidated statement of profit or loss
(in million EUR) Year ended 31 December Notes 2017 2016
Continuing operations
Revenue (6.1) 828.5 800.1
Raw materials, consumables and goods for resale (6.3) (9.6) (18.8)
Other income (6.2) 59.0 68.0
Services and other goods (6.3) (344.4) (336.6)
Personnel expenses (6.3) (147.2) (143.9)
Depreciation, amortisation and impairment (6.3) (131.2) (124.8)
Changes in provisions (6.3) 0.4 (5.3)
Other expenses (6.3) (19.6) (22.1)
Results from operating activities 235.9 216.6
Share of profit of equity accounted investees (net of tax) (5.1 5.2) 108.7 78.4
EBIT* 344.6 295.0
Net finance costs (6.4) (76.5) (82.8)
Finance income 5.5 7.0
Finance costs (81.9) (89.9)
Profit before income tax 268.2 212.2
Income tax expense (6.5) (39.1) (32.0)
Profit from continuing operations 229.1 180.2
Profit for the period 229.1 180.2
Profit attributable to: Owners of the company 229.1 179.9 Non controlling interest 0.0 0.3
Profit for the period 229.1 180.2
Earnings per share (EUR)
Basic earnings per share (6.6) 3.76 2.95 Diluted earnings per share (6.6) 3.76 2.95
* EBIT (Earnings Before Interest and Taxes) = Results from operating activities and share of profit of equity accounted investees, net of income tax The accompanying notes form an integral part of these consolidated financial statements.
2
Consolidated statement of profit or loss and comprehensive income
(in million EUR) Year ended 31 December Notes 2017 2016
Profit for the period 229.1 180.2
Other comprehensive income (OCI)
Items that may be reclassified subsequently to profit or loss: Effective portion of changes in fair value of cash flow hedges (6.7) 9.4 8.7 Related tax (3.2) (2.9)
Items that will not be reclassified to profit or loss: Remeasurements of post employment benefit obligations (7.12) (13.7) 1.2 Equity accounted investees share of OCI 1.1 (0.6) Related tax (7.12) 2.3 (0.4)
Other comprehensive income for the period, net of tax (4.1) 6.0
Total comprehensive income for the period 225.0 186.2
Total comprehensive income attributable to: Owners of the company 225.0 185.9 Non controlling interest 0.0 0.3
Total comprehensive income for the period 225.0 186.2
The accompanying notes form an integral part of these consolidated financial statements.
3
Consolidated statement of financial position
(in million EUR)
ASSETS
Notes
NON CURRENT ASSETS 6,093.3 5,653.9
Property, plant and equipment (7.1) 3,202.4 2,956.5
Intangible assets and goodwill (7.2) 1,738.6 1,735.8
Trade and other receivables (7.4) 147.8 63.0
Equity accounted investees (5.1+5.2) 942.7 832.4
Other financial assets (including derivatives) (7.3) 60.8 65.4
Deferred tax assets (7.5) 1.0 0.8
CURRENT ASSETS 503.2 587.7
Inventories (7.6) 13.6 22.6
Trade and other receivables (7.7) 281.1 379.6
Current tax assets (7.8) 3.8 2.8
Cash and cash equivalents (7.9) 195.2 176.6
Deferred charges and accrued revenues (7.7) 9.5 6.1
Total assets 6,596.5 6,241.6
EQUITY AND LIABILITIES
EQUITY
2,641.8 2,512.6
Equity attributable to owners of the company (7.10) 2,640.7 2,511.4
Share capital 1,517.6 1,517.2
Share premium 11.9 11.8
Reserves 173.0 173.0
Hedging reserve 0.0 (6.2)
Retained earnings 938.2 815.6
Non controlling interest 1.1 1.2
NON CURRENT LIABILITIES
2,984.5 2,728.0
Loans and borrowings (7.11) 2,834.7 2,586.4
Employee benefits (7.12) 84.3 75.1
Derivatives (8.2) 0.0 9.4
Provisions (7.13) 20.8 23.3
Deferred tax liabilities (7.5) 40.9 28.7
Other liabilities (7.14) 3.8 5.1
CURRENT LIABILITIES 970.2 1,001.0
Loans and borrowings (7.11) 49.5 147.5
Provisions (7.13) 4.5 2.4
Trade and other payables (7.15) 378.6 390.8
Current tax liabilities 2.9 0.5
Accruals and deferred income (7.16) 534.7 459.8
Total equity and liabilities 6,596.5 6,241.6
The accompanying notes form an integral part of these consolidated financial statements.
4
31 December 2017 31 December 2016
Consolidated statement of changes in equity
(in million EUR)
Balance at 1 January 2016
1,512.8 10.0 (11.9) 0.1 138.8 763.8 2,413.6 0.8 2,414.4
Profit for the period 179.8 179.8 0.3 180.2
Other comprehensive income net of tax (6.7) 5.8 0.2 6.0 6.0
Total comprehensive income for the period 5.8 180.0 185.8 0.3 186.2
Transactions with owners, recorded directly in equity
Contributions by and distributions to owners
Shares issued (7.10) 3.5 1.8 5.3 5.3
Share based payment (6.3) 0.9 0.9 0.9
Transfer to legal reserve (7.10) 34.3 (34.3)
Dividends (7.10) (94.1) (94.1) (94.1)
Total contributions and distributions 4.4 1.8 34.3 (128.4) (88.0) (88.0)
Total transactions with owners 4.4 1.8 34.3 (128.4) (88.0) (88.0)
Balance at 31 December 2016 1,517.2 11.8 (6.1) 0.0 173.0 815.5 2,511.4 1.2 2,512.6
Balance at 1 January 2017 1,517.2 11.8 (6.1) 0.0 173.0 815.5 2,511.4 1.2 2,512.6
Profit for the period (6.7) 229.1 229.1 0.0 229.1
Other comprehensive income net of tax (6.7) 6.2 (10.3) (4.1) (4.1)
Total comprehensive income for the period 6.2 218.8 225.0 0.0 225.0
Transactions with owners, recorded directly in equity
Contributions by and distributions to owners
Shares issued (7.10) 0.2 0.1 0.3 0.3
Share based payment (6.3) 0.1 0.1 0.1
Transfer to legal reserve (7.10) Dividends (7.10) (96.2) (96.2) (96.2)
Total contributions and distributions 0.3 0.1 (96.2) (95.8) (95.8)
Total transactions with owners 0.3 0.1 (96.2) (95.8) (95.8)
Balance at 31 December 2017 1,517.6 11.9 0.0 0.0 173.0 938.2 2,640.7 1.1 2,641.8
The accompanying notes form an integral part of these consolidated financial statements.
Notes Share capital Share premium Hedging reserve Foreign currencytranslation Reserves Retained earnings Total Non - controllinginterests Total equity5
Consolidated statement of cash flows
(in million EUR) Year ended 31 December Notes 2017 2016
Cash flows from operating activities
Profit for the period 229.1 179.9
Adjustments for:
Net finance costs (6.4) 76.5 82.9
Other non cash items 0.1 1.0
Current income tax expense (6.5) 29.2 12.5
Profit or loss of equity accounted investees, net of tax (5.1 5.2) (108.7) (78.5)
Depreciation of PP&E and amortisation of intangible assets (7.1 7.2) 131.4 124.4
Gain on sale of property, plant and equipment and intangible assets (7.1 7.2) 6.5 8.8
Impairment losses of current assets (6.3) 0.0 0.6
Change in provisions (6.3) (5.3) (1.2)
Change in fair value of derivatives (8.2) 1.1 1.0
Change in deferred taxes (7.5) 9.9 19.4
Cash flow from operating activities 369.8 350.9
Change in inventories (7.6) 9.3 1.3
Change in trade and other receivables (7.7) 98.2 (61.4)
Change in other current assets (7.7) 4.8 3.9
Change in trade and other payables (7.15) (12.3) 80.5
Change in other current liabilities (7.14 7.16) 74.9 91.2
Changes in working capital 174.8 115.5
Interest paid (6.4) (88.4) (115.6)
Interest received (6.4) 1.7 56.5
Income tax paid (6.5) (27.6) 80.3
Net cash from operating activities 430.3 487.6
Cash flows from investing activities
Acquisition intangible assets (7.2) (10.6) (9.6)
Acquisition of property, plant and equipment (7.1) (369.1) (388.6)
Acquisition of equity accounted investees (5.1) (57.2) (25.8)
Proceeds from sale of property, plant and equipment 1.5 3.2
Proceeds from sales of investments (7.3 8.1) 0.0 6.3
Proceeds from capital decrease from equity accounted investees (5.1) 0.1 7.2
Dividend received from equity accounted investees (5.1 5.2) 56.8 57.3
Loans to joint ventures (7.4) (84.6) (38.7)
Net cash used in investing activities (463.1) (388.7)
Cash flow from financing activities
Proceeds from issue share capital (7.10) 0.4 5.3
Expenses related to issue share capital 0.0 (0.1)
Dividends paid ( ) (7.10) (96.2) (94.2)
Repayment of borrowings ( ) (6.4) (100.0) (540.0)
Proceeds from withdrawal borrowings (+) (7.11) 247.2 80.0
Non controlling interests 0.0 0.3
Net cash flow from (used in) financing activities 51.4 (548.7)
Net increase (decrease) in cash and cash equivalents 18.6 (449.8)
Cash and cash equivalents at 1 January 176.6 626.4
Cash and cash equivalents at 31 December 195.2 176.6
Net variations in cash and cash equivalents 18.6 (449.8)
The accompanying notes form an integral part of these consolidated financial statements.
6
NOTES
ACCOMPANYING THE CONSOLIDATED FINANCIAL STATEMENTS
1. Reporting entity 8
2. Basis of preparation 8
2.1. Statement of compliance 8
2.2. Functional and presentation currency 12
2.3. Basis of measurement 12
2.4. Use of estimates and judgements 13
2.5. Approval by the Board of Directors 13
3. Significant accounting policies 14
3.1. Basis of consolidation 14
3.2. Foreign currency translation 15
3.3. Financial instruments 15
3.4. Balance sheet items 16
3.5. Income statement items 19
3.6. Statement of comprehensive income and statement of changes in equity 20
4. Segment reporting 21
4.1. Basis for segmentation 21
4.2. Elia Transmission (Belgium) 21
4.3. 50Hertz Transmission (Germany) 23
4.4. Reconciliation of information on reportable segments to IFRS amounts 25
5. Equity accounted investees 26
5.1. Joint ventures 26 5.2. Associates 27
6. Items in the consolidated statement of profit or loss and other comprehensive income 28
6.1. Revenue 28
6.2. Other income 28
6.3. Operating expenses 28
6.4. Net finance costs 29
6.5. Income taxes 29
6.6. Earnings per share (EPS) 30
6.7. Other comprehensive income 30
7. Items in the consolidated statement of financial position 31
7.1. Property, plant and equipment 31
7.2. Intangible assets and goodwill 32
7.3. Other financial assets 33
7.4. Non current trade and other receivables 33 7.5. Deferred tax assets and liabilities 34 7.6. Inventories 35
7.7. Current trade and other receivables, deferred charges and accrued revenues 35
7.8. Current tax assets 36
7.9. Cash and cash equivalents 36
7.10. Shareholders' equity 36
7.11. Interest bearing loans and borrowings 37
7.12. Employee benefits 38 7.13. Provisions 43
7.14. Other non current liabilities 43
7.15. Trade and other payables 44 7.16. Accruals and deferred income 44
7.17. Financial instruments fair values 45
7.18. Changes in interest bearing loans and borrowings 46
8. Miscellaneous 47
8.1. Effect of new acquisitions/sales of shares 47
8.2. Financial risk and derivative management 47
8.3. Commitment and contingencies 49
8.4. Related parties 51
8.5. Subsidiaries, joint ventures and associates 52 8.6. Subsequent events 53 8.7. Miscellaneous 53
8.8. Services provided by the auditors 53
9. REGULATORY FRAMEWORK AND TARIFFS 54
9.1 Regulatory framework in Belgium 54
9.1.1 Federal legislation 54
9.1.2 Regional legislation 54
9.1.3 Regulatory agencies 54
9.1.4 Tariff setting 54
9.2 Regulatory framework in Germany 57
9.2.1 Relevant legislation 57
9.2.2 Regulatory agencies in Germany 57
9.2.3 Tariff setting in Germany 57
JOINT AUDITORS’ REPORT ON THE CONSOLIDATED FINANCIAL STATEMENTS 59
INFORMATION ABOUT THE PARENT COMPANY 64
Statement of financial position after distribution of profits 65
Income statement 66
7
NOTES
ACCOMPANYING THE CONSOLIDATED FINANCIAL STATEMENTS
1. Reporting entity
Established in Belgium, Elia System Operator SA (the 'Company' or 'Elia') has its registered office at Boulevard de l’Empereur 20, B 1000 Brussels. The Company's consolidated financial statements for the 2017 financial year include those of the Company and its subsidiaries (together referred to as the 'Group' or 'Elia Group') and the Group's interest in joint ventures and associates.
The Company is a limited liability company, with its shares listed on Euronext Brussels, under the symbol ELI.
The Elia Group is organised around two electricity transmission system operators: Elia Transmission in Belgium and (in cooperation with Industry Funds Management) 50Hertz Transmission, one of the four German transmission system operators, active in the north and east of Germany. With around 2,300 employees and a transmission grid comprising some 18,600 km of high voltage connections serving 30 million consumers, the Elia Group is one of Europe’s top five TSOs. It efficiently, reliably and securely transmits electricity from generators to distribution system operators and major industrial consumers, while also importing and exporting electricity from and to neighbouring countries. The Group is a driving force behind the development of the European electricity market and the integration of energy generated from renewable sources. In addition to its system operator activities in Belgium and Germany, the Elia Group offers businesses a range of consultancy and engineering services. The Group operates under the legal entity Elia System Operator, a listed company whose reference shareholder is municipal holding company Publi T.
2. Basis of preparation
2.1. Statement of compliance
The consolidated financial statements have been prepared in accordance with International Financial Reporting Standards (IFRS), as adopted by the European Union. The Group has applied all new and revised standards and interpretations published by IASB and applicable to the Group’s activities which are effective for financial years starting on 1 January 2017.
New and amended standards and interpretations
If a standard or amendment affects the Group, it is described, together with the impact hereunder.
• Recognition of Deferred Tax Assets for Unrealised Losses (amendments to IAS 12 effective as of 1 January 2017)
The amendments clarify the accounting for deferred tax assets for unrealised losses on debt instruments measured at fair value. Furthermore, the amendments provide guidance on estimating probable future taxable profits when assessing the recognition of deferred tax assets when there are insufficient taxable temporary differences relating to the same taxation authority and the same taxable entity. The Group was not impacted by this new treatment.
• Disclosure Initiative (amendments to IAS 7 effective as of 1 January 2017)
The amendments require entities to provide disclosure of changes in their liabilities arising from financing activities, including both changes arising from cash flows and non cash changes (such as foreign exchange gains or losses). The Group has provided the information for both the current and the comparative period in Note 7.18.
• Amendments to IFRS 12: Disclosure of Interests in Other Entities (effective as of 1 January 2017)
Clarification of the scope of disclosure requirements in IFRS 12 from Annual Improvements Cycle 2014 2016. The amendments clarify that the disclosure requirements in IFRS 12, other than those in paragraphs B10 B16, apply to an entity's interest in a subsidiary, a joint venture or an associate (or a portion of its interest in a joint venture or an associate) that is classified (or included in a disposal group that is classified) as held for sale. In line with the Group's business model, none of the Group's participations are held for sale and therefore these amendments did not affect the Group's financial statements.
Standards, amendments and interpretations that are not yet effective in 2017
The standards, interpretations or amendments listed hereafter are published on the date of approval of these consolidated financial statements but are not yet effective, and the Group did not opt for early adoption:
• IFRS 9: Financial Instruments (effective as of 1 January 2018) reflects all phases of the financial instruments project and replaces IAS 39: Financial Instruments: Recognition and Measurement and all previous versions of IFRS 9. The standard introduces new requirements for classification and measurement, impairment and hedge accounting.
The Group plans to adopt the new standard on the required effective date and will not restate comparative information The Group has reviewed in detail the potential impact of all three aspects of IFRS 9. This assessment is based on currently available information and may be subject to changes arising from further reasonable and supportable information being made available to the Group in 2018 when the Group will adopt IFRS 9.
(a) Classification and measurement
Trade receivables are held to collect contractual cash flows and are expected to give rise to cash flows representing solely payments of principal and interest. The Group analysed the contractual cash flow characteristics of those instruments and concluded that they meet the criteria for amortised cost measurement under IFRS 9. Therefore, reclassification for these instruments is not required.
Equity shares in non listed companies are intended to be held for the foreseeable future. No impairment losses were recognised in profit or loss during prior periods for these investments. The Group will apply the option to present fair value changes in OCI. The Group considered that for the Belgian segment the application of IFRS 9 on these equity shares would have an effect of less than
8
€0.1 million. For the German segment, a positive effect of approx. €5.4 million is expected to occur which will be recognised through OCI.
There will be no impact on the Group's accounting for financial liabilities, as the new requirements only affect the accounting for financial liabilities that are designated at fair value through profit or loss, and the Group does not have any such liabilities. IFRS 9 does not have an impact on the accounting policies for derecognition of financial assets and liabilities.
(b) Impairment
IFRS 9 requires the Group to record expected credit losses on all of its debt securities, loans and trade receivables, either on a 12 month or on a lifetime basis. The Group will apply the simplified approach and record lifetime expected losses on all trade receivables.
A preliminary assessment for the Belgian segment indicated that the application of the Expected Credit Losses (ECL) method at 31 December 2017 would increase the bad debt allowance for trade receivables by €0.3 million at that date compared with the allowance for trade receivables recognised under IAS 39. Deferred tax assets would increase by €0.1 million and net profit for the period would decrease by €0.2 million.
A similar assessment for the German segment indicates that the application of the Expected Credit Losses (ECL) method at 31 December 2017 would increase the bad debt allowance for trade receivables by €0.4 million at that date compared with the allowance for trade receivables recognised under IAS 39. Deferred tax assets would increase by €0.1 million, and net profit for the period would decrease by €0.3 million.
(c) Hedge accounting
Under the amended hedging requirements, more hedge relationships could be eligible for hedge accounting, as the new standard introduces a more principles based approach. However, at this stage the Group does not expect any new hedge relationships to be designated. The Group's existing hedge relationships appear to qualify as continuing hedges upon the adoption of IFRS 9. As a consequence, the Group does not expect a significant impact on its hedge relationships
• IFRS 15: Revenue from Contracts with Customers (effective as of 1 January 2018) establishes a new comprehensive framework for determining whether, how much and when revenue is recognised. It replaces existing revenue recognition guidance, including IAS 18: Revenue, IAS 11: Construction Contracts, IFRIC 18: Transfers of Assets from Customers, and IFRIC 13: Customer Loyalty Programmes.
The Group has completed an assessment of the impact of the adoption of IFRS 15 on its consolidated financial statements. The Group only foresees an impact as a result of the application of IFRIC 18.
Under IFRS 15, recognised revenue should reflect the consideration received by an entity in exchange for the transfer of control of promised goods or services to customers. The Group used a five step approach to assess whether a contract falls within the scope of IFRS 15 and how revenue should be recognised.
1. Identify the contract(s) with a customer
2. Identify the performance obligations in the contract(s)
3. Determine the transaction price
4. Allocate the transaction price to the performance obligations
5. Recognise revenue when performance obligations are satisfied, or when control of goods or services is transferred to the customer
The Group has a number of standard contracts for its customers, covering most of its revenue. These contracts are specific to each segment. As a consequence, the analysis of the potential impact of IFRS 15 is performed by reviewing those standard contracts. In the table below, an overview of the different revenue buckets is given, with reference to the relevant contracts and the result of the potential impact under IFRS 15.
9
Revenue bucket (per segment)
Revenue bucket (Group) Contracts
Status analysis
Elia Transmission (Belgium) revenues
Withi n the scope of IFRS 15
Change in accounting policy Change in amount of revenu
Change in timing of revenu
Impact on opening equity on 1 January 2018 (net of tax)
Grid connection Revenue Connection contract complete yes no no no 0.0
Management and development of grid infrastructure
Management of the electrical system
Compensation for imbalances
Revenue Access contract complete yes no no no 0.0
Revenue Access contract complete yes no no no 0.0
Revenue ARP contract complete yes no no no 0.0
Market integration Revenue ARP contract complete yes no no no 0.0
International revenues Revenue Congestion revenues complete yes no no no 0.0
Other income Transfers of assets from customers Customer contributions complete yes yes no yes (63.3)
Other income Revenue EGI contracts complete yes no no no 0.0
Other income Optimal use of assets Telecom contracts complete yes no no no 0.0
50Hertz Transmission (Germany) revenues (at 100%)
Vertical grid revenues n/a Grid use contract complete yes no no no 0.0
Ancillary services revenues n/a Contract for balancing groups complete yes no no no 0.0
Other income n/a Customer contributions complete yes yes no yes (33.2)
Received client contributions (IFRIC 18) are currently directly recognised in full as revenue, whereas under IFRS 15 the cash considerations should be presented as deferred revenue and will be recognized in revenue over the lifetime of the underlying asset.
The impact of the transition to IFRS 15 on the revenue of the segments Elia Transmission Belgium and 50Hertz Transmission Germany is shown below:
Elia Transmission (Belgium) revenues Period ended 31 December 2017 31 December 2017 31 December 2017 as reported under IFRS 15 difference
Grid connection 42.2 42.2 0.0
Management and development of grid infrastructure 479.2 479.2 0.0
Management of the electrical system 118.5 118.5 0.0
Compensation for imbalances 170.7 170.7 0.0
Market integration 24.3 24.3 0.0
International revenue 47.3 47.3 0.0
Other income 97.5 77.2 (20.4)
Subtotal revenues and other income 979.8 959.4 (20.4)
Settlement mechanism: deviations from approved budget (92.3) (92.3) 0.0
Total revenues and other income 887.5 867.1 (20.4)
10
e
e
50Hertz Transmission (Germany) revenues Period ended
31 December 2017 31 December 2017 31 December 2017
as reported under IFRS 15 Difference
Vertical grid revenues 1,241.4 1,241.4 0.0
Horizontal grid revenues 210.2 210.2 0.0
Ancillary services revenues 94.0 94.0 0.0
Other income 73.5 72.7 (0.8)
Subtotal revenue and other income 1,619.1 1,618.3 (0.8)
Settlement mechanism: deviations from approved budget (288.9) (288.9) 0.0
Total revenues and other income 1,330.2 1,329.4 (0.8)
The summarised impact on the Group's revenue is detailed below:
Revenues Period ended
31 December 2017 31 December 2017 31 December 2017
as reported under IFRS 15 difference
Revenue 806.4 806.4 0.0
Transfers of assets from customers 22.1 1.7 (20.4)
Total revenue 828.5 808.2 (20.4)
Other operating income
Services and technical expertise (0.3) (0.3) 0.0
Own production 25.5 25.5 0.0
Optimal use of assets 14.3 14.3 0.0
Other 18.5 18.5 0.0
Gain on sale PPE 1.0 1.0 0.0
Total other operating income 59.0 59.0 0.0
The impact on the results of the Group can be found in the table below for the period ended 31 December 2017 as well as for the expected impact on the opening equity at 1 January 2018:
The companies which are included in the 50Hertz Transmission Germany segment are accounted for using the equity method (at 60%), therefore the impact of IFRS 15 on their revenue recognition is given in the entry 'Share of profit of equity accounted investees (net of income tax)' in the Group's results
The summarised impact on the Group is detailed below:
Key figures Period ended
31 December 2017 31 December 2017 31 December 2017
as reported under IFRS 15 difference
Total revenues 887.5 867.1 (20.4)
Share of profit of equity accounted investees (net of income tax) 108.7 107.9 (0.4)
Income tax expenses (39.1) (39.6) (0.5)
Net profit 229.1 207.4 (21.4)
Total assets 6,596.5 6,576.5 (20.0)
Total equity 2,640.7 2,557.5 (83.2)
Key figures per share
Basic earnings per share (EUR) 3.76 3.41 (0.35)
Equity per share (EUR) 43.4 42.0 (1.4)
The income tax expenses, as presented in the table above, include the combined effect of additional temporary differences accumulated throughout the financial year 2017 which has resulted in an increased deferred tax liability of €6 9 million, as well as an offsetting effect resulting from remeasuring the accumulated temporary differences at the lower tax rates, as enacted as part of the tax reform, and having an effect of €7 4 million.
11
•
Transition method
The Group plans to adopt IFRS 15 in its consolidated financial statements for the year ending 31 December 2018 using the full retrospective method. As a result, the Group will apply all of the IFRS 15 requirements to each comparative period presented and adjust its consolidated financial statements.
The Group also plans to use the practical expedients for completed contracts, if relevant, meaning that completed contracts that began and ended in the same comparative period, as well as those that are completed at the beginning of the earliest period presented, will not be restated.
IFRS 16 was issued in January 2016 and replaces IAS 17: Leases, IFRIC 4: Determining whether an Arrangement contains a Lease, SIC 15: Operating Leases Incentives and SIC 27: Evaluating the Substance of Transactions Involving the Legal Form of a Lease. IFRS 16 sets out the principles for the recognition, measurement, presentation and disclosure of leases and requires lessees to account for all leases under a single on balance sheet model similar to the accounting for finance leases under IAS 17. The standard includes two recognition exemptions for lessees leases of 'low value' assets (e.g. personal computers) and short term leases (i.e. leases with a lease term of 12 months or less). At the commencement date of a lease, a lessee will recognise a liability to make lease payments (i.e. the lease liability) and an asset representing the right to use the underlying asset during the lease term (i.e. the right of use asset). Lessees will be required to separately recognise the interest expense on the lease liability and the depreciation expense on the right of use asset.
Lessees will also be required to remeasure the lease liability upon the occurrence of certain events (e.g. a change in the lease term, or a change in future lease payments resulting from a change in an index or rate used to determine those payments). The lessee will generally recognise the amount of the remeasurement of the lease liability as an adjustment to the right of use asset.
Lessor accounting under IFRS 16 is substantially unchanged from today's accounting under IAS 17. Lessors will continue to classify all leases using the same classification principle as in IAS 17 and distinguish between two types of leases: operating and finance leases.
IFRS 16 also requires lessees and lessors to make more extensive disclosures than under IAS 17.
IFRS 16 is effective for annual periods beginning on or after 1 January 2019. Early application is permitted, but not before an entity applies IFRS 15. A lessee can choose to apply the standard using either a full retrospective or a modified retrospective approach. The standard's transitional provisions allow for certain reliefs.
The Group is currently in the process of quantifying the effect of IFRS 16 on the consolidated financial statements. Potential effects will be communicated during the financial year 2018.
•
The following standards, amendments and interpretations had not yet taken effect in 2017. The changes in the below standards, amendments and interpretations are not expected to have a material impact on the annual accounts and are therefore not set out in more detail:
▪ Amendments to IFRS 10 and IAS 28: Sale or Contribution of Assets between an Investor and its Associate or Joint Venture;
▪ IFRS 14: Regulatory Deferral Accounts;
▪ IFRS 2: Classification and Measurement of Share based Payment Transactions Amendments to IFRS 2;
▪ IFRS 17: Insurance Contracts;
▪
Transfers of Investment Property Amendments to IAS 40;
▪
Annual Improvements to IFRS Standards 2014 2016 Cycle; particularly focused on IFRS 1 and IAS 28;
▪
Annual Improvements to IFRS Standards 2015 2017 Cycle; particularly focused on IFRS 3, IFRS 11, IAS 12 and IAS 23;
▪ Amendments to IFRS 9: Prepayment Features with Negative Compensation;
▪
2.2.
Applying IFRS 9: Financial Instruments with IFRS 4: Insurance Contracts Amendments to IFRS 4;
▪ Amendments to IAS 28: Long term interests in Associates and Joint Ventures;
▪ IFRIC 22: Foreign Currency Transactions and Advance Consideration; and
▪ IFRIC Interpretation 23: Uncertainty over Income Tax Treatment.
Functional and presentation currency
The consolidated financial statements are presented in million euro (the functional currency of the Company), rounded to the nearest hundred thousand, unless stated otherwise.
2.3. Basis of measurement
The consolidated financial statements have been prepared on a historical cost basis, except for the derivative financial instruments, which are measured at fair value. Non current assets and disposal groups held for sale are valued at the lowest of the carrying amount and the fair value less cost to sell. Employee benefits are valued at the present value of the defined benefit obligations, less fair value of the plan assets. Changes in fair value of financial assets are recorded through profit or loss.
12
2.4. Use of estimates and judgements
The preparation of the consolidated financial statements in accordance with IFRS requires management to make judgements, estimates and assumptions that could affect the reported amounts of assets and liabilities and revenue and expenses. The estimates and underlying assumptions are based on historical experience and various other factors that are believed to be reasonable under the circumstances, the results of which form the basis for making judgements regarding the carrying amounts of assets and liabilities. Actual results could differ from these estimates. The estimates and underlying assumptions are reviewed on an ongoing basis. Revisions to accounting estimates are recognised in the period in which the estimate is revised if the revision only affects this period, or in the period in which the estimate is revised and future periods if the revision affects both current and future periods.
Information about significant areas of estimation uncertainty and critical judgements in applying accounting policies that have the most significant effect on the amounts recognised in the consolidated financial statements is included in the following notes:
• The net result of the Belgian segment and the German segment is determined by calculation methods set by respectively the Belgian federal regulator, the Commission for Electricity and Gas Regulation ('CREG') and the German federal regulator, the Federal Network Agency ('BNetzA'). For certain calculations, a level of judgement is needed. More disclosures are to be found in Notes 7.16, 9.1.4 and 9.2.3.
• Consolidation of entities in which the Group holds less than 20% of the voting rights but has significant influence: Under IFRS 10, the Group assesses whether it has significant influence over its associates and therefore needs to consolidate them and reassesses this in each reporting period (also see note 5)
• Deferred tax assets are recognised for the carry forward of unused tax losses and unused tax credits in so far as it is probable that future taxable profit will be available against which the unused tax losses and unused tax credits can be utilised. In making its judgement, management takes into account elements such as long term business strategy and tax planning opportunities (see Note 6.5)
• Credit risk related to customers: Management closely reviews the outstanding trade receivables, also considering ageing, payment history and credit risk coverage (see Note 8.2)
• Employee benefits including reimbursement rights: The Group has defined benefit plans and defined contribution plans which are disclosed in Note 7.12. The calculation of the liabilities or assets related to these plans is based on actuarial and statistical assumptions. This is, for example, the case for the present value of future pension liabilities. The present value is, among other factors, impacted by changes in discount rates, and financial assumptions such as future increases in salary. In addition, demographic assumptions, such as average assumed retirement age, also impact the present value of future pension liabilities.
• In determining the appropriate discount rate, management consider the interest rates of corporate bonds in currencies consistent with currencies of the post employment benefit obligation, i.e. euro, with at least an AA rating or above, as set by at least one dominant rating agency, and extrapolated along the yield curve to correspond with the expected term of the defined benefit obligation. Higher and lower yielding bonds are excluded in developing the appropriate yield curve.
• Each plan's projected cash flow is matched to the spot rates of the yield curve to calculate an associated present value. A single equivalent discount rate is then determined that produces that same present value. Hence, the resulting discount rate reflects both the current interest rate environment and the plan's distinct liability characteristics;
• Provisions for environmental remediation costs: At each year end, an estimate is made of future expenses in respect of soil remediation, based on the advice of an external expert. The extent of remediation costs is dependent on a limited number of uncertainties, among others newly identified cases of soil contamination (see Note 7.13);
• Other provisions are based on the value of the claims filed or on the estimated amount of the risk exposure. The expected timing of the related cash outflow depends on the progress and the duration of the associated process/procedures (see Note 7.13);
• Goodwill impairment testing: The Group performs impairment tests on goodwill and on cash generating units (CGUs) at the reporting date, and whenever there are indicators that the carrying amount might be higher than the recoverable amount. This analysis is based on assumptions such as market evolution, market share, margin evolution and discount rates (see Note 7.2);
• Fair value measurement of financial instruments: When the fair values of financial assets and financial liabilities recorded in the statement of financial position cannot be measured based on quoted prices in active markets, their fair value is measured using valuation techniques. The inputs to these valuation techniques are taken from observable markets where possible. Where this is not feasible, a level of judgement is required in establishing fair values. Changes in the fair value of the derivative hedging instrument designated as a cash flow hedge are recognised directly in other comprehensive income (OCI) to the extent that the hedge is effective. To the extent that the hedge is ineffective, changes in fair value are recognised in profit or loss (see Note 8.2).
2.5.
Approval by the Board of Directors
These consolidated financial statements were authorised for issue by the Board of Directors on 22 March 2018.
13
3. Significant accounting policies
3.1. Basis of consolidation
SUBSIDIARIES
A subsidiary is an entity that is controlled by the Company. The Group controls an entity when it is exposed, or has rights, to variable returns from its involvement with the entity and has the ability to affect those returns through its power over the entity. The financial statements of subsidiaries are included in the consolidated financial statements from the date that control commences until the date that this ceases. The accounting policies of subsidiaries are changed when necessary to align them with the policies adopted by the Group. Losses applicable to the non controlling interests in a subsidiary are allocated to the non controlling interests even if doing so causes the non controlling interests to have a deficit balance.
ASSOCIATED COMPANIES
Associated companies are those companies in which the Company has significant influence, but not control, over the financial and operating policies. The consolidated financial statements include the Group's share of the total recognised profits and losses of associated companies on the basis of the equity method, from the date that significant influence commences until the date that significant influence ceases. When the Group's share of the losses exceeds its interest in an associated company, its carrying amount is reduced to nil and further losses are not recognised except to the extent that the Group has incurred legal or constructive obligations or has made payments on behalf of an associated company.
INTERESTS IN JOINT VENTURES
A joint venture is an arrangement in which the Group has joint control, whereby the Group has rights to the net assets of the arrangement, as opposed to joint operations whereby the Group has rights to its assets and obligations for its liabilities. Interests in joint ventures are accounted for using the equity method. They are recognised initially at cost price. Subsequent to initial recognition, the consolidated financial statements include the Group's share of the total recognised profits and losses of joint ventures on the basis of the equity method, from the date that joint control commences until the date that joint control ceases. When the Group's share of the losses exceeds its interest in joint ventures, its carrying amount is reduced to nil and further losses are not recognised except to the extent that the Group has incurred legal or constructive obligations or has made payments on behalf of a joint venture.
NON CONTROLLING INTERESTS
Non controlling interests are measured at their proportionate share of the acquiree's identifiable net assets at the acquisition date. Changes in the Group's interest in a subsidiary not wholly owned that do not result in a loss of control are accounted for as equity transactions.
LOSS OF CONTROL
Upon the loss of control, the Group derecognises the assets and liabilities of the subsidiary, any non controlling interests and the other components of other comprehensive income related to the subsidiary. Any surplus or deficit arising on the loss of control is recognised in profit or loss. If the Group retains any interest in the previous subsidiary, then such interest is measured at fair value at the date that control is lost. Subsequently it is accounted for as an equity accounted investee or as an available for sale financial asset depending on the level of influence retained.
ELIMINATION OF INTRA GROUP TRANSACTIONS
Intra Group balances and any unrealised gains or losses or revenue and expenses arising from intra Group transactions are eliminated when preparing the consolidated financial statements.
Unrealised gains from transactions with associated companies are eliminated to the extent of the Group's interest in the entity. Unrealised losses are eliminated in the same way as unrealised gains, but only to the extent that there is no evidence of impairment.
BUSINESS COMBINATIONS AND GOODWILL
Goodwill arises on the acquisition of subsidiaries, joint ventures and associates and represents the excess of the consideration transferred over the Group's interest in the net fair value of the net identifiable assets, liabilities and contingent liabilities of the acquiree.
The Group measures goodwill at the acquisition date as:
• the fair value of the consideration transferred; plus
• the recognised amount of any non controlling interest in the acquiree; plus
• if the business combination is completed in stages, the fair value of the pre existing equity interest in the acquiree; less • the fair value of the identifiable assets acquired and liabilities at acquisition date.
When the excess is negative, a bargain purchase gain is recognised immediately in profit or loss.
The consideration transferred does not include amounts related to the settlement of pre existing relationships. Such amounts are generally recognised in profit or loss.
Transactions costs, other than those associated with the issue of debt or equity securities, that the Group incurs in connection with a business combination are expensed as incurred.
Any contingent consideration payable is measured at fair value at the acquisition date. If the contingent consideration is classified as equity, then it is not remeasured and settlement is accounted for within equity. Otherwise, subsequent changes in the fair value of the contingent consideration are recognised in profit or loss.
14
3.2. Foreign currency translation
FOREIGN CURRENCY TRANSACTIONS AND BALANCES
Transactions in foreign currencies are converted into the functional currency of the Company at the foreign exchange rate on the date of the transaction. Monetary assets and liabilities denominated in foreign currencies on the balance sheet date are converted at the foreign exchange rate on that date. Foreign exchange differences arising on conversion are recognised in profit or loss.
Non monetary assets and liabilities denominated in foreign currencies that are valued in terms of historical cost are converted at the exchange rate on the date of the transaction.
FOREIGN OPERATIONS
A foreign operation is an entity that is a subsidiary, an associate, an interest in a joint venture or a branch of the reporting entity, whose activities are based or conducted in a country or currency other than those of the reporting entity.
The financial statements of all Group entities that have a functional currency different from the Group's presentation currency are translated into the presentation currency as follows:
• assets and liabilities are translated at the exchange rate at the reporting date;
• income and expenses are translated at the average exchange rate of the year
Exchange differences arising from the translation of the net investment in foreign subsidiaries, interests in joint ventures and associates at closing exchange rates are included in shareholder's equity under 'OCI. Upon the (partial) disposal of foreign subsidiaries, joint ventures and associates, (part of) cumulative translation adjustments are recognised in the profit or loss as part of the gain/loss of the sale.
3.3. Financial instruments
DERIVATIVE FINANCIAL INSTRUMENTS
The Group sometimes uses derivative financial instruments to hedge its exposure to foreign exchange and interest rate risks arising from operating, financing and investment activities. In accordance with its treasury policy, the Group neither holds nor issues derivative financial instruments for trading purposes. However, derivatives that do not qualify for hedge accounting are accounted for as instruments held for trading purposes.
Derivative financial instruments are recognised initially at fair value. Any gain or loss resulting from changes in the fair value is immediately booked in the income statement. Where derivative financial instruments qualify for hedge accounting, the reflection of any resulting gain or loss depends on the nature of the item being hedged.
The fair value of interest rate swaps is the estimated amount that the Group would receive or pay to terminate the swap at the end of the reporting period, taking into account the current interest rates and the current creditworthiness of the swap counterparties and the Group. The fair value of forward exchange contracts is their quoted market price at the end of the reporting period, i.e. the present value of the quoted forward price.
DERIVATIVES USED AS HEDGING INSTRUMENTS
Cash-flow hedges
Changes in the fair value of the derivative hedging instrument designated as a cash flow hedge are recognised directly in other comprehensive income (OCI) to the extent that the hedge is effective. To the extent that the hedge is ineffective, changes in fair value are recognised in profit or loss.
If the hedging instrument no longer meets the criteria for hedge accounting, expires or is sold, terminated or exercised, hedge accounting is prospectively discontinued. The cumulative gain or loss previously recognised in OCI remains there until the forecast transaction occurs. When the hedged item is a non financial asset, the amount recognised in OCI is transferred, where justified, to the carrying amount of the asset. In other cases, the amount recognised in OCI is transferred to profit or loss in the same period that the hedged item affects profit or loss.
When a derivative or hedge relationship is terminated, cumulative gains or losses still remain in OCI provided that the hedged transaction is still expected to occur. If the hedged transaction is no longer expected to take place, the cumulative unrealised gain or loss is removed from OCI and is immediately recognised in profit or loss.
Hedging of monetary assets and liabilities
Hedge accounting is not applied to derivative instruments that economically hedge monetary assets and liabilities denominated in foreign currencies. Changes in the fair value of such derivatives are recognised in profit or loss of foreign currency gains and losses.
15
Balance sheet items
PROPERTY, PLANT AND EQUIPMENT
Owned assets
Items of property, plant and equipment are stated at cost (including the directly allocated costs such as finance costs) less accumulated depreciation and impairment losses (see the section 'Impairment'). The cost of self produced assets comprises the cost of materials, of direct labour and, where relevant, of the initial estimate of the costs of dismantling and removing the assets and restoring the site where the assets were located. If parts of an item of property, plant and equipment have different useful lives, they are accounted for as separate items of property, plant and equipment.
Subsequent costs
The Group recognises in the carrying amount of an item of property, plant and equipment the subsequent costs of replacing part of such an item when that cost is incurred, but only when it is probable that the future economic benefits embodied in the item will flow to the Group and the cost of the item can be measured reliably. All other costs, such as repair and maintenance costs, are recognised in profit or loss as and when they are incurred.
Depreciation
Depreciation is recognised in profit or loss on a straight line basis over the estimated useful life of each component of an item of property, plant and equipment. Land is not depreciated. The applied depreciation percentages can be found in the table below
Depreciation methods, remaining useful lives and residual values of the property, plant and equipment are reassessed annually and are prospectively adjusted as the occasion arises.
• Administrative buildings 2.00%
• Industrial buildings 2.00 4.00%
• Overhead lines 2.00 4.00%
• Underground cables 2.00 5.00%
• Substations (facilities and machines) 2.50 6.67%
• Remote control 3.00 12.50%
• Dispatching 4.00 10.00%
• Other PPE (fitting out rented buildings) contractual period
• Vehicles 6.67 20.00%
• Tools and office furniture 6.67 20.00%
• Hardware 25.00 33.00%
Dismantling obligation
Provision is made for decommissioning and environmental costs, based on future estimated expenditure, discounted to present values. An initial estimate of decommissioning and environmental costs attributable to property, plant and equipment is recorded as part of the original cost of the related property, plant and equipment.
Changes in the provision arising from revised estimates or discount rates or changes in the expected timing of expenditure relating to property, plant or equipment are recorded as adjustments to their carrying value and depreciated prospectively over their remaining estimated economic useful lives; otherwise such changes are recognised in the profit or loss.
The unwinding of the discount is recorded in the profit or loss as a financing charge.
Derecognition
An asset is no longer recognised when the asset is subject to disposal or when no future economic benefits are expected from its use or disposal. Gains or losses arising from the derecognition of the asset (which is determined as the difference between the net disposal proceeds and the carrying amount of the asset) are included in profit or loss, under other income or other expenses, during the year in which the asset was derecognised.
INTANGIBLE ASSETS
Goodwill
Goodwill is stated at cost less accumulated impairment losses. Goodwill is allocated to cash generating units and is not amortised but tested annually for impairment (see the section 'Impairment'). In the case of associated companies, the carrying amount of goodwill is included in the carrying amount of the investment in the associated company.
Computer software
Software licences acquired by the Group are stated at cost less accumulated amortisation (see below) and impairment losses (see the section 'Impairment').
Expenditure on research activities undertaken with the prospect of developing software within the Group is recognised in profit or loss as expenditure as incurred. Expenditure on the development phase of software developed within the Group is capitalised if:
• the costs of development can be measured reliably;
• the software is technically and commercially feasible and future economic benefits are likely;
• the Group plans and has sufficient resources to complete development;
• the Group plans to use the software.
The capitalised expenditure includes cost of material, direct labour costs and overhead costs that are directly attributable to preparing the software for its use. Other costs are recognised in profit or loss as incurred.
16 3.4.
Licenses, patents and similar rights
Expenditure on acquired licences, patents, trademarks and similar rights are capitalised and amortised on a straight line basis over the contractual period, if any, or the estimated useful life.
Subsequent expenditure
Subsequent expenditure on capitalised intangible assets is capitalised only when it increases the future economic benefits embodied in the specific asset to which it relates. All other expenditure is recognised in profit or loss as expenditure as incurred.
Amortisation
Amortisation is recognised in profit or loss on a straight line basis over the estimated useful life of intangible assets, unless the useful life is indefinite. Goodwill and intangible assets with indefinite useful lives are tested systematically for impairment on each end of the reporting period. Software is amortised from the date it is available for use. The estimated useful lives are as follows:
• Licences 20.00%
• Concessions contractual period
• Computer software 20.00 25.00%
Depreciation methods, remaining useful lives and residual values of intangible assets are reassessed annually and are prospectively adjusted as the occasion arises.
INVESTMENTS
Each type of investment is recognised on the date of the transaction.
Investments in equity securities
Investments in equity securities are undertakings in which the Group has no significant influence or control. This is the case in undertakings where the Group owns less than 20% of the voting rights. Such investments are designated as available for sale financial assets and are measured at fair value. Any resulting changes in fair value, except those related to impairment losses, are recognised directly in other comprehensive income (OCI). Upon disposal of an investment, the cumulative gain or loss previously recognised directly in OCI is recognised in profit or loss.
The equity investees are measured at cost price if there is no quoted price in an active market and the fair value cannot be measured reliably.
Investments in debt instruments
Investments in debt securities classified as held for trading purposes or as being available for sale are carried at fair value, with any resulting gain or loss respectively recognised in profit or loss or directly in equity. The fair value of these investments is determined as the quoted bid price at the end of the reporting period. Impairment charges and foreign exchange gains and losses are recognised in profit or loss. Investments in debt securities classified as held to maturity are measured at amortised cost.
Other investments
Other investments held by the Group are classified as available for sale and are measured at fair value, with any resulting gain or loss recognised directly in equity. Impairment charges are recognised in OCI (see the section 'Impairment').
TRADE AND OTHER RECEIVABLES
Construction contracts in progress
Construction contracts in progress are stated at cost price plus profit based on progress made to date, minus a provision for foreseeable losses and less progress billing. The cost price comprises all expenditure directly related to specific projects, plus an allocation of fixed and variable overheads incurred during the Group's contract activities based on normal operating capacity.
Trade and other receivables
Trade receivables and other receivables are measured at amortised cost minus the appropriate allowance for amounts regarded as unrecoverable.
INVENTORIES
Inventories (spare parts) are stated at the lower of cost and net realisable value. Net realisable value is the estimated selling price minus the estimated costs of completion and selling expenses. The cost of inventories is based on the weighted average cost price method. The cost includes the expenditure incurred in acquiring the inventories, and the direct costs of bringing them to their location and making them operational.
Write downs of inventories to net realisable value are recognised in the period in which the write offs occurred.
CASH AND CASH EQUIVALENTS
Cash and cash equivalents comprise cash balances, bank balances, commercial paper and deposits that can be withdrawn on demand. Overdrafts that are repayable on demand and form an integral part of the Group's cash management are included as a component of cash and cash equivalents for the purpose of the statement of cash flows.
IMPAIRMENT NON-FINANCIAL ASSETS
The carrying amount of the Group's assets, excluding inventories and deferred taxes, are reviewed at the end of the reporting period for each asset to determine whether there is any indication of impairment. If any such indication exists, the recoverable amount of the asset is estimated
The recoverable amount of goodwill and intangible assets with an indefinite useful life and intangible assets that are not yet available for use is estimated at the end of each reporting period.
17
An impairment loss is recognised whenever the carrying amount of an asset or its cash generating unit exceeds its recoverable amount. Impairment losses are recognised in profit or loss. Recognised impairment losses relating to cash generating units are allocated first to reduce the carrying amount of any goodwill allocated to cash generating units and then to reduce the carrying amount of the other assets in the units on a pro rata basis.
After recognition of impairment losses, the depreciation costs for the asset will be prospectively adjusted.
Calculation of the recoverable amount
The recoverable amount of intangible assets and property, plant and equipment is determined as the higher of their fair value less costs to sell or value in use. In assessing value in use, the expected future cash flows are discounted to their present value using a pre tax discount rate that reflects both the current market assessment of the time value of money and the risks specific to the asset
The Group's assets do not generate cash flows that are independent from other assets. The recoverable amount is therefore determined for the cash generating unit (i.e. the entire high voltage grid) to which the asset belongs. This is also the level at which the Group administers its goodwill and reaps the economic benefits of acquired goodwill.
Reversals of impairment
An impairment loss in respect of goodwill is not reversed. Impairment loss on other assets is reversed if there have been changes in the estimates used to determine the recoverable amount.
An impairment loss is reversed only to the extent that the asset's carrying amount does not exceed the carrying amount that would have been determined, net of depreciation or amortisation, if no impairment loss had been recognised.
IMPAIRMENT FINANCIAL ASSETS
An impairment loss in respect of a financial asset measured at amortised cost is calculated as the difference between its carrying amount and the present value of the estimated future cash flows discounted at the asset's original effective interest rate. Losses are recognised in profit or loss and reflected in an allowance account against loans and receivables or held to maturity investments securities. Interest on the impaired asset continues to be recognised. When an event occurring after the impairment was recognised causes the amount of impairment loss to decrease, the decrease in impairment loss is reversed through profit or loss.
Impairment losses on available for sale financial assets are recognised by reclassifying the losses accumulated in the fair value reserve in equity to profit or loss. The cumulative loss that is reclassified from equity to profit or loss is the difference between the acquisition cost, net of any principal repayment and amortisation, and the current value, less any impairment loss recognised previously in profit or loss. Changes in cumulative impairment losses attributable to application of the effective interest method are reflected as a component of interest income. If, in a subsequent period, the fair value of an impaired available for sale debt security increases and the increase can be related objectively to an event occurring after the impairment loss was recognised, then the impairment loss is reversed, with the amount of the reversal recognised in profit or loss. However, any subsequent recovery in the fair value of an impaired available for sale equity security is recognised in other comprehensive income.
SHARE CAPITAL
Transaction costs
Transaction costs in respect of the issuing of capital are deducted from the capital received.
Dividends
Dividends are recognised as a liability in the period in which they are declared.
INTEREST-BEARING LOANS
Interest bearing loans are recognised initially at fair value less related transaction costs. Subsequent to initial recognition, interest bearing loans are stated at amortised cost price with any difference between cost price and redemption value being recognised in profit or loss over the period of the loans on an effective interest basis.
EMPLOYEE BENEFITS
Defined-contribution plans
All Belgian contribution based promises, called defined contribution pension plans under Belgian pension legislation, are classified as defined benefit plans for accounting purposes due to the legal minimum return to be guaranteed by the employer.
As Belgian contribution based promises are not back loaded, the defined benefit obligation (DBO) was determined following the Projected Unit Credit method (PUC) without projection of future contributions. The fair value of assets equals for each plan the sum of the accrued individual reserves (if any) and the value of the collective fund(s) (if any). Please also see the following section, 'Defined benefit plans'
Defined benefit plans
For defined benefit plans, the pension expenses are assessed on an annual basis by accredited actuaries separately for each plan, using the projected unit credit method. The estimated future benefit that employees have earned in return for their service in the current and previous periods is discounted to determine its present value, and the fair value of any plan assets is deducted. The discount rate is the interest rate as at the end of the reporting period on high quality bonds which have maturity dates that approximate to the terms of the Group's obligations and that are denominated in the currency in which the benefits are expected to be paid.
When the benefits of a plan are improved, the portion of the increased benefit relating to past service by employees is recognised as an expense in profit or loss at the earlier of the following dates:
• when the plan amendment or curtailment occurs; or
• when the entity recognises related restructuring costs under IAS 37 or termination benefits.
Where the calculation results in a benefit to the Group, the recognised asset is limited to the present value of any future refunds from the plan or reductions in future contributions to the plan.
18
Remeasurements, comprising of actuarial gains and losses, the effect of the asset ceiling, excluding amounts included in net interest on the net defined benefit liability and the return on plan assets (excluding amounts included in net interest on the net defined benefit liability), are recognised immediately in the statement of financial position with a corresponding debit or credit to retained earnings through OCI in the period in which they occur. Remeasurements are not reclassified to profit or loss in subsequent periods.
Reimbursement rights
Reimbursement rights are recognised as a separate asset when, and only when, it is virtually certain that another party will reimburse some or all of the expenditure required to settle the corresponding benefit obligation. The reimbursement rights are presented as non current assets under other financial assets and are measured at expected value. These rights are handled the same as the corresponding defined benefit obligation. When changes in the period result from changes in financial assumptions; changes from experience adjustments or changes in demographic assumptions, the asset is adjusted through OCI. The components of the defined benefit cost are recognised net of amounts relating to changes in the carrying amount of the rights to reimbursement.
Other long term employee benefits
The Group's net obligation in respect of long term service benefits other than pension plans is assessed on an annual basis by accredited actuaries. The net obligation is calculated using the projected unit credit method and is the amount of future benefit that employees have earned in return for their service in the current and previous periods. The obligation is discounted to its present value, and the fair value of any related assets is deducted. The discount rate is the yield as at the end of the reporting period on high quality bonds having maturity dates that approximate to the terms of the Group's obligations and that are denominated in the currency in which the benefits are expected to be paid.
Short term employee benefits
Short term employee benefits are measured on an undiscounted basis and are expensed as the related service is provided. A liability is recognised for the amount expected to be paid out under a short term cash bonus or profit sharing plans if the Group has a legal or constructive obligation to pay this amount as a result of the past service provided by the employee, and the obligation can be reliably estimated.
PROVISIONS
A provision is recognised in the balance sheet when the Group has a current legal or constructive obligation as a result of a past event and it is likely that an outflow of economic benefits of which a reliable estimate can be made will be required to settle the obligation.
If the effect is material, provisions are determined by discounting the expected future cash flows at a pre tax rate that reflects the current market assessment of the time value of money and, where appropriate, of the risks specific to the liability.
If the Group expects to recover some or all of the provisions from a third party, the compensation is only included as a separate asset if it is virtually certain that said compensation will be awarded. The cost connected to a provision is included in profit or loss net of any compensation.
The total estimated cost of dismantling and disposal of an asset are, if applicable, recognised as property, plant and equipment and depreciated over the asset's entire useful life. The total estimated cost of dismantling and of disposal of the asset is posted as provisions for the discounted current value. If the amount is discounted, the increase in the provision due to the lapse of time is classified as finance expenses.
TRADE AND OTHER PAYABLES
Trade and other payables are stated at amortised cost.
GOVERNMENT GRANTS
Government grants are recognised when it is reasonably certain that the Group will receive the grant and that all underlying conditions will be met. Grants related to an asset are presented under other liabilities and will be recognised in the income statement on a systematic basis over the expected useful life of the related asset. Grants related to expense items are recognised in the income statement in the same period as the expenses for which the grant was received. Government grants are presented as other operating income in the income statement.
3.5. Income statement items
REVENUE
Revenue is recognised when it is probable that future economic benefits associated with the transaction will flow to the entity and that these benefits can be measured reliably and recovery of the compensation due is likely.
Revenue includes changes in the settlement mechanism (see Note 7.16).
Revenue represents the fair value of the consideration received in the ordinary course of the Group's activities.
Goods sold and services rendered
Revenue from services and the sale of goods is recognised in profit or loss when the significant risks and rewards of ownership have been transferred to the buyer.
Construction contracts in progress
As soon as the outcome of a construction contract can be estimated reliably, contract revenue and expenses are recognised in profit or loss in proportion to the stage of completion of the contract. An expected loss on a contract is immediately recognised in profit or loss.
Transfer of assets from customers
The revenue from customers (financial contribution) for the construction of connections and related enhancement to the high voltage grid is recognised in profit or loss on the basis of the stage reached in recovery of the underlying property, plant and equipment
Other income
Other income is recognised when it is earned or when the related service is performed.
19
EXPENSES
Operating lease payments
Payments made under operating leases are recognised in profit or loss on a straight line basis over the term of the lease. Lease incentives received to conclude the leasing agreement are recognised in profit or loss as an integral part of the total lease expenses.
Other expenses
Property taxes chargeable to Elia Transmission (Belgium) are directly recognised in full (100%) as soon as ownership is certain (generally as of 1 January of the year). However, these costs, qualified as non controllable costs in the regulatory framework, are recorded as revenue through the settlement mechanism for the same amount, resulting in a zero profit or loss impact.
FINANCE INCOME AND EXPENSES
Finance expenses comprise interest payable on borrowings, calculated using the effective interest rate method, foreign exchange losses, gains on currency hedging instruments offsetting currency losses, results on interest rate hedging instruments, losses on hedging instruments that are not part of a hedge accounting relationship, losses on financial assets classified as for trading purposes and impairment losses on available for sale financial assets as well as any losses from hedge ineffectiveness. Net finance expenses comprise interest on loans, calculated using the effective interest rate method and foreign exchange gains and losses.
Finance income includes, amongst others, interest receivables on bank deposits, recognised in profit or loss as it accrues using the effective interest rate method.
Borrowing costs that are not directly attributable to the acquisition, construction or production of a qualifying asset are recognised in profit or loss using the effective interest method.
INCOME TAXES
Income taxes comprise current and deferred tax. Income tax expense is recognised in profit or loss, except to the extent that it relates to items recognised directly in equity.
Current tax is the expected tax payable on taxable income for the year, using tax rates enacted or substantively enacted at the end of the reporting period, and any adjustments to tax payable in respect of previous years.
Deferred tax is recognised, using the balance sheet method, on temporary differences arising between the carrying amounts of assets and liabilities for financial reporting purposes and the amounts used for taxation purposes. Deferred tax is not recognised for the following temporary differences: the initial recognition of assets or liabilities in a transaction that is not a business combination and that affects neither accounting nor taxable profit, and differences relating to investments in subsidiaries and joint ventures to the extent that it is probable that they will not be reversed in the foreseeable future. In addition, deferred tax is not recognised for taxable temporary differences arising from initial recognition of goodwill. Deferred tax is measured at the tax rates that are expected to be applied to the temporary differences when they are reversed, based on the laws that have been enacted or substantively enacted by the reporting date. Deferred tax assets and liabilities are offset if there is a legally enforceable right to offset current tax liabilities and assets and they relate to income taxes levied by the same tax authority on the same taxable entity or on different tax entities, but they are intended to settle current tax liabilities and assets on a net basis or their tax assets and liabilities will be realised simultaneously.
A deferred tax asset is recognised only to the extent that it is likely that future taxable profits will be available against which the asset can be utilised. Deferred tax assets are reduced to the extent that it is no longer likely that the related tax benefit will be realised.
Additional income taxes that arise from the distribution of dividends are recognised at the same time as the liability to pay the related dividend.
3.6.
Statement of comprehensive income and statement of changes in equity
The statement of comprehensive income presents an overview of all revenues and expenses recognised in the consolidated statement of profit or loss and in the consolidated statement of changes in equity. The Group has elected to present comprehensive income using the two statement approach, i.e. the statement of profit or loss immediately followed by the statement of other comprehensive income. As a result of this presentation, the content of the statement of changes in equity is restricted to owner related changes.
20
4. Segment reporting
4.1. Basis for segmentation
The Group has opted for a geographical segmentation since this segmentation forms the basis for the Company's internal management reporting and enables the Chief Operating Decision Maker (CODM) to evaluate and assess the type and financial profile of its activities in a transparent way.
Pursuant to IFRS 8, the Group has identified the following operating segments based on the aforementioned criteria:
• Elia Transmission (Belgium), which comprises Elia System Operator NV/SA and the companies whose activities are directly linked to the role of Belgian transmission system operator (Elia Asset NV/SA, Elia Engineering NV/SA, Elia Re SA, HGRT SAS, Coreso NV/SA, Ampacimon SA and Enervalis NV);
• 50Hertz Transmission (Germany), which comprises Eurogrid International CVBA/SCRL and companies whose activities are directly linked to the role of transmission system operator in Germany (Eurogrid GmbH, 50Hertz Transmission GmbH, 50Hertz Offshore GmbH and Gridlab GmbH);
• Atlantic Grid, comprising E Offshore A LLC and Atlantic Grid Investment A Inc, who are connected to the Atlantic Wind Connection project which aims to develop the first high voltage direct current offshore grid off the East Coast of the United States;
• EGI (Elia Grid International NV/SA and Elia Grid International GmbH), both companies supplying specialists in consulting, services, engineering and procurement, creating value by delivering solutions based on international best practice, while fully complying with regulated business environments;
• Nemo (Nemo Link Ltd), linked to the Nemo project, which will connect the UK and Belgium using high voltage electricity cables, enabling power to be exchanged between the two countries.
Under IFRS 8, the Group is required to report segment information about each operating segment that exceeds certain quantitative thresholds. Since the operational activities of Atlantic Grid, EGI and Nemo do not exceed the thresholds, the operations of Atlantic Grid have been aggregated in the reporting segment 50Hertz Transmission (Germany) and the operations of EGI and Nemo in the reporting segment of Elia Transmission (Belgium) as their activities are regularly evaluated by the respective CODMs for those segments.
The two operating segments have also been identified as the Group's cash generating units, as the group of assets managed by the segments independently generates cash flows.
The CODM has been identified by the Group as being the Boards of Directors, the CEOs and the Management Committees of each segment. The CODM periodically reviews the performance of the Group's segments using various indicators such as revenue, EBITDA and operating profit.
The company's geographical segments are mainly characterised by common revenue and cost drivers and the same public service mission in their respective geographical area, but differ from each other mainly in terms of country specific regulatory frameworks. For more details about this topic, please see Note 9: 'Regulatory framework and tariffs'
The information presented to the CODM follows the Group's IFRS accounting policies and therefore no reconciling items have to be disclosed.
4.2. Elia Transmission (Belgium)
The table hereafter shows the 2017 consolidated results of Elia Transmission (Belgium)
Elia Transmission key figures (in million EUR) Year ended 31 December
2017 2016 Difference (%)
Total revenues and other income 887.5 868.1 2.2%
Depreciation, amortisation, impairment and changes in provisions (130.8) (130.0) 0.6%
Results from operating activities 235.9 216.6 8.9%
Share of profit of equity accounted investees, net of tax 0.6 3.1 (80.6%)
EBIT 236.5 219.6 7.7%
EBITDA 367.3 349.6 5.1%
Finance income 5.5 7.0 (21.4%)
Finance costs (81.9) (89.9) (8.9%)
Income tax expense (39.1) (32.0) 22.2%
Profit attributable to the owners of the Company 121.0 104.5 15.8%
Consolidated statement of financial position (in million EUR)
31 December 2017 31 December 2016 Difference (%)
Total assets 5,765.1 5,463.6 5.5%
Capital expenditure 388.1 406.9 (4.6%)
Net financial debt 2,689.1 2,557.3 5.2%
EBITDA (Earnings Before Interest and Taxes, Depreciations and Amortisations) = EBIT + depreciation/amortisation + changes in provisions
21
In early 2016, the new tariff methodology approved by regulator CREG on 26 November 2015, came into force. The methodology is again applicable for a four year period and introduces some new elements compared with the previous methodology which was applicable from 2012 until 2015. The most important changes are 1) the way the allowed net profit is built up, which is now more closely linked to operational performance, 2) the structure of the tariffs, which still use a 'cost plus' methodology, and 3) the definition of the cost categories: reservation costs of ancillary services (except black start) are classified as 'influenceable costs' (and no longer as 'non controllable costs') and are eligible for an incentive within predefined limits. Finally, tariffs are no longer fixed for a four year period, but annual tariffs are agreed within the four year time frame. For more information about the new regulated framework, see Note 9.1.
Financial
Elia Transmission's revenue was up 2.2% on the same period the previous year, to €887.5 million. The increase in revenues is a result of a higher authorised regulated net profit, higher depreciations and higher taxes that are passed on into revenues. These increases were partly offset by lower costs, mainly for ancillary services and financing, which are all passed on into revenues, benefitting consumers and offsetting the lower revenues generated by Elia Grid International (EGI).
The table below provides more details of changes in the various revenue components:
(in million EUR) 2017 2016 Difference (%)
Revenues according to old tariff mechanism 0.0 (1.3) n/a
Grid connection 42.2 40.8 3.3%
Management and development of grid infrastructure 479.2 476.8 0.5%
Management of the electrical system 118.5 118.1 0.4%
Compensation for imbalances 170.7 146.4 16.6%
Market integration 24.3 23.5 3.3%
International revenue 47.3 38.9 21.4%
Other income (including EGI revenues) 97.5 105.8 (7.8%)
Subtotal revenues and other income 979.8 949.1 3.2%
Settlement mechanism: deviations from approved budget (92.3) (81.0) 14.0%
Total revenues and other income 887.5 868.1 2.2%
Grid connection revenues increased slightly to €42.2 million (up 3.3%) as a result of a tariff increase as well as an increase in the number of connected assets.
Revenues from management and development of grid infrastructure (up 0.5%) and management of the electrical system (up 0.4%) remained fairly stable.
Services rendered in the context of energy management (including black start) and individual balancing of balancing groups are paid as part of the revenues from compensation for imbalances. These revenues increased by 16.6% to €170.7 million, largely due to the tariff increase for energy management (up €13.7 million) and because of higher revenues from compensation for imbalances as a result of higher congestion (up €10.8 million).
Finally, the last section of the tariff revenues encompasses the services that Elia Transmission provides within the context of market integration, which increased slightly (up 3.3%) to €24.3 million.
International revenue increased by €8.4 million (up 21.4%), due to the higher congestion on the borders in early 2017 resulting from a lack of production in France and lower generation levels in Belgium at the year end
Other income decreased by €8.3 million (down 7.8%) compared with the same period the previous year to €97.6 million. This was driven principally by EGI revenues, which decreased from €19.7 million to €9.7 million, as fewer owner's engineering services were provided in 2017 than the previous year.
The settlement mechanism (€92.3 million) encompasses the deviation in the current year from the budget approved by CREG. The operating surplus, in relation to the budget of the costs and revenues authorised by the regulator, must be returned to consumers and therefore does not form part of the revenues. The operational surplus compared with the budget is primarily a result of the higher tariff sales (€13.0 million), increased cross border revenues (€4.6 million), lower costs for ancillary services (€50.9 million) and lower financial charges (€19.6 million). This was partly offset by a higher than budget regulated net profit (€9.2 million) and the usage of a deferred tax asset for used notional interest deduction (€11.8 million).
The reported EBITDA (up 5.1%) and EBIT (up 7.7%) were mainly impacted by increased regulated net profit, higher depreciations and lower financing costs to be passed on in the tariffs, partly offset by the lower contribution from EGI and the lower result of equity accounted investments.
Net finance costs (down 7.7%) fell by €6.4 million compared with 2016, mainly due to the repayment of a €500 million bond in April 2016. Also, with the settlement of the fiscal claim in 2016 and the cash inflow of €176.2 million following the purchase of 2.8 million green certificates by the Walloon Region in September 2017, the financing was limited to issuing a €250 million Eurobond. Owing to strong investor interest and low market interest rates, the Eurobond had a coupon rate of 1.375%. The lower lending costs are passed on in full to consumers, in accordance with the regulatory framework.
22
In a nutshell, the net profit increased by 15.8% to €121.0 million, mainly due to the following items:
• increase in the fair remuneration (up €5.0 million): The higher average OLO compared to 2016 (up 0.25%) and the increase in equity due to reservation of part of the 2016 result (€40.1 million) led to a fair remuneration of €41.1 million;
• decrease in the incentives realised (down €5.2 million): Good operational performance, primarily involving the incentives linked to innovation (up €0.5 million) and the discretionary incentive (up €0.4 million), was offset by a higher average tax rate (down €1.8 million), lower performance on the incentive linked to import capacity (down €2.3 million) following a change in the regulatory reference for 2017, and lower efficiency (down €2.0 million);
• a higher mark up for strategic investments (up €9.5 million);
• higher customer contributions for specific investments (up €4.5 million);
• no major damage to electrical facilities compared with 2016 (up €1.0 million);
• IAS 19 related changes (down €2.7 million);
• a lower result on equity accounted investments than 2016 (down €2.5 million);
• others (down €0.9 million): a lower EGI result (down €1.5 million), a lower regulatory settlement for the previous year (down €1.7 million), higher activation of software costs (up €1.5 million) and the capitalisation of issuance costs linked to the Eurobond (up €0.7 million).
The reported net profit increased more sharply by 15.8% to €121.0 million. Following the approval of the legislation implementing the corporate income tax reform in late December 2017, Elia Transmission reassessed its deferred tax assets and liabilities according to the new future tax rates that apply to the period when the asset will be realised or the liability will be settled, leading to a non recurring result of €12.4 million for the period.
Total assets increased by 5.5% to €5,765.1 million, mainly as a result of the investment programme. The net financial debt also increased to €2,689.1 million (up 5.2%), as Elia's sizeable CAPEX programme (€485.6 million) was mainly financed by cash flows generated from operating activities (€370.2 million), the proceeds from the sale of 2.8 million green certificates to the Walloon Region leading to a cash inflow of €176.2 million and profit reservation from prior years. In addition, Elia Transmission issued a €250 million Eurobond in late March 2017, partially offset by the reimbursement of commercial paper and an EIB loan reaching maturity in 2017 (€20 million).
The equity increased mainly as a result of the reservation of the 2017 profit, partly offset by the payment of dividends for 2016 (€96.2 million).
4.3. 50Hertz Transmission (Germany)
The table below shows the 2017 consolidated results of the 50Hertz Transmission system operator activities in Germany:
50Hertz Transmission key figures (in million EUR) Year ended 31 December*
Total revenues and other income
2017 2016 Difference (%)
1,330.2 1,291,2 3.0%
Depreciation, amortisation, impairment and changes in provisions (150.1) (139.1) 7.9%
EBIT 321.7 237.2 35.6%
EBITDA 471.8 376.3 25.4%
Finance income 1.9 1.8 5.6%
Finance costs (56.2) (57.1) (1.6%)
Income tax expense (87.1) (56.3) 54.7%
Profit attributable to the owners of the Company 180.2 125.6 43.5%
Consolidated statement of financial position (in million EUR)
31 December 2017 31 December 2016 Difference (%)
Total assets 6,196.0 5,663.6 9.4%
Capital expenditure 478.1 737.3 (35.2%)
Net financial debt 1,435.6 1,623.5 (11.6%)
* 60% of the profit attributable to the owners of the Company is included in 'Share of profit of equity accounted investees (net of income tax) of the Group'
50Hertz Transmission's revenue increased by 3.0% compared with 2016. This was the result of increasing revenues following the increased onshore and offshore investments, as well as higher levels of other revenues.
The table below provides more details of changes in the various revenue components:
Total revenues and other income (in million EUR)
Vertical grid revenues
2017 2016 Difference (%)
1,241.4 944.3 31.5%
Horizontal grid revenues 210.2 167.2 25.7%
Ancillary services revenues 94.0 99.5 (5.5%)
Other revenues 73.5 64.9 13.3%
Subtotal revenues and other income 1,619.1 1,275.9 26.9%
Settlement mechanism: deviations from approved budget (288.9) 15.3 n/a
Total revenues and other income 1,330.2 1,291.2 3.0%
23
Vertical grid revenue (tariffs to end customers) increased by €297.1 million primarily as a result of the increase in the total allowed revenues by the regulator. The allowed non controllable costs for energy (up €353.6 million) to be passed on in the tariffs, which are updated each year, were impacted by a newly introduced allowance for renewable energy (RES) curtailment costs, as well as the recovery of the substantial 2015 tariff deficits for energy costs. Furthermore, following the ongoing investment programme, there was an increased allowed cost recovery for investments (up €16.4 million).
Horizontal grid revenues increased by €43.0 million compared with 2016, mainly due to higher congestion income (up €7.0 million) and higher offshore costs charged to other TSOs (up €33.7 million). In Germany, all offshore connection costs are shared among the four German transmission system operators. This means that 50Hertz bears around 20% of these costs and passes on 80% of its own connection costs to the other three TSOs. Due to the increasing offshore investments, which in 2017 related mainly to the offshore grid connection of Ostwind 1, the cost recovery charged horizontally to the other TSOs is rising and thus impacting the horizontal revenues.
Ancillary services revenues fell slightly, decreasing by €5.5 million. Cross border redispatch revenues dropped sharply with the commissioning of phase shifting transformers at the Czech border. This was partly compensated by higher revenues from balancing groups, as higher costs for control energy were passed on to the balancing group owners.
The settlement mechanism includes both the annual offsetting of deficits and surpluses arising accounted for before 2017 ( €162.1 million) and the net surplus generated in 2017 between the costs allowed to be passed on in the tariffs and actual costs ( €126.8 million). The operational surplus in 2017 results mainly from the lower real energy costs as a result of favourable weather conditions and preventative grid measures.
The EBITDA increased to €471.8 million (up 25.4%) mainly as a result of both onshore and offshore investment activities (up €38.7 million) and lower operational expenditure (up €72.4 million). Material costs dropped significantly mainly due to lower maintenance costs, after peaking in the maintenance activity cycle in 2016. Furthermore, due to the substantial investment programme and the lower rate of maintenance activities, a higher portion of personnel costs could be allocated to new investments leading to higher own work capitalised revenues than 2016. EBIT (up 35.6%) was further impacted by the increased depreciations as a result of the commissioning of the Southwest Coupling Line and the North Ring during 2017. Taking into account the non recurring energy bonus realised in 2017 (€4.8 million), which was down from 2016 (€7.6 million), and non recurring regulatory settlements ( €4.6 million), the reported EBIT came in at €321.7 million.
The net profit increased by 43.5% to €180.2 million as a result of:
• a growing asset base driven by the ongoing investment programme, leading to a higher onshore (up €17.4 million) and offshore (up €21.3 million) remuneration;
• lower OPEX and other costs (up €72.4 million);
• increased depreciation (down €11.5 million) driven by commissioning of investments;
• reduced net finance costs (up €2.3 million), with the full year effect of the €750 million debt capital market transaction concluded in April 2016 offset by lower interest on provisions;
• increased income tax expense (down €35.6 million).
Total assets increased by 9.4% to €6,196.0 million, mainly due to a favourable development of the EEG cash and the investments made.
50Hertz ended the year with a positive free cash flow of €283.8 million linked to the positive EEG cash flows and the remuneration of the 2015 energy costs, recovered in 2017. Consequently, the net financial debt decreased to €1,435.6 million compared with the end of 2016. The net debt includes an EEG cash position of €775.7 million.
24
4.4. Reconciliation of information on reportable segments to IFRS amounts
Consolidated results (in million EUR)
Year ended 31 December
2017 2017 2017 2017 Elia Transmission (Belgium)
50Hertz Transmission (Germany)
Consolidation entries and intersegment transactions
Elia Group (a) (b) (c) (a)+(b)+(c)
Total revenues and other income 887.5 1,330.2 (1,330.2) 887.5
Depreciation, amortisation, impairment and changes in provisions (130.8) (150.1) 150.1 (130.8)
Results from operating activities 235.9 321.7 (321.7) 235.9
Share of profit of equity accounted investees, net of tax 0.6 0.0 108.1 108.7
EBIT 236.5 321.7 (213.6) 344.6
EBITDA 367.3 471.8 (363.6) 475.5
Finance income 5.5 1.9 (1.9) 5.5
Finance costs (81.9) (56.2) 56.2 (81.9)
Income tax expense (39.1) (87.1) 87.1 (39.1)
Profit attributable to the owners of the Company 121.0 180.2 (72.1) 229.1
Consolidated statement of financial position (in million EUR)
Total assets 5,765.1 6,196.0 (5,364.6) 6,596.5
Capital expenditure 388.1 478.1 (478.1) 388.1
Net financial debt 2,689.1 1,435.6 (1,435.6) 2,689.1
Total revenues and other income 868.1 1,291.2 (1,291.2) 868.1
Depreciation, amortisation, impairment and changes in provisions (130.0) (139.1) 139.1 (130.0)
Results from operating activities 216.6 237.2 (237.2) 216.6
Share of profit of equity accounted investees, net of tax 3.1 0.0 75.3 78.4
EBIT 219.6 237.2 (161.8) 295.0
EBITDA 349.6 376.3 (300.9) 425.0
Finance income 7.0 1.8 (1.8) 7.0
Finance costs (89.9) (57.1) 57.1 (89.9)
Income tax expense (32.0) (56.3) 56.3 (32.0)
Profit attributable to the owners of the Company 104.5 125.6 (50.2) 179.9
Consolidated statement of financial position (in million EUR)
31 Dec 2016 31 Dec 2016
31 Dec 2016 31 Dec 2016
Total assets 5,463.6 5,663.6 (4,885.6) 6,241.6
Capital expenditure 406.9 737.3 (737.3) 406.9
There are no significant intersegment transactions.
The Group has no concentration of customers in either of the operating segments.
25 Net financial debt 2,557.3 1,623.5 (1,623.5) 2,557.3
31 Dec 2017 31 Dec 2017 31 Dec 2017 31 Dec 2017 Consolidated results (in million EUR) Year ended 31 December 2016 2016 2016 2016 Elia Transmission (Belgium) 50Hertz Transmission (Germany) Consolidation entries and intersegment transactions Elia Group (a) (b) (c) (a)+(b)+(c)5. Equity-accounted investees
5.1. Joint ventures
Eurogrid International CVBA is a joint venture of the Group. The Company was established by the Group together with IFM Investors (UK) Ltd to acquire 50Hertz Transmission GmbH, one of the four German transmission system operators. The Group has a stake of 60% in the joint venture. Eurogrid International is a private entity that is not listed on any public exchange.
Eurogrid International and its subsidiaries (see Note 8.5) together form the segment 50Hertz Transmission (Germany). See Note 4.3.
The following table summarises the financial information of the joint venture, based on its IFRS financial statements, and reconciliation with the carrying amount for the Group's interest in the consolidated financial statements.
(in million EUR)
2017 2016
Percentage ownership interest 60.00% 60 00%
Non current assets 4,580.4 4,238 6
Current assets 1,615.6 1,425 1
Non current liabilities 3,096.6 3,188 7
Current liabilities 1,714.0 1,178 6
Equity 1,385.4 1,296 4
Group's carrying amount for the interest 831.3 777 8
Revenues and other income 1,330.2 1,291 2
Depreciation and amortisation (149.8) (138 3)
Net finance result (54.4) (55 4)
Profit before income tax 267.3 181 9
Income tax expense (87.1) (56 3)
Profit for the year 180.2 125 6
Total comprehensive income for the year 180.2 125 6
Group's share of profit for the year 108.1 75 4 Dividends received by the Group 55.9 55 6
Since February 2015, Elia and National Grid have had a joint venture, Nemo Link Ltd, in place for the construction of an interconnector between Belgium and the UK. This project consists of subsea and underground cables connected to a converter station and an electricity substation in each country, which will allow electricity to flow in either direction between the two countries and will give UK and Belgium improved reliability and access to electricity and sustainable generation. The two companies have an equal ownership percentage. The figures of this joint venture are incorporated into the Belgian segment (see Note 4.2). In 2017, Elia injected €56.4 million in capital into Nemo Link Ltd.
The following table summarises the financial information of the joint venture, based on its IFRS financial statements and reconciliation with the carrying amount for the Group's interest in the consolidated financial statements.
(in million EUR)
2017 2016
Percentage ownership interest 50.0% 50.0%
Non current assets 490.7 242.4
Current assets 63.7 29.2
Non current liabilities 297.1 111.6
Current liabilities 72.3 85.0
Equity 185.0 74.9
Group's carrying amount for the interest 92.5 37.5
Revenues and other income 0.0 0.0
Depreciation and amortisation 0.0 0.0
Net finance result (0.1) (0.2)
Profit before income tax (0.1) (0.3)
Income tax (2.6) 3.0
Profit for the year (2.7) 2.7
Total comprehensive income for the year (2.7) 2.7
Group's share of profit for the year (1.4) 1.4
Dividends received by the Group 0.0 0.0
26
Associates
The Group has four associates, all of which are equity accounted investees.
The Group acquired a 12.5% interest in Enervalis NV during the year. This is a start up that develops innovative software as a service solutions that will allow market players to optimise their energy bills while helping to meet the growing need for flexibility in the electricity system. A representative of the Group has been appointed a member of Enervalis's Board of Directors. Therefore the Group considers to have a significant influence and Enervalis is, as such, accounted for using the equity method.
The Group has a 20.5% interest in Ampacimon SA, a Belgian company working on developing innovative monitoring systems provided to TSOs and distribution system operators (DSOs) so that they can more quickly anticipate on changes in energy supply and demand On 31 January 2017, the Group acquired 128 additional shares from the previous shareholders.
The Group has a 20.6% interest in Coreso NV/SA, a company which provides coordination services aimed at facilitating the secure operation of the high voltage electricity system in seven countries. During the year, the Group transferred 127 shares to new shareholders; 63 of these shares were held by entities in the German segment.
HGRT SAS is a French company with a 49.0% stake in Epex Spot, the exchange for power spot trading in Germany, France, Austria, Switzerland, Luxembourg and (through its 100% associate APX) the UK, Netherlands and Belgium. The Group itself holds a 17.0% stake in HGRT. As one of the founding partners of HGRT, the Group has a 'golden share', enabling the Group to have a minimum number of representatives on the Board of Directors. This constitutes a significant influence and therefore HGRT is accounted for using the equity method.
In 2017, the Group received a dividend of €0.9 million from HGRT (€1.7 million in 2016).
None of these companies are listed on any public exchange.
The following table illustrates the summarised financial information of the Group's investment in these companies, based on their respective financial statements prepared in accordance with IFRS.
(in million EUR)
Enervalis Ampacimon Coreso HGRT 2017 2016 2017 2016 2017 2016 2017 2016
Percentage ownership interest 12.5% 0.0% 20.5% 19.6% 20.6% 21.7% 17.0% 17.0%
Non current assets
Current assets
Non current liabilities
Current liabilities
0 3 0 2 0.0 3 1 2.3 93.0 93.4
1 4 5 8 4.8 2 5 2.3 7.2 1.5
0 0 0 1 0.1 0 0 0.0 0.0 0.0
0 3 2 8 1.9 3 2 2.5 0.1 0.0
Equity 1 3 3 1 2.8 2 4 2.2 100.2 94.9 Group's carrying amount for the interest
Revenues and other income
0 7 0 6 0.5 0 4 0.5 17.0 16.1
0 8 2 6 1.2 10 5 9.2 0.0 0.0
Profit before income tax (1 1) 0 7 2.1 0 5 0.4 11.0 8.1
Income tax expense
0 0 (0 3) (0.1) (0 2) (0.2) (0.2) (0.5)
Profit for the year (1 1) 0 4 1.9 0 2 0.2 10.8 7.6
Total comprehensive income for the year (1 1) 0 4 1.9 0 2 0.2 10.8 7.6
Group's share of profit for the year 0 0 0 1 0.4 0 0 0.0 1.8 1.3
27 5.2.
6. Items in the consolidated statement of profit or loss and other comprehensive income
6.1. Revenue
(in million EUR)
2017 2016
Revenue 806.4 785.1
Transfers of assets from customers 22.1 15.1
Total revenue 828.5 800.1
We refer to the segment reporting for a breakdown of the significant categories within the revenue of the Belgian segment (Note 4.2).
6.2. Other income
(in million EUR)
Services and technical expertise
2017 2016
0.0 5.7
Own production 25.5 19.2
Optimal use of assets 14.3 14.4
Other 18.2 28.5
Gain on sale PPE 1.0 0.2
Other operating income 59.0 68.0
The Group's own production relates to time worked on investment projects by own employees. The €6.3 million increase is mainly due to the increase in capital expenditure and the completion of the Stevin project. This last phase required a lot of testing and human intervention to ensure that the project could be operational in time.
The optimal use of assets mainly represents income generated from contracts with telecom operators, where pylons and dark fibres are made available as a support to their mobile network.
The section 'Other' has decreased by €10 million. This is mainly due to the one off impact in 2016 of the Nemo development costs. Those development costs ( €8.8 million) were invoiced to Nemo Link Ltd in 2016.
6.3. Operating expenses
COST OF MATERIALS, SERVICES AND OTHER GOODS
(in million EUR)
2017 2016
Raw materials, consumables and goods for resale 9.6 18.8
Purchase of ancillary services 140.2 133.2 Services and other goods (excl. purchase of ancillary services) 204.2 203.5
Total 354.0 355.4
The decrease in raw materials, consumables and goods for resale is primarily driven by EGI GmbH. In 2016, substantial costs were incurred by a number of projects where key milestones were reached.
Purchase of ancillary services includes the costs for services which enable the Group to balance generation with demand, to maintain constant voltage levels and to manage congestion on its grids. The cost incurred in 2017 mainly increased because of the number of activations needed to guarantee a balanced grid. These were mainly a result of the colder winter period in 2017, leading to higher levels of electricity consumption, as well as of increased electricity generation by wind energy, which had an effect on overall production.
Services and other goods are related to maintenance of the grid, services provided by third parties, insurance and consultancy, among others
PERSONNEL EXPENSES
(in million EUR)
2017 2016
Salaries and wages 101.6 94.2
Social security contributions 26.2 25.1
Pension costs 7.2 12.7
Other personnel expenses 9.9 7.9
Share based payment 0.1 1.0
Employee benefits (excl. pensions) 2.2 3.0
Total 147.2 143.9
In March 2017, Elia Group gave its employees in Belgium the chance to subscribe to an Elia System Operator SA capital increase. The capital increase resulted in the creation of 9,861 additional shares without nominal value. The Group's employees were granted a 16.66% reduction on the quoted share price, which resulted in a €0.1 million reduction overall. The transaction resulted in a €0.3 million capital increase and a €0.1 million increase in the share premium.
Elia Group had 1,333.2 FTEs on 31 December 2017 as opposed to 1,268.5 FTEs at the end of 2016, i.e. a 7.4% increase
For more information regarding pension costs and employee benefits, see Note 7.12: Employee benefits.
28
DEPRECIATION, AMORTISATION, IMPAIRMENT AND CHANGES IN PROVISIONS
(in million EUR)
2017 2016
Amortisation of intangible assets 8.0 8.5
Depreciation of property, plant and equipment 123.4 115.9
Total depreciation & amortisation 131.3 124.4
Impairment of inventories (0.3) 0.3
Total impairment (0.3) 0.3
Other provisions 1.3 2.9
Environmental provisions (1.6) 2.4
Changes in provisions (0.4) 5.3
Total 130.8 130.0
The amount of impairment on trade receivables is explained in Note 8.2: Financial risk and derivative management.
A detailed description is provided in other sections for 'Intangible assets' (see Note 7.2), 'Property, plant and equipment' (see Note 7.1) and 'Provisions' (see Note 7.13).
OTHER EXPENSES
(in million EUR)
2017 2016
Taxes other than income tax 11.9 12.9
Loss on disposal/sale of property, plant and equipment 7.5 9.1
Impairment on receivables 0.3 0.2
Other operating expenses 19.6 22.2
Taxes other than income tax mainly consist of property taxes.
6.4. Net finance costs
(in million EUR)
2017 2016
Finance income 5.5 7.0
Interest income on investment trust, cash and cash equivalents and granted loans 3.6 1.6
Other financial income 1.9 5.4
Finance costs (81.9) (89.9)
Interest expense on eurobonds and other bank borrowings (68.1) (76.4)
Interest expense on derivatives (9.3) (9.2)
Other financial costs (4.5) (4.2)
Exchange losses (0.0) (0.1)
Net finance costs (76.5) (82.8)
Interest income on investment trust, cash and cash equivalents and granted loans involves €3.6 million in interest relating to a loan agreement between Elia System Operator and Nemo Link Ltd. See Note 7.4.
The interest expenses on eurobonds and other bank borrowings decreased as a result of lower interest rates being available in the market. In 2016, a €500.0 million eurobond was repaid, subject to higher historic interest rates, with a €250.0 million eurobond being issued in March 2017. See Notes 4.2 and 8.2.
For more details of net debt and loans, see Note 7.11.
6.5. Income taxes
RECOGNISED IN PROFIT OR LOSS
The consolidated income statement includes the following taxes:
(in million EUR)
2017 2016
Current year 28.5 15.4
Adjustments for prior years 0.7 (2.9)
Total current income tax expenses 29.2 12.5
Origination and reversal of temporary differences 9.9 19.4
Total deferred taxes 9.9 19.4
Total income taxes recognised in profit and loss 39.1 32.0
The current income tax expenses increased in 2017 compared with 2016. The main reason for this were the higher profits realised in 2017 than in the financial year 2016 and the effect of the 'notional interest deduction'. The latter was not only impacted by a decreased Notional Interest Deduction percentage in the course of the year (from 1.13% in the financial year 2016 to 0.24% in the financial year 2017) but also the utilisation of all the outstanding notional interest carried forward.
The lower deferred tax charge is mainly a result of tax reform, which gave a €12.4 million positive effect on profit and loss.
29
RECONCILIATION OF THE EFFECTIVE TAX RATE
The tax on the Group's profit (loss) before tax differs from the theoretical amount that would arise using the Belgian statutory tax rate applicable to profits (losses) of the consolidated companies as follows:
(in million EUR) 2017 2016
Profit before income tax 268.2 212.2
Income tax expense 39.1 32.0
Income tax, using the domestic corporate income tax rate 91.2 72.1
Domestic corporate income tax 33.99% 33.99%
Effect of the foreign tax rate (0.2) (0.1)
Share of profit of equity accounted investees (37.0) (26.7)
Non deductible expenses 2.6 2.4
Adjustments prior years 0.7 (2.9)
Tax incentives (notional interest deduction) (13.1) (18.0)
Tax credit R&D (2.3) (5.6)
Effect of NID carried forward on regulatory balance 7.9 8.2
Fairness tax 0.0 0.6
Tax reform: deferred income tax adjustments (12.4) 0.0
Other 1.8 1.9
Income tax expense 39.1 32.0
1 DTA = Deferred tax asset; NID = Notional Interest Deduction
The notional interest deduction (NID) decreased from the previous year. This is mainly a result of the lower NID percentage that decreased to 0.24% in the financial year 2017, as opposed to 1.13% in the financial year 2016, and the lower tax assets with respect to notional interest carried forward.
Deferred income taxes are discussed further in Note 7.5.
6.6. Earnings per share (EPS)
BASIC EPS
Basic earnings per share are calculated by dividing the net profit attributable to the shareholders of the Company (€229.1 million) by the weighted average number of ordinary shares outstanding during the year.
Weighted average number of ordinary shares 2017 2016
Ordinary shares issued on 1 January 60,891,158 60,750,239
Impact of the shares issued in December 2016 3,475
Impact of the shares issued in March 2017 7,646
Weighted average number of shares on 31 December 60,898,804 60,753,714
DILUTED EPS
Diluted earnings per share are determined by adjusting the profit or loss attributable to ordinary shareholders and the weighted average number of ordinary shares outstanding for the effects of all dilutive potential ordinary shares, which comprise share options and convertible bonds.
Diluted earnings per share are equal to basic earnings per share, since there are no share options or convertible bonds.
Share capital and reserves per share
Share capital and reserves per share totalled €43.4 per share on 31 December 2017, compared with a value of €41.4 per share at the end of 2016
6.7. Other comprehensive income
Total comprehensive income includes both the result of the period recognised in the statement of profit or loss and the other comprehensive income recognised in equity. Other comprehensive income includes all changes in equity other than owner related changes, which are reported in the statement of changes in equity.
Changes in fair value
(in million EUR) 2017 2016
Net changes in fair value of interest rate swaps 6.2 5.7
Recognised in:
Hedging reserve 6.2 5.7
The decrease in market value of the Group's interest rate swaps can be explained by the maturity of all the existing interest rate swap contracts in 2017. At the year end of 2017, the Group was only engaged in two smaller foreign currency rate swaps with a fair value of below €0.1 million.
The hedging reserve is discussed in detail in Note 8.2.
30
Remeasurements
The OCI had a negative impact of €10.3 million, mainly relating to defined benefit plan actuarial gains and losses (including the impact of reimbursement rights) (also see Note 7.12). The lower OCI compared with 2016 is mainly due to the impact incurred in the current year from experience adjustments to the defined benefit plans.
7. Items in the consolidated statement of financial position
7.1. Property, plant and equipment (in million EUR)
Land and buildings Machinery and equipment
Furniture and vehicles
ACQUISITION VALUE
Balance at 1 January 2016
Additions
Other tangible assets
Assets under construction Total
193.6 4,666.2 153.8 15.0 346.2 5,374.8
2.4 43.3 11.2 0.1 340.1 397.2
Disposals (0.5) (35.7) (2.8) (0.3) (2.8) (42.1)
Transfers from one heading to another 4.2 230.3 0.0 0.0 (234.6) 0.0
Balance at 31 December 2016 199.8 4,904.2 162.2 14.8 448.9 5,729.9
Balance at 1 January 2017 199.8 4,904.2 162.2 14.8 448.9 5,729.9
Additions 3.5 46.3 8.8 0.1 318.6 377.3
Disposals (0.3) (43.2) (1.7) (0.2) (0.1) (45.6)
Transfers from one heading to another 2.9 357.9 0.0 4.6 (365.5) 0.0
Balance at 31 December 2017 205.9 5,265.1 169.3 19.3 401.9 6,061.6
DEPRECIATION AND IMPAIRMENT
Balance at 1 January 2016 (20.8) (2,535.5) (120.2) (11.1) (2,687.7)
Depreciation (2.0) (105.1) (8.3) (0.5) (115.9)
Disposals 0.0 27.0 2.8 0.3 30.1
Balance at 31 December 2016 (22.8) (2,613.7) (125.7) (11.3) (2,773.4)
Balance at 1 January 2017 (22.8) (2,613.7) (125.7) (11.3) (2,773.4)
Depreciation (1.9) (110.8) (8.6) (2.1) (123.5)
Disposals 0.1 35.6 1.7 0.2 37.6
Transfers from one heading to another 0.0 3.0 0.0 (3.0) 0.0
Balance at 31 December 2017 (24.7) (2,685.9) (132.6) (16.1) - (2,859.2)
CARRYING AMOUNT
Balance at 1 January 2016 172.8 2,130.6 33.6 3.9 346.2 2,687.2
Balance at 31 December 2016 177.0 2,290.5 36.5 3.5 448.9 2,956.5
Balance at 1 January 2017 177.0 2,290.5 36.5 3.5 448.9 2,956.5
Balance at 31 December 2017 181.2 2,579.3 36.7 3.2 401.9 3,202.4
A net amount of €377.3 million was invested in 2017 by Elia Transmission, mainly on upgrading high voltage substations and laying high voltage cables. The largest investment in 2017 was on the Stevin project: €67 million was invested in this project, mainly on substations and power lines. Investments in ALEGrO (€21.6 million), MOG (€21.7 million), Mercator Horta (€33.5 million) and Brabo (€37.6 million) were also made in 2017.
During 2017, €8.2 million (€8.5 million in 2016) of borrowing costs have been capitalised on 2017 acquisitions, based on an average interest rate of 3.21% (4.0% in 2016).
Outstanding capital expenditure commitments are described in Note 8.3.
31
7.2. Intangible assets and goodwill (in million EUR)
ACQUISITION VALUE
Balance at 1 January 2016
Goodwill Development costs of software
1,707.8 81.4 2.4 1,791.6
Acquired own construction capitalised 0.0 8.8 0.9 9.7
Balance at 31 December 2016 1,707.8 90.2 3.4 1,801.3
Balance at 1 January 2017 1,707.8 90.2 3.4 1,801.3
Acquired own construction capitalised 0.0 10.5 0.3 10.8 Disposals 0.0 0.0 (0.1) (0.1)
Balance at 31 December 2017 1,707.8 100.7 3.6 1,812.1
DEPRECIATION AND IMPAIRMENT
Balance at 1 January 2016 (0.0) (55.0) (1.9) (57.0) Amortisation 0.0 (8.2) (0.3) (8.5)
Balance at 31 December 2016 (0.0) (63.3) (2.2) (65.5)
Balance at 1 January 2017 (0.0) (63.3) (2.2) (65.5) Amortisation 0.0 (7.6) (0.4) (8.0)
Balance at 31 December 2017 (0.0) (70.9) (2.6) (73.5)
CARRYING AMOUNT
Balance at 1 January 2016 1,707.8 26.4 0.5 1,734.6
Balance at 31 December 2016 1,707.8 26.9 1.1 1,735.8
Balance at 1 January 2017 1,707 8 26 9 1 1 1,735 8
Balance at 31 December 2017 1,707 8 29 8 1 0 1,738 6
Software comprises both IT applications developed by the Company for operating the grid and software for the Group's normal business operations.
During 2017, €0.2 million in borrowing costs were capitalised on 2017 acquisitions (compared with €0.1 million in 2016 on that year's acquisitions), based on an average interest rate of 3.21% (4.0% in 2016).
The goodwill, which is allocated to the CGU Elia Transmission (Belgium), relates to the following business combinations: (in million EUR) 2017 2016
Acquisition Elia Asset 2002 1,700.1 1,700.1
Acquisition Elia Engineering 2004 7.7 7.7
Total 1,707.8 1,707.8
IMPAIRMENT TEST FOR CASH GENERATING UNIT ELIA TRANSMISSION (BELGIUM) CONTAINING GOODWILL
In 2002, the acquisition of Elia Asset by the Company for €3,304.1 million resulted in a positive consolidation difference of €1,700.1 million. This positive consolidation difference was the result of the difference between the acquisition value of this entity and the carrying amount of its assets. This difference consists of various aspects such as the fact that (i) Elia was appointed as a TSO for a period of 20 years, (ii) Elia had unique resources in Belgium as Elia is the owner of the whole of the very high voltage network and is the owner of 94% of the high voltage grid (or has the right to use this), and hence only Elia is entitled to put forward a development plan, and (iii) Elia had the relevant TSO know how.
At the date of acquisition, the description or the quantification in euros of these aspects could not be performed on an objective, transparent and reliable basis and therefore, the difference could not be allocated to specific assets and was considered unallocated. Therefore, this difference has been recognised as goodwill since the initial adoption of IFRS in 2005. The regulatory framework, in particular the offsetting in the tariffs of the decommissioning of fixed assets, applicable from 2008 onwards, did not have an impact on this accounting treatment. The goodwill described above and the goodwill resulting from the acquisition of Elia Engineering in 2004 were allocated to the single cash generating unit for the impairment test determined, since the income and expenses were generated by one activity, specifically 'regulated activity in Belgium', which will also be considered to be one cash generating unit.
As a result, the Company assigned the carrying amount of the goodwill to one unit, the regulated activity in Belgium. Since 2004, annual impairment tests have been conducted and have not resulted in recognition of any impairment losses. Cash generating units to which goodwill has been allocated are tested for impairment at least annually as the higher of their fair value less cost to sell or value in use, applying the assumptions below and using the following valuation methods.
Licences/ concessions Total32
The impairment test was conducted by an independent expert and is based on the following valuation methods and applying the following assumptions (according to the fair value less cost to sell methodology):
• discounting of future cash flows and using the Regulated Asset Base (RAB) as the basis for the estimation of the terminal value;
• discounting of future dividends;
• comparison between the previously mentioned impairment methods and those used by various comparable Western European listed companies, such as Red Eléctrica de España, Enagas, Terna, Snam Rete Gas, National Grid and Fluxys;
• the market valuation based on the Company's share price.
The future cash flows and future dividend methods are based on the business plan for the period 2018 2027.
The key assumptions used for this valuation are:
• a tax rate of 29 58% for the years 2018 2019, and a tax rate of 25% thereafter;
• an unlevered beta of 0.53;
• a market risk premium of 4.5%;
• a perpetual growth rate of 0.78%.
In addition, three different discounted cash flow (DCF) approaches were used:
1) DCF based on a fixed WACC:
• Risk free rate: 2.5%, based on the 10 year average of the Belgian 10 year government bonds;
• the levered beta calculated based on the target debt ratio of 67%;
• cost of equity: 8.3%;
• cost of debt pre tax: 3.0%;
• WACC: 4.2%.
2) DCF based on a variable WACC:
• variable cost of equity due to a variable levered beta (based on an unlevered beta of 0.53 and the forecast debt ratios) and a variable risk free rate (1.7% in 2018, 2.35% in 2019, 2.60% in 2020 and 2.50% for 2021 and the years thereafter);
• variable cost of debt based on the annual interest cost forecasts in the business plan (ranges between 2.4% and 3.4% in the period 2018 2027);
• the WACC varying from 4.0% to 4.4%.
3) Adjusted present value (APV) method:
• based on an unlevered cost of equity of 4.9%.
The independent analysis did not result in the identification of an impairment of goodwill in the financial year 2017.
With regard to the assessment of the recoverable amount, management believe, based on the analysis of the external expert and on current knowledge, that no reasonably possible change in any of the above key assumptions would cause material impairment losses.
7.3. Other financial assets
(in million EUR)
2017 2016
Immediately claimable deposits 7.1 7.1
Available for sale assets 0.2 0.2
Reimbursement rights 53.6 58.1
Total 60.9 65.4
Immediately claimable deposits are measured at fair value. The risk profile of these investments is discussed in Note 8.2.
The reimbursement rights are linked to the obligations for the retired employees falling under the interest scheme (Scheme B unfunded plan) on the one hand and medical plan liabilities and tariff benefits (for the entire retired population) on the other (also see Note 7.12: Employee benefits). The reimbursement rights are recoverable through the regulated tariffs. The following principle applies: all incurred pension costs for 'Scheme B' retired employees and the costs linked to healthcare and tariff benefits of retired Elia staff members are defined by the regulator (CREG) as non controllable expenses that are recoverable through the regulatory tariffs. The decrease in the carrying value of this asset is disclosed in Note 7.12: Employee benefits.
7.4. Non current trade and other receivables
(in million EUR)
Loans to joint ventures
2017 2016
147.8 63.0
Total 147.8 63.0
As mentioned in Note 5.1, the Group has a 50% stake in the shares of Nemo Link Ltd. This company is financed by both shareholders through equity and loans. As a result, at 31 December a non current receivable is outstanding on Nemo Link Ltd amounting to €147.8 million. Of this €147.8 million, €138.7 million is accounted for as an unsecured loan instrument with a fixed interest rate of 4% and a maturity of 25 years after the commercial operations date of the interconnector (see Note 6.4). The remaining sum of €9.1 million is a trade receivable on which both parties have agreed to extend the payment term to the time Nemo Link becomes operational (not before 2019). As a consequence, the trade receivable is classified as a non current receivable and bears a fixed interest rate.
33
Deferred tax assets and liabilities
RECOGNISED DEFERRED TAX ASSETS AND LIABILITIES (in million EUR)
Property, plant and equipment
2017 2016 Assets Liabilities Assets Liabilities
1.2 (31.4) 1.6 (32.9)
Intangible assets 0.0 (8.4) 0.1 (9.3)
Interest bearing loans and other non current financial liabilities
0.0 (1.2) 1.7 0.0
Employee benefits 7.6 0.0 5.6 0.0
Notional interest deduction carried forward previous accounting years 0.0 0.0 11.9 0.0
Deferred tax on investment grants
0.0 (1.2) 0.0 0.0
Other items 0.8 (7.3) 0.5 (6.9)
Tax asset/liability before offsetting 9.6 (49.5) 21.3 (49.2)
Offsetting of tax (8.6) 8.6 (20.4) 20.4
Net tax asset/(liability) 1.0 (40.9) 0.8 (28.7)
The changes in deferred tax assets and liabilities can be presented as follows:
CHANGES IN DEFERRED TAX ASSETS AND LIABILITIES RESULTING FROM MOVEMENTS IN TEMPORARY DIFFERENCES DURING THE FINANCIAL YEAR (in million EUR)
Opening balance Recognised in profit or loss
Recognised in OCI Other Closing balance
2016
Property, plant and equipment (24.4) (7.1) (31.4)
Intangible assets (8.9) (0.3) (9.2)
Inventories (1.0) 1.0 0.0
Interest bearing loans and other non current financial liabilities 4.5 0.2 (2.9) 1.7
Employee benefits 6.7 (0.8) (0.4) 5.6
Notional interest deduction carried forward previous accounting years 24.3 (12.4) 11.9
Other items (6.5) (0.0) (6.5)
Total (5.1) (19.4) (3.3) (27.9)
2017
Property, plant and equipment (31.4) 1.2 (30.2)
Intangible assets (9.2) 0.8 (8.4)
Interest bearing loans and other non current financial liabilities 1.7 0.3 (3.2) (1.2)
Employee benefits 5.6 (0.3) 2.3 7.5
Notional interest deduction carried forward previous accounting years 11.9 (11.9) 0.0
Deferred tax on investment grants (1.2) (1.2)
Other items (6.5) (0.1) (6.5)
Total (27.9) (9.9) (0.9) (1.2) (39.9)
As of 2012, a deferred tax asset has been recognised on the notional interest deduction reserve, as a result of the changes made to the mechanism of the recuperation and changes to the regulatory framework. The deferred tax asset on the notional interest deduction reserve further decreased by €11.9 million to nil as at 31 December 2017. This significant reduction can be explained by the continued decline in the notional interest deduction rate for the financial year 2017, which ultimately resulted in the all the remaining reserves carried forward being used
The deferred tax on investment grants relates to a deferred tax liability for grants received. The deferred tax liability was recognised against the payment received and, as such, did not have an impact on OCI or profit and loss.
On 25 December 2017, the Belgian government published a tax reform law. This law envisages, among other things, a decrease in the corporation tax rate from 33 99% to 29 58% in the financial years 2018 and 2019 and a further decrease to 25% in the financial year 2020. The effect of this law has been considered in the measurement of the deferred tax liabilities as at 31 December 2017, resulting in a positive €12 4m effect on the statement of profit and loss and an €2 4 million offsetting effect on other comprehensive income.
IMPACT OF THE TAX REFORM ON PROFIT AND LOSS AND OTHER COMPREHENSIVE INCOME (in million EUR) 2017
Recognised in profit or loss
Recognised in OCI
Temporary differences 176.5 (26.6)
Deferred tax, at taxes rates applicable for financial year 2017 58.8 (9.0)
Deferred tax, at new rates 46.4 (6.6)
Effect of tax reform (12.4) 2.4
34 7.5.
UNRECOGNISED DEFERRED TAX ASSETS OR LIABILITIES
As at 31 December 2017, there were no unrecognised deferred tax assets.
Within the Elia Group there is no formal policy regarding dividend distributions by subsidiaries. The Elia Group joint ventures will not distribute their profits until they obtain the consent of all venture partners, in other words the Group controls the timing of the reversal of the related taxable temporary differences, but management are confident that they will not be reversed in the foreseeable future. In this respect, the Group is no longer subject to an (unrecognised) deferred tax liability (this amounted to €3.3 million in 2016) considering that as part of the tax reform, dividends received from subsidiaries will become fully tax exempt for the parent company.
7.6. Inventories
(in million EUR)
2017 2016
Raw materials and consumables 27.6 37.0
Write downs (14.0) (14.3)
Total 13.6 22.6
The warehouse primarily stores replacement and spare parts for maintenance and repair work on the Group's high voltage substations, overhead lines and underground cables. It also included work in progress balances.
The decrease of inventories is mainly due to a decreased work in process balance for Elia Grid International compared with the financial year 2016, as a result of the completion of a substantial project throughout 2017.
Write downs are recorded following the non utilisation of stock items based on their underlying rotation. These were slightly lower than in 2016.
7.7. Current trade and other receivables, deferred charges and accrued revenues
(in million EUR)
2017 2016
Construction contracts in progress 3.9 4.2
Trade and other receivables and advance payments 227.2 221.7
Levies 20.6 139.9
VAT and other taxes 24.2 6.8
Other 5.2 7.0
Deferred charges and accrued revenues 9.5 6.1
Total 290.6 385.7
Trade receivables are non interest bearing and are generally have terms of 15 to 30 days.
Construction contracts in progress remained stable at €3.9 million as opposed to €4.2 million the previous year. Those construction contracts in progress mainly arise from EGI's business
The decrease in levies is mainly due to:
• a lower outstanding balance of green certificates with regard to the Walloon Region (decrease from a receivable of €91.7 million at the year end of 2016 to a payable of €49 1 million at the year end of 2017). The decrease is mainly due to the purchase of 2.8 million green certificates by the Walloon Region in September 2017, as approved by the Decree of 29 June 2017. This resulted in a cash inflow of €176.2 million (please also see Note 8.3 in this regard). This transaction had no impact on the Group's profit and loss statement;
• a decrease of €29.8 million relating to Flemish green certificates; this was a result of an upward adjustment in the tariffs to be charged in 2017 and increased sales volumes on auctions over the financial year 2017; and
• the fact that these were partially compensated by a higher outstanding amount of levies to cover the costs for the Strategic Reserve (increase from €2.3 million to €9.3 million in 2017)
The Group's exposure to credit and currency risks, and impairment losses related to trade and other receivables are shown in Note 8.2.
At 31 December, the ageing analysis of trade and other receivables and advance payments is as follows:
(in million EUR)
2017 2016
Not past due 218.7 200.4
Past due 0 30 days 0.8 10.0
Past due 31 60 days 2.9 3.8
Past due 61 days one year 2.8 5.7
More than one year 1.6 1.6
Total (excl. impairment) 226.8 221.5
Doubtful amounts 1.7 1.3
Amounts of write offs (1.3) (1.1)
Total 227.2 221.7
35
7.8. Current tax assets
(in million EUR)
2017 2016
Tax receivables 3.8 2.8
Total 3.8 2.8
The tax receivables have remained in line with the previous year. The €3.8 million in tax receivables at 31 December 2017 mainly relate to 2017 advances on corporation tax to be recovered in the financial year 2018.
7.9. Cash and cash equivalents
(in million EUR)
2017 2016
Call deposits 55.2 22.5
Balance at bank 140.0 154.1
Total 195.2 176.6
Cash and cash equivalents have increased in the course of the year. This increase was mainly driven by the higher profitability during the year, as well as by the €176.2 million cash inflow which resulted from the 2.8 million green certificates that were sold in September 2017 (Note 8.3). This effect has partially been offset by a continued high level of capital expenditure in the electricity grid.
Short term call deposits are invested for periods varying from a few days and a few weeks to several months (generally not exceeding three months), depending on immediate cash requirements, and earn interest in accordance with the interest rates for the short term deposits. The interest rate of interest bearing investments at the end of the reporting period varies from 0.00% to 0.10%.
Bank account balances earn or pay interest in line with the variable rates of interest on the basis of daily bank deposit interest rates The Group's interest rate risk and the sensitivity analysis for financial assets and liabilities are discussed in Note 8.2.
The cash and cash equivalents disclosed above and in the statement of cash flows include €29.0 million held by Elia RE. These deposits are subject to regulatory restrictions and are therefore not directly available for general use by the other entities within the Group.
7.10. Shareholders' equity
SHARE CAPITAL AND SHARE PREMIUM
Number of shares 2017 2016
Outstanding on 1 January 60,891,158 60,750,239
Issued against cash payment 9,861 140,919
Number of shares (end of period) 60,901,019 60,891,158
The extraordinary shareholders' meeting of 17 May 2016 decided to execute a capital increase in two steps/periods (one in 2016 for a maximum of €5.3 million and the other in 2017 for a maximum of €0.7 million) for a total maximum amount of €6.0 million for its Belgian employees.
In December 2016, the Elia Group gave its employees in Belgium the opportunity to subscribe to an Elia System Operator SA capital increase (tax and non tax tranches) which resulted in a €4.4 million increase (including the cost for the capital increase amounting to €0.9 million) in the share capital and simultaneously in a €1.8 million increase in share premium.
The second tranche of this capital increase (tax tranche) for the Group's Belgian employees was implemented in March 2017 and involved €0.4 million, consisting of a €0.3 million capital increase and a €0.1 million increase in share premium. As part of this second tranche, 9,861 new shares were issued.
RESERVES
In line with Belgian legislation, 5% of the Company's statutory net profit must be transferred to the legal reserve each year until the legal reserve represents 10% of the capital. As at 31 December 2017 the Group's legal reserve amounts to €173.0 million and represents 10% of the capital.
The Board of Directors can propose the payout of a dividend to shareholders up to a maximum of the available reserves and the profit carried forward from previous financial years of the Company, including the profit for the financial year ended 31 December 2017. Shareholders must approve the dividend payment at the Annual General Meeting of Shareholders.
HEDGING RESERVE
The hedging reserve comprises the effective portion of the cumulative net change in fair value of cash flow hedging instruments with regard to hedged transactions that have not yet occurred.
36
DIVIDEND
After the reporting date, the Board of Directors will put forward the dividend proposal indicated below
Dividend 2017 2016
Per ordinary share entitled to dividend 1.62 1.58
At the General Meeting of Shareholders on 16 May 2017, the Board of Directors proposed the payout of a gross dividend of €1.58 per share, which yields a net dividend of €1.1106 per share, yielding a total amount of €96.2 million.
The Board of Directors' meeting of 22 February 2018 proposed a gross dividend of €1.62 per share. This dividend is subject to approval by shareholders at the Annual General Meeting on 15 May 2018 and is not included as a liability in the consolidated financial statements of the Group.
The total dividend, calculated based on the number of shares outstanding on 22 February 2018, corresponds to a total of €98.7 million.
7.11. Interest bearing loans and borrowings
(in million EUR)
Non current borrowings
2017 2016
2,834.7 2,586.4
Subtotal non current borrowings 2,834.7 2,586.4
Current borrowings 0,0 100.0
Accrued interest 49.5 47.5
Subtotal current loans and borrowings 49.5 147.5
Total 2,884.2 2,733.9
See Note 7.18 for an explanation of the changes in interest loans and borrowings.
The net increase in interest bearing loans and borrowings is explained by the issuance of a new €250 million eurobond in March 2017, as well as the repayment of the European Investment Bank loan (€20.0 million) and the dematerialised treasury notes (€78.0 million), as those loans matured in financial year 2017.
Information concerning the terms and conditions of the outstanding interest bearing loans and borrowings is given below:
(in million EUR)
Maturity Amount Interest rate before hedging
Interest rate after hedging Current proportion fixed
Current proportion variable
Shareholders' loan 2022 495.8 0.89% 0.89% 0.00% 100.00%
Eurobond issues 2004/15 years 2019 499.8 5.25% 5.25% 100.00% 0.00%
Eurobond issues 2013/15 years 2028 547.4 3.25% 3.25% 100.00% 0.00%
Eurobond issues 2013/20 years 2033 199.4 3.50% 3.50% 100.00% 0.00%
Eurobond issues 2014/15 years 2029 346.5 3.00% 3.00% 100.00% 0.00%
Eurobond issues 2015/8.5 years 2024 498.4 1.38% 1.38% 100.00% 0.00%
Eurobond issues 2017/10 years 2027 247.4 1.38% 1.38% 100.00% 0.00%
Total 2,834.7 82.51% 17.49%
Information concerning the contractual maturities of the Group's interest bearing loans and borrowings (current and non current) is given below
(in million EUR)
Face value Less than 1 year 1 2 years 3 5 years More than 5 years
Shareholders' loan 495.8 495.8
Eurobond issues 2,350.0 500.0 1,850.0
Total 2,845.8 995.8 1,850.0
The following covenants are required for the eurobonds issued under the €3 billion EMTN programme and the back up facilities:
(i) The company will not grant any security interest (i.e. any mortgage, charge, pledge, lien or other form of encumbrance or security interest; a personal guarantee or suretyship does not constitute a 'security interest') to secure any relevant debt of any person or to secure any guarantee of or indemnity in respect of any relevant debt of any person.
(ii) The Company shall ensure that none of its material subsidiaries grant any security interest to secure any relevant debt of any person or to secure any guarantee of or indemnity in respect of any relevant debt of any person.
(iii) The Company will and shall ensure that its material subsidiaries will ensure that no other person grants any security interest to secure any of the company's, or any of its material subsidiaries', relevant debt or to secure any guarantee of or indemnity in respect of any of the Issuer's, or any of its material subsidiaries', relevant debt.
37 (iv) The Company will retain at least a 75% participation in Elia Asset SA/NV.
(v) The Company will keep its licence as a transmission system operator.
Employee benefits
DEFINED CONTRIBUTION PLANS
Employees remunerated based on a ‘salary scale’ who were recruited after 1 June 2002 and management staff recruited after 1 May 1999 are covered by two defined contribution pension plans (Powerbel and Enerbel).
Below we briefly describe these two defined contribution plans:
• Enerbel
This scheme is aimed at salaried employees hired after 1 June 2002.
The employee's contribution is based on a step rate formula, being equivalent to 0.875% of the portion of the salary below a given ceiling plus 2.625% of the portion of the salary above this ceiling. This contribution is deducted each month from the employee's salary.
The employer's contribution is equivalent to 3 times the employee’s contribution.
• Powerbel
This scheme is aimed at managers hired on or after 1 May 1999, and those who asked to be transferred onto it when given the opportunity in 2007 and 2015.
The employee’s contribution is based on a step rate formula, being equivalent to 0.6% of the portion of the salary below a given ceiling plus 4.6% of the portion of the salary above this ceiling. This contribution is deducted monthly from the subscribers’ salary.
The employer’s contribution is equivalent to 4 times the employee's contribution.
The new law on occupational pension plans, published at the end of 2015, made various changes to the guaranteed return on defined contribution plans. For payments made after 1 January 2016, this law requires employers to guarantee an average annual return of at least 1.75% over the course of a career, up to a cap of 3.75%.
For insured plans the minimum guaranteed return until 31 December 2015 still needs to be equivalent to at least 3.25% for the employer’s contribution and 3.75% for the employee's contribution, with any shortfall being covered by the employer.
As a result of the above change and as mentioned in the accounting policies, all defined contribution pension plans under the Belgian pension legislation are classified as defined benefit plans for accounting purposes due to the legal minimum return to be guaranteed by the employer, which represents a plan amendment.
As the Belgian contribution based promises are not back loaded, the DBO was determined based on the Projected Unit Credit (PUC) method without any projection of future contributions. Until the end of 2015, the intrinsic value method was used. For any plan the fair value of assets equals the sum of the accrued individual reserves (if any) and the value of the collective fund(s) (if any).
The guaranteed return for 2016 amounts to 1.75% and is applied in accordance with the vertical method to all paid contributions to the pension funds and to the insurers (branch 21 products).
In 2016, it was decided to offer DC plan subscribers the option to transfer the acquired reserves guaranteed by the insurers to the pension funds in the form of a ‘cash balance best off' plan with a minimum guaranteed return of 3.25%. The reserves of all salary scale employees have been transferred to the pension funds, following a collective labour agreement, and the vast majority of the management staff have individually opted to transfer their reserves as well. For further details, please see the section ‘Defined benefit plans' below.
In 2017, further transfers from the existing bonus pension plan and seniority premium plan were offered. All the members of staff eligible for such a transfer have opted to transfer their reserves into a ‘cash balance best off' plan.
Both employees' and employers' contributions are paid on a monthly basis for the base plans. The employee's contribution is deducted from the salary and paid to the insurer by the employer. The amount of future cash flows depends on wage growth.
DEFINED BENEFIT PLANS
In Belgium, collective agreements regulate the rights of company employees in the electricity and gas industries. These agreements provide ‘pension supplements' based on the annual salary and an employee's career within a company. If the employee passes away, the supplements are partially revertible to the inheritor (wife/orphan). The benefits granted are linked to Elia's operating result. There is no external pension fund or group insurance for these liabilities, which means that no reserves are constituted with third parties. The obligations are qualified as a defined benefit.
The collective agreement determines that active staff hired from 1 January 1993 until 31 December 2001 and all managerial/executive staff hired prior to 1 May 1999 will be granted the same guarantees via a defined benefit pension scheme (Elgabel and Pensiobel closed plans). Obligations under these defined benefit pension plans are funded by a number of pension funds for the electricity and gas industries and by insurance companies.
As mentioned above, the Group has transferred certain acquired reserves guaranteed by the insurers to 'Cash balance best off' plans since 2016. The main objective of these plans is to guarantee for every subscriber a minimum guaranteed return of 3.25% on the acquired reserves until pension age. As this guarantee is an obligation by the employer, these plans represent defined benefit plans.
Elia Transmission Belgium also has early retirement schemes and other post employment benefits such as reimbursement of medical expenses and price subsidies, as well as other long term benefits (seniority payments). Not all of these benefits are funded and, in accordance with IAS 19, these post employment benefits are classified as defined benefit plans.
The total net liability for employee benefit obligations is as follows: (in million EUR)
Defined benefit plans
2017 2016
21.2 12.1
Post employment benefits other than pensions 63.1 63.0
Total provisions for employee benefits 84.3 75.1
In the following tables, details are given of the outstanding provision for employee benefits, with the split between pension cost (‘Pensions') and non pension costs ('Other'), which encompasses healthcare costs, tariff benefits and jubilee benefits.
38 7.12.
(in million EUR)
Pensions Other
2017 2016 2017 2016
Present value of funded defined benefit obligation (224.3) (192.1) (63.7) (63.6)
Fair value of plan assets 203.1 179.9 0.6 0.6
Net employee benefit liability (21.2) (12.1) (63.1) (63.0)
Movement in the present value of the defined benefit obligation
Pensions Other (in million EUR)
2017 2016 2017 2016
At the beginning of the period (192.1) (160.6) (63.6) (59.7)
Current service cost (6.9) (10.2) (1.7) (1 7)
Interest cost/income (3.2) (3.3) (1.0) (1 3)
Contributions from plan participants (1.2) 0.7 0.0 0.0
Cost of early retirement 0.1 (0.3) 0.0 0.0
Including remeasurement gains/(losses) in OCI and in Statement of profit or loss, arising from
• Changes in demographic assumptions 1.7 0.0 0.7 0 0
• Changes in financial assumptions (0.7) (14.6) (0.6) (3 3)
• Changes from experience adjustments (16.5) 8.1 (0.2) (0 3)
Taxes on contributions paid during the year 1.2 0.0 0.0 0.0
Past service cost 0.0 (2.6) 0.0 0 0
Payments from the plan 11.8 16.4 2.7 2 8
Settlements 0.0 0.0 0.0 (0.1)
Transfers (18.5) (25.8) 0.0 0.0
At the end of the period (224.3) (192.1) (63.7) (63.6)
Movements in the fair value of the plan assets
Pensions Other (in million EUR)
2017 2016 2017 2016
At the beginning of the period 179.9 139.7 0.6 0.7
Interest income 2.8 2.9 0.0 0.0
Remeasurement gains/losses in OCI arising from:
Return of plan assets (excluding interest income on plan assets) 2.4 8.7 (0.0) (0.0)
Contributions from employer 9.9 17.5 1.1 2.8
Contributions from plan participants 1.2 1.8 0.0 0.0
Benefit payments (11.8) (16.4) (1.1) (2.8)
Transfers 18.5 25.8 0.0 0.0
At the end of the period 203.1 179.9 0.6 0.6
Actual return on plan assets 23.7 11.6 (0.0) (0.0)
Amounts recognized in comprehensive income
Pensions Other (in million EUR)
2017 2016 2017 2016
Service cost
Current service cost (6.9) (9.5) (1.7) (1.7)
Cost of early retirement 0.1 (0.3) 0.0 0.0
Past service cost 0.0 (2.6) 0.0 0.0
Settlements 0.0 0.0 0.0 (0.1)
Actuarial gains/(losses) on defined benefit obligation 0.0 0.0 0.5 0.0
Net interest on the net defined benefit liability/(asset)
Interest cost on defined benefit obligation (3.2) (3.3) (1.0) (1.3)
Interest income on plan assets 2.8 2.9 0.0 0.0
Other 0.0 0.0 0.0 0.0
Defined benefit costs recognised in profit or loss (7.2) (12.7) (2.2) (3.0)
Actuarial gains(/losses) on defined obligations arising from:
1) Changes in demographic assumptions 1.7 0.0 0.2 0.0
2) Changes in financial assumptions (0.7) (14.6) 0.2 (3.3)
3) Changes from experience adjustments (16.5) 8.1 (1.0) (0.3)
Return on plan assets (excluding interest income on plan assets) 2.4 8.7 0.0 0.0
Remeasurements of net defined benefit(/liability)/asset recognised in other comprehensive income (OCI) (13.1) 2.2 (0.6) (3.6)
Total (20.3) (10.5) (2.8) (6.7)
39
(in million EUR)
2017 2016
Breakdown of defined benefit obligation by type of plan participants (288.0) (255.7)
Active plan participants (215.5) (177.7)
Terminated plan participants with def. benefit entitlements (10.9) (5.6)
Retired plan participants and beneficiaries (61.6) (72.4)
Breakdown of defined benefit obligation by type of benefits (288.0) (255.7)
Retirement and death benefits (224.3) (192.1)
Other post employment benefits (medical and tariff reductions) (45.0) (44.1)
Seniority payments (18.7) (19.5)
When determining the appropriate discount rate, the Group considers the interest rates of corporate bonds in currencies consistent with the currencies of the post employment benefit obligation with at least an 'AA' rating or above, as set by an internationally acknowledged rating agency, and extrapolated as needed along the yield curve to correspond with the expected term of the defined benefit obligation.
A stress test is performed annually. This test verifies that the minimum funding requirements are covered to deal with 'shocks' with probabilities of occurrence of 0.5%.
The members (mostly) contribute to the financing of the retirement benefits by paying a personal contribution falling into the 'defined contribution' category (step rate formula a%t1 + b%t2) deducted each month from their salaries.
The annual balance of the defined benefit lump sum is financed by the employer through a recurrent allowance expressed as a percentage of the total payroll of the participants. This percentage is defined by the aggregate cost method and is reviewed annually. This method of financing involves smoothing future costs over the remaining period of the plan. The costs are estimated on a projected basis (taking into account salary growth and inflation). The assumptions related to salary increase, inflation, employee turnover and age term are defined on the basis of historical data from the Company. The mortality tables used are the ones corresponding to the observed experience within the financing vehicle and take into consideration expected changes in mortality. The Group calculates the net interest on the net defined benefit liability (asset) using the same high quality bond discount rate (see above) used to measure the defined benefit obligation (net interest approach). These assumptions are challenged on a regular basis. Exceptional events (such as modification of the plan, change of assumptions and overly short coverage terms) can eventually lead to outstanding payments from the sponsor.
The defined benefit plans expose the Company to actuarial risks such as investment risk, interest rate risk, longevity risk and salary risk.
Investment risk
The present value of the defined benefit plan liability is calculated using a discount rate determined based on high quality corporate bonds. The difference between the actual return on assets and the interest income on plan assets is included in the remeasurements component (OCI). Currently the plan has a relatively balanced range of investments, as shown below:
Fair value of the plan assets per major category 2017 2016
Investments quoted in an active market 80.74% 88.10%
Shares eurozone 15.35% 20.49%
Shares outside eurozone 20.90% 25.23%
Government bonds eurozone 5.10% 1.48%
Other bonds eurozone 31.25% 21.83%
Other bonds outside eurozone 8.14% 19.07%
Unquoted investments 19.26% 11.90%
Qualifying insurance contracts 0.00% 0.62%
Property 3.77% 4.70%
Cash and cash equivalents 1.04% 0.12%
Other 14.44% 6.45%
Total (in %) 100.00% 100.00%
Due to the long term nature of the plan liabilities, the board of the pension fund, of which Elia Transmission (Belgium) is a member, considers it appropriate that a reasonable portion of the plan assets be invested in equity securities to leverage the return generated by the fund.
Interest risk
A decrease in the bond interest rate will increase the plan liability. However, this will be partially offset by an increase in the return on the plan’s debt investments, of which approximately 95% is now invested in pension funds with an expected return of 3.6%.
Longevity risk
The present value of the defined benefit plan liability is calculated based on the best estimate of the mortality of plan participants both during and after their employment. An increase in the life expectancy of the plan participants will increase the plan's liability. The prospective mortality tables from the IA/BE have been used.
Salary risk
The present value of the defined benefit plan liability is calculated based on the future salaries of plan participants. As such, an increase in the salary of the plan participants will increase the plan’s liability.
40
ACTUARIAL ASSUMPTIONS
(in % and years)
Discount rate
Pensions defined benefit plans and cash balance best off plans
2017 2016
1.31% between 1.36% and 1.50%
Pensions defined contribution plans between 1.77% and 1.87% between 1.82% and 2.05%
Other 1.72% 1.69%
Expected average salary increase (excluding inflation) 1.00% 2.00%
Expected inflation 1.75% 1.75%
Expected increase in health benefits (including inflation) 2.75% 2.75%
Expected increase in tariff advantages 1.75% 1.75%
Average assumed retirement age
Employee 63 63 Manager 65 65
Mortality table used
Active personnel IABE IABE
Inactive personnel IABE IABE
Life expectancy in years of a pensioner retiring at age 65:
For a person aged 65 at closing date: Male 19.9 19.9 Female 24.0 24.0
For a person aged 65 in 20 years: Male 22.3 22.3 Female 26.0 26.0
(in years)
2017 2016
Weighted average duration of the defined benefit obligation 9.58 9.15
Weighted average duration of the defined contribution plans 18.43 18.96
Weighted average duration of the post employment benefits other than pensions 14.03 13.45
The actual return on plan assets in % for 2017 was in the range of 3.31% to 5.86% (compared with a range of 3.0% to 5.6% in 2016).
The Group expects to contribute €4.5 million to its Belgian defined benefit pension plans and €0.3 million to its Belgian defined contribution pension plans in 2018.
Below we also provide an overview of the expected cash outflows for the DB plans over the next five years:
Future expected cash outflows 2018 2019 2020 2021 2022 Pensions (4.8) (7.0) (11.7) (16.4) (15.8)
Other (3.3) (3.4) (3.4) (3.2) (3.1)
Total (in million EUR) (8.1) (10.4) (15.1) (19.5) (18.9)
There is a certain degree of uncertainty linked to the above expected cash outflows which can be explained by the following factors:
• Differences between assumptions and actual data can occur, e.g. retirement age and future salary increase
• The above expected cash outflows are based on a closed population and therefore do not incorporate future new hires
• The future premiums are calculated based on the last known aggregate cost rate, which is reviewed on an annual basis and varies depending on the return on plan assets, the actual salary increase as opposed to the assumptions, and unexpected changes in the population.
41
SENSITIVITY ANALYSIS (in million EUR)
Impact on the net defined benefit obligation of an increase in:
Increase (+)/decrease ( )
Discount rate (0.5% movement) 13.9
Average salary increase excl. inflation (0.5% movement) (11.3)
Inflation (0.25% movement) (5.8)
Increase in healthcare benefits (1.0% movement) (5.2)
Increase in tariff advantages (0.5% movement) (0.8)
Life expectancy of pensions (1 year) (2.2)
REMEASUREMENTS OF POST-EMPLOYMENT BENEFIT OBLIGATIONS (in million EUR)
2017 2016
Cumulative amount at 1 January (11.8) (11.9)
Recognised in the period (10.3) 0.2
Cumulative amount at 31 December (22.1) (11.8)
Remeasurements of post employment benefits include the portion of 50Hertz Transmission (Germany) (joint venture) amounting to €2.1 million (€3.2 million in 2016).
The below table represents the actuarial gains and losses recognised in other comprehensive income by nature :
Remeasurements of defined-benefit obligation arising from Pensions Other (in million EUR): 2017 2016 2017 2016
1) Changes in demographic assumptions 1.7 0.0 0.2 0.0
2) Changes in financial assumptions (0.7) (14.6) 0.2 (3.3)
3) Changes from experience adjustments (16.5) 8.1 (1.0) (0.3)
Return on plan assets (excluding interest income on plan assets) 2.4 8.7 0.0 0.0
Remeasurements of net defined benefit (liability)/asset recognised in other comprehensive income (OCI) (13.1) 2.2 (0.6) (3.6)
REIMBURSEMENT RIGHTS
As described in Note 7.4, a non current asset (within other financial assets) is recognised as reimbursement rights linked to the defined benefit obligation for the population benefitting from the interest scheme and medical plan liabilities and tariff benefits for the retired Elia population. Each change in these liabilities equally affects the corresponding reimbursement rights under non current other financial assets.
The decrease in reimbursement rights linked to pensions is a result of the change in financial assumptions on the one hand (discount rate) and changes from experience adjustments on the other hand.
Movement in the present value of the reimbursement rights
Pensions
Other (in million EUR) 2017 2016 2017 2016
At the beginning of the period (31.8) (36.4) (26.3) (23.5)
Current service cost 0.0
Interest cost/income (0.4) (0.6) (0.5) (0.5)
Actuarial gains(/losses) on defined obligation arising from:
1) Changes in demographic assumptions
0.0 0.0 0.0 0.0
2) Changes in financial assumptions (0.1) (1.6) 0.1 (1.7)
3) Changes from experience adjustments 0.2 3.0 (0.5) (2.4)
Taxes on contributions paid during the year 0 5 0.0 0.0 0.0
Payments from the plan 3 7 3.8 1 6 1.7
At the end of the period (28.0) (31.8) (25.6) (26.3)
42
Provisions
(in million EUR)
Environment Elia Re Other Total
Balance at 1 January 2016 13.8 4.7 2.0 20.5
Increase in provisions 3.3 3.0 0.8 7.1
Reversals of provisions (0.4) (0.3) (0.0) (0.7)
Utilisation of provisions (0.5) (0.3) (0.2) (1.1)
Balance at 31 December 2016 16.2 7.1 2.4 25.7
Long term portion 13.8 7.1 2.5 23.3
Short term portion 2.4 0.0 0.0 2.4
Balance at 1 January 2017 16.2 7.1 2.5 25.8
Increase in provisions 3.0 1.6 0.3 4.3
Reversals of provisions (4.0) 0.0 (0.1) (4.1)
Utilisation of provisions (0.6) (0.6) (0.1) (0.7)
Balance at 31 December 2017 14.6 8.1 2.6 25.3
Long term portion 10.1 8.1 2.6 20.8
Short term portion 4.5 0.0 0.0 4.5
Elia has conducted soil surveys on over 200 sites in Flanders in accordance with contractual agreements and Flemish legislation. Significant soil contamination was found on some sites, with this being mainly attributable to historical pollution arising from earlier or nearby industrial activities (gas plants, incinerators, chemicals, etc.).
Elia carried out analyses and studies in a number of substations and on a number of plots on which pylons for overhead power lines were built in the Brussels Capital Region and the Walloon Region, with a view to detecting any possible contamination. On the basis of the analyses and studies, Elia has made provisions for possible future soil remediation costs in line with the respective legislation.
Environmental provisions are recognised and measured based on the appraisal of an external expert bearing in mind BATNEEC (Best Available Techniques Not Entailing Excessive Costs) as well as on the circumstances known at the end of the reporting period. The timing of the settlement is unclear but for the premises where utilisations occur, the underlying provision is classified as a short term provision.
The utilisation of provisions for the environment is predominantly related to ongoing soil research and remediation on certain sites in Wallonia and Flanders worth €0.6 million in total. On the one hand, a reversal of €4.0 million was recorded for certain sites in Wallonia and Brussels; and on the other hand, an increase of €3.0 million, mainly for sites in Wallonia and Flanders, following on from new estimates and regulatory changes in the Walloon Region.
An amount of €8.1 million is included at the year end for Elia Re, a captive reinsurance company, of which €3.8 million is linked to claims for overhead facilities, €2.9 million to electrical facilities and €1.4 million to liability cases (as opposed to €2.8 million for overhead facilities, €3.0 million for electrical facilities and €1.3 million for liability cases in 2016).
The section ‘Other' consists of provisions for litigation to cover likely payment as a result of cases in which legal proceedings have been instituted against the Group by a third party or in which the Group is involved.
These estimates are based on the value of claims filed or on the estimated level of risk exposure. The expected timing of the related cash outflow depends on the progress and duration of the associated procedures.
The changes in provisions are presented in Note 6.3.
7.14. Other non current liabilities
(in million EUR)
2017 2016
Investment grants 3.8 5.1
Total 3.8 5.1
The investment grants consist of deferred income for capital subsidies received from the European Union and the Brussels Capital Region. No additional grants were recognised under other non current liabilities in 2017.
43 7.13.
7.15. Trade and other payables
(in million EUR)
2017 2016
Trade debts 220.8 288.0
VAT and other taxes 8.9 8.4
Remuneration and social security 28.1 26.5
Dividends 1.2 1.2
Levies 108.0 54.0
Other 11.1 12.5
Accrued liabilities 0.4 0.3
Total 378.5 390.8
Trade debts as at the year end of 2016 were exceptionally high. The level of trade debts outstanding as at the year end of 2017 has returned to normal
Levies mainly consist of federal levies (€43.4 million, compared with €40.0 million at the end of 2016) and levies for the Walloon government (€49.1 million payable, compared with a €91.7 million receivable at the end of 2016). The payable to the Walloon government is mainly due to the sale of 2.8 million green certificates in September 2017, as approved by the Decree of 29 June 2017. This resulted in a cash inflow of €176.2 million. Also see Note 7.7.
'Other' mainly consists of cash guarantees received from customers and advance payments for projects.
7.16. Accruals and deferred income
(in million EUR)
2017 2016
Accruals and deferred income 8.5 26.2
Settlement mechanism 526.1 433.6
Total 534.6 459.8
The settlement mechanism is described in Note 9.1. The change in the settlement mechanism in Belgium is described in Note 4.2
The settlement mechanism at 31 December 2017 is set out in the table below:
(in million EUR) Belgium
To be refunded to the tariffs in the current regulatory period 157.5
To be refunded to the tariffs in the next regulatory period 368.6
Settlement mechanism 526.1
The Group operates in a regulated climate in which tariffs are meant to make it possible to realise total revenue consisting of:
1. a reasonable return on invested capital;
2. all reasonable costs which are incurred by the Group.
Since the tariffs are based on estimates, there is always a difference between the tariffs that are actually charged and the tariffs that should have been charged to cover all reasonable costs of the system operator and to provide shareholders with a reasonable profit margin on their investment.
If the applied tariffs result in a surplus or a deficit at the end of the year, this means that the tariffs charged to consumers/the general public could have been respectively lower or higher (and vice versa). A surplus or deficit arising from the settlement mechanism is therefore not reported in profit or loss, or as an item under equity.
On a cumulative basis, it could be argued that the public has made an advance payment (= surplus) for its future use of the grid. As such, the surplus (deficit) is not a commission for a future loss (recovery) of income but instead a deferred/accrued revenue for (with regard to) consumers. On the basis of the regulatory framework, the Group believes that the surplus (deficit) does not represent an item of revenue (cost). Consequently, these amounts are netted and reported under 'Accruals and deferred income'. These surpluses or deficits are verified and approved by the regulator in the next accounting year.
See Note 9.1 for more details
44
7.17.
Financial instruments fair values
The following table shows the carrying amounts and fair values of financial assets and liabilities, including their levels in the fair value hierarchy.
Fair value (in million EUR)
31 December 2016
Other financial assets
Carrying amount
Designated at fair value Fair valuehedging instruments Loans and receivables
7.3
Other financial liabilities
Total Level 1 Level 2 Level 3 Total
7.3 7.1 0.2 7.3
Trade and other receivables 442.6 442.6 0.0
Cash and cash equivalents 176.6 176.6 0.0
Interest rate swaps used for hedging (9.4) (9.4) (9.4) (9.4)
Unsecured financial bank loans and other loans (643.3) (643.3) (643.3) (643.3)
Unsecured bond issues (2,090.6) (2,090.6) (2,449.8) (2,449.8)
Trade and other payables (390.8) (390.8) 0.0
Total 7.3 (9.4) 619.2 (3,124.6) (2,507.6) 7.1 (3,102.5) 0.2 (3,095.2)
31 December 2017
Other financial assets
7.3
7.3 7.1 0.2 7.3 Trade and other receivables 428.9 0.0 428.9 0.0
Cash and cash equivalents 195.2 0.0 195.2 0.0
Foreign currency rate swaps used for hedging 0.0 0.0 0.0 0.0
Unsecured financial bank loans and other loans (545.3) (545.3) (545.3) (545.3)
Unsecured bond issues (2,338.9) (2,338.9) (2,621.2) (2,621.2)
Trade and other payables (378.5) (378.5) 0.0
Total 7.3 0.0 624.1 (3,262.7) (2,631.3) 7.1 (3,166.5) 0.2 (3,159.3)
The above tables do not include fair value information for financial assets and liabilities not measured at fair value, such as cash and cash equivalents, a considerable proportion of trade and other receivables, and trade and other payables as their carrying amount is a reasonable approximation of fair value.
Fair value is the amount for which an asset could be exchanged or a liability settled in an arm's length transaction. IFRS 7 requires, for financial instruments that are measured in the balance sheet at fair value, the disclosure of fair value measurements by level in the following fair value measurement hierarchy:
• Level 1: The fair value of a financial instrument that is traded in an active market is measured based on quoted (unadjusted) prices for identical assets or liabilities. A market is considered active if quoted prices are readily and regularly available from an exchange, dealer, broker, industry group, pricing service or regulatory agency, and those prices represent actual and regularly occurring market transactions on an arm’s length basis
• Level 2: The fair value of financial instruments that are not traded in an active market is determined using valuation techniques. These maximise the use of observable market data where it is available and rely as little as possible on entity specific estimates. If all significant inputs required to assess the fair value of an instrument are observable, either directly (i.e. as prices) or indirectly (i.e. derived from prices), the instrument is included in level 2
• Level 3: If one or more of the significant inputs used in applying the valuation technique is not based on observable market data, the financial instrument is included in level 3.
FAIR VALUE
As the loan has a variable interest rate, the carrying amount of the loan is equal to the fair value.
The fair value of the financial assets and liabilities, other than those presented in the above table, approximates to their carrying amounts largely due to the short term maturities of these instruments.
45
FAIR-VALUE HIERARCHY
The fair value of 'sicavs' falls into level 1, i.e. valuation is based on the (unadjusted) listed market price on an active market for identical instruments.
The fair value of interest rate swaps, loans and bond issues falls into level 2, which entails valuation being based on input from other prices than the stated prices, where these other prices can be observed for assets or liabilities. This category includes instruments valued on the basis of listed market prices on active markets for such instruments; listed prices for identical or similar instruments on markets that are deemed less than active; or other valuation techniques arising directly or indirectly from observable market data.
ESTIMATE OF FAIR VALUE Derivatives
Brokers' statements are used for valuations of the interest rate and foreign currency rate swaps. The statements are controlled using valuation models or techniques based on discounted cash flows. The models incorporate various inputs including the credit quality of counterparties and interest rate curves at the end of the reporting period.
As the interest rate swaps matured on 31 December 2017, €32k relates to two minor foreign currency rate swaps.
As at 31 December 2017, the counterparty risk is considered close to zero, as is the Group's own non performance risk.
Interest bearing loans
The fair value is calculated on the basis of the discounted future redemptions and interest payments.
7.18. Changes in interest bearing loans and borrowings
The tables below disclose the changes in the Group's liabilities arising from financing activities, including both changes arising from cash flows and non cash changes.
(in million EUR)
Current interest bearing loans and borrowings
Non current interest bearing loans and borrowings
Total
Balance 1 January 2016 604.4 2,605.4 3,209.8
Cash flow: interest paid (115.6) 0.0 (115.6)
Cash flow: repayment of borrowings (540.0) 0.0 (540.0)
Cash flow: proceeds from withdrawal borrowings 80.0 0.0 80.0
Interest accruals 98.6 0.0 98.6
Other 20.1 (19.0) 1.1
Balance 31 December 2016 147.5 2,586.4 2,733.9
Balance 1 January 2017 147.5 2,586.4 2,733.9
Cash flow: interest paid (88.4) 0.0 (88.4)
Cash flow: repayment of borrowings (100.0) 0.0 (100.0)
Cash flow: proceeds from withdrawal borrowings 0.0 247.4 247.4
Interest accruals 90.4 0.0 90.4
Other 0.0 0.9 0.9
Balance 31 December 2017 49.5 2,834.7 2,884.2
The net increase in interest bearing loans and borrowings is predominantly explained by the issuance of a new €250 million eurobond in March 2017, as well as the repayment of the loan to the European Investment Bank (€20.0 million) and the dematerialised treasury notes (€78.0 million) as those loans matured in the financial year 2017.
'Other' in the financial year 2016 mainly relates to reclassifications of long term debt to short term debt in accordance with when instruments become due.
46
8. Miscellaneous
8.1. Effect of new acquisitions/sales of shares
CHANGES IN THE ELIA TRANSMISSION (BELGIUM) SEGMENT
Funding of JV Nemo Link
On 27 February 2015, Elia System Operator and National Grid signed a joint venture agreement to build the Nemo Link Interconnector; each shareholder holds a 50% stake in Nemo Link Ltd, a UK company.
Both shareholders have provided funding to Nemo Link Ltd since 2016 via equity contributions and loans (with an annual interest rate of 4% and a maturity of 25 years from the start date of the commercial operations of the Interconnector), divided on a 50/50 basis
In 2017, Elia provided €141.9 million, bringing the Company's total funding to €231.2 million, of which 40% came via equity contributions and 60% via loans. This joint venture is included in the Belgian segment using the equity method.
Acquisition of stake in Enervalis NV
Elia acquired a 12.5% stake in Enervalis in the financial year 2017. Enervalis develops innovative software as a service solutions that will support market players in optimising their energy bill while helping to meet growing flexibility needs with a view to managing the balance between supply and demand on the system. The software solutions enable Enervalis's customers (e.g. energy suppliers and equipment manufacturers) to automatically optimise the supply, storage and demand flexibility of devices such as heat pumps, electric vehicles and solar PV systems to better match prosumer energy needs.
8.2. Financial risk and derivative management
PRINCIPLES OF FINANCIAL RISK MANAGEMENT
The Group aims to identify each risk and set out strategies to control the economic impact on the Group's results. The Risk Management Department defines the risk management strategy, monitors the risk analysis and reports to management and the Audit Committee. The financial risk policy is implemented by determining appropriate policies and setting up effective control and reporting procedures. Selected derivative hedging instruments are used depending on the assessment of the risk involved. Derivatives are used exclusively as hedging instruments. The regulatory framework in which the Group operates significantly restricts their effects on profit or loss (see the section 'Regulatory framework and tariffs'). The major impact of increased interest rates, credit risk, etc. can be settled in the tariffs, in accordance with the applicable legislation.
CREDIT RISK
Credit risk encompasses all forms of counterparty exposure, i.e. where counterparties may default on their obligations to the Company in relation to lending, hedging, settlement and other financial activities. The Company is exposed to credit risk from its operating activities and treasury activities. As regards its operating activities, the Group has a credit policy in place, which takes into account the risk profiles of customers. The exposure to credit risk is monitored on an ongoing basis, resulting in a request to issue bank guaranties from the counterparty for some major contracts.
At the end of the reporting period there were no significant concentrations of credit risks. The maximum credit risk is the carrying amount for each financial asset, including derivative financial instruments.
(in million EUR) 2017 2016
Loans and receivables long term 147.8 63.0
Loans and receivables short term 281.1 379.6
Cash and cash equivalents 195.2 176.6
Immediately claimable deposits 7.1 7.1
Interest rate swaps used for hedging (matured as at 31 December 2017):
Liabilities (9.4)
Total 631.2 616.9
The movement in the allowance for impairment in respect of loans and receivables during the year was as follows:
(in million EUR) Bad debtors Impairment losses Remaining balance
Opening balance 1.6 (1.3) 0.3
Changes during the year (0.3) 0.2 (0.1)
Balance at 31 December 2016 1.3 (1.1) 0.2
Opening balance 1.3 (1.1) 0.2
Changes during the year 0.4 (0.2) 0.2
Balance at 31 December 2017 1.7 (1.3) 0.4
The Group believes that the unimpaired amounts overdue by more than 30 days are still collectible, based on historical payment behaviour and extensive analysis of customer credit risk, including underlying customers' credit ratings, when available. The credit quality of trade and other receivables is assessed based on a credit policy.
47
CURRENCY RISK
The Group is not exposed to any significant currency risk, either from transactions or from exchanging foreign currencies into euro, since it has no foreign investments or activities and less than 1% of its costs are expressed in currencies other than the euro.
LIQUIDITY RISK
Liquidity risk is the risk that the Group may be unable to meet its financial obligations. The Group limits this risk by constantly monitoring cash flows and ensuring that there are always sufficient credit line facilities available.
The Group's objective is to maintain a balance between continuity of funding and flexibility through the use of bank loans, confirmed and unconfirmed credit facilities, commercial paper programme, etc. For medium to long term funding, the Group uses bonds. The maturity profile of the debt portfolio is spread over several years. The Group Treasury frequently assesses its funding resources taking into account its own credit rating and general market conditions.
Referring to the bond issues in 2013, 2014, 2015 and 2017, the Group is convinced that it has sufficient access to sources of funding.
(in million EUR)
Non-derivative financial liabilities
Closing balance Expected cash outflows
6 months or less 6-12 months 1-2 years 2-5 years > 5 years
3,124.6 (3,722.0) (562.6) (2.1) (73.3) (670.4) (2,413.7)
Unsecured bond issues 2,090.6 (2,703.8) (68.5) 0.0 (68.5) (653.0) (1,913.8)
Unsecured financial bank loans and interest accruals 643.3 (627.5) (103.3) (2.1) (4.8) (17.4) (499.9)
Trade and other payables 390.8 (390.8) (390.8)
Derivative financial liabilities
9.4 (9.5) (4.7) (4.8) 0.0 0.0 0.0
Interest rate swaps used for hedging 9.4 (9.5) (4.7) (4.8)
Total at 31 December 2016
3,134.0 (3,731.5) (567.3) (6.9) (73.3) (670.4) (2,413.7)
Non derivative financial liabilities 3,262.7 (3,814.7) (452.6) (2.2) (576.4) (644.8) (2,138,7)
Unsecured bond issues
2,338.9 (2,919.6) (71.9) 0.0 (571.9) (137.1) (2,138.7)
Unsecured financial bank loans and interest accruals 545.3 (566.1) (51.7) (2.2) (4.4) (507.8) 0.0
Trade and other payables
378.5 (378.5) (378.5)
Derivative financial liabilities 0.0 0.0 0.0 0.0 0.0 0.0 0.0
Foreign currency rate swaps used for hedging 0.0 0.0 0.0 0.0 0.0 0.0 0.0
Total at 31 December 2017 3,262.7 (3,864.2) (502.1) (2.2) (576.4) (644.8) (2,138.7)
In 2017, Elia Transmission issued a 10 year bond with a nominal value of €250 million.
Details of the used and unused back up credit facilities are set out below:
(in million EUR)
Maturity Available amount
Confirmed credit line 08/07/2021 110.0
Confirmed credit line 08/07/2021 110.0
Confirmed credit line 08/07/2021 110.0
Confirmed credit line 08/07/2021 110.0
Confirmed credit line 08/07/2021 110.0
Confirmed credit line 08/07/2021 100.0
EIB credit facility 14/11/2018 100.0
Belgian dematerialised treasury notes unlimited 350.0
Straight loan EGI unlimited 2.5
Average basic interest Amount used Amount not used
Euribor + 0.30% 0.0 110.0
Euribor + 0.30% 0.0 110.0
Euribor + 0.30% 0.0 110.0
Euribor + 0.30% 0.0 110.0
Euribor + 0.30% 0.0 110.0
Euribor + 0.30% 0.0 100.0
Euribor + 0.19% 0.0 100.0
Euribor + margin when concluding deal 0.0 350.0
Euribor + 0.75% 0.0 2.5
Total 1,102.5 0.0 1,102.5
As at 31 December 2017, the German segment had unused facilities amounting to in total €900 million (consisting of a €150 million overdraft facility and €750 million in revolving facilities).
INTEREST RATE RISK
Interest rate risk is the risk that the fair value or future cash flows of a financial instrument will fluctuate because of changes in market interest rates. The Group's exposure to the risk of changes in market interest rates relates primarily to its long term debt obligations with floating interest rates.
The Group manages its interest rate risk by having a balanced portfolio of fixed and variable rate loans and borrowings. To manage this, the Group could engage in interest rate swaps, in which the Group agrees to exchange, at specified intervals, the difference between fixed and variable rate interest amounts calculated based on an agreed notional principal amount. These swaps are allocated to hedge underlying debt obligations. As at 31 December 2017, the Group had no interest rate swaps outstanding.
48 The table (see Note 7.11) shows the average interest rate at the balance sheet date.
SENSITIVITY ANALYSIS
Changes in interest rates will not affect the consolidated result in the short or long term as the Group operates within a regulatory framework where the consequences of fluctuations in financial expenses are mainly recovered in tariffs, except for the items which are directly recognised through OCI.
HEDGING
All financial derivatives the Group enters into relate to an underlying transaction or forecast exposure, depending on the expected impact on the income statement, and if the stringent IAS 39 criteria are met, the Group decides on a case by case basis whether hedge accounting will be applied. The following paragraphs describe the transactions whereby hedge accounting is applied. As at 31 December 2017, the Group had no transactions which did not qualify for hedge accounting.
In accordance with the hedge accounting rules, all derivative financial instruments are designated as cash flow hedges and valued at fair value. Consequently, the portion of the gain or loss on the derivative financial instrument that can be considered an effective hedge is reflected directly in equity (hedging reserves net of tax).
As at 31 December 2017, the Group only had two minor foreign currency swaps outstanding, totalling a notional amount of €0.3 million. The net fair value of these swaps was below €0.1 million.
As at that date, no significant financial expenses resulting from ineffective cash flow hedges were included in profit or loss.
CAPITAL RISK MANAGEMENT
The purpose of the Group's capital structure management is to maintain the debt and equity ratios related to the regulated activities in line with the requirement of the regulatory framework (one third equity and two thirds debt capital). This approach allows the Group to manage the security of the liquidity at all times via flexible access to capital markets, so as to be able to finance strategic projects and to offer an attractive remuneration to shareholders.
The Company's dividend policy involves optimising dividend payments while still bearing in mind that the company has the self financing capacity it needs to carry out its legal mission.
The Company offers the employees the opportunity to subscribe to capital increases that are exclusively reserved for them.
8.3. Commitment and contingencies
OPERATING LEASE COMMITMENTS GROUP AS A LESSEE
The Group entered into agreements to obtain passage rights for both underground and above ground cables. These rights are often obtained in the form of usufruct rights or concessions. The terms and conditions of these contracts vary depending on the counterparty as well as the when the contract was entered into.
The Group also entered into commercial leases on motor vehicles, IT equipment and office buildings. The leases related to cars and IT equipment have an average term of three years. The contracts regarding the buildings have a normal term of nine years, with the option of renewing the lease after that. Renewals are decided on by the specific entity that holds the lease. Normal conditions for renewal of lease contracts are applicable.
Future minimum rentals payable under non cancellable operating leases are as follows:
(in million EUR)
< 1 year 1 5 years > 5 years
Use of land * 0.5 1.9 7.7
Buildings 2.4 2.4 0.0
Cars, IT equipment and others 6.2 10.8 0.0
Balance at 31 December 2016 9.1 15.1 7.7
Use of land 0.5 1.9 7.2
Buildings 2.4 0.6 0.0
Cars, IT equipment and others 7.3 10.9 0.0
Balance at 31 December 2017 10.2 13.4 7.2
* Use of land commitments were not disclosed in the 2016 annual accounts. These commitments were not considered operating lease commitments until 2016. The Group has revised its position as part of the ongoing analysis of lease accounting. The disclosed amounts do not include low value leases (i.e. with annual payments of less than €250) and which are considered not to have a material effect on this disclosure.
The following expenses related to these lease contracts were recognised in the profit or loss:
(in million EUR)
2017 2016
Use of land 1.7 1.7
Buildings 2.5 2.4
Cars, IT equipment and others 6.4 6.2
Total 10.6 10.3
49
OPERATING LEASE COMMITMENTS GROUP AS A LESSOR
The Group has entered into commercial property leases on certain items of property, plant and equipment, mainly consisting of optimising the use of sites and high voltage pylons. Future minimum rental receivables are as follows:
(in million EUR)
< 1 year 1 5 years > 5 years
Telecom 13.1 9.8 13.1 Land and buildings 0.6 0.5 0.0
Balance at 31 December 2016 13.6 10.3 13.1 Telecom 14.4 6.5 0.0 Land and buildings 0.6 0.2 0.0
Balance at 31 December 2017 15.0 6.7 0.0
The following revenue related to these lease contracts was recognised in the income statement:
(in million EUR) 2017 2016
Telecom 14.3 13.0 Land and buildings 0.6 0.6
Total 14.9 13.6
CONTINGENT RENTS, PURCHASE OPTIONS AND RESTRICTIONS
The Group has no contracts which include contingent rental payments, and no purchase options were agreed in the significant lease contracts. Furthermore, these significant lease contracts do not include any escalation clauses or restrictions that are significant to the use of the respective asset.
CAPITAL-EXPENDITURE COMMITMENT
As at 31 December 2017, the Group had a commitment of €1,004.88 million relating to the purchase contracts for the installation of property, plant and equipment for further grid extensions. These capital expenditure commitments include the commitments of the German segment, amounting to €435.8 million (with a 60% stake for Elia).
OTHER CONTINGENCIES AND COMMITMENTS
As at 31 December 2017, the Group had a commitment of €130.44 million relating to purchase contracts for general expenses, maintenance and repair costs. This amount includes the commitments of the German segment, totalling €21.9 million (with a 60% stake for Elia).
Elia System Operator also provided a parent company guarantee to her joint venture Nemo Link Ltd amounting to €113.7 million in relation to the EPC contracts so that Nemo Link Ltd could build the relevant interconnector.
Having received approval from the Walloon government and from the CREG, on 22 June 2015 Elia entered into an agreement with Solar Chest for the sale of Walloon green certificates with a total value of €275 million, of which €221 million was settled in 2015 and a total of €48 million was settled in 2016. Solar Chest's mission is to buy, hold and sell Walloon green certificates for a period of respectively five, six and seven years. At the end of each period (30 June 2020, 30 June 2021 and 30 June 2022 respectively), any unsold certificates will be bought back by Elia. CREG confirmed and guaranteed to Elia that at the end of each reservation period, the cost and any expense for repurchase of non marketable certificates may be recovered fully through the tariffs for levies, and as a consequence the impact of the potential repurchase by Elia will have no impact on the Company's financial performance.
In September 2017, Elia sold 2.8 million green certificates to the Walloon Region (i.e. the Walloon Agency for Air and Climate, or AwAC) leading to a net cash inflow of €176.2 million. This was a result of the Decree of 29 June 2017 amending the Decree of 12 April 2011 relating to the organisation of the regional electricity market and the Decree of 5 March 2008 relating to the creation of the Walloon Agency for Air and Climate. The green certificates transferred by Elia can be gradually resold by AwAC as from 2022, taking into account the market conditions that exist for green certificates at that time. The legislation also envisages the green certificates being held by the AwAC for a period of up to nine years, after which Elia is required to buy back any unsold certificates. These repurchase commitments will have no impact on Elia's financial performance, as the cost and expense for the repurchase will be fully recovered through the tariffs for levies.
50
Related parties
TRANSACTIONS WITH KEY MANAGEMENT PERONNEL
Key management include members of the Board of Directors and Elia's Management Committee, made up of the Chief Executive Officer, the Chief Financial Officer, the Chief Customers, Market & System Officer, the Chief Public Acceptance Officer, the Chief Assets Officer, the Chief Infrastructure Officer, the Chief Officer External Relations and the Chief Human Resources & Internal Communication Officer.
The members of the Board of Directors are not employees of the Group. The remuneration for their mandate is detailed in the Corporate Governance Statement forming part of this annual report.
The members of Elia's Management Committee are hired as employees and the components of their remuneration are set out below. Members of the Management Committee do not receive stock options, special loans or other advances from the Group.
(in million EUR)
2017 2016
Short term employee benefits 2.6 2.4
Basic remuneration 1.8 1.6
Variable remuneration 0.8 0.8
Post employment benefits 0.4 0.4
Other variable remuneration 0.7 0.6
Total gross remuneration 3.7 3.4
Number of persons (in units) 8 7
Average gross remuneration per person 0.5 0.5
Number of shares (in units) 20,005 22,039
Some members of the Management Committee also hold shares in Elia System Operator for an overview, please see the Corporate Governance Statement forming part of this annual report.
In addition, Elia's Management Committee also assessed whether transactions occurred with entities in which they or members of the Board of Directors exercise a significant influence (e.g. positions as CEO, CFO, vice presidents of the Management Committee, etc.).
There were some significant transactions in 2017 with various distribution system operators. The total value of realised sales came to €54.1 million, while the total value of expenses amounted to €3.3 million. As at 31 December 2017, there was an outstanding trade receivable position of €4.6 million and an outstanding trade debt position of €0.2 million.
TRANSACTIONS WITH JOINT VENTURES AND ASSOCIATED COMPANIES
Transactions between the Company and subsidiaries that are related parties were eliminated during consolidation and therefore are not recognised in this note.
In the 2017 and 2016 financial years, there were no transactions with E Offshore, Atlantic Grid Investment or Enervalis.
Transactions with joint ventures and associated companies were not eliminated, and therefore details of transactions with other related parties are shown below:
(in million EUR)
2017 2016
Transactions with joint ventures and associated companies 23.2 27.8
Sales of goods 33.3 34.6
Purchases of goods (14.7) (8.4)
Interest and similar revenue 4.6 1.6
Outstanding balances with joint ventures and associated companies 134.9 28.8
Long term debtors 147.7 63.0
Trade debtors 4.2 2.8
Trade debts (11.7) (29.7)
Accruals and deferred income (5.3) (0.1)
Deferred charges and accrued revenues 0.0 1.6
Sales of goods remained relatively stable from year to year. The transactions mainly involved work performed by EGI GmbH for 50Hertz, as well as revenues generated with respect to IGCC (i.e. International Grid Control Coordination) exports by 50Hertz.
The increase in purchases of goods can be explained by increased volumes of IGCC imports by 50Hertz.
The decrease in trade debts is due to a fall in outstanding trade debts owed by EGI GmbH to 50Hertz.
Please also see Note 8.3 in which we set out the guarantees Elia System Operator issued for its joint venture Nemo Link Ltd
The significant increase in long term debtors is a result of the funding provided to Nemo Link in 2017 see Note 7.4 for more details
51 8.4.
Subsidiaries, joint ventures and associates
GROUP STRUCTURE OVERVIEW
SUBSIDIARIES
Elia System Operator NV/SA has direct and indirect control of the subsidiaries listed below

All the entities keep their accounts in euros (except E Offshore A LLC, Atlantic Grid Investment A Inc and Atlantic Grid A LLC, whose accounts are held in US dollars) and have the same reporting date as Elia System Operator NV/SA (except Eurogrid International CVBA/SCRL)
Name Country of establishment
Headquarters Stake (%)
2017 2016
Elia Asset NV/SA Belgium Bd de l’Empereur 20, 1000 Brussels 99.99 99.99
Elia Engineering NV/SA Belgium Bd de l’Empereur 20, 1000 Brussels 100.00 100.00
Elia Re NV/SA Luxembourg Rue de Merl 65, 2146 Luxembourg 100.00 100.00
Elia Grid International NV/SA Belgium Bd de l’Empereur 20, 1000 Brussels 80.00 80.00
Elia Grid International GmbH Germany Heidestraße 2, 10557 Berlin 80.00 80.00
Joint ventures
Eurogrid International CVBA/SCRL Belgium Bd de l’Empereur 20, 1000 Brussels 60.00 60.00
Eurogrid GmbH Germany Heidestraße 2, 10557 Berlin 60.00 60.00
50Hertz Transmission GmbH Germany Heidestraße 2, 10557 Berlin 60.00 60.00
50Hertz Offshore GmbH Germany Heidestraße 2, 10557 Berlin 60.00 60.00
Gridlab GmbH Germany Mittelstraße 7, 12529 Schönefeld 60.00 60.00
E Offshore A LLC
USA 874, Walker Road, Suite C, 19904 Dover, Delaware 60.00 60.00
Atlantic Grid Investment A Inc USA 1209 Orange Street, 19801 Wilmington, Delaware 60.00 60.00
Nemo Link Ltd
Associated companies accounted for using the equity method
H.G.R.T S.A.S.
United Kingdom Strand 1 3, London, WC2N 5EH UK 50.00 50.00
France 1 Terrasse Bellini, 92919 La Défense Cedex 17.00 17.00
Coreso NV/SA Belgium Avenue de Cortenbergh 71, 1000 Brussels 20.58 21.66
Ampacimon SA
Belgium Rue des Chasseurs Ardennais 3, 4031 Angleur 20.54 19.64
Enervalis NV Belgium Centrum Zuid 1111, 3530 Houthalen Helchteren 12,47 0.00
Other participations
JAO SA
Luxembourg 2, Rue de Bitbourg, 1273 Luxembourg Hamm 8.00 8.00
Atlantic Grid A LLC USA 4445, Willard Av, Suite 1050, 20815 Chevy Chase, Maryland 5.86 6.00
European Energy Exchange (EEX) Germany Augustusplatz 9, 04109 Leipzig 4.32 5.20
TSCNET Services GmbH Germany Dingolfinger Strasse 3, 81673 Munich 4.62 4.62
52 8.5.
8.6. Subsequent events
There are no significant events to report after 31 December 2017.
8.7. Miscellaneous
Impact of the result of the United Kingdom leaving the European Union
The Group has started an analysis of the potential impact of Brexit on the consolidated financial statements.
At this stage, the Group does not expect any impact on the construction of the Nemo Link interconnector. Future operations resulting from the Nemo Link interconnection could be affected by the United Kingdom exiting the European Union, but due to ongoing measures being taken by both the UK government and the European Union, the impact cannot yet be quantified.
Other than a potential effect on the future operations of the Nemo Link interconnection which cannot be quantified as yet, the Group expects the effect of Brexit on the consolidated financial statements to be very limited.
8.8. Services provided by the auditors
The General Meeting of Shareholders appointed as joint auditors KPMG Bedrijfsrevisoren Burg. CVBA (represented by Alexis Palm) and Ernst & Young Bedrijfsrevisoren BCVBA (represented by Patrick Rottiers) for the audit of the consolidated financial statements of Elia System Operator NV/SA and the audit of the statutory financial statements of Elia System Operator NV/SA, Elia Asset NV/SA and Elia Engineering NV/SA.
The following table sets out the fees of the joint auditors and its associated companies related to the delivered services with respect to the accounting year 2017:
in EUR Belgium Other offices in the network
Total
Statutory audit 179,958 319,450 499,408
Audit related 110,355 171,296 281,651
Income tax 55,706 4,302 60,008
Indirect tax 20,277 0 20,277
Other advisory 30,000 14,696 44,696
Total 396,296 509,744 906,040
53
9.
REGULATORY FRAMEWORK AND TARIFFS
9.1 Regulatory framework in Belgium
9.1.1 Federal legislation
The Electricity Act, which forms the general basis, lays down the core principles of the regulatory framework governing Elia’s activities as a transmission system operator in Belgium.
This Act was heavily amended on 8 January 2012 by the transposition at federal level of the 3rd package of European directives. These changes ensure that the Electricity Act:
• sets out the unbundling of transmission operations from generation, distribution and supply activities;
• sets out in greater detail the rules for operating and accessing the transmission system;
• redefines the transmission system operator's legal mission, mainly by expanding it to the offshore areas over which Belgium has jurisdiction; and
• strengthens the role of the regulatory authority, particularly as regards determining transmission tariffs.
A number of royal decrees provide more details of the regulatory framework applying to the transmission system operator, particularly the Royal Decree on the Federal Grid Code. Similarly, the decisions passed by the Commission for Electricity and Gas Regulation (CREG) supplement these provisions to form the regulatory framework within which Elia operates at the federal level.
9.1.2 Regional legislation
Belgium's three regions are primarily responsible for the local transmission of electricity through grids with a voltage of 70 kV or less on their respective territory. The regional regulators are in charge of the non tariff aspects of local transmission system regulation, while setting and monitoring tariffs falls under federal jurisdiction.
The Flemish Region, the Brussels Capital Region and the Walloon Region have also transposed into their legislative framework the provisions of the 3rd European package applying to them. The regional decrees have been complemented by various other rules and regulations on matters such as public service obligations, renewable energy and authorisation procedures for suppliers.
9.1.3 Regulatory agencies
As required by EU law, the Belgian electricity market is monitored and controlled by independent regulators.
FEDERAL REGULATOR
CREG is the federal regulator, and its powers with regard to Elia include:
• approving the standardised terms in the three main contracts used by the company at the federal level: the connection contract, the access contract and the ARP contract;
• approving the capacity allocation system at the borders between Belgium and neighbouring countries;
• approving the appointment of the independent members of the Board of Directors;
• determining the tariff methodology to be observed by the grid operator when calculating the various tariffs applying to grid users;
• certifying that the grid operator actually owns the infrastructure it operates and that it meets the regulatory requirements for independence from generators and suppliers.
REGIONAL REGULATORS
Operation of electricity grids with voltages of 70 kV and less falls under the jurisdiction of the respective regional regulators. Each of them may require any operator (including Elia if it operates such grids) to abide by any specific provision of the regional electricity rules on pain of administrative fines or other sanctions. However, the regional regulators do not have the power to set tariffs for electricity transmission systems, as tariff setting falls within the exclusive remit of CREG for these grids.
9.1.4 Tariff setting
TARIFF REGULATIONS
On 18 December 2014, CREG adopted a decree setting out calculation methods to establish tariffs applying to users of electricity grids performing a transmission function. Elia used this methodology as a basis for its tariff proposal for 2016 2019 submitted on 30 June 2015. This tariff proposal, adjusted following the discussions between Elia and CREG in the course of the second half of 2015, was approved by the regulator on 3 December 2015.
TARIFF REGULATIONS APPLYING IN BELGIUM
As the operator of grids performing a transmission function (covering the transmission grid and the local and regional transmission grids in Belgium), Elia makes most of its income from the regulated tariffs charged for use of these grids (tariff income), which are approved in advance by CREG. As of 1 January 2008, the prevailing tariff regulation mechanisms have provided for approved tariffs being set for four year periods, barring specific circumstances. 2017 was therefore the second year of the third four year regulatory period.
The tariff mechanism is based on amounts recognised in accordance with Belgian accounting regulations (BE GAAP). The tariffs are based on budgeted costs minus a number of sources of non tariff income. These costs are then divided based on an estimate of the volumes of electricity taken off the grid and, in the case of some costs, based on estimated volumes of electricity injected into the grid, in accordance with the terms of the tariff methodology drawn up by CREG.
54
The costs taken into account include the forecast value of the authorised remuneration of the invested capital, an estimate of the amounts allocated to Elia in the form of performance incentives and the predicted values of various cost categories. These costs are subdivided into three groups: controllable costs, for which Elia is offered a financial incentive to improve its efficiency levels; non controllable costs, over which Elia has no influence and for which the deviations from the budget are completely allocated to the calculation of future tariffs; and influenceable costs, to which a hybrid rule applies (see the information about controllable and non controllable costs and income and influenceable costs provided below).
FAIR REMUNERATION
Fair remuneration is the return on capital invested in the grid. It is based on the average annual value of the regulated asset base (RAB), calculated annually, taking into account new investments, depreciations and changes in working capital.
In this context, fair remuneration is calculated based on a formula that allocates a different return to equity accounting for up to 33% of the RAB (Part A) and to equity exceeding this ratio (Part B). This formula is as follows:
Fair remuneration = A + B where:
• A = [33% x average RAB of the year n x [(OLO n) + (beta x risk premium)] x illiquidity premium]; plus
• B = [(S 33%) x average RAB x (OLO n + 70 base points)]; where:
• OLO n is the interest rate for Belgian 10 year linear bonds for the year in question;
• S = consolidated capital and reserves/average RAB, in accordance with Belgian accounting standards (BE GAAP);
• beta (β) is calculated based on Elia share prices, compared with the BEL 20 index, over a three year period; the value of beta cannot be lower than 0.53:
• the risk premium is fixed at 3.5%;
• the illiquidity premium is fixed at 1.10.
PART A
The rate of remuneration (in %) as set by CREG for year ‘n’ is equal to the sum of the risk free rate, i.e. the average rate of Belgian 10 year linear bonds and a premium for share market risk, weighted using the applicable beta factor.
The reference ratio of 33% is applied to Elia’s average regulated asset base (RAB) to calculate Elia’s reference equity.
By means of this ratio, CREG encourages the proportional share between equity and regulated asset base to be as close as possible to 33%. As a consequence, Part B (applicable to the reference equity exceeding 33% of the RAB) is remunerated at a lower rate.
PART B
If the actual proportional share of Elia's actual equity exceeds the reference ratio, the surplus amount is balanced out with a rate of remuneration calculated as follows: [(OLO n + 70 base points)].
The Electricity Act also provides for the possibility of the regulator setting higher remuneration rates for capital that is invested to finance projects of national or European interest (see 'Other incentives' below).
Non controllable costs and revenues
This category of costs and revenues over which Elia has no direct control is not subject to the incentive mechanisms offered by CREG, and is allocated in its entirety to the calculation of the revenue to be covered by tariffs. The tariffs are set on the basis of the forecast values of these costs, and the difference from the actual values is allocated ex post to the tariff calculation for the subsequent period.
The main non controllable costs are: depreciation of tangible fixed assets, ancillary services (except for the reservation costs of ancillary services excluding black start, which are referred to as "influenceable costs"), costs related to line relocation imposed by a public authority, and taxes. They also include financial charges to which the embedded debt principle applies. As a consequence, all actual and reasonable financial costs related to debt financing are included in the tariffs. Some revenues are also non controllable. These include cross border congestion revenues and financial revenues.
Controllable costs and revenues
The costs and revenues over which Elia has direct control are subject to incentive regulation mechanisms, meaning that Elia is encouraged to reduce these costs and increase these revenues. Therefore, Elia's efficiency efforts (and conversely any inefficiency) are divided equally between Elia profits and future tariffs (50% each).
Influenceable costs
The reservation costs of ancillary services, except for black start, are categorised as 'influenceable costs', meaning that Elia's profits are partially affected (to the tune of 15%) by increases and reductions in these costs, within certain limits (ranging from €2 million to €6 million).
Other incentives
• Market integration: This incentive consists of three components: (i) enhancement of Belgium's import capacity; (ii) increase of social welfare generated by regional market coupling: both elements only have a positive impact on the net profit, with a maximum of €6 million for import capacity and a maximum of €11 million for social welfare (pre tax). (iii) the profit (dividends and capital gains) resulting from Elia's financial participation in various other companies contributing to market integration (CASC, Coreso, HGRT, APX ENDEX) is shared between Elia (40%) and future tariffs reductions (40%).
55
• Investment programme: This incentive is related to three objectives: (i) Elia's ex ante/ex post justification of the costs involved in each investment (this objective makes a contribution of up to €2.5 million to pre tax profits); (ii) adherence to the planned dates for commissioning of the Stevin, Brabo, ALEGrO and fourth phase shifting transformer (PST) projects (€1 million pre tax per project commissioned on time); and (iii) production of a list of selected strategic projects, especially investments aimed at consolidating European integration (the ''mark up' incentive). The mark up is calculated based on the actual cumulative amounts spent, whereby it must however be borne in mind that there are annual and project caps on amounts invested and that the incentive is calculated on the basis of the actual amounts invested. The mark up applies in full when the OLO rate is 0.5% or less. It is reduced if the OLO rate is greater than 0.5% and decreases to 0 for an OLO rate of 2.16% or more. Please note that 10% of the mark up amount obtained for each project must be repaid if the project is not completed by the stipulated deadlines or if the availability levels provided by the project after commissioning are unsatisfactory.
• Continuity of supply: Elia is entitled to an incentive calculated based on the Average Interruption Time (AIT) measured in the course of a year. The allocated sum is limited to €2 million (pre tax).
• Innovation: This incentive is calculated based on the total costs incurred in obtaining innovation subsidies, up to a maximum sum corresponding to 50% of the amount of subsidies received or €1 million (pre tax).
• Discretionary incentive: Each year, CREG sets the objectives Elia is expected to meet to receive this incentive. These mainly relate to the implementation of projects and mechanisms aimed at balancing supply and demand on the electricity market. This incentive contributes to the profit to the tune of up to €2 million (pre tax).
Settlement mechanism: deviations from budgeted values
The actual volumes of electricity transmitted may differ from the forecast volumes. If the transmitted volumes are higher (or lower) than those forecast, the deviation is booked to an accrual account during the year in which it occurs and this deviation from budgeted values creates a regulatory debt (or a regulatory receivable) which will be used to calculate the tariffs for the subsequent period. The same mechanism applies to non controllable costs.
Cost and revenue allocation between regulated and non regulated activities
The tariff methodology for 2016 2019 features a mechanism enabling Elia to develop activities outside the Belgian regulated perimeter and whose costs are not covered by grid tariffs in Belgium. This methodology establishes a mechanism to ensure that the impact on Belgian grid users of Elia's financial participation in other companies which CREG does not consider part of the RAB (such as stakes in regulated or non regulated activities outside Belgium, for example its participation in 50Hertz or EGI) is neutral.
56
9.2 Regulatory framework in Germany
9.2.1 Relevant legislation
The German legal framework is laid down in various pieces of legislation. The key law is the German Energy Act (Energiewirtschaftsgesetz EnWG), which defines the overall legal framework for the gas and electricity supply industry in Germany. The EnWG is supported by a number of laws, ordinances and regulatory decisions, which provide detailed rules on the current system of incentive regulation, accounting methods and network access arrangements, including:
• the Ordinance on Electricity Network Tariffs (Verordnung über die Entgelte für den Zugang zu Elektrizitätsversorgungsnetzen (Stromnetzentgeltverordnung StromNEV)), which establishes, inter alia, principles and methods for the grid tariff calculations and other obligations applying to grid operators;
• the Ordinance on Electricity Network Access (Verordnung über den Zugang zu Elektrizitätsversorgungsnetzen (Stromnetzzugangsverordnung StromNZV), which, inter alia, sets out the further detail how to grant access to the transmission systems (and other types of grids) by way of establishing the balancing amount system (Bilanzkreissystem), scheduling of electricity deliveries, control energy and other general obligations, e.g. congestion management (Engpassmanagement), publication obligations, metering, minimum requirements for various types of contracts and the duty of certain system operators to manage the balancing amount system for renewable energy;
• the Ordinance on Incentive Regulation (Verordnung über die Anreizregulierung der Energieversorgungsnetze (Anreizregulierungsverordnung ARegV)), which sets out the basic rules for incentive regulation of TSOs and other system operators (as set out in more detail below). It also describes in general terms how to benchmark efficiency, which costs are included in the efficiency benchmarking, how to determine inefficiency and how this translates into yearly targets for efficiency growth.
9.2.2
Regulatory agencies in Germany
The regulatory agencies for the energy sector in Germany are the Bundesnetzagentur (BnetzA, or Federal Network Agency) in Bonn for grids to which over 100,000 grid users are directly or indirectly connected and the specific regulatory authorities in the various federal states for grids to which fewer than 100,000 grid users are directly or indirectly connected. The regulatory agencies are, inter alia, in charge of ensuring non discriminatory third party access to grids and monitoring the grid use tariffs levied by the TSOs. 50Hertz Transmission and 50Hertz Offshore are subject to the authority of the Federal Network Agency.
9.2.3
Tariff setting in Germany
The current regulation mechanism is established in Germany by the ARegV. Under the ARegV, grid tariffs are defined to generate a pre defined 'revenue cap' as determined by the Federal Network Agency for each TSO and for each regulatory period. The revenue cap is principally based on the costs of a base year, and is fixed for the entire regulatory period, except when it is adjusted to account for specific cases provided for in the ARegV. The grid operators are not allowed to retain revenue in excess of their individually determined revenue cap. Each regulatory period lasts five years, with the second regulatory period starting on 1 January 2014 and ending on 31 December 2018. Tariffs are public and cannot be the subject of negotiations with customers. Only certain customers (under certain set circumstances laid down in the relevant legislation) are allowed to agree to individual tariffs according to Article 19 of the StromNEV (for example, in the case of sole use of a network asset). The Federal Network Agency has to approve such individual tariffs.
For the purposes of the revenue cap, the costs incurred by a grid operator fall into two categories as follows:
• Permanently non influenceable costs (PNIC): These costs are fully integrated into the 'revenue cap' and are fully recovered by the grid tariffs, albeit usually with a two year time lag. They include return on equity, imputed trade tax, cost of debt, depreciation and operational costs (currently at a fixed rate of 0.8% of the capitalised investment costs of the respective onshore investments) for what are called investment measures. The cost of debt related to investment measures is currently capped at the lower value of the actual cost of debt and the cost of debt as calculated in accordance with published Federal Network Agency guidelines. Since 2012, the costs associated with these investment measures have been based on forecast values. The differences between the forecast values and the actual values are reflected in the regulatory account. In addition, Permanently non influenceable costs include costs relating to ancillary services, grid losses and redispatch costs, as well as European initiatives and income from auctions. These costs and income are included in the revenue cap based on a procedural regulation mechanism set by the Federal Network Agency in accordance with Article 11(2) of the ARegV (FSV). The regulation process relating to ancillary services and grid losses costs gives the system operator an incentive to outperform the planned costs through bonus/malus mechanisms. Since the revision of the ARegV in 2016, also costs for the curtailment of renewable energy sources to relieve grid congestion are based on forecast values. Moreover, costs resulting from European projects of common interest (PCI) where a cost contribution of Germany has been decided can be included as PNIC, albeit with a two year time lag
• Temporary non influenceable costs (TNIC) and influenceable costs (IC): These costs include return on equity, depreciation, cost of debt, imputed trade tax and other operational expenses and are subject to an incentive mechanism as set by the Federal Network Agency, which features an efficiency factor (only applicable to IC), a productivity factor improvement and an inflation factor (applicable to both TNIC and IC) over a five year period. In addition, the current incentive mechanism provides for the use of a quality factor, but the criteria and implementation mechanism for such a factor for TSOs are yet to be described by the Federal Network Agency. The various defined factors give the TSOs a medium term objective to eliminate what are deemed to be inefficient costs. As regards the cost of debt, the permitted cost of debt related to influenceable costs needs to be shown to be marketable;
As for return on equity, the relevant laws and regulations set out the provisions relating to the permitted return on equity, which is included in the TNIC/IC for assets belonging to the regulatory asset base and the PNIC for assets approved in investment budgets. For the second regulatory period (2014 2018), the return on equity is set at 7.14% for investments made before 2006 and 9.05% for investments made since 2006, based on 40% of the total asset value being regarded as 'financed by equity' with the remainder being treated as 'quasi debt'. In 2016, the BNetzA determined the return on equity applicable for the third regulatory period (2019 2023); the
57
values were significantly down from the second regulatory period, namely to 5.12% for investments made before 2006 and 6.91% for investments made since 2016. The return on equity is calculated before corporate tax and after imputed trade tax
Separately from the revenue cap, 50Hertz is compensated for costs incurred related to its renewable energy obligations, including EEG and CHP/KWKG obligations and offshore liabilities For this purpose, various surcharges have been implemented that are subject to specific regulatory mechanisms aimed at a balanced treatment of costs and income.
CHANGES IN TARIFF REGULATIONS
In 2016, a revision of the ARegV entered into force implementing various relevant changes, especially regarding the regulatory system for distribution system operators. However, also TSOs are affected as the ARegV revision changes several PNIC aspects such as the methodology for the determination of replacement portions in new investment measures (for already approved and applied for investment measures, the conservation of the status quo is foreseen), the consideration of costs from the curtailment of renewable energy sources based on forecast values and the consideration of PCI costs. Moreover, the ARegV revision substantiates the methodologies that can be applied to measure the individual efficiency of the four German TSOs, allowing for only an international benchmark or a relative reference grid analysis for this purpose.
As of 31 December 2017, 50Hertz had obtained approval for 86 of the 123 active investment measure requests made since 2008.
Based on the total investment budget request volume of €13 billion, the approved investment budget for the same date accounts for €8.7 billon
TARIFFS
Grid access tariffs were calculated based on the respective revenue cap and published on 29 September 2017 for 2018. Compared with 2017, they have decreased by an average of 11%. 50Hertz has actively and successfully proceeded with its grid extension projects. Due to the commissioning of new lines, it was possible to lower costs for redispatch and for curtailment of renewables and in this way compensate for the persistently high costs of grid extension which enabled this decrease in the tariffs.
In recent years, the grid access tariffs of the four German TSOs have developed differently, mainly driven by the different volumes of renewable energies installed in the control areas, leading to significantly higher tariffs in those control areas with higher levels of renewable energies. In July 2017, the Act for Modernisation of Grid Tariffs (Netzentgeltmodernisierungsgesetz NEMoG) came into force. The NEMoG envisages the gradual harmonisation of the grid access tariffs of the four German TSOs as of 2019, culminating in uniform transmission tariffs in 2023. Moreover, the NEMoG eliminates ‘avoided grid fees' (vNNE) for volatile RES generation and a new system for offshore grid connections, shifting the related costs from the tariffs to a surcharge.
58

59

60

61

62

63
INFORMATION ABOUT THE PARENT COMPANY
Extracts from the statutory annual accounts of Elia System Operator NV/SA, drawn up in accordance with Belgian accounting standards, are given hereafter in abbreviated form.
Pursuant to Belgian company legislation, the full financial statements, the annual report and the joint auditors' report are filed with the National Bank of Belgium.
These documents will also be published on the Elia website and can be obtained on request from Elia System Operator NV/SA, Boulevard de l’Empereur 20, 1000 Brussels, Belgium. The joint auditors issued an unqualified opinion.
64
Statement of financial position after distribution of profits
ASSETS (in million EUR)
2017 2016
FIXED ASSETS 3,677.8 3,620.7
Financial fixed assets 3,677.8 3,620.7
Affiliated companies 3,572.3 3,572.3
Participating interests 3,572.3 3,572.3
Other enterprises linked by participating interests 105.6 48.4
Participating interests 105.4 48.2
Other participating interests 0.2 0.2
CURRENT ASSETS 1,893.9 1,628.5
Amounts receivable after more than one year 147.8 63.0
Trade receivables 8.8 8.8
Other amounts receivable 139.0 54.2
Inventories and contracts in progress 4.9 5.8
Contracts in progress 4.9 5.8
Amounts receivable within one year 1,585.3 1,428.4
Trade debtors 215.6 208.8
Other amounts receivable 1,369.8 1,219.6
Investments 30.0 0.0
Other term deposits 30.0 0.0
Cash at bank and in hand 117.9 126.9
Deferred charges and accrued income 8.0 4.5
TOTAL ASSETS 5,571.7 5,249.3
EQUITY AND LIABILITIES (in million EUR)
2017 2016
CAPITAL AND RESERVES 1,765.2 1,764.1
Capital 1,519.0 1,518.7
Issued capital 1,519.0 1,518.7
Share premium account 11.9 11.8
Reserves 174.7 173.9
Legal reserve 173.0 173.0
Untaxed reserve 1.6 0.9
Profit carried forward 57 2 59.7
PROVISIONS, DEFERRED TAXES 0.4 0.5
Provisions for risks and charges 0.4 0.5
Other risks and charges 0.4 0.5
LIABILITIES 3,806.0 3,484.7
Amounts payable after one year 2,839.2 2,590.7
Financial debts 2,839.2 2,590.7
Unsubordinated debentures 2,343.4 2,094.9
Credit institutions 0.0 0.0
Other loans 495.8 495.8
Amounts payable within one year 389.4 418.1
Current portion of amounts payable after more than one year 0.0 20.0
Financial debts
4.3 82.7
Credit institutions 0.0 78.0
Other loans 4.3 4.7
Trade debts 186.4 204.9
Suppliers 179.3 196.1
Advances received on contracts in progress 7.1 8.8
Amounts payable regarding taxes, remuneration and social security costs 8.7 7.7
Taxes 0.7 0.6
Remuneration and social security 8.0 7.1
Other amounts payable 192 5 102.8
Accrued charges and deferred income 577.4 475.9
TOTAL EQUITY AND LIABILITIES 5,571.7 5,249.3
65
Income statement
(in million EUR)
2017 2016
OPERATING INCOME 799.4 732.9
Turnover 792.2 714.7
Increase/(decrease) in inventories of finished goods, works and contracts in progress (0.9) 1.0
Other operating income 8.1 17.2
OPERATING CHARGES (704.7) (669.8)
Services and other goods (666.5) (634.2)
Remuneration, social security costs and pensions (38.1) (35.2)
Amounts written off stocks, contracts in progress and trade debtors: appropriations/(write backs) (0.2) (0.2)
Provisions for liabilities and charges: appropriations/(uses and write backs) 0.0 0.2
Other operating charges (0.0) 0.4
OPERATING PROFIT 94.8 63.1
Financial income 98.0 182.6
Income from financial fixed assets 90.4 123.0
Income from current assets 7.6 4.9
Non recurring financial income 0.0 54.7
Financial charges (88.9) (97.2)
Debt charges (86.7) (93.9)
Other financial charges (2.2) (3.3)
Non recurring financial charges 0.0 0.0
PROFIT FOR THE PERIOD BEFORE TAXES 103.8 148.5
Income taxes (6.9) (11.3)
Income taxes (6.9) (11.3)
PROFIT FOR THE PERIOD 96.9 137.2
Transfer to untaxed reserves (0.8) (0.8)
PROFIT FOR THE PERIOD AVAILABLE FOR APPROPRIATION 96.1 136.4
66
Annexes to the Annual Report 2017
CONTENTS
1. Sustainability ambitions 2
2. Group priorities - Materiality 3
2.1. Phased approach 3 2.2. Elia’s User Group panels 3
3. Network operation 5
3.1. Evolution of installed capacity (Elia Belgium) 5 3.2. Energy balance (Elia Belgium) 5 3.3. Energy balance (Elia Belgium – 2017) 6
3.4. Cross border exchange Belgium (Twh) (Elia Belgium – 2017) 6
3.5. Evolution of consumption (Twh) (Elia Belgium) 7 3.6. Grid interruptions (Elia Belgium) 7
3.7. Non-supplied energy (Elia Belgium) 8 3.8. Quality of service split by voltage (Elia Belgium) 8
4. Infrastructure management 9
4.1. Supply chain management 9 4.2. Number of suppliers in Belgium - EU vs non- EU 9 4.3. Split of yearly spend in Belgium within EU vs non-EU 9 4.4. Total circuit length in km (Elia Belgium) 10 4.5. Number of substation locations (Elia Belgium) 10
5. HR 11
5.1. Total headcount (Elia Group – 2017) 11 5.2. Leavers by gender (Elia Belgium) 13 5.3. Parental leave (Elia Belgium) 13
5.4. Employee survey (Elia Belgium) 14 5.5. New hires per age category (Belgium) 17 5.6. Employee turnover per age category (Elia Belgium) 17 5.7. Average number of sick days per employee (Elia Belgium) 17
6. Public acceptance (focused on environment and biodiversity) 18
6.1. Energy consumption within the organisation (Elia Belgium – 2017) 18
6.2. Number of projects for which impact is monitored (Elia Belgium) 18
6.3. Protecting birds by installing markers (Elia Belgium) 18
6.4. Sustainable integration of facilities in the Stevin project (Elia Belgium) 19
6.5. Annual implementation budget for the Elia-RTE LIFE project (Elia Belgium) 19
6.6. Electromagnetic fields (Elia Belgium) 19
6.7. Requests for information handled (Elia Belgium) 20
6.8. Carbon assessment (Elia Belgium) 20
6.9. Client information and complaints requests (Elia Belgium) 21
7. GRI reference table 22
ELIA ANNEXES TO THE ANNUAL REPORT 2017 - 1
1. Sustainability programme and ambitions
At Elia Belgium, the following sustainability ambitions were defined by the Executive Committee (Excom) in November 2017:
Energy grid
Elia Belgium
Safety
Employees
Environment
AMBITIONS FOR 2020
Develop a grid which enables the integration of 13% renewable energy or alternatives within the product mix at Belgian level and support the target of 20% renewable energy at European level.
Ensure that the yearly average interruption time does not exceed the maximum AIT of 2.55 min.
Embed a safety culture at Elia by increasing the safety awareness of employees and contractors in order to: ensure that every employee and contractor knows the principles of the Go for Zero programme ensure Elia’s safety instructions are properly applied avoid electrical near misses or incidents increase reporting maturity and reduce the number of injuries.
AMBITIONS FOR 2020
Develop an extended talent and organisational development programme.
Move towards a new corporate culture with a new vision and ambition.
Create a high-performance organisation to empower people to take more initiatives and enable quicker decision-making.
Deliver a positive impact on society by realising further grid development enabling proper integration of renewable energy into the EU grid of the future.
20% reduction in CO2 emissions from our own operations (compared to 2010).
Community
We deliver the infrastructure of the future and innovate in services that enable the pathway to a reliable and sustainable power system, with the interest of the community at the heart of every decision.
The Elia Group is constantly expanding its dialogue with stakeholders and keeps them informed throughout the entire duration of its projects.
We perform the necessary studies and analyses and act as an advisor to the different governments on implementing the energy transition in the interest of society.
AMBITIONS FOR 2050
Integrate renewables into both centralised and decentralised systems. Develop strong grid interconnections together with neighbouring countries.
Use digitalisation and ‘smarter grid’ market design to exploit resources in an efficient way.
Long-term ambitions to be defined at a later stage.
AMBITIONS FOR 2050
Long-term ambitions to be defined at a later stage.
Elia BelgiumELIA ANNEXES TO THE ANNUAL REPORT 2017 - 2
2. Group priorities - Materiality
2.1. Phased approach
The topics identified in these frameworks were assessed by Elia management. The following individuals were involved in prepa ring the Group materiality matrix:
Department heads from Elia Belgium
One department head from 50Hertz
CEO of Eurogrid Belgium
The department head from 50Hertz who rated the materiality topics took into account the materiality assessment performed among 50Hertz internal stakeholders in 2016. The output of the German assessment was reflected in the input provided for this materiality assessment.
In addition, the topics brought up in the existing stakeholder channels were mapped with this materiality matrix to crosscheck the completeness of our exercise.
In a subsequent phase, this materiality matrix will be used as a basis for engaging with external stakeholders.
2.2. Elia’s User Group panels
Elia regularly organises User Group panels. These discussion groups allow Elia to maintain an ongoing dialogue with its main customers and partners. Within the Users’ Groups, there are three working groups and four task forces. The task forces are set up ad hoc to handle specific issues when necessary. Currently, three of the four task forces are active:
BidLadder Task Force: This task force aims to discuss with all relevant stakeholders the design of a BidLadder market plat form allowing market parties to bring available flexibility to the market.
Implementation of Strategic Reserves Task Force: This task force is aimed at informing and consulting market players and stakeholders about all relevant issues linked to the implementation of strategic reserves.
Implementation of Network Codes Task Force (currently inactive): This task force consists of a group of experts set up by the Users’ Group to analyse, discuss and make substantive proposals on specific issues and topics related to implemen tation of the European Network Codes in the Belgian context.
CIPU Redesign (iCAROS) Task Force: This task force aims to discuss topics related to future asset coordination procedures with the relevant stakeholders.
The working groups meet at least once a year and consist of the following:
System Operation and European Market Design Working Group: This working group mainly addresses topics related to the operation of the high-voltage grid, capacity calculation as well as initiatives and developments linked to European inte gration of electricity markets.
Belgian Grid Working Group: This working group addresses issues associated with the Elia grid and related mechanisms, products and services that are of interest to Elia’s customers.
Balancing Working Group: This working group mainly addresses operational, technical and market-related issues in order to prepare Elia for the challenges Elia’s balancing market will face in the coming years.
Additionally, four Users’ Group plenary meetings are scheduled each year to pass on information about important topics not addressed by the working groups.
ELIA ANNEXES TO THE ANNUAL REPORT 2017 - 3
During all of these sessions, topics that are material to the relevant external stakeholders are discussed. An over view of the topics based on the GRI, SASB and ISO 26000 standards can be found in the following table.
Users’ Group Session
30/03/2017 – Clean energy for all Europeans 22/06/2017 – Modular offshore grid 21/09/2017 – Implementation of network codes 21/09/2017 – innovation @ Elia
7/12/2017 – ENTSO-E Winter Outlook 2017-2018
22/06/2017 – Modular offshore grid 22/06/2017 – Elia’s view on Belgium’s Energy Vision for 2050 21/09/2017 – Implementation of network codes
Link to material topic
Transmission services
Users’ Group plenary meetings
22/06/2017 – Feedback: Balancing WG 30/06/2016 – Customer satisfaction survey 21/09/2017 – Feedback: Balancing WG & iCAROS TF 21/09/2017 – innovation @ Elia
22/06/2017 – Elia’s view on Belgium’s Energy Vision for 2050 22/06/2017 – Compensation in kind 2018 22/06/2017 – Modular offshore grid 30/06/2016 – Customer satisfaction survey
30/03/2017 – Clean energy for all Europeans 30/06/2016 – Customer satisfaction survey
22/06/2017 – Elia’s view on Belgium’s Energy Vision for 2050 30/06/2016 – Customer satisfaction survey 21/09/2017 – Innovation @ Elia
Fair operating practices
Labour practices/employees
Environment
System Operation and European Market Design Working Group
Belgian Grid Working Group
Balancing Working Group
Organisational governance
Community involvement & development
27/04/2016 – Elia summer outlook (incompressibility risk) Transmission services
1/02/2016 – Status of major Elia infrastructure works 25/03/2016 – Power quality 19/06/2017 – Large infrastructure projects 21/04/2017 – Grid losses
7/03/2017 – Implementation of network codes
Transmission services
Fair operating practices
30/11/2017 – Balancing WG Transmission services 15/05/2017 – Balancing WG Fair operating practices
Status meetings of the Balancing TF
Labour practices/employees
ELIA ANNEXES TO THE ANNUAL REPORT 2017 - 4
3. Network operation
3.1. Evolution of installed capacity (Elia Belgium)
7,000 6,000 5,000 4,000 3,000 2,000 1,000 0
3,087 2,292
ELIA ANNEXES TO THE ANNUAL REPORT 2017 - 5 3,380 2,807
6,865 6,546 6,688
5,919 314
2,958 2,172 116
806 823 897
1,308
261 219 234 122 122
Nuclear Solar Wind Hydro Biomass Incineration Natural Gas Pumpedstorage Other Thermal
Nuclear installed capacity will remain stable until the first decommissioning, which is scheduled for 2022.
The installed capacity of renewable energy sources, such as solar and wind, has increased and is expected to increase further in the coming years. Elia acts as a market facilitator and in this role works hard to ensure the grid is prepared to integrate new renewable energy.
3.2. Energy balance (Elia Belgium)
80,000 70,000 60,000 50,000 40,000 30,000 20,000 10,000 0
23,716.55 2,717.85
14,649.98 8,466.77
14,191.75 8,169.54
20,998.70
6,183.21
6,022.21
77,229.42 57,605.65 1,374.93
77,665.55 72,867.75 1,385.41
77,173.91 72,519.35 1,367.65
Import Export Net import Consumption Net production Energy losses
Consumption decreased slightly by 0.6% in 2017 compared to 2016, with 77,173.91 GWh of energy consumed in 2017. This decrease can be explained by the downward trend in both import and export. Net production of energy decreased slightly by 0.5%, down 348.40 GWh to 72,519.35 GWh. Energy losses have remained stable over the years, with 1,367.65 GWh of energy lost in 2017.
2015 2016 2017
2015 2016 2017
3.3. Energy balance (Elia Belgium – 2017)
Import = 14,191.75
Net production = 72,519.35
Net import = 6,022.21
Energy losses = 1,367.65
3.4. Cross border exchange Belgium (Twh) (Elia Belgium – 2017)

ELIA ANNEXES TO THE ANNUAL REPORT 2017 - 6 Consumption = 77,173.91
Export = 8,169.54
2.17 TWH 10.25 TWH 5.49TWH3.92TWH 0.51TWH0.03TWH NL LU FR
3.5.Evolution of consumption (Twh) (Elia Belgium)
January
8.0
6.0 5.0 4.0 3.0 2.0 1.0
2016 Twh
Twh
temp. C°
temp. C°
3.6. Grid interruptions (Elia Belgium) 4 3.5 3 2.5 2 1.5 1 0.5
2013
This graph shows the interruptions for which Elia is responsible. Any interruptions caused by customer errors, thunderstorms, third parties, birds, etc. are not considered here. Furthermore, only incidents that resulted in a customer interruption time of more than three minutes are included.
The maximum interruption time is the reference value used for calculating the average interruption time (AIT) incentive. Based on a seven-year average, this value was introduced in 2015 and validated by CREG for four years. This reference value will be reviewed in 2019.
Exceptional events represent the number of natural disasters, storms or other climatological circumstances, nuclear or chemical accidents, explosions, and so on resulting in an interruption that lasted more than three minutes. Exceptional events only occurred in 2016 and 2017. Between March 2012 and June 2016, there were no major events leading to customer interruptions.
Incidents (n°)
Exceptional events
Average interruption time (min)
Max interuption time (min)
ELIA ANNEXES TO THE ANNUAL REPORT 2017 - 7
February March April May June July August September October November December
2017
2016
2017
20 18 16 14 12 10 8 6 4 2 0
7.0
60 50 40 30 20 10 0
2014 2015 2016 2017
3.7. Non-supplied energy (Elia Belgium)
400 300 200 100 0 2013 2014 2015 2016 2017
1 0.999995 0.99999 0.999985 0.99998
Energy not supplied (Mwh)
Onshore availability
Onshore availability represents the availability of the interface points between the Elia grid and the customer’s grid. It takes into account all the interruptions caused by intrinsic risks (weather, third parties, animal outside building, etc.) or by internal Elia problems (e.g. material failure, human error) which lasted more than three minutes, but excludes interruptions directly caused by Elia’s customers. This onshore availability is calculated as 1-(AIT (intern Elia + intrinsic risk)/#min in the year). Energy not supplied concerns all energy not supplied to our customers during interruptions caused by internal Elia problems which lasted more than three minutes. However, it does not take into account the impact of major events.
3.8. Quality of service split by voltage (Elia Belgium)
INTERRUPTIONS SPLIT HIGH AND LOW VOLTAGE
SPLIT OF AIT PER NETWORK
AIT
inter connection network (≥ 150kV)
The majority of interruptions take place on the local transmission network as most customers are connected to the local transmission grid rather than the interconnection grid. There is no trend explaining changes in the average interruption time (AIT) repartition.
AIT
ELIA ANNEXES TO THE ANNUAL REPORT 2017 - 8
500
2013 2014 2015 2016 2017 2013 2014 2015 2016 2017 40 30 20 10 0 100% 80% 60% 40% 20% 0% N° of incidents leading to interruptions on interconnection network N° of incidents leading to interruptions on local transmission network % of
within local transport network (< 150kV) % of
within
52% 30 38 36 26 30 48% 4 1010 12 11 64% 36% 35% 65% 87% 13% 97% 3%
4. Infrastructure management
4.1. Supply chain management
Elia has to comply with the European tendering rules. The application of these rules and other internal guide lines ensure that every supplier is treated in a non-discriminatory and transparent way and that the information sent is treated confidentially. The selection of the suppliers and the award of the different contracts are based on the evaluation of multiple criteria’s. The exposure to some social or environmental risks is mitigated by the fact that every purchase is performed by a multifunctional team, including specific representatives from envi ronmental and/ or safety representatives. Depending on the purchase, the selection and awarding criteria’s are adapted to ensure that the selected supplier has a supply chain that is compliant with the objectives and values of Elia. CSR elements are integrated in the tendering contract, as well as within the general purchasing condi tions, which are signed by the suppliers.
4.2. Number of suppliers in BelgiumEU vs non- EU
2015 2016 2017
Number of suppliers EU 2,325 2,282 2,374
Number of suppliers non EU 95 74 92
4.3. Split of yearly spend in Belgium within EU vs non-EU
ELIA ANNEXES TO THE ANNUAL REPORT 2017 - 9 0.91%0.71%1.43%
100%
95%
90% 85%
80%
99.09%99.29%98.57%
Non european supplier European supplier
2015 2016 2017
The procurement outside the EU countries is today very limited and the environmental impact is taken into account in the criteria’s. For the spend in 2017, 84.5% of the total purchases within non-EU countries were in the UK (the UK is an EU country, it just doesn’t have the single currency) and Switzerland and 7% within the US. Therefore, Elia complies with the high EU or Belgian standards in terms of environment, social responsibility and worker wellbeing. Moreover, the evaluation of the safety aspects is done separately since it is crucial for Elia to have suppliers on board that share the same view on the importance of safety. There is only limited impact on human rights violation for Elia as Elia’s activities are mainly based within Europe. Also the number of non-EU suppliers for Elia Belgium is limited to 92 of 2,374 suppliers and spending is even limited to 0.91% of the all total spending. The large majority of purchases in non-EU countries are IT and consultancy related. The same selection and awarding criteria are used as for the non- EU suppliers.
4.4. Total circuit length in km (Elia Belgium)
9,000 8,000 7,000 6,000 5,000 4,000 3,000 2,000 1,000 0
ELIA ANNEXES TO THE ANNUAL REPORT 2017 - 10 5,560 5,558 5,563 2,8742,852 2,932
Underground cabling (km)
Overhead lines (km)
2015 2016 2017
The length of overhead lines and underground cabling has remained stable over the years. No substantial increase in line length is expected as Elia is investing in the replacement of existing lines.
4.5. Number of substation locations (Elia Belgium)
Overall, the number of substations has remained stable, although some low-voltage (<70kV) local transmission substations are being replaced by substations for the interconnection network.
2016 815 2017 814 2015 817
5. HR
5.1. Total headcount (Elia Group – 2017)
5.1.1. Breakdown by company
1000 900
600 500
300 200
0
Transmission Eurogrid GmbH Gridlab GmbH Elia Grid International Germany Elia System Operations (ESO)
5.1.2. Breakdown by country (Elia Group – 2017)
Elia Belgium employees
Elia Assets (EA)
Engineering (EE)
EGI Belgium Eurogrid International (EI)
50Hertz employees
ELIA ANNEXES TO THE ANNUAL REPORT 2017 - 11
800 700
400
100
50Hertz
Elia
57%
43% 993 6 15 23 333 784 206 20 7
5.1.3. Breakdown by responsibility level and gender (Elia Group) – GRI 102-41
TOTAL HEADCOUNT BELGIUM
Men Women Men Women Men Women
2015 2016 2017
Director 4 2 4 3 5 3
Senior Manager 24 6 25 5 28 5
Direct leaders 354 85 352 89 405 105
White collars 638 135 643 131 656 143
700 600 500 400 300 200 100 0 700 600 500 400 300 200 100 0
TOTAL HEADCOUNT GERMANY
Men Women Men Women Men Women
2015 2016 2017
Director 7 0 7 0 8 0
Senior Manager 35 4 36 5 34 6
Direct leaders 62 12 72 14 78 15
White collars 619 184 649 193 699 197
Overall, we can see that 21% of German and 18% of Belgian employees are female. For direct leaders and above, 14% of German and 20% of Belgian employees are female. In 2017, 77% of German employees and all Belgian employees were covered by collective bargaining agreements.
Note that all technicians in Belgium and Germany are considered as white-collar workers. Consequently, there are no bluecollar workers.
ELIA ANNEXES TO THE ANNUAL REPORT 2017 - 12
5.2 Leavers by gender (Elia Belgium)
2017
Women Men
0
The number of employees leaving Elia has fallen over the years. In 2017, only 22 employees left the company, of which 6 were women and 16 were men. In terms of employee turnover, 2.6% of women left the Elia Group, compared with 1.6% of men. Employees aged between 30 and 50 were the biggest group of leavers. A third were younger than 30 and the remaining 10% were over 50.
Calculation method
The number of leavers is determined based on all employees leaving the company as a result of dismissal or resignation from 1 January to 31 December of the year concerned. Retiring employees are excluded from the scope. Employee turnover is determined based on all leavers divided by the total headcount on 31 December of the previous year. The employee turnover by age category is based on all leavers in the respective age category, divided by the total headcount on 31 December of the previous year.
5.3. Parental leave (Elia Belgium)
5.3.1. Gender split
Women Men
5.3.2. Split by type of parental leave
2015
Parental leave as a deduction of full time employment
Full time parental leave (≥ 1 month)
ELIA ANNEXES TO THE ANNUAL REPORT 2017 - 13 In 2017, 84 employees took parental leave, which is an increase compared to 2016. Of the employees taking parental leave, 58% opted for full-time parental leave while 42% took their parental leave as a reduction of their weekly working schedule. Interestingly, 66% of the employees who took parental leave in 2017 were men. We are also seeing an increase in the number of men taking parental leave each year.
5 10 15 20 25 30 10 20 30 40 50 60
2016 2017 100% 90% 80% 60% 40% 20% 0%
2016 2015 2017 2016 2015
6 28 26 22 16 56 44 36 28 30 9 12 55% 59% 58% 45% 41% 42%
5.4. Employee survey (Elia Belgium)
ELIA ANNEXES TO THE ANNUAL REPORT 2017 - 14 Commitment towards Elia clearly keeps increasing in 2017.
Likelihood to recommend
ORGANIZATIONAL COMMITMENT INDEX
80 81 85
Motivation of colleagues
71 72 74 77
Overall satisfaction
Job Engagement in Elia increases after a decade of stability. We observe increases for all index questions.
Recommendation of job
Identification Likelihood to re-apply
Perceived performance of employer in market
Involvement in job
JOB ENGAGEMENT INDEX
2004 2006 2008 2010 2012 2014 2017 79 79 79 80
81 81 84
2004 2006 2008 2010 2012 2014 2017
Fun in job
Importance of jobSatisfaction with job
Alignment with management increases vs. 2014.
Optimism about the future
Confidence in decisions taken by direction
ALIGNMENT INDEX
85 89
2004 2006 2008 2010 2012 2014 2017
Support strategy and orientation
Agility (or the ability to respond strategically to uncertainty) remains stable vs. 2014. Agility is lower than Organizational Commitment, Job Engagement & Alignment.
Understand relation between personal targets and targets of the company
Support change within the company
Cooperation between departments
AGILITY INDEX
64 65
Flexibility
2004 2006 2008 2010 2012 2014 2017
Awareness of market and circumstances Ease of taking decisionsDeveloping new activities
Understand the need for change
HIGH IMPACT
Ratio dedicated/detached improves vs. 2014. The company trend is one towards higher organizational commitment and dedication.
IMPACT
High HighLow
ENGAGED
DEDICATED
From an employee engagement perspective, primary focus of HR should be with evaluation, development opportunities & financial recognition.
FOCUS
DETACHED PRIMARY STRENGTH
Evaluation
Organizational commitment
Development opportunities
Financial recognition
Jobdate / MidYear
Work-life balance
Head of department
Executive Team Direct manager
Work environment / tools
Cooperation direct colleagues
IMPACT ON ORGANIZATIONAL COMMITMENT INDEX Job engagement SECONDARY STRENGTH
ELIA ANNEXES TO THE ANNUAL REPORT 2017 - 15 FOCUS
Cooperation other colleagues
PERFORMANCE (TOP 3 Extremely satisfied + Very satisfied + Satisfied)
BELONGERS 2012 2014 2017 2012 2014 2017 2012 2014 2017 2012 2014 2017 32 11 33 9 26 8 38 20 40 18 45 21 60 70 80 90 100 20 10 0
LOW
PRIMARY
SECONDARY
PRIMARY FOCUS AREAS
Development opportunities
Evaluation
SECONDARY FOCUS AREAS
Financial recognition
Marginal positive trends for most aspects related to development opportunities Biggest threat is lack of perceived opportunity for promotion, especially observed with smaller units. 31% hopes to be promoted in 2018
Attrition risk remains very low
Negative trend for overall satisfaction on evaluation
Link between evaluation and reward is primary focus point, especially within Infrastructure Development where it is linked with lower perceived objectivity of feedback
Satisfaction on financial recognition remains stable vs. 2014. Biggest driver is alignment between salary and performance
Some employees seem to be suspicious about their salary vs. that of their peers. Especially within Infrastructure Development there’s a lot of negativity concer ning salary vs. peers
Jobdate / MidYear
Work-life balance
Satisfaction on jobdate / MidYear remains similar vs. 2014. There’s some disagree ment about its usefulness.
Main improvement point is the level of actions taken to support development (especially within Infrastructure Development)
Satisfaction on work-life balance decreases vs. 2014. Workload is perceived as less feasible
Satisfaction on work-life balance is heavily impact by the attention Elia gives to it, which is in for improvement for some employees
There are specific concerns related to work-life balance within the different units: CM&S: workload as such; Infrastructure Development: home-work commute; within some smaller units: distribution of work within the team
ELIA ANNEXES TO THE ANNUAL REPORT 2017 - 16
5.5. New hires per age category (Elia Belgium)
100% 80% 60% 40% 20% 0
100% 90% 80% 70% 60% 50% 40% 30% 20% 10% 0
42,7%
2.1% 41.0%
3.8% 56.7%
9.3% 55.2% 55.1% 34.0%
2015 2016 2017
< 30 year 30 < 50 year ≥ 50 year
ELIA ANNEXES TO THE ANNUAL REPORT 2017 - 17 These graphs on new hires include all new employees within the planned budget and all the employees that were recruited as additions to the original budget. Changes in positions are not included.
5.6. Employee turnover per age category (Elia Belgium) 57% 68%
10%11%7%
60% 33.3% 21.6% 33.3%
2015 2016 2017
5.7. Average number of sick days per employee (Elia Belgium)
10.00 8.00 6.00 4.00 2.00
0.00
9.51 8.69
10.31
< 30 year 30 < 50 year ≥ 50 year
number of sick days
2015 2016 2017
In general, employees had 10 sick days in 2017, which is in line with the previous years. Calculation method: The average sick days per employee is calculated based on the total number of sick days divided by the total headcount on 31 December of the previous year.
6. Public acceptance (focused on environment and biodiversity)
6.1. Energy consumption within the organisation (Elia Belgium – 2017)
Green energy non-core network (kWh)
2,799,000 4,250,000
Green energy core network (kWh)
6.2. Number of projects for which impact is monitored (Elia Belgium)
2017 2016 2015
0% 10% 20% 30% 40% 50% 60% 70% 80% 90% 100%
6.3. Protecting birds by installing markers (Elia Belgium)
Since 2016, Elia has installed bird markers on 13.62 km of lines.
Installed in length in m 2016 2017
Stevin - Gezelle 7,180 m.
Langerlo - Sikel 3,110 m.
Rodenhuize - Langerbrugge 2,430 m.
Herderen - Lixhe 900 m.
Total 4,010 m. 9,610 m.
With the help of Belgium’s leading environmental associations, Elia has identified the 130 sections of its network of overhead lines that pose the greatest hazard to birdlife. Measuring 200 km in total, they will gradually be fitted with bird anti-collision devices over the next 10 years. If a project is due to take place on these sections, markers will be installed immediately. For sections without projects, we will take advantage of scheduled inter ventions to fit markers on the conductors or earth wires.
Birdlife Soundscape Flora
ELIA ANNEXES TO THE ANNUAL REPORT 2017 - 18
6.4. Sustainable integration of facilities in the Stevin project (Elia Belgium)
During the Stevin project, Elia worked hard to minimise the impact of its facilities on the landscape by planting large numbers of trees and shrubs.
Planted in
length in m 2015 2016 2017
Trees (every 10 m) 1,430 3,920 3,560
Pollard (every 7 m) 987 1,302 1,197
Cropped hedge 187 1,385 1,050
Uncropped hedge 577 2,070 1,417
Wooded border 653 1,104 985
6.5. Annual implementation budget for the Elia-RTE LIFE project (Elia Belgium)
Fixed amount spent per year on the realization of the ELIA life project
€ 505,529
Since 2015, Elia has had a fixed annual budget of €505,529 for the Elia-RTE LIFE project, which seeks to transform the spaces beneath Elia’s high-voltage lines into corridors for diversity. With this budget, Elia is restoring natural habitats for fauna and flora at Natura 2000 and other sites.
The Elia-RTE LIFE project ended in December 2017 but Elia has decided to continue the work by launching LIFE 2, despite no longer receiving funding from the European Commission and the Walloon Region.
6.6. Electromagnetic fields (Elia Belgium)
Upon request, Elia offers free electromagnetic field measurements to the owners of land and buildings located near Elia facilities. Each year, €370,000 is spent on scientific research into the impact of low-frequency magnetic fields.
6.6.1. Number of electromagnetic field measurements performed (Elia Belgium)
ELIA ANNEXES TO THE ANNUAL REPORT 2017 - 19
2016 € 505,529 2017 € 505,529 2015
0 50 100 150 200 250 2017 2016 2015 207 141 100
6.7. Requests for information handled (Elia Belgium)
2015 2016 2017
Received 80 54 56
Handled 80 54 56
Elia’s central contact centre receives numerous questions about the company’s activities each day, some rela ting to environmental topics. In 2016, 194 questions about electromagnetic fields (EMFs) were received, and 140 measurements* were performed. For the other 54 requests, only information was provided.
The number of requests was roughly the same in 2016 and 2017, down on the number received in 2015. There is no specific explanation for this difference, but generally speaking we see an increase in requests following media attention and/or the launch of a major grid project.
Each year, €370,000 is spent on scientific research analysing the impact of low-frequency magnetic fields. The amount is fixed as Elia has contracts with the Belgian BioElectroMagnetics Group (BBEMG) and the Electric Power Research Institute (EPRI).
*These measurements are based on third-party requests received at the contact centre.
6.8. Carbon assessment (Elia Belgium)
Elia has been conducting a carbon assessment since 2010 to identify direct and indirect emissions from its activities and is taking steps to reduce greenhouse gas emissions from its activities.
Scope 1 Direct emissions
Scope 2
Indirect emissions
Grid losses 81.92%
Scope 3
Indirect emissions
• Assets & Network 10.20%
• Business travel 0.89%
• Buildings 0.35%
• IT materials 0.27%
• Employee commuting 0.25%
• Fixed assets company cars/vans 0.20%
0.40%
• Waste 0.1 7 %
• Visitors 0.09%
• Food consumption 0.07%
• Oil purchase 0.01 %
• Paper & Ink consumption 0.01 %
-
ELIA ANNEXES TO THE ANNUAL REPORT 2017 - 20
5.16 % 82.32 % 12.51 % Émissions directes - scope 1 5,16% Émissions indirectes - scope 2 82,32% Émissions indirectes
scope 3 12,51%
•
• Green Electricity
• Heating 0.00% • SF6 Leakage 3.71% • Company used fleet 1.11% • Natural Gas 0.32% • Airconditioning 0.00% 2017 18,087 TeqCo2 306,512 TeqCo2 43,840 TeqCo2 2016 14,086 TeqCo2 278,119 TeqCo2 40,441 TeqCo2 2015 15,318 TeqCo2 269,254 TeqCo2 40,590 TeqCo2
6.9. Client information and complaints requests (Elia Belgium)
2015
Number of information requests
Number of Client complaints
These figures represent all information requests and complaints regarding the electric quality of service (power quality). The positive trends between 2015 and 2016 are mainly due to a better internal reporting improved follow-up and the centralisation of requests from DSOs. Complaints were stable in 2015 and 2016. The big increase of complaints in 2017 is due to one incident, which resulted in 61 complaints from DSO users. The decrease in information requests can be explained by a decline in incident numbers (from 445 to 379).
6.9.1. Customer Satisfaction Survey
Every two years, Elia measures the customer satisfaction level among its key stakeholders (distribution system operators, grid users, producers, access responsible parties, User’s Group ,…). The main objectives of this survey are to provide an overview of the Key Performance Indicators (KPIs) related to service quality and their evolution over time.
The latest surveys were conducted in 2016 with 252 stakeholders. The KPIs measured were the Elia Satisfaction Index, reflecting how stakeholders evaluate the products and services of Elia in general, the Customer Effort Score, reflecting the ease of doing business with Elia, the customer satisfaction regarding account management and image etc. The overall aim is to identify strengths and weaknesses among the different stakeholders in order to further optimize the customer relationship.
With regards to the Elia Satisfaction Index, Elia scored 67%, reflecting the high quality of products and services. The majority of the stakeholders still describe collaboration with Elia as “easy”. Compared to 2014, there is a very positive evaluation of Elia’s Key Account Managers, with a significant increase in the satisfaction about Elia’s ability to think along with its stakeholders. Regarding image, there were stable results for Elia’s expertise and communication.
The survey highlighted the strengths that need to be maintained and priorities were set to further improve stakeholder satisfaction.
6.9.2. Requests received & handled at Contact Centre
Each year, Elia receives approximately 75,000 requests for information concerning high-voltage network installations. These enquiries come from a range of sources including local residents, contractors, engineering firms, public authorities, utilities and project developers. The company has defined response times, based on statutory time frames, within which the Contact Centre must answer requests for information. For example, the standard deadline for responding to routine requests is 7 working days from receipt. In 2017, 99.91% of all requests were answered within the set times.
ELIA ANNEXES TO THE ANNUAL REPORT 2017 - 21
2016 2017 250 200 150 100 50 0
131 197 160 11 7 76
2015 2016 2017 78,413 75,581 74,040
7. GRI reference table
This annual report has been prepared in accordance with the Global Reporting Initiative (GRI) Standards: Core option. It is the Elia Group’s first annual integrated report and covers the period from 1 January 2017 to 31 December 2017.
GRI 102: General information 2017
1. Organizational Profile
102-1 Name of the organization p. 8-11 102-2 Activities, brands, products, and services p. 12-13
102-3 Location of headquarters p. 10
102-4 Location of operations p. 10
102-5 Ownership and legal form p. 11
102-6 Markets served p. 14-19
102-7 Scale of the organization p. 12-13
102-8 Information on employees and other workers Annex part 5
102-9 Supply chain p. 2 & p. 40-51
102-10 Significant changes to the organization and its supply chain p. 40-51
102-11 Precautionary Principle or approach p. 29-37
102-12 External initiatives p. 60-63
102-13 Membership of associations p. 52-63
2. Strategy
102-14 Statement from senior decision-maker p. 4-7
102-15 Key impacts, risks, and opportunities p. 4-7
3. Ethics and integrity
102-16 Values, principles, standards, and norms of behavior p. 120
102-17 Mechanisms for advice and concerns about ethics p. 120
4. Governance
102-18 Governance structure p. 102-103
102-19 Delegating authority p. 122
5. Stakeholder engagement
102-40 List of stakeholder groups p. 2
102-41 Collective bargaining agreements Annex part 5.1.3
102-42 Identifying and selecting stakeholders p. 25
102-43 Approach to stakeholder engagement p. 25 & p. 80
102-44 Key topics and concerns raised p. 14-19 & p. 23-25
6. Reporting principles
102-45 Entities included in the consolidated financial statements p. 10-11
102-46 Defining report content and topic Boundaries p. 23-25
102-47 List of material topics p. 23-25
ELIA ANNEXES TO THE ANNUAL REPORT 2017 - 22
102-48 Restatements of information
102-49 Changes in reporting
102-50 Reporting period
There are no restatements of information provided in previous reports.
The annual report 2017 is the first integrated annual reporting in line with the GRI - Core principles.
Fiscal year 2017
102-51 Date of most recent report Annual report 2017
102-52 Reporting cycle Annual reporting cycle
102-53 Contact point for questions regarding the report Marleen Vanhecke External Communications & External Relations marleen.vanhecke@elia.be
102-54 Claims of reporting in accordance with the GRI Standards
102-55 GRI content index Annex part 7
GRI 103: Identified Material Aspects and Boundaries
103-1 Explanation of the material topic and its Boundary p. 23-25
103-2 The management approach and its components p. 23-25
103-3 Evaluation of the management approach p. 23-25
GRI 201: Economic performance
201-1 Direct economic value generated and distributed p. 12-13
201-2 Financial implications and other risks and opportunities for the organisation’s activities due to climate change
GRI 203: Indirect economic impacts
p. 12-13 & p. 116-119
This Annual report has been prepared in accordance with the GRI Standards: Core option.
203-1 Development and impact of infrastructure investments and services supported p. 28-37
203-2 Significant indirect economic impacts, including the extent of impacts p. 28-37
GRI 204: Procurement practices
204-1 Proportion of spending on local suppliers Annex part 4.2 & 4.3
GRI 205: Anti-Corruption
205-1 Total number and percentage of operations assessed for risks related to corruption and the significant risks identified
p.120-123
205-2 Communication and training on anticorruption policies and procedures p.120-123
205-3 Confirmed incidents of corruption and actions taken
GRI 206: Anti-competitive behaviour
206-1 Legal actions for anti-competitive behaviour, antitrust, and monopoly practices
GRI 302: Energy
302-1 Energy consumption within the organisation Annex part 6.1
No incidents of corruption occurred during the reporting period.
No legal actions pending or completed during the reporting year.
ELIA ANNEXES TO THE ANNUAL REPORT 2017 - 23 302-2 Energy consumption outside of the organisation Annex part 6.1
GRI 304: Biodiversity
304-1 Operational sites owned, leased, managed in, or adjacent to, protected areas and areas of high biodiversity value outside protected areas
p. 66-81
304-2 Significant impacts of activities, products, and services on biodiversity p. 66-81
304-3 Habitats protected or restored p. 66-81
GRI 305: Emissions
305-1 Direct greenhouse gas (GHG) emissions (Scope 1) p. 74-75 Annex part 6.8
305-2 Energy indirect greenhouse gas (GHG) emissions (Scope 2) p. 74-75 Annex part 6.8
305-3 Other indirect greenhouse gas (GHG) emissions (Scope 3) p. 74-75 Annex part 6.8
305-5 Reduction of greenhouse gas (GHG) emissions p. 74-75 Annex part 6.8
GRI 307: Environmental compliance
307-1 Non-compliance with environmental laws and regulations
GRI 308: Supplier Environmental Assessment
308-2 Significant actual and potential negative environmental impacts in the supply chain and actions taken
GRI 401: Employment
Annex part 4.1-4.3
The organisation has not identified any significant non-compliance with environmental laws and/or regulations.
401-1 Total number and rates of new employee hires and employee turnover by age group, gender and region Annex part 5.2 & 5.6
401-2 Benefits provided to full-time employees that are not provided to temporary or part-time employees, by significant locations of operation
401-3 Return to work and retention rates after parental leave, by gender Annex part 5.3
GRI 402: Labor/Management Relations
402-1 Percentage of total workforce represented in formal joint management - worker health and safety committees that help monitor and advise on occupational health and safety programmes
GRI 403: Occupational Health and Safety
403-2 Type of injury and rates of injury, occupational diseases, lost days, and absenteeism, and total number of work-related fatalities, by region and by gender
p. 31-32 & p. 37
There are no differences between the benefits provided to full-time and part-time employees.
403-3 Workers with high incidence or high risk of diseases related to their occupation p. 31-32 & p. 37
GRI 404: Training and Education
404-1 Average hours of training per year per employee by gender, and by employee category p. 86-87
This body (joint committee) exists in both countries but the percentage of workforce represented is immaterial, less than 1%.
ELIA ANNEXES TO THE ANNUAL REPORT 2017 - 24
GRI 405: Diversity and Equal Opportunity
405-1 Composition of governance bodies and breakdown of employees per employee category according to gender, age group, minority group membership, and other indicators of diversity
GRI 406: Non-Discrimination
406-1 Total number of incidents of discrimination and corrective actions taken
GRI 416: Customer Health and Safety
416-1
Assessment of the health and safety impacts of product and service categories
416-2 Incidents of non-compliance concerning the health and safety impacts of products and services
GRI 417: Marketing and Labeling
GRI 419: Socio economic Compliance
419-1 Monetary value of significant fines for non-compliance with laws and regulations in the social and economic area
Electric Utilities Specific
EU4 Length of above and underground transmission and distribution lines by regulatory regime
p. 103 & p. 109 Annex part 5.1.3
p. 28-29 & p. 74
417 Results of surveys measuring customer satisfaction p. 89-90
The organisation has not identified any incidents of discrimination during the reporting period.
p. 12 & p. 39 Annex part 4.4
G4-DMA Management approach to ensure short and longterm electricity availability and reliability p. 14-19
G4-DMA Demand-side management programs including residential, commercial, institutional and industrial programs
EU12 Transmission and distribution losses as a percentage of total energy p. 37 Annex part 6.8
EN12 Description of significant impacts of activities, products, and services on biodiversity in protected areas and areas of high biodiversity value outside protected area
LA4 Report on health and safety performance of contractors and subcontractors working onsite or on behalf of the reporting organisation off site
p. 14-19
The organisation has not identified any non-compliance with regulations and/or voluntary codes.
p. 67-81
During the reporting year the company did not receive any significant fines or non-monetary sanctions for non-compliance with laws and/or regulations in the social and economic area.
ELIA ANNEXES TO THE ANNUAL REPORT 2017 - 25 p. 29-31 & p. 37
EU28 Power outage frequency Annex part 3.7, 3.8 & 3.9
EU29 Average power outage duration Annex part 3.7, 3.8 & 3.9