FOR AUSTRALIAN AGRICULTURE


2022 Elders Annual Report Elders Limited ABN 34 004 336 636
1 Contents Chair's Report 2 CEO’s Report 4 Year in Brief 6 Operating and Financial Review 10 Review of Operations 22 Sustainability 34 Directors’ Report 42 Remuneration Report 50 Executive Management 70 Elders Limited Annual Financial Report 76 Shareholder Information 136 Company Directory 137
1
Chair’s Report
lders has thrived in this environment and createdexceptional value for shareholders as a result. While environmental factors affecting commodities have a direct correlation with our performance, the results presented in this Annual Report are also the product of the hard work of the lders team and its dedication to the interests of our customers. Our adherence to the ight Point Plan, and the commitment of the network team to consistently deliver the best service in rural Australia, has allowed us to record this exceptional result.
In addition, during the course of the financial year, we acquired 13 businesses with 10 new locations and 115 new employees, improving our geographic spread to service more clients. he business development pipeline for FY23 is encouraging with numerous successful businesses expected to oin lders in the next 12 months.
Australian agriculture is in a strong position. ood seasonal conditions, strong commodity prices, and record demand or Australian agricultural products are all contributing to a very avourable production environment and a sense o confidence and excitement or t e years a ead.
he world’s population is pro ected to increase by 2 billion people in the next 30 years 1 , dramaticallygrowing from almost 8 billion currently to 9.7 billion in 20501 . his population growthtogether with global instability put added pressure on food production and these factors call on Australian farmers to continue to increase productivity. Our industry’s ambition of reaching pre-farmgate value of $100 billion2 by 2030 has never been more relevant.
lders is at the forefront of this growth, supplying goods and services to thousands of farmers across the country and assisting them to improve their production quality and quantity. We have an opportunity to sustainably grow our business and our sector to deliver more value to Australian farmers, consumers, and industry stakeholders.
Reinvestment is an important part of our growth strategy. his year lders announced its new wool handling business which is a clear demonstration of confidence in the future of this unique fibre. his significant investment will help to make the wool industry more efficient and more sustainable.
We also continue to invest in our people. he Food Supply Chain Alliance recently stated the food supply chain is short at least 172,000 people3. abour is crucial to achieving our goals, and shortages in our sector mean we need to attract talent across every area of our business. he need to encourage diversity in our sector has never been so pertinent we need to ensure we hire and retain talent from across a broad spectrum of individuals.
Women are underrepresented in our industry, withdata showing women make up only 32% of the agricultural workforce4. lders is committed to changing this with a focus on diversity, equity and inclusion. his year we refreshed our Diversity and Inclusion ob ectives regarding the representation of women in management positions, implemented equal gender composition on learning and development programs and in early careers recruitment, created policy changes to reflect inclusion, and introduced unconscious bias training at the frontline leadership level.
lders is a partner of the National Farmer’s Federation Diversity in Agriculture eadership program, which involves committing to meaningful change towards gender diversity within lders and more broadly in the agriculture industry.
nited ations, lo al ss es Po lation, 2022.
2 ational Far ers Federation, 2030 oad a stralian ric lt re s Plan or a $100 illion nd str , 2020.
3 ational Far ers Federation, n recedented la o r crisis across stralia s ood s l c ain, 2022.
4 De art ent o ric lt re, Fiseries and Forestr , na sot o stralia s ric lt ral or orce.

Elders Annual Report
5
The representation of women in management is an important measure for us to track the success of our diversity strategy. In the coming year we are striving to get closer to our target of 25% women in leadership positions by 2025. This figure currently sits at 17%. Our representation of women in Non-Executive Director roles and Senior Executive positions remain steady at 60% and 42% respectively.
There is much work to be done and Elders acknowledges it has a key role to play in improving participation of the underrepresented in our workforce.
With so many opportunities ahead, there is a feeling of optimism in the agriculture sector. The Australian Bureau of Agricultural and Resource Economics and Sciences (ABARES) is predicting the gross value of agricultural production to exceed $80 billion in 2022-23 and for favourable conditions to persist5 Farmland values continue to increase, showing genuine confidence in agriculture as a safe and reliable asset class for investors6. Recent APRA findings support this increased investment in agricultural assets, with a 6% overall increase in lending to the farm sector in 2020-217
It’s not possible to speak about the successes of Elders without referencing the progress we are making towards being a more sustainable business. This year Elders publishes its third Sustainability Report, tracking progress towards our ambitions to be a leader in sustainability for the agricultural sector, and an adopter of the best governance and sustainability standards practised in corporate Australia.
We continue to support a wide range of organisations that each contribute to the richness and vitality of rural and regional communities around Australia. Strengthening regional Australia is important to us, and our clients, which is why we have joined the Regional Australia Council, to offer our support and expertise as well as make our own commitments to its development.
It is evident that Elders plays a crucial role, not just in the agricultural sector, but to Australian livelihoods, the economy, and the global food supply chain. I am pleased to say your company is in good shape financially, which will allow it to continue in this role into the future and bring value to shareholders.
I would like to thank my fellow directors for their support and all Elders team members for their great efforts and dedication throughout the year.
Your Chair, Ian Wilton Chair
Department of Agriculture, Fisheries and Forestry, Agricultural overview: September quarter 2022.
6 Elders, Elders Rural Property Update Q2 April - June 2022.
7 Department of Agriculture, Fisheries and Forestry, Agricultural lending data 2020-21.
Chair's Report 3
CEO’s Report
rand
I am proud to share that lders has maintained itsposition as rural Australia’s most trusted agribusiness by farmers, according to Roy Morgan brand trust research. lders is a trusted partner to Australian farming enterprises, delivering products, services, and advice to assist them in improving the productivity of their businesses. We occupy this privileged position as a result of the passion and commitment of our industry-leading workforce which is there for our clients and communities in every season.
xceptional financial per ormance
lders as muc to be proud o t is year. e business as per ormed remar ably well, ma ing significant progress on its strategic ambitions and contributing to a t riving agriculture sector.
In FY22 our underlying earnings before interest and tax ( BI ) was $232.1 million, an increase of 39%. We have seen steady growth across all of our core product and geographic areas, contributing to this result, which is testament to our business improvement initiatives.
lders’ performance this year reflects the continued commitment to improvement and growth in accordance with our ight Point Plan, coupled with excellent seasonal and market conditions. We have made both product and geographically strategic acquisitions and continued to grow our business organically across the country. Our ongoing rural products backward integration strategy and execution of supply chain efficiency initiatives has continued to deliver margin growth.
We have not compromised our unflinching financial discipline in achieving this growth, with our commitment to cost and capital efficiency reflected in underlying return on capital (ROC) of 26.2% up from 22.5% in FY21 and outperforming our benchmark target of 15%.
ey highlights of the FY22 results include: Sales of $3445.3 million, up 35% ross margin of $652.7 million, up 23%
Rural Products gross margin of $383.1 million, up 35%, including 53% growth in gross margin contribution from our fertiliser sales, where we continue to grow margins through supply chain efficiency, dynamic pricing and other business improvement initiatives
Agency Services contributed gross margin of $147.0 million, up 4%
Real state gross margin of $61.6 million, up 21% with growth across farmland sales, residential sales and property management Financial Services contributed gross margin of $44.2 million, up 7%, with growth in insurance and I delivery warranty Feed and Processing Services gross margin of $16.8 million, up 33%benefitting from improved efficiency and innovation at illara Feedlot

Improvement of leverage, interest cover and gearing ratios
Sa ety and wellbeing
While we have en oyed the return of many in-person events, allowing our employees to reconnect with clients and industry after a significant hiatus caused by the pandemic, lders has maintained a safety-first approach to protecting its employees. Adherence to COVID-19 guidelines and best practice has been a priority to ensure the health of all members of the community is protected. We have had a staggered return to offices and branches, encouraging work from home arrangements where possible to contribute to the public effort to minimise the spread of COVID-19. he ability of our team to remain nimble and maintain the highest level of service to our clients throughout this period has been commendable.
Elders Annual Report
We had 6 Lost Time Injuries (LTI) this year.
Any harm to our employees is unacceptable and we strive for a zero-harm workplace. Our commitment to safety has been backed by a $3.3 million investment in our network to provide sufficient chemical storage controls, upgraded racking and new purpose-built branches. Elders also invested $365k in pallet wrappers and drum jib lifters, and is trialling improved in-vehicle safety systems.
With the assistance of our employee Wellbeing Committee, this year we reviewed our current risk controls around psychosocial hazards and trained selected staff in mental health first aid, with further investment to be made. In addition to these initiatives, Elders is in the process of implementing a plan for all branches to host a defibrillator, so that any employee or member of the community can access this potentially life-saving equipment in an emergency.
Sustainability and innovation
Elders' commitment to sustainability is one of our top priorities and I am pleased to share that we have made significant inroads across all facets of our sustainability strategy. Across our network we allocated $2.7 million to sponsorships and donations, directing the majority of our spend to local community groups, agriculture industry and innovation and health and wellbeing initiatives. At a grassroots level, these investments have significant and lasting impacts on the vitality and connectedness of rural communities.
Our dedication to managing our environmental impact deepened in 2022. One example has been our focus on improving waste management. We joined the Australian Packaging Covenant Organisation and our branches collected 1,600 small and 50,000 bulk chemical containers from farmers for recycling. We also undertook further analysis of our waste management approach, with the objective of developing a national waste management strategy that will enable us to better manage our impact.
Innovation is an essential driver of the agricultural sector achieving its ambitions of $100 billion pre-farmgate output by 2030. Elders continues to partner with industry bodies and research institutions, both in our network and the Thomas Elder Institute, to bridge the gap between research and on-farm adoption of technologies and techniques that have proven benefits to productivity. AgTech remains an important contributor to improving farming productivity and this year we partnered with providers that assist producers with a range of innovations from farm management tools to remote water monitoring, soil moisture probes and remote sensing satellite imagery.
Over the coming months and years we’re changing our ways of working through a significant systems modernisation project. Early in 2023, Elders will unveil a brand-new website, which will deliver a seamless and convenient experience, with the customer at the centre, and e-commerce capabilities in the future.
The Elders values of teamwork and innovation will be brought to the forefront with a transformed internal digital landscape through a new intranet that will significantly improve our communication and operations. Our core business systems will be evolving, future proofing us and laying solid foundations to maintain growth and strong relationships with customers, community, and our own people.
These changes will be implemented across finance, operations and human resources platforms making them far more accessible and useable. Additionally, we’ll build talent and capability across Elders, with leaders accessing integrated information for a clearer real time picture of the organisation, optimising our workforce, and removing capability gaps. Elders’ customers will experience the benefits of these improved ways of working and of the increased capacity of our people.
Full details on our targets and strategy can be found in our Sustainability Report, available at Elders Investor Centre
Growth and reinvestment
As the Elders network expands through recruitment and the acquisition of businesses that fill strategic or geographical gaps, our focus on our people becomes increasingly important. This year, Elders achieved all-time high results in our employee effectiveness survey, well above the global high performing benchmark. The results showed an increase in both markers: the level to which our employees are engaged, committed and willing to go the extra mile, and enabled, possessing the resources and support to do their job. As CEO I am encouraged by these results, assured that we are doing the right things in our business to support our employees.
I am also motivated to ensure that we continue to be an employer of choice in our sector and offer a desirable value proposition in a competitive recruitment market. Retention is just one part of our strategy to employ the best people, which is why we have reinvested and re-envisioned our Early Careers Program which encapsulates a range of pathways across our business for the next generation of agribusiness professionals.
Reinvestment in our people, business and industry, is an important part of ensuring that Elders continues to grow and thrive.
In this vein, we announced the launch of Elders Wool Handling, scheduled for launch in 2023, which will see a significant investment in improving the wool supply chain and offering end to end service for our clients with improved efficiency and ease. Complementing Elders’ existing wool offering, the new business and its associated facilities, will be industryleading in terms of capabilities, safety and environmental credentials, and approach to supply chain optimisation.
As we grow, it is imperative that we continue to invest in developing our existing team and maintaining our One Elders culture. We have numerous personal and professional development initiatives in the business ranging from our traineeships through to our senior leaders development program, known as the Thomas Elder Academy. Notwithstanding ongoing COVID-19 restrictions, we have successfully maintained engagement with our people, as demonstrated by our high performance enablement and engagement scores.
This is a credit to the leadership group throughout the business and I thank them for their commitment to our people during these challenging times.
Looking forward
Elders has once again generated excellent results for our shareholders in 2022 and deepened its position as the most trusted partner to Australian farmers. Having said that, there are still many opportunities to grow and improve our business, and further enhance our value proposition to rural Australia. I wish to thank the entire Elders team for their contribution to achieving these results and their commitment to delivering on these ambitions moving forward.
Mark C Allison Managing Director and CEO
CEO’s Report 5


6 LOST TIME INJURIES #1 MOST TRUSTED AGRIBUSINESS BRAND 79% EMPLOYEE ENGAGEMENT 49 NET PROMOTER SCORE Elders Annual Report
YEAR IN BRIEF $3.4b Sales revenue Up 35% on FY21 Results 64% Cost to earn ratio Down 5% on FY21 Results 97.3c Underlying earnings per share Up 1% on FY21 Results $232m Underlying EBIT Up 39% on FY21 Results $653m Gross margin Up 23% on FY21 Results 26% Return on capital Up 3.7% on FY21 Results 56.0c Dividend per share Up 33% on FY21 Results 75% Cash conversion Down 19% on FY21 Results Year in Brief
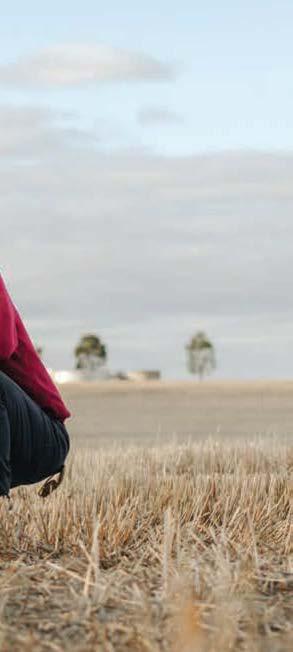
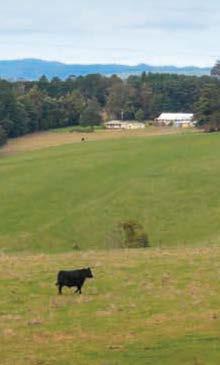
A healthy future For Australian wool
In the early days of wool production in Australia, Elder, Smith & Co, owned and ran several pastoral properties, shearing an estimated 1.5 million sheep in the early 1880’s. During this time, wool was an important export commodity for the growing colony and Australia became the largest producer of wool in the world.
In 2021/22 Australia exported $3.3 billion of wool1; the fibre remains a world-renowned and sought-after product due to its natural properties which include insulation, fire resistance, hardiness and stretch.
While the sector might be steeped in tradition, it is far from backward. Wool has an impressive list of environmentally friendly credentials and is being transitioned by some of the industry’s sharpest minds who are passionate about the fibre’s ecofriendly credentials, its ability to be grown and sourced sustainably, and who service international markets that are increasingly driven by consumers who demand transparency and traceability.
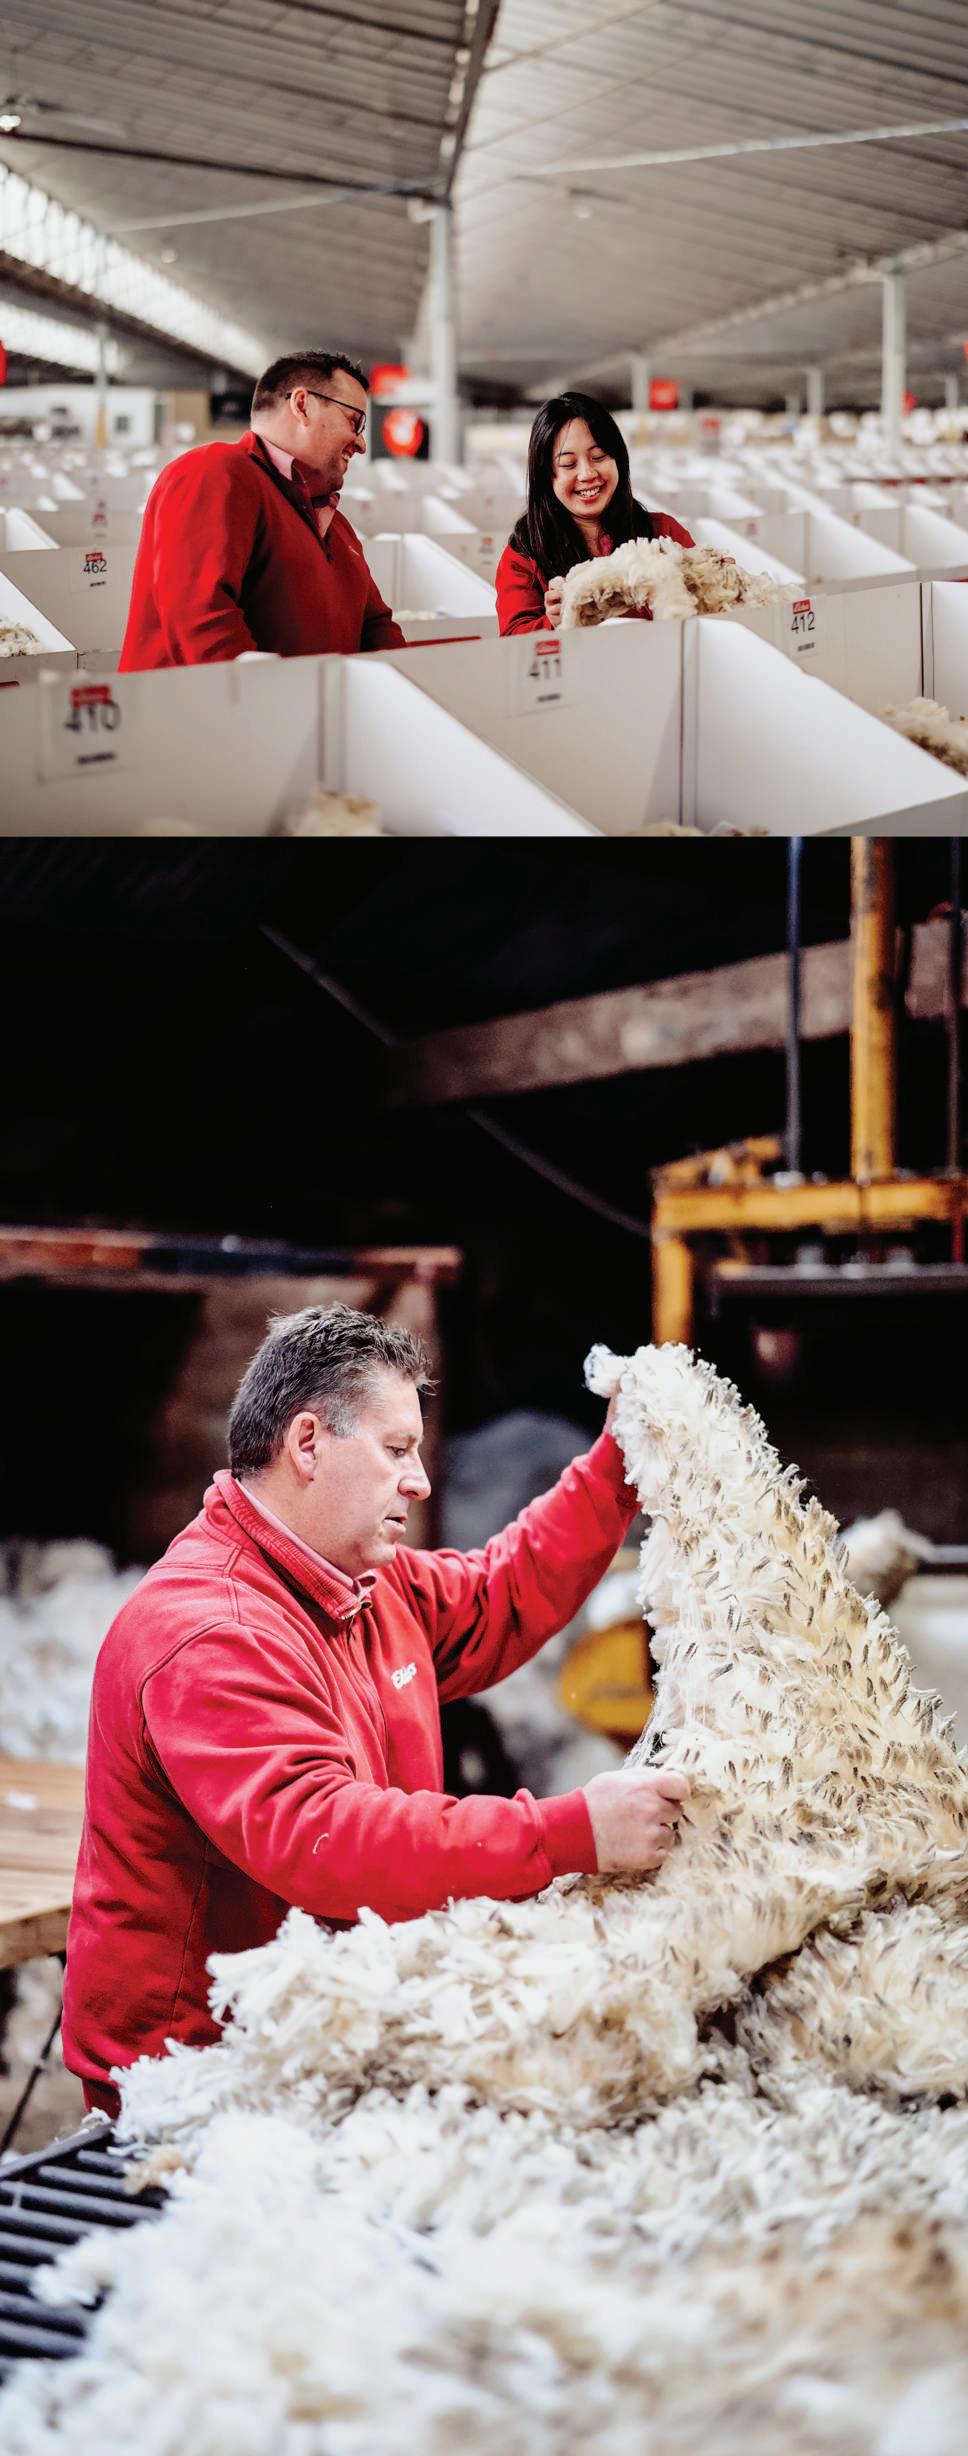
Samantha Wan is the Wool Quality Assurance & Marketing Manager at Elders’ Wool Selling Centre in Melbourne. She acts as a point of contact for growers and district wool managers, assisting them with key decision making.
“It’s important for Australia to keep an eye on this industry that is changing every day,” said Samantha.
“Consumers are driving the wool market to become increasingly accountable, traceable and sustainable, which means we have opportunities to implement techniques and programs with our clients that make their product more sellable, and often, more able to earn premiums on a clip.”
One of the programs that Samantha refers to is the Responsible Wool Standard (RWS) which is an international, voluntary standard that addresses animal welfare in sheep farms and the chain of custody of wool from farm to final product. Individual sites are certified by independent bodies, and material is then tracked from the farm to the final product using transaction certificates.
Elders is a leader in providing consultation to clients to support them in becoming RWS accredited, with a growing number of RWS accredited clips being sold each month across the country.
“Supporting our clients, whether to achieve accreditation, transition to non-mulesing, or improve their safety or productivity practices in other ways, are all examples of how Elders is doing more to support farming businesses,” said Samantha.
“We have to look at the entire supply chain to find opportunities where we can add value as professionals, but also as industry participants who want the sheep and wool sector to enjoy success for generations to come.”
Samantha has her own list of credentials as winner of the Broker Award from the National Council of Wool Selling Brokers of Australia in 2019, Elders Employee of the Year award in 2018, and the title Youth Ambassador for WoolProducers Australia, just to name a few. While she seems a natural fit to the industry, Samantha doesn’t have an agricultural background, and has driven her own success by seeking out experiences and opportunities, learning from the network around her, and recognising that her unique skillset is an asset.
“If we keep looking for the same people to do the same things, we will never change.
I’m fortunate that I have always had senior members of my team backing me, giving me confidence,” she said.
People like Samantha are helping to take the wool industry forward and are crucial advocates for pursuing a career in the sector. In July 2022, Elders announced a significant investment in the industry with the Elders Wool Handling business to launch in 2023.
“Elders Wool Handling is showing that we’re not just brokers, we are a solid and invested part of the supply-chain. The pro-activeness of this business decision is important to show the next generation that we have something great to showcase,” said Samantha.
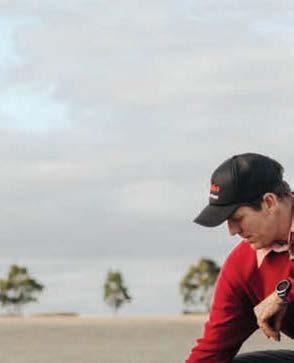
For Matthew Tattersall, Wool Technical Manager, the new business is a keen reflection of the optimism felt in the sector.
“There are major benefits for growers, including being able to manage their businesses better by having easier access to information,” said Matthew.
“These efficiency gains will be felt well past the farmgate, with central facilities making the shipping and handling process faster and easier and putting product in the hands of buyers sooner.”
Matthew said the wool sector is developing a keener interest in ethical production which is helping to drive change.
“Wool is already seen as a clean and natural fibre but we are seeing an evolution of our industry toward a more sustainable model, driven by consumer demand. The welfare of workers in wool, the animals and the land on which wool is grown, is being prioritised more than ever before.
The combination of this, with changing infrastructure and investment in the supply chain through Elders’ new wool handling business, are all signs that wool has a healthy future.”
1 Rural Bank, Australian agricultural trade 2021/22.
Elders 2022 Annual Report 8
Elders has played a pioneering role in the Australian wool industry since its infancy.
Samantha Wan Wool Quality Assurance & Marketing Manager, Elders' Wool Selling Centre Melbourne
“We have to look at the entire supply chain to find opportunities where we can add value as professionals, but also as industry participants who want the sheep and wool sector to enjoy success for generations to come.”


OPERATING & FINANCIAL REVIEW 2022


Operating and Financial Review
During the year ended 30 September 2022, all our key products and geographies outperformed the prior year, reflecting the implementation of our Eight Point Plan business improvement initiatives and successful integration of our strategic acquisitions, which allowed us to take advantage of excellent seasonal and market conditions.
Geographical and product diversity enabled Elders to overcome headwinds from localised unfavourable weather events in many regions, while supply chain efficiency initiatives and our backward integration strategy continue to support margin growth.
Operations
Elders is focused on creating value for all its people, customers, community and shareholders in Australia and internationally.
We achieve this with the expertise and dedication of over 2,500 employees and an ongoing commitment to safety, sustainability and diversity.
In Australia, Elders works closely with primary producers to provide products, marketing options and specialist technical advice across rural, wholesale, agency and financial product and service categories.
Elders is also a leading Australian rural and residential property agency and management network. This network includes both company owned and franchise offices operating throughout Australia in both major population centres and regional areas.
Our feed and processing business operates a best practice beef cattle feedlot in New South Wales.
Strategy
Elders' strategic framework is governed by our three-year Eight Point Plan.
Our ambitions to FY23 include:
• achieving compelling shareholder returns (5-10% EBIT and EPS growth through the cycles and minimum 15% ROC). Two years into the current Eight Point Plan we have attained 39% EBIT growth, while improving ROC to 26.2% in FY22
• industry leading sustainability outcomes, with targets set to reduce our Scope 1 and 2 greenhouse gas emissions to zero by 2050
• being the most trusted agribusiness brand in rural and regional Australia, which we are proud to have had awarded for the last three years
Elders continued to make strong progress on our strategic priorities and enablers:
1. Win market share across all products, services and geographies through client focus, effective sales and marketing and strategic acquisitions
2. Capture more gross margin in Rural Products through optimised pricing, backward integration and supply chain efficiency
3. Strengthen and expand our service offerings, including Livestock and Wool Agency, Real Estate, Financial and Technical Services
4. Optimise our Feed and Processing Services business at Killara Feedlot
5. Develop a sustainability program that is authentic and industry leading
6. Invest in Systems Modernisation programbest of breed solutions to improve customer experience, drive process and administration efficiency and better accommodate change
7. Attract, retain and develop the best people and provide a safe and inclusive working environment
8. Maintain unflinching financial discipline and commitment to cost and capital efficiency
Impacts of COVID-19
While COVID-19 pandemic conditions appear to be easing in Australia at the date of this report, COVID-19 remains a global pandemic as declared by the World Health Organisation. Elders has considered the impact of COVID-19 when preparing the consolidated financial statements and related note disclosures, and continues to monitor the impact on our employees, demand for Elders’ products and services, customers, communities and supply chains.
Impacts of severe weather events in Australia
The eastern Australian states have been impacted by high rainfall and severe flooding during 2022. The commitment of our employees to supporting their local communities and the geographical diversification of our business has resulted in minimal disruption to our operations.
Elders 2022 Annual Report 12
1
1 The Operating and Financial Review is presented in Australian dollars and is rounded in millions, unless otherwise stated. Rounding differences may be present due to individual amounts rounded to the nearest thousand dollars in the Financial Report.
Profit and Loss
Profit: Reported and Underlying2
$million FY22 FY21 Change Change % Sales 3,445.3 2,548.9 896.4 35%
Gross margin
Retail Products 310.0 222.3 87.7 39%
Wholesale Products 73.1 61.2 11.9 19%
Agency Services 147.0 141.3 5.7 4% Real Estate Services 61.6 50.7 10.9 21% Financial Services 44.2 41.3 2.9 7%
Feed and Processing Services 16.8 12.6 4.2 33%
Total gross margin 652.7 529.4 123.3 23% Costs (distribution and administration) (420.6) (362.9) (57.7) (16%)
Underlying earnings before interest and tax 232.1 166.5 65.6 39% Finance Costs (8.6) (8.8) 0.2 2%
Underlying profit before tax 223.5 157.7 65.8 42% Tax (64.2) (2.6) (61.6) n/m
Non-Controlling Interests (7.1) (4.0) (3.1) (78%)
Underlying profit to shareholders 152.2 151.1 1.1 1% Items excluded from underlying profit 10.7 (1.3) 12.0 n/m
Reported profit after tax to shareholders 162.9 149.8 13.1 9%
Underlying earnings before interest, tax, depreciation and amortisation 279.3 207.4 71.9 35% Underlying earnings per share (cents) 97.3 96.7 0.6 1%
Items Excluded from Underlying Profit
The statutory result included items that are unrelated to operating financial results. Measurement and analysis of financial results excluding these items is considered to give a meaningful representation of like-for-like performance from ongoing operations ("underlying profit"). Underlying profit is a non-IFRS measure and is not audited or reviewed.
$million FY22 FY21 Commentary
Profit on sale 22.0
Profit on sale of StockCo investment Business closure costs (10.6) Cost associated with the closure of Elders Fine Foods (China) One-off costs (0.7)
Systems Modernisation costs that are one off in nature, but cannot be capitalised
Unbooked tax losses (1.3) Recognition of tax and unbooked tax losses Total 10.7 (1.3)
Change in product margin ($million)3 Agency Services Interest, tax & NCI Real Estate Services Costs Feed and Processing Services
87.7 5.7 10.9 2.9 4.2 (57.7) (64.5) 152.2 151.1 Wholesale Products
Retail Products
11.9
Operating and Financial Review 13
Product margin Financial Services FY21 FY22 2 FY22 underlying earnings per share (97.3 cents per share) is impacted by the recognition of tax expense in underlying income commencing 1 October 2021. To enable consistent comparison year on year, FY22 adjusted underlying earnings per share is 134.1 cents per share up 38.7% on FY21 3 Branch incentive is proportionally allocated to Retail Products and Agency based on margin contribution
Sales
Sales increased $896.4 million to $3,445.3 million (+35%) across all products. Retail and Wholesale Products represented $817.4 million or 91% of the upside, supported by acquisitions and organic growth initiatives, as well as improved seasonal conditions and favourable market activity.
Gross Margin
Retail Products
Retail Products margin uplift was mainly due to increased sales (+$745.7 million or +44%), driven by strong demand for fertiliser and crop protection chemicals following favourable seasonal conditions. Benefits from the backward integration strategy mostly mitigated margin pressures from higher input costs, resulting in strong margin consistent with the prior year.
Wholesale Products
Wholesale Products margin growth was attributable to sales uplift (+$71.7 million or +22%) in line with expansion of the AIRR network and organic growth initiatives, including investment in the member base, supported by strong demand from ongoing favourable seasonal conditions.
Agency Services
Agency Services margin uplift was largely driven by the Livestock business, which increased $4.7 million to $129.6 million (+4%). This was primarily due to strong cattle prices with sheep prices remaining relatively flat, partially offset by lower volumes due to herd and flock rebuilding, in line with market activity. Wool margin also grew, corresponding to recoveries in the market and re-emerging global demand.
Real Estate Services
Real Estate Services margin increase of $10.9 million (+21%) was favourable across all service offerings. Broadacre and residential sales improved on the previous year, supported by growth in volumes, and favourable market conditions. Property management earnings increased, boosted by acquisitions in key geographical locations.
Financial Services
Financial Services achieved margin improvement of $2.9 million (+7%), mostly across the Insurance and Livestock in Transit delivery warranty products. Insurance increased, corresponding to growth in gross written premiums, as well as higher returns from the equity accounted investment (+21%). LIT uplift of $0.9 million on the prior year to $8.7 million is primarily the result of higher livestock prices.
Feed and Processing Services
Feed and Processing Services margin recovered significantly on the prior year due to increasing efficiency at Killara Feedlot (+$4.2 million or +35% ). This was supported by strong demand from domestic and export customers and high residency levels. Gross margin also benefited from cattle performance efficiencies, supported by increasing backgrounding operations. A closure strategy has been implemented for the Elders Fine Foods business following continuing low sales due to COVID-19 disruptions in key regions in China.
Costs
FY22 was a year of significant EBIT growth. The cost to earnings ratio improved to 64% (FY21: 69%), despite an increased cost base driven by additional FTEs required to facilitate network growth and initiatives. Incentives were also higher in line with business out-performance.
Net Profit After Tax
after
includes the recognition of underlying tax expense ($64.2 million), effective from 1 October 2021.
Elders 2022 Annual Report 14
profit
Product margin by year ($million) 222.3 Retail Products Feed and Processing Services Financial Services Real Estate Services Agency Services Wholesale Products 310.0 61.2 73.1 141.3 147.0 50.7 61.6 41.3 44.2 12.6 16.8 0 50 100 150 200 250 300 350 FY21FY22
Net
tax
Profit and Loss (cont.)
EBIT by Geography
$million FY22 FY21 Change Change %
Wholesale Products 37.3 31.4 5.9 19%
New South Wales 52.4 34.1 18.3 54% Queensland and Northern Territory 34.4 21.5 12.9 60%
Victoria and Riverina 80.6 62.5 18.1 29%
South Australia 43.7 31.8 11.9 37%
Tasmania 6.9 6.0 0.9 15% Western Australia 63.7 54.7 9.0 16%
International (China) (0.8) (1.0) 0.2 20%
Corporate Overheads (86.1) (74.5) (11.6) (16%) Underlying earnings before interest and tax 232.1 166.5 65.6 39%
EBIT contribution from all geographies improved in FY22 as a result of organic growth initiatives, including increasing sales staff to extend the value proposition to clients, which enabled the branch network to capitalise on strong demand arising from favourable seasonal conditions. This was supported by contributions from strategic acquisitions and a continued focus on cost and capital efficiency.
Wholesale Products
Wholesale Products margin growth was attributable to sales uplift in line with expansion of the AIRR network and organic growth initiatives, including investment in the member base, supported by strong demand from ongoing favourable seasonal conditions.
New South Wales
New South Wales achieved growth across all products with organic growth initiatives positioning the business to capitalise on strong demand. B&W Rural and Titan AG sales were strong contributors, with increased demand for chemical and fertiliser products following more favourable weather conditions across the region. Further growth was provided by buoyant livestock and wool prices and a favourable broadacre Real Estate market. Contribution from Killara Feedlot improved due to strong demand and high residency levels.
Queensland and Northern Territory
The improvement in Queensland and Northern Territory was assisted by product diversification from the Sunfam acquisition as well as sustained high Retail Products demand for chemical and fertiliser products, and a favourable rural Real Estate market, partially offset by lower cattle volumes resulting from herd rebuild and a limited live export market.
Victoria and Riverina
The upside in Victoria and Riverina is the result of increased contributions from all products, with organic growth initiatives enabling the branch network to capitalise on strong Retail Products demand, particularly for fertiliser and chemical products, with Titan AG showing significant growth. Further uplift was provided by sustained high cattle prices and an active Real Estate market, particularly in broadacre asset sales.
South Australia
Growth in Rural Products, particularly Titan AG, fertiliser and chemical products, was the primary driver of the uplift in South Australia, reflecting the success of both organic growth initiatives and integration of strategic acquisitions. This was supported by favourable contributions from increased Real Estate turnover, with competition for broadacre remaining high, and from Agency Services with limited domestic cattle supply leading to higher prices.
Tasmania
Livestock agency was the primary contributor to growth in Tasmania, due to a combination of higher cattle prices and increased volumes from growth in market share. Contribution from the retail business improved with favourable conditions driving demand across most categories.
Western Australia
Western Australia's increase was primarily driven by Retail Products, with both organic growth initiatives and strategic acquisitions positioning the business to benefit from increased demand for retail products, notably seed and chemical products. Real Estate performed very strongly with all real estate categories increasing on last year due to strong demand for both residential and broadacre properties, as well as higher property management turnover and the successful integration of strategic acquisitions.
Corporate Overheads
Costs increased +$11.6 million or +16% primarily due to the investment in people to support business growth, increased variable incentives in line with business out-performance and strategic initiatives including the Systems Modernisation project.
Operating and Financial Review 15
Capital Management Balance Sheet
$million FY22 FY21 Change Change %
Trade and other receivables 819.5 734.8 84.7 12% Inventory 484.5 321.7 162.8 51% Livestock 73.4 56.2 17.2 31%
Trade and other payables (752.5) (667.5) (85.0) (13%) Working capital 624.9 445.2 179.7 40% Property, plant and equipment 47.0 36.0 11.0 31% Right-of-use assets 119.3 105.7 13.6 13%
Equity accounted investments and other financial assets 48.8 59.2 (10.4) (18%) Intangibles 364.3 332.6 31.7 10% Provisions (98.2) (85.0) (13.2) (16%) Capital (net operating assets) 1,106.1 893.8 212.3 24%
Borrowings: working capital and other facilities (179.2) (154.3) (24.9) (16%)
Lease liabilities (123.5) (110.7) (12.8) (12%)
Cash and cash equivalents 17.8 48.1 (30.3) (63%) Net debt (284.9) (216.9) (68.0) (31%) Tax assets 39.5 101.7 (62.2) (61%)
Shareholders' equity 860.7 778.6 82.1 11%
Elders 2022 Annual Report 16
Change in underlying profit by geography ($million) FY21 FY22 Wholesale Products 5.9 151.1
Underlying EBIT NSW QLD & NT VIC & RIV SA TAS WA International Corporate Overheads Interest, Tax & NCI 152.2 18.3 12.9 18.1 11.9 0.9 9.0 0.2 (11.6) (64.5) Underlying profit by geography ($million) -20 0 20 40 60 80 100 31.4 FY21FY22 37.3 34.1 52.4 21.5 34.4 62.5 80.6 31.8 43.7 6.0 6.9 54.7 63.7 (1.0)(0.8) Wholesale Products NSW QLD & NTVIC & RIV SA TAS WA International
Working Capital
$million FY22 FY21 Change Change %
Retail Products 401.9 246.1 155.8 63%
Wholesale Products 99.9 83.8 16.1 19%
Agency Services 58.7 53.8 4.9 9%
Real Estate Services 0.4 4.1 (3.7) (90%)
Financial Services 9.4 32.3 (22.9) (71%)
Feed and Processing Services 83.4 59.7 23.7 40%
Other (28.8) (34.6) 5.8 17%
Working capital (balance date) 624.9 445.2 179.7 40%
Working capital (average) 606.5 487.7 118.8 24%
Key movements in working capital
Working capital at balance date closed at $624.9 million, which is $179.7 million higher than the prior year, driven by 35% growth in sales in FY22:
• trade and other receivables uplift of $84.7 million is largely in line with increased Rural Products sales activity, which was underpinned by favourable seasonal conditions and commodity price increases. Debtor days, recoverability and ageing profile have remained stable. This was partially offset by a reduction in Financial Services receivables following the divestment of StockCo
• inventory increased $162.8 million, mostly in Rural Products due to gross price inflation on most categories (particularly crop protection chemicals and fertiliser) and additional investment in own brand products which have longer lead times
• livestock grew $17.2 million predominantly due to higher prices at Killara Feedlot, in line with higher demand from domestic and export customers
• trade and other payables increased $85.0 million primarily driven by higher underlying commodity prices and increased inventory on hand in line with positive outlook for 1H23
Key movements in net operating assets
Net operating assets at balance date increased a further $212.3 million to $1,106.1 million on the prior year relating to:
• intangibles (+$31.7 million or +10%), driven by goodwill on acquisitions in FY22
• right-of-use assets (+$13.6 million), due to an increased number of renegotiated lease contracts, which resets the right-of-use value
• provisions increased by $13.2 million predominantly due to increased incentives in line with business out-performance
• property, plant and equipment growth is primarily related to investment in Elders Wool Handling facilities
Net Debt
Net debt at balance date was $284.9 million, which was an increase of $68.0 million from the prior year. Average net debt increased $27.0 million to $327.7 million primarily due to the increase in Rural Products working capital to support business growth, with higher investing cash outflows for acquisitions, the Systems Modernisation project and construction of the Elders Wool Handling facility. This was partially offset by proceeds from the StockCo divestment. Additional financing cash outflows relate to higher dividends paid to shareholders.
Capital management ratios
KeyRatios-rolling12months
FY22 FY21 Change Change %
Underlying return on capital (%) 26.2% 22.5% 3.7% n/m
Leverage ratio (average net debt to EBITDA) (times) 1.2 1.4 (0.2) (14%)
Interest cover ratio (EBITDA to net interest) (times) 32.5 23.6 8.9 38%
Gearing ratio (average net debt to closing equity) (%) 38.1% 38.6% (0.5%) n/m
All financial debt ratios have improved on last year in line with earnings growth. There is also significant headroom in the banking covenants, which excludes AASB16 leases impact and the debtor securitisation facility.
Undrawn facilities at 30 September 2022 were $290.0 million out of total committed facilities of $475.0 million.
Tax Assets
Tax assets decreased $62.2 million to $39.5 million, impacted by the recognition of underlying tax expense of $64.2 million, effective from 1 October 2021, which is due to all tax losses now recorded on balance sheet.
Shareholders' Equity
Shareholders' equity increased $82.1 million to $860.7 million at September, mostly representing FY22 reported net profit of $162.9 million partially offset by dividend distribution to shareholders of $73.7 million.
Return on Capital
Elders' underlying return on capital increased to 26.2% at 30 September 2022, an increase of 3.7% on last year. The increase is attributable to higher earnings from all products and geographies, with very strong Rural Products demand due to favourable seasonal conditions the major contributor.
Operating and Financial Review 17
Cas Flow
$million FY22 FY21 C ange C ange %
Operating cash flows 113.7 142.2 (28.5) (20%) Investing cash flows (45.1) (35.5) (9.6) (27%)
Financing cash flows (98.7) (109.3) 10.6 10% et cas low (30.2) (2.7) (27.5) n/m
Cash conversion (%) 75% 94% (19%) n/m
Cas Conversion
Working
Increase in Receivables (73.2)
(108.0)
(13.3)
Operating cas low
Operating cash flow is largely comprised of an underlying BI DA ad usted for non cash items of $327.7 million. his is partially offset by movements in assetsand liabilities of $214.1 million: increase in Rural Products (Retail and Wholesale Products) working capital at balance date of $171.9 million, mostly attributable to higher debtors in line with increased sales activity and increased commodity prices, while maintaining stable debtor days, recoverability and ageing profile Agency Services working capital increase of $4.9 million with an increase in receivables more than offsetting the increase in payables, primarily due to the unfavourable timing of year end reduction in Financial Services working capital of $22.9 million due to a decrease in receivables following the divestment of StockCo higher Feed and Processing Services working capital (+$23.7 million) predominantly due to increased inventory balances at illara Feedlot, related to higher cattle prices
Cash conversion was 75%, corresponding to an operating cash inflow of $113.7 million on underlying net profitafter tax of $152.2 million. his is compared to a cash conversion of 94% in the prior year, resulting from an inflow of $142.2 million on underlying net profit of $151.1 million. he movement on the prior period mostly relates to the increased net working capital required to support 39% growth in underlying BI . Working capital to sales ratio of 18% improved +2% on the prior year demonstrating lders efficient capital management framework.
Investing cas low
Investing cash flow was a net outflow of $45.1 million at balance date, the result of 13 acquisitions during the year, Systems Modernisation pro ect and construction of the lders Wool Handling facility, partially offset by the proceeds from the StockCo divestment.
Financing cas low
Financing cash flow was an outflow of $98.7 million, primarily representing full year FY21 and half year FY22 dividends paid to shareholders of $73.7 million.
Elders Annual Report
Rural Products (171.9) Financial Services 22.9 Real Estate Services 3.7 Agency Services (4.9) Corporate and Other (5.8) Feed and Processing Services (23.7) Other Capital (34.4)
Capital Operating Cash Flow 113.7 Depreciation and Amortisation 47.2
Assets
Pro t a er Tax
Cash Conversion
Decrease in Net Paid Stock
Decrease in Receivables 9.2 Interest, Tax and Dividends (2.2) Movements in
and Liabilities (214.1) Underlying
152.2
75% EBIT 232.1
Decrease in Payables
Other Non Cash Items 50.7 Provisions / Other 9.3 Provisions / Other (0.8)
Material Business Risks
Following is an overview of key risks Elders faces in seeking to achieve its objectives. The risks noted are not exhaustive and not in order of materiality. Elders seeks to identify, analyse, evaluate, treat and monitor all risks, to maximise opportunities and prevent or reduce losses.
Elders’ risk appetite is set by the Board and recorded in the Elders Resilience Policy and Framework. The Executive maintains focus on those risks that have a higher rating than the desired appetite and continually assesses our operational and strategic environment for new and emerging risks.
Risks are comprehensively reviewed and reported four times a year (or escalated immediately if certain triggers are met) to the Board Audit, Risk and Compliance Committee to ensure the Board is adequately informed of the evolving risk environment. More detail on Elders’ approach to managing risk is contained in the Corporate Governance Statement on Elders’ website at elders.com.au/corporategovernance
Note: In line with ASX Corporate Governance Council recommendation 7.4, and the purpose of this report, Elders has categorised our material business risks as follows:
Economic
The ability to continue operating at a particular level of economic production over the long-term.
Environmental
The potential negative consequences to a listed entity if its activities adversely affect the natural environment or if its activities are adversely affected by changes in the natural environment.
Social
The potential negative consequences to a listed entity if its activities adversely affect human society or its activities are adversely affected by changes in human society.
Material Business Risk Our strategy Health and safety
Safety risk is inherent in Elders’ business activities. The safety of our people, our customers and clients and the general community with whom we interact is our number one priority. Key safety risks include livestock handling, remote driving, manual handling and chemical handling.
The safety of our people and an effective safety culture at Elders is a critical and non-negotiable corporate objective. Through the implementation of a safety management system based on continuous improvement, we reduce risks which might impact our operations.
We recognise and reward safety initiatives and safe behaviours via our monthly One Elders Awards program. This initiative values and promotes safety and ensures our positive safety culture is embedded throughout our operations.
During FY22 Elders established Critical Risk Teams to facilitate a team based approach to identify and implement improved controls for safety risks across the business.
Animal welfare
The safety and welfare of livestock is of paramount importance to Elders and the company has controls in place to ensure the wellbeing and proper treatment of all animals within our control. Failure to protect the welfare of livestock in our control might result in stakeholder activity, business disruption and reputational damage.
Elders has “zero tolerance” for poor treatment of livestock. Our people are trained in safe livestock handling protocols and methods and we comply with and strive to exceed all government requirements. In addition, we actively engage with the industry and stakeholders to improve animal welfare practices where possible.
Our suite of livestock handling policies and procedures will be relaunched in FY23 to ensure the highest standards of care by our people.
Operating and Financial Review 19
Achievement of our business objectives could be affected by a number of risks that might, individually or collectively, have an impact.
Material Business Risk Our strategy Pandemic
Pandemic conditions have the potential to impact Elders’ ability to conduct its business.
The safety of our people, customers and clients, the general community and business continuity are at risk during such events.
Commodity pricing
Elders has exposure to commodity price fluctuations in its Agency, Rural Products and Feed and Processing operations where movements in commodity prices, exchange rates and/or a change in the volume of Australian rural production could affect margins in the future.
Severe weather events
Severe weather events and other natural events may reduce the output of relevant agricultural products and affect the operation of Elders’ business. Natural events, caused or affected by weather, such as frost, drought, flood and fire can have an impact. Such conditions can influence the supply of and demand for rural products and services provided by Elders, resulting in varied revenue levels.
Climate change
Physical risks (such as hotter and drier conditions and more extreme weather events) and transitional risks (such as those relating to the reduction of greenhouse gas emissions) may have significant implications for the environment and conditions in which Elders operates.
Throughout COVID-19, Elders has enacted and operated its business continuity processes, establishing a COVID-19 Committee which is comprised of executive level business unit representitives and functional experts and is chaired by the Company Secretary and General Counsel. This Commitee continues to meet to this day.
While COVID-19 pandemic conditions appear to be easing in Australia, Elders continues to monitor developments for safety, wellbeing and business disruption impacts.
Exposures are managed through diversification of income streams by product, channel and geography, controlled inventory levels and flexible remuneration models for the Agency business which allow for cost base adjustments in response to fluctuations.
To limit the impact of natural weather events, Elders maintains both a geographical spread of operations and a diverse product, channel and service range. We maintain robust incident response and business continuity systems to manage events arising from severe weather.
In 2022 Elders continued to develop its approach to managing climate related risks. This included progress on:
• Climate change scenario analysis
• Targets relating to renewable electricity
• Developing our Scope 3 emissions profile
Our Board has set a target of fully aligning our climate related disclosures with the TCFD Recommendations by 30 September 2023.
Further detail on our management of climate related risks and performance on managing energy and emissions is available in Elders' 2022 Sustainability Report.
Biosecurity threats
Biosecurity threats to agricultural products and livestock may affect Elders’ business. An outbreak of an animal or plant disease can lead to quarantine conditions in rural Australia, trade controls and reduce producers’ need for goods and services or affect their ability to operate.
Food safety
Elders handles livestock and red meat in its Feed and Processing operations which are destined for human consumption. The risk of contamination to these food products exists.
Fraud and corruption
Elders is exposed to fraud, bribery and corruption risks, including in foreign markets in which it operates.
To manage the impact, Elders has in place disease management protocols. In addition, Elders also has a business continuity framework to respond to and recover from the risk of business disruption.
During 2022, Elders formed a biosecurity committee to plan for the threat of Foot and Mouth Disease and Lumpy Skin Disease. With both diseases present in countries close to Australia, Elders considers increased preparedness for these risks to be prudent management.
This risk is managed through strict animal health controls in the feedlot. In addition, Elders has a business continuity framework specifically for the Killara Feedlot.
Elders has several controls to counter these risks, including appropriate segregation of duties, the terms of its Code of Conduct, compliance policies, anti-fraud policy, anti-bribery and corruption policy, training throughout the business, financial reconciliation processes, whistle-blower policy and reporting hot-line, leave management protocols and an Internal Audit program which is complemented by periodic reviews conducted by the external auditor.
Global and domestic economic shocks
Elders is exposed to rapid changes in economic conditions that impact prices, sales volumes, growth and or overhead costs.
Exposures are managed through diversification of income streams by product and geography, controlled inventory levels and flexible remuneration models for the Agency business and appropriate debt facility management.
Elders 2022 Annual Report 20
Material Business Risk
Our strategy Counterparty risk
Elders deals with numerous counterparties of different types. We provide credit to approved counterparties, both domestically and internationally, and may be exposed to losses associated with a client’s inability to repay debt as well as exposure to supplier and partner counterparty risks.
Geopolitical risk
Elders operates in domestic and foreign jurisdictions where the business may be affected by changes implemented by governments. In addition, subsidies given to foreign rural producers may adversely affect the competitive position of Australian rural outputs.
Human resource risk
Elders' people are critical to the performance and success of the organisation. Failure to attract and retain the right people might adversely impact organisational performance.
Social licence risk
Elders operates in jurisdictions where the business may be affected by changes to stakeholder expectations which and require the business to modify its activities. This includes expectations relating to human rights, animal welfare, the environment and product and services mix.
Cyber risk
Elders' operations rely on information technology solutions which expose us to the threat of cyber disruption and loss of data.
This risk is managed by individual counterparty credit risk assessments, maintaining credit policies and procedures, oversight by the Credit Committee, debtors monitoring and reporting, trade credit insurance (major livestock exporter and processors debtor) and high level reviews of significant credit issues by the CEO and CFO, and if sufficiently material, the Board. To address counterparty risk through its foreign operations, Elders performs counterparty risk assessments, undertakes due diligence processes and seeks to establish long-term strategic relationships with key customers.
Elders controls consequential exposure to this risk through contractual means wherever practicable and seeks to cultivate a diverse range of international markets to reduce concentration risk. The Board maintains control and oversight over ventures in new jurisdictions.
Elders has well established processes aligned to our objective to be an employer of choice and attract outstanding people with the right values. Additional processes are designed to ensure Elders utilises their individual talents to achieve sustainable success.
Elders controls consequential exposure to this risk through continuous monitoring of social trends that have the potential to impact the business. Various resources, including our sustainability team, are responsible for identifying, analysing and responding to social shifts. The Board has oversight over activities in all jurisdictions.
Elders maintains a strong focus on our information technology and data security capabilities and we continue to implement and embed stronger security for our IT infrastructure on a continuous improvement basis.
During 2022, Elders has continued to invest in cyber security and established a data governance committee to further enhance data security and privacy controls within the organisation.
Supply chain risk
Due to the nature of our operations, we operate with complex supply chain challenges and work with numerous logistics suppliers in a dynamic operational and regulatory environment.
This operational risk continues to be a strong focus in 2022 in light of some continued pandemic impacts, global volatility arising from geopolitical and economic factors and the need to ensure supply chain resiliency.
Elders continues to manage its Rural Products supply chain risks and has established a dedicated supply chain team to reduce supply chain vulnerability.
Operating and Financial Review 21


REVIEW OF OPERATIONS 2022


200 AGRONOMISTS Nationwide 756k USERS ELDERSRURAL.COM.AU 75k FOLLOWERS ON SOCIAL MEDIA 9.6m USERS ON ELDERS WEATHER Across Elders national accounts on all platforms www.eldersweather.com.au and app available on mobile devices Nationwide Elders Annual Report
OPERATING HIGHLIGHTS $2.4b Retail Products Sales Up 44% on FY21 Results $0.4b Wholesale Products Sales Up 22% on FY21 Results $1.8b Residential Sales Turnover Up 21% on FY21 Results $2.5b Farmland Sales Turnover Up 54% on FY21 Results 1.4m Head of Cattle Sold Down 12% on FY21 Results 9.0m Head of Sheep Sold Down 3% on FY21 Results $1.0b Gross Written Premiums Up 12% on FY21 Results 67k Killara Head of Cattle Sold Up 12% on FY21 Results Review of Operations
Rural Products
Elders is one of Australia’s leading suppliers of rural farm inputs including seeds, fertilisers, agricultural chemicals, animal health products and general rural merchandise.
Our Retail Products division supplies these rural products to primary producers and corporate farm customers through 232 Elders owned retail stores. Additionally, we also provide professional production and cropping advice with 200 agronomists nationwide, including additional specialists operating through Elders Technical Services.
Elders also operates a Wholesale Products business supplying independently owned member stores, utilising the AIRR branding. AIRR also provides retail services through corporate owned stores and the Tuckers Pet and Produce brand to independently owned member stores. Our backward integration strategy is facilitated through various brands.
Performance
Rural Products margin increased $99.6 million (35%) to $383.1 million, of which $87.7 million is attributable to Retail Products. This uplift in Retail Products is largely driven by sales activity (up 44%), with favourable seasonal conditions strengthening cropping demand. Retail Products gross margin percentage was maintained year on year, supported by our backward integration strategy, preferred supplier ranging and focus on margin management. Titan AG also contributed a further $15.1 million of manufacturing margin year on year, supported by a 32% increase in sales through the Elders network.
Wholesale Products margin is up $11.9 million (19%) to $73.1 million, benefiting from sales growth of 22% due to growth in independent member sales, higher private label sales and increased wholesale business via AIRR's distribution centres.
Strategy
To deliver profitable growth through execution of our backward integration strategy, capturing more gross margin through optimised pricing and supply chain efficiency, and winning market share through customer centricity, sales force effectiveness and strategic acquisitions.
Strategy Achievement Plan
Expand own brand product segment
Margin management and efficiency improvements
• Increased own brand share of sales across most major product categories
• Launched new home brand products in the crop protection, seed, fertiliser and animal health ranges
• Re-launched own brand 'EPG Seed'
• Maintained average margins in a challenging market with supply constraints and rising cost of inputs
• Established a new national supply chain function to deliver supply chain efficiencies and support risk management
• Continue to expand own brand product portfolio through new product launches
• Expand the innovation function and identify strategic opportunities
• Continued improvement in margin management sophistication through technology solutions
• Develop an enhanced pricing strategy
Customer focus and expanded store footprint
Growth of Wholesale Products
• Invested in revenue generating roles and delivered sales training to 200+ front line employees
• Added nine new retail locations, four through acquisitions and five greenfield developments across the country
• Increased the warehouse footprint with a new warehouse and distribution centre in Tasmania
• Successfully delivered procurement synergies and enhanced maturity of sales through the Elders network
• Grew private label brand share in wholesale and retail networks
• Filled key strategic gaps with a new corporate store and two successful acquisitions
• Continue to fill geographic gaps with strategic acquisitions and greenfield developments
• Create a further 40+ sales facing roles in the network to support organic growth
• Continue to increase the warehouse footprint by opening a new warehouse in Central Queensland
• Build on the private label brand position through the launch of new products
• Expand retail footprint through strategic acquisitions in key areas
• Grow the member base
Rural Products margin ($million) 148.8 152.9 219.5 283.5
383.1
Margin by product 66% Farm Supplies 19% Wholesale Products 15% Fertiliser
Margin split by geography
Elders 2022 Annual Report 26
QLD & NT NSW VIC & RIV TAS SA
WA 16% 22% 27% 3% 13% 19%
Agency Services
Elders provides a range of marketing options for livestock, wool, and grain. Elders' livestock network comprises livestock agents and employees operating across Australia conducting on-farm sales to third parties, regular physical and online public livestock auctions and direct sales into Elders-owned and third-party feedlots and livestock exporters.
Elders is one of the largest wool agents for the sale of Australian greasy wool and operates a brokering service for wool growers. Our team of dedicated wool specialists assists clients with wool marketing, in-shed wool preparation, ram selection and sheep classing.
Elders also has a 50% interest in AuctionsPlus, an online livestock auction platform, and a 30% interest in Clear Grain Exchange (CGX), which is an online grain trading platform
Performance
Agency Services margin improved $5.7 million (4%) to $147.0 million, which is mostly attributable to Livestock (up $4.7 million). This is due to strong livestock prices for both cattle and sheep, due to limited domestic supply. This is however partially offset by improved seasonal conditions driving herd and flock rebuild and Foot and Mouth Disease concerns, which has seen volumes reduce for both cattle and sheep.
Wool margin is favourable $0.5 million (3%) to last year, as the wool market stabilised following a strong recovery in FY21. Volumes were marginally lower than prior year, however this was offset by the Eastern Market Indicator (EMI) averaging higher than prior year .
Strategy
To deliver profitable growth of the Agency Services portfolio through business improvement, recruitment and acquisition for our Livestock and Wool businesses and through focused growth of our investments in AuctionsPlus and CGX.
Strategy Achievement Plan
Operating model
• Business efficiency and growth through implementation of initiatives, including digitisation of processes
• Further growth in AuctionsPlus channel in livestock and machinery transactions
• Record year for CGX for volumes sold through the platform
• Launched Elders Wool Handling, with operations set to commence in FY23
• Continued investment in Livestock, Wool and Grain product development to improve and expand offering
• Further footprint expansion through targeted agency acquisitions
• Continue to grow listings through AuctionsPlus
• Leverage 30% shareholding in CGX to improve grain value proposition and grow revenue
People
• Relaunched livestock trainee program
• Implemented national livestock training program
• Selective recruitment of Livestock and Wool personnel
• Geographical expansion through recruitment of high performing people
Review of Operations 27
FY18FY19FY20FY21FY22
Includes equity earnings from
16% 12% 33% 4% 19% 16% QLD & NT NSW VIC & RIV TAS SA WA
Agency Services margin ($ million) 1 119.6 116.5 127.2 141.3 147.0
1
investments. Margin by product 88% Livestock 11% Wool 1% Grain Margin split by geography
Real Estate Services
Elders’ Real Estate Services include company owned rural agencies primarily involved in the marketing of farms, stations and lifestyle estates. It also includes a network of residential real estate agencies providing agency and property management services in major population centres and regional areas through company owned and franchise offices. Other services include water and home loan broking.
Performance
Real Estate Services margin increased by $10.9 million (21%) to $61.6 million compared to last year, with sales turnover up across most service offerings. Margin from company owned residential and farmland agency has contributed most of the uplift due to ongoing network expansion, high demand and increased prices. Growth was achieved across most geographies.
Property management has also outperformed last year as a result of ongoing rent roll growth. Key agent retention and net growth in agent numbers has been maintained at strong levels through delivery of a compelling attraction and retention proposition.
Strategy
To deliver profitable growth of the Real Estate Services portfolio through business improvement, recruitment and acquisition for all real estate services.
Strategy Achievement Plan
Operating model
• Implementation of numerous business improvement initiatives, primarily focused at brand enhancement, digital strategy, system modernisation and people development
• Grown a significant rent roll asset through organic and acquisitive growth
• Positioned the business as a transaction adviser of choice in corporate agriculture and facilitated numerous on and off-market investment scale farmland transactions
• Implemented Console Cloud property management platform to drive efficiency improvement in rent roll operations
• Implemented AgentBox, an industry leading CRM, across company owned and franchise network
• Continue to grow company owned farmland agency, residential agency and property management presence in major regional centres
• Continue to grow market share in water broking
• Enhance productivity and efficiency initiatives in our property management business
• Leverage the new CRM systems for agency operations, including use of data and driving cross referral opportunities
• Continued enhancement of digital marketing and lead generation activity
People
• Positioned key personnel as leading transaction advisers for corporate scale transactions
• Maintained a strong attraction and retention proposition
• Retained high performing sales agents
• Significant increase in participation levels in a modern learning and development program
• Ongoing recruitment of high performing real estate sales representatives and water brokers
• Recruitment of real estate franchisees
• Increased productivity through technology initiatives and training
• Ongoing investment in capability in the farmland investment space to provide a whole of investment life cycle service offering
Margin by product 71% Agency 29% Property Management
Elders 2022 Annual Report 28
FY18FY19FY20FY21FY22
Real Estate Services margin ($ million) 33.6 34.3 38.2 50.7 61.6
Margin split by geography 24% 12% 17% 1% 17% 29% QLD & NT NSW VIC & RIV TAS SA WA
Financial Services
Elders distributes a wide range of banking and insurance products and services through its Australian network. We work together with a number of partners to deliver these offerings; Rural Bank for banking, StockCo for livestock funding products and Elders Insurance (a QBE subsidiary) for general insurance. Collectively, these relationships enable us to offer a broad spectrum of products designed to help our customers grow their business and manage cash flow and risk.
Performance
Financial Services margin of $44.2 million improved $2.9 million (7%) on last year. This uplift is largely contributed by our Insurance business (up $1.9 million), driven by increased gross written premiums through new insurance lines and locations. Growth in our Livestock in Transit (LIT) Delivery Warranty and new livestock funding products has also contributed to the overall uplift.
Strategy
To deliver profitable growth of the Financial Services portfolio through business improvement, product development and upstream investment in our services business.
Strategy Achievement Plan
Deeper, more productive partnerships
Expand Elders issued product offerings
• Launched engagement program with Rural Bank to further enhance local relationships and drive growth
• Sale of share in StockCo and new distribution agreement with new owner
• Continued service and distribution of Rural Banking products
• Further growth in Livestock Delivery Warranty associated with Elders’ Agency Services business
• Increased on-balance sheet lending capability though product enhancement
• Building on existing and new relationships with Rural Bank staff located in Elders' branches to bring finance solutions to Elders' clients
• Joint strategic marketing and referral campaigns with Elders Insurance to grow gross written premiums
• Further development of new and existing on-balance sheet finance products to improve efficiency and client experience
• Grow Livestock Delivery Warranty revenue through increased uptake and further digitisation
• Expand Elders' finance footprint and capability through recruitment and training
Review of Operations 29
Financial Services margin ($ million)1 38.3 33.4 37.1 41.3 44.2 FY18FY19FY20FY21FY22 1 Includes equity earnings from investments.
Margin by product 38% Agri Finance 42% Insurance 20% LIT Delivery Warranty
QLD & NT NSW VIC & RIV TAS SA WA
Margin split by geography 15% 16% 29% 2% 19% 19%
Feed and Processing Services
In Australia, Elders operates Killara Feedlot, a beef cattle feedlot near Tamworth in New South Wales. Elders also imports, processes and distributes premium Australian meat in China.
Performance
Killara Feedlot margin is favourable to last year $4.2 million improving 35% to $16.1 million, with strong demand from domestic and export customers driving increased sales across all aspects of the business. Excellent seasonal conditions and higher residency levels have contributed to margin improvement while growth in our backgrounding operations via early purchasing of young stock continues to support the supply chain. Further investment in Killara's farming operations and capital expenditure has also seen improved efficiencies and sustainability across the business.
Elders Fine Foods contributed gross margin of $0.7 million, which is in line with last year, as ongoing COVID-19 disruptions impact sales in China. A closure plan has been formalised and the business will conduct an orderly wind down of operations in FY23.
Strategy
To deliver continuous improvement in EBIT and ROC for all businesses with active portfolio composition management.
Strategy Achievement Plan
Grow Killara Feedlot
• Continued investment in capital improvements to drive high utilisation and efficiencies including installation of a 500-kilowatt solar farm due for completion in late 2022
• Steady cattle supply chain management via backgrounding and external facilities
• Enhanced irrigated farming operations to better utilise farming country and available effluent and licensed bore water
• Diversified customer portfolio
• Continued improvements in animal health outcomes through pre vaccination and backgrounding strategy
• World first feedlot trial work in the early detection of bovine respiratory disease
• Antimicrobial stewardship plan to reduce antibiotic use in cattle
• Extensive capital investment in new feeding technologies
• Continue staged roll out of centre pivot irrigation systems for the production of corn silage to be used as part of cattle feeding at the feedlot and backgrounding operations
• Explore opportunities for carbon farming and improved soil nutrient and moisture management practices
• Undertake full carbon footprint evaluation to account for on-site carbon sequestration
• Finalise commission of new feed mill
Closure of Elders Fine Foods in FY23
• Contained losses despite market conditions severely impacted by COVID -19
• Finalise closure of trading operations
Elders 2022 Annual Report 30
FY18FY19FY20FY21FY22
Feed and Processing Services margin ($ million) 14.2 15.0 15.5 12.6 16.8
Margin by product 96% Killara 4% Elders Fine Foods
Outlook
Elders remains committed to Australian agriculture and achieving its Eight Point Plan strategy.
Several regional communities have been impacted by recent flood events across Eastern Australia. With the water yet to recede at the time of writing, the full impact of these events on the current winter crop harvest and summer crop planting is yet to be determined. Elders has enacted its hardship policy to support clients in need.
Rural Products
• ABARES summer crop outlook, released in early September 2022, predicted a positive summer crop outlook, with area planted forecast to rise 2% to 1.6 million hectares1, which was expected to drive strong demand in the first half for cropping inputs, particularly agricultural chemicals, fertiliser and seed. Areas of Queensland, New South Wales, Victoria and South Australia have since experienced continued wet weather and flooding which has created significant uncertainty regarding summer crop production
• Current 2022-23 winter crop production of 55.5 million tonnes was forecast by ABARES,1 which supported continued optimism for the following winter crop season next year, however the impact of unseasonal wet weather across parts of the East coast may impact the 2022 winter crop harvest
• With the water yet to recede at the time of writing, the full impact of these events on the current winter crop harvest and summer crop planting is yet to be determined
• Benefits from strategic bolt-on acquisitions to provide further growth in FY23
Agency Services
• Prices for beef are expected to fall in 2023 due to easing of restocking demand, however will remain historically elevated due to supplies remaining relatively tight2
• Sheep prices are expected to fall in 2022-23, due to reduced restocking demand, but are expected to remain high. Export volumes are expected to increase in volume supported by continuing strong demand from United States and China2
• Global demand for wool is expected to dampen due to increases in inflation and interest rates in major economies. The gross value of wool production is expected to remain unchanged as increased production volumes are offset by a decrease in Eastern Market Indicator in 2022-232
• The Australian agriculture sector has taken action to mitigate the risk of outbreak of Foot and Mouth Disease and Lumpy Skin Disease, however we remain alert to any potential outbreak
Real Estate Services
• Favourable commodity price outlook and good seasonal conditions are expected to continue to drive strong demand for farmland properties in the short to medium term
• Demand for residential properties is expected to normalise due to inflation control measures, however the strong demand for rental properties is likely to continue
• Property management earnings are expected to increase due to rent roll portfolio acquisitions completed in FY22
Financial Services
• Favourable market conditions to support demand for our Insurance and other Agri Finance offerings
1 Department of Agriculture, Fisheries and Forestry, ABARES Australian Crop Report: September edition
2 Department of Agriculture, Fisheries and Forestry, ABARES Agricultural forecasts and outlook: September edition
• Continued uptake of our livestock funding product forecast to provide margin upside
• Our Livestock in Transit delivery warranty product expected to continue to grow in line with higher livestock turnover
Feed and Processing Services
• Some headwinds expected in first half FY23 regarding higher cost of goods, in particular the premium branded beef programs
• Supply chain continues to be supported by our backgrounding and irrigated farming operations to ensure high utilisation and throughput at the feedlot
• Killara continues to diversify its supply to include the growing grass fed segment
• Investment in environmentally sustainable growth initiatives to meet community and consumer expectations
Costs and Capital
• Maintain focus on cost to earn through the cycles
• General inflation, footprint and acquisition growth, continued investment in Sustainability and our Eight Point Plan, investment in Elders Wool Handling and the first phases of our System Modernisation program will temporarily increase our cost base prior to benefits from Systems Modernisation and Elders Wool Handling being achieved
• Interest rates are expected to stabilise in 2023, following successive increases in 2022
External impacts
There are a number of current events which may have an impact on global and domestic markets, input prices, supply chain and geopolitical environments:
• Widespread wet weather in key cropping areas
• Russia and Ukraine conflict
• COVID-19
Review of Operations 31
Trust in advisors the key to success for rice growers
When Elders’ agronomist Shaun Krahnert rolled up the Hollins’ driveway to introduce himself in 2007, little did they know that he would become such an important part of their farming business. He became a friend whose advice they would rely on and eventually someone they would consider part of the family.
Brooke and Nev Hollins run a 4115ha mixed farming operation in Burraboi NSW, a blinkand-you-miss-it town 30km from Barham. They began farming an initial plot from Nev’s Dad whose family were the first in the district to trial and grow rice crops 80 years previously in neighbouring town, Wakool.
Since taking on their first property, Brooke and Nev have managed to more than triple their existing landholdings, buying land where they could improve the soil with pea and vetch and use it to future-proof their business in drought years.
The Hollinses now grow winter and summer crops, ensuring they have rotations in their cropping program to maintain the health of the soil, and run 2000 merino sheep.
“We look at each other at the end of every year and say, ‘no wonder we’re exhausted’. It’s hard work but you’ve got to have diversity and a few different strings in your bow,” said Brooke.
“We are very mindful that we could grow crops in the same paddocks every year and get average results, but that’s not us, and if we do, we’re not going to be farming in 50 years.”
This focus on the sustainability of their enterprise is a priority for the couple, whose son has a keen interest in carrying on farming after school.
“We’ve invested in pivots for low or zero water allocation years to be able to grow crops that keep us going. We have a self-propelled sprayer with an ExactApplyTM nozzle control system to deal with weed resistance in the corner paddocks, so we can deal with problems now and avoid issues in years to come,” said Brooke.
“When we returned to the farm, it was during the ‘millennial drought’ and we quickly realised that we needed to get any loamy country as close by as we could to remain viable while we didn't have water.
We were diligent in putting money back into the soil to bring it back to health, as well as dealing with major weed control issues.”
Shaun said the Hollins’ competitive advantage is being open to change.
“Nev and Brooke are always open to putting ideas on the table and weighing them up,” said Shaun.
“Everything they grow complements the rest of the operation and they’re always looking for ways to use water more efficiently, get more value per megalitre, whether that’s through growing rice close to the main channel or relasering the paddocks.
They’ve had the ability to adapt and trust the advisors around them who want to help, and that’s made them able to grow like they have.”
The Hollinses use Elders for their agronomy, livestock services, merchandise, insurance, and wool brokering. Brooke couldn’t be clearer that they wouldn’t be where they are today if it wasn’t for the Elders team and their family around them.
“We can’t fault the service that we get from Elders,” she said.
“We get a lot of advice; we use the whole team, pull them together and trust them, and that’s how we’ve been able to get where we are.”
That element of trust is the bedrock of Brooke and Nev’s relationship with Shaun, who has helped improve their operations to such a standard that the couple recently won SunRice Grower of the Year Award, an accolade measured against a grower’s production and agronomy quality, water use, efficiency, innovation and technology use, business management, and sustainability.
With their agronomist Shaun’s characteristic straight-talking advice, they’ve reached the top of their farming game.
“The first time Shaun came out, and I still remember the day, he sat at our kitchen table and said, ‘if you do what I say when I say it, we can grow good crops together’” laughs Brooke.
“We were on-board, and it didn’t take long to realise that when he says something it’s for a reason. If we didn’t have Shaun, we wouldn’t get the results that we get. I don’t know a farmer who isn’t happy with him as their agronomist.”
In farming, where the lines between personal and business are blurred, to be considered part of your clients’ family, not just their farm, is high praise.
“At the end of the day, it’s our livelihood that’s in Shaun’s hands,” said Brooke.
“We see his passion, he wears his heart on his sleeve, and in a bad year he really feels it.
He really is part of the family.”
Elders 2022 Annual Report 32
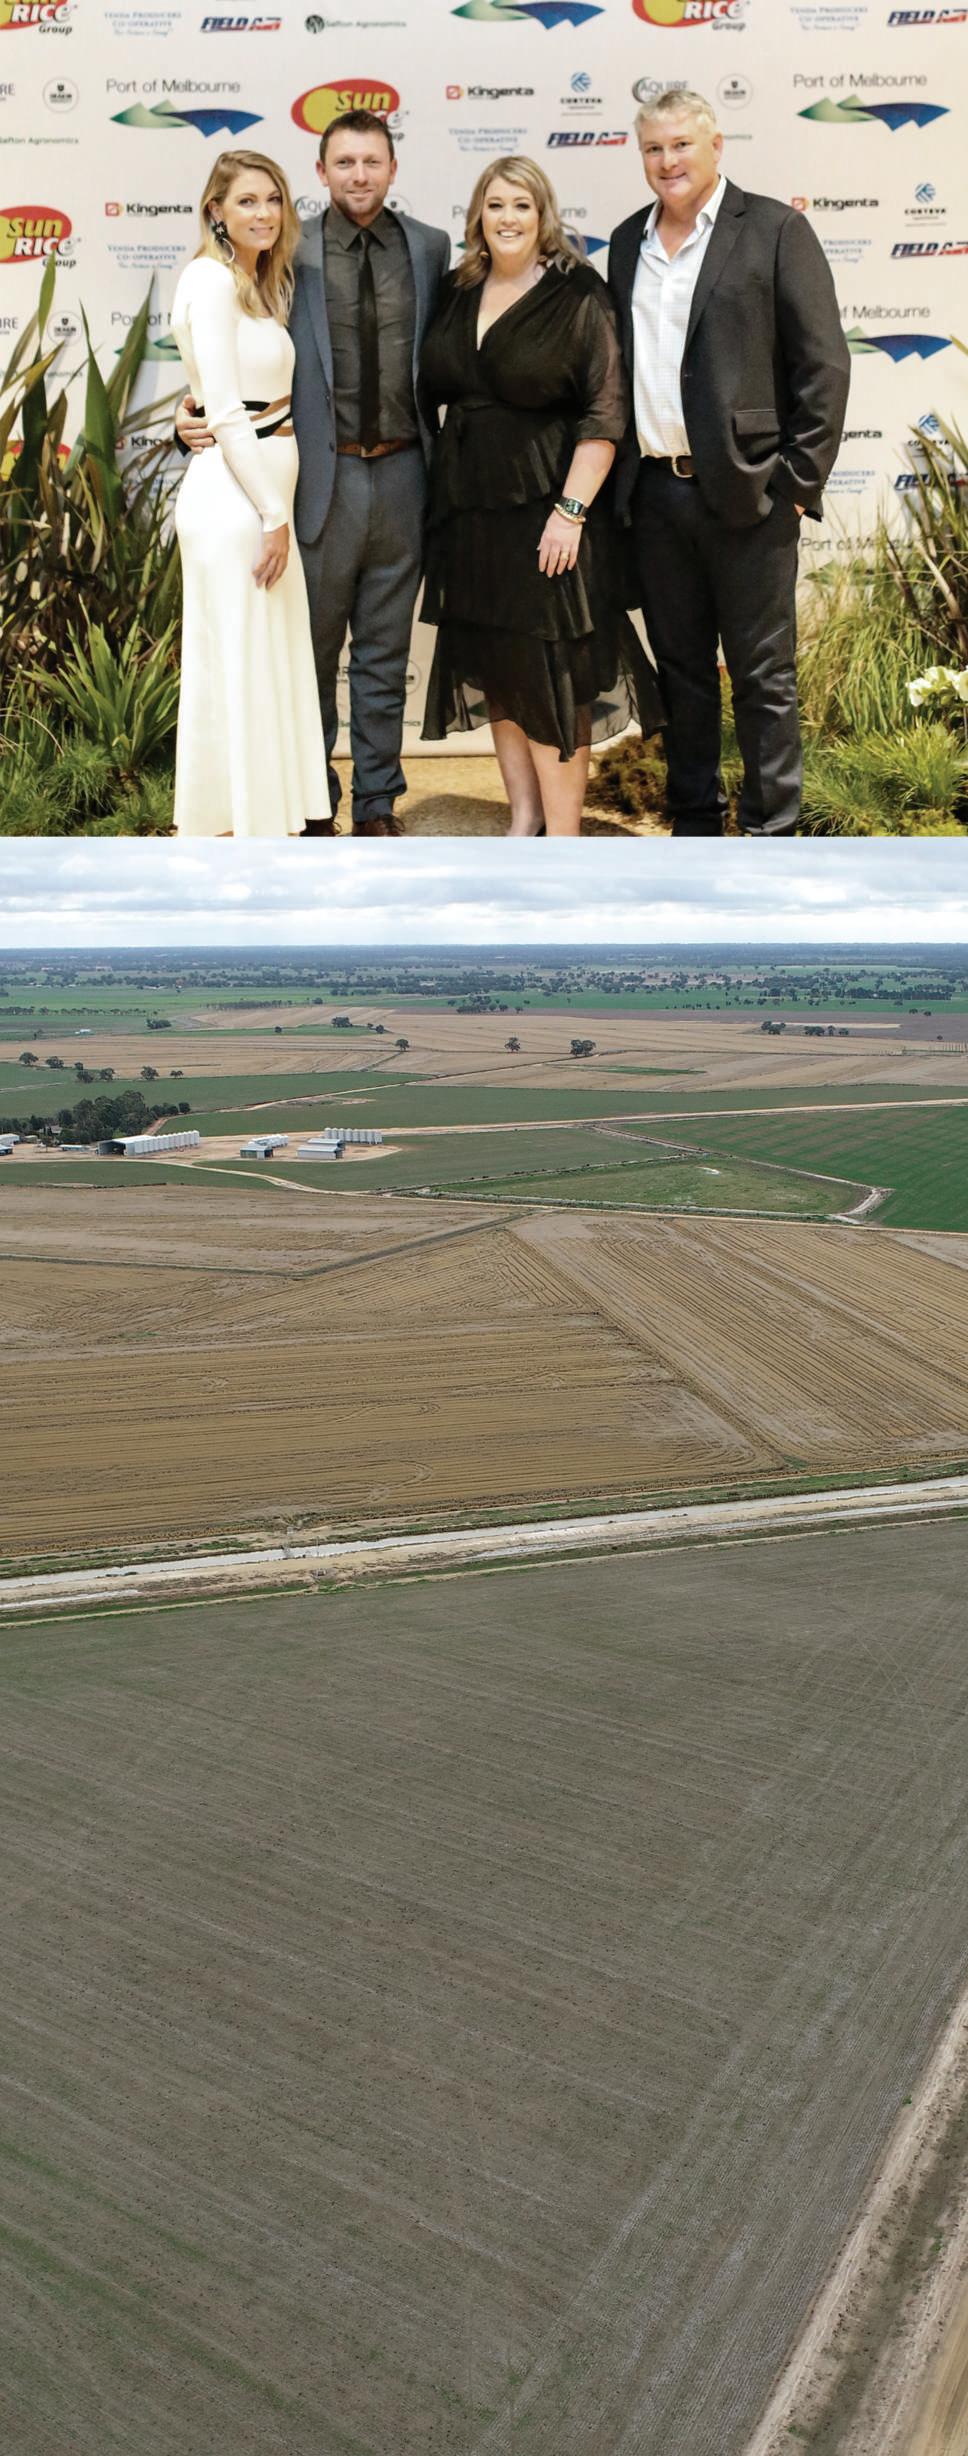
“We can’t fault the service that we get from Elders,”
Brooke Hollins Producer, Burraboi NSW


CLIMATE TARGETS TO REDUCE GREENHOUSE GAS EMISSIONS1 2025 100% renewable electricity in all Australian sites by 2025 2030 50% reduction in Scope 1 and 2 emissions intensity (tCO2e/$m revenue) by 2030, against a baseline year of 20212 2050 Net zero Scope 1 and 2 emissions by 2050 Target achieved through the procurement and retirement of Large-scale Generation Certificates (LGCs) 500kW solar farm in development Progressive increase in onsite solar generation from FY23 FY 18.8 tCO2e/$m revenue in 2022 Down from 23.86 tCO2e in 2021 Achieved through record revenue, LGC procurement and reduced equipment el use at Killara Feedlot 64,772 tCO₂e this year (Scope 1 and 2) Up from 60,828 tCO2e in 2021 2 Subject to commercially viable technology being available to address feedlot cattle emissions. TARGET FY22 PROGRESS
SUSTAINABILITY PERFORMANCE 50% Board positions held by women 17% Women in senior management Improvement programs in place 6 Lost Time Injuries (up from 3 in FY21) $3.3m invested in safety capital expenditure 12.6 TRIFR Down from 15.1 in FY21 $2.69m Donations and sponsorships 1,000+ Local community sports teams and events sponsored 41,000+ Agricultural chemical containers collected for reuse or recycling APCO Joined the Australian Packaging Covenant Organisation and committed to reducing packaging waste
Sustainability at Elders
Our key sustainability principles
We provide our customers and clients with the goods and services they need
Our Material Topics
We support our people and the industries and communities in which we operate
We do our part to look after the environment and the animals in our care
We operate ethically and to the highest standard
Our sustainability program includes the following topics, which are regularly reviewed to ensure we continue to address the issues our stakeholders consider to be material to our business.
Topic Focus
Community impact and investment Supporting local communities and managing community expectations and relations
Health and safety Maintaining our commitment to providing a safe work environment
Employee attraction and retention Investing in the present and the next generation of our workforce and ensuring that our people are enabled to support service delivery and create meaningful work outcomes
Climate change Addressing the risks and opportunities presented by climate change mitigation and adaptation
Water availability Addressing the issue of water availability to the communities in which Elders operates and its impact on the operation and performance of Elders’ business
Animal welfare Ensuring the well-being and proper treatment of livestock Severe weather events Addressing the issue of severe weather events and their impact on the operation and performance of Elders’ business
Energy Managing our energy consumption and greenhouse gas emissions through the responsible use and reliable sourcing of energy Waste management Responsibly managing waste in our own operations and our role in managing agricultural waste from our customers’ operations
Corporate governance Delivering on our commitment to high quality governance, transparency and ethical business practices Innovation and technology Demonstrating our investment in innovation and technology in the agriculture industry
Our ambition is to develop and then deliver an authentic and industry leading sustainability program which acknowledges and builds on the initiatives in which Elders participates and leads throughout rural and regional Australia, for and on behalf of the entire agriculture industry.
This is highlighted in our current Eight Point Plan, which sets out Elders' key strategic priorities from 1 October 2020 through to 30 September 2023. Our Eight Point Plan was developed by our Board and Executive through a series of workshops and strategy sessions over the course of 2020. Full details of our sustainability program and actions during FY22 can be found in our Sustainability Report, available at our Sustainability Centre.
Community Impact and Investment
Through assisting generations of Australian farmers over the course of more than 180 years in business, we recognise that our long-term sustainability is dependent on us maintaining strong relationships with the communities in which we operate and connected to their economic prosperity and resilience.
Our rural communities continue to face a number of challenges presented by changing agribusiness models, increasing automation and corporatisation of farms, the environmental impacts of drought and more broadly, climate change.
As a key member of the agriculture industry and our rural communities, we recognise our role in providing support. We primarily do this through:
• investments in local events and organisations, and by participating in local community programs
• supporting local businesses and employing local workers
• maintaining a physical presence in the communities we serve, through good times and bad
• adapting and providing the goods and services our local customers and clients need at any given time
Sponsorships and Donations (numbersrounded)
$2.69m
To local communities - including the Regional Australia Institute, rural schools, clubs and more than 1,000 local community sports teams and events. $1.25m
To industry and innovation - including major field days, national growers associations, industry bodies and several grass roots organisations. $1.19m
To health and well-being - including RFDS, Dolly's Dream and Beyond Blue and local fundraising events for local and national causes. $0.2m
Elders 2022 Annual Report 36
Climate change
Hotter and drier conditions, prolonged droughts and more extreme weather events have profound effects on farmers, associated businesses, the communities in which we operate and Australia’s economy more broadly. Our role as a provider of products and services to Australian primary producers places us at risk to both direct and indirect effects of climate change.
In 2022, a change in Federal Government saw Australia reaffirming its commitment to net zero emissions by 2050 and announcing more ambitious interim targets to reduce greenhouse gas emissions by 2030.
Reducing emissions in the agriculture sector presents some challenges and many opportunities to improve productivity and resilience while benefiting the environment. As a valued partner of the agriculture sector, we have an important role to play in contributing to the sector’s resilience and helping develop technologies to assist with emissions mitigation and climate change adaptation. We also acknowledge our own responsibility to address climate change and in particular, manage and reduce greenhouse gas emissions associated with our own operations.
This year, we completed qualitative climate change scenario analysis. Ahead of our 2023 ambitions, we also identified and quantified select categories of our Scope 3 emissions, and made progress against our emissions reductions targets, achieving 100% renewable electricity in all our Australian sites through the procurement and retirement of Large-scale Generation Certificates.
Elders' staged action plan for full alignment with the TCFD Recommendations by 30 September 2023
Governance Risk Management Strategy Metrics & Targets
FY20 Comprehensive disclosure of our climate-risk management process, roles and responsibilities.
Initiated internal and independent review of climate-related risks and opportunities.
FY21 Detailed our climate-risk assessment methodology and disclosed our climaterelated risks and current mitigation actions.
Detailed the role risk plays in our decision making.
Identified climaterelated opportunities.
FY22 Qualitatively assess future climaterelated risks and impacts using appropriate climate scenarios.
FY23
Disclose impacts of, and business resilience to, climaterelated risks and opportunities including commentary on financial implications under each scenario.
Progress against our targets
Target Performance
100% renewable electricity in all Australian sites by 2025
50% reduction in Scope 1 and 2 emissions intensity (tCO2e/$m revenue) by 2030, against a baseline year of 2021 (subject to commercially viable technology being available to address feedlot cattle emissions)
Net zero Scope 1 and 2 emissions by 2050
Reported our Scope 1 and 2 emissions from energy use and feedlot cattle.
Reported our Scope 1 and 2 emissions, including emissions from feedlot waste and fertiliser management.
Develop our Scope 3 emissions profile. Set climate related targets and metrics.
Report on performance against targets.
• Target achieved through LGC procurement and retirement
• 500kW solar farm in development
• Progressive increase in onsite solar generation from FY23
• 2021: 23.86tCO2e / $m revenue
• 2022: 18.8tCO2e / $m revenue
• Achieved through record revenue, LGC procurement and reduced equipment fuel use at Killara Feedlot
• 64,772 tCO2e in 2022
• Up from 60,828 tCO2e in 2021
Our targets apply to the sites over which Elders has operational control and are based on our financial year ending 30 September. Full details on our emissions profile, targets and strategy to reduce emissions are set out in our Sustainability Report.
Our strategy to achieve our emissions reduction targets involves investment in renewable energy, technology and innovation to improve energy efficiency and reduce greenhouse gas emissions. We are particularly reliant on innovation to support a greater uptake of electric and hybrid vehicles in our fleet, and a reduction in enteric emissions from our feedlot cattle. In the coming years, we aim to partner with industry on the development and implementation of technology to tackle the carbon footprint of our cattle. We also recognise that carbon offsets may have a role to play. We will further develop our strategy and position on carbon offsets in the coming years and communicate this in future annual and sustainability reports. We will aim to reduce and eliminate our emissions where possible and commercially sensible, without the use of carbon offsets in the first instance.
Sustainability 37
1
Our emissions profile
Scope 1 emissions - Source
tCO2e
Scope 2 emissions - Source tCO2e
Killara Feedlot cattle 44,826 69% Electricity - Australian sites 0 0%
Fleet transport fuel - diesel 17,450 27% Electricity - Elders Fine Foods, China 385 1%
Killara Feedlot equipment fuel - diesel and gasoline 1,418 2%
Other (including fleet transport fuel (gasoline), forklift fuel (LPG) and natural gas) 693 1%
Total: 64,772 tCO2e
Elders 2022 Annual Report 38
1 Between 1 July 2021 and 30 June 2022.
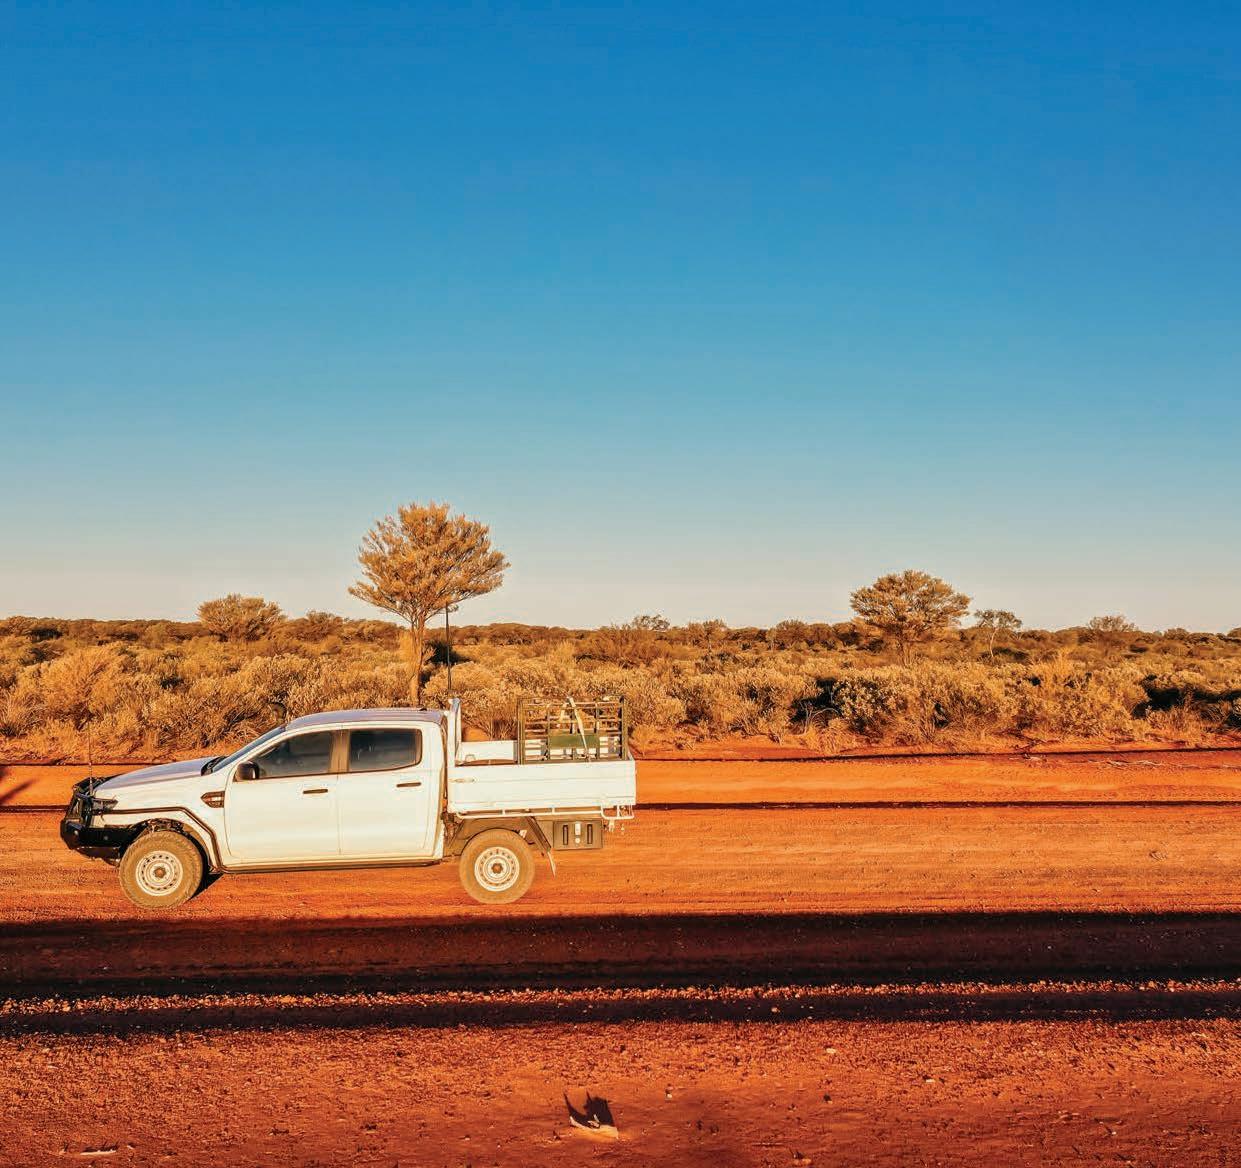
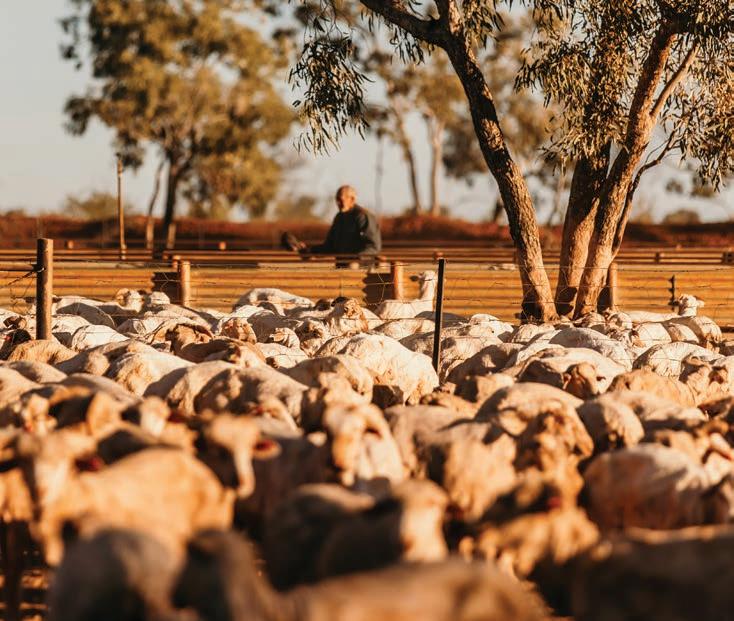


Sustainability
Success for Killara with investment in sustainability
A solar farm, an antimicrobial stewardship plan and world-first disease detection trials are just some of the measures Elders Killara is implementing to prioritise sustainable operations.
On the outskirts of Quirindi, New South Wales, lies Killara Feedlot, a 20,000-head beef cattle feedlot operated by Elders.
Killara is committed to supplying high-quality beef products, while operating sustainably. The initiatives in place at Killara are wideranging, and include measures based in both animal and environmental welfare and best industry practices.
Andrew Talbot, General Manager of Killara, explained that investing in new technology and adopting sustainable practices is crucial for the long-term health of the feedlot and just good business.
“Prioritising environmental and social factors results in better operations overall,” he said. “As staff safety and community engagement improve and our environment is better looked after, our cattle become healthier and happier.”
One of the most exciting developments is Killara’s involvement in a world-first trial for the early detection of Bovine Respiratory Disease (BRD). Working alongside industry bodies and international universities, it is hoped the findings from the trial will deliver improvements in drug efficacy and animal health across the globe.
Similarly, autogenous vaccine development, targeting the bacteria unique to BRD at Killara has seen vaccines approved and in use at the feedlot. Such vaccines are not yet commercially available in Australia, placing Killara in a unique position to reduce illness and mortality rates in cattle. Whilst in the early stages, there are positive early signs.
The feedlot has an antimicrobial stewardship plan in place, which is part of the facility’s ambition to reduce antibiotic use in cattle. Killara works closely with cattle suppliers as part of this plan, ensuring cattle are best prepared for feedlot entry, with strong immune response capabilities. The trends in recent years for animal health are positive, with excellent gains being recorded and mortality rates from BRD falling from 1% to 0.5% over the past five years.
There are further plans for milling operations at the feedlot to run predominantly on solar power, which is set to be sourced on-site from a 500-kilowatt solar farm, due for completion in late 2022.
Andrew explained this will reduce Killara’s dependence on electricity from the grid produced by fossil fuels.
“The solar farm is expected to supply most of the electricity used by our mill and potentially export an additional 200MWh of renewable electricity,” he said.
The removal of fossil fuels to power the processing mill at Killara is also underway.
“We are exploring other green energy sources such as hydrogen to power the plant in a clean and sustainable way,” Andrew said.
Other initiatives include the establishment of a centre pivot irrigation system to maximise water use efficiency, and a continued focus on managing nutrient and moisture levels in soil to optimise soil health and productivity.
In the coming months, Killara will be focusing on further developing its understanding of its current soil carbon baseline at Killara and its total farm carbon footprint, to identify more opportunities for improvement.
The initiatives at Killara are part of Elders’ wider commitment to sustainability, as outlined in Elders Eight Point Plan.
Mark Allison, Elders’ Managing Director and CEO said he is pleased to see the initiatives at Killara come to life.
“Sustainability is a core objective of Elders as we continue to operate, grow and support our people and communities,” he said.
“The efforts being made by our team at Killara are proof of this; Elders prioritises and celebrates responsible operations.”
Andrew said he is proud of the leadership that Killara is taking regarding sustainability, explaining that the health of the business is much more than just its profitability.
“The balance sheet of the business is now healthier and more financially sustainable which is great news for all of our stakeholders,” he said.
“But the real health of the business is more than the financial returns; it needs to include the health of the environment, the animals and the engagement of the staff, to ensure that those financial returns are sustainable into the future.”
Elders 2022 Annual Report 40
real health of the business is more than the financial returns; it needs to include the health of the environment, the animals and the engagement of the staff, to ensure that those financial returns are sustainable into the future.”
Andrew Talbot General Manager Killara, Elders
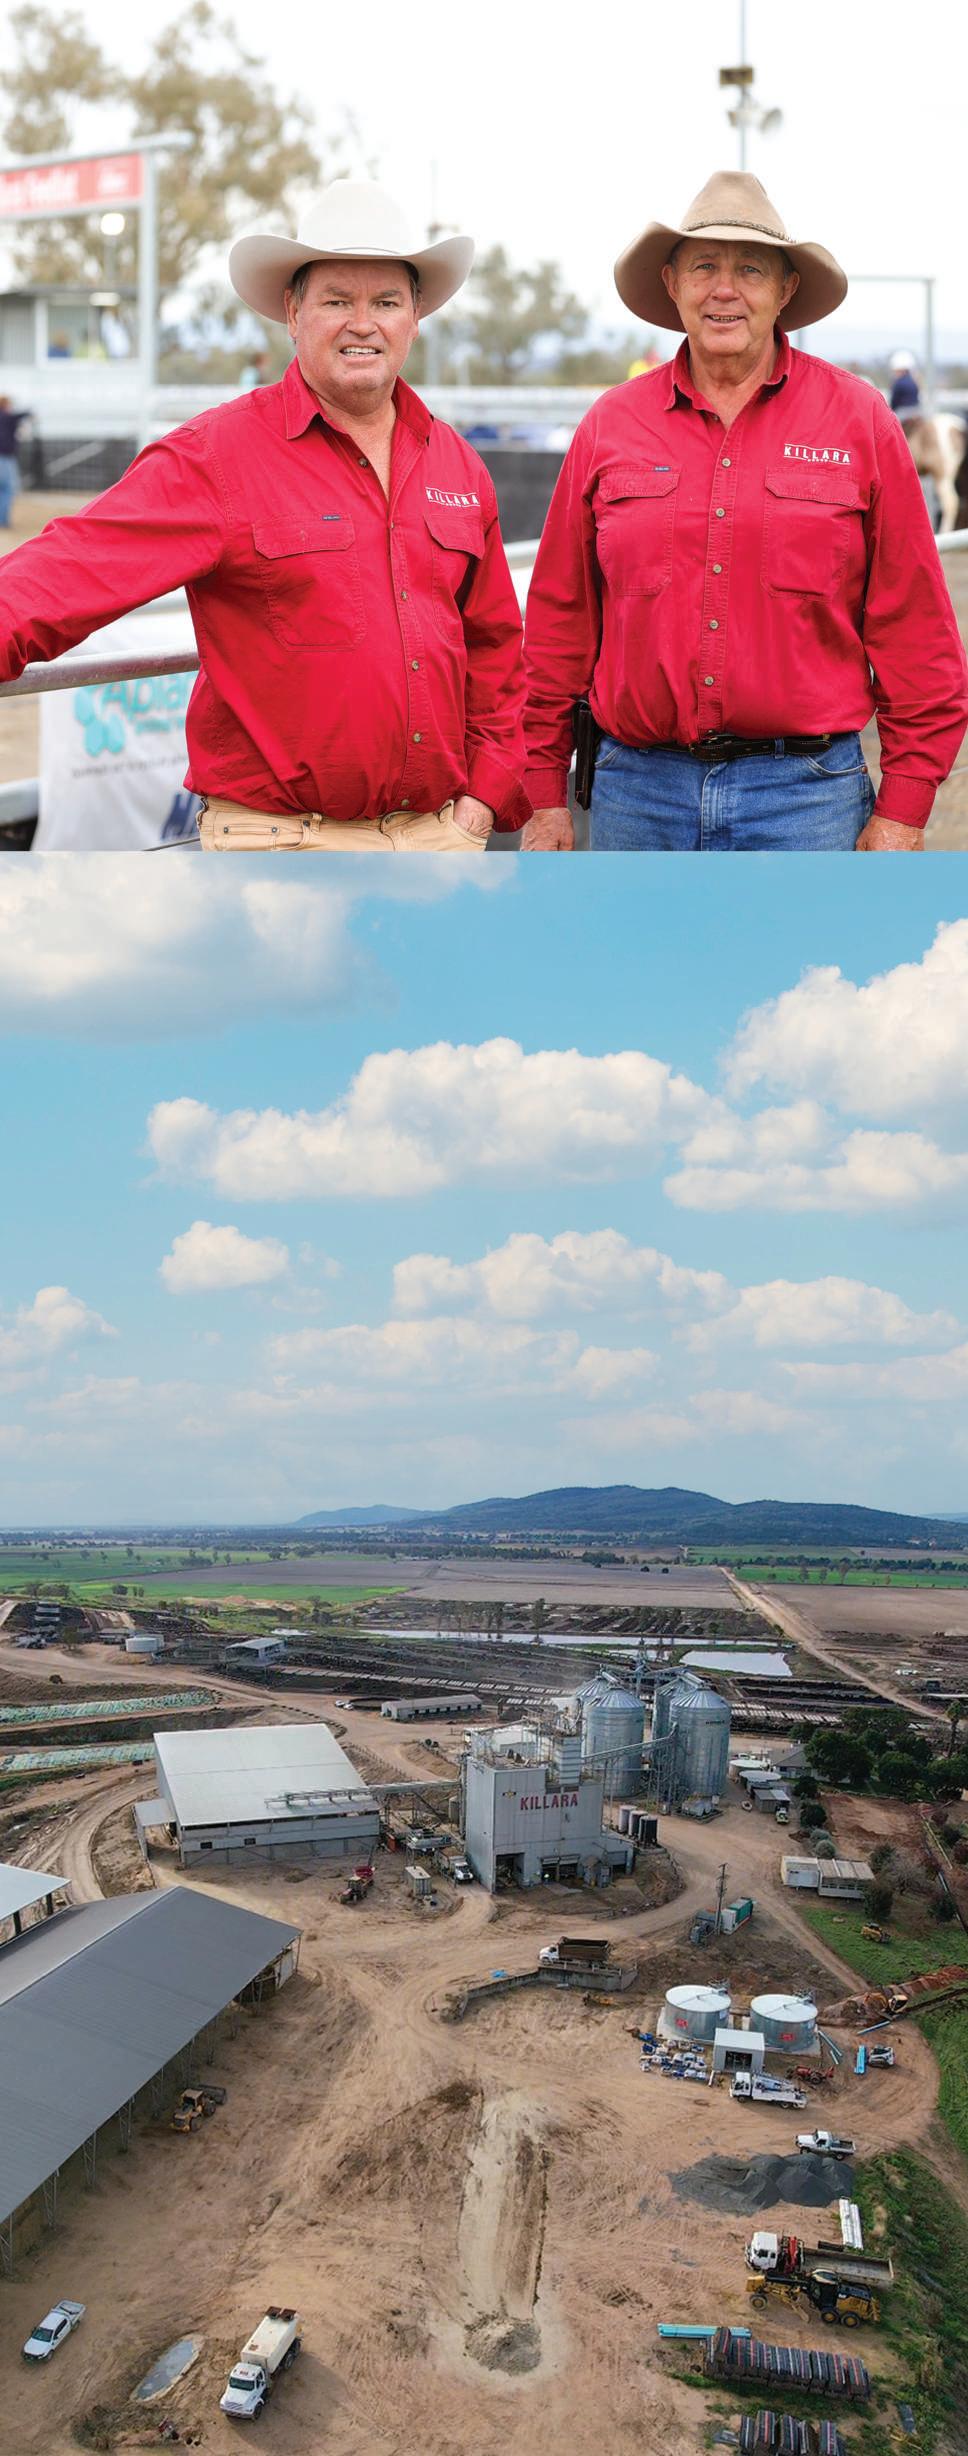
“The
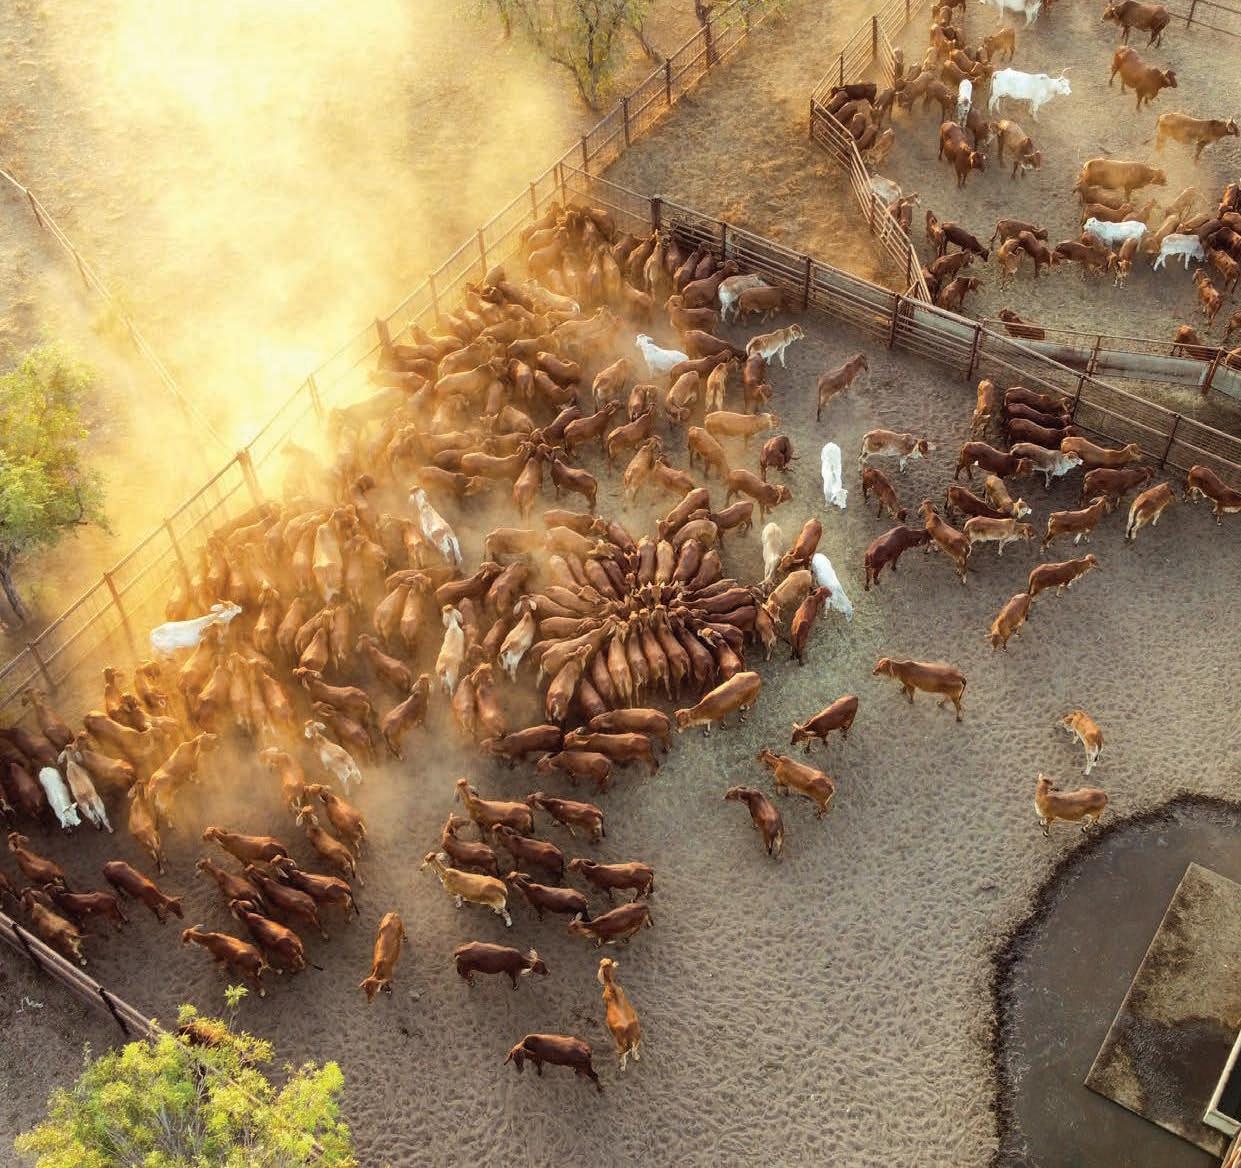
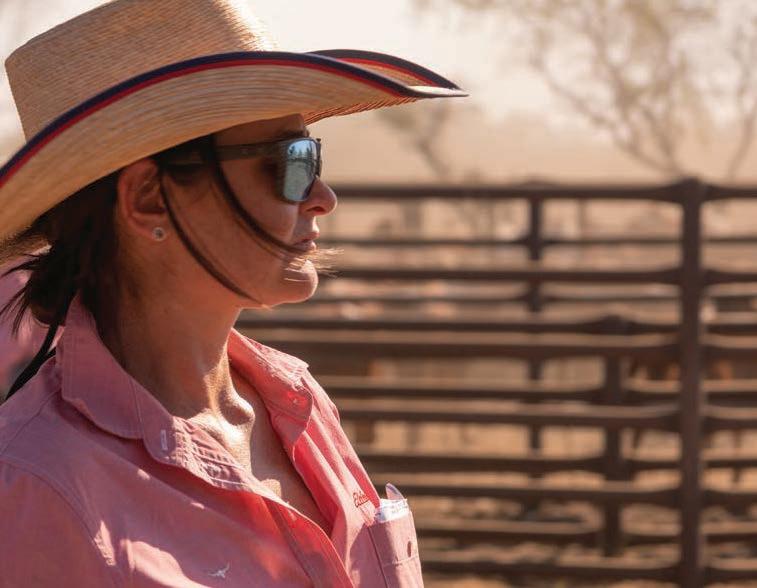
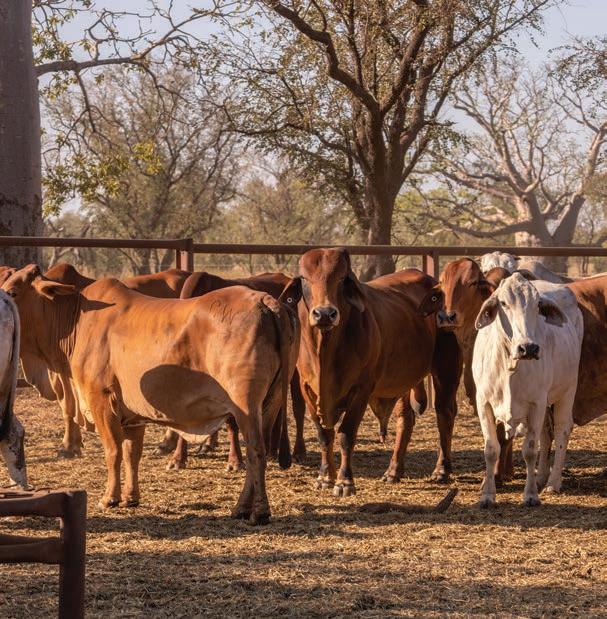


DIRECTORS’ REPORT 2022
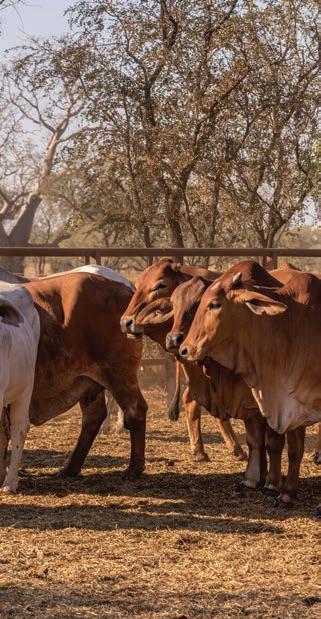
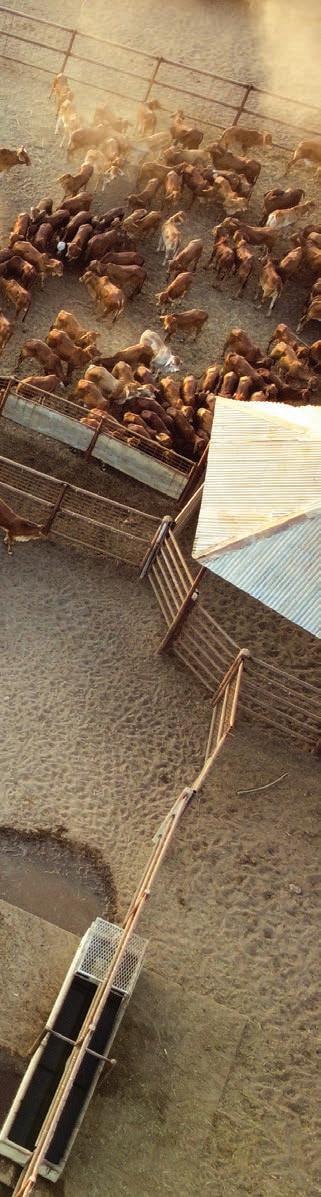
Directors’ Report
r Ian ilton
c, F , F P , F D,
Appointed Chair on 11 September 2019 and Non xecutive Director since 2014, Mr Wilton is also Chair (appointed 11 September 2019) of the Work Health and Safety Committee and Nomination and Prudential Committee. Mr Wilton is a member of the Audit, Risk and Compliance Committee (former Chair) and the Remuneration and Human Resources Committee.
Mr Wilton is an experienced non-executive director and former senior executive with extensive knowledge of the agricultural sector. He has held Chief Financial
Officer positions with Ridley Corporation imited, CSR Sugar and rainCorp imited. He was President and Chief xecutive Officer of rainCorp Malt.
Mr Wilton is a Non- xecutive Director of Namoi Cotton imited (since June 2020).
Mr Wilton was previously Chair of the advisory board of Mackay’s Banana Marketing and Non- xecutive Director of Sheep CRC td (Nov 2015 Sept 2020).
Mr Wilton is a resident of New South Wales.
r ar C arles Allison
r c, con, D , P ( , F D
Mr Allison oined lders imited as a Non- xecutive Directorin December 2009, served as Chairman and xecutive Chairman, before being appointed Managing Director and Chief xecutive Officer in May 2014.
Mr Allison’s agribusiness career of more than 40 years spans technical, manufacturing, supply and distribution roles and business. Previous roles include Managing Director/C O of rain rowers imited, Jeminex imited, Farmo Pty td, Wesfarmers andmark imited, Wesfarmers CSBP imited and CropCare Australasia Pty td and eneral Manger of Incitec Fertilisers.
Mr Allison is currently Chair of Agribusiness Australia, AuctionsPlus, the Agriculture and Natural Resources nd-User Advisory Board of the SmartSat CRC, the Agrifood and Wine Advisory Board of Adelaide University, a Non- xecutive Director of rain rowers imited and a member of the Rabobank Food and Agriculture Advisory Board.
Mr Allison oversaw the development and implementation of lders’ ight Point Plan in 2014, which returned the company to pure play agribusiness and resulted in the first shareholder distribution in nearly a decade. Since 2014, lders has grown from a market capitalisation of $50m to $1.9b.
s obyn Clubb A
c, , F Fin, D
Non- xecutive Director since September 2015, Ms Clubb is Chair of the Audit, Risk and Compliance Committee (appointed 11 September 2019) and a member of the Remuneration and Human Resources Committee (former Chair), the Work Health and Safety Committee and the Nomination and Prudential Committee.
Ms Clubb is an experienced Non- xecutive Director, a Chartered Accountant and Fellow of the Finance and Securities Institute of Australia. She has over 20 years’ experience as a senior executive in the financial services industry, working for organisations including AMP imited and Citibank imited.
Ms Clubb is currently a Director of Craig Mostyn Holdings Pty td (since Feb 2017, retiring Dec 2022), Chair of the Australian Wool xchange imited (since Aug 2016, retiring Nov 2022), Chair of Pro en imited (Director since Apr 2019), Non- xecutive Director of ssential nergy (since Apr 2018), Chair of FCFA easing imited (Director since Aug 2021) and a Director of Australia Post (since Sept 2022).
Ms Clubb is a resident of New South Wales.
Elders Annual Report
s Diana ilert
c ( d , o ( , D, e er o ie ec tive o
Non- xecutive Director since November 2017, Ms ilert wasappointed Chair of the Remuneration and Human Resources Committee on 11 September 2019. She is also a member of the Audit, Risk and Compliance Committee, the Work Health and Safety Committee and the Nomination and Prudential Committee.
With an executive career of over 25 years, Ms ilert has held senior executive roles with Suncorp, Citibank, IBM and News imited, during which time she developed experience in operational leadership, strategy, technology, digital disruption with alternate strategies for large incumbent businesses, and customer experience/marketing.

r att ew uinn c,
Non- xecutive Director since February 2020, Mr uinn is a member of the Audit, Risk and Compliance Committee, Remuneration and Human Resources Committee, Work Health and Safety Committee and Nomination and Prudential Committee.
Mr uinn holds a BSc in Chemistry and Management Science and is a Chartered Accountant. He also has senior executive experience as Managing Director of Stockland for 13 years.
en
Ms ilert is currently a Non- xecutive Director of Domain Holdings imited (since Nov 2017) and eypath ducation International Inc (since May 2021).
Ms ilert is also a member of the Australian Competition ribunal.
Ms ilert was previously a director of Super Retail roup imited (Oct 2015 Jan 2021) and Navitas imited (July 2014 July 2019).
Ms ilert is a resident of New South Wales.
s aelene urp y s, F , D
Non- xecutive Director since January 2021, Ms Murphy is a member of the Audit, Risk and Compliance Committee, Remuneration and Human Resources Committee, Work Health and Safety Committee and Nomination and Prudential Committee.
Ms Murphy holds a Bachelor of Business (Accounting), is a Fellow of the Institute of Chartered Accountants and a raduate of the Australian Institute of Company Directors. She also has many years experience as a senior executive, having previously been the C O of the Delta roup and Managing Director of 333 Management.
Mr uinn has extensive non-executive director experience in the Australian listed company environment. He is currently a director of CSR imited (since Aug 2013) and Chair of unlisted SA Management Holdings imited (since June 2018). Mr uinn was previously Chair of Class imited (Director July 2015 Feb 2022) and a Director of Regis Healthcare imited (Mar 2018 - Oct 2021).
Mr uinn is a resident of New South Wales.
Ms Murphy has strong non-executive director experiencein the Australian listed company environment, across a range of industry sectors. Her current AS non-executive director roles are at Bega Cheese imited (since June 2015), Integral Diagnostics imited (since Oct 2017) and Altium imited (since Sept 2016, retiring Nov 2022) and abcorp Holdings imited (since Aug 2022). Ms Murphy was also previously a non-executive director of Clean Seas Seafood imited (July 2018 - Oct 2020).
Ms Murphy is a resident of Victoria.
Directors’ Report
Directors and Secretaries
Elders’ Directors in office during the financial year and until the date of this report were:
Non-Executive Directors
• Ian Wilton, Chair
• Robyn Clubb
• Diana Eilert
• Matthew Quinn
• Raelene Murphy
Executive Director
• Mark Charles Allison, Managing Director and Chief Executive Officer
Company Secretaries
• Peter Gordon Hastings, BA, LLB, GDLP, FGIA, Grad Dip Applied Corporate Governance, GAICD
Mr Hastings was appointed Company Secretary in February 2010. He held the position of Group Solicitor with the Elders Group between 1995 and 1999 and again between 2003 and 2010. He has also held the position of General Counsel since February 2010. Peter is also Chair of Walford Anglican School for Girls.
• Shannon Hope Doecke, BAcc, Grad Dip Applied Corporate Governance, MAICD, AGIA
Ms Doecke was appointed as a Company Secretary in July 2020. Ms Doecke has served as the Assistant Company Secretary since April 2019. Ms Doecke previously worked for AustCham Shanghai, between 2014 and 2019, as Governance Manager, then Company Secretary.
Principal Activities
The principal activities of Elders during the year were:
• the provision of retail products and associated services to the rural sector
• the provision of wholesale products to independent rural and regional farm supplies retailers
• the provision of livestock and wool agency services
• the provision of real estate sales agency services (both companyowned and franchised) and property management services
• arrangements for the provision of financial services to rural and regional customers,
including a 20% investment in Elders Insurance (Underwriting Agency) Pty Ltd
• the provision of digital and technical services, agricultural market information and investments in the AuctionsPlus and Clear Grain online trading platforms
• feedlotting of cattle
Results and Review of Operations
The consolidated entity recorded a profit for the year, after tax and non-controlling interests, of $162.9 million (2021: profit of $149.8 million). A review of the operations and results of the consolidated entity and its principal businesses during the year is contained in pages 23 to 30.
Significant Changes in the State of Affairs
There were no significant changes in the state of affairs of the consolidated entity that are not otherwise disclosed elsewhere in this annual report.
Impacts of COVID-19
As in FY20 and FY21, Elders' response to COVID-19 has been a “safety first” programme aimed at keeping our employees, customers, contractors and other stakeholders as protected from COVID-19 infection in the workplace as possible. This approach has also focused on the mental health consequences of the pandemic and responses to it on our employees.
A range of measures have been implemented to help manage the risk of COVID-19 infection in our workplaces, and the mental health issues that can be a consequence of COVID-19 and societal restrictions introduced to combat it. Key employees across the country received mental health first aid training and Elders' myWellbeing team continue to roll out communications to increase understanding and awareness around health and wellbeing.
Throughout Elders' network we have, through our COVID-safe plans, worked to minimise the spread of COVID-19. Fortunately the impact to our business has been minimal and contingency plans have enabled Elders to continue to service our customers. Our stores continue to maintain a thorough cleaning regime in line with our COVID-safe plans.
While COVID-19 pandemic conditions appear to be easing in Australia at the date of this
report, COVID-19 remains a global pandemic as declared by the World Health Organisation. Elders has considered the impact of COVID-19 when preparing the consolidated financial statements and related note disclosures, and continues to monitor the impact on our employees, demand for Elders' products and services, customers, communities and supply chains.
Events Subsequent to Balance Date
There was no matter or circumstance that has arisen since 30 September 2022 which is not otherwise dealt with in this report or in the consolidated financial statements, that has significantly affected or may affect the operations of Elders, the results of those operations or the state of affairs of Elders and its controlled entities in subsequent financial periods.
Likely Developments and Future Results
Discussion of other likely developments in the operations of the consolidated entity and the expected results for those operations in future financial years is included on page 31 of this report.
Attendance at Meetings by Directors
Director attendance at scheduled meetings in the 12 months to 30 September 2022 is set out below.
Committee attendance is only recorded where a director is a member of the relevant committee. Although Mr Allison is recorded as a nonmember for some committees, he attended all meetings held for each of those committees.
Elders 2022 Annual Report 46
Board of Directors Work Health and Safety Committee Audit, Risk and Compliance Committee Remuneration and Human Resources Committee Nomination and Prudential Committee Attended Held Attended Held Attended Held Attended Held Attended Held I Wilton 12 12 2 2 5 5 5 5 2 2 M C Allison 12 12 2 2 R Clubb 12 12 2 2 5 5 5 5 2 2 D Eilert 12 12 2 2 5 5 5 5 2 2 M Quinn 11 12 2 2 5 5 5 5 1 2 R Murphy 12 12 2 2 5 5 5 5 2 2
Dividends and Other Equity Distributions
On 11 November 2022, the Directors determined to pay a final dividend of $0.28 per ordinary share, franked at 30%, bringing dividends for FY22 to $0.56 per share. In accordance with a determination made by the Directors, Elders’ Dividend Reinvestment Plan remains in operation. Dividends paid during the year were
Dividend
Date Determined Date Paid Dividend per Share Franking Rate Total Dividend
Final Dividend for Half Year Ended 30 September 2021 12 November 2021 17 December 2021 $0.22 20% $ 34,424,846.28
Interim Dividend for Half Year Ended 31 March 2022 20 May 2022 17 June 2022 $0.28 30% $ 43,813,440.72
Share Options and Performance Rights
Share options and rights may be granted to company executives under the Long-Term Incentive Plan that is part of Elders’ remuneration structure. Information about the Long-Term Incentive Plan can be found in the Remuneration Report on pages 51 to 69 of this Annual Report.
The number of performance rights on issue at 30 September 2022, which were held by 21 Long-Term Incentive Plan participants, is disclosed in note 26 to the Financial Statements. If each of these rights vested, this would represent 0.74% of the Company’s current issued ordinary shares.
These performance rights are Elders’ only unquoted equity securities and represent the number of performance rights outstanding at the date of this report. The representation below differs from note 26 in the financial statements which does not take into account performance rights that vested after the reporting date. The closing performance rights per note 26 of the financial statements includes the 487,916 rights that vested on 14 November 2022.*
1,238,666 (389,750) 391,900 (90,133) (487,916) 662,767
No. of rights as at 30 Sept 2021
No. of rights vested on 15 Nov 2021*
* in accordance with Australian accounting standards
No. of rights granted since the AGM on 16 Dec 2021
No. of rights lapsed from 30 Sept 2021 to date of report
No. of rights vested on 14 Nov 2022*
No. of rights outstanding at the date of report
The performance rights granted to the five most highly remunerated officers as part of their remuneration, between 30 September 2021 and the date of this report, are shown below.
Name of Officer
Number of Rights Granted between 30 September 2021 and 14 November 2022
Mark Charles Allison 102,400
Malcolm Hunt 20,500
Peter Gordon Hastings 18,800
Thomas Benjamin Russo 18,700
Elizabeth Therese Ryan 17,900
Share and Other Equity Issues During the Year
The total number of ordinary shares on issue at the date of this report is 156,476,574.
Elders has historically issued new shares to satisfy allocations under its incentive plans and dividend reinvestment plan. In late 2021, the Board determined that shares allocated for these purposes should be purchased on market. Therefore, there has been no change to the number of ordinary shares on issue between 1 October 2021 and the date of this report.
Restricted Securities and Voluntary Escrow
As at the date of this report, Elders has no restricted securities on offer.
Nonetheless, pursuant to the FY21 short-term incentive (STI) plan, 40% of the STI earned by executives was delivered in shares that are subject to trading restrictions. A total of 86,523 shares were allocated to plan participants under the FY21 STI plan. At the date of this report 43,258 shares allocated under the FY21 STI plan are held by plan participants and remain subject to the plan's trading restrictions. (Further information about the FY21 and FY22 short-term incentive plans is included in the 2022 Remuneration Report, commencing on page 51).
Directors’ Report 47
emuneration o Directors and Senior xecutives
Details of the remuneration arrangements in place for lders’ ey Management Personnel are set out in the Remuneration Report commencing on page 51. In compiling this report lders has met the disclosure requirements prescribed in the Australian accounting standards and Corporations Act 2001.
Directors Interests
he relevant interests of the Directors in shares and other equity securities of lders, as at the date of this report, are detailed on page 69 of the Remuneration Report.
Insurance o Officers and Indemnities
he consolidated entity paid an insurance premium in respect of a contract insuring each of the Directors of lders named earlier in this report and each full time xecutive Officer, Director and Secretary of Australian group entities against liabilities and expenses arising as a result of work performed in their respective capacities, to the extent permitted by law. he terms of the policy prohibit disclosure of the premiums paid.
As at 30 September 2022, each Director and Officer had entered into a Deed of Access, Insurance and Indemnity which provides: that lders will maintain an insurance policy insuring the Officer against any liability incurred by the Officer in the Officer’s capacity as an Officer of lders or another group entity to the extent allowed by law for indemnity against liability as an officer, except to the extent of indemnity under the insurance policy or where prohibited by law for access to company documents and records, sub ect to undertakings as to confidentiality
nvironmental Per ormance egulation
A number of lders operations are sub ect to environmentallegislation. Such legislation is diverse and varies between states, territories, local authorities and various regulators. Compliance with relevant legislation is managed on the ground by our branches and overseen and guided by our internal Safety, Risk and nvironment Business Partners. nvironmental risks and ha ards are managed in accordance with our Resilience Framework. Our performance in relation to environmental management and the various applicable environmental regulations across our various businesses over the reporting period is as follows.
illara Feedlot
lders operates illara Feedlot, a beef cattle feedlot, in uirindi, New South Wales. illara is sub ect to both state and local government environmental legislation, and its operation is conditional on it maintaining its environment protection and water licences.
In accordance with its environment protection licence ( P icence), illara is required to undertake a significant number of environmental management activities to ensure that it is managing its waste, dust and odour emissions to minimise pollution of the surrounding community and to avoid groundwater and soil contamination. Failure to manage these emissions can affect the amenity of the local community and contaminate private and public property.
missions are monitored internally by illara, and externally by the New South Wales nvironment Protection Authority (NSW PA) and the National Pollutant Inventory (NPI). illara submits reports to the NPI detailing emissions of NPI substances (including ammonia, carbon monoxide and oxides of nitrogen) and activities illara has participated in to reduce these emissions. illara also submits annual reports to the New South Wales PA describing (amongst other things) management systems in place to manage soil health and nutrient levels, odour and dust, waste, protection of local waterways and any pollution complaints received in the reporting year. hese reports are prepared by an external consultant.
illara is also sub ect to licence requirements for water consumption and waste management.
No confirmed breaches of environmental regulations or pollution complaints relating to illara were reported during the year ended 30 September 2022. illara s performance on water management and consumption and waste management is detailed on pages 44 and 25 of lders 2022 Sustainability Report.
Saleyards
Saleyards are sub ect to various state, territoryand local government environmental requirements, particularly relating to effluent management, dust and noise. hese obligations vary from place to place and generally only apply to saleyards above a prescribed si e. lders expects its saleyard operations, irrespective of their si e, to abide by the applicable laws and regulations.
No breaches of environmental regulations affecting lders’ saleyards were reported during the year ended 30 September 2022.
etail and olesale Operations
lders’ retail and wholesale operations are sub ectto state environmental regulations relating to the storage, handling, transport and sale of dangerous goods, which include some of the agricultural chemicals, fertilisers and poisons we supply. Although these regulations are based on nationally recognised standards, the regulatory environment for the transporting, handling, storage, sale and use of such dangerous goods, chemicals and scheduled poisons is complex and sub ect to regulations imposed by each state and territory. lders Safety, Risk and nvironment Business Partners monitor compliance with these regulations. In addition, many of lders’ branches and personnel participate in an accreditation, training and audit program
operated by AgSafe. hese assurance activities are being progressively rolled out to our wholesale operations.
lders is not aware of any breaches of environmental regulations affecting lders’ retail or wholesale operations that were reported during the year ended 30 September 2022.
ounding o Amounts
he parent entity is a roup of the kind specified in ASIC Corporations (Rounding in Financial/Directors Report) Instrument 2016/191 issued by the Australian Securities and Investments Commission. In accordance with that class order, amounts in the Financial Report and Directors’ Report have been rounded to the nearest thousand dollars unless otherwise stated.
on-Audit Services
Based on advice received from the Audit, Risk and Compliance Committee, the Directors are satisfied that the provision of non-audit and audit-related services is compatible with the general standard of independence for auditors imposed under the Corporations Act 2001 for the following reasons: all non-audit and audit-related services have been reviewed by the Audit, Risk and Compliance Committee to ensure they do not impact on the impartiality or ob ectivity of the auditor the nature and scope of the non-audit services provided means that auditor independence was not compromised
he amount received or due to be received for the provision of non-audit services is disclosed in note 27 of the financial report, Auditors’ Remuneration.
A copy of the auditor’s independence declaration as required under section 307C of the Corporations Act 2001 is set out on page 126.
his report, including the Remuneration Report commencing on page 51, is made in accordance with a resolution of Directors.
Ian ilton Chair ar Allison Managing Director
Elders Annual Report
14
November 2022


Directors’ Report
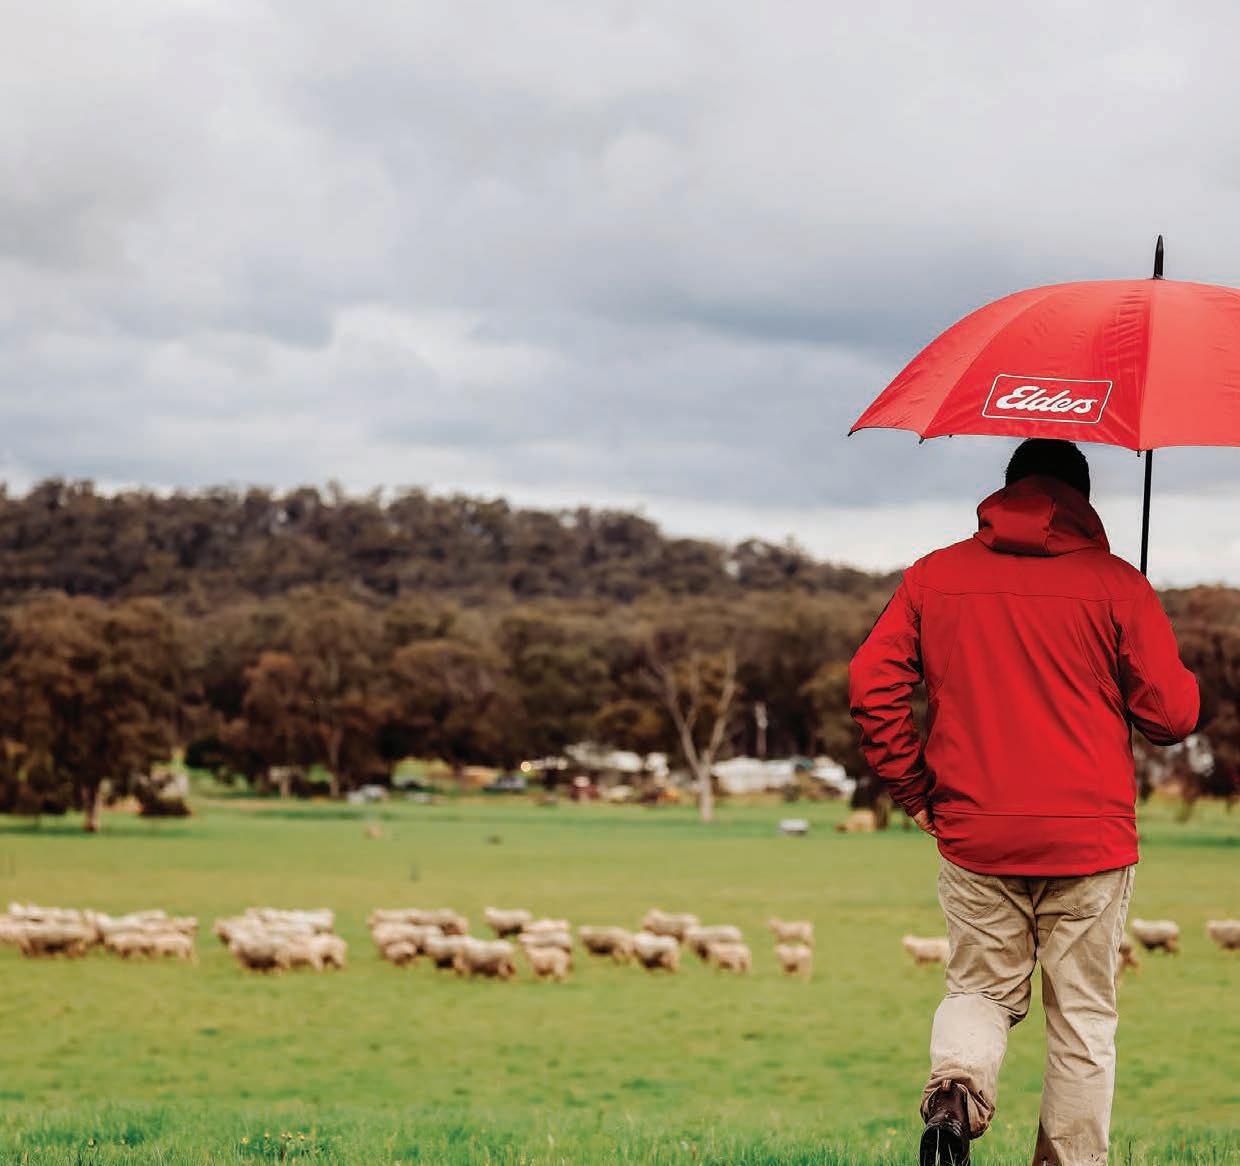
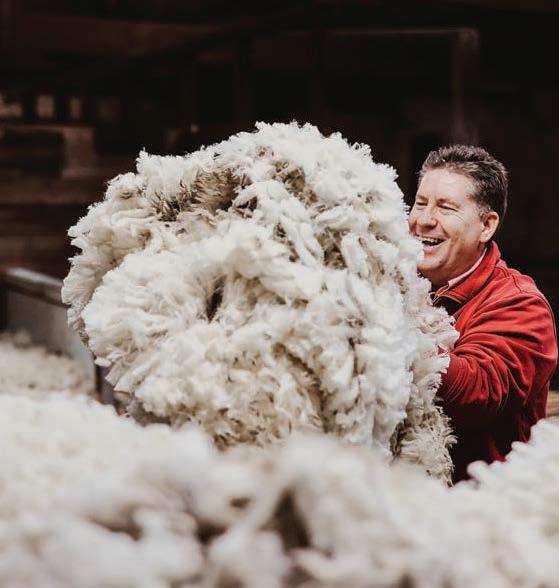
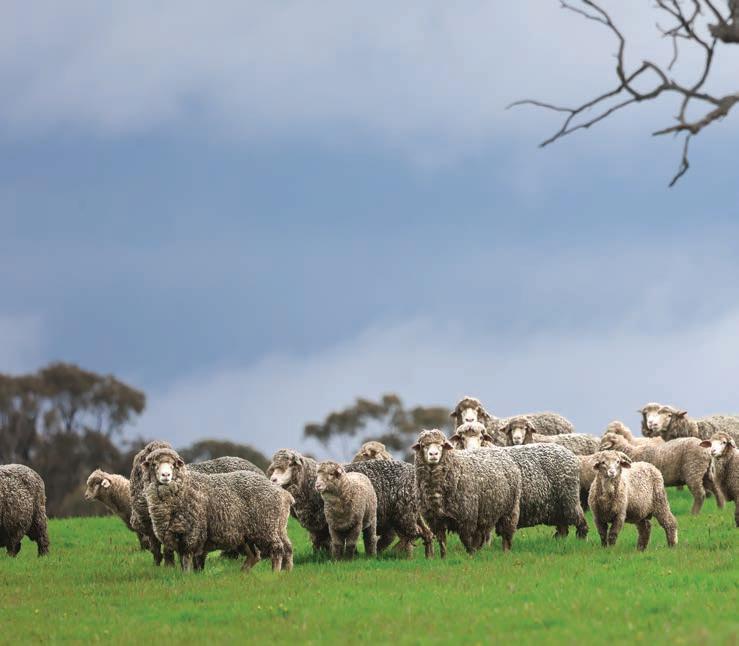


REMUNERATION REPORT

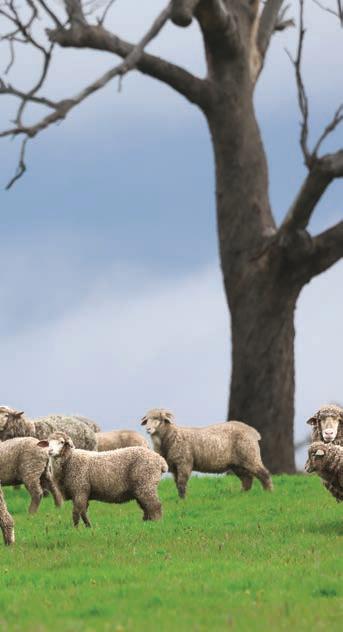
Remuneration Report
Following is the Remuneration Report for the consolidated entity for the year ended 30 September 2022. The Remuneration Report provides shareholders with an understanding of Elders’ remuneration policies and the link between our remuneration approach and our performance, in particular with regard to Elders’ Key Management Personnel (KMP).
The remuneration outcomes presented in this report reflect the results of Financial Year 2022, not only the business performance, but also strong alignment with outcomes for our shareholders.
The information provided in this report has been audited, unless otherwise indicated, as required by the Corporations Act 2001 (Cth) and forms part of the Directors’ Report.
Remuneration at a Glance
Our Year
Our FY22 underlying EBIT of $232.1 million represents an increase of 39% on FY21.
Excellent seasonal conditions, strong commodity prices and the hard work of the Elders team have driven the strong growth. In addition our well-executed growth strategy, which targets a balance between organic and acquisitive growth, has continued to produce value for shareholders.
KMP Changes
The Board reviewed the KMP for FY22 and determined the following persons are KMP:
• Non- Executive Directors
• Managing Director and Chief Executive Officer
• Chief Financial Officer (CFO)
The following changes were made to the Executive KMP during FY22:
• Tania Foster, Chief Financial Officer, ceased employment with Elders on 31 August 2022
• The role occupied by Malcolm Hunt, Executive General Manager National & Victoria/Riverina, was determined by the Board not to be a KMP role for FY22 effective 1 October 2021 as the role no longer encompassed the responsibility for the strategic direction of Elders
Remuneration Changes Implemented
in FY22
Elders' Reward Framework was reviewed in FY20 and remains relevant to Elders with the only changes:
• FY22 Short-Term Incentive (STI) changes to gateways: addition of, for this year only, a greater than prior year EBIT gateway addition of a no significant environmental event gateway removal of ROC hurdle as a gateway, but maintaining ROC as a modifier and a key financial measure in the MD & CEO STI
Further details are in section 3.1 of this Remuneration Report.
• FY22 Long-Term Incentive relative TSR comparator peer group will comprise all companies in the S&P/ASX 200 to align with shareholders expectations. Previously, this peer group included S&P/ASX 200 with the exclusion of companies in the S&P/ASX 100.
Further details are in section 3.1 of this Remuneration Report.
Elders 2022 Annual Report 52
•
Remuneration Changes for FY23
• FY23 Short-Term Incentive Changes to gateways of: removal of greater than prior year EBIT EBIT threshold gateway increase to 95% of EBIT budget (from 90%) addition of sustainability measure as a key priority in MD & CEO measures to reflect the focus of Elders on sustainability.
Non-Executive Directors Fees
NED fees will increase by 3% from 1 January 2023. In addition, with expansion of the oversight responsibilities of the Board Work Health and Safety Committee (which will become the Board Safety and Sustainability Committee, effective 1 January 2023), the Board reviewed and equalised fees paid to the chairs and members of each Committee. From 1 January 2023, the Committee Chair fee is $25,000 and the Member fee is $12,500 for all Committees other than for the Nomination and Prudential Committee which continues to attract no fee for the Chair or a Member.
• Non-Executive
Directors Fee Pool
Approval is being sought at the 2022 AGM to increase the Fee Pool by $300,000 from $1,200,000 to $1,500,000. The proposal follows consideration of Board succession planning which identified a need to appoint an additional Non-Executive Director. The Board expects to appoint the new Director in FY23.
Overview of FY22 Remuneration Outcomes
Total Fixed Remuneration (TFR)
The MD & CEO’s TFR increased 2% and CFO's TFR increased 1% effective 1 January 2022. All increases considered market movements, individual performance and benchmarking to relevant peers.
Variable Remuneration
Short-Term Incentives
Elders' Short-Term Incentive pool is aligned with company performance and shareholders' interests and reflects the very strong FY22 EBIT results.
The MD & CEO’s FY22 STI outcome was 74.5% of maximum opportunity.
The CFO's FY22 STI outcome was 100% of maximum opportunity as per separation arrangements. Further details are in section 2.1 of this Remuneration Report.
Long-Term Incentives vesting
The FY20 LTI grant 3 year performance period ended 30 September 2022. 100% of this grant vested based on:
• an absolute TSR outcome of 27.7% which exceeded the stretch target of 14%
• an EPS CAGR outcome of 36.6% which exceeded the stretch target of 10%
• a ROC outcome of 26.2% which exceeded the stretch target of 18%
Further details are in section 2.2 of this Remuneration Report.
Non-Executive Director Fees
The Board reviewed NED fees against market fees and applied an increase of 2% to the Chair fee, member Board fees and Committee fees effective 1 January 2022. Further details are in section 5.2 of this Remuneration Report.
Contents
Key Management Personnel 54
1 Overview of FY22 Executive Remuneration 55
2 Link Between Elders’ Financial Performance and FY22 Remuneration Outcomes 56
3 Details of the Executive Remuneration Framework 61
4 Remuneration Governance 64
5 Non-Executive Director Remuneration and Statutory Remuneration 65
6 Key Terms of Executive KMP Employment Contracts and Statutory Remuneration 66
7 Additional Required Disclosures 68
Remuneration Report 53
Key Management Personnel
In this report, KMP are determined in accordance with the definition under the Accounting Standard AASB124 Related Party Disclosures as those persons with authority and responsibility for planning, directing, and controlling the activities of Elders during the financial year.
The MD & CEO and Senior Executives considered KMP are referred to collectively as “Executive KMP” in this report.
FY22 Key Management Personnel
Name Position Status Date as KMP (if not a full year)
Non-Executive Directors
I Wilton Chair Full year
R Clubb Director Full year
D Eilert Director Full year
R Murphy Director Full year
M Quinn Director Full year
Executive KMP
M C Allison Managing Director and CEO
Former Executive KMP
T Foster Chief Financial Officer
Full year
Part year Ceased 31 August 2022
Elders 2022 Annual Report 54
Section 1 Overview o FY22 xecutive emuneration


lders’ remuneration framework is designed to attract, retain and motivate whilst driving lders’ culture and delivering our business strategy, long-term companyperformance and creation of shareholder value.
1.1 emuneration Principles
Drive outcomes and provide a balance between motivation, ris and reward.
1.2 emuneration Structure and ix
ar et competitive to attract and retain ey talent.
eward is commensurate wit per ormance.
Decisions are ob ective and consistent.
Simple and lexible allowing or business growt .
ein orces lders culture, vision and values.
Remuneration Report
o drive and support delivery o lders strategy and create long-term s are older value.
Remuneration Year 1 Year 2 Year 3 100% paid in cash Attracts and retains executives with the
and experience to deliver our
Remuneration is structured so a portion of an xecutive MP’s and other Senior xecutive s reward depends on meeting individual, business unit and lders’ targets and ob ectives, including maximising returns for shareholders. xecutive MP and other Senior xecutives remuneration elements, structure and delivery Fixed
capability
strategy.
and rewards
60% paid in cash and 40% deferred to equity
Supports
100% delivered in performance rights Base salary, superannuation and other benefits 50% subject to relative TSR (and additional requirement of absolute TSR is greater than or equal to zero) 50% subject to EPS growth Year 4 3 year performance period 1 year holding lock STI Cash Subject to performance targets across the performance year Deferred STI vests in 2 equal tranches over 2 years xecutive MP FY22 remuneration mix at maximum MD & CEO Performance Based Performance Based Senior Executives (Including KMP) Total Fixed Remuneration 32% Maximum STI 32% Maximum LTI 36% Total Fixed Remuneration 49% Maximum STI 24% Maximum LTI 27%
Short-Term Incentive Motivates
for achievement of annual performance against Elders’ overall results and individual key performance indicators.
Long-Term Incentive
alignment to long-term overall company performance rewarding for delivery of longer term strategy and creating shareholder value.
Section 2 in etween lders Financial Per ormance and FY22 emuneration Outcomes
2.1 Overview o FY22 S I Outcomes
xecutive MP FY22 S I performance measures
Category Per ormance measure eig ting y was it c osen
nsures xecutive MP will only be awarded where threshold financial, Code of Conduct, safety and environmental performance has been achieved.
ow is it measured ateway Achievement of threshold performance for underlying BI , greater than prior year BI outcome, ero fatalities, adherence to lders Code of Conduct and no significant environmental event
Financial measures Financial and operational performance
60% ey indicators of lders’ financial performance and aligned to lders’ ight Point Plan ob ectives.
Strategic measures Strategic Priorities 20% he Board believes the strategic priorities of lders’ ight Point Plan are fundamental key drivers of long-term value creation.
People and safety 10% Focusing on our people through diversity and employee engagement is critical to continue to attract and retain the talent needed to deliver our strategy.
Safety is about driving significant progress in achieving a ero harm workplace.
Customer 10% Focusing on building and maintaining effective customer relationships is key to a long-term sustainablebusiness.
MD C O FY22 S I outcomes
hreshold is based on achievement of: 90% of the Board approved underlying BI budget greater than prior year BI outcome adherence to lders Code of Conduct ero fatalities no significant environmental event.
Below the BI threshold no S I is payable to xecutive MP.
Achievement of Board approved budget financial outcomes, including underlying BI , Operating Cash Flow and ROC targets.
he MD C O is measured by the overall key milestones of the ight Point Plan which is translated into an Annual Operating Plan.
Other xecutive MP are measured on achievement of their Business Unit’s key milestones in this Plan.
People is measured through positive movement in the representation of women in management and employee engagement and enablement.

Safety is measured through reduction in total recordable in ury frequency rate and completion of risk radar actions.
Measured through the Roy Morgan rust Survey and customer net promoter score.
ey Priority easures arget Outcome FY22 Per ormance Commentary
Financial easures (60%)
Underlying BI $180m $232.1m
Operating Cashflow (over 12-month period) $114m $113.7m
Return on Capital 22% 26.2%
Strategic Priorities (20%)
People Sa ety (10%)
Deliver Business Improvement initiatives to improve ruralproduct margin +1% between 0% and 1%
Deliver system modernisation pro ect as per milestones and budget Board Assessed xceeded arget Achievement of FY22 Sustainability Action Plan Board Assessed arget

otal recordable in ury frequency rate ( RIFR) <14 12.6
Completion of annual risk radars across lders and completionof risk radar actions 96% 70% 100% 87%
Positive trend towards four Board endorsed diversity ob ectives including working towards 25% of women in management positions across the organisation
20% 17%
Senior leadership development and succession planning Board Assessed arget
Customer (10%) Roy Morgan rust Survey Results for most rusted Brandin Regional Australia No. 1 No. 1

Customer Net Promoter Score (average across year) 50% 48.7%
FY22 underlying BI was 39% higher than FY21. It substantially exceeded budget and prevailing market expectations at the start of the year and was supported by strong return on capital. Operating cash flow was impacted by investment in working capital to support the growth in business.

83.3% of this key priority was awarded.
Product margin growth fell short of target due to dynamic global market conditions. System modernisation pro ect, a key business transformation, is meeting key pro ect milestones and budget. FY22 Sustainability Action Plan is meeting key milestones.

60% of this key priority was awarded.
Decrease in RIFR, strong risk radar outcomes, deliveryof one of the four diversity ob ectives and delivery of senior leadership development and succession planning.
78.5% of this key priority was awarded.
lders continues to be the most trusted agribusiness brandamong farmers, through the efforts of our employees. Our customer net promoter score fell ust short of target.
50% of this key priority was awarded.
Maximum performance achieved hreshold/Minimum performance achieved hreshold/Minimum performance not met
Elders Annual Report
2.1 Overview of FY22 STI Outcomes
continued
Executive KMP FY22 STI outcomes and performance against targets
KMP Financial Measures (60%) People and Safety (10%) Strategic Priorities (20%)
M C Allison, MD & CEO
Former KMP
Customer (10%) Maximum STI Opportunity Awarded STI as % of Maximum
Forfeited STI as % of Maximum
Company Company Company Business Unit $ % %
Meets target Meets target Meets target Meets target 1,123,200 74.5% 25.5%
T Foster, CFO Meets target Meets target
Meets target Meets target 313,700 1001 0
1 Approved by Board, to award 100% of STI in cash to the former CFO for the full FY22 as part of separation arrangements.
2.2 Overview of FY22 LTI Outcomes
The FY20 LTI grant, with a performance period of 3 years, concluded 30 September 2022. The testing resulted in 100% vesting.
Finalised LTI – FY20 grant
2.2 Overview of FY22 LTI Outcomes
% of Total Grant Performance Measures
Tranche 1 – Total Shareholder Return (TSR)
50% Based on Elders’ average annual compound TSR over the three year performance period 1 October 2019 ending on 30 September 2022. TSR rights were subject to a target goal and a stretch goal. The percentage of TSR rights that vest were determined as follows:
Absolute TSR over the performance period % of Rights that vest
Less than 10% Nil
Equals 10% 50%
Greater than 10% but less than 14% 50-100%, on a straight-line sliding scale
Equal to or greater than 14% 100%
Absolute TSR was measured using opening and closing share prices determined as follows:
• the opening share price value of $6.27
• the closing share price value based on the 5 trading day Volume Weighted Average Price (VWAP) up to and including the last day of the performance period
• dividends paid in the performance period
Tranche 2 – Earnings per Share Growth
25%
EPS rights vest subject to achievement of Target or above EPS Compound Annual Growth Rate (CAGR) over the performance period as follows:
EPS CAGR over the performance period % of Rights that vest
Less than 7% Nil
Equals 7% 50%
Outcome of Testing
Elders’ absolute TSR over the performance period was 27.7%. Resulting in 100% vesting of this tranche.
Notes regarding calculation: The starting price to calculate the Compound Average Growth Rate was Elders' 5 trading day VWAP up to and including 30 September 2019 of $6.27 and the closing share price of Elders' 5 trading day VWAP as at 30 September 2022 of $11.887.
Dividends paid over the performance period were $1.01 per share. An external consultant (PFS Consulting) was engaged to calculate the TSR outcome.
Elders' EPS growth over the performance period was 36.6%. Resulting in 100% vesting of this tranche. As communicated in FY20, EPS for the purposes of LTI will be calculated using the weighted average shares as the denominator and underlying NPAT3 as numerator. The EPS outcome for FY22 was determined as follows:
FY19 FY20 FY21 FY22
Weighted avg. no. of shares1 (000) 121,006 154,094 156,305 156,477
Underlying NPAT ($ million) 63.6 109.02 151.1 209.73
Greater than 7% but less than 10% 50-100%, on a straight-line sliding scale EPS (cents) 52.6 70.72 96.7 134.13 CAGR 36.6%
Equal to or greater than 10% 100%
Remuneration Report 57
2.2 Overview
of FY22 LTI Outcomes
% of Total Grant Performance Measures
Outcome of Testing
Reconciliation of statutory profit to underlying profit used to calculate EPS for this LTI grant FY22
Statutory Profit ($ million) 162.9
● Basic EPS (cents) – Statutory Profit 104.1 Adjustment for non-underlying items ($ million) (10.7) Underlying NPAT ($ million) 152.2
● Basic EPS (cents) - Underlying NPAT 97.3 Adjustment for tax expense 57.5 Adjusted NPAT ($ million)3 209.7 Basic EPS (cents) - Adjusted NPAT 134.1
Weighted average shares (millions of shares) 156.5
Reconciliation of tax expense adjustment
Statutory tax expense 67.7
Tranche 3 – Return on Capital (ROC)
25% ROC rights vest in full if ROC was greater than or equal to 18% for the financial year ending 30 September 2022.
Additional Vesting Condition
In addition to the performance conditions above, the performance rights will only vest if the share price on the vesting date is greater than or equal to the 5 trading day VWAP up to and including 30 September 2019, being a day prior to the start of the performance period.
2 Pre-AASB 16 Leases, the FY20 EPS outcome applying AASB 16 Leases is 69.9c.
Add back of tax expense relating to entity outside the tax consolidated group
(6.6) Add back of non-underlying tax expense (3.6)
Adjustment for tax expense 57.5
For a reconciliation between underlying and NPAT please see the Operating and Financial Review section of the Annual Report.
The weighted average shares are displayed in note 4 of the Financial Statements.
Elders’ return on capital as at 30 September 2022 was 26.2%. Resulting in 100% vesting of this tranche.
ROC = Underlying EBIT/Average Net Operating Assets Average Net Operating Assets = Working Capital, PP&E, Investments, Intangibles, Tax Balances Recognised on Acquisitions and Provisions (Excludes Elders Brand Name)
The VWAP as at 30 September 2019 was $6.27 therefore it is expected, based on the share price as at the date of this Report, that the vesting condition will be met (vesting will occur no later than 30 November 2022).
1 Shares exclude dilutive performance rights which have not yet vested. For FY22 , no rights were deemed to be dilutive refer to note 4 of the finanical statements.
3 As approved by the Board, the underlying NPAT component of the EPS calculation was adjusted for certain tax charges recognised during the year. This is to present the underlying NPAT on a comparable basis to align tax treatment across the periods. The Board utilised its discretion on the treatment of tax.
One fully paid share in Elders will be allocated for each vested performance right. The total number of vested performance rights under the FY20 grant is 487,916. In addition, 41,455 additional shares will be allocated at time of vesting for the value of dividends not received on the vested rights during the performance period. Individual vesting outcomes are outlined in section 7
Elders 2022 Annual Report 58
2.3 Summary of FY22 Executive KMP Outcomes
This table presents actual remuneration paid or payable, or vested for the Executive KMP in respect of FY22. The information is voluntary, unaudited, different from and additional to that required by Australian accounting standards and statutory requirements, which is provided in section 6.2
Executive KMP Remuneration outcomes for FY22 (unaudited and non-IFRS) Base salary Total STI1 Values of Shares Vested2
M C Allison MD & CEO
Former KMP
Superannuation
Other3 Termination benefits Total
$ $ $ $ $ $ $
1,093,695 836,971 1,847,474 23,999 3,802,139
T Foster4 CFO 573,850 313,700 23,999 50,570 301,053 1,263,172
Total 1,667,545 1,150,671 1,847,474 47,998 50,570 301,053 5,065,311
1 STI cash and deferral component that will be paid for performance in FY22.
2 Value of the FY19 LTI grant that vested in the FY22 year.
3 Second payment of sign on bonus paid to T Foster and relocation assistance.
4 T Foster's base salary and superannuation was disclosed up to cessation of employment on 31 August 2022.
2.4 Historical Five Year Performance
Highlights Elders’ key financial performance over the past five years and link to the Senior Executive KMPs' STI and LTI remuneration outcomes.
Underlying Earnings per Share (cents) +15.0% CAGR
Remuneration Report 59
Performance FY18
1 FY18 FY19 FY20 FY21 FY22 Sales Revenue ($m) 1,599 1,626 2,093 2,549 3,445 + 21.1% CAGR
75 74 121 167 232 + 32.6% CAGR
Underlying NPAT ($m)1 108 151 152 +24.2% CAGR 64 64 Return on Capital (%) 19 23 26 +2.2% 24 18 Dividends per Share (cents) 22 42 56 +32.8% CAGR 18 18 FY18 FY19 FY20 FY21 FY22 FY18 FY19 FY20 FY21 FY22 FY18 FY19 FY20 FY21 FY22 FY18 FY19 FY20 FY21 FY22 FY18 FY19 FY20 FY21 FY22 Share Price Movement (cents) 453 138 (38) 221 (68) FY18 FY19 FY20 FY21 FY22 55 53 70 97 97
FY18 FY19 FY20 FY21 FY22 55 53 70 97 134 97 Adjusted underlying EPS 1 As approved by the Board, the underlying NPAT component of the EPS calculation was adjusted for certain tax charges recognised during the year. This is to present the underlying NPAT on a comparable basis to align tax treatment across the periods. The Board utilised its discretion on the treatment of tax. Elders’ Remuneration Outcomes Remuneration outcomes 2018 2019 2020 2021 2022 STI – average % received of maximum opportunity 81% 0% 94% 95% 87% LTI – vesting % 100% 75% 75% 100% 100%
Elders' CAGR
to FY22
Underlying EBIT ($m)
Adjusted Underlying Earnings per Share for Vesting (cents)1 +25.0% CAGR
2.4 Historical Five Year Performance continued
This chart shows Elders’ annual TSR performance over the last five years against the S&P/ASX 200 Accumulation Index. Elders’ LTI Plans for FY18, FY19 and FY20 include an absolute TSR performance condition. Full vesting of the TSR tranche (50% of total grant for FY18 and FY19, and 33.3% of FY20) was achieved for grants under the FY18, FY19 and FY20 LTI Offers.
This chart compares Elders’ total LTI vesting results for grants in FY16-20 to Elders’ share price during the same period. LTI Plan performance outcomes relative to Elders' share price
Elders 2022 Annual Report 60
Absolute TSR % Absolute TSR % 14.00% 12.50% -10.20% 30.60% 2.6% 48.1% -7.0% 77.1% 14.6% -7.7% ASX200 Elders 2018 2019 2020 2021 2022
Elders
100% 75% 75% 100% 100% 0% 10% 20% 30% 40% 50% 60% 70% 80% 90% 100% 0 2 4 6 8 10 12 14 01/10/2017 01/10/2018 LTI Grant: FY16 01/10/2019 LTI Grant: FY17 01/10/2020 LTI Grant: FY18 01/10/2021 LTI Grant: FY19 01/10/2022 LTI Grant: FY20 Elders share price ($) LTI award (% vested) 16
share price LTI award (% vested)
Section 3 – Details of the Executive Remuneration Framework
3.1
Current Short-Term and Long-Term Incentive Plan Structures
Current STI Structure FY22
Performance Period
MD & CEO
Senior Executives
Annual aligned with financial year – 1 October 2021 to 30 September 2022
Maximum STI Opportunity as % of TFR 100% of TFR 50% of TFR
Performance Measure(s)
Gateway: Underlying EBIT (90% of Target), greater than prior year EBIT, zero fatalities, adherence to Elders Code of Conduct and no significant environmental events are achieved.
Once the gateway has been achieved, individual STI for the Executive KMPs are awarded based on achievement of individual KPIs which contain a balance of challenging financial and operational targets and are aligned to business strategy. Refer to section 2.1 for further details on Executive KMP FY22 STI performance measures.
Equity Deferral
Exercise of Discretion
40% of any STI earned by Executive KMP is delivered in locked Elders shares with half released at the end of year one and the balance released at the end of year two. These shares are held in trust subject to trading restrictions and are contingent on the Executive KMP remaining employed at the end of each period. During the restriction periods, the shares are subject to forfeiture if the Executive KMP resigns or is terminated for cause, unless the Board determines otherwise. No further performance conditions apply and shares fully vest to the participant at the end of the restriction period if the continued service requirement is met.
As the shares are awarded in lieu of cash and relate to an incentive that has already been earned, during the restriction period Executive KMP are entitled to all dividend and voting entitlements applying to the shares held in trust in their name.
The MD & CEO may recommend discretionary incentive payments to Senior Executives for approval by the Board.
The Board has overriding discretion in determining an Executive KMP’s individual STI outcome and may take into account factors such as any material risk events identified and the impact and accountability of the Executive in those events, and any other special circumstances (e.g. acquisitions and divestments).
The Board has discretion to reduce or deny individual STI outcomes in relation to any significant breach of Elders’ Code of Conduct, One Elders values or significant environmental events.
Clawback
Elders may recover amounts paid where the STI was calculated on financial results due to: • a material non-compliance with any financial reporting requirement; or • misconduct of any employees, contractors or advisers; and
as a result of which the actual metrics and outcomes used to determine the STI were incorrect, and as such a lower payment would have been made based on the restated results.
Remuneration Report 61
3.1 Current Short-Term and Long-Term Incentive Plan Structures continued
Current LTI Plans Structure
Performance Period (3 years)
FY21 FY22
1 October 2020 to 30 September 2023
1 October 2021 to 30 September 2024
Maximum LTI Opportunity % of TFR MD & CEO – 110%, Senior Executives – 55%
Grant Date
17-Dec-20 MD & CEO 16-Dec-21 MD & CEO 12-Mar-21 other participants 22-Dec-21 other participants
No. of Rights Outstanding and no. of Participants 101,000 Rights MD & CEO 102,400 Rights MD & CEO 235,667 Rights 18 other participants 223,700 Rights 19 other participants
As at 30 September 2022
Grant Methodology
Performance Conditions
Performance Measures and Vesting
Performance rights allocated under this plan are determined using “face value methodology” being the 5 trading day VWAP at the day prior to the start of the Performance Period (i.e. 30 September).
The performance rights are split into two tranches.
Tranche 1 Relative TSR 50% weighting
Tranche 2 EPS Growth 50% weighting
Tranche 1
– Relative TSR Against Comparator Companies Performance Rights
50% of rights vest subject to Elders' TSR performance relative to the TSR performance of the Comparator Companies over the Performance Period (subject to Elders' absolute TSR over the Performance Period being greater than or equal to zero).
Elders' TSR Percentile Rank % of Tranche that Vest
50th Percentile 50% 75th Percentile or above 100%
• less than Target no rights vest
• if greater than Target but less than Stretch is achieved, 50-100% of rights vest on a straight line sliding scale
The Comparator Companies for the purposes of this tranche comprises of the companies in the S&P/ASX 200 index excluding the companies in the S&P/ASX 100 as as the start of the Performance Period.
Tranche 2 – EPS Growth Performance Rights
• less than Target no rights vest
• if greater than Target but less than Stretch is achieved, 50-100% of rights vest on a straight line sliding scale
The Comparator Companies for the purposes of this tranche comprises of the companies in the S&P/ASX 200.
50% of rights vest in full if EPS CAGR is greater than or equal to Target for the performance period. The starting EPS value is EPS as at 30 September prior to the commencement of the performance period.
EPS CAGR % of Tranche that Vest
Target 7.5% 50%
Stretch 10% 100%
• less than Target no rights vest
• if greater than Target but less than Stretch is achieved, 50-100% of rights vest on a straight line sliding scale
Elders 2022 Annual Report 62
FY21 FY22
3.1 Current Short-Term and Long-Term Incentive Plan Structures continued
Current LTI Plans Structure
Holding Lock A 12 month holding lock on shares awarded under the LTI. A participant is entitled to receive dividends and other distributions and exercise full voting rights.
Performance Testing
Clawback
Dividends
Treatment of Unvested Rights on Cessation of Employment
Dealing in Securities
Change of Control
Corporate Actions/Reconstructions
Board Discretion
Future Considerations
Testing of the performance conditions will occur once the results for the relevant performance period have been audited and approved by the Board. There will be no re-testing of performance.
The Board may determine that any unvested rights will lapse or be forfeited, and/or the participant must pay or repay as a debt, proceeds from shares allocated in certain circumstances such as, but not limited to, fraud, gross misconduct, breach of duties or obligations.
No compensation for the value of dividends not received.
The Board has overriding discretion over the treatment of unvested performance rights when a participant ceases employment. On cessation of employment the Board may, amongst other options, allow the participant to retain a pro-rated number of rights based on the portion of the performance period the participant has worked or to lapse all rights.
Participants are prohibited from taking out derivatives over performance rights. In addition, after vesting of performance rights, all dealings in shares issued to a participant are regulated by Elders’ Securities Dealing Policy which requires, amongst other things, that dealings only take place during open periods specified by Elders.
In the event of a transaction, event or state of affairs that, in the Board’s opinion, is likely to result in a change of control of the Company, the Board may, in its absolute discretion, determine that all or a specified number of a participant’s unvested performance rights and/or options vest or cease to be subject to restrictions. If the Board does not make a determination, participants will retain all of their incentive securities and the incentive securities will continue to be subject to the original terms of the grant.
Prior to allocation of shares to a participant upon vesting of performance rights or exercise of options (as the case may be), the Board may make any adjustments it considers appropriate to the terms of a performance right and/ or option granted to a participant in order to minimise or eliminate any material advantage or disadvantage to a participant resulting from a corporate action or capital reconstruction.
The Board may exercise its discretion to make adjustments it considers appropriate in light of the purpose and intent of the Plan and the performance conditions. This may include making adjustments to ensure that the interests of the relevant Participant are not, in the opinion of the Board, materially prejudiced or advantaged relative to the position reasonably anticipated at the time of the grant. The Board uses a number of principles to assess whether to make an adjustment, including:
• maintaining the desired level of stretch for targets
• maintaining the integrity and intention of the reward
• aligning outcomes with general market and shareholder expectations
• consistent treatment across remuneration elements and performance period
• preserving the success and intent of transactions or other actions that have materially benefitted the company
If discretion is to be exercised, it may be a result of events such as:
• acquisitions and acquisition costs
• divestments
• changes to tax treatments
• legislative or accounting standard changes
• capital reconstructions or corporate actions
• internal reorganisation of the business and/or group assets
• events affecting comparator companies including, but not limited to, takeovers, mergers or de-mergers that might occur during the Performance Period
• events, circumstances or significant items outside of the control of management or which are not reflective of management performance
From FY22 onwards, Elders has resolved to include items of tax expense and/or benefit in Underlying NPAT. As Elders has recognised all tax losses on balance sheet in FY21, the Underlying tax expense will no longer be offset by an income tax benefit as a result of tax losses recognition. The Board will seek to exercise its discretion on the EPS outcomes of future LTI vesting by adjusting the tax expense across the Performance Period to ensure comparability across the performance period. The performance measures will be as intended as the Board originally set. Shareholders will be provided with a reconciliation.
Remuneration Report 63
Section 4 emuneration overnance
he Board Remuneration and Human Resources Committee operates in accordance with the guidance set out in the 4th dition of the AS Corporate overnance Council Principles and Recommendations.
Further information on the role and responsibilities of the Committee is set out in the Corporate overnance Statement, which along with the Committee’s Charter, is publishedon the lders Investor Centre1 he Committee is comprised entirely of independent Non- xecutive Directors.
Board
Reviews the performance of individual Directors and the Executive team, and approves the CEO’s remuneration.
Management
Provides briefs or recommendations to the BRHRC on the remuneration strategy and framework.
Board Remuneration and Human Resources Committee (BRHRC) Makes recommendations to the Board on people management and remuneration strategies and policies. Ensures KMP remuneration outcomes are appropriate and aligned to company performance and shareholder expectations.
Independent external advisors Provide independent advice to the BRHRC on remuneration and market practice.
4.1 Independent remuneration advice
he Committee is briefed by management, however, the Committee makes all decisions free of the influence of management.
Further to the management briefings, to assist in its decision-making, the Committee may, from time to time, seek independent advice from remuneration advisors,and in so doing will directly engage with the advisor without management involvement.
In the year ending 30 September 2022, the Committee has not sought independent advice from remuneration advisors, therefore no remuneration recommendations, as defined by the or orations ct 2001 (Cth), were made by remuneration advisors.
1 lders 2022 or orate overnance tate ent can e o nd online at investors.eldersli ited.co /investor-centre
Elders Annual Report
Section 5 – Non-Executive Director Remuneration and Statutory Remuneration
5.1 Remuneration Framework and Policy
Non-Executive Directors are remunerated by way of fees in the form of cash and superannuation.
NEDs do not participate in Elders’ cash or equity incentive plans and do not receive retirement benefits other than superannuation contributions disclosed in this report.
NED fees are reviewed by the Board on an annual basis, taking into consideration the accountability and time commitment of each director, supported, where appropriate and necessary, by information from external remuneration advisors.
The Board believes Elders’ NEDs should own securities in Elders to further align their interests with the interests of other shareholders. Elders’ Minimum Shareholding Policy was updated effective 1 October 2020 and now requires NEDs to hold at least 100% of NED Base fees (including superannuation) within three years from appointment. Details of NEDs’ shareholdings in Elders can be found in section 7
5.2 Non-Executive Director Fees in FY22
Total fees for the financial year ended 30 September 2022 remain within the aggregate fee limit of $1,200,000 per annum, (including superannuation guarantee), approved by the Board following Elders’ 2013 Annual General Meeting. Approval is being sought at the AGM to increase the NED Fee Pool by $300,000 from $1,200,000 including superannuation to $1,500,000 including superannuation. The proposal follows consideration of Board succession planning, which identified a need to appoint an additional Non-Executive Director. The Board expects to appoint the new Director in FY23.
The Board reviewed the NED fees during FY22 and applied a 2% increase to all Chair and member fees. Previous reporting of NED fees excluded superannuation, for FY22 superannuation is included.
Non-Executive Director fee
FY22 fee including superannuation1 Chair Member $ $
Board 298,9682 131,274
Audit, Risk and Compliance Committee 33,660 17,952 Work Health and Safety Committee Nil Nil
Remuneration and Human Resources Committee 22,440 10,200 Nomination and Prudential Committee Nil Nil
1 Showing fees effective 1 January 2022. NED Board fees previously presented excluding superannuation.
2 The Chair of the Board does not receive additional Committee fees.
Non-Executive Director remuneration
Short-term payments
Post-employment Total Base Board fee Board Committee fees Superannuation $ $ $ $
I Wilton 2022 273,619 23,999 297,618 2021 262,500 22,163 284,663
R Clubb 2022 118,620 40,554 16,117 175,291 2021 115,750 40,000 14,992 170,742
D Eilert 2022 118,620 36,498 15,706 170,824 2021 115,750 36,000 14,608 166,358
R Murphy1 2022 118,620 26,360 14,680 159,660 2021 78,929 17,540 9,343 105,812
M Quinn 2022 118,620 26,360 14,680 159,660 2021 115,750 26,000 13,645 155,395
Total 2022 748,099 129,772 85,182 963,053 2021 688,679 119,540 74,751 882,969
1 R Murphy commenced as Non-Executive Director on 28 January 2021.
Remuneration Report 65
Section 6 – Key Terms of Executive KMP Employment Contracts and Statutory Remuneration
6.1 Contractual Arrangements of Executive KMP
Contractual arrangements
Component MD & CEO Senior Executives
Contract Duration
Notice (without cause) initiated by:
Ongoing until terminated by either party
Elders 12 months 6 months
Individual 6 months 3 months
Payment in lieu of notice may be made equivalent to the remuneration the MD & CEO and Senior Executive would have received over the notice period.
Payment may be awarded under a Short-Term or Long-Term Incentive Plan in accordance with plan rules.
Notice for Serious Misconduct
Redundancy
Change of Control
Elders may terminate immediately. No payment in lieu of notice or other termination payments are payable under the employment agreement.
Not applicable Due to genuine redundancy, as defined by the Fair Work Act 2010, the Senior Executive is entitled to a retrenchment payment in accordance with Elders’ policy. This payment is also subject to the rules and limitations specified in the Corporations Act 2001 (Cth) and Corporations Regulations.
Not specifically referenced in contract. In the event of a Change of Control or Disposal of Business resulting in a material diminution in the roles and responsibility of the Senior Executive, the Senior Executive may terminate their contract on three months’ notice.
Elders 2022 Annual Report 66
6.2
Executive KMP Statutory Remuneration
Executive KMP remuneration
Short-term payments Postemployment
Share-based payments1 Long-term payments Termination benefits2 Total % performance related3
Base salary Cash STI Annual Leave Other4 Superannuation Deferred STI rights LTI Performance rights
Long service leave5
$ $ $ $ $ $ $ $ $ $ %
M C Allison 2022 1,093,695 502,183 (63,655) 23,999 310,075 619,801 (219,140) 2,266,958 63% 2021 1,015,969 605,280 87,795 22,163 170,611 692,980 71,103 2,665,901 55%
Former KMP6
J H Cornish 2022 n/a n/a n/a n/a n/a n/a n/a n/a n/a n/a n/a 2021 151,577 52,685 412 7,231 (169,908) 198,910 459,006 699,913 -24%
R I Davey 2022 n/a n/a n/a n/a n/a n/a n/a n/a n/a n/a n/a 2021 390,096 204,000 158,365 22,163 109,472 248,509 261,588 1,394,193 22%
T Foster7 2022 573,850 313,7008 32,726 50,570 23,999 81,695 301,053 1,377,593 29% 2021 183,934 98,4309 4,455 18,265 11,316 316,400 31%
M Hunt10 2022 n/a n/a n/a n/a n/a n/a n/a n/a n/a n/a n/a 2021 223,155 71,036 4,434 17,662 13,432 20,021 83,89411 15,836 449,470 39%
R L Norton 2022 n/a n/a n/a n/a n/a n/a n/a n/a n/a n/a n/a 2021 41,570 35,195 2,830 14,463 249,419 343,477 0%
Total 2022 1,667,545 815,883 (30,929) 50,570 47,998 310,075 701,496 (219,140) 301,053 3,644,551 2021 2,006,301 978,746 342,929 39,169 90,768 190,632 716,438 534,358 970,013 5,869,354
1 The amortisation of the fair value of the FY21 equity based STI was fully recognised in FY21. The 2021 comparative value has been restated to reflect the appropriate amortisation of the STI component over the appropriate vesting period. Additionally, the vesting period for the FY21 LTI granted to M C Allison & M Hunt did not include the 12 month holding lock period which is a vesting condition in relation to the KMPs' service requirement. The 2021 comparative values have been restated to include the additional 12 month holding lock period as part of the vesting and amortisation period. This has resulted in a total decrease of $332,956.
2 Comprised of redundancy payments under Elders’ redundancy policy and/or payments in lieu of notice and comply with Part 2D.2 of the Corporations Act 2001 (Cth).
3 Performance related remuneration consists of cash STI and share based payments (including deferred STI) as a percentage of total remuneration.
4 Includes car parking (M Hunt, J Cornish, R Norton), living away from home allowance (J Cornish), company leased vehicles (M Hunt, R Norton) and sign on bonus and relocation assistance (T Foster).
5 Former KMP data is statutory leave entitlements paid on separation.
6 Former KMP reflect the changes in restructure of Elders executive during the period.
7 T Foster's data for 2021 pro-rata from commencement with Elders, 31 May 2021. Data for 2022 base salary was disclosed up to cessation of employment with Elders, 31 August 2022.
8 For FY22 T Foster's STI will be paid 100% cash.
9 For FY21 T Foster's STI was paid 100% cash.
10 M Hunt's data pro-rata from date of commencement in EGM National & VIC/RIV role, 8 March 2021. For FY22 the role was not considered as a KMP as determined by the Board.
11 In FY21, M Hunt was appointed as a KMP effective 8 March 2021 in which the LTI expense was not apportioned to the period where he was a KMP. The 2021 comparative value has been restated to reflect the appropriate apportioned expense of the FY21 LTI component to the period he was a KMP, resulting in a decrease of $70,859
Remuneration Report 67
Section 7 – Additional Required Disclosures
Details of Executive KMP current LTI grants and STI restricted shares
Type Grant date1 Balance at start of period
M C Allison
Former KMP
Granted Vesting date Vested2 Lapsed Balance3 Expensed at end of period
Fair Value at grant date4
Rights maximum value yet to vest5
No. No. No. % No. % No. $ $ $
LTI 13-Dec-18 146,000 Nov-21 146,000 100
LTI 12-Dec-19 166,0006 Nov-22 166,000 264,493 793,480
LTI 17-Dec-20 101,000 Nov-23 101,000 163,984 683,265 355,298
LTI 16-Dec-21 102,400 Nov-24 102,400 191,324 797,184 605,860
LTI Total 413,000 102,400 146,000 369,400 619,801 2,273,929 961,158
STI 22-Dec-21 16,727 Sep-22 16,727 102,369 204,738
STI 22-Dec-21 16,726 Sep-23 16,726 68,242 204,726 68,242
STI Total 33,453 33,453 170,611 409,464 68,242
T Foster7 LTI 22-Dec-21 28,600 Nov-24 19,067 67 9,533 81,695 245,102
1 The grant dates are aligned to the requirements under the Accounting Standards.
2 The exercise price for the rights was nil.
3 The balance represents 100% of unvested rights as of 30 September 2022.
4 Fair value is used to calculate the value of performance rights when granted. The fair value at Grant Date is independently determined using Monte Carlo simulation techniques which take into account the exercise price, the term of the rights, the share price at grant date and expected price volatility of the underlying share, the expected dividend yield and the risk free interest rate for the term of the option for TSR tranche. A discounted cash flow model was used for the fair value of the EPS tranche. Fair value utilised for FY22 LTI Grant, tranche 1, MD & CEO $5.13, Senior Executive $5.99 and Tranche 2, MD & CEO $10.44 and Senior Executive $11.15 (for more information see note 26 financial statements). Fair value is used to calculate the value of restricted shares for the STI Plan. Fair value utilised for FY21 restricted shares is $12.24 per share.
5 The maximum value of the performance rights yet to vest has been determined as the fair value amount at grant date that is yet to be expensed. The minimum value of deferred shares yet to vest is nil, as the shares will be forfeited if the vesting conditions are not met.
6 For the FY20 LTI grant expected to vest November 2022, additional shares of 14,104 will be allocated to the Executive KMP at the time of vesting for the value of dividends not received during the performance period on the vested rights.
7 No LTI grants were made to T Foster in FY21 as commencement with Elders was 1 May 2021. T Foster ceased employment on 31 August 2022, as per the LTI Plan Rules a portion of T Foster rights has continued on foot, based on the percentage of performance period completed for each grant.
Executive KMP shareholding
Shares held at start of year 1 October 2021
Shares acquired during the year as part of remuneration
Shares acquired during the year through the vesting of LTI
Other shares acquired (disposed of) during the year
Balance of shares held at end of financial period1
M C Allison 800,000 33,4532 155,293 988,746
Former KMP
T Foster 19 3863 405
Total 800,019 33,839 155,293 989,151
1 Balance of shares helds at end of financial period for former KMP is the date of cessation of employment.
2 Represents the deferred component of FY21 STI in restricted shares.
3 Reflects shares acquired through the Deferred Employee Share Plan for FY22.
Elders 2022 Annual Report 68
Non-Executive Directors shareholding
Shares held at start of year 1 October 2021
Shares acquired during the year as part of remuneration
Other shares acquired (disposed of) during the year
Balance of shares held at end of financial period
I Wilton 131,193 131,193
R Clubb 12,400 1,600 14,000
D Eilert 13,769 13,769
M Quinn 15,597 5,742 21,339 R Murphy 4,000 2,500 6,500
Total 176,959 9,842 186,801
Note: No other changes occurred during the year. None of the shares in the two tables above are held by the Non-Executive Directors or Executive KMP. Elders takes its obligations to prevent insider trading very seriously. In conformity with that approach, Directors take a conservative view of when they can deal in Elders shares (even when trading windows are open), seeking to avoid both real and perceived trading on inside information. This approach limits the opportunities for Non-Executive Directors to acquire Elders’ shares.
Other equity schemes in which one or more KMP participate
Description
Deferred Employee Share Plan (DESP)1
This plan enables participants to salary sacrifice remuneration up to $5,000 to acquire restricted shares. Tax can be deferred up to 15 years. Elders makes no contribution to this plan other than funding the costs of administration. There are no further performance or service conditions once shares are purchased.
7.1 Other transactions and loans with KMP
There are no loans to KMP outstanding in the current or prior year.
Eligibility Criteria Number of participants as at Number of outstanding shares as at 30 Sept 2021 30 Sept 2022 30 Sept 2021 30 Sept 2022
All permanent employees
186,443
From time to time, sales and purchases occur during the year between subsidiaries in the Group and entities that certain directors of Elders have direct or indirect control over. These transactions are conducted on the same terms and conditions as those entered into by other Elders’ employees or customers on an arm’s length basis and are trivial or domestic in nature.
Remuneration Report 69
241 200 170,881
1 T Foster participated in 2021 and 2022 and held 405 shares under this Plan accumulated in FY21 and FY22.
Executive Management
ar Allison
ana in Director ie ec tive Officer r c, con, D , F D, P (
Mr Allison oined lders imited as a Non- xecutive Directorin December 2009, served as Chairman and xecutive Chairman, before being appointed Managing Director and Chief xecutive Officer in May 2014.
Mr Allison’s agribusiness career of more than 40 years spans technical, manufacturing, supply and distribution roles and business. Previous roles include Managing Director/C O of rain rowers imited, Jeminex imited, Farmo Pty td, Wesfarmers andmark imited, Wesfarmers CSBP imited and CropCare Australasia Pty td and eneral Manger of Incitec Fertilisers.
Paul ossiter
ctin ie Financial Officer cc, P , F
Paul was appointed to the role of Acting Chief Financial Officer in August 2022,after serving the business since 2004. Paul has been roup reasurer since 2012.

Prior to oining lders, Paul worked for employers in the finance sector including Credit Suisse in Sydney and Morgan Stanley in ondon. Paul is a Certified

Mr Allison is currently Chair of Agribusiness Australia, AuctionsPlus, the Agriculture and Natural Resources nd-User Advisory Board of the SmartSat CRC, the Agrifood and Wine Advisory Board of Adelaide University, a Non- xecutive Director of rain rowers imited and a member of the Rabobank Food and Agriculture Advisory Board.
Mr Allison oversaw the development and implementation of lders’ ight Point Plan in 2014, which returned the company to pure play agribusiness and resulted in the first shareholder distribution in nearly a decade. Since 2014, lders has grown from a market capitalisation of $50m to $1.9b.
Practising Accountant, with a Bachelor of Accountancy from the University of South Australia, and a Fellow of the Financial Services Institute of Australasia (FINSIA).
Paul is an experienced finance, accounting and risk management professional in the fields of banking, financial markets and agriculture.
om usso
ec tive eneral ana er ational ictoria, iverina ( ons , , rad Di P, Di Pro erv ( enc t
om was appointed xecutive eneral Manager Network in 2022, prior to which he has held several other roles within the lders group.
Most recently, om was xecutive eneral Manager Real state, Brand Communications. During his tenure in that role the gross margin contribution of the real estate product more than doubled and he has established a strategic marketing and communications function which has custody of the most trusted agribusiness brand in rural Australia.
om has established himself as a leading transaction adviser in the farmland investment space and is a trusted adviser to many of lders’ largest clients.
om previously played a pivotal role in devising andimplementing the turnaround strategy for lders, including executing a number of large and complex divestment initiatives.
Prior to lders, om was the Chief xecutive of a specialist international law firm and practiced as a corporate lawyer with a focus on mergers and acquisitions, corporate finance, complex contractual pro ects, corporate governance and intellectual property.
Elders Annual Report
Peter astings
o an ecretar eneral o nsel , , D P, F , rad Di lied or orate overnance, D
Peter was appointed lders’ Company Secretary and eneral Counsel in 2010. He has responsibility for the Company’s legal, compliance, company secretarial, risk and insurance functions.
Peter was an integral member of the lders’ team that worked hard to protect shareholder interests through many years of financial distress and which, subsequently, successfully implemented stabilisation, and now growth, strategies. Peter has three decades of experience gained in legal and governance roles with lders, other inhouse legal positions and in private and government legal practice.


Viv Da os
ie
n or ation Officer
( ancester , P , D
Viv was appointed to the position of CIO in 2021 and is responsible for leading the technology/business transformation program at lders a multiyear change program that will see the introduction of modern technologies to simplify and enhance interactions with our customer base through traditional and digital channels. In addition to his CIO remit, homas lder Institute ( I) and homas lder Consulting ( C) also report into Viv.
With the emergence of the ag-tech space, there are many implications and opportunities for lders and our customers. Moving the I and C services into the CIO portfolio allows us to take a broader view of this space and incorporate viable opportunities into our technology roadmap.

Viv’s 30 years of experience includes senior leadership positions in Australia, Asia and urope, predominantly in the retail sector with the AS Watson roup, esco, PM and Dairy Farm International. More recently Viv spent four years running the technology and digital functions for Caltex Australia, based out of Sydney.
Olivia ic ardson
ec tive eneral ana er Peo le, lt re a et t ( ons , D
Olivia was appointed eneral Manager People and Culture in 2018, with the Safety function included in her portfolio from 1 October 2020.
Olivia’s priorities include maintaining an engaged andenabled workforce, investment in learning and development programs, creating a diverse and inclusive workforce, building on the pride in the pink shirt and driving a ero harm workplace. Having been with lders for 13 years, she is well acquainted with lders people, appreciating that they are loyal and committed to doing the best for their communities.
Notable achievements include refreshing the learning anddevelopment framework to ensure people are equipped with the relevant skills and technical expertise to do their ob and the refresh of our mployee Value Proposition aimed at promoting lders as a great place to work to drive retention and attraction of high calibre staff.
Prior to lders, Olivia has worked across Human Resources in FMC , Financial Services and elecommunications throughout Australia, the U and urope.
Executive Management
iim im ec tive eneral ana er siness Develo ent o , P , D
iim was appointed to the role in 2018.
She has successfully led the completion and integrationof many acquisitions underpinning the growth of lders, including Australian Independent Rural Retailers (AIRR), itan A , ivestock and Wool in ransit delivery warranty and various retail, agency and real estate bolt-ons.
Her focus is to ensure long term sustainable growth through the acquisition of high quality businesses in
eremy Cowan
ec tive eneral ana er ral Prod cts o
A senior supply chain and commercial professional, Jeremy was appointed to his role with lders commencing in October 2022.
He comes to lders with an extensive track record of line manager excellence and change management delivery, and deep expertise in end to-end supply chain, encompassing, manufacturing, procurement strategy, end to end planning and category management.
He has held multiple executive management team roles in multinational branded product businesses

strategic areas throughout the network and through the supply chain.
Recently, she also led the divestment of lders’ investmentin StockCo and negotiated a long term distribution agreement with StockCo’s new owners. iim commenced with lders in March 2006, and has held various roles within the finance team.

Prior to lders, iim worked with PwC in Malaysia and Adelaide.
in the FMC and consumer healthcare sectors, in Australia and the United States.
Jeremy is currently based in regional Australia and possesses direct insight into how regions and the lders network operate. his will assist him in his role of supporting our business growth and backward integration strategy, along with the further integration of our rural products businesses.
Elders Annual Report
This page has been intentionally left blank.
Executive Management 73
Opportunities abound for agriculture’s next generation
As the agriculture industry expands to feed and clothe a growing global population, doors are opening for the next generation of agricultural professionals interested in new ways to contribute to the sector with fresh perspectives and diverse skills and backgrounds.
With fond memories of helping her dad on their mixed farming property, West Australian Georgia Adams says that farming seemed like a dream job to her – one that has since become a reality after taking on a role in livestock production with Elders’ Williams branch in Western Australia.
After a short stint in Farm Supplies, Georgia quickly realised that livestock production was her passion, and that helping producers to improve their productivity was an ambition that had impacts far beyond the farms she was working on.
“The honest day’s work, the drive and determination of the people in the industry, as well as the challenge it posed, really motivated me to get involved and work to offer value to producers,” said Georgia.
“There is an enormous amount of pressure placed on agriculture to increase production to meet the demands of a growing global population. Australian growers are already efficient producers, but this will need to improve to meet such growing demand.
“We need to take a systems approach to improving productivity – considering the production, environmental and social issues that surround food production.”
With demand for quality Australian product only growing, a desire to help contribute to Australia’s food supply chain requires a broad range of emerging skills and insights.
“There are so many new branches in the industry opening due to the need for new innovations, so it appeals to a wider audience more now than it did in decades gone by,” said Georgia.
“The generation coming through offers an understanding of new technologies such as robotics, IT, and engineering related to agriculture. This understanding will aid in the utilisation of new technologies and improved traditional practices.
“The opportunities available to those in the industry are incredible and only expanding; I believe that females are participating in greater numbers in agriculture as a result.”
This swing toward a younger and more diverse industry is being supported by the Elders Early Careers Program, which this year saw an 8% increase in applicants. As one way to bring in new talent to the sector, the program has expanded its intake from 30 networkonly based roles, like the Graduate Agronomy Program and Livestock Trainee Program, to up to 50 roles and a whole new corporate stream, offering opportunities in the areas of marketing and communications, human resources and information technology.
One employee benefitting from the program is Olivia O’Brien who joined the Livestock Trainee Program in 2021 and is forging a successful career in livestock production with Elders’ Hamilton branch.
“The program enables trainees to gain firsthand experience in different regions with different climates and challenges, as well as seeing how our livestock people interact with their grazier clients to help improve their operations,” she said.
Similarly, Amy Canty, a graduate agronomist in Cowra from the 2022 intake, said her role is challenging just as it is rewarding, which is why the sector is so appealing.
“Farming practices will always change. With research and innovation comes change, and that’s exciting to me,” she said.
“As a young person entering the industry, I can see so much room for growth, but at the same time I love the traditional side. This is the career path for me, and I can’t wait to see where it takes me.”
Heading north, at just 23, Eliza Connors joined Elders Rockhampton in a state-wide stud stock role. Now with the business for two years, Eliza said the traditions of the livestock industry combined with the exciting opportunities offered as it adapts and grows, are some of the reasons she is passionate about the sector, suggesting that the male farming stereotype is outdated.
“Yes, many of the auctioneers you might see are men, but working in the industry there are so many women calling the shots as breeders, managers, journalists, or technical support staff at the sale.”
Eliza says growing her career in the pink shirt has been transformative.
“I find it impossible to not feel a thrill as years of careful management and breeding are put to the open market and you watch the success unfold for clients,” she said.
“You kind of get the feeling that this is the industry for you, then it’s all about finding your own path to a career that can fit your interests.”
Whether in livestock or agronomy, Georgia Adams’ assertion about opportunities rings true: “The rate of change in agriculture demands a lot of the next generation but the opportunities are limitless.”
Elders 2022 Annual Report 74
Adams Livestock

“The generation coming through offers an understanding of new technologies such as robotics, IT, and engineering related to agriculture. This understanding will aid in the utilisation of new technologies and improved traditional practices.
Georgia
Production Advisor, Elders Williams
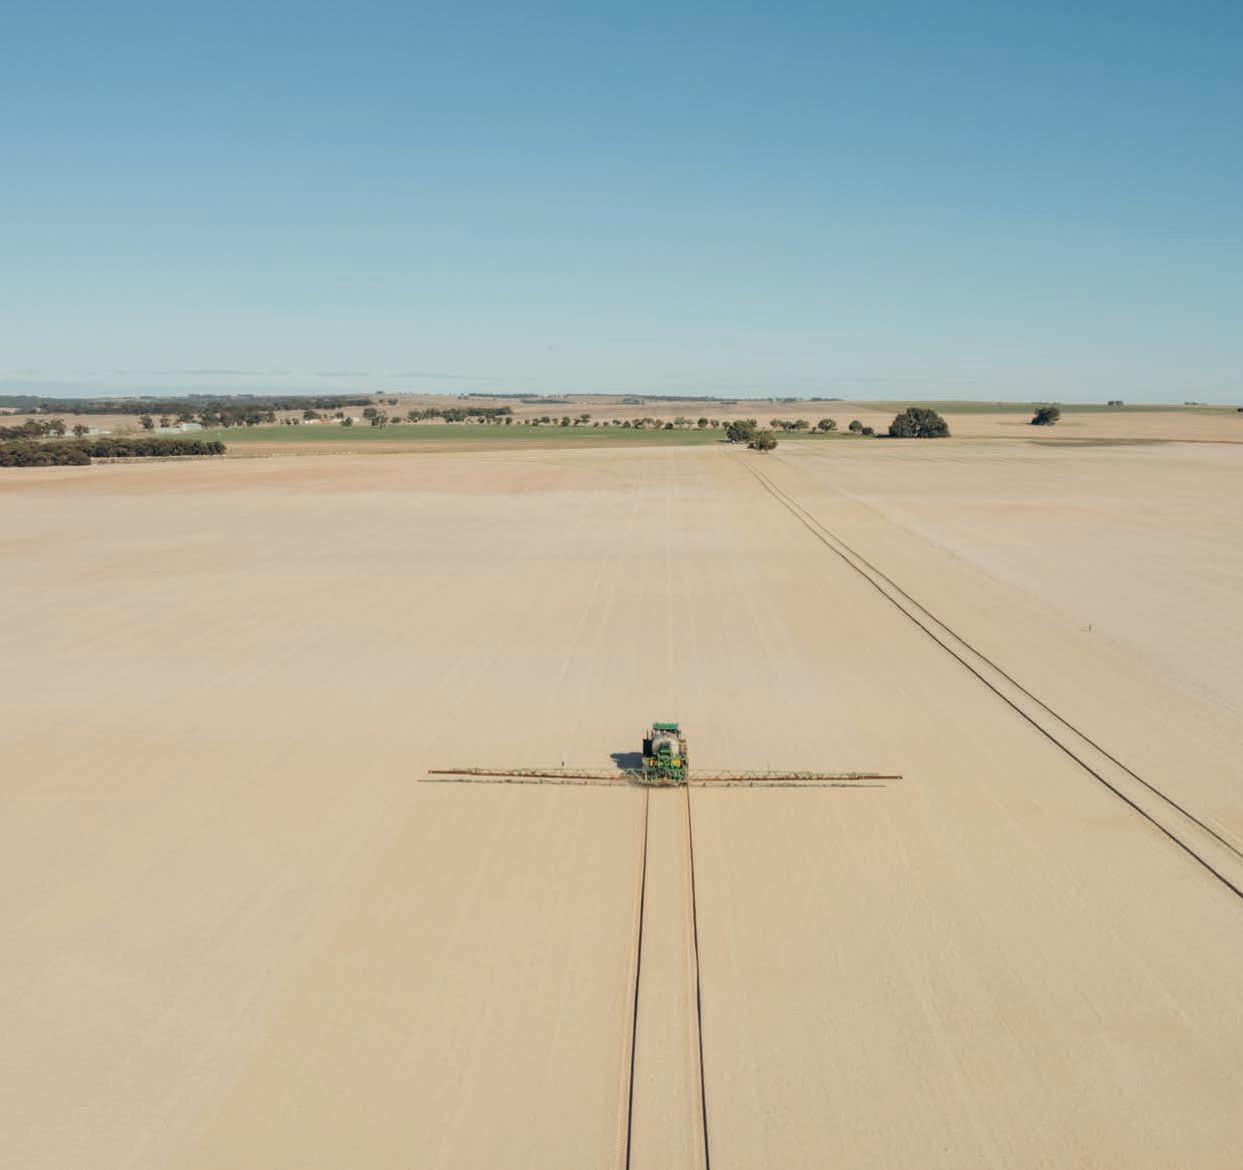
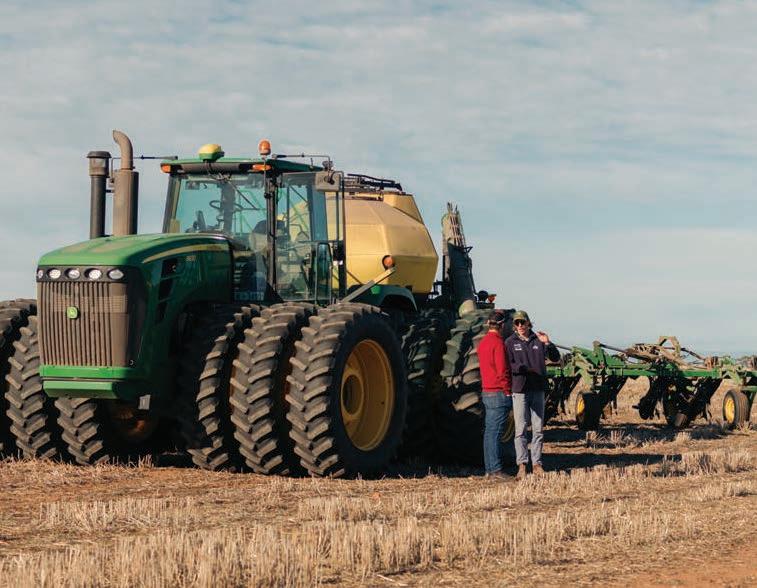


Elders Annual Report
FINANCIAL REPORT 2022


Elders Limited Annual Financial Report 77
Elders
Elders Limited Annual Financial Report
Limited Annual Financial Report
September
78 Consolidated Statement of Comprehensive Income
Statement of Financial Position
Statement of Cash Flows
Consolidated Statement of Changes in Equity
Notes to the Consolidated Financial Statements
About this report
Group Performance 1 Segment Information 86 2 Revenue and Expenses
3 Income Tax 89 4 Earnings Per Share 91 Working Capital 5 Receivables 92 6 Livestock 93 7 Inventory 94 8 Trade and Other Payables 95 Capital Employed 9 Property, Plant and Equipment 96 10 Leases 98 11 Intangibles
12 Equity Accounted Investments
13 Provisions 103 Net Debt 14 Cash Flow Statement Reconciliation 105 15 Interest Bearing Loans and Borrowings 106 Risk Management 16 Financial Instruments 107 Equity 17 Contributed Equity 112 18 Reserves 113 19 Dividends 114 Group Structure 20 Investments in Controlled Entities 115 21 Parent Entity 119 22 Business Combinations – Changes in the Composition of the Entity 120 Other Notes 23 Expenditure Commitments 121 24 Contingent Liabilities 122 25 Related Party Disclosures 122 26 Share Based Payment Plans 123 27 Auditor's Remuneration 124 28 Key Management Personnel 124 29 Subsequent Events 124 Directors' Declaration 125
30
2022
79 Consolidated
80 Consolidated
81
82
83
83
88
100
102
CONSOLIDATED STATEMENT OF COMPREHENSIVE INCOME
For the year ended 30 September 2022
2022 2021
Note $000 $000
Sales revenue 2 3,445,254 2,548,924
Cost of sales (2,805,343) (2,030,501)
Gross profit 639,911 518,423
Equity accounted profits 12 12,725 10,897
Distribution expenses (333,221) (287,090)
Administrative expenses (87,334) (75,767)
Finance costs 2 (8,571) (8,755)
Other items of income/(expense) 2 14,227
Profit before income tax expense 237,737 157,708
Income tax expense 3 (67,727) (3,924) Net profit for the period 170,010 153,784
Items that may be reclassified to profit and loss
Exchange differences on translation of foreign operations (84) 343
Net gains on cash flow hedges (357) 932 Other comprehensive profit/(loss) for the period, net of tax (441) 1,275
Total comprehensive income for the period 169,569 155,059
Profit for the period is attributable to:
Non-controlling interest 7,144 4,007
Owners of the parent 162,866 149,777 Net profit for the period 170,010 153,784
Total comprehensive income for the period is attributable to:
Non-controlling interest 7,144 4,007
Owners of the parent 162,425 151,052 Total comprehensive income for the period 169,569 155,059
Reported operations
Basic earnings per share (cents per share) 4 104.1¢ 95.8¢
Diluted earnings per share (cents per share) 4 104.1¢ 95.5¢
The accompanying notes form an integral part of this consolidated statement of comprehensive income.
Elders Limited Annual Financial Report
79
CONSOLIDATED STATEMENT OF FINANCIAL POSITION
2022 2021
Note $000 $000
Current assets
Cash and cash equivalents 14 17,840 48,063
Trade and other receivables 5 819,504 734,769 Livestock 6 73,371 56,237 Inventory 7 484,482 321,683
Total current assets 1,395,197 1,160,752
Non current assets
Other financial assets 1,269 1,269
Equity accounted investments 12 47,547 57,936 Property, plant and equipment 9 46,953 36,018
Right-of-use assets 10 119,304 105,739 Intangibles 11 364,320 332,643
Deferred tax assets 3 45,406 102,673
Total non current assets 624,799 636,278
Total assets 2,019,996 1,797,030
Current liabilities
Trade and other payables 8 736,373 648,294 Interest bearing loans and borrowings 15 179,210 154,265
Lease liabilities 10 32,716 37,972 Current tax payable 3 5,869 974
Provisions 13 94,348 81,870
Total current liabilities 1,048,516 923,375
Non current liabilities
Other payables 8 16,059 19,204
Lease liabilities 10 90,827 72,705 Provisions 13 3,877 3,154
Total non current liabilities 110,763 95,063
Total liabilities 1,159,279 1,018,438
Net assets 860,717 778,592
Equity
Contributed equity 17 1,646,630 1,651,006 Reserves 18 (27,705) (26,887)
Retained earnings (764,066) (848,694)
Total parent entity equity interest 854,859 775,425
Non-controlling interests 5,858 3,167
Total equity 860,717 778,592
The accompanying notes form an integral part of this consolidated statement of financial position.
Elders 2022 Annual Report
80
As at 30 September 2022
CONSOLIDATED STATEMENT OF CASH FLOWS
For the year ended 30 September 2022
2022 2021 Note $000 $000
Cash flows from operating activities
Receipts from customers (inclusive of GST) 12,885,381 10,638,812
Payments to suppliers and employees (inclusive of GST) (12,769,549) (10,495,672)
Dividends received 11,806 9,584
Interest and other finance costs paid (7,941) (7,727)
Income tax (paid) (6,036) (2,840)
Net operating cash flows 14 113,661 142,157
Cash flows from investing activities
Payments for property, plant and equipment (16,361) (6,378)
Payments for equity accounted investments (123) (150)
Payments for intangibles (4,235)
Payments for acquisitions through business combinations, net of cash acquired 22 (53,965) (28,028)
Proceeds from sale of property, plant and equipment 716 911
Acquisition of intangible assets (4,568) (1,845)
Proceeds from sale of equity accounted investments 33,400
Net investing cash flows (45,136) (35,490)
Cash flows from financing activities
Purchase of shares (9,584)
(Repayment)/proceeds of borrowings 24,945 (29,426)
Payments of lease liabilities (35,908) (29,286) Dividends paid (73,748) (48,468)
Partnership profit distributions/dividends paid (4,453) (2,165)
Net financing cash flows (98,748) (109,345)
Net increase/(decrease) in cash held (30,223) (2,678)
Cash at the beginning of the financial period 48,063 50,741 Cash at the end of the financial period 14 17,840 48,063 The accompanying notes form an integral part of this consolidated statement of cash flows.
Elders Limited Annual Financial Report
81
CONSOLIDATED STATEMENT OF CHANGES IN EQUITY
For the year ended 30 September 2022
Issued capital Reserves Retained earnings Non-controlling interest Total equity
$000 $000 $000 $000 $000
As at 1 October 2021
1,651,006 (26,887) (848,694) 3,167 778,592
Profit for the period 162,866 7,144 170,010
Other comprehensive income/(loss):
Exchange differences on translation of foreign operations (84) (84)
Cash flow hedge and fair value of derivatives, net of tax (357) (357)
Total comprehensive income/(loss) for the period (441) 162,866 7,144 169,569
Transactions with owners in their capacity as owners:
Put option revaluation (2,234) (2,234)
Dividends paid (74,855) (74,855)
Dividend reinvestment plan 3,383 (3,383)
Deferred performance shares 112 112
Partnership profit distributions/dividends paid (4,453) (4,453)
Cost of share based payments 3,570 3,570
Reallocation of equity 1,713 (1,713)
Shares purchased (9,584) (9,584)
As at 30 September 2022 1,646,630 (27,705) (764,066) 5,858 860,717
As at 1 October 2020 1,645,561 (27,670) (946,890) 1,325 672,326
Profit for the period 149,777 4,007 153,784
Other comprehensive income/(loss):
Foreign currency translation differences for foreign operations 343 343
Cash flow hedge and fair value of derivatives, net of tax 932 932
Total comprehensive income/(loss) for the period 1,275 149,777 4,007 155,059
Transactions with owners in their capacity as owners:
Dividends paid (49,061) (49,061)
Dividend reinvestment plan 2,520 (2,520)
Partnership profit distributions/dividends paid (2,165) (2,165)
Cost of share based payments 2,433 2,433 Reallocation of equity 2,925 (2,925)
As at 30 September 2021 1,651,006 (26,887) (848,694) 3,167 778,592
The accompanying notes form an integral part of this consolidated statement of changes in equity.
Elders 2022 Annual Report
82
NOTES TO THE CONSOLIDATED FINANCIAL STATEMENTS
For the year ended 30 September 2022
ABOUT THIS REPORT
Corporate information
The consolidated financial report of Elders Limited for the year ended 30 September 2022 was authorised for issue on 14 November 2022 by the Directors. Elders Limited (the Parent) is a for profit company limited by shares incorporated and domiciled in Australia whose shares are publicly traded on the Australian Securities Exchange.
The nature of the operations and principal activities of the Company are described in the Directors’ Report. References in this consolidated financial report to ‘Elders’ are to Elders Limited and each of its controlled entities unless the context requires otherwise.
Basis of preparation
The financial report is a general-purpose financial report, which has been prepared in accordance with the requirements of the Corporations Act 2001, Australian accounting standards and other authoritative pronouncements of the Australian Accounting Standards Board (AASB) and International Financial Reporting Standards (IFRS) as issued by the International Accounting Standards Board (IASB). The financial report has also been prepared on a historical cost basis, except for derivative financial instruments which have been measured at fair value, and biological assets that are measured at fair value less costs to sell.
The financial report is presented in Australian dollars and under the ASIC Corporations (Rounding in Financial/Director’s Reports) Instrument 2016/191, issued by the Australian Securities and Investments Commission, all values are rounded to the nearest thousand dollars ($000) unless otherwise stated.
Both the functional and presentation currency of Elders and its Australian subsidiaries is Australian Dollars (AUD). Subsidiaries incorporated in countries other than Australia, which have a functional currency other than Australian Dollars, are translated to the presentation currency.
Transactions in foreign currencies are initially recorded by subsidiaries at their respective functional currency rates at the date the transaction first qualifies for recognition. Monetary assets and liabilities denominated in foreign currencies are retranslated at the rate of exchange ruling at the reporting date.
Differences arising on settlement or translation of monetary items are recognised in the statement of comprehensive income. Non-monetary items that are measured in terms of historical cost in a foreign currency are translated using the exchange rate as at the date of the initial transaction.
The financial report has been prepared on a going concern basis.
Comparative information which relates to prior periods is restated to be comparable with current year disclosures.
Basis of consolidation
The consolidated financial statements comprise the financial statements of Elders Limited and its subsidiaries as at 30 September 2022. Control is achieved when Elders is exposed, or has rights, to variable returns from its involvement with the investee and has the ability to affect those returns through its power over the investee. When Elders has less than a majority of the voting or similar rights of an investee, it considers all relevant facts and circumstances in assessing whether it has power over an investee.
Elders re-assesses whether or not it controls an investee if facts and circumstances indicate that there are changes to one or more of the three elements of control. Assets, liabilities, income and expenses of a subsidiary acquired or disposed of during the year are included in the statement of comprehensive income from the date Elders gains control until the date Elders ceases to control the subsidiary.
Profit or loss and each component of other comprehensive income are attributed to the equity holders of the parent of Elders and to the non-controlling interests, even if this results in the non-controlling interests having a deficit balance. When necessary, adjustments are made to the financial statements of subsidiaries to bring their accounting policies into line with Elders’ accounting policies. All intra-group assets and liabilities, equity, income, expenses and cash flows relating to transactions between members of Elders are eliminated in full on consolidation.
Significant accounting judgements, estimates and assumptions
The preparation of Elders’ consolidated financial statements requires management to make judgements, estimates and assumptions that affect the reported amounts in the financial statements. Management continually evaluates its judgements and estimates in relation to assets, liabilities, contingent liabilities, revenue and expenses.
Actual results may differ from these estimates under different assumptions and conditions and may materially affect the financial result or the financial position reported in future periods. Judgements, estimates and assumptions which are material to the financial report are found in the following notes:
Note 7
Accounting for rebates
Note 9 Impairment of non-financial assets other than brand names and goodwill
Note 10
Accounting for leases
Note 11 Impairment of brand names and goodwill
Elders Limited Annual Financial Report
83
NOTES TO THE CONSOLIDATED FINANCIAL STATEMENTS
For the year ended 30 September 2022
ABOUT THIS REPORT
Impacts of Climate Change
Elders has incorporated climate change risk and the necessary measures to meet its emissions reduction targets. While the effects of climate change risk and the implementation of the emissions reduction targets do not change the significant estimates, judgements and assumptions used in the preparation of the consolidated financial statements, it has increased the accounting estimation uncertainty and resulted in application of further judgement within those identified areas. Elders has used accounting estimates based on forecasts developed on market information available at balance date.
Elders has reviewed the following material accounting judgements, estimates and assumptions within the accounting policies that have potential to be impacted by climate change risk and the implementation of Elders' emissions reduction targets:
Impairment testing
Cash flow projections used in the impairment testing process are based upon financial budgets approved by the Board, external forecasts of market growth rates and expected operating margins and capital expenditure, including projected expenditure required to meet the Elders’ emissions reduction targets.
Capital expenditure and research and development
Elders’ research and development and capital expenditures are aligned to Elders’ strategy focusing on new and alternative technologies and products, in line with Elders' emissions reduction targets, impacting either capital expenditure or the Income Statement.
Taxes
Climate-related matters have been considered in the assessment of the future taxable profits on which the recognition of deferred tax assets are based. Business plans used for the recognition of deferred tax assets have been aligned with those used in the impairment testing process taking into account Elders’ emissions reduction targets.
Provisions and contingent liabilities
Elders’ provisions and contingent liabilities for the 2022 financial year have taken into consideration Elders’ current climate-related risk assessments.
Insurance
The change in climate may result in more regular and intense climate events which can have a significant impact on Elders’ production with business interruption, accident or damages. This may increase Elders’ insurance costs due to higher amounts at stake or Elders’ costs with more frequent uninsurable events.
Changes to Accounting Policies
(i)
New and Revised Accounting Standards and Interpretations
A number of new amendments to standards and interpretations became operative for the financial year ended 30 September 2022. None of these have materially impacted Elders and its policies.
(ii) Accounting Standards and Interpretations issued but not yet effective
Elders has not early adopted any standard, interpretation or amendment that has been issued but is not yet effective. Elders has assessed the upcoming standards, interpretations or amendments and concluded there is no material impact expected from the adoption of these new standards, interpretations or amendments.
Elders 2022 Annual Report
84
NOTES TO THE CONSOLIDATED FINANCIAL STATEMENTS
For the year ended 30 September 2022
ABOUT THIS REPORT
The notes to the financial statements
The notes include information which is required to understand the financial statements and is material and relevant to the operations, financial position and performance of Elders. They include the applicable accounting policies applied and significant estimates and judgements made. Specific accounting policies are disclosed in their respective notes to the financial statements.
The notes are organised into the following sections:
Group Performance Provides additional information regarding financial statement lines that are most relevant to explaining Elders’ performance during the period.
Working Capital Provides additional information regarding financial statement lines that are most relevant to explaining the assets used to generate Elders’ trading performance during the period and liabilities incurred as a result.
Capital Employed Provides additional information regarding financial statement lines that are most relevant to explaining the capital investment made that allows Elders to generate its operating result during the period and liabilities incurred as a result.
Net Debt Provides additional information regarding financial statement lines that are most relevant to explaining Elders’ net debt position and borrowings for the period.
Risk Management Provides information relating to Elders’ exposure to various financial risks, its impact on the financial position and performance of Elders and how these risks are managed.
Equity Provides additional information regarding financial statement lines that are most relevant to explaining the equity position of Elders at the end of the period, including the dividends declared and/or paid during the period.
Group Structure Summarises how the group structure affects the financial position and performance of Elders as a whole.
Other Notes Includes other notes that must be disclosed to comply with the accounting standards and other pronouncements, but that is not immediately related to individual line items in the financial statements.
Elders Limited Annual Financial Report
85
NOTES TO THE CONSOLIDATED FINANCIAL STATEMENTS
For the year ended 30 September 2022
GROUP PERFORMANCE– NOTE 1: SEGMENT INFORMATION
Identification of reportable segments
Elders has identified its operating segments to be Branch Network, Wholesale Products, Feed and Processing Services and Corporate Services and Other Costs. These operating segments are the basis on which internal reports are reviewed and used by the Chief Executive Officer (the chief operating decision maker) in assessing performance and in determining allocation of resources. Discrete financial information about each of these operating businesses is reported to the Chief Executive Officer on at least a monthly basis. Elders operates predominantly within Australia. All other geographical operations are not material to the financial statements.
Type of product and service
• Branch Network includes the provision of a range of products and services through a common distribution channel, including agricultural retail products, agency and real estate services and financial services.
• Wholesale Products includes the AIRR business based in Shepparton, Victoria, supported by a network of warehouses to supply independent retail stores throughout Australia.
• Feed and Processing Services includes Killara feedlot, a beef cattle feedlot near Tamworth in New South Wales. In China, Elders imports, processes and distributes premium Australian meat.
• Corporate Services and Other Costs segment includes the general investment activities not associated with the other business segments and the administrative corporate office activities, including centrally held costs not allocated to the other segments.
Accounting policies and intersegment transactions
The accounting policies used by Elders in reporting segments internally are the same as those contained in the financial statements. Segment results have been determined on a consolidated basis and represent the earnings before corporate net financing costs and income tax expense.
Branch Network Wholesale Products
2022
Feed and Processing Services
Corporate Services and Other Costs
Total $000 $000 $000 $000 $000
Sale of goods and biological assets 2,432,147 400,258 202,443 1,433 3,036,281
Debtor interest associated with sales 10,052 10,052
Interest revenue from related party advances 1,492 1,492
Commission revenue 397,429 397,429 Sales revenue 2,841,120 400,258 202,443 1,433 3,445,254
Equity accounted profits 12,725 12,725
Earnings before interest, tax, depreciation and amortisation 328,002 46,012 2,576 (83,042) 293,548
Depreciation and amortisation (4,792) (4,443) (1,838) (723) (11,796) Depreciation on right-of-use assets (28,282) (4,283) (583) (2,297) (35,445) Segment result 294,928 37,286 156 (86,062) 246,308
Interest expense (5,226)
Unwinding discount expense in regards to liabilities (630)
Interest on lease liabilities (2,715)
Finance costs (8,571)
Profit before income tax benefit/(expense) 237,737
Segment assets 1,397,501 338,188 105,500 178,807 2,019,996 Segment liabilities 679,887 109,369 5,606 364,417 1,159,279
Net assets 717,614 228,819 99,894 (185,610) 860,717
Carrying value of equity accounted investments 47,547 47,547
Acquisition of non current assets (cash outflow) 75,327 2,197 1,728 79,252
Non cash income/(expense) other than depreciation and amortisation (284) 288 (132,802) (132,798)
Profit/(loss) on sale of non current assets 22,376 22,376
Elders 2022 Annual Report
86
NOTES TO THE CONSOLIDATED FINANCIAL STATEMENTS
For the year ended 30 September 2022
GROUP PERFORMANCE– NOTE 1: SEGMENT INFORMATION
Branch Network
2021
Sale of goods and biological assets
Wholesale Products
Feed and Processing Services
Corporate Services and Other Costs
Total $000 $000 $000 $000 $000
1,689,152 328,642 161,991 1,160 2,180,945
Debtor interest associated with sales 7,552 7,552
Interest revenue from related party advances 2,585 2,585 Commission revenue 357,842 357,842 Sales revenue 2,057,131 328,642 161,991 1,160 2,548,924
Equity accounted profits 10,897 10,897
Earnings before interest, tax, depreciation and amortisation 234,039 39,023 5,462 (71,136) 207,388 Depreciation and amortisation (3,725) (4,355) (1,423) (897) (10,400)
Depreciation on right-of-use assets (24,674) (3,274) (66) (2,511) (30,525)
Segment result 205,640 31,394 3,973 (74,544) 166,463
Interest expense (5,355)
Unwinding discount expense in regards to liabilities (1,028)
Interest on lease liabilities (2,372)
Finance costs (8,755)
Profit before income tax benefit/(expense) 157,708
Segment assets
1,157,142 302,488 87,668 249,732 1,797,030 Segment liabilities 608,714 87,687 12,291 309,746 1,018,438
Net assets 548,428 214,801 75,377 (60,014) 778,592
Carrying value of equity accounted investments 57,936 57,936 Acquisition of non current assets (cash outflow) 32,476 2,197 1,728 36,401
Non cash income/(expense) other than depreciation and amortisation (5,075) 58 (45,039) (50,056)
Profit/(loss) on sale of non current assets 423 423
Elders Limited Annual Financial Report
87
NOTES TO THE CONSOLIDATED FINANCIAL STATEMENTS
For the year ended 30 September 2022
GROUP PERFORMANCE– NOTE 2: REVENUE AND EXPENSES
Sales revenue
2022 2021
Note $000 $000
Sale of goods and biological assets 3,036,281 2,180,945
Debtor interest associated with sales 10,052 7,552
Interest revenue from related party advances 25 1,492 2,585 Commission revenue 397,429 357,842
Total sales revenue 3,445,254 2,548,924
Other items of income/(expense)
Sale of equity accounted investment 21,956
Impairment of foreign operation (6,982)
Other costs (747)
Total other items of income/(expense) 14,227
Finance costs
Interest expense (5,226) (5,355)
Unwinding discount expense in regards to liabilities (630) (1,028)
Interest on lease liabilities (2,715) (2,372)
Total finance costs (8,571) (8,755)
Specific expenses: depreciation and amortisation
Depreciation and amortisation (11,796) (10,400)
Depreciation on right-of-use assets (35,445) (30,525)
Total depreciation and amortisation (47,241) (40,925)
Specific expenses: employee benefit expense
Salaries, wages and incentives (222,267) (190,702)
Superannuation and other employee costs (43,865) (37,928)
Share based payments (3,570) (2,433)
Total employee benefit expense (269,702) (231,063)
Operating lease expenditure (2,011) (1,766)
Accounting Policy
Elders recognises revenue as or when each performance obligation from contracts with customers are satisfied and considers whether there are separate elements of each transaction to which a portion of the transaction price needs to be allocated. The majority of Elders’ revenue is recognised at a point in time and attributable to the sale of retail products, wholesale products, provision of agency services and real estate services, with the exception being certain financial services revenue which is recognised over a period of time. There were no significant judgements in revenue recognition. The following specific recognition criteria must also be met before revenue is recognised:
(i)
Sale of goods and biological assets
Revenue from the sale of goods predominantly relates to sale of agricultural retail products and wholesale products, and is recognised at the point in time when control has been transferred to the customer, generally through the execution of a sales agreement at point of sale or when the delivery of goods has occurred.
(ii) Commission revenue
Commission revenue is derived from the rendering of agency services, real estate services and financial services and is generally recognised at the point in time when the service is provided. In some cases, Elders will enter into contracts with customers that contain multiple performance obligations and revenue will be recognised as each of these is satisfied. The transaction price is allocated to each performance obligation accordingly.
(iii) Interest revenue
Interest income predominantly relates to revenue derived from trade receivables related to the sale of agricultural retail products and is recognised as it accrues using the effective interest rate method.
Elders 2022 Annual Report
88
NOTES TO THE CONSOLIDATED FINANCIAL STATEMENTS
For the year ended 30 September 2022
GROUP PERFORMANCE– NOTE 3: INCOME TAX
Significant Accounting Judgements, Estimates and Assumptions
Recovery of deferred tax assets
Deferred tax assets are recognised for deductible temporary differences as management considers that it is probable the future taxable profit will be available to utilise those temporary differences. Deferred tax assets are recognised for all unused tax losses to the extent that it is probable that taxable profit will be available against which the losses can be utilised. Significant management judgement is required to determine the amount of deferred tax assets that can be recognised, based on the likely timing and the level of future taxable profits together with future tax planning strategies.
(a) Major components of income tax expense are:
Income statement
2022 2021 $000 $000
Current income tax expense (70,982) (52,098)
Adjustments in respect of current income tax of previous years 596 360 Deferred income tax benefit 2,659 47,814
Income tax expense reported in the statement of comprehensive income (67,727) (3,924)
(b) Reconciliation of income tax expense applicable to accounting profit/(loss) before income tax at the statutory income tax rate to income tax expense at Elders’ effective income tax rate is as follows:
Total accounting profit before tax 237,737 157,708
Income tax expense at 30% (2021: 30%) (71,321) (47,312)
Adjustments in respect of current income tax of previous years 596 360
Share of equity accounted profits 3,825 3,269 Non-assessable profits/(losses) 4,148 (419)
Recognition of previously unrecognised losses 42,461 Impairment expense (3,604)
Other (1,371) (2,283) Income tax expense as reported in the statement of comprehensive income (67,727) (3,924)
Current tax payable 5,869 974
Capital losses not recognised as an asset
Elders held $103.5 million of capital losses (2021: $109.5 million) measured at 30% of gross value for which no deferred tax asset was recognised in the consolidated statement of financial position. The capital losses are available indefinitely for offset against future capital profits subject to continuing to meet relevant statutory tests.
Tax losses carried forward at the end of the year
Value of tax losses carried forward (net) 49,928 109,946
Tax Consolidation
Elders and its 100% owned Australian resident subsidiaries are in a tax consolidated group. Elders Limited is the head entity of the tax consolidated group. Members of the Group have entered into a tax sharing agreement that provides for the allocation of income tax liabilities between the entities should the head entity default on its tax payment obligations. No amounts have been recognised in the financial statements in respect of this agreement on the basis that the possibility of default is remote.
Tax Transparency Report
Elders has prepared a voluntary tax transparency report which is available to view online or to download from the Elders’ website at elders.com.au. The report sets out relevant tax information for Elders and its controlled entities for the year ended 30 September 2022. The tax transparency report has not been audited and does not form part of the Financial Report.
Elders Limited Annual Financial Report
89
NOTES TO THE CONSOLIDATED FINANCIAL STATEMENTS
For the year ended 30 September 2022
GROUP PERFORMANCE– NOTE 3: INCOME TAX
(c) Major components of deferred income tax:
Deferred income tax assets
Statement of Financial Position Movement
2022 2021 2022 2021
$000 $000 $000 $000
Losses available to offset against future taxable income 49,928 109,946 (60,018) (6,167)
Provision for employee entitlements 29,106 24,431 4,675 5,242
Other provisions 5,350 4,342 1,008 844
Capitalised expenses 3,817 3,187 630 (376)
Lease liabilities 36,962 32,992 3,970 1,658
Other 838 1,129 (291) 493
Gross deferred income tax assets 126,001 176,027 (50,026) 1,694
Deferred income tax liabilities
Inventory (2,121) (1,601) (520) 94
Intangibles (36,760) (37,202) 442 878
Right-of-use assets (35,780) (32,269) (3,511) (2,015)
Other (5,934) (2,282) (3,651) (1,745)
Gross deferred income tax liabilities (80,595) (73,354) (7,240) (2,788)
Net deferred tax asset 45,406 102,673
Movement in net deferred tax asset (57,266) (1,094)
Deferred income tax benefit recognised in the statement of comprehensive income (2,659) 47,814 Utilisation of booked tax losses 59,450 (48,628)
Deferred income tax assets/(liabilities) recognised for acquisitions of businesses (principally related to acquired intangibles) 627 120
Deferred income tax (expense)/benefit recognised in equity (152) (400) 57,266 (1,094)
Accounting Policy
Current tax assets and liabilities for the current and prior periods are measured at the amount expected to be recovered from or paid to the taxation authorities based on the current period’s taxable income.
Deferred income tax is recognised on temporary differences. Deferred income tax assets are recognised for taxable temporary differences and unused tax losses only if it is probable that future taxable amounts will be available to utilise those temporary differences.
The carrying amount of deferred income tax assets is reviewed at each reporting date and reduced to the extent that it is no longer probable that sufficient taxable profit will be available to allow all or part of the deferred income tax asset to be utilised. Unrecognised deferred income tax assets are reassessed at each reporting date and are recognised to the extent that it has become probable that future taxable profit will allow the deferred tax asset to be recovered.
Current tax assets and liabilities are offset if there is a legally enforceable right to offset and the Group intends to either settle on a net basis, or to realise the asset and settle the liability simultaneously. Deferred tax assets and liabilities are offset if there is a legally enforceable right to offset current tax liabilities and assets, and when the deferred tax balances relate to income taxes levied by the same tax authority.
Other taxes
Revenues, expenses and assets are recognised net of the amount of GST. Receivables and payables are stated inclusive of the amount of GST receivable or payable. The net amount of GST recoverable from, or payable to, the taxation authority is included as part of receivables or payables in the consolidated statement of financial position.
Cash flows are included in the consolidated statement of cash flows on a gross basis and the GST component of cash flows arising from investing and financing activities, which is recoverable from, or payable to, the taxation authority are classified as operating cash flows.
Elders 2022 Annual Report
90
NOTES TO THE CONSOLIDATED FINANCIAL STATEMENTS
For the year ended 30 September 2022
GROUP PERFORMANCE– NOTE 4: EARNINGS PER SHARE
2022 2021
Weighted average number of ordinary shares (‘000) used in calculating basic EPS 156,477 156,305
Dilutive performance rights (‘000) 579
Adjusted weighted average number of ordinary shares used in calculating dilutive EPS (‘000) 156,477 156,884
In previous periods rights issued under the LTIP scheme were considered dilutive as it was anticipated that shares would be issued. Given the policy change to purchasing shares on the market, rather than issuing shares, no dilution from performance rights in the current period is recognised.
The following reflects the net profit/(loss) and share data used in the calculations of earnings per share (EPS):
2022 2021 $000 $000
Reported operations
Basic and dilutive
Net profit attributable to members (after tax) 162,866 149,777
Reportedoperationsearningspershare:
Basic earnings per share (cents per share) 104.1¢ 95.8¢
Diluted earnings per share (cents per share) 104.1¢ 95.5¢
Accounting Policy
Basic earnings per share amounts are calculated by dividing net profit or loss for the year attributable to ordinary equity holders of the parent by the weighted average number of ordinary shares outstanding during the period. Diluted earnings per share are calculated by dividing the net profit attributable to ordinary equity holders of the parent by the weighted average of ordinary shares outstanding during the period plus the weighted average number of ordinary shares that would be issued on conversion of all dilutive potential ordinary shares into ordinary shares.
Elders Limited Annual Financial Report
91
NOTES TO THE CONSOLIDATED FINANCIAL STATEMENTS
For the year ended 30 September 2022
WORKING CAPITAL– NOTE 5: RECEIVABLES
Current
2022 2021 $000 $000
Trade debtors 795,489 695,274
Loss allowance (7,034) (9,257) 788,455 686,017
Amounts receivable from equity accounted investments 2,515 17,520 Livestock deferred receivables 8,856 16,276 Prepayments 8,328 3,909 Other receivables 11,350 11,047
Total current receivables 819,504 734,769
Included in trade debtors is $107.3 million (2021: $93.9 million) which is subject to credit insurance with various terms and conditions.
Trade debtors are generally on 30 to 90 day terms with the exception of Livestock debtors which are on 10 day terms. In some instances, deferred terms in excess of 90 days are offered, where Elders also receives extended creditor terms.
In line with AASB 9, trade debtors are reviewed in accordance with the simplified approach to measuring expected credit losses based on the payment profile of sales over a period of five years and the corresponding historical credit losses experienced within this period, which is reassessed annually. The historical loss rates are adjusted to reflect current and forward-looking information (including agricultural specific macroeconomic factors) affecting the ability of the customers to settle the debtors. Elders' assessment of trade receivables and loss allowances was determined as follows:
Current 1-30 days past due 31-60 days past due 61-90 days past due +91 days past due Total $000 $000 $000 $000 $000 $000
2022
Expected loss rate
< 1% < 1% < 1% < 1% 44%
Gross carrying amount 675,925 84,908 11,666 8,206 14,784 795,489 Loss allowance 406 127 35 1 6,465 7,034
2021
Expected loss rate
< 1% < 1% < 2% < 1% 56%
Gross carrying amount 597,142 72,683 9,345 2,918 13,186 695,274 Loss allowance 1,483 218 182 6 7,368 9,257
Reconciliation
of loss allowances for trade debtors at beginning and end of period:
2022 2021 $000 $000
Opening loss allowance 9,257 8,245
Increase/(decrease) in loss allowance recognised in profit or loss (1,226) 2,172
Trade debtors written off (997) (1,254)
Increase in loss allowance through acquisitions 94
Closing loss allowance 7,034 9,257
Related party receivables
For terms and conditions of related party receivables, including from equity accounted investments, refer to note 25
Fair value and credit risk
Due to the short term nature of trade and other current receivables, their carrying value is assumed to approximate their fair value. For other receivables the carrying amount is not materially different to their fair values. The maximum exposure to credit risk is the fair value of each class of receivables. Details regarding credit risk exposure are disclosed in note 16
Foreign exchange and interest rate risk
Details regarding the foreign exchange and interest rate risk exposure are disclosed in note 16, including those relating to derivative related balances.
Elders 2022 Annual Report
92
NOTES TO
THE CONSOLIDATED FINANCIAL STATEMENTS
For the year ended 30 September 2022
WORKING CAPITAL– NOTE 5: RECEIVABLES
Accounting Policy
Trade receivables are recognised initially at transaction price and subsequently measured at amortised cost using the effective interest rate method, less expected credit losses. To measure the expected credit losses, trade receivables have been grouped on days past due.
The expected credit loss rates are based on payment profile over a historical period and the credit losses experienced within this period. The historical loss rates are adjusted to reflect current and forward-looking information on macroeconomic factors affecting the ability of the customers to settle the receivables.
Livestock deferred receivables are recognised initially at transaction price and subsequently measured at amortised cost using the effective interest rate method. All balances hold a maturity of less than 12 months. Interest on livestock deferred receivables is recognised as it accrues using the effective interest rate method.
WORKING CAPITAL – NOTE 6: LIVESTOCK
Current
2022 2021 $000 $000
Total livestock 73,371 56,237
Reconciliation of fair value of livestock at beginning and end of period:
Opening fair value 56,237 44,734
Purchases 168,395 131,925
Cost of sales (152,315) (120,480)
Fair value increment/(decrement) 1,054 58
Closing fair value 73,371 56,237
At balance date 22,789 head of cattle (2021: 22,265) are included in livestock. This represents cattle held in Australia for feedlotting purposes.
Elders is exposed to a number of risks related to its livestock:
Regulatory and environmental risks
Elders is subject to laws and regulations and has established environmental policies and procedures aimed at compliance with local environmental and other laws. Management performs regular reviews to identify environmental risks and ensure systems in place are adequate to manage those risks.
Supply and demand risk
Elders is exposed to financial risk in respect of livestock activity. The primary financial risk associated with this activity occurs due to the length of time between expending cash on the purchase and ultimately receiving cash from the sale to third parties. Elders is exposed to risks arising from fluctuations in price and sales volumes, and product substitution. Where possible, Elders manages these risks by aligning volumes with market supply and demand, and through the sale of livestock on forward contracts.
Other risks
Elders’ livestock are exposed to the risk of damage from disease and other natural forces. Elders has extensive processes in place aimed at monitoring and mitigating those risks, including regular health inspections and industry pest and disease surveys.
Accounting Policy
Elders holds biological assets in the form of livestock. Livestock is measured at fair value internally as there is no observable market for them. Where there are unobservable inputs for an asset or liability, these are classified as Level 3 Price Inputs. The value is based on the estimated exit price per kilogram and the value changes for the weight of each animal as it progresses through the feedlot program. The key factors affecting the value of each animal are price/kg, days on feed and the feed conversion ratio. The market value increments or decrements are recorded in profit and loss.
Significant changes in any of the significant unobservable valuation inputs for feedlot cattle in isolation would result in significantly higher or lower fair value measurement.
Elders Limited Annual Financial Report
93
NOTES TO THE CONSOLIDATED FINANCIAL STATEMENTS
For the year ended 30 September 2022
WORKING CAPITAL– NOTE 7: INVENTORY
Significant Accounting Judgements, Estimates and Assumptions
Accounting for rebates
Elders receives rebates associated with the purchase of retail goods from suppliers. These vary in nature and include price and volume rebates. Rebates received, in line with the relevant contractual arrangements, are recognised as a reduction to cost of sales when the sale of the particular product occurs. Inventory on hand is recognised net of rebates.
Elders pays rebates associated with the sales of wholesale goods to suppliers. These vary in nature and include price and volume rebates. Rebates paid, in line with the relevant contractual arrangements, are recognised as a reduction to sales revenue when the sale of the particular product occurs.
2022 2021 $000 $000
Current Retail and Wholesale 484,801 315,180
Other 5,357 9,750
Provision for obsolescene (5,676) (3,247)
Total inventory 484,482 321,683
Inventory write-downs recognised as an expense totalled $2.4 million (2021: $4.2 million).
Accounting Policy
Inventories are valued at the lower of cost and net realisable value. Costs are assigned to individual items of inventory predominately on the basis of weighted average cost. Net realisable value is the estimated selling price in the ordinary course of business less the estimated costs necessary to make the sale.
Supplier rebates received are recognised as a reduction in the cost of inventory and are recorded as a reduction in cost of sales when the inventory is sold.
Elders 2022 Annual Report
94
NOTES TO THE CONSOLIDATED FINANCIAL STATEMENTS
For the year ended 30 September 2022
WORKING CAPITAL– NOTE 8: TRADE AND OTHER PAYABLES
Current
2022 2021 $000 $000
Trade creditors 617,044 546,997
Payables associated with supplier financing arrangements 47,114 26,050
Other creditors and accruals 70,590 73,541 Payables to associated companies 1,625 1,706 736,373 648,294
Non current
Other creditors and accruals 16,059 19,204 Total trade and other payables 752,432 667,498
Interest rate, foreign exchange and liquidity
risk
Information regarding interest rate, foreign exchange and liquidity risk exposure is set out in note 16, including those relating to derivative forward contracts.
Accounting Policy
Trade and other payables are carried at amortised cost and due to their short term nature they are not discounted. The carrying amount of trade and other payables are assumed to be the same as their fair values. They represent liabilities for goods and services provided to Elders prior to the end of the financial year that remain unpaid and arise when Elders becomes obliged to make future payments in respect of the purchase of these goods and services. The amounts are unsecured and are usually paid within supplier terms.
Financial guarantees
Financial guarantee contracts issued by Elders are those contracts that require a payment to be made to reimburse the holder for a loss it incurs because the specific debtor fails to make a payment when due in accordance with the terms of the debt instrument. Financial guarantee contracts are recognised initially at fair value, adjusted for transaction costs that are directly attributable to the issuance of the guarantee. Subsequently, the liability is measured at the higher of the best estimate of the expenditure required to settle the present obligation at the reporting date and the amount recognised less cumulative amortisation. Information regarding financial guarantees is set out in note 24
Payables associated with supplier financing arrangements
To manage the cash flow conversion cycle on some products procured and to ensure that suppliers receive payment in a time period that suits their business model, Elders offers some suppliers the opportunity to use supplier financing arrangements. Elders evaluates supplier financing arrangements against a number of indicators to assess if the balance continues to hold the characteristics of a payable or is required to be reclassified as borrowings. These indicators include whether the payment terms exceed customary payment terms within the industry of typically less than 90 days. During the course of the year and as at 30 September 2022, none of the balances subject to supplier financing arrangements met the characteristics to be reclassified as borrowings and the balances remained in other payables. Balances associated with supplier financing arrangements are unsecured. In the statement of cash flows supplier financing is classified within cash flows from operating activities.
Elders Limited Annual Financial Report
95
NOTES TO THE CONSOLIDATED FINANCIAL STATEMENTS
For the year ended 30 September 2022
CAPITAL EMPLOYED– NOTE 9: PROPERTY, PLANT AND EQUIPMENT
Significant Accounting Judgements, Estimates and Assumptions
Impairment of non-financial assets other than brand names and goodwill Elders assesses impairment of all assets at each reporting date by evaluating conditions specific to the company and to the particular asset that may lead to impairment. These include product performance, technology, climate, economic and political environments and future product expectations. If an impairment trigger exists, the recoverable amount of the asset is determined. It is Elders’ policy to conduct bi-annual internal reviews of asset values, which are used as sources of information to assess for indicators of impairment. Assets have been tested for impairment in accordance with the accounting policies, including the determination of recoverable amounts of assets using the higher of value in use and fair value less cost to sell.
land Buildings Leasehold improvements Plant and equipment (owned)
2022
Carrying amount at beginning of period
Assets under construction Total
Note $000 $000 $000 $000 $000 $000
3,484 11,778 4,396 15,757 603 36,018
Additions 90 748 1,697 5,818 8,008 16,361
Additions through business combinations 22 36 1,415 1,451 Disposals (5) (31) (273) (309)
Depreciation expense (1,102) (1,027) (3,715) (5,844) Impairment/ writedown expense (766) (766)
Exchange fluctuations (2) 24 22
Transfers from assets under construction 32 7 17 (56) Other transfers within PPE 20 20
Carrying amount at end of period 3,569 11,456 5,076 18,297 8,555 46,953
Cost 3,569 21,022 15,231 45,197 8,555 93,574
Accumulated depreciation and impairment (9,566) (10,155) (26,900) (46,621) 3,569 11,456 5,076 18,297 8,555 46,953
2021
Carrying amount at beginning of period 3,516 11,419 4,502 12,473 358 32,268
Additions 10 1,128 547 4,096 597 6,378
Additions through business combinations 92 2,787 2,879 Disposals (42) (29) (7) (410) (488) Depreciation expense (740) (851) (3,438) (5,029)
Exchange fluctuations 10 10
Transfers from assets under construction 113 239 (352)
Carrying amount at end of period 3,484 11,778 4,396 15,757 603 36,018
Cost 3,484 20,242 13,536 39,251 603 77,116
Accumulated depreciation and impairment (8,464) (9,140) (23,494) (41,098) 3,484 11,778 4,396 15,757 603 36,018
All property, plant and equipment is pledged as security, refer to note 15 for interest bearing loans and borrowings.
Elders 2022 Annual Report
96
Freehold
NOTES TO THE CONSOLIDATED FINANCIAL STATEMENTS
For the year ended 30 September 2022
CAPITAL EMPLOYED– NOTE 9: PROPERTY, PLANT AND EQUIPMENT
Accounting Policy
Property, plant and equipment are stated at historical cost less accumulated depreciation and any accumulated impairment losses. Such costs include the cost of replacing part of the property, plant and equipment and borrowing costs for long-term construction projects if the recognition criteria are met. When significant parts of property, plant and equipment are required to be replaced at intervals, Elders recognises such parts as individual assets with specific useful lives and depreciates them accordingly. All other repairs and maintenance are recognised in profit or loss as incurred.
Property, plant and equipment, excluding freehold land and assets under construction, are depreciated over the estimated useful economic life of specific assets as follows:
Life Method
50 years Straight line Leasehold improvements Lease term Straight line Plant and equipment – owned 3 to 10 years Straight line Network infrastructure 5 to 25 years Straight line
Buildings
The useful lives are consistent with those of the prior period. The assets’ residual values, useful lives and depreciation methods are reviewed, and adjusted if appropriate at each financial year end.
Derecognition
An item of property, plant and equipment is derecognised upon disposal or when no future economic benefits are expected from its use or disposal. Gains and losses on disposal are determined by comparing the proceeds with the carrying amount. These are included in the consolidated statement of comprehensive income.
Elders Limited Annual Financial Report
97
NOTES TO THE CONSOLIDATED FINANCIAL STATEMENTS
For the year ended 30 September 2022
CAPITAL EMPLOYED– NOTE 10: LEASES
Significant Accounting Judgements, Estimates and Assumptions
Accounting for leases
In determining the lease term, Elders considers all facts and circumstances that create an economic incentive to exercise an extension option, or not exercise a termination option. Extension options (or periods after termination options) are only included in the lease term if the lease is reasonably certain to be extended (or not terminated). Elders holds leases of operational importance (e.g. rural cornerstone property leases) which are expected to be extended for the maximum available lease term. Leases of this nature have been assessed using the extended lease term. For all other leases, the lease term excluding extension and termination options has been applied. The assessment is reviewed if a significant event or a significant change in circumstances occurs which affects this assessment and that is within the control of Elders.
Where Elders is a lessee:
(a) Amounts recognised in the consolidated statement of financial position
Reconciliation of carrying amounts of right-of-use assets at beginning and end of period:
Properties Motor vehicles Other Total $000 $000 $000 $000
2022
Carrying amount at beginning of period 89,786 15,419 534 105,739
Additions 10,268 9,382 19,650 Depreciation expense (22,760) (12,430) (255) (35,445)
Lease modifications and reassessments 21,778 7,582 29,360 Carrying amount at end of period 99,072 19,953 279 119,304
2021
Carrying amount at beginning of period 86,722 13,343 737 100,802
Additions 12,099 5,436 17,535 Depreciation expense (19,942) (10,380) (203) (30,525)
Lease modifications and reassessments 10,907 7,020 17,927
Carrying amount at end of period 89,786 15,419 534 105,739
Reconciliation of carrying amounts of lease liabilities at beginning and end of period:
2022 2021 $000 $000
Carrying amount at beginning of period 110,677 104,501
Additions 19,650 17,535
Interest expense 2,715 2,372
Lease modifications and reassessments 29,124 17,927 Repayments of principal and interest (38,623) (31,658)
Carrying amount at end of period 123,543 110,677
Lease liabilities of which are:
● Current lease liabilities 32,716 37,972
● Non current lease liabilities 90,827 72,705 123,543 110,677
Elders 2022 Annual Report
98
NOTES TO THE CONSOLIDATED FINANCIAL STATEMENTS
For the year ended 30 September 2022
CAPITAL EMPLOYED– NOTE 10: LEASES
Accounting Policy
Elders leases various offices, warehouses, retail stores and motor vehicles. Rental contracts are typically made for an average period of three years but may have extension options as described below. Lease terms are negotiated on an individual basis and contain a wide range of different terms and conditions. The lease agreements do not impose on any banking covenants, however leased assets may not be used as security for borrowing purposes.
Leases are recognised as a right-of-use asset with a corresponding liability at the date at which the leased asset is available for use. Each lease payment is allocated between the liability and interest expense. The interest expense is charged to profit or loss over the lease period to produce a constant periodic rate of interest on the remaining balance of the liability for each period. The right-of-use asset is depreciated over the shorter of the asset’s useful life and the lease term on a straight-line basis.
Assets and liabilities arising from a lease are initially measured on a present value basis. Lease liabilities include the net present value of the following lease payments:
• fixed payments (including in-substance fixed payments), less any lease incentives receivable
• variable lease payment that are based on an index or a rate
• the exercise price of a purchase option if the lessee is reasonably certain to exercise that option
Lease payments are discounted using Elders incremental borrowing rate, being the rate Elders would have to pay to borrow the funds necessary to obtain an asset of similar value in a similar economic environment with similar terms and conditions.
Elders is exposed to potential future increases in variable lease payments based on an index or rate, which are not included in the lease liability until they take effect. When adjustments to lease payments based on an index or rate take effect, the lease liability is reassessed and adjusted against the right-of-use asset.
Right-of-use assets are measured at cost comprising the following:
• the amount of the initial measurement of lease liability
• any lease payments made at or before the commencement date less any lease incentives received
Payments associated with leases of low-value assets are recognised on a straight-line basis as an expense in profit or loss. Low-value assets comprise of IT equipment and office equipment. Elders does not have any short term leases with a lease term of 12 months or less.
Extension and termination options
Extension and termination options are included in Elders’ property leases. These terms are used to maximise operational flexibility in terms of managing contracts. The majority of the extension and termination options held are exercisable only by Elders and not by the respective lessor.
Elders Limited Annual Financial Report
99
NOTES TO THE CONSOLIDATED FINANCIAL STATEMENTS
For the year ended 30 September 2022
CAPITAL EMPLOYED– NOTE 11: INTANGIBLES
Significant Accounting Judgements, Estimates and Assumptions
Impairment of brand names and goodwill Elders assesses impairment of assets at each reporting date by evaluating conditions specific to the company and to the particular asset that may lead to impairment. These include product performance, technology, climate, economic and political environments and future product expectations. If an impairment trigger exists the recoverable amount of the asset is determined. It is Elders’ policy to conduct bi-annual internal reviews for indicators of impairment. If indicators exist, assets are tested for impairment through determination of recoverable amounts of assets using the higher of value in use and fair value less cost to sell.
Elders determines whether the brand names and goodwill are impaired or whether it is appropriate to reverse any previous impairments on an annual basis. This requires an estimation of the recoverable amount of the associated cash-generating units, using a value in use discounted cash flow methodology, to which the brand names or goodwill is allocated.
Reconciliation of carrying amounts at beginning and end of period:
2022
Carrying amount at beginning of period 175,151 9,325 80,240 23,000 40,979 3,948 332,643 Additions 786 4,407 4,235 182 9,610
Additions through business combinations 23,181 3,949 753 27,883 Amortisation (1,756) (3,594) (602) (5,952) Other 136 136
Carrying amount at end of period 199,254 15,925 80,993 23,000 37,385 4,235 3,528 364,320
Cost 199,254 22,455 80,993 23,000 47,620 4,235 5,127 382,684
Accumulated amortisation and impairment (6,530) (10,235) (1,599) (18,364) 199,254 15,925 80,993 23,000 37,385 4,235 3,528 364,320
2021
Carrying amount at beginning of period 146,952 8,214 79,162 23,000 44,476 4,443 306,247 Additions 305 1,540 415 2,260
Additions through business combinations 27,894 865 1,078 29,837 Amortisation (1,294) (3,497) (580) (5,371) Impairment (330) (330) Carrying amount at end of period 175,151 9,325 80,240 23,000 40,979 3,948 332,643
Cost 175,151 14,098 80,240 23,000 47,621 5,085 345,195 Accumulated amortisation and impairment (4,773) (6,642) (1,137) (12,552) 175,151 9,325 80,240 23,000 40,979 3,948 332,643
For impairment testing purposes, all intangibles except for the Elders’ Brand Name have been allocated to the Branch Network and Wholesale Products cash generating units as applicable. For Branch Network, $125.0 million (2021: $119.4 million) of goodwill, $12.8 million (2021: $12.0 million) of brand names and $23.0 million (2021: $23.0 million) of distribution rights were allocated for impairment testing. For Wholesale Products, $74.3 million (2021: $74.3 million) of goodwill and $7.6 million (2021: $7.6 million) of brand names were allocated for impairment testing. The Elders' Brand Name has not been allocated to individual cash generating units but rather assessed against all cash generating units expected to benefit from it.
Elders 2022 Annual Report
100
Non current Goodwill Rent rolls & loan books Brand names Distribution rights Customer intangibles Software Assets in progress Other Total $000 $000 $000 $000 $000 $000 $000 $000
NOTES TO THE CONSOLIDATED FINANCIAL STATEMENTS
For the year ended 30 September 2022
CAPITAL EMPLOYED– NOTE 11: INTANGIBLES
The recoverable amount of cash generating units has been determined based on a value in use calculation using cash flow projections approved by management that covers a period of 5 years. Future cash flows are based on budgets and forecasts taking into account current market conditions and known future business events that will impact cash flows. The discount rate applied to the cash flow projections is 10.0% pre-tax (2021: 10.0% pre- tax) which has been determined based on a weighted average cost of capital calculation which incorporates the specific risks relating to the cash generating units identified. The estimated recoverable amount of each of the CGU’s is greater than the carrying values at 30 September 2022. Carrying values are not sensitive to a reasonable change in discount rate of +/- 2% and significant headroom remains.
The calculation of value in use for cash generating units was based on the following key assumptions:
Gross margin
Gross margin is expected to increase in financial year 2023 due to:
• increased earnings from geographical expansion through acquisitions and footprint growth
• higher earnings from continued organic growth focus across our product and service portfolio
• additional growth through the continued expansion of the backward integration strategy
Selling, general and administrative expenses
Ongoing emphasis on cost control will be offset by investment directly linked to margin improvement and control enhancement, including implementation of remuneration models which drive performance and growth.
Growth rate estimates
Cash flows are based on the 2023 budget. No growth rate for years 2 to 5 or perpetuity has been incorporated in the discounted cash flow.
Discount rates
Discount rates reflect management’s estimate of the time value of money and the specific risk not already reflected in the cash flows.
Accounting Policy
(i)
Brand Names
The brand name intangibles are deemed to have an indefinite useful life and are not amortised. The brand name value represents the value attributed to brands when acquired through business combinations and is carried at cost less accumulated impairment losses. The brand names have been determined to have an indefinite useful life due to there being no foreseeable limit to the period over which they are expected to generate net cash inflows, given the strength and durability of the brands and the level of marketing support. The brands have been in the rural and regional Australian market for many years, and the nature of the industry Elders operates in is such that brand obsolescence is not common, if appropriately supported by advertising and marketing spend.
Expenditure incurred in developing, maintaining or enhancing the brand names is expensed in the year that it occurred.
(ii) Goodwill
After initial recognition, goodwill acquired in a business combination is measured at cost less any accumulated impairment losses. Goodwill is not amortised but is subject to impairment testing on an annual basis or whenever there is an indicator of impairment.
(iii) Rent rolls and loan books
Rent rolls and loan books have been acquired and are carried at cost less accumulated amortisation and impairment losses. These intangible assets have been determined to have finite useful lives and are amortised over their useful lives of 10 years and tested for impairment whenever there is an indicator of impairment.
(iv) Distribution rights
Amount relates to a livestock and wool delivery guarantee distribution right. After initial recognition, distribution rights are measured at cost less any accumulated impairment losses. These intangible assets have been assigned an indefinite life and are subject to impairment testing on an annual basis or whenever there is an indicator of impairment.
(v) Customer intangibles
Customer intangibles relates to wholesale and member relationships recognised as part of the AIRR acquisition and are carried at cost less accumulated amortisation and impairment losses. These intangible assets have been determined to have finite useful lives and are amortised over their useful lives of 10 to 15 years and tested for impairment whenever there is an indicator present.
(vi)
Software assets
Software assets relates to internally generated software and associated assets that form part of the System Modernisation program and are carried at cost until project milestones are completed. When a project milestone is completed, the asset is ready for use and amortised over the asset's useful life of 10 years in line with Elders' policy for core IT systems.
(vii) Other
Other intangibles mainly relate to software and development of IT infrastructure and are carried at cost less accumulated amortisation and impairment losses. Software and IT intangible assets have been determined to have finite useful lives and are amortised over their useful lives of 5 years and tested for impairment whenever there is an indicator of impairment. Other intangibles also include indefinite life assets.
The useful life of an intangible asset with an indefinite life is reviewed each reporting period to determine whether the indefinite life assessment continues to be supportable. If not, the change in the useful life assessment from indefinite to finite is accounted for as a change in accounting estimate and is thus accounted for on a prospective basis.
Elders Limited Annual Financial Report
101
NOTES TO THE CONSOLIDATED FINANCIAL STATEMENTS
For the year ended 30 September 2022
CAPITAL EMPLOYED– NOTE 12: EQUITY ACCOUNTED INVESTMENTS
Balance date Ownership interest
2022 2021 % %
Auctions Plus Pty Ltd 30-Jun 50 50
Elders Insurance (Underwriting Agency) Pty Ltd 31-Dec 20 20
StockCo Holdings Pty Ltd 30-Jun 30
Clear Grain Pty Ltd 30-Jun 30 30
Agcrest Holdings Pty Ltd 30-Jun 33 33 Agcrest Land Holdings Pty Ltd 30-Jun 33 33
Elders Financial Planning Pty Ltd 30-Sep 49
Consolidated entity investment Contribution to net profit
Dividends received
2022 2021 2022 2021 2022 2021 $000 $000 $000 $000 $000 $000
Auctions Plus Pty Ltd 2,507 2,637 1,486 1,954 1,617 1,491
Elders Insurance (Underwriting Agency) Pty Ltd 42,982 42,653 10,195 8,449 9,889 7,913
StockCo Holdings Pty Ltd 10,916 516 89
Clear Grain Pty Ltd 2,020 1,580 740 405 300 180
Agcrest Holdings Pty Ltd 38 100 (212)
Agcrest Land Holdings Pty Ltd 50
Equity accounted investments 47,547 57,936 12,725 10,897 11,806 9,584
All equity accounted investments are Australian resident companies. Summary financial information for equity accounted investees is as follows:
Profit/(loss) after income tax Assets Liabilities $000 $000 $000
2022
Auctions Plus Pty Ltd 2,972 7,636 (2,508)
Elders Insurance (Underwriting Agency) Pty Ltd 51,095 109,708 (98,645)
StockCo Holdings Pty Ltd 1,719
Clear Grain Pty Ltd 2,466 7,747 (4,810)
Agcrest Holdings Pty Ltd (642) 896 (4)
Total 57,610 125,987 (105,967)
2021
Auctions Plus Pty Ltd 3,907 8,415 3,140
Elders Insurance (Underwriting Agency) Pty Ltd 42,247 97,610 88,000
StockCo Holdings Pty Ltd 298 294,274 292,838
Clear Grain Pty Ltd 1,350 5,178 3,827
Total 47,802 405,477 387,805
Accounting Policy
Elders’ equity accounted investments are accounted for using the equity method of accounting in the consolidated financial statements and at cost in the parent. Equity accounted investments are entities over which Elders has significant influence and that are neither subsidiaries nor joint ventures.
Under the equity method, equity accounted investments are carried in the consolidated financial statements at cost plus post acquisition changes in Elders’ share of net assets of the investment. Goodwill relating to the investment is included in the carrying amount of the investment and is neither amortised nor individually tested for impairment.
The statement of comprehensive income reflects Elders’ share of the results of operations of the equity accounted investments.
Elders 2022 Annual Report
102
NOTES TO THE CONSOLIDATED FINANCIAL STATEMENTS
For the year ended 30 September 2022
CAPITAL EMPLOYED– NOTE 13: PROVISIONS
Reconciliation of carrying amounts at beginning and end of period:
Employee benefits Restructuring provisions Make good Other Total $000 $000 $000 $000 $000
2022
As at beginning of period 81,582 484 996 1,962 85,024
Arising during year 62,731 1,559 2,675 66,965
Utilised (52,514) (10) (32) (1,190) (53,746)
Unused amounts reversed (581) (53) (634) Provisions arising from entities acquired 616 616 92,415 2,033 383 3,394 98,225
Disclosed as:
Current 88,538 2,033 383 3,394 94,348 Non current 3,877 3,877
Total 92,415 2,033 383 3,394 98,225
2021
As at beginning of period 64,148 1,193 694 2,181 68,216 Arising during year 38,953 675 339 39,967
Utilised (23,422) (709) (199) (433) (24,763)
Unused amounts reversed (174) (125) (299)
Discount rate adjustment 426 426
Provisions arising from entities acquired 1,477 1,477 81,582 484 996 1,962 85,024 Disclosed as:
Current 78,428 484 996 1,962 81,870 Non current 3,154 3,154 Total 81,582 484 996 1,962 85,024
Elders Limited Annual Financial Report
103
NOTES TO THE CONSOLIDATED FINANCIAL STATEMENTS
For the year ended 30 September 2022
CAPITAL EMPLOYED– NOTE 13: PROVISIONS
Accounting Policy
Provisions are recognised when Elders has a present obligation (legal or constructive) as a result of a past event, which makes it probable that an outflow of resources embodying economic benefits will be required to settle the obligation and a reliable estimate can be made of the amount of the obligation. When Elders expects some or all of the provision to be reimbursed, for example under an insurance contract, the reimbursement is recognised as a separate asset, but only when the reimbursement is virtually certain. The expense relating to any provision is presented in the statement of comprehensive income net of any reimbursement.
Provisions are measured at the present value of management’s best estimate of the expenditure required to settle the present obligation at the reporting date. The discount rate used to determine the present value reflects current market assessments of the time value of money and the risks specific to the liability. The increase in the provision resulting from the passage of time is recognised in finance costs.
Employee benefits
(i) Wages, salaries, annual leave and sick leave
Liabilities for wages and salaries, including non-monetary benefits and annual leave expected to be settled within 12 months of the reporting date are recognised in respect of employees’ service up to the reporting date. They are measured at the amounts expected to be paid when the liabilities are settled. Expenses for non-accumulating sick leave are recognised when the leave is taken and are measured at the rates paid or payable.
(ii) Long service leave
The liability for long service leave is recognised in the provision for employee benefits and measured as the present value of expected future payments to be made in respect of services provided by employees up to the reporting date using the projected unit credit method. The non-current portion of this liability relates to the entitlement that Elders does not expect employees to take within 12 months of the reporting date.
Consideration is given to expected future wage and salary levels, experience of employee departures, and periods of service. Expected future payments are discounted using market yields at the reporting date on high quality corporate bonds with terms to maturity and currencies that match, as closely as possible, the estimated future cash outflows.
(iii) Incentives
Includes corporate, network and other incentives. These are accrued throughout the reporting period, according to performance based measures.
Restructuring provisions
Provisions are only recognised when general recognition criteria provisions are fulfilled. Additionally, Elders needs to follow a detailed formal plan about the business or part of the business concerned, the location and the number of employees affected, a detailed estimate of the associated costs, and appropriate time line. The people affected have a valid expectation that the restructuring is being carried out or the implementation has been initiated already.
Make Good (Restoration)
Where Elders has entered into leasing arrangements that require the leased asset to be returned at the end of the lease term in its original condition, an estimate is made of the costs of restoration or dismantling of any improvements and a provision is raised.
Onerous contracts
A provision for onerous contracts is recognised when the expected benefits to be derived from a contract are lower than the unavoidable cost of meeting its obligations under the contract. The provision is measured at the present value of the lower of the expected cost of terminating the contract and the expected net cost of complying with the contract. Before a provision is established, Elders recognises any impairment loss on the assets associated with that contract.
Elders 2022 Annual Report
104
NOTES TO
THE CONSOLIDATED FINANCIAL STATEMENTS
For the year ended 30 September 2022
NET DEBT– NOTE 14: CASH FLOW STATEMENT RECONCILIATION
(a) Reconciliation of net profit after tax to net cash flows from operations
2022 2021 $000 $000
Profit after income tax expense 170,010 153,784
Adjustments for non cash items:
Depreciation and amortisation 47,241 40,925
Unwinding of discount in regards to payables 630 1,028
Equity accounted profits (12,725) (10,897)
Dividends from equity accounted investments 11,806 9,584
Other fair value adjustments (1,054) (58)
Impairments 766 330
Doubtful debts (1,226) 2,172
Employee entitlements 62,731 39,379
Other provisions 3,599 715
Other write downs 2,429 4,216
Net profit on sale of non-current assets (22,376) (423)
Net tax movements 62,272 1,154
Other non cash items 3,570 2,433
Total non cash items 157,663 90,558
Total after non cash items 327,673 244,342
● (Increase)/decrease in receivables and other assets (99,163) (142,404)
● (Increase)/decrease in inventories (165,228) (59,087) Increase/(decrease) in payables and provisions 50,379 99,306
Net cash flows from operating activities 113,661 142,157
(b) Cash and cash equivalents
Cash at bank and in hand 17,840 48,063
(c) Net debt reconciliation
Cash and cash equivalents
17,840 48,063
Borrowings - repayment within one year (179,210) (154,265)
Borrowings - repayment after one year
Lease liabilities (123,543) (110,677) Net debt (284,914) (216,879)
Cash and liquid investments 17,840 48,063
Gross debt - fixed interest rates (123,543) (110,677)
Gross debt - variable interest rates (179,210) (154,265) Net debt (284,914) (216,879)
Non-cash investing and financing activities disclosed in other notes are:
• acquisition of right-of-use assets – note 10
• shares issued a part of purchase consideration of a business combination – note 22
• dividend distributions through the issue of shares under the dividend reinvestment plan – note 19
• shares issued to eligible executives under Elders Long-Term Incentive Plan – note 26
At balance date, Elders held $46.3 million (2021: $52.6 million) of client monies in trust which are off balance sheet. The funds are held on behalf of clients in the Real Estate business and Elders is bound by the relevant legislation in each state in relation to controls and governance over the funds.
Accounting Policy
Cash and cash equivalents in the statement of financial position comprise cash at bank and on hand and short-term deposits with a maturity of three months or less. For the purposes of the consolidated statement of cash flows, cash and cash equivalents consist of cash and cash deposits as defined above, net of outstanding bank overdrafts.
Elders Limited Annual Financial Report
105
NOTES TO THE CONSOLIDATED FINANCIAL STATEMENTS
For the year ended 30 September 2022
NET DEBT– NOTE 15: INTEREST BEARING LOANS AND BORROWINGS
Current
2022 2021 $000 $000
Unsecured loans 4,230 4,265
Trade receivables and other working capital funding 174,980 150,000 179,210 154,265
Elders has complied with all applicable bank covenants throughout the reporting period.
Elders also has an ancillary facility in relation to contingent funding, such as bank guarantees. As at 30 September 2022, $10.1 million had been issued (2021: $6.7 million).
Assets pledged as security
Secured loans are secured by various fixed and floating charges over all the assets of Elders' (either directly or indirectly). Trade receivables and other working capital funding is secured over the underlying debtors. This facility expires in December 2023.
Fair value
The carrying value of interest bearing liabilities approximates fair value.
Accounting Policy
All loans and borrowings are initially recognised at the fair value of the consideration received less directly attributable transaction costs. After initial recognition, interest-bearing loans and borrowings are subsequently measured at amortised cost using the effective interest rate method.
Borrowings are classified as current liabilities unless Elders has an unconditional right to defer settlement of the liability for at least 12 months after the reporting date.
Borrowing costs directly attributable to the acquisition, construction or production of a qualifying asset (i.e. an asset that necessarily takes a substantial period of time to get ready for its intended use or sale) are capitalised as part of the cost of that asset. All other borrowing costs are expensed in the period they occur. Borrowing costs consist of interest and other costs that an entity incurs in connection with the borrowing of funds.
Elders 2022 Annual Report
106
NOTES TO THE CONSOLIDATED FINANCIAL STATEMENTS
For the year ended 30 September 2022
RISK MANAGEMENT– NOTE 16: FINANCIAL INSTRUMENTS
Elders’ principal financial instruments comprise cash, receivables, payables, interest bearing loans and borrowings, and derivatives.
Risk exposures and responses
Elders manages its exposure to key financial risks, including interest rate and currency risk in accordance with its financial risk management policy. The objective of the policy is to support the delivery of financial targets while protecting future financial security. The main risks arising from Elders’ financial instruments are interest rate risk, foreign currency risk, credit risk and liquidity risk. Elders uses different methods to measure and manage different types of risks to which it is exposed. These include monitoring levels of exposure to interest rate and foreign exchange risk and assessments of market forecasts for interest rate and foreign exchange prices. Ageing analysis and monitoring of specific credit allowances are undertaken to manage credit risk. Liquidity risk is monitored through the development of future rolling cash flow forecasts.
The Board reviews and agrees policies for managing each of these risks as summarised below.
(a) Interest rate risk
Elders’ exposure to market interest rates relates primarily to short-term debt obligations. The level of debt is disclosed in note 15. At 30 September 2022 there was nil value of secured loans hedged under a floating to fixed arrangement (2021: nil), meaning at balance date, Elders had the following mix of financial assets and liabilities exposed to Australian variable interest rate risk:
2022 2021 $000 $000
Financial assets
Cash and cash equivalents 17,840 48,063
Financial liabilities
Interest bearing loans and liabilities (179,210) (154,265)
Net exposure (161,370) (106,202)
Elders constantly analyses its interest rate exposure so as to manage its cash flow volatility arising from interest rate changes. Within this analysis consideration is given to potential renewals of existing positions, alternative financing, alternative hedging positions and the mix of fixed and variable interest rates.
The following sensitivity analysis is based on the interest rate risk exposures in existence at the balance sheet date. At balance dates, if interest rates had moved as illustrated in the table below, with all other variables held constant, post tax profit and equity would have been affected as follows:
Post tax profit/equity
Higher/(lower)
+ 100 basis points (1,614) (1,062)
- 100 basis points 1,614 1,062
Elders Limited Annual Financial Report
107
NOTES TO THE CONSOLIDATED FINANCIAL STATEMENTS
For the year ended 30 September 2022
RISK MANAGEMENT– NOTE 16: FINANCIAL INSTRUMENTS
(b) Liquidity risk
Liquidity risk arises from Elders’ financial liabilities and the subsequent ability to meet our obligations to repay financial liabilities as and when they fall due. Elders’ objective is to maintain a balance between continuity of funding and flexibility through the use of committed available lines of credit. Elders manages its liquidity risk by monitoring the total cash inflows and outflows expected on a daily basis. Elders has established comprehensive risk reporting covering its business units that reflect expectations of management of the expected settlement of financial assets and liabilities. Elders has not identified or experienced additional liquidity risk as a result of COVID-19. As at 30 September 2022, Elders has $290.0 million of undrawn facilities (2021: $293.0 million).
(i) Non derivative financial assets and liabilities
The following liquidity risk disclosures reflect all contractually fixed pay-offs, repayments and interest resulting from the recognised financial liabilities and financial guarantees as of 30 September 2022. For the other obligations the respective undiscounted cash flows for the respective upcoming fiscal years are presented. The timing of cash flows for liabilities is based on the contractual terms of the underlying contract. However, where the counterparty has a choice of when the amount is paid, the liability is allocated to the earliest period in which Elders can be required to pay. When committed to make amounts available in instalments, each instalment is allocated to the earliest period in which Elders is required to pay. For financial guarantee contracts, the maximum amount of the guarantee is allocated to the earliest period in which the guarantee can be called. The risk implied from the values shown in the table below, reflects a balanced view of cash inflows and outflows of non-derivative financial instruments.
Carrying amount Contractual cash flows 6 months or less 6-12 months > 1 years
$000 $000 $000 $000 $000
2022
Non derivative financial assets:
Trade and other receivables 826,538 826,538 826,538 826,538 826,538 826,538
Non derivative financial liabilities: Interest bearing loans and borrowings (179,210) (179,210) (179,210) Lease liabilities (123,543) (126,281) (15,280) (15,280) (95,721) Trade and other payables (752,433) (752,433) (734,081) (2,312) (16,040) (1,055,187) (1,057,925) (928,571) (17,592) (111,761) Net inflow/(outflow) (228,649) (231,387) (102,033) (17,592) (111,761)
2021
Non derivative financial assets: Trade and other receivables 744,026 744,026 744,026 744,026 744,026 744,026
Non derivative financial liabilities: Interest bearing loans and borrowings (154,265) (154,265) (154,265) Lease liabilities (110,677) (116,506) (19,178) (19,178) (78,150) Trade and other payables (667,498) (667,498) (640,612) (7,682) (19,204) (932,440) (944,978) (820,764) (26,860) (97,354) Net inflow/(outflow) (188,414) (200,952) (76,738) (26,860) (97,354)
Elders 2022 Annual Report
108
NOTES TO THE CONSOLIDATED FINANCIAL STATEMENTS
For the year ended 30 September 2022
RISK MANAGEMENT– NOTE 16: FINANCIAL INSTRUMENTS
(ii) Derivative financial instruments
Due to the unique characteristics and inherent risks of derivative instruments, Elders separately monitors liquidity risk arising from transacting in derivative instruments. Net settled derivatives comprise interest rate hedges. Net settled derivatives held by Elders at balance date were nil (2021: nil).
(c) Credit risk
Credit risk arises from Elders’ financial assets, which comprise cash and cash equivalents, trade and other receivables, and derivative instruments. Elders’ exposures to credit risk arise from potential default of the counterparty, with the maximum exposure equal to the carrying amount of the financial assets. The ageing of trade and other receivables at balance date is reported at note 5. The credit risk associated with cash and derivatives is located primarily in Australia.
Trade receivables are reviewed in accordance with the simplified approach to measuring expected credit losses which uses a lifetime expected loss allowance. To measure expected losses, trade receivables have been grouped on days past due. Expected credit losses are based on the payment profile of sales over a period of 5 years and the historical default experience within this period. The historical loss rates are adjusted to reflect current and forward-looking information on macroeconomic factors affecting the ability of the customers to settle the receivables.
Elders minimises concentrations of credit risk by undertaking transactions with a large number of debtors in various locations. The credit risk amounts do not take into account the value of any collateral or security. The creditworthiness of counterparties is regularly monitored and subject to defined credit policies, procedures, limits and insurance positions. The amounts disclosed do not reflect expected losses and are shown gross of provisions. The maximum exposure to credit risk at the reporting date was:
2022 2021 $000 $000
Cash and cash equivalents 17,840 48,063 Trade and other receivables 819,505 734,769 837,345 782,832
Location of credit risk Australia 833,679 785,604 Asia 3,447 6,210 Other 219 275 Total 837,345 792,089
Elders Limited Annual Financial Report
109
NOTES TO THE CONSOLIDATED FINANCIAL STATEMENTS
For the year ended 30 September 2022
RISK MANAGEMENT– NOTE 16: FINANCIAL INSTRUMENTS
(d) Foreign currency risk
Elders is exposed to movements in the exchange rates of a number of currencies. These are primarily generated from the following activities:
• purchase and sale contracts written in foreign currency
• receivables and payables denominated in foreign currencies
• commodity cash prices that are partially determined by movements in exchange rates
Foreign exchange risk is managed within Board approved limits using forward foreign exchange and foreign currency contracts. Where possible, exposures are netted off against each other to minimise the cost of hedging. Hedge accounting is applied effective 1 October 2020. Elders uses cash flow financial instruments to offset foreign currency exposures on purchases of AgChem products from international suppliers, denominated in US Dollars. The cash flow financial instruments are not speculative investments. As at 30 September 2022, Elders held designated cash flow hedges with a notional value of $103.8 million with a fair value asset of $5.3 million (2021: $3.3 million fair value asset). The maturity dates for designated cash flow hedges ranges from October 2022 to February 2023.
As at 30 September 2022, Elders had the following AUD exposures to foreign currencies that were not designated in cash flow financial instruments: 2022 2021 $000 $000
Financial assets
Cash and cash equivalents – CNY 1,873 1,864
Cash and cash equivalents – IDR 464 669
Cash and cash equivalents – other 223 275
Receivables – CNY 471 3,378
Receivables – IDR 639 299 3,670 6,485
Financial liabilities
Payables – CNY (2,527) (941) Payables – IDR (240) (240)
Interest bearing loans and borrowings – CNY (4,265) (2,767) (5,446)
Net exposure 903 1,039
Given the foreign currency balances included in the statement of financial position at balance date, if the Australian dollar at that date strengthened by 10% with all other variables held constant, then the impact on post tax profit/(loss) arising on the balance sheet exposure would be as follows:
Post tax profit
Higher/(lower)
CNY 18 (4)
IDR (86) (73)
Other (22) (28)
A 10% weakening of the Australian dollar against the above currencies would have had the equal but opposite effect on the above currencies to the amounts shown above, on the basis that all other variables are held constant.
Elders 2022 Annual Report
110
NOTES TO THE CONSOLIDATED FINANCIAL STATEMENTS
For the year ended 30 September 2022
RISK MANAGEMENT– NOTE 16: FINANCIAL INSTRUMENTS
Accounting Policy
Elders uses forward currency contracts to hedge risks associated with foreign currency rate fluctuations. Such derivative financial instruments are initially recognised at fair value on the date on which a derivative contract is entered into and are subsequently remeasured to fair value. Derivatives are carried as financial assets when their fair value is positive and as financial liabilities when their fair value is negative. Derivative assets and liabilities are classified as non current in the statement of financial position when the remaining maturity is more than 12 months, or current when the remaining maturity is less than 12 months.
The fair values of forward currency contracts are calculated by reference to current forward exchange rates for contracts with similar maturity profiles. Any gains or losses arising from changes in fair value of derivatives are taken directly to profit and loss.
Elders applies the hedge accounting principles contained within AASB 9 Financial Instruments. For all effective cash flow hedges entered into, Elders recognises the movements in fair value of the derivative financial instruments in equity and only recognises the cumulative difference in the statement of comprehensive income when the hedged item is recognised. Amounts accumulated in equity are included within the initial cost of the asset where the hedged item subsequently results in the recognition of a non-financial asset such as inventory. Any ineffective portion of a cash flow hedge is recognised immediately in the profit and loss. Hedge effectiveness is determined at the inception of the hedge relationship, and prospectively assessed to ensure economic relationships remain between the hedging instrument and hedged item.
Elders documents the economic relationship between hedging instruments and hedged items, including whether changes in the cash flows of the hedging instruments are expected to offset changes in the cash flows of hedged items. Elders also documents its risk management objective and strategy for undertaking its hedge transactions.
(e)
Financial assets and liabilities measured at fair value
Elders use various methods in estimating the fair value of a financial instrument. The methods comprise:
• Level 1 – the fair value is calculated using quoted prices in active markets
• Level 2 – the fair value is estimated using inputs other than quoted prices included in level 1 that are observable for the asset or liability, either directly (as prices) or indirectly (derived from prices)
• Level 3 – the fair value is estimated using inputs for the asset or liability that are not based on observable market data
All forward exchange derivative contracts were measured at fair value using the level 2 method. Fair value of derivative instruments approximates the carrying value. The fair values of forward currency contracts are calculated by reference to current forward exchange rates for contracts with similar maturity profiles.
The fair value of financial instruments as well as the method used to estimate the fair values are summarised in the table below:
2022 2021
Quoted market price (Level 1)
Financial assets and liabilities
Valuation technique – market observable inputs (Level 2)
Valuation technique –non market observable inputs (Level 3)
Quoted market price (Level 1)
Valuation technique – market observable inputs (Level 2)
Valuation technique –non market observable inputs (Level 3)
$000 $000 $000 $000 $000 $000
Foreign currency derivatives 5,264 3,292
Elders Limited Annual Financial Report
111
NOTES TO THE CONSOLIDATED FINANCIAL STATEMENTS
For the year ended 30 September 2022
EQUITY– NOTE 17: CONTRIBUTED EQUITY
Issued and paid up capital
2022 2021 $000 $000
156,476,574 ordinary shares (September 2021: 156,476,574) 1,646,630 1,651,006
The movement in the dollar balance of share capital is a result of:
• $9.6 million of treasury shares purchased
• ($3.4) million of dividends where the shareholders have participated in the dividend reinvestment plan
• ($1.8) million of shares transferred from treasury upon vesting of performance rights in accordance with Elders’ Long-Term Incentive Plan
Elders considers both capital and net debt as relevant components of funding, and hence, part of its capital management. When managing capital and net debt, management’s objective is to ensure the entity continues as a going concern as well as to maintain optimal returns to shareholders and benefits for other stakeholders. Management also aims to maintain a capital structure that ensures the lowest cost of capital available to the entity.
Treasury Shares
Treasury shares are shares in Elders Limited that are held for the purpose of allocating shares under the Elders Executive Long-Term Incentive (LTI) and Short-Term incentive (STI) plans (see note 26 for further information).
Shares issued are recognised on a first-in-first-out basis. There were no treasury shares acquired in FY21.
Opening balance 1 October 2021
Number of Shares $000
Acquisition of shares (average price $13.96 per share) 686,315 9,584
Allocation of deferred shares under executive performance schemes (414,554) (5,789)
Allocation of dividend reinvestment plan shares (271,761) (3,795)
Balance 30 September 2022
Accounting Policy
Ordinary shares are classified as equity. Incremental costs directly attributable to the issue of new shares or options are included in equity as a deduction, net of tax, from the proceeds.
Elders 2022 Annual Report
112
NOTES TO THE CONSOLIDATED FINANCIAL STATEMENTS
For the year ended 30 September 2022
EQUITY
EQUITY – NOTE 18: RESERVES
Reconciliation of carrying amounts at beginning and end of period: Business combination reserve
2022
Employee equity benefits reserve
Hedge reserve Foreign currency translation reserve
Total $000 $000 $000 $000 $000
Carrying amount at beginning of period (27,495) 4,819 932 (5,143) (26,887)
Exchange differences on translation of foreign operations (84) (84)
Fair value movement in cash flow hedge 6,757 6,757
Reclassified to inventory (7,265) (7,265)
Less deferred tax impact 152 152
Cost of share based payments 3,570 3,570
Transfer to issued capital (1,713) (1,713)
Revaluation of put option (2,235) (2,235)
Carrying amount at end of period (29,730) 6,676 576 (5,227) (27,705)
2021
Carrying amount at beginning of period (27,495) 5,311 (5,486) (27,670)
Exchange differences on translation of foreign operations 343 343
Fair value movement in cash flow hedge 3,292 3,292
Reclassified to inventory (1,960) (1,960)
Less deferred tax impact (400) (400)
Cost of share based payments 2,433 2,433
Transfer to issued capital (2,925) (2,925)
Carrying amount at end of period (27,495) 4,819 932 (5,143) (26,887)
Elders Limited Annual Financial Report
113
NOTES TO THE CONSOLIDATED FINANCIAL STATEMENTS
For the year ended 30 September 2022
EQUITY– NOTE 18: RESERVES
Nature and purpose of reserves
(i)
Business combination reserve
This reserve is used to record the differences between the carrying value of non-controlling interests and the consideration paid/received, where there has been a transaction involving non-controlling interests that do not result in a loss of control.
Under agreements entered into with a number of non-controlling interests, the non-controlling shareholders have put options over their interests. These options are exercisable in accordance with the terms of each agreement. The potential liability for Elders under the put options is based on expectations of the exercise price and timing, discounted to present value using Elders’ incremental borrowing rate. The recognition of the put options is reflected in the business combination reserve and as a financial liability within current liabilities.
(ii) Employee equity benefits reserve
This reserve is used to record the value of equity benefits provided to employees, including key management personnel as part of their remuneration.
(iii) Hedge reserve
The hedge reserve is used to record the effective portion of gains or losses on derivative financial instruments. Amounts are subsequently included within the initial cost of the asset where the hedged item subsequently results in the recognition of a non-financial asset such as inventory or profit and loss as appropriate.
(iv) Foreign currency translation reserve
The foreign currency translation reserve is used to record exchange differences arising from the translation of the financial statements of foreign subsidiaries, including exchange differences arising from loans which are deemed to be net investments in a foreign operation.
Accounting Policy
The results of subsidiaries incorporated in countries other than Australia, are translated into Australian Dollars (presentation currency) as at the date of each transaction. Assets and liabilities are translated at exchange rates prevailing at reporting date. Exchange variations resulting from the translation are recognised in the foreign currency translation reserve in equity.
On consolidation, exchange differences arising from the translation of net investments in overseas subsidiaries are taken to the foreign currency translation reserve. If such a subsidiary was disposed of, the proportionate share of exchange differences would be transferred out of equity and recognised in profit or loss.
EQUITY – NOTE 19: DIVIDENDS
On 17 December 2021, Elders paid a partially franked (20%) final dividend of 22 cents per share. This distribution totalled $33.9 million (December 2020: $20.3 million). The cash outflow was $32.5 million (December 2020: $19.2 million), with the difference reinvested by shareholders under dividend reinvestment plan.
On 17 June 2022, Elders paid a partially franked (30%) interim dividend of 28 cents per share. This distribution totalled $43.2 million (June 2021: $30.7 million). The cash flow was $41.2 million (June 2021: $29.3 million), with the difference reinvested by shareholders under dividend reinvestment plan.
2022 2021 $000 $000
Subsidiary equity dividends on ordinary shares: Dividends paid to non-controlling interests during the year 4,453 2,165
Franking credits available to the parent for subsequent financial years based on tax rate of 30% (2021: 30%) 11,007 10,700
Elders 2022 Annual Report
114
NOTES
TO THE CONSOLIDATED FINANCIAL STATEMENTS
For the year ended 30 September 2022
GROUP STRUCTURE– NOTE 20: INVESTMENTS IN CONTROLLED ENTITIES
(a) Schedule of controlled entities
Country of Incorporation
% Held by Group 2022 2021
Ace Ohlsson Pty Limited Australia (a) 100 100
Agsure Pty Ltd Australia (a) 100 100
AI Asia Pacific Operations Holding Limited Hong Kong SAR (c) 100 100
Air International Asia Pacific Operations Pty Ltd Australia (d) 100 100
AIRR Apparent Pty Ltd Australia (a) 100 100
AIRR Belmark Pty Ltd Australia (a) 100 100
AIRR Holdings Limited Australia (a) 100 100
AIRR iO Pty Ltd Australia (a) 100 100
APO Administration Limited Hong Kong SAR 100 100
APT Projects Pty Ltd Australia (d) 100 100
Aqa Oysters Pty Ltd (in liq) Australia (d) (f) 77 77
Ashwick (Vic) No 102 Pty Ltd Australia (d) 100 100
Australian Independent Rural Retailers Pty Ltd Australia (a) 100 100
B & W Rural Pty Ltd Australia 76 76
BWK Holdings Pty Ltd (in liq) Australia (d) (f) 100 100
Chemseed Australia Pty Ltd Australia (d) 100 100
Eastern Rural Pty Ltd Australia (d) 100 100
Elders Automotive Group Pty Ltd Australia (d) 100 100
Elders Burnett Moore WA Pty Ltd Australia (d) 100 100
Elders China Trading Company China 100 100
Elders Communications Pty Ltd (in liq) Australia (d) (f) 100 100
Elders Finance Pty Ltd Australia (a) 100 100
Elders Fine Foods (Shanghai) Company China 100 100
Elders Fine Foods Vietnam Company Limited Vietnam (e) 100
Elders Forestry Finance Pty Ltd Australia (d) 100 100
Elders Forestry Management Pty Ltd Australia (d) 100 100
Elders Forestry Pty Ltd Australia (d) 100 100
Elders Global Wool Holdings Pty Ltd (in liq) Australia (d) (f) 100 100
Elders Home Loans Pty Ltd Australia (d) 100 100
Elders Management Services Pty Ltd Australia (d) 100 100
Elders PT Indonesia Indonesia 100 100
Elders Real Estate (Tasmania) Pty Ltd Australia (d) 100 100
Elders Real Estate (WA) Pty Ltd Australia (d) 100 100
Elders Rural Services Australia Limited Australia 100 100
Elders Rural Services Limited Australia (a) 100 100
Elders Telecommunications Infrastructure Pty Ltd (in liq) Australia (d) (f) 100 100
Family Hospitals Pty Ltd Australia (d) 100 100
ITC Timberlands Pty Ltd Australia (d) 100 100
JS Brooksbank & Co Australasia Ltd New Zealand (e) 100
JSB New Zealand Limited New Zealand (e) 100
Keratin Holdings Pty Ltd Australia (d) 100 100
Killara Feedlot Pty Ltd Australia (a) 100 100
Manor Hill Pty Ltd Australia (d) 100 100
New Ashwick Pty Ltd (in liq) Australia (d) (f) 100 100
Northern Rural Supplies Pty Ltd Australia (d) 100 100
Prels Pty Ltd Australia (d) 100 100
Prestige Property Holdings Pty Ltd Australia (d) 100 100
Elders Limited Annual Financial Report
115
NOTES TO THE CONSOLIDATED FINANCIAL STATEMENTS
For the year ended 30 September 2022
GROUP STRUCTURE– NOTE 20: INVESTMENTS IN CONTROLLED ENTITIES
Country of Incorporation
% Held by Group 2022 2021
Primac Exports Pty Ltd Australia (d) 100 100
Primac Pty Ltd Australia (d) 100 100
Redray Enterprises Pty Ltd Australia (d) 100 100
Robian Holdings Pty Ltd Australia (b) (d) 100
SDEA Nominees Pty Ltd Australia (a) 100 100
Sunfam Pty Ltd Australia (d) 100 100
The Hunter River Company Pty Ltd Australia (a) 100 100
Titan Ag Pty Ltd Australia (a) 100 100
Ultrasound Australia Pty Ltd Australia (a) 100 100
Victorian Producers Co-operative Company Pty Ltd Australia (d) 100 100
YP Agricultural Services Pty Ltd (Formerly Elders Victorian Feedlot Pty Ltd) Australia (d) 100 100
• The parties that comprise the Closed Group are denoted by (a)
• Entities acquired or registered during the period are denoted by (b)
• Entities exempted from audit requirements due to overseas legislation or non-corporate status are denoted by (c)
• Entities classified by the Corporations Act as small proprietary companies relieved from audit requirements are denoted by (d)
• Entities denoted by (e) were disposed of, deregistered or liquidated during the year
• Entities denoted by (f) entered members voluntary liquidation during the year
Accounting Policy
The results of subsidiaries incorporated in countries other than Australia, are translated into Australian Dollars (presentation currency) as at the date of each transaction. Assets and liabilities are translated at exchange rates prevailing at reporting date. Exchange variations resulting from the translation are recognised in the foreign currency translation reserve in equity.
Elders 2022 Annual Report
116
NOTES TO THE CONSOLIDATED FINANCIAL STATEMENTS
For the year ended 30 September 2022
GROUP STRUCTURE– NOTE 20: INVESTMENTS IN CONTROLLED ENTITIES
(b) Deed of Cross Guarantee
Pursuant to ASIC Corporations (Wholly-owned Companies) Instrument 2016/785 dated 29 September 2016, relief has been granted to these controlled entities of Elders Limited from the Corporations Act 2001 requirements for preparation, audit and lodgement of financial reports and Directors’ reports. As a condition of the Class Order, Elders Limited, and the controlled entities subject to the Class Order, entered into a Deed of Cross Guarantee (Deed). The effect of the Deed is that Elders Limited has guaranteed to pay any deficiency in the event of the winding up of any member of the Closed Group, and each member of the Closed Group has given a guarantee to pay any deficiency, in the event that Elders Limited or any other member of the Closed Group is wound up.
Certain members of the Closed Group, in addition to certain controlled entities, are guarantors in connection with the consolidated entity’s borrowings facilities disclosed at note 15. A consolidated statement of comprehensive income and consolidated statement of financial position, comprising Elders Limited and the controlled entities which are a party to the Deed, after elimination of all transactions between parties to the Deed, for the year ended 30 September 2022 is set out as follows. The prior period has been adjusted to ensure comparability:
2022 2021 $000 $000
Statement of comprehensive income of the Closed Group
Sales revenue 1,425,122 848,747
Cost of sales (1,202,050) (725,678)
Gross profit 223,072 123,069
Other revenue 197,476 75,000
Distribution expenses (52,970) (48,795)
Administrative expenses (14,831) (11,417)
Other items of income/(expense)
Finance costs (1,865) (2,658)
Profit/(loss) before income tax benefit/(expense) 350,882 135,199
Income tax benefit/(expense) (59,459) (6,592)
Profit/(loss) after income tax benefit/(expense) 291,423 128,607
Elders Limited Annual Financial Report
117
NOTES TO THE CONSOLIDATED FINANCIAL STATEMENTS
For the year ended 30 September 2022
GROUP STRUCTURE– NOTE 20: INVESTMENTS IN CONTROLLED ENTITIES
Consolidated statement of financial position of the Closed Group
Current assets
2022 2021 $000 $000
Cash and cash equivalents 26,154 6,867
Trade and other receivables 332,259 216,623 Livestock 73,721 55,556 Inventory 135,845 174,447
Total current assets 567,980 453,493
Non current assets
Other financial assets 274,179 274,179
Property, plant and equipment 20,721 18,361
Right-of-use assets 21,326 13,625 Intangibles 161,338 136,584
Deferred tax assets 49,703 108,854
Total non current assets 527,267 551,603 Total assets 1,095,247 1,005,096
Current liabilities
Trade and other payables 591,952 678,204 Lease liabilities 6,712 4,097
Current tax payable
Provisions 8,990 6,334
Total current liabilities 607,654 688,635 Non current liabilities
Lease liabilities 13,424 7,935
Total non current liabilities 13,424 7,935 Total liabilities 621,078 696,570 Net assets 474,169 308,526
Equity
Contributed equity 1,646,630 1,651,006 Reserves 6,163 4,819
Retained earnings (1,178,625) (1,347,299) Total equity 474,169 308,526
Elders 2022 Annual Report
118
NOTES TO
THE CONSOLIDATED FINANCIAL STATEMENTS
For the year ended 30 September 2022
GROUP STRUCTURE– NOTE 21: PARENT ENTITY
Information relating to the parent entity of the Group, Elders Limited:
Results:
2022 2021 $000 $000
Net profit for the period after income tax expense 151,869 54,647
Total comprehensive income 151,869 54,647
Financial position:
Current assets 209,215 79,431
Non current assets 228,880 288,335
Total assets 438,095 367,766
Current liabilities 1,684 1,958
Non current liabilities
Total liabilities 1,684 1,958
Net assets 436,411 365,808
Issued capital 1,646,630 1,651,006
Retained earnings (1,189,821) (1,341,690)
Profit reserve (26,561) 51,673
Employee equity reserve 6,163 4,819
Total equity 436,411 365,808
The prior period has been adjusted to ensure comparability.
Guarantees
As disclosed in note 20, the parent entity has entered into a Deed of Cross Guarantee with certain controlled entities. The effect of this Deed is that Elders Limited and each of these controlled entities has guaranteed to pay any deficiency of any of the companies party to the Deed in the event of any of those companies being wound up.
The parent entity is a party to various guarantees and indemnities pursuant to bank facilities extended to the Group as disclosed in note 24
Elders Limited Annual Financial Report
119
NOTES TO THE CONSOLIDATED FINANCIAL STATEMENTS
For the year ended 30 September 2022
GROUP STRUCTURE– NOTE 22: BUSINESS COMBINATIONS – CHANGES IN THE COMPOSITION OF THE ENTITY
(a) Acquisitions
(i) Current period acquisitions
During the current period, Elders acquired a number of small to medium retail and real estate businesses for a total consideration of $39.2 million, including $10.4 million of deferred consideration. These transactions resulted in the recognition of $23.2 million of goodwill.
(ii) Prior period acquisitions
In the prior period, Elders acquired a number of small to medium retail and agency businesses for a total consideration of $49.0 million, including $28.6 million of deferred consideration. These transactions resulted in the recognition of $27.9 million of goodwill.
2022 2021 $000 $000
Purchase consideration
Cash paid 28,849 20,352
Deferred consideration 10,383 28,645
Total purchase consideration 39,232 48,997
The total assets and liabilities recognised as a result of acquisitions are:
Cash and cash equivalents 206 8,324
Trade and other receivables 3,805
Inventory 11,671 10,882
Property, plant and equipment 1,451 2,879
Rent roll 4,014 865
Brand name 753 1,078
Trade and other payables (800) (5,381)
Provisions (616) (1,465)
Deferred tax assets/(liabilities) (627) 116
Net identifiable assets acquired 16,051 21,103
Goodwill on acquisition 23,181 27,894 39,232 48,997
Payments for acquisitions through business combinations, net of cash acquired
The cash outflow for payments for acquisitions through business combinations, net of cash acquired of $54.0 million (2021: $28.0 million) represents cash paid, net of cash acquired in respect of businesses acquired during the period of $28.6 million (2021: $12.0) and payments of deferred consideration relating to acquisitions from prior periods of $23.7 million (2021: $16.0 million).
At 30 September 2022, Elders has $31.3 million (2021: $36.8 million) of deferred consideration amounts related to acquisitions which are included in current and non current other creditors and accruals in note 8
(b) Disposals
There were no disposals during the current or prior period other than for equity accounted investments (refer to note 12).
Elders 2022 Annual Report
120
NOTES TO THE CONSOLIDATED FINANCIAL STATEMENTS
For the year ended 30 September 2022
GROUP STRUCTURE– NOTE 22: BUSINESS COMBINATIONS – CHANGES IN THE COMPOSITION OF THE ENTITY
Accounting Policy
Business combinations are accounted for using the acquisition method. The cost of an acquisition is measured as the aggregate of the consideration transferred, measured at acquisition date fair value and the amount of any non-controlling interest in the acquiree. For each business combination, Elders elects whether it measures the non-controlling interest in the acquiree either at fair value or at the proportionate share of the acquiree’s identifiable net assets. Acquisition costs incurred are expensed and included in administrative expenses.
When Elders acquires a business, it assesses the financial assets and liabilities assumed for appropriate classification and designation in accordance with the contractual terms, economic circumstances and pertinent conditions as at the acquisition date.
If the business combination is achieved in stages, the previously held equity interest is remeasured at its acquisition date fair value and any resulting gain or loss is recognised in profit or loss.
Any contingent consideration to be transferred by the acquirer will be recognised at fair value at the acquisition date. Subsequent changes to the fair value of the contingent consideration which is deemed to be an asset or liability will be recognised in accordance with AASB 9 either in profit or loss or as a charge to other comprehensive income. If the contingent consideration is classified as equity, it shall not be remeasured until it is finally settled within equity. In instances where the contingent consideration does not fall within the scope of AASB 9, it is measured in accordance with the appropriate AASB standard.
OTHER NOTES – NOTE 23: EXPENDITURE COMMITMENTS
(a) Operating lease commitments – Elders as a lessee
As a result of the application of AASB 16, Elders' expenditure commitments relating to leases have been recognised as lease liabilities with an associated right-of-use asset and are presented in note 10 , except for low value leases. Elders' operating lease commitments for low value leases are presented below.
2022 2021 $000 $000
Operating lease commitments:
● Within one year 1,221 1,316
● After one year but not later than five years 1,464 1,372
After more than five years
Total minimum lease payments 2,685 2,688
(b) Capital commitments
Significant capital expenditure contracted for at the end of the reporting period but not recognised as liabilities is as follows:
Capital expenditure commitments:
2022 2021 $000 $000
● Within one year 27,217
● After one year but not later than five years After more than five years
Total minimum payments 27,217
Elders Limited Annual Financial Report
121
NOTES TO THE CONSOLIDATED FINANCIAL STATEMENTS
For the year ended 30 September 2022
OTHER NOTES– NOTE 24: CONTINGENT LIABILITIES
There are potential legal matters that occur in the ordinary course of business that are being considered by Elders’ legal advisors. Based on the current information available, the following applies:
Unquantifiable contingent liabilities
• Elders has contingent obligations in respect of real property let or sub-let by subsidiaries of Elders.
• Elders has contingent obligations in respect of real property sub-let to the purchaser of Elders’ former Sandalwood estate.
• Elders has contingent obligations in respect of an agency agreement which carries a minimum fulfilment clause. This agreement expires December 2022.
• Benefits are payable under service agreements with employees of Elders under certain circumstances such as achievement of prescribed performance hurdles, occurrence of certain events or termination of employment for reasons other than serious misconduct.
• Subsidiaries of Elders have, from time to time in the ordinary course, provided parent company guarantees in respect of certain contractual obligations of their subsidiaries. The contingent exposure under those guarantees on a consolidated basis is no greater than the exposure of the subsidiary having the principal contractual obligation.
• Subsidiaries of Elders have from time to time provided warranties and indemnities in connection with the disposal of assets. The Directors are not aware at the present time of any material exposures under the warranties of indemnities.
• Various legal claims for damages resulting from the use of products or services of Elders, and from the contracts entered into or alleged to have been entered into by Elders, are in existence for which no provision has been raised as it is not currently probable that these claims will succeed or it is not practical to estimate the potential effect of these claims. The Directors are of the view that none of these claims based on the net exposure is likely to be material.
Other guarantees
As disclosed in note 20, the parent entity has entered into a Deed of Cross Guarantee with certain controlled entities. The effect of this Deed is that Elders Limited and each of these controlled entities has guaranteed to pay any deficiency of any of the companies party to the Deed in the event of any of those companies being wound up.
The parent entity and certain subsidiaries of Elders are parties to various guarantees and indemnities pursuant to bank facilities extended to Elders.
OTHER NOTES – NOTE 25: RELATED PARTY DISCLOSURES
The ultimate controlling entity of the Group is Elders Limited.
From time to time, Directors of Elders, or third parties of which a Director of Elders is also a Director, engage in transactions with Elders or entities in which Elders has an investment. These transactions are immaterial and generally in the nature of the acquisition of goods or services from Elders or an entity in which Elders has an investment or the supply of services to Elders or an entity in which Elders has an investment. Such transactions are on arm’s length commercial terms and procedures are in place to manage any actual or potential conflicts of interest.
As part of sharing office space with branches within the Branch Network segment, Elders incurred costs on behalf of Elders Insurance (Underwriting Agency) Pty Ltd and recharged these at arm’s length.
During the year, Elders sold its 30% equity stake in StockCo holdings. In the prior period Elders received a net repayment of $5.0 million on its advance to StockCo Holdings Pty Ltd. As at balance date, Elders has no receivable from StockCo Holdings Pty Ltd (2021: $15.1 million) and recognised interest revenue of $1.5 million (2021: $2.6 million) during the period. Elders also received trail and exclusivity fees of $1.1 million (2021: $1.5 million).
During the year, the Managing Director of AIRR Holdings Limited ceased employment at Elders. During the year, Elders assumed property lease contracts and made lease payments (comprising principal and interest) totalling $3.2 million (2021: $2.8 million) to related entities of the former Managing Director of AIRR Holdings Limited. As at balance date, there is no related party relationship, such transactions were on arm’s length commercial terms and procedures are in place to manage any actual or potential conflicts of interest.
Elders 2022 Annual Report
122
NOTES TO THE CONSOLIDATED FINANCIAL
For the year ended 30 September 2022
STATEMENTS
OTHER NOTES– NOTE 26: SHARE BASED PAYMENT PLANS
Long-Term Incentive Performance Rights
Performance rights were granted to eligible executives with a three year performance period and split into tranches, each carrying a different performance condition. Upon vesting of performance rights one fully paid share in Elders will be allocated for each performance right.
Set out below are a summary of rights granted under the plans:
Grant Date Vesting date Balance at start of period
Granted Vested Lapsed Balance at end of period
MD & CEO Grant
13-Dec-18 Nov-21 146,000 146,000
Senior Executive Grant 15-Feb-19 Nov-21 243,750 243,750
MD & CEO Grant 12-Dec-19 Nov-22 166,000 166,000
Senior Executive Grant 21-Feb-20 Nov-22 321,916 321,916
MD & CEO Grant 17-Dec-20 Nov-23 101,000 101,000
Senior Executive Grant 12-Mar-21 Nov-23 260,000 24,333 235,667
MD & CEO Grant 16-Dec-21 Nov-24 102,400 102,400
Senior Executive Grant 22-Dec-21 Nov-24 289,500 65,800 223,700
Total 1,238,666 391,900 389,750 90,133 1,150,683
During the period, long-term incentive performance rights expense of $3,059,225 (2021: $2,432,638) was recognised.
For long-term incentive performance rights vesting in November 2022, additional shares of 41,455 (November 2021: 42,518) will be allocated under the MD & CEO Grant and Senior Executive Grant at the time of vesting for the value of dividends paid but not received on the vested rights during the performance period.
Performance rights were granted to eligible executives with a three year performance period and split into tranches, each carrying a different performance condition. Upon vesting of performance rights one fully paid share in Elders will be allocated for each performance right.
The fair value at grant date of the long-term incentive performance rights issued during the year was:
MD & CEO Grant Senior Executive Grant $ $ 2022
Relative TSR against Comparator Companies Performance Rights 5.13 5.99 EPS Growth Performance Rights 10.44 11.15 2021
Relative TSR against Comparator Companies Performance Rights 4.30 6.51 EPS Growth Performance Rights 9.23 11.27
Key inputs in calculating the fair value of the long-term incentive performance rights issued during the year include:
• Share price at valuation date: $11.54 for the MD & CEO Grant (2021: $9.89) and $12.24 for the Senior Executive Grant (2021: $11.89)
• Risk free rate: 1.0% for the MD & CEO Grant (2021: 0.1%) and 0.8% for the Senior Executive Grant (2021: 0.1%)
• Volatility: 30% for the MD & CEO Grant (2021: 39%) and 30% for the Senior Executive Grant (2021: 38%)
• Dividend yield: 3.6% for the MD & CEO Grant (2021: 2.5%) and 3.4% for the Senior Executive Grant (2021: 2.1%)
The weighted average remaining life of the long-term incentive performance rights outstanding at the end of the financial year was 1.0 years. (2021: 1.1 years).
Performance rights associated with the 2019 Long-Term Incentive Plan vested during the period. As a result, a total of 389,750 shares were issued to relevant participants.
Short term incentive restricted shares
Restricted shares are issued to employees are part of the short term incentive plan. During the period, a total expense of $0.5 million was recognised in relation to this.
A total of 86,523 restricted shares were allocated to the plan participants and remain unvested at the end of the year.
The weighted average fair value at the grant date is $12.24 (2021: nil).
Elders Limited Annual Financial Report
123
NOTES TO THE CONSOLIDATED FINANCIAL STATEMENTS
For the year ended 30 September 2022
OTHER NOTES– NOTE 27: AUDITOR'S REMUNERATION
Amounts received or due and receivable by the auditor PricewaterhouseCoopers for:
2022 2021 $ $
● auditing or review of financial statements 788,300 699,000
● other non-audit services 10,695 11,500
● fee paid to subcontractors of the auditor 1,668
Total 798,995 712,168
OTHER NOTES – NOTE 28: KEY MANAGEMENT PERSONNEL
Remuneration of Directors and other Key Management Personnel
For information on the Remuneration Policy, Structure and the relationship between remuneration payment and performance please refer to the Remuneration Report
2022 2021 $ $
Short-term 2,503,069 3,367,145 Long-term (219,140) 534,358 Post employment 47,998 90,768
Termination benefits 301,053 970,013
Share based payments 1,011,571 907,070
Total 3,644,551 5,869,354
For details of Key Management Personnel, see section 6.2 of the Remuneration Report.
OTHER NOTES – NOTE 29: SUBSEQUENT EVENTS
There are no matters or circumstances that have arisen since 30 September 2022 which are not otherwise dealt with in this report or in the consolidated financial statements that have significantly affected or may significantly affect the operations of Elders, the results of those operations or the state of affairs of Elders in subsequent financial periods.
Elders 2022 Annual Report
124
DIRECTORS' DECLARATION
For the year ended 30 September 2022
In accordance with a resolution of the Directors of Elders Limited, the Directors declare:
1. In the opinion of the Directors: (a) the financial statements and notes of Elders Limited for the financial year ended 30 September 2022 are in accordance with the Corporations Act 2001, including: (i) Giving a true and fair view of its financial position as at 30 September 2022 and of its performance for the year ended on that date; and (ii) Complying with Australian Accounting Standards (including the Australian Accounting Interpretations) and the Corporations Regulations 2001 (b) the financial statements and notes also comply with International Financial Reporting Standards as disclosed in the basis of preparation (c) there are reasonable grounds to believe that the Company will be able to pay its debts as and when they become due and payable.
2. This declaration has been made after receiving the declarations required to be made to the Directors in accordance with section 295A of the Corporations Act 2001 for the year ended 30 September 2022.
3. In the opinion of the Directors, as at the date of this declaration, there are reasonable grounds to believe that the members of the Closed Group identified in note 20 will be able to meet any obligations or liabilities to which they are or may become subject, by virtue of the Deed of Cross Guarantee.
On behalf of the Board,
Ian Wilton Chair Mark C Allison Managing Director and CEO
Adelaide 14 November 2022
Elders Limited Annual Financial Report
125
Auditor’s Independence Declaration
As lead auditor for the audit of Elders Limited for the year ended 30 September 2022, I declare that to the best of my knowledge and belief, there have been:
(a)no contraventions of the auditor independence requirements of the Corporations Act 2001 in relation to the audit; and
(b)no contraventions of any applicable code of professional conduct in relation to the audit. This declaration is in respect of Elders Limited and the entities it controlled during the period.
M.T.
 Lojszczyk
Adelaide Partner PricewaterhouseCoopers 14 November 2022

PricewaterhouseCoopers, ABN 52 780 433 757
Level 11, 70 Franklin Street, ADELAIDE SA 5000, GPO Box 418, ADELAIDE SA 5001
T: +61 8 8218 7000, F: +61 8 8218 7999, www.pwc.com.au
Liability limited by a scheme approved under Professional Standards Legislation.
Elders 2022 Annual Report 126
Independent auditor’s report
To the members of Elders Limited
Report on the audit of the financial report
Ouropinion
In our opinion:
The accompanying financial report of Elders Limited (the Company) and itscontrolled entities (together the Group) is in accordance with the Corporations Act 2001, including:
(a) giving a true and fair view of theGroup'sfinancial position as at 30 September 2022 and of its financial performance for the year then ended
(b) complying with Australian Accounting Standardsand the Corporations Regulations 2001.
What we have audited
The Group financial reportcomprises:
● the consolidated statementof financial position as at 30 September 2022
● the consolidated statementof comprehensive income for the year then ended
● the consolidated statementof changesin equityfor the year then ended
● the consolidated statementof cash flowsfor the year then ended
● the notes to the consolidated financial statements,which include significant accounting policies and other explanatoryinformation
● the directors’ declaration.
Basis foropinion
We conducted our auditin accordance with Australian Auditing Standards. Our responsibilitiesunder those standardsare further described in the Auditor’s responsibilities for the audit of the financial report section of our report.
We believe that the audit evidence we have obtained issufficient and appropriate to provide a basis for our opinion.
Independence
We are independent ofthe Group in accordance with the auditor independence requirements ofthe Corporations Act 2001 and the ethical requirements ofthe Accounting Professional & Ethical StandardsBoard’sAPES 110 Code of Ethics for Professional Accountants (including Independence Standards) (the Code) thatare relevantto our auditof the financial report in Australia.We have also fulfilled our other ethical responsibilitiesin accordance withthe Code.
PricewaterhouseCoopers, ABN 52 780 433 757
Level 11, 70 Franklin Street, ADELAIDE SA 5000, GPO Box 418, ADELAIDE SA 5001
T: +61 8 8218 7000, F: +61 8 8218 7999
Liability limited bya scheme approved underProfessionalStandards Legislation.
Independent auditor’s report 127
Ouraudit approach
An audit is designed to provide reasonable assurance aboutwhether the financialreportis free from material misstatement. Misstatementsmayarise due to fraud or error. They are considered material if individuallyor in aggregate,theycould reasonablybe expected to influence the economicdecisions of users taken on the basisof the financial report.
We tailored the scope of our audit to ensure that we performed enough work to be able to givean opinion on the financial report as a whole, taking into accountthe geographic and management structure of the Group,itsaccounting processesand controlsand the industryin which it operates.
Materiality
● For the purposeofour audit,we used overall Group materiality of$11.8 million,whichrepresents approximately 5% ofthe Group’s profitbeforetax.
● We applied this threshold,together with qualitativeconsiderations,to determinethescopeofour audit and the nature, timing and extentofour auditprocedures and to evaluate theeffect of misstatements on the financial reportas awhole.
● We choseGroup profitbeforetax because, in our view, itis thebenchmark againstwhich theperformance of theGroup is mostcommonly measured.
● We utilised a 5% thresholdbased on our professional judgement,notingitis within therangeofcommonly acceptable thresholds.
Audit Scope
● Our auditfocused on wherethe Group made subjectivejudgements;for example,significantaccounting estimates involvingassumptionsand inherently uncertain futureevents.
● Our auditwork focused on theAustralian operations’financial information given their financial significance to theGroup.
We performed further audit procedures ata Group level,includingprocedures over theconsolidationofthe Group’s businesses and thepreparation ofthefinancial and remuneration reports.
Elders 2022 Annual Report 128
Key audit matters
Key audit mattersare those mattersthat, in our professionaljudgement, were of most significance in our audit of the financial report for the current period. The key auditmatterswere addressed in the contextof our auditof the financialreport asa whole,and in forming our opinion thereon, and we do not provide a separate opinion on these matters.Further,any commentaryon the outcomesof a particular auditprocedure ismade in that context. We communicated the key auditmattersto the Board Auditand RiskCommittee.
Key audit matter
Accounting for supplier rebates
(Refer to note 7)
Elders receiverebates on purchases ofretail goods for resale from suppliers.Theserebates are varied in nature and includepriceand volumerebates. In accordancewith Australian AccountingStandards, rebates should only berecognisedas a reduction in costofsales when theassociated performance conditions havebeen met. This requires a detailed understandingby theGroup ofthe various contractual arrangements.
We consideredtheaccountingfor supplier rebates to be a key auditmatter because:
● supplier rebates recognisedduring theyear are material to the financial statements;
● supplier arrangements arecomplex in nature and vary between suppliers;and
● judgementis involvedby theGroup to determinethe amount ofrebates that should be recognised in thecostofsales and the amount that should bedeferred to inventory
How our audit addressed the key audit matter
We performed thefollowingprocedures:
● for a sampleof rebates recognisedas a reduction to costofsales,we:
o agreed terms to supplier creditnotes or individual supplier agreements and recalculated the amountof therebate; and
o checked ifthe rebate amountwas only recognisedas a reduction in costof sales when a sale ofthe relevant producthad occurred.
● for a sampleof rebates receivable at balance date, we:
o agreed the Group’s calculation ofthe rebate receivableto the terms in the relevantsupplier agreement;and
o agreed the key components ofrebates receivable, includingrebateaccruals and amounts received over the course of theyear, to relevantunderlying evidence.
● to assess theaccuracy ofrebates being deferred in inventory as atbalance date we:
o obtained a listing ofretail stock on hand and for a sampleof items, traced the rebate percentageback to supplier agreements. We also recalculated the rebate amount deferred against inventory;and
o for a sampleof rebates receivable, checked thatwhen the related inventory was still on handatbalance date, the rebate amount had been appropriately deducted from inventory.
o
Independent auditor’s report 129
Key audit matter
Existence and valuation of Inventory (Refer to note 7)
At 30 September 2022, the Group held inventory balances of $484.4 million,as disclosedin Note7 Inventories.
Inventories arevalued at the lower of costand net realisablevalue (‘NRV’). Costs are assigned to individual items ofinventorypredominately on the basis of weighted averagecost.Net realisable value is the estimated selling pricein theordinary courseof business less theestimated costs necessary to make the sale.
We consideredthis akey auditmatter due the judgementrequired by the Group in estimating thenet realisablevalue and the provisionfor obsolescencein relation to theinventory.
In addition,thedistributionoftheGroup’s inventory across a largenumber of locations may resultin an increased risk in relationto existence.
How our audit addressed the key audit matter
We performed thefollowingprocedures amongstothers:
● developed an understandingoftheGroup’s process for the procurementand accounting for inventory.
● tested the operating effectivenessofselected controls onasamplebasis in relation to the inventory process.
● for a sampleof inventoryitems,we reperformed the calculation ofweighted averagecostusing the Group’s methodology.
● attended stocktakes at selected locationsand performed thefollowingprocedures,amongst others:
o observed theGroup’s processes and controls duringthestocktakes,
o selected a sample ofinventory items from the Group’s inventory records and compared thequantity recorded to the actual amount counted duringthestock takes.
● for a sampleof inventoryitems,traced the inventory quantity counted duringthestocktakes to the Group’s inventoryrecords.
● for a sampleof inventorypurchases and sales made between thestocktakedate and balance sheetdate, we checked theinventory movements to the relevantsupporting documentation.
● for a sampleof inventoryitems sold after theyear end,we compared thesellingpricenetofestimated selling coststo thecostofthe inventoryitems at the balance date.
● assessed thereasonableness ofthefinancial report disclosures againsttherequirements ofAustralian Accounting Standards.
Elders 2022 Annual Report 130
Otherinformation
The directorsare responsible for the other information. The other information comprisesthe information included in the annual report for the year ended 30 September 2022, but doesnotinclude the financial report and our auditor’sreport thereon.
Our opinion on the financial reportdoesnot cover the other information and accordinglywe do not express anyform of assurance conclusion thereon.
In connection with our auditof the financial report, our responsibilityis to read the other information and, in doing so, consider whether the other information ismateriallyinconsistentwith the financial report or our knowledge obtained in the audit, or otherwise appears to be materiallymisstated.
If, based on the workwe have performed on the other information thatwe obtained prior to the date of this auditor’sreport, we conclude thatthere is a material misstatement of thisother information,we are required to report thatfact.We have nothing to report in this regard.
Responsibilitiesof the directors forthe financial report
The directorsof the Company are responsible for the preparation of the financialreportthat givesa true and fair view in accordancewith Australian Accounting Standards and the Corporations Act 2001 and for such internal control as the directorsdetermine is necessaryto enable the preparation of the financial report thatgivesa true and fair view and is free frommaterialmisstatement, whether due to fraud or error.
In preparing the financial report,the directors are responsible for assessing the abilityof the Group to continue as a going concern, disclosing, asapplicable, matters related to going concern and using the going concern basisof accounting unless thedirectors either intend to liquidate the Group or to cease operations, or have no realisticalternative butto do so.
Auditor’s responsibilities forthe auditof the financial report
Our objectivesare to obtain reasonable assurance aboutwhether the financial reportas a whole is free frommaterial misstatement,whether dueto fraud or error,and to issue an auditor’sreportthat includes our opinion. Reasonable assurance isa high level of assurance, but isnot a guarantee that an audit conducted in accordance with theAustralian Auditing Standards willalwaysdetect a material misstatementwhen it exists.Misstatementscan arise fromfraud or error and are considered material if, individuallyor in the aggregate,theycould reasonablybe expected to influence the economic decisionsof userstaken onthe basisof the financial report.
A further description of our responsibilitiesfor the auditof the financialreportis located at theAuditing and Assurance StandardsBoard website at: https://www.auasb.gov.au/admin/file/content102/c3/ar1_2020.pdf. This description formspartof our auditor'sreport.
Independent auditor’s report 131
Ouropinion on the remuneration report
We have audited the remuneration report included in pages 51 to 69 of the directors’ reportfor the year ended 30 September 2022.

In our opinion,the remuneration reportof EldersLimited for the year ended 30 September 2022 complieswith section 300A of the Corporations Act 2001.
Responsibilities

The directorsof the Company are responsible for the preparation and presentation of the remuneration report in accordance with section 300A of the Corporations Act 2001. Our responsibility is to expressan opinion on the remuneration report,based on our auditconducted in accordance with Australian Auditing Standards.
T. Lojszczyk
Elders 2022 Annual Report 132
PricewaterhouseCoopers M.
Adelaide Partner 14 November 2022
This page has been intentionally left blank.
Independent auditor’s report 133
ASX
Additional Information
a) Distribution of Ordinary Shares as at 1 November 2022
Holdings Ranges
Total Units Percentage FPO Holders
1-1,000 4,085,521 2.610% 11,593 1,001-5,000 11,956,321 7.640% 5,097 5,001-10,000 6,109,987 3.900% 836 10,001-100,000 16,717,848 10.680% 684 100,001-9,999,999,999 117,606,897 75.160% 56
Totals 156,476,574 100.000% 18,266
The number of holders holding less than a marketable parcel 856
Distribution of Unquoted Equity Securities at 1 November 2022
As noted on page 47 of the Directors' Report, performance rights are the only unquoted equity securities on issue as at the date of this report.
Holdings Ranges
Total Units Percentage Unquoted Equity Securities Holders
1-1,000 0 0.000% 0 1,001-5,000 0 0.000% 0 5,001-10,000 25,833 2.250% 3 10,001-100,000 755,450 65.650% 17 100,001-9,999,999,999 369,400 32.100% 1
Totals 1,150,683 100.00% 21
All unvested performance rights on issue were acquired under an employee incentive plan
b) Voting Rights
All ordinary shares carry one vote per share without restriction. Unvested performance rights carry no voting rights.
c) Stock Exchange Quotation
Elders has one class of quoted securities, being the ordinary shares (ELD) which is listed on the Australia Securities Exchange. The Home Exchange is Sydney.
Elders 2022 Annual Report 134
d) Twenty Largest Shareholders as at 1 November 2022
The twenty largest holders of Elders Ordinary Shares were as follows:
No. of shares %
HSBC CUSTODY NOMINEES (AUSTRALIA) LIMITED 39,849,051 25.466%
CITICORP NOMINEES PTY LIMITED 24,591,302 15.716%
J P MORGAN NOMINEES AUSTRALIA PTY LIMITED 21,988,779 14.052%
NATIONAL NOMINEES LIMITED 10,581,904 6.763%
BNP PARIBAS NOMS PTY LTD <DRP> 5,771,758 3.689%
BNP PARIBAS NOMINEES PTY LTD <AGENCY LENDING DRP A/C> 1,969,217 1.258%
BNP PARIBAS NOMINEES PTY LTD HUB24 CUSTODIAL SERV LTD <DRP A/C> 1,378,606 0.881%
MR MARK CHARLES ALLISON 955,293 0.611%
HSBC CUSTODY NOMINEES (AUSTRALIA) LIMITED <NT-COMNWLTH SUPER CORP A/C> 869,223 0.555%
VENN MILNER SUPERANNUATION P/L 800,000 0.511%
BNP PARIBAS NOMINEES PTY LTD <IB AU NOMS RETAILCLIENT DRP> 643,411 0.411%
CITICORP NOMINEES PTY LIMITED <COLONIAL FIRST STATE INV A/C> 383,657 0.245%
PACIFIC AGRIFOODS INVESTMENTS PTY LTD 335,456 0.214%
SANDHURST TRUSTEES LTD <JMFG CONSOL A/C> 314,620 0.201%
MR KWOK CHING CHOW & MS PIK YUN PEGGY CHAN 310,000 0.198%
NETWEALTH INVESTMENTS LIMITED <WRAP SERVICES A/C> 300,323 0.192%
CERTANE CT PTY LTD <ELD DEF A/C> 289,134 0.185%
G HARVEY NOMINEES PTY LIMITED <HARVEY 1995 DISCRETION A/C> 278,000 0.178%
PJ & JL ROBERTS PTY LTD <THE PETER ROBERTS FAMILY > 271,020 0.173%
LEUTENEGGER INVESTMENTS PTY LTD <LEUTENEGGER S/F A/C> 261,081 0.167%
Total Securities of Top 20 Holdings 112,141,835 71.667%
The number of shares held by substantial shareholders in the Company, as disclosed in substantial holding notices given to the Company as at 1 November 2022.
Shareholder No. of shares
Percentage of shares held at date of notice
Date of notice
Vanguard Group 7,839,970 5.010% 19 October 2022
e) Corporate Governance Statement
Elders’ 2022 Corporate Governance Statement can be found online at investors.elderslimited.com/investor-centre/?page=annual-reports
ASX Additional Information 135
Shareholder Information
S are egistry
Boardroom Pty imited
evel 8,210 eorge Street, Sydney, NSW, 2000 1300737760


+61(0)292790664 enquiries boardroomlimited.com.au boardroomlimited.com.au
nquiries
Shareholders with enquiries about their shareholdings should contact the Company’s share registry, Boardroom, on the above contact details.
Online s are older in ormation
Shareholders can obtain information about theirholdings or view their account instructions online.
For identification and security purposes, you will need to know your Reference Number (HIN/SRN), Surname/Company Name and Post/ Country Code to access. his service is accessible via the Investor Centre on the Company’s website or direct via the Boardroom website at investorserve.com.au.

ax and dividend/ interest payments
lders is obliged to deduct tax from dividend/ interestpayments (which are not fully franked) to holders registered in Australia who have not quoted their ax File Number ( FN) to the Company. Shareholders who have not already quoted their FN can do so by contacting Boardroom.
C ange o address
Issuer Sponsored Shareholders who have changedtheir address should advise Boardroom in writing. Written notification can be emailed or posted to Boardroom at the address shown ad acent and must include both old and new addresses and the Securityholder Reference Number (SRN) of the holding.
Alternatively, holders can amend their details on-linevia Boardroom’s website. Shareholders who have broker sponsored holdings should contact their broker to update these details.

Annual eport mailing list

Shareholders who wish to vary their Annual Report mailing arrangements should advise Boardroom online or in writing.
lectronic versions of the report are available to all via the Company’s website. Annual Reports will be mailed to all shareholders who have elected to be placed on the mailing list for this document.
Investor in ormation
Information about the Company is available from a number of sources: ebsite: elders.com.au
Subscribe: Shareholders can nominate to receive company information electronically via the Investor Centre on the Company’s website.
Additionally, shareholders may elect to receive official company information through InvestorServe on Boardroom’s website.
Publications:
he Annual Report is the ma or printed source of company information. Other publications include the half-yearly report, Sustainability Report, Corporate overnance Statement, company press releases and investor presentations.
All publications can be obtained either through the Company’s website or by contacting the Company.
Elders Annual Report
Company Directory
Directors
Mr Ian Wilton — MSc, FCCA, FCPA, FAICD, CA
Mr Mark C Allison — BAgrSc, BEcon, GDM, AMP (HBS), FAICD
Ms Robyn Clubb AM — BEc, CA, F Fin, MAICD
Ms Diana Eilert — BSc (Syd), MCom (UNSW), GAICD
Mr Matthew Quinn — BSc, ACA
Ms Raelene Murphy — BBus, FCA, GAICD
Secretaries
Registered Office
Mr Peter G Hastings — BA, LLB, GDLP, FGIA, Grad Dip Applied Corporate Governance, GAICD
Ms Shannon Doecke — BAcc, Grad Dip Applied Corporate Governance, MAICD, AGIA
Level 10, 80 Grenfell Street, Adelaide, South Australia, 5000 P (08) 8425 4000 F (08) 7131 0118 CompanySecretary@elders.com.au elders.com.au
Share Registry
Boardroom Pty Limited, Level 8, 210 George Street, Sydney, NSW, 2000 P 1300 737 760 F +61 (0)2 9279 0664 boardroomlimited.com.au
Auditor PricewaterhouseCoopers
Bankers
Australia & New Zealand Banking Group
National Australia Bank Coöperative Centrale Raiffeisen - Boerenleenbank (Rabobank Australia)
Stock Exchange Listing
Elders Limited ordinary shares are listed on the Australian Securities Exchange under the ticker code “ELD”.
Company Directory 137
