
The Ultimate Guide to Candlestick Patterns
Reading the Language of the Market
What is a Candlestick?
Each candle tells a story of the battle between bulls (buyers) and bears (sellers) for a specific time period.
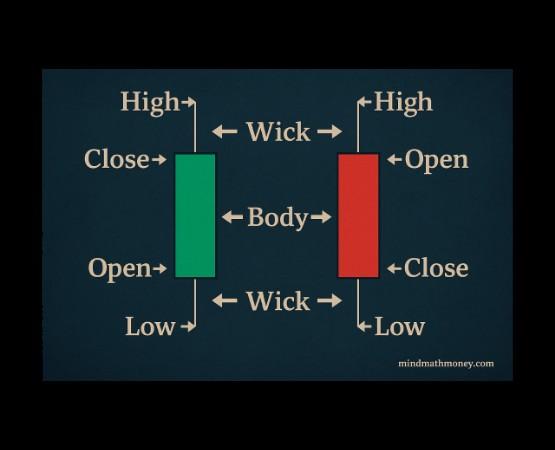
Anatomy of a Candlestick
Real Body: Shows the range between the open and close price.
Wicks (Shadows): Show the highest and lowest prices reached.
Bullish (Green): The close price was higher than the open price.
Bearish (Red): The close price was lower than the open price.

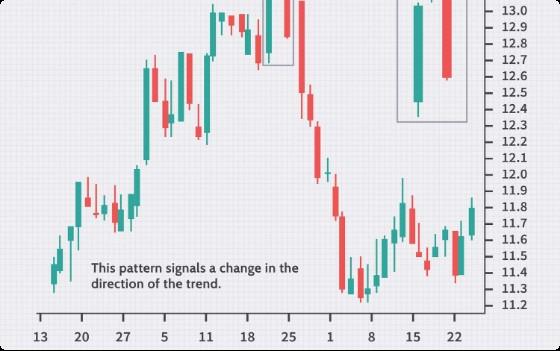
Patterns are formed by single or multiple candlesticks and often signal a reversal or continuation of a trend.
Key Single-Candle Signals (Indecision) Understanding the Signals


Doj i
A neutral pattern where the open and close are virtually equal. Signals indecision and a potential reversal.


Spinning Top
Similar to a Doji but with a small real body. Also signals market indecision and a potential change in direction.

Maruboz u
A full body with no wicks. A Bullish Marubozu is extremely strong; a Bearish one is extremely weak.
Single-Candle Reversal Signals

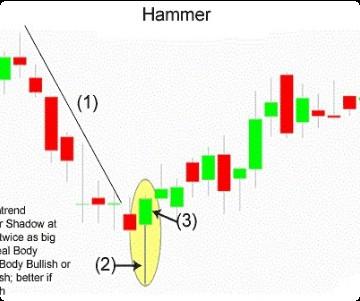
Hammer
Bullish Reversal. Long lower wick and small body at the top. Appears at the bottom of a downtrend.

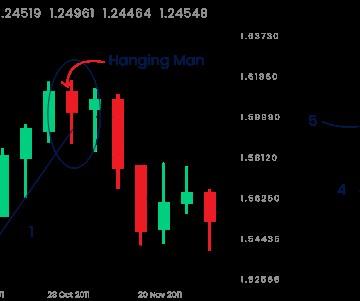
Hanging Man
Bearish Reversal. Same shape as a hammer, but appears at the top of an uptrend.
Shooting Star
Bearish Reversal. Long upper wick and small body at the bottom. Appears at the top of an uptrend.
Part 2: Dual-Candle Patterns
Dual-Candle: The Engulfing Patterns

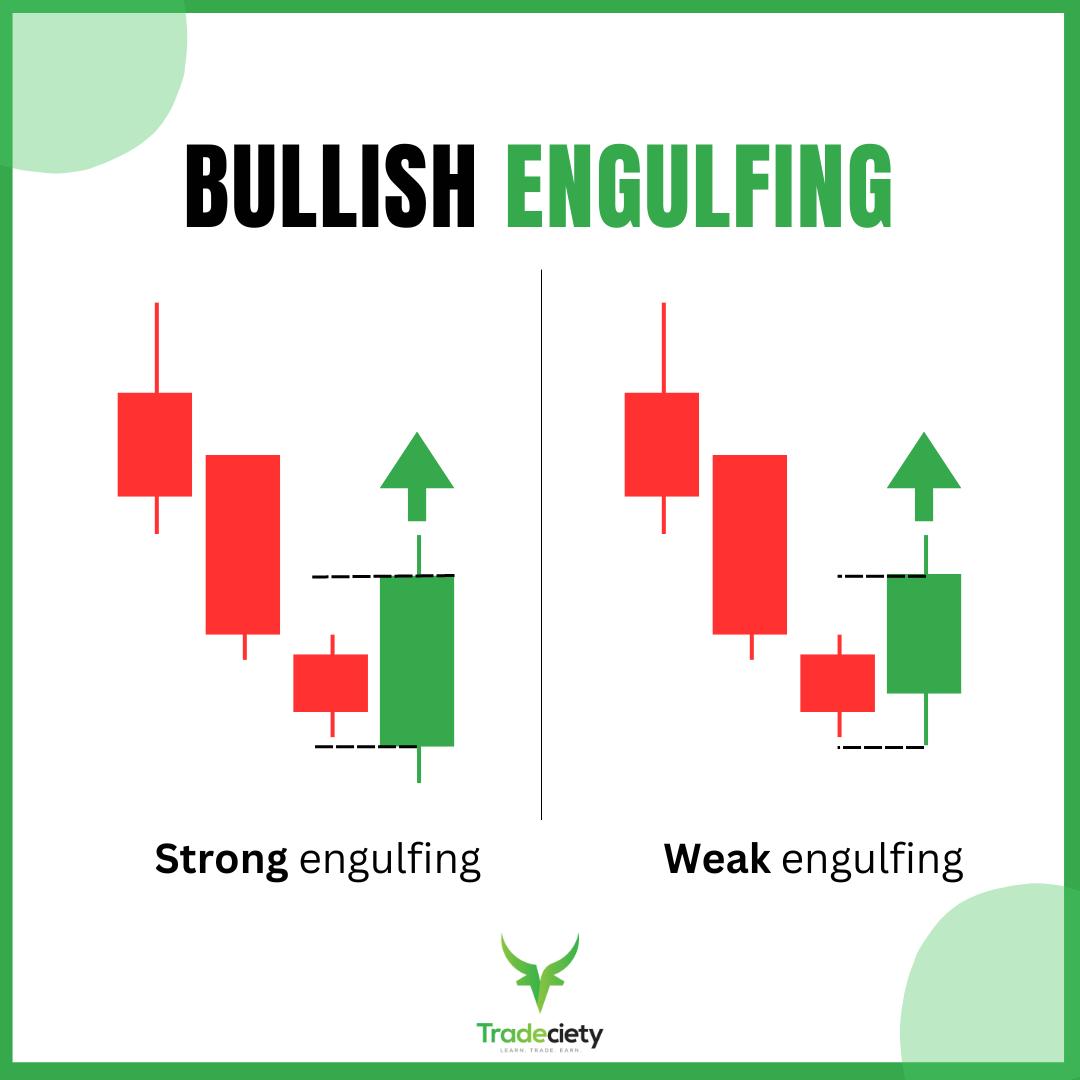

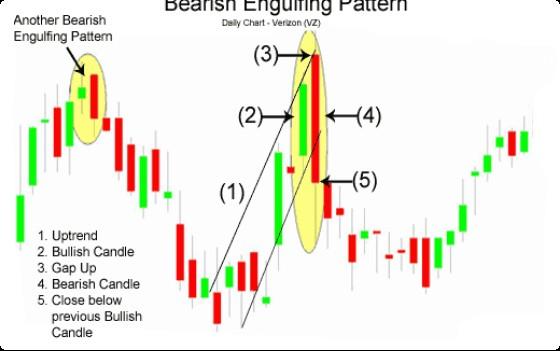
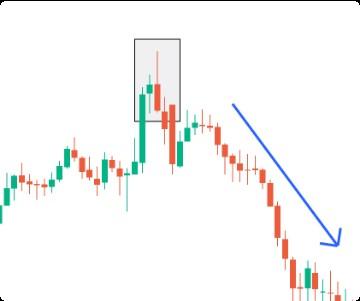
Bearish Engulfing
Strong Bearish Reversal. A large red body completely engulfs the prior small green body.
Dual-Candle: Key Reversals

Piercing Line
Bullish. A strong green candle closes above the 50% mark of the prior red candle. Signals a potential bottom.

Dark Cloud Cover
Bearish. A red candle opens above the prior green candle but closes below its 50% mark.

Tweezer Top/Bottom
Two candles with matching highs (Tweezer Top) or matching lows (Tweezer Bottom).
Part 3: Triple-Candle Patterns
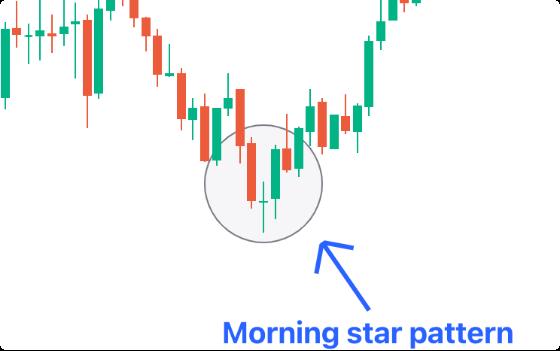
Morning Star
Bullish Reversal. A large red candle, followed by a small "star" (indecision), then a large green candle.
Evening Star
Bearish Reversal. A large green candle, followed by a "star", then a large red candle.
How to Trade with Candlesticks

Context is King: A pattern is only significant if it appears at a key support or resistance level, or at the end of a long trend.

Look for Confirmation: Never trade on a single pattern alone. Wait for the next candle to confirm the new direction.

Combine with Other Tools: Use candlesticks in conjunction with chart patterns, trendlines, and volume for the most reliable signals.
Download Your Free Trade Chart Patterns PDF
Thank you.