
The global perspective on prime property and investment Elliman.com/wealthreport 18th edition 2024
18th edition
Definitions and data
EDITOR
Liam Bailey
WRITTEN BY
Knight Frank Research
James Culley
Kate Everett-Allen
Patrick Gower
Antonia Haralambous
Flora Harley
Christine Li
Andrew Shirley
HNWI High-net-worth individual – someone with a net worth of US$1 million or more.
UHNWI: Ultra-high-net-worth individual – someone with a net worth of US$30 million or more.
PRIME PROPERTY: The most desirable and most expensive property in a given location, generally defined as the top 5% of each market by value. Prime markets often have a significant international bias in terms of buyer profile.
THE PIRI 100: Now in its 17th year, the Knight Frank Prime International Residential Index tracks movements in luxury prices across the world’s top residential markets. The index, compiled using data from our research teams around the world, covers major financial centres, gateway cities and second-home hotspots – both coastal and rural – as well as leading luxury ski resorts.

THE KNIGHT FRANK WEALTH SIZING MODEL: The model, created by our data engineering team, measures the size of HNWI, UHNWI and billionaire cohorts in more than 200 countries and territories.
MARKETING
Sally Ingram
PUBLIC RELATIONS
Astrid Recaldin
SUB-EDITING
Sunny Creative
DESIGN & DIRECTION
Quiddity Media
FRONT COVER
Court Three
PRINT Optichrome
ALL KNIGHT FRANK
CONTACTS:
firstname. familyname@ knightfrank.com
This year’s cover provides a stark illustration of a critical change in the private client investment story. The shift to higher interest rates in 2023 represented a massive break with the pattern of ever-lower debt costs that shaped the previous two decades. While rates are likely to be cut through 2024, they will remain substantially above their recent ultra-low levels. This, together with a global election boom, an ever more tangled geopolitical web and a perfect storm of disruption for real estate, means the old rulebook no longer applies. For investors, it’s time to turn to the Next Chapter.
Welcome
This year’s report confirms a strong affinity between private capital and real estate – and with lower interest rates and higher inventory on the horizon, we anticipate a significant increase in activity over the next 12 months
We are delighted to welcome you to The Wealth Report 2024, the 18th edition of this market-leading report. Last year’s report described the impact of rising rates on wealth portfolios, with the total wealth held by Ultra-High-Net-Worth Individuals (UHNWIs) falling by 10% in the face of energy, economic and geopolitical events. Despite these pressures, we emphasised our belief that investors should focus on the opportunities ahead.
Those who invested saw healthy returns. As we report, wealth creation is back – fueled by a shift in the outlook for interest rates and propelled by the robust performance of the US economy, alongside a sharp recovery in equity markets.
This year, we confirm a rise in the number of UHNWIs globally, led by growth here in the US and the Middle East, and continued demand from these investors for real estate, with around a fifth looking to purchase residential property this year and the same proportion looking at commercial opportunities.

ACCESSING OUR RESEARCH AND INSIGHTS


01. HOWARD M. LORBER EXECUTIVE CHAIRMAN
02. SCOTT DURKIN PRESIDENT AND CHIEF EXECUTIVE OFFICER
03. SUSAN DE FRANÇA PRESIDENT AND CEO, DE DEVELOPMENT MARKETING
As we note, this vote of confidence for real estate comes at a fortuitous time. Investment markets have been shaken by higher debt costs, with further structural disruption resulting from the need for greener, more sustainable stock, together with shifts in working, shopping and living patterns. Add in sizeable new requirements from emerging sectors such as life sciences, and the need for capital in the property sector has never been higher. The opportunities for well-financed investors are enormous.
As always, we consider the global mobility of wealth – where it is being created and where it is moving to. We take an in-depth look at luxury residential markets, gauge the shifting requirements being placed on global farmland, and assess the latest Environmental, Social and Governance (ESG) themes. Our objective remains to provide the most rounded picture of the impact of wealth on investment and the world’s major real estate markets.
We are committed to providing you with the right advice to help you take advantage of these opportunities. With a Knight Frank Private Office based in Douglas Elliman’s New York headquarters, supported by its London operations and offices in Dubai, Monaco, Singapore and now Hong Kong, our network is truly global. In other words, we are well positioned to help you achieve your goals.
Please do get in touch. The Douglas Elliman and Knight Frank network would love to be of assistance.
“
year, we confirm
THE WEALTH REPORT 1 THE WEALTH REPORT
Important notice © 2024. All rights reserved. This publication is produced for general outline information only, it is not definitive and it is not to be relied upon in any way. Although we believe that high standards have been used in the preparation of the information, analysis and views presented, no responsibility or liability whatsoever can be accepted by Knight Frank for any errors or loss or damage resultant from the use of or reference to the contents of this publication. We make no express or implied warranty or guarantee of the accuracy of any of the contents. This publication does not necessarily reflect the view of Knight Frank in any respect. Information may have been provided by others without verification. Readers should not take or omit to take any action as a result of information in this publication. In preparing this publication, Knight Frank does not imply or establish any client, advisory, financial or professional relationship, nor is Knight Frank or any other person providing advisory, financial or other services. In particular, Knight Frank LLP is not authorised by the Financial Conduct Authority to undertake regulated activities (other than limited insurance intermediation activity in connection with property management). No part of this publication shall be reproduced, stored in a retrieval system, or transmitted in any form or by any means, electronic, mechanical, photocopying, recording or otherwise, without prior written permission from Knight Frank for the same, including, in the case of reproduction, prior written approval of Knight Frank to the specific form and content within which it appears. Knight Frank LLP is a member of an international network of independent firms which may use the “Knight Frank” name and/or logos as all or part of their business names. No “Knight Frank” entity acts as agent for, or has any authority to represent, bind or obligate in any way, any other “Knight Frank” entity. This publication is compiled from information contributed by various sources including Knight Frank LLP, its direct UK subsidiaries and a network of separate and independent overseas entities or practices offering property services. Together these are generally known as “the Knight Frank global network”. Each entity or practice in the Knight Frank global network is a distinct and separate legal entity. Its ownership and management is distinct from that of any other entity or practice, whether operating under the name Knight Frank or otherwise. Where applicable, references to Knight Frank include the Knight Frank global network. Knight Frank LLP is a limited liability partnership registered in England with registered number OC305934, the registered office is 55 Baker Street, London W1U 8AN, where a list of members’ names may be inspected.
ATTITUDES SURVEY The 2024 instalment is based on responses provided during December 2023 by more than 600 private
intermediaries and
who
them manage
trillion of wealth for UHNWI clients.
Survey
Frank Research provides a range of market-leading insights through the year covering all major global real estate sectors and markets. To get the best of Knight Frank straight to your inbox, visit knightfrank.com/ResearchNewsletters
THE
bankers, wealth advisors,
family offices
between
over US$3
Attitudes
Knight
This
a rise in the number of UHNWIs globally, led by growth in the US and the Middle East, and continued demand from these investors for real estate”
01 02 03
The global perspective prime property and investment Elliman.com/wealthreport Your partners in property
The Wealth Report
’s unique data, expert insights, thought-provoking interviews and future views help shed light on the key issues affecting how you live, work, invest and give back
Our contributors

LIAM BAILEY
The Wealth Report's Editor outlines the big issues facing real estate investment (page 6), and looks at the impact of younger investors (page 14)

KATE EVERETT-ALLEN
Kate shares her insights into the leading 100 global luxury residential property markets on page 32

JAMES CULLEY
Knight Frank's head of data science leads our work measuring global wealth creation, as discussed on page 10

FLORA HARLEY
Our sustainability expert takes a deep dive into the evolving world of ESG (page 50)

ANTONIA HARALAMBOUS
Antonia distils the world's key commercial real estate investment themes into four pages (page 42)

CHRISTINE LI
Knight Frank’s Head of Asia-Pacific Research brings her perspective to the big issues facing the region on page 72
INTRODUCTION
04 Key findings
The Wealth Report Editor
Liam Bailey shares his top takeaways from our 2024 edition
HOME
32 PIRI 100
The results of our Prime International Residential Index
34 Seeking value?
What US$1 million buys in a range of city and second-home markets
INVEST
42 Navigating the recovery
The who, what and where of commercial real estate investment
46 Insider knowledge
Knight Frank’s expert team share their sectors to watch in 2024
50 Is ESG over?
Why ESG still matters – and how UHNWIs can make a difference

06 The world ahead
The five themes that will steer real estate investment this year
WEALTH
10 Many happy returns
Despite challenging conditions, global wealth is still on the rise
13 Join the club
We look at what it takes to be part of the 1%
14 The age of change
What the great wealth transfer could mean for investors


ANDREW SHIRLEY
Our rural research specialist assesses the outlook for farmland (page 58) and tracks the ups and downs of luxury assets (page 62)
PATRICK GOWER
Patrick takes the temperature of increasingly competitive moves to attract global wealth (page 18)

18 Game of thrones
Could a new crop of challenger cities upset the old world order?
35 Red tape tracker
Policy shifts are moving the goalposts for investors
36 The year ahead
The risks and opportunities facing investors in an uncertain world
38 The big five
From AI to wellness, what’s driving markets in 2024

39 Ones to watch
Our pick of the properties and places attracting wealthy buyers
53 Renewing real estate
How ESG can help build a more sustainable sector
56 Are you ready for AI?
Knowledge is power when it comes to reaping the benefits of AI
58 Green dirt
How the environmental agenda is shaping farmland markets
62 Gear change
The results of the Knight Frank Luxury Investment Index

68 Databank
The numbers behind The Wealth Report
72 Final word
The view from Asia-Pacific, the world’s newest wealth hub
THE WEALTH REPORT THE WEALTH REPORT 2 3
Key findings
Liam Bailey, Knight Frank’s Global Head of Research and Editor of The Wealth Report, distils the findings from this year’s edition
P6 THE NEXT CHAPTER
This year will see the long-awaited downward pivot in interest rates. While cuts are on the horizon, rates will remain above their recent ultra-low levels. This, together with increasingly complex geopolitics, tech and climate disruption means that for real estate investors, the old rulebook no longer applies. As we explore throughout this year’s report, it’s time to turn to the Next Chapter.
P10 WEALTH CREATION RETURNED
That shift in outlook for interest rates, the robust performance of the US economy and a sharp uptick in equity markets helped wealth creation globally. At the end of 2023 there were 4.2% more UHNWIs than a year earlier, with nearly 70 very wealthy investors minted every day, taking the global total to just over 626,600. Growth was led by North America (up 7.2%) and the Middle East (6.2%), with only Latin America seeing its number of wealthy individuals fall. While Europe lagged in terms of new wealth generation, the continent remains home to the wealthiest 1% (page 13).
P12 WEALTH PROSPECTS
Despite slower global growth this year, the revival of wealth creation looks set to remain with us. We confirm our expectation that the
number of wealthy individuals globally will rise by 28.1% during the five years to 2028. Our model points to strong outperformance from Asia, with high growth in India (50%) and the Chinese mainland (47%) in particular.
P14 GENERATIONAL SHIFTS IN WEALTH
With US$90 trillion of assets set to move between the generations in the US, and affluent millennials set to become the richest generation in history, we take a look at the implications for investment behaviour. Attitudes to wealth creation among female Gen Z-ers suggests the 38% rise in female UHNWIs over the past decade is set to keep building.
P18 CITIES SLUG IT OUT
With wealthy individuals better connected and more willing to move than ever before, emerging wealth hubs are responding by dishing out incentives to challenge the supremacy of established global gateways. We report on Paris’s attempts to lure financiers from the City of London, London's own shift to the left, Geneva’s search for something more than stability, how Milan and Miami are feeling the pressures of success, Hong Kong and Singapore’s respective plans to be the home of Asia’s new elite and, finally, how developers in New York and Los Angeles are betting on a branded future.
P32 RESIDENTIAL PRICES ON THE UP
Despite the sharpest ever uptick in global interest rates we confirm that, while sales volumes took a hit in 2023, capital values continued to grow by 3.1% across the world’s leading prime markets. Asian markets led the charge, followed by those in the Americas. Our analysis confirms where buyers will need to dig deepest (Monaco and Aspen) and which prime markets are offering value right now.
P36 THE FUTURE OF RESIDENTIAL
More than a fifth of global UHNWIs are planning a purchase in 2024. Helpfully, we provide our house price forecast for 25 of the most in-demand markets, led by Auckland (+10%) and Mumbai (+5.5%). While the pace of rental growth will slow this year, our prime rent forecast points to some notable outliers, with Sydney leading at 12%. We round up the big themes impacting global markets – with politics replacing inflation as the leading market risk – and outline how AI, wellness and climate concerns will shake up the luxury development sector.
P42 A SLOWER 2023 FOR COMMERCIAL...
It was a challenging 2023 for global commercial real estate (CRE), with investment volumes falling by 46% as investors grappled with elevated interest rates and higher debt costs. Despite a tougher environment, private investors remained the most active global buyers for the third consecutive year, taking a record 49% share of this US$698 billion market, with the living sectors, industrial and logistics, and offices their top picks.
P44 ...SETS THE SCENE FOR A RECOVERY
With almost a fifth of UHNWIs planning to invest in CRE this year, we examine where the money is likely to come from (Middle Eastern and Asian investors have the strongest appetite) and where it is likely to be directed, with the living sectors and healthcare leading. To aid investor decisionmaking, our sector outlook covers English vineyards, much needed lab space, secondary offices in the best locations, and those sectors benefiting from structural tailwinds including “beds, sheds, eds and meds”. Finally, with rates on their way down, we see debt returning to form part of investor strategies.
P50 SUSTAINABLE TRENDS IN FOCUS
With a 27% chance that 2024 will see the average rise in global temperatures surpass 1.5°C compared with the pre-industrial era, and with the richest 1% of the global population responsible for more emissions than the poorest 66%, it’s good to know that almost twothirds of UHNWIs are attempting to reduce their carbon footprint. We assess the key sustainability strategies being employed by the world’s wealthy as they assess CRE investment.
P56 AI IN REALITY
The AI investment wave carried the rebound in equities markets last year: is it about to do the same for real estate? We report how record investment in AI-driven tech will impact on demand for specific use types in very targeted locations. Beyond the direct requirements from the technology, we consider how AI is being harnessed to uncover market opportunities at scale, highlighting a project that saw AI identify previously overlooked land capable of accommodating more than 100,000 homes.
P58 FARMLAND
With farmland forming the biggest investable real estate sector, at least by size, comprising 5 billion hectares, or more than 40% of the globe’s landmass, investors are asking it to deliver ever more. While food production unsurprisingly leads investor objectives, latent environmental benefits are rising in importance, with US$30 billion earmarked by investment funds for climate-related outcomes. Our investigation reveals a sector grappling to place a value on radical new uses.
P62 LUXURY COLLECTIBLES ON PAUSE
Despite record-breaking individual sales in 2023, a surge in financial market returns contributed to a shift in allocations impacting on luxury asset value. The Knight Frank Luxury Investment Index fell 1% over the year, pulled down by falling values in rare whisky (-9%), classic cars (-6%), handbags (-4%) and furniture (-2%). While art (+11%), jewellery (+8%) and watches (+5%) helped offset some of these falls, our assessment reveals a need for an ever more discerning approach from investors, with significant volatility by sub-market.
THE WEALTH REPORT THE WEALTH REPORT 4 5
The world ahead
Liam Bailey explores the five big themes shaping real estate investing this year
“ With record funds totalling US$483 billion waiting to be invested, 2024 will mark the turning point for investment volumes”
1. Global growth will slow, but geopolitics will support critical sectors
2. Rates will fall, just not as much as investors hope
The global economy has defied recession fears with robust growth over the past 12 months, most notably in the US. Despite apparent stability in developed economies, growth will slow over the coming year. Global GDP will likely expand by around 2.9% in 2024, down from 3.1% a year earlier. The American economy’s unexpected resilience is partly down to increased consumer spending, fuelled by savings accumulated during the Covid-19 pandemic. Once these savings diminish, higher interest rates will constrain spending, dragging on growth. The world’s economic stability is also underpinned by substantial but unsustainable government spending, resulting in historically high levels of government debt. Higher debt costs mean a reckoning is coming for governments this year.
Relations between the US and China showed some signs of thawing following a November meeting between presidents Joe Biden and Xi Jinping, but their economic rivalry will continue to escalate, adding to a fractious outlook for geopolitics. The fragmentation in relations initiated during the Trump administration, and expanded under Biden’s leadership, will likely lead to increased investment in strategic sectors such as technology, energy and defence.
While the inflation surge is subsiding, the extent and pace of rate cuts remains uncertain. Investors are convinced that we’ll see a sustained fall in rates over the course of the year, but how low they will go remains subject to conflicting long-term trends.
Some factors will weigh on debt costs, notably the world’s ageing population. This demographic shift towards higher savings will lead banks to cut lending rates as they aim to align higher deposits with increased borrowing. That will be counterbalanced by the greening of the global economy and the ongoing decoupling of the West from China’s supply chains. Both transformations require huge public and private investment. In the long run, the global economy will acquire additional energy sources and increased productive capacity, but achieving these goals will exert significant upward pressure on the prices of raw materials, infrastructure and labour.
3. Liquidity will improve in 2024
4. AI investment will drive real estate requirements
Global property markets suffered value corrections in 2023. While most residential markets got off lightly, commercial markets felt the brunt of the downturn. New lending will be issued below the cost of debt that prevailed in late 2023, but still above the levels at which existing deals were struck. Even as central banks cut rates this year, it will still feel for many as though monetary policy is tightening.
This process, while painful for some, is the key to a real estate market recovery in 2024. Lower values, lower interest rates and some forced selling will allow for a much anticipated improvement in investment volumes. With more than US$2 trillion in loans set to mature through to 2027 in the US alone according to MSCI, opportunities for well-capitalised investors will appear with increasing regularity as the year progresses.
Real estate is hitting a perfect storm of disruption. Hybrid working, the green agenda, the retail reinvention and a critical under-supply of housing are big themes with a long way to run. Despite the repricing of property, the volume of apparently stranded assets will rise as use requirements shift, environmental policy requirements bite and refurbishment costs rise. But with record funds totalling more than US$483 billion (Preqin) waiting to be invested, 2024 will mark the turning point for investment volumes.
By 2025, approximately 40% of corporate IT expenditure is anticipated to be directed towards AI-related projects, with IDC projecting an astonishing annual investment of US$500 billion in AI products by 2027. This substantial investment will be felt acutely in the real estate sector, driving a surge in demand for specific property categories.
There will be a sizeable increase in demand for data centres, especially as proximity to cost-effective energy sources becomes increasingly critical. Expect a heightened need for specialised office spaces tailored to accommodate collaborative research and laboratory requirements. The rising demand for research facilities, pivotal to the development of AI-related hardware and software, will likely favour industrial real estate located near universities or established technology hubs.
Moreover, the integration of AI-driven building management systems will elevate service standards in energy efficiency, climate control and security. This enhancement will further distinguish top-tier office buildings from others in the market, enhancing their appeal to tenants and investors.
5. Climate change will impact property values, but also presents new prospects
There is a 27% chance that 2024 will see the average rise in global temperatures surpass 1.5°C compared with the pre-industrial era, according to the UK’s Met Office. The direct repercussions of this warming trend are already evident, influencing various aspects of the property market. The effects include altered crop yields in agricultural regions, shifts in tourism patterns, physical harm to buildings in vulnerable zones and disruptions in infrastructure.
In the short term, more properties are expected to face indirect consequences, such as rising insurance premiums and the possibility of expanding uninsurable areas. Data from MSCI in the US reveals a significant increase in insurance costs as a percentage of income receivable, more than doubling from 1.0% to 2.3% over five years to September 2023. Coupled with regulatory alterations, this signifies a notable rise in risks for investors who opt to disregard environmental factors in their investments this year.
Conversely, new opportunities are emerging. Demand is rising from both tenants and investors for properties situated in low-risk areas, as well as for energy-efficient buildings. As the toll of climate-related damage increases, there will be heightened demand for technology that assists property owners in preparing for, adapting to and recovering from climate-related hazards and subsequent damage.
THE WEALTH REPORT THE WEALTH REPORT 6 7
Wealth
Enter the new world of wealth as regional and generational shifts redraw the map
10 MANY HAPPY RETURNS
Following the gloom of 2022, an uptick in economic growth is boosting wealth creation
13 JOIN THE CLUB
We look at what it takes to enter the world of the 1%
14 THE AGE OF CHANGE
A generational shift is bringing about seismic changes in how wealth is put to use
18 GAME OF THRONES
With growing UHNWI mobility, a new crop of cities is rising up to challenge the old world order

8 WEALTH WEALTH
Peak performer – Asia is emerging as the world’s fastest growing wealth hub
Many happy returns
Against a challenging backdrop, the past 12 months saw an uptick in wealth creation, driven by the robust performance of the US economy, a recovery in equity markets and a shift in outlook for interest rates. Liam Bailey reports
Most major economies managed to steer clear of downturns in 2023. In fact, global GDP expanded by a healthy 3.1%.
Emerging economies and Asia led the recovery, with India a notable example. Europe struggled to gain traction, but the US was the standout developed economy with a strong performance supported by government stimulus.
Following a disastrous investment environment in 2022, marked by the breakdown of the 60/40 equity/bond model and a staggering US$10 trillion loss in UHNWI portfolios, 2023 saw a turnaround in returns.
The number of UHNWIs globally rose 4.2% to 626,619, from 601,300 a year earlier. That more than reverses the 2022 decline. At a regional level wealth creation was led by North America (7.2%) and the Middle East (6.2%), with Latin America the only region to see its population of wealthy individuals decline. In terms of key country performance, Turkey leads our rankings with a 10% expansion in UHNWI numbers, followed by the US at 8%.
The rise in wealth creation was supported by global economic growth and the improved fortunes of key investment sectors. In the first half of 2023, despite ongoing rate tightening
The Knight Frank Wealth Sizing Model
and rising bond yields, equities surged on the back of enthusiasm surrounding AI. Even as this trend waned in the second half of the year, declining inflation and the anticipation of earlier and more substantial rate cuts provided renewed momentum to equity markets. The S&P Global 100 delivered a 25.4% annual increase in 2023, albeit this was hugely flattered by the outstanding performance of the “magnificent seven” US tech stocks.
ON THE UPSIDE
Bond markets experienced improved performance in the final quarter of the year, as investors factored in likely rate cuts.
While some sectors grappled with the lingering impact of elevated debt costs, particularly commercial real estate and private equity, residential property values surprised on the upside.
Residential capital values grew by 3.1% across the world’s leading prime markets through 2023. For investors, residential returns were supported by prime global rents rising at an average three times their long-run trend.
Other sectors delivered positive returns during the year, with gold up 15% and Bitcoin up 155%, reversing a large part of the losses sustained by this volatile asset in 2022.
THE WEALTH REPORT THE WEALTH REPORT 10 11 WEALTH WEALTH
17,437 | 17,934 | 22,776 Australasia 17,689 | 18,790 | 24,102 Middle East 2,886 | 2,996 | 3,506 Africa 25.7% 28.3% 27.0% 17.0% 22.3% 7.2% 6.2% GLOBAL AVERAGE 601,300 | 626,619 | 802,891 28.1% 4.2% 3.8% 2.9% 1.8% 161,177 165,442 | 228,849 Asia 38.3% 2.6% % CHANGE 2023 VS 2022 % CHANGE 2028 VS 2023 UHNWI POPULATION (US$30M+): 2022 | 2023 | 2028
235,998 | 253,066 | 318,220 North America 13,654 | 13,159 | 15,556 Latin America 18.2% -3.6% 152,459 | 155,232 | 189,882 Europe
“ The pandemic disrupted the delivery of new homes, especially in the luxury segment in markets such as London. There is a real window of opportunity for developers over the short to medium term”
BRIGHT PROSPECTS
We expect the number of wealthy individuals globally to rise by 28.1% during the five years to 2028. While positive, our forecast points to a rate of expansion noticeably slower than the 44% increase experienced in the five-year period to 2023.
As we note on page 6, the global economy will likely be impacted by higher inflation in the medium term, leading to a lower growth outcome compared with the recent historic trend.
Our model points to strong outperformance from Asia, with high growth in India (50%), the Chinese mainland (47%), Malaysia (35%) and Indonesia (34%). With the mobility of
Expectations for wealth growth in 2024
wealth increasing all the time, a key question is whether future growth remains within these and other high-growth markets, or whether there is a leakage of talent to Europe, Australasia or North America. Outside Asia, strong growth is focused on the Middle East, Australasia and North America, with Europe lagging and Africa and Latin America likely to be the weakest regions.
CHALLENGES AND OPPORTUNITIES
Despite the slower rate of forecast growth in UHNWI populations over the coming five years, this expansion is still much faster than underlying population growth – likely to be around 5% over the same period.
This expanding cohort of wealthy individuals looks favourably on real estate. Almost a fifth of UHNWIs plan to invest in commercial real estate this year, while more than a fifth are planning to buy residential. Growth over the forecast period provides various opportunities for investors, particularly developers able to deliver property that suits the shifting tastes of the newly minted.
In the residential market, the Covid-19 pandemic disrupted the delivery of new homes, especially in
the luxury segment in markets such as London. There is a real window of opportunity for developers over the short to medium term.
While the challenges are different in commercial markets, there are arguably larger opportunities. The market disruption impacting offices in particular, but affecting other sectors as well, considered alongside the requirement for investment to “green” existing property assets, points to a need for very deep pools of equity to come into the sector. We note on page 42 the activity of private capital in real estate investment, which points to a readiness to engage with this challenge. With so much wealth due to be created in the coming years, there will be plenty of opportunities for those with the right skills and insights.
Join the club
The Wealth Report confirms what it takes to be part of the global 1%
The 1% club
Individual
Our Attitudes Survey results validate the broad takeaway from our Wealth Sizing Model – that wealth creation is set to be positive in the near term. Respondents from all world regions confirmed that on average their clients expected to see their wealth portfolios grow in 2024. The most confident region was the Middle East, with a strong showing from Asian and Australasian respondents. While still optimistic, African and European clients were the most modest in their expectations of the year ahead.
“Almost a fifth of UHNWIs plan to invest in commercial real estate this year, while more than a fifth are planning to buy residential”
How optimistic are you that your clients’ wealth will increase in 2024?
On a scale of 1 to 5, 5 being the maximum (for full results see Databank, page 68)
While the wealthy may be happy to reflect on their financial success, openly admitting to being part of the 1% may be a step too far for many. Our numbers reveal, though, that exclusive as it may sound, it’s actually easier to become a member of this particular club than it is to gain UHNWI status.
In all the markets we have assessed for this year’s report, the 1% threshold starts far below the US$30 million entry point for becoming a UHNWI. European hubs top the list, led by Monaco, where US$12.9 million is the threshold to join the 1% club. Following behind are Luxembourg at US$10.8 million and Switzerland at US$8.5 million. Perhaps surprisingly, bearing in mind its dominance in terms of overall wealth creation, the US comes in fourth, at US$5.8 million. Across the Asia-Pacific region, Singapore leads the pack with a requirement of US$5.2 million.
Our findings confirm the substantial differences in wealth distribution between countries, with smaller hubs demonstrating a bias towards higher thresholds. As Western countries in particular grapple with government deficits and the need to raise tax revenue, expect greater policy focus on where wealth is located, how it is distributed across economies and how governments can both tax it and encourage its growth: not an easy mix of outcomes to secure.
Chinese
Source:
THE WEALTH REPORT THE WEALTH REPORT 12 13 WEALTH WEALTH
US$12,883,000 US$10,832,000 US$8,509,000 US$5,813,000 US$5,227,000 US$4,761,000 US$4,673,000 US$4,574,000 US$4,321,000 US$3,430,000 US$3,273,000 US$3,094,000 US$3,070,000 US$2,548,000 US$2,468,000 US$1,971,000 US$1,074,000 Monaco Luxembourg Switzerland US Singapore Sweden Australia
Zealand Ireland Germany France Hong Kong SAR UK Italy Spain Japan
New
mainland
join the
selected
territories, Q4 2023
net wealth needed to
top 1% in
countries and
Knight Frank Research
Attitudes Survey North America 3.76 Latin America 3.75 Europe 3.69 Africa 3.53 Australasia 4.04 Asia 4.15 Middle East 4.41 Global average 3.86
Source:
The Wealth Report Attitudes Survey
The age of change
While the distribution of wealth may be shifting between world regions, an even bigger shift is happening between generations. Liam Bailey assesses the investment implications
1. THE GREAT WEALTH TRANSFER WILL SUPER-CHARGE EXISTING TRENDS
Over the next 20 years, a massive transfer of wealth and assets will occur as the silent generation and baby boomers hand over the reins to millennials. The shift will see US$90 trillion of assets move between generations in the US alone, making affluent millennials the richest generation in history. The transfer is happening amid seismic changes in how wealth is put to use. The difference in outlook between younger and older generations will result in a substantial reappraisal of marketing strategies for anyone wanting to sell products or services to this newly wealthy group.
2. WEALTH IS BECOMING MORE DIVERSE
It may be starting from a low base, but the trend is undeniable. Recent survey findings from Altrata suggest women make up around 11% of global UHNWIs. While still not a large share, this represents rapid growth from just 8% less than a decade ago. Given the attitudes of female Gen Z-ers we note
Going up?
% of respondents who expect their wealth to increase in 2024
“ Where 22% of UHWNIs are expected to invest in a home purchase this year, only 19% of HNWIs are expected to take the same route”
below, this looks likely to remain the direction of travel. Businesses looking to attract wealthy investors will need to adapt their strategies to ensure they are relevant to this new, broader market.
3. GEN Z ARE MOST CONFIDENT IN THEIR ABILITY TO CREATE WEALTH
As our Attitudes Survey reveals (see page 68), 71% of UHNWIs globally anticipate growth in their wealth this year. For HNWIs, our Next Gen Survey reveals a more conservative figure of 65% (see chart above). A clear pattern emerges when data is analysed by age: younger affluent groups are more confident about the economic outlook compared with older groups. Only 52% of HNWI boomers anticipate growing their wealth in the next 12 months, in contrast to 75% of Gen Z-ers, with 43% expecting “significant growth”.
Male HNWIs express greater confidence than women. This is particularly pronounced among male millennials, with 75% expecting their wealth to grow, compared with 64% of women. However, for Gen Z, these
Treading lightly
% of respondents who say they are trying to reduce their carbon footprint
75% all HNWIs
65% all UHNWIs
Homing instinct
% of respondents considering buying a home in 2024
expectations are entirely reversed, with a remarkable 81% of women in this group expecting growth. Half expect “significant growth”.
19% all HNWIs
22% all UHNWIs

THE NEXT GEN SURVEY
As part of our Attitudes Survey work this year, we conducted a survey of 600 global HNWIs (individuals with US$1 million+ in assets or US$200k+ annual income). Our focus was twofold: to examine the difference in attitudes between this mass affluent group and the UHNWIs covered by our main survey; and to understand the differences in views among HNWIs based on age and gender. Full results from this survey will be published in April. Sign up for The Wealth Report Newsletter to receive the full analysis.
4. ENVIRONMENTAL CONCERNS WILL INFLUENCE INVESTMENT DECISIONS
Climate change is an area where our results show clear generational differences in priorities. Looking at the top line question on carbon emissions from our main Attitudes Survey (see page 50), millennials appear to have got the message when it comes to cutting consumption – 80% of male and 79% of female respondents say they are trying to shrink their carbon footprints. Male boomers take a different view with just 59% trying to reduce their impact, well below their female peers (67%). Recent work undertaken by The Future Laboratory confirms
a shift in attitudes around wealth, with younger groups looking at the opportunity it provides to act as a force for change.
5. PROPERTY REMAINS KEY FOR ALL WEALTHY GROUPS
Where 22% of UHNWIs are expected to invest in a home purchase this year, only 19% of HNWIs are expected to take the same route. Boomers appear most reticent (8% and 7% for females and males respectively) while millennials are most active, with scores approaching UHNWI levels (23% for females, 21% for males).
When it comes to commercial property, 19% of UHNWIs are considering investing this year. Given
the larger financial commitment required, it is probably unsurprising that a much smaller percentage of HNWIs are considering a similar move: only 7% overall, with male millennials the most committed (9%) and male boomers the least (3%).
“80% of male and 79% of female millennial respondents say they are trying to shrink their carbon footprints”
THE WEALTH REPORT THE WEALTH REPORT 14 15 WEALTH WEALTH
Source: Knight Frank Next Gen Survey All female 76% Boomer 67% Gen X 75% Millennial 79% Millennial 80% Gen Z 72% All male 74% Boomer 59% Gen X 68% Gen Z 75%
:
Gen Survey
Knight Frank
Survey All Boomer Gen X Millennial Gen Z Male UHNWIs Male UHNWIs 7% 17% 9% 21% 20% Female UHNWIs Female UHNWIs 8% 21% 20% 23% 20%
Source
Knight Frank Next
Source
Next Gen
GLOBAL HNWIS BOOMER GEN X MILLENNIAL GEN Z ALL 65% 52% 56% 69% 75% FEMALE 63% 50% 56% 64% 81% MALE 68% 53% 56% 75% 69%
The Wealth Report asks two experts for their perspective on the shift in generational wealth
MIKE PICKETT Director, Cazenove Capital
How is the financial sector preparing for the coming generational wealth transfer?
The wealth management industry is probably one of the last sectors to be disrupted in terms of how we think about the next generation. We’re talking about a cohort that is seeking a wealth manager who is on their wavelength, if indeed they want to deal with a human at all. Younger clients have new views and ambitions and I think the opportunity for businesses, if they get this right, are enormous. Technology – including providing digital services, and being open to new fields such as AI and blockchain technology – is a big part of it. Impact is important, too.
Why is this change so big?
Next gen wealth owners share some key characteristics – from their expectations and mindset to their desires and what they are willing to pay for – which vary markedly from those of previous generations. Add to that the enormous sums due to be transferred between generations over the next couple of decades. But it goes beyond a simple shift of existing wealth. I think the diversity
of opportunity to create wealth has also grown – for example, there are YouTubers worth tens of millions. First generation wealth creation is on the rise, as is the array of entrepreneurial routes to create it. There is also evidence that the youth of today blame the generations before them for the challenges that they and the planet face today. All of this has implications for how wealth management is approached in the future.
How are these changes expressed in investment strategies?
The transition to the next generation will impact not just how we deliver investment services, but also the kinds of investments we make.
Sustainability and impact investing are clear examples. The growth seen in both areas hasn’t been driven solely by younger investors – but there is growing awareness that investment portfolios can actually have a positive impact on people and the planet and many younger clients want us to help them achieve this.
the costs associated with investment strategies – and on running their businesses as efficiently as possible.
We talk about values-driven investment for the next generation –is that fair?
Without a doubt there is a hunger from younger wealthy clients to “do the right thing”. Gen Z in particular are looking for ways to invest in alignment with their values. It’s not just about financial returns, it’s about building cultural capital. That encompasses brand and identity, as well as a sense of community that allows for collaboration, purpose-led investing, enriching experiences and more. Appealing as stewards of both financial and cultural capital will be crucial to engaging the next gen audience in the future.
That said, I think there is a need for pragmatism. Not to say that a sustainable investment strategy won’t deliver financial returns over the long term; but the path from A to B may differ from a more traditional investment strategy. Overall, though, there is a sense of the next generation wanting to be involved and engaged in the process of how their wealth is managed – for a firm to invest their money with them instead of for them.
Does property feature in younger clients’ investment plans?
 BEN WHATTAM Co-founder, Modern Affluence Exchange
How big a change does the great wealth transfer represent?
“ There is also evidence that the youth of today blame the generations before them for the challenges that they and the planet face today. All of this has implications for how wealth management is approached in the future”
Private markets are another area of focus. Over the past two decades, we’ve seen some incredible businesses enjoy huge success while remaining privately held –think Facebook, Uber or Airbnb. The next generation has come of age seeing private markets as an incredibly exciting opportunity. As the infrastructure continues to mature, these kinds of investments are becoming more accessible to a wider range of investors, and on more attractive terms.
That brings me to my final point: transparency and cost. One of the great benefits of technology is that it makes price comparison so much easier. This in turn means managers are becoming even more focused on
I don’t think younger generations see residential property as a route to wealth creation in the same way as boomers or Gen X. In particular, the low interest rate environment and impressive growth in house prices of the past 15 years is unlikely to be repeated in the next 15. I also think there is some evidence that Gen Z may be happier to rent property or lease assets such as cars, and to adopt subscription-led lifestyles.
In any overall wealth strategy, diversification is important. Ensuring you have sufficient assets to meet your needs in each bucket – “liquidity” (e.g. cash reserves), “lifestyle” (liquid investment portfolio) and “legacy/ illiquid” (property or private markets) – can be a good way to think about it. How wealth or property firms deliver these “lifestyle” and “legacy” offerings will, in my view, be key to creating and maintaining active and long-standing connections with the next generation of wealthy individuals.
It’s a seismic change. We’re witnessing the historic convergence of two powerful forces: immense amounts of private capital, and growing social and environmental consciousness. There is a huge dichotomy at play: 71% of the world lives in a country where inequality is growing, while record numbers of next gen family members recognise they have a responsibility to counter inequality with impact investing or fighting climate change.
“Anyone looking at engaging the rising generation of wealth will need to think hard about how they remain relevant for this audience”
“Since World War Two, Western economies have been driven by an overt focus on economic prosperity. This has come at the expense of environmental prosperity and has arguably imposed social costs”
This shift in attitudes will be amplified as we transition from an era driven by newly made wealth to one increasingly influenced by inherited wealth. The next generation, holding major investment power, is likely to direct significant amounts of capital to causes beyond solely maximising economic growth. Their consumer spending will also be guided by a different set of values and perspectives.
Why does this transfer matter?
Since World War Two, Western economies have been driven by an overt focus on economic prosperity. This has come at the expense of environmental prosperity and has arguably imposed social costs.
The next generation is poised to inherit huge sums, and all the research we have commissioned confirms that they value societal and environmental wellbeing alongside economic gain and are unlikely to continue the relentless pursuit of growth at all costs. If you’re selling services to the wealthy and your primary message and underlying proposition is based on economic prosperity, it’s unlikely to resonate in isolation. Anyone looking at engaging
the rising generation of wealth will need to think hard about how they remain relevant for this audience.
Are differences in attitudes between generations that significant?
Our conclusion after running the Modern Affluence programme for five years is a very confident “yes”.
Bloomberg opened our 2023 summit with a unique piece of research confirming significant differences in attitudes to wealth across generations. Take the fact that 66% of millennials focus on investing with purpose, compared with 49% for Gen X. Climate change is the number one concern for Gen Z and whether they’re rich or just affluent, they see it as their generational responsibility to fix what has been broken by their elders. This issue is fundamentally changing consumer behaviours, particularly for those with wealth.
How should a real estate business position itself to capitalise on these trends?
Demonstrating meaningful awareness and willingness to change are the two corporate behaviours that any business in any sector will need. The willingness of Gen Z and millennials to associate with brands that can show they are aware of the impact their business has on the world, and meaningfully demonstrate how they are working to make that impact a positive one, is notable.
Real estate offers a significant and relevant opportunity for meaningful dialogue with the rising generation, covering both cultural capital in the form of social inequality and environmental impact and financial capital such as investing, debt and wealth creation. A real estate company that seeks to unlock its current and future customers’ cultural and financial capital will be a market leader and, importantly, a market shaper.
THE WEALTH REPORT THE WEALTH REPORT 16 17 WEALTH WEALTH
Game of thrones
A new crop of emerging wealth hubs is challenging the old world order. Patrick Gower reports
In October 2022, a reporter tweeted that a major international investment bank was “on the brink”. It was enough to prompt many wealthy clients to begin pulling their funds out of Credit Suisse. The Zurich-based investment bank would collapse just five months later.
Two themes repeatedly cropped up during our investigation into the long-term prospects for the world’s wealth hubs: this generation of HNWIs is both better connected, and more mobile, than ever.
Both themes are encapsulated by the Credit Suisse saga. In that particular case, wealthy individuals were primarily moving money, but the principle applies equally to physical movement, too.
From Miami to Milan, relative upstarts among the world’s wealth hubs are challenging the supremacy of incumbents such as New York and London. An increasingly nomadic group of HNWIs appears happy to respond to incentives to move, whether these span tax, safety or simply a change of lifestyle.
This is a story of carrots and sticks. In London, a combination of taxation and political rhetoric have prompted some investors to wonder whether they are still welcome. Equally, perceptions of a fall in living standards in major US cities, particularly when it comes to safety, have increased the allure of alternatives.
The challengers have problems of their own, of course. Milan suffers from a dearth of prime homes. New Yorkers might fancy a slice of Miami but are reluctant to move amid a scarcity of places in schools that can charge as much as US$50,000 a term. Singapore has seen great success in building its ultra-wealthy population but is realising that coaxing them to invest locally presents another challenge altogether.
Credit Suisse is just one bank, but Swiss regulators are now questioning whether the banking system’s reliance on wealthy – and flighty – individuals poses as many risks as opportunities. It must be careful how it addresses the problem: for the world’s 1%, leaving has never been easier.

THE WEALTH REPORT THE WEALTH REPORT 18 19 WEALTH WEALTH
Paris. Race to the top
A package of reforms aims to make Paris the number one choice for the international banking elite
Ten days before Christmas, French Finance Minister Bruno Le Maire flew to New York to try to establish how he might coax more bankers and hedge fund managers to move to Paris.
Le Maire wanted to “take the pulse” of senior leaders at Wall Street giants including Goldman Sachs, Morgan Stanley, BlackRock and Global Infrastructure Partners, a government official told the website Politico at the time. Those meetings will inform a new package of legislative and regulatory reforms, due in 2024, aimed at building on post-Brexit relocations to the French capital.
Le Maire’s government has been locked in a race – alongside the administrations of Ireland and Germany – to topple London as Europe’s dominant financial hub since Britain voted to leave the European Union in 2016. They are being assisted by the European Central Bank (ECB), which insists that banks must move more senior staff to within its remit if they are to manage risks appropriately.
Neither Paris, Dublin nor Frankfurt has managed to strike a notable blow so far, but Paris has the best momentum.
A BIGGER BUZZ
“Global finance institutions are bringing top level management in [to Paris] to demonstrate to the regulators that they are taking this seriously,” says Florence Carr, a Paris-based partner in EY’s Financial Services Office. “It’s the build up of lots of little things that are attractive to the high-end executive that has given Paris a bigger buzz than other places, like the fantastic international schools or the fact you can hop on a train and be on the French Riviera in about five hours.”
By some measures, Paris appears to be in the ascendency. A series of business-friendly reforms has enabled

France to attract more foreign direct investment than any European nation for the past four years, driven largely by industry and innovation but supported by the flourishing Parisian financial sector, according to EY. Regional unemployment is close to a 15-year low.
The 2023 Rugby World Cup was a success, bringing an estimated €1 billion into the French economy. The Olympics will arrive in July, and large swathes of the city are being regenerated, including a 52-hectare site 7km north of the centre that is being developed into 2,800 new homes. Meanwhile, the Grand Paris Project, Europe’s largest urban infrastructure scheme, will deliver 68 new stations and four new rail lines when it is completed in 2030.
The financial sector is swelling. As of 2022, Paris had lured 2,800 financial services jobs from London, compared with 1,800 that had left for Frankfurt and 1,200 that moved to Dublin, according to EY. The number of French bankers earning at least €1 million surged 63% between 2020 and 2021, according to the latest available figures from the European Banking Authority.
A FLOURISHING INDUSTRY
While those figures leave little doubt that the industry is flourishing, it remains true that relocations have
a lawmaker from Macron’s party, that suggested it should be easier and cheaper to fire high-income employees, according to Politico. Measures could include tweaks to labour laws or moves to facilitate easier stock market listings of small and medium-sized enterprises, according to a December report by Bloomberg. Any incentives are likely to fit with Le Maire’s plan to attract institutions beyond the global banks, such as hedge funds and sovereign wealth funds.
THE KINGMAKER
While those reforms would be attractive to investors, the ECB is the real kingmaker. A desk mapping review conducted by its officials in 2020 found that many of the post-Brexit European hubs opened by financial institutions were in fact “empty shells” still reliant on London-based services.
London. Shift to the left
A change of government in the UK could have significant implications
for London’s future as a wealth hub
nor poverty would exist in a fair society, party leader Jeremy Corbyn said in 2019.
The UK is again on the cusp of a Labour government and, if some polls are to be believed, it’s only the size of the majority that is yet to be decided. As is customary at this stage in the election cycle, current leader Sir Keir Starmer has been reluctant to reveal too much, but experts tell The Wealth Report that he’s likely to preside over the most radical Labour government in decades.
Tbeen far rarer than initial estimates suggested: a 2017 report by PwC for the lobby group TheCityUK warned that Brexit had put as many as 75,000 UK financial sector jobs at risk, for example. Certainly, the UK government has not been resting on its laurels. In December, Chancellor Jeremy Hunt signed a financial services deal with Switzerland – made possible by Brexit –that should make it easier for financial firms and wealthy individuals to do business. Indeed, many investors say they are sanguine about the long-term risks to London, which has a deeply embedded financial services ecosystem that makes leaving more trouble than it’s worth.
“There are enough workarounds to be able to have staff in London and operations in the EU,” says Jérôme Legras, Managing Partner and Head of Research at Paris-based Axiom Alternative Investments. “It’s more complicated and there have been a lot of administrative headaches, but ultimately the impact has been managed. We’ve seen more people going to Frankfurt and Paris but it’s not massive.”
That could change if the ECB and the French government get their way. The reforms being considered by Le Maire could be inspired by a December report by Charles Rodwell,
“A lot of the business was being booked in the EU but sent through financial means outside of the EU and particularly to London,” Carr says. Officials have “been pushing and pushing and the pressure is mounting almost every day on this.”
More than a fifth of the 264 trading desks initially reviewed “warranted targeted supervisory action,” Andrea Enria, head of the ECB’s supervisory board said in 2022. Further reviews are likely to be expanded to cover services beyond the scope of the initial review, including mergers and acquisitions and stock and bond issuance, the ECB said in December. The reviews are likely to form the core of a strategy to draw more capital to the bloc, which in turn must be overseen by increasing numbers of senior executives.
The banks “are getting their reports from the ECB that are very much saying ‘if you want to trade here, you need to have the capital to back up your business here’,” Carr says. “That means if you trade, you need the capital to protect that trade, and when you move capital you have to move people. This is definitely happening.”
ony Blair had been prime minister for about a year when his Trade and Industry Secretary Peter Mandelson said the Labour Party was “intensely relaxed about people getting filthy rich.”
It was 1998, and Blair was at the beginning of a decade-long rule that would be era-defining in its approach to economic liberalisation. But while real incomes surged, so did wealth inequality. The party’s attitudes to wealth have become increasingly varied ever since. Neither billionaires
What that looks like in practice will be crucial for London. Following a period of post-Brexit uncertainty, the capital’s reputation as Europe’s dominant hub for wealth and finance is looking more secure. Labour risks upsetting that progress if it is too heavy-handed in its attempts to raise taxes on the wealthy, says Paddy Dring, Global Head of Prime Sales at Knight Frank.
“People are concerned about the government and in particular about any changes that might make big overseas investors feel unwelcome,” he says. “Feeling welcome is important. Clients use those words and I think it’s important that a new government conveys that Britain still values international investment.”
“As of 2022, Paris had lured 2,800 financial services jobs from London, compared with 1,800 that had left for Frankfurt and 1,200 that moved to Dublin, according to EY”

THE WEALTH REPORT THE WEALTH REPORT 20 21 WEALTH WEALTH
“From North America to New Zealand, left-wing political parties in advanced economies are beginning to reckon with flaws in the typical ‘tax and spend’ economic model”
COMPARISONS WITH BLAIRITES
Starmer and his shadow chancellor
Rachel Reeves have so far courted business and ruled out many of the more radical policies favoured by leftleaning sections of the party. These include introducing rent controls, imposing a mansion tax on higherpriced properties, raising capital gains tax and increasing the top rate of income tax. While Reeves does want to reform the UK’s non-dom tax regime, which allows UK residents with a permanent home overseas to avoid paying UK tax on foreign income, anything substantial risks “shooting themselves in the foot for political gain with very little in the form of economic benefit,” says James McBride, a veteran of the Labour Party Policy Unit that worked on both the 2016 Brexit referendum and 2017 general election campaigns.
Despite the moderate rhetoric, comparisons with Blairites would be wide of the mark. “They aren’t Corbynites either, but they are much more centre left in their proposition than either the Financial Times or the liberal consensus would have us believe,” says McBride, now managing director at political consultancy ForeFront Partners. “If that's correct, then we’re headed for a Labour government that will be more leftwing and more radical than any we’ve had since the 1970s.”
For a glimpse of what that might look like, turn overseas. From North America to New Zealand, leftwing political parties in advanced economies are beginning to reckon with flaws in the typical “tax and spend” economic model. A key pillar in US president Joe Biden’s fiscal policy is known as “modern supplyside economics”, an overhauled version of the credo made famous by former president Ronald Reagan and his British counterpart Margaret
Thatcher. Both sought growth via tax cutting and deregulation.
Modern supply-side economics, by contrast, incentivises labour force participation, research and development, infrastructure and climate change mitigation, with an eye on longer-term structural problems such as inequality, US Treasury Secretary Janet Yellen said in the 2022 speech in which she coined the term.
Progressive governments in other advanced economies would like to follow suit, including Labour, according to McBride. While their plans “aren’t yet codified”, he says, their application of modern supply-side economics could mean anything from a universal offer for childcare to drive up labour market participation at the less contentious end of the spectrum, right up to something as ambitious as Biden’s Inflation Reduction Act.
“It would represent a much more activist, interventionist industrial strategy,” he says. “This is bread and butter European socialism, but it would be a break with the neoliberal consensus that we’ve had.”
LEVELLING UP
Their ambition will be limited by what’s popular and what’s possible when it comes to public finances.
Tackling wealth inequality will remain a priority, but Labour’s methods are likely to focus more on curtailing runaway asset prices by increasing housing supply, for example, rather than raising taxes on the wealthy. Curtailing the dominance of London by levelling up the rest of the country will retain cross-party support, and McBride suggests we will see greater levels of devolution, though this is a multi-generational project.
So are Starmer and Reeves also “intensely relaxed about people getting filthy rich”? Probably not, but the pair are realists and have a good grasp of what’s possible, according to McBride.
“In an ideal world they would want to tax more, particularly the rich, but they’re smart enough to know that would cost them the election, and despite the instinctive politics, the world is a complicated place,” he concludes. “The UK is in a pretty tough position for lots of reasons, and it would be too risky both politically and economically to go down that route.”
Geneva. Back to basics
The Swiss banking industry, so long a byword for security and stability, must work to regain momentum and restore its reputation
On Saturday October 1 2022, an ABC news reporter tweeted that a major international investment bank was “on the brink”.
It was the beginning of the end for Zurich-based Credit Suisse. Buffeted by repeated scandals, shares in the bank were already down 60% over the course of the year. By Monday lunchtime there had been more than 6,400 retweets and 28,000 likes, according to the Australian Financial Review. Customers began pulling their funds.
Six months later and almost 6,000 miles away, chat groups packed with well-connected venture capitalists began speculating that Silicon Valley Bank, headquartered in Santa Clara, California, might be insolvent. The subsequent contagion reverberated back to Zurich, where Credit Suisse depositors had already pulled SFr67 billion during the first three months of the year. Both institutions would collapse within the month.
MONEY ON THE MOVE
“In both cases, we realised how quickly people can decide to move their money,” says Angela Gallo, a senior lecturer in finance at Bayes Business School. “A critical factor in the failure of Credit Suisse was the fact that a lot of their deposits were with very wealthy clients, and wealthy clients tend to be quite dynamic, so they leave very quickly.”
This poses a challenge for key wealth hubs such as Geneva and Zurich, which rely disproportionately on highly mobile wealthy individuals. Switzerland commands more than a fifth of the world’s cross-border wealth management, making it a larger overseas wealth hub than Singapore or
Hong Kong. Switzerland’s deep pool of financial talent, its proximity to the rest of Europe and the diversification provided by the Swiss franc have long been a draw for investors. However, those factors are dwarfed by a reputation for secrecy, security and stability that has been centuries in the making.
“People come from all over the world to put down roots in a place perceived as safe and stable from an economic, political and personal perspective,” says Alex Koch de Gooreynd, Knight Frank’s Head of Residential Sales in Switzerland. “If you’re from a place where life is a little less secure and the rule of law is less of a factor for political leaders, the Swiss offer is hugely attractive.”
SLOWING GROWTH
That reputation has already been shaken by scandals and a steady erosion of secrecy rules as both US and EU authorities seek to clamp down on tax evasion and money laundering. The Swiss wealth management industry has grown at a slower rate than rival Asian centres for several years, and Hong Kong is likely to overtake Switzerland as the leading centre of cross-border wealth management in
2027, according to a 2023 forecast by Boston Consulting Group (BCG).
Granted, this is partly a consequence of economic pressures impacting the wealth management industry across western Europe and the rapid growth of private wealth in Asia. But Swiss regulators know they must repair reputational damage and prevent further bank runs if the industry is to regain momentum.
The subsequent takeover of Credit Suisse by UBS in March “changed the perception of the Swiss banking industry,” says Gallo, who believes the reliance on wealthy depositors, once considered among its greatest strengths, is now seen by regulators as a weakness.
“We would normally think that banks’ deposit base is made up of retail investors like you and me, but it’s not true anymore,” she says. “For many, super-rich individuals or corporations with big accounts play a much bigger role. The growing importance of wealth management has real implications for bank stability.”
SAFETY IN THE LONG RUN
The Swiss National Bank and the Swiss Finance Ministry are now conducting a review of the country’s banking rules, part of which will seek to address the
flighty nature of wealthy investors who played a role in the demise of Credit Suisse. Measures being discussed include an option to stagger a greater portion of withdrawals over longer periods of time, imposing fees on exits, or rewarding clients who tie up their savings for longer with higher interest rates, Reuters reported in November. A report is due out in spring 2024.
By paying SFr3 billion for Credit Suisse and assuming up to US$5.4 billion in losses, UBS CEO Ralph Hamers told reporters that his bank was “defending the reputation” of the Swiss banking industry. Initially, investors gave the takeover a lukewarm reception for creating what was perceived as “a weaker giant”, Gallo says, but if the deal manages to assuage fears among overseas investors about the safety of their funds in the long run, it is likely to be regarded as a major success.
“Overseas clients with funds in Switzerland must fall back on the history of the banking industry and the fact that it’s dominated by very large players, because that gives them the reputation they need,” Gallo says. “With secrecy comes some uncertainty about what will happen to your funds, so the reputation of the banks is everything.”

THE WEALTH REPORT THE WEALTH REPORT 22 23 WEALTH WEALTH
Milan. Filling the gap
A new tax regime is drawing UHNWIs to Italy: now its main wealth hub needs the prime housing stock to keep them there
For decades, the world’s billionaires have snapped up mansions overlooking Lake Como and secluded Tuscan farmhouses to use as getaways from their lives in London, Geneva and New York.
But while most are used to packing weekend bags, increasing numbers of UHNWIs are purchasing handsome Milanese penthouses to use as primary residences, lured by generous tax incentives.
A tax regime allowing nondomiciled Italian residents to pay an annual flat tax of €100,000 on foreign income lies at the core of the surge. Family members can take part for an additional annual €25,000 fee. Just 98 people took advantage of the scheme when it was introduced in 2017, a figure that rose steadily to 549 by 2020 before more than doubling to 1,339 in 2021, according to official figures analysed by The Guardian
The system “has been a great success and it’s still very much in its growth phase,” says Roberta Crivellaro, partner and head of the Italian practice at law firm Withersworldwide. “More and more clients are asking about Milan because they’ve seen that this measure has been kept in place since 2017, so the initial scepticism has now passed away.”
PUBLIC SUPPORT
Indeed, the scheme has survived five prime ministers and enjoys broad public support in a country reliant on tourism, Crivellaro says. That stands in contrast to so-called non-dom schemes elsewhere, most notably in London, which have attracted the ire of residents fed up with public displays of wealth

inequality. The UK’s Labour Party has pledged to reform that scheme if it wins power in an election likely to take place this year (see page 21).
Italian prime minister Giorgia Meloni views the scheme as part of a broader plan to cut taxes in order to boost investment. In October, Meloni announced €24 billion in tax cuts and pledged to raise public sector pay throughout 2024 despite rising pressure on public finances. State interest payments have ballooned as rates have risen.
Italy has long had the culture and weather to attract the world’s wealthy. Milan is the country’s main wealth hub, connected by two airports and within easy reach of the Alps, Lake Como and the beaches of the Ligurian coast. High taxes were once viewed as a key barrier preventing overseas investors settling over the long term, but as the scheme has grown more successful a new challenge has emerged: a lack of suitable prime housing.
“Milan just doesn’t have the assets that these clients are looking for,” Crivellaro says. “Milan would be their first destination if they could find houses like those you might see in London, but they can’t, so they go to Como or Florence.”
PRESSURE ON HOUSING
Milan’s population has climbed 10% during the past decade, putting pressure on both ends of the housing
of the city, Thomson and Crivellaro agree. That will limit Milan’s potential as a regional wealth hub as property purchasers spend time in more secluded locations rather than splashing out in the city as the government would like.
“Sometimes these billionaires do not live the idea of communities,” Mayor Giuseppe Sala said in an interview with Bloomberg TV in October. “They are happy here. They live in a very vibrant city and in an easy city because it’s not so big. But we would like to have a sort of giveback from them.”
Hong Kong and Singapore. Rich pickings
incentives and a business-friendly regulatory regime to encourage 1,100 family offices managing more than US$4 trillion to move to the citystate, up from about 100 less than a decade ago.
DOMINANT PLAYER
“ There are certain industries, such as fashion, furniture and finance, where being in Milan really makes sense, but it has got some way to go before it can offer the lifestyle of other hubs”
ladder. Average house prices have climbed from €3,883 per sq m five years ago to a November 2023 high of €5,345. In central Milan, prices can typically run as high as €10,466 per sq m.
“The vast majority of prime properties lie in existing structures, so unlike a lot of markets in the world Milan’s property market isn’t driven by new build,” says Bill Thomson, Italian Network Chairman at Knight Frank. “Supply comes through via the redevelopment of existing buildings, and those that do come available are often purchased by local developers who have spent tens of millions buying apartments for the rental market.”
Without the stock, billionaire purchasers tend to opt for an apartment in Milan and a trophy property to live in within easy reach
Some of these issues will be solved in time. The supply of prime homes is picking up, though they are still not of a calibre to compete with the great wealth hubs of Europe, Crivellaro says. Upmarket restaurants and private members’ clubs are also proliferating. A branch of restaurant SUSHISAMBA will open during 2024 as part of the redevelopment of the historic Torre Velasca by Hines, for example.
“There are certain industries, such as fashion, furniture and finance, where being in Milan really makes sense, but it has got some way to go before it can offer the lifestyle of other hubs, and particularly other parts of Italy,” says Thomson. “People want to enjoy their lives as well as save money, and for that, the rest of Italy has the best the world has to offer.”
Over the five years to 2028, Asia’s wealthy population is set to grow faster than any other region in the world
The rate of growth – equivalent to around 35 new UHNWIs each day – will bring the total to about 230,000, almost 40% larger than it was in 2023. At that point, only North America will boast a larger community of ultra-wealthy people, but at current rates of growth, it won’t be long before Asia takes the crown.
Competition to host Asia’s newly minted wealthy is hotting up, with Hong Kong and Singapore leading the charge. Singapore has utilised tax
Hong Kong has long been the region’s dominant wealth hub. The city’s wealth management industry posted the fastest growth in assets under management in the five years to 2022 until “the winds changed” and some wealthy individuals began moving funds to Singapore, BCG said in a 2023 report. The authorities responded with a set of incentives aimed at family offices and residency for people investing at least HK$30 million into the city.
“Hong Kong is very good at reinventing itself, and it has obviously seen what it perceives as the success of Singapore’s family office regime,” says Jeffrey Lee, partner and head of the Singapore office at law firm Charles Russell Speechlys.
Though family office numbers have risen in Singapore, the link to direct spending and investing is not clear cut. Last summer, the Monetary Authority of Singapore (MAS) tweaked the incentives on offer to encourage family offices to invest in the country’s equity markets, including those aimed at encouraging investment in local climate-related projects, for example.

THE WEALTH REPORT THE WEALTH REPORT 24 25 WEALTH WEALTH
“Singapore is seeing success in attracting emerging wealth from Indonesia, Thailand, Malaysia and Vietnam, while Hong Kong will always be the dominant hub for wealth created in the Chinese mainland”
Family office arrivals have had little impact on the residential property market either, according to MAS officials. The challenge for the city is to encourage these private institutions to put down deeper roots – which should lead to more widespread investment.
Despite these challenges, the wealth management industry is likely to swell rapidly. Financial wealth booked in Singapore is expected to grow at a rate of 9% through to 2027, according to BCG. That will place it in the top three wealth management hubs globally, behind Hong Kong and Switzerland.
Hong Kong’s family office community is about 400-strong, and the city has ambitious plans for growth, with targets for a further 200 by 2025. In October last year, a policy announcement confirmed an investment migration programme that will encourage wealthy individuals to invest at least HK$30 million in local stocks or other assets. The Capital Investment Entrant Scheme is likely to be open from the middle of this year onwards, and will have a central role in bolstering Hong Kong’s wealth management industry.
Experts are generally bullish on Hong Kong’s prospects. Indeed, the
rate of regional wealth creation is so significant that Hong Kong and Singapore are each strengthened by the success of the other, according to Charles Russell Speechlys’ Lee. Singapore is seeing success in attracting emerging wealth from Indonesia, Thailand, Malaysia and Vietnam, while Hong Kong will always be the dominant hub for wealth created in the Chinese mainland.
INVITING INVESTMENT
Indeed, the success of Hong Kong as a wealth management hub hinges less on the performance of Singapore than it does on the expansion of the Chinese economy and its ability to attract wealthy individuals from the mainland. China’s economic growth is likely to slow to 4.5% in 2025, down from 8.4% in 2020, according to World Bank forecasts. Those growth rates are still likely to be enough to help propel Hong Kong to becoming the world’s dominant wealth management hub by 2027, taking Switzerland’s crown, according to BCG.
The key question for both Singapore and Hong Kong will be the degree to which either manages to implement a regulatory structure that encourages real investment in the local economy, according to Lee.
“Most governments would want these sorts of regimes to be created with one key focus in mind, which is to invite investment into the country,” he says. “Will either be able to attract the ‘real’ family offices as we know it – families that need some sort of infrastructure around their wealth? I think the jury is still out on that.”

Miami. Going up –and up
Even billionaires struggle to get a slice of the South Florida waterfront
Fresh from selling his fashion brand to Estée Lauder for US$2.8 billion, Tom Ford spent US$51 million for a Palm Beach estate in December 2022, a record for a so-called “dry” property on the island.
The South Florida property market “was already on an upward trajectory in 2020, but the pandemic took us to outer space,” says Bill Hernandez, a real estate agent at Douglas Elliman in Miami. “If people have to spend that kind of money to not be on the ocean, then good gracious, what does that tell you about where we’re headed?”
Wealthy individuals have long flocked to Florida for its weather, lifestyle and political and economic stability. Miami is known as the “capital of Latin America” and is arguably the region’s most dominant financial hub, despite not being part of it. Seven in ten residents identify as Hispanic or Latino, according to the US Census Bureau.
ON THE MOVE
A new dynamic has emerged since the Covid-19 pandemic. Large companies and wealthy individuals who were once tethered to dominant US economic centres such as New York or Los Angeles have moved to Florida in increasing numbers, citing attractive tax rates, perceptions of higher crime in their former bases and the success of remote working.
In South Florida, foreign driver licence exchanges increased 78% in the first nine months of 2023 compared with the same period in 2022. Of the out-of-state applicants arriving in south-east Florida during the first half of the year, 24% were from New York, 10% from New Jersey and 8% from California, according to
the Miami Association of Realtors. Feeder states such as Texas, Georgia, Virginia, Maryland and Ohio are also increasing their market share.
Financial institutions such as Citadel, Elliott Management and Point72 Asset Management have all either moved their headquarters to or expanded in Florida. Citadel founder Ken Griffin cited Chicago’s crime rate as key to its move, suggesting safety risks had made it difficult to recruit into the firm’s Windy City office. In 2023, Amazon founder Jeff Bezos purchased a US$79 million sevenbedroom mansion along with the neighbouring US$68 million plot of land in Miami’s Indian Creek, an island known as the “Billionaire Bunker”.
“Miami has come on strong as a corporate destination and the culture has become dramatically more sophisticated, which is attracting decision-makers from all over the world,” says Peter Bazeli, Principal and Managing Director at real estate consultancy Weitzman. “It still has a long way to go if it’s ever going to truly compete with the likes of New York, because of the sheer numbers. You still don’t have that critical mass of employment – but it has momentum.”
GETTING REAL
Annual house price growth in Miami has cooled from a peak of 37.2% in May 2022 to 6.5% in the year to December, according to the Knight Frank Prime International Residential Index (see page 32). The market calmed as buyers began to resist the lofty demands of sellers, says Douglas Elliman’s Hernandez. “Some sellers were still at crazy elevated prices, but these buyers can respond by staying in New York or Beverly Hills,” he says. “Now sellers are starting to get real and we saw some really big sales occur through 2023.”
Elevated house prices aren’t the only headwind. Florida, like many emerging wealth hubs including Milan, have enjoyed rapid growth since the onset of the pandemic. However, their success is putting strain on resources and infrastructure, whether it’s a lack of available land, or a shortage of schools that perform at levels that wealthy families expect if they are to move from cities such as London or New York.
Gulliver Preparatory School in Miami has seen record applications for each of the past four years, the school
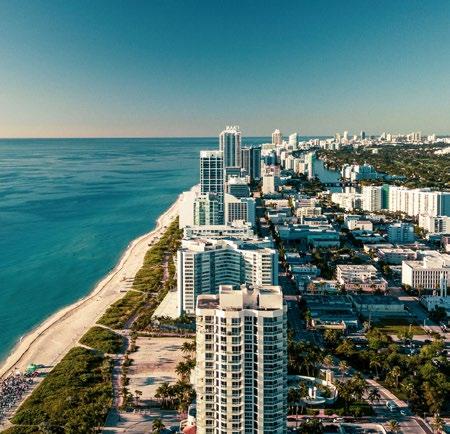
“In South Florida, foreign driver licence exchanges increased 78% in the first nine months of 2023 compared with the same period a year ago”
told Forbes last year. Pine Crest School said a surge in interest began in March 2020, which it put down to “the rise in corporate remote work arrangements, and the attractive cost of living and quality of life in South Florida.”
Avenues, one of New York City’s most elite schools, is set to open in Miami from 2025. Places are likely to cost US$50,000 a term.
“Some people hesitate to transition down here because we simply can’t match the level of education on offer in New York,” Hernandez says. “When they do make the move, there’s a big competitive market to get their kids in to the handful of private schools that we have.”
Competition for land is almost as fierce, particularly on the waterfront, according to Bazeli. That’s impacting the feasibility of new residential projects. “Anywhere on the ocean
in Miami Beach, even up all the way to Bal Harbour, you can underwrite residential projects at as high as US$5,000 or more per sq ft,” he adds. “It just depends on the scale and the massing of what you can build.”
TRADING UP
Tom Ford has traded up since his December 2022 purchase. Last year, the designer upsized by swapping houses with Brian Kosoy, CEO of private equity real estate firm Sterling Organization, the Palm Beach Daily News reported at the time. Ford now resides in a 17,424 sq ft, five-bedroom mansion at 195 Via Del Mar in Palm Beach – a two-minute walk to the water.
Demand may have cooled in the broader market, but billionaires such as Ford will continue to fight for the best spots because many of the trends that have supported Florida’s post-pandemic growth are firmly entrenched, Hernandez says. “I think by the end of 2025 and through 2026, South Florida real estate from Palm Beach all the way down to Coconut Grove will be one of, if not the most expensive real estate market in North America,” he concludes. “I’m convinced of it.”
THE WEALTH REPORT THE WEALTH REPORT 26 27 WEALTH WEALTH
New York City and Los Angeles. On brand
From the east coast to the west, long-held perceptions of luxury are being challenged by a new breed of branded developments
From “The Fresh Prince of Bel Air” to “MTV Cribs” and “Selling Sunset”, the film and TV industry has long promoted the Los Angeles mansion as a global symbol of American wealth.
But for a small and growing number of wealthy residents moving to the city in search of the California dream, these opulent homes, at times reaching in excess of 100,000 sq ft, are no longer the only option. Indeed, across major US cities including New York and Miami, an increasing focus on security and convenience is bringing full-service buildings and branded residences to the fore. In Los Angeles, city authorities are seeking to promote higher-density, mixed-use developments to lock in what it sees as more sustainable growth.
“Los Angeles has always been about the mansion, but the city has so much potential precisely because of the fact that it’s still really very much in the early stages of higher-density, mixed-use types of development,” says Peter Bazeli, Principal and Managing Director at Weitzman.
“I think that there are some really exciting things to come from an urban planning perspective if the city does begin to diversify away from the mansion housing stock that makes up the luxury market there.”

The prime housing market is recovering from a downturn sparked by the sharp increase in borrowing costs and the implementation of the so-called “mansion tax” in 2023.
The 4% levy on property sales above US$5 million rises to 5.5% for US$10 million-plus sales. While authorities expect almost 40% of revenue to come from sales of single-family homes, the levy also applies to apartments and commercial buildings. Prime residential values in Los Angeles climbed 2.5% in 2023, according to our Prime International Residential Index (page 32). Knight Frank expects growth to cool to 1% over the course of 2024 with rising supply as lower mortgage rates encourage owners to sell.
SAFETY FIRST
A set of Aman Branded Residences in Beverly Hills, due to open in 2026, provides a glimpse of the competition. The homes will sit alongside an Aman hotel and club, within eight acres of botanical gardens on the 17.5-acre One Beverly Hills development, less than a mile from Rodeo Drive.
The Aman residences are part of a rapidly expanding global market of branded residences that cater to wealthy individuals seeking the benefits of ownership while wanting the services of five- and six-star hotels. There are now 186 operational schemes globally and another 138 are in the pipeline, according to Knight Frank Research. North America accounts for nearly 40% of total projects and 60% of the pipeline.
Meals cooked by Michelin-starred chefs are a big part of the appeal, but safety is now among the primary draws, brokers say. Though official statistics show incidents of violent crime are at or close to historic lows in both New York City and Los Angeles, “Los Angeles has always been about the mansion, but the city has so much potential precisely because of the fact that it’s still really very much in the early stages of higherdensity, mixed-use types of development”

“ The challenge for developers with schemes in the pipeline will be to ensure what’s on offer matches local definitions of luxury and provides a strong enough connection between the brand and the physical space to justify the prices charged”
which people want to come here, do business and enjoy everything else that New York has to offer,” says Hugh Dixon, Head of the US Private Office at Knight Frank.
GROWING PAINS
Nevertheless, there appears to be a swelling group of wealthy buyers – particularly the newly minted younger generation – who want to be in downtown locations while enjoying the best services and security available.
perceptions don’t always match reality. Three-quarters of New Yorkers said crime was a “very serious” problem in a February Quinnipiac University poll, for example, the highest number since researchers first asked the question in 1999.
Experts put the disconnect down to social media and high-profile campaigns on crime from political leaders. Wealthy buyers – including those coming from overseas – are well-connected enough to pick up on the concerns.
“Safety and property taxes are generally among the first questions from purchasers, but both tend to be outstripped by the degree to
“The trend in Los Angeles is into full-service buildings,” says Cory Weiss, a broker at Douglas Elliman’s Los Angeles office. “I’m seeing buildings that used to predominantly have older people in, and a lot of the younger people are moving in for the safety and convenience. I’ve had two clients buy second homes here in the past year and they bought in full-service buildings because of the safety and security. I’m just seeing more activity from people considering these building that generally wouldn’t have in the past.”
To be sure, some experts say luxury multi-family homes and branded residences pose little threat
to the dominance of the mansion, whether in Los Angeles or elsewhere. The branded residences market is tiny by comparison, and there will always be a large slice of the expanding wealthy community that favours the space and seclusion offered by single-family properties on the outskirts of cities.
Indeed, the branded residence market has experienced growing pains. The premiums are so attractive to developers that poorly conceived schemes have been introduced, resulting in sluggish sales, says Bazeli, whose firm consults on about 80 branded residence developments each year. The challenge for developers with schemes in the pipeline will be to ensure what’s on offer matches local definitions of luxury and provides a strong enough connection between the brand and the physical space to justify the prices charged.
“As the sector evolves, buyers will become even more demanding and better educated, and they will need clear answers as to what each development is really offering to back up the premium prices being marketed,” he concludes.
THE WEALTH REPORT THE WEALTH REPORT 28 29 WEALTH WEALTH
Home
Delve into the trends driving prime global residential property performance now and in the future
32 PIRI 100
Manila tops the list in this year’s PIRI, with prime property across the board defying expectations
34 SEEKING VALUE?
What US$1 million will buy in cities and second-home markets around the world
35 RED TAPE TRACKER
As the world heads for the polls, brace for a year of shifting policy and regulation
36 THE YEAR AHEAD
The economic outlook may be brighter, but the forecast remains unsettled for investors
38 THE BIG FIVE
From AI to wellness, the key themes shaping the future of prime property markets
39 ONES TO WATCH
Knight Frank’s global experts on the properties and locations catching their eye in 2024

THE WEALTH REPORT THE WEALTH REPORT 30 31 HOME HOME
High life – The Greenwich by Rafael Viñoly embraces light and air from every floor, with its glass façade and rounded corners offering expansive panoramic views of downtown Manhattan and beyond
PIRI 100
Luxury residential markets proved resilient in the face of successive interest rate hikes in 2023. Kate Everett-Allen explores our unique Prime International Residential Index, which tracks the performance of 100 city, sun and ski locations globally
The results
The Prime International Residential Index (PIRI 100) surprised on the upside in 2023. Of the 100 markets tracked, 80 recorded flat or positive annual price growth.
Yet at the start of 2023, economists were expecting a much weaker outcome. Stock markets were headed for more pain, inflation was veering out of control and the pandemic-fuelled property boom was set to end in tears as borrowing costs hit 15-year highs in some markets. Right? Wrong.
The “soft landing” adage applied as much to luxury property markets as to monetary policy, with the index posting a solid 3.1% gain overall. Manila (26%) leads but last year’s frontrunner, Dubai (16%), slipped only one spot. AsiaPacific (3.8%) pipped the Americas (3.6%) to the title of strongest-performing world region, with Europe, the Middle East and Africa trailing (2.6%).
As predicted last year, sun locations continued to outperform, up 4.7% on average with ski resorts close behind (3.3%) and cities on 2.7%.
THE YEAR IN REVIEW
As markets adjusted to the higher cost of debt, sales took a bigger hit than prices. In London, New York, Dubai, Singapore, Hong Kong and Sydney, luxury sales declined on average by 37% year-on-year.
Some markets corrected after strong falls due to rapid rate hikes (Auckland, Seoul), while others moved up the rankings in part due to supply shortages (Sydney, Singapore). Some were influenced by policy and tax shifts, easing (Hong Kong) or tightening (Los Angeles), and some markets benefited from significant wealth inflows (Dubai, Miami).
Prices in both New York and London dipped around 2% in 2023 and sit 8% and 17% below their most recent market peaks respectively, presenting a strong opportunity for prospective buyers. Iberia proved a hotspot, occupying five of the top 20 rankings with the Algarve and Ibiza (both 12%) leading the pack.
KEY FINDINGS
1. Luxury prices climbed 3.1% on average in 2023.
2. Sales volumes, not prices, were the main casualty of higher interest rates.
3. Manila leads, with Dubai in second place.
4. Asia-Pacific was the strongest-performing world region.
5. London and New York remain closely aligned.
8
9
3
1.4% MELBOURNE
1.4% RIO DE JANEIRO
65 1.3% VERBIER
66 1.2%
71 1.0% GSTAAD
72 0.8% LAUSANNE
0.6% BUCHAREST
0.6% DUBLIN
0.6% JAKARTA
0.6%
2023 in perspective
MEA CULPA
In the interest of full disclosure, we look back at what we got right – and wrong – in 2023, comparing our 25-city forecast with the actual results in this year’s PIRI 100.
GOLD STAR
For 18 of the 25 cities tracked, our research teams demonstrated remarkable accuracy, staying within a 2% margin. Not bad given the tumultuous economic and geopolitical backdrop.
COULD DO BETTER
Seoul, Vancouver, Sydney and Madrid wrongfooted us, outperforming our expectations. Domestic buyers dominated, and in most cases a lack of stock gave prices an extra boost. Three cities posted weaker growth than predicted: Dublin, Edinburgh and Los Angeles. Higher mortgage costs resulting in weaker sales volumes and a mansion tax in Los Angeles influenced buyer sentiment more than anticipated.
26.3% MANILA 2 15.9% DUBAI
1
15.0% BAHAMAS =4 12.3% ALGARVE =4 12.3% CAPE TOWN =6 12.0% ATHENS =6 12.0% IBIZA
10.0% MUMBAI
8.6% SHANGHAI =10 8.0% MUSTIQUE =10 8.0% ST BARTS 12 7.4% CYPRUS 13 7.2% MARBELLA 14 7.0% MALLORCA 15 6.7% VANCOUVER 16 6.5% MIAMI 17 6.4% MADRID =18 6.2% LAKE COMO =18 6.2% SEOUL =20 6.0% MEXICO CITY =20 6.0% VAL D'ISÈRE =22 5.6% BOSTON =22 5.6% JERSEY =24 5.5% AUCKLAND =24 5.5% COURCHEVEL =24 5.5% FLORENCE 27 5.4% SHENZHEN 28 5.2% PERTH =29 5.0% CAYMAN ISLANDS =29 5.0% CHAMONIX =29 5.0% ORANGE COUNTY =29 5.0% PORTO =29 5.0% PROVENCE =29 5.0% ST MORITZ
4.7% SÃO PAULO
4.5% ROME
4.2% DELHI =38 4.1% GOLD COAST =38 4.1% STOCKHOLM =40 4.0% HAWAII =40 4.0% OSLO 42 3.5% MILAN 43 3.4% HOUSTON 44 3.3% BEIJING =45 3.0% BARBADOS =45 3.0% BRITISH VIRGIN ISLANDS 47 2.9% SINGAPORE 48 2.8% RIYADH =49 2.7% BARCELONA =49
SYDNEY
35
36
37
2.7%
TAIPEI =52 2.5% LOS ANGELES =52 2.5% MEGÈVE =52 2.5% MÉRIBEL =52 2.5% NAIROBI =52 2.5% PARIS =52 2.5% VENICE 58 2.3% BRISBANE 59 2.2% BENGALURU
2.2% LISBON 61 2.0% LUCCA 62 1.6% GUANGZHOU =63
=63
51 2.6%
60
=67
=67
=67
ST
=67
WELLINGTON
BRUSSELS
1.1% ASPEN
1.1% PHUKET
1.1%
TROPEZ
1.1%
MONACO
0.5% SAN FRANCISCO 78 0.2% KUALA LUMPUR =79 0.0% SARDINIA =79 0.0% VIENNA 81 -0.2% MARRAKESH 82 -0.5% TOKYO =83 -1.0% BERLIN =83 -1.0% TORONTO 85 -1.3% GENEVA 85 -1.3% JEDDAH 87 -1.8% BANGKOK 88 -2.0% NEW YORK =89 -2.1% HONG KONG =89 -2.1% LONDON 91 -2.4% ZURICH 92 -2.7% THE HAMPTONS 93 -3.2% EDINBURGH =94 -3.9% BUENOS AIRES =94 -3.9% FRANKFURT 96 -5.0% SAINT-JEAN-CAP-FERRAT 97 -5.3% PRAGUE 98 -5.6% AMSTERDAM 99 -7.0% CANNES 100 -8.4% OXFORD THE WEALTH REPORT 33 HOME HOME PRIME INTERNATIONAL RESIDENTIAL INDEX
=73
=73
=73
=73
77
THE WEALTH REPORT 32
AVERAGE ANNUAL CHANGE BY WORLD REGION AMERICAS 3.6% EMEA 2.6% ASIA-PACIFIC 3.8% TOP 5 BAHAMAS MUSTIQUE ST BARTS VANCOUVER MIAMI TOP 5 ALGARVE CAPE TOWN ATHENS IBIZA CYPRUS TOP 5 MANILA MUMBAI SHANGHAI SEOUL AUCKLAND AVERAGE ANNUAL CHANGE BY ECONOMY TYPE ADVANCED 2.9% EMERGING 3.2%
annual % change across the PIRI 100 markets 8.0% 10.0% 6.0% 4.0% 2.0% 0.0% -2.0% -4.0% -6.0% 2008 -0.2% 20 15 1 .8% 20 11 0. 1 % 20 18 1 .3% 2009 -5.5% 20 16 1 .4% 20 12 0.3% 20 19 1 .8% 20 10 1 .0% 20 17 2. 1 % 20 13 2.8% 20 14 2.2% 2020 1 .9% 20 21 8.4% 2023 3. 1 % 2022 5.2%
Average
Sources: All data comes from Knight Frank's global network with the exception of Boston, Miami, San Francisco (S&P CoreLogic Case-Shiller); Frankfurt (Ziegert Research & ImmobilienScout 24); Jersey (States of Jersey); Mexico (Sociedad Hipotecaria Federal); Oslo (Advokat Ek, Oslo); São Paulo and Rio de Janeiro (Fundação Instituto de Pesquisas Econômicas); Stockholm (Svensk Mäklarstatistik AB); Toronto (Toronto Real Estate Board); Vancouver (Vancouver Real Estate Board); Tokyo (Ken Corporation) Notes: Price changes are measured in local currency and correspond to the period 31 December 2022 to 31 December 2023 unless otherwise stated. Amsterdam, Barcelona, Brussels, Buenos Aires, Cyprus, Dubai, Edinburgh, Geneva, Jeddah, Jersey, Marrakesh, Mexico City, Riyadh, The Hamptons, Zurich to Q3 2023. Boston, Miami and San Francisco to October 2023. Aspen and Vancouver to November 2023. Tokyo - relates to all properties above ¥100m
Seeking value?
Our PIRI pricing graphics provide an annual guide to how much space your money will buy you when it comes to prime residential property
There is significant variation in prime prices across luxury residential markets, which often surprises buyers. Prime prices in Dubai may sit 134% higher than at the start of the pandemic but they are still noticeably lower than in more established markets. Here, US$1 million buys 91 sq m, four times the equivalent in Hong Kong.
Sources:
It’s a similar story for second homes, as shown in our new chart focusing on rural, coastal and alpine markets. In Barbados, for example, US$1 million will garner 143 sq m, more than four times as much luxury space as in St Tropez.
How many square metres of prime property US$1m buys in selected markets
Red tape tracker
Buckle up for a year of shifting rules and regulations. As almost 70 countries go to the polls in 2024, the implications for wealth flows and property markets could be significant. Here’s our round-up of the latest changes
UK A Labour Party victory in the UK general election is expected to end the non-dom tax regime, increase stamp duty for overseas buyers and potentially lead to changes to inheritance tax rules. Knight Frank Research, Douglas Elliman, Ken Corporation Note: Currency calculation as at 29 December 2023
CANADA
A two-year foreign buyer ban due to end on January 1 2025 has been extended to 2027. Permanent residents and some temporary workers are exempt, along with some rural and “recreational” property.
NEW YORK
FRANCE
From 2025, properties rated G for energy efficiency can no longer be let. Since August 2022, rents for F- and G-rated properties cannot be increased. The rules do not apply to furnished holiday lets.
HONG KONG SAR
The rates of both ad valorem and buyer’s stamp duty have been reduced for non-permanent residents, meaning a reduction from 30% to 15% overall.

PORTUGAL
The Non-Habitual Residency initiative, with lower tax rates for non-residents, was due to end in 2023 but has been extended for applicants who can prove their move was planned prior to December 2023.
UAE UAE has reintroduced the three-month or 90-day visit visa, which can be extended within the country for an additional cost.
CHINESE MAINLAND
New housing policies across first-tier cities include lowering the down payment ratio for first-time and second-home purchasers and extending the maximum mortgage term to 30 years.
AUSTRALIA
Fees for foreigners allowed to buy existing houses will be tripled, and taxes for foreigners who leave dwellings vacant doubled.
Plus, January saw the country's “golden visa” scheme halted.
NEW ZEALAND
Mortgage interest can once again be deducted from rental income for tax purposes and investors now need to hold a property for two years rather than 10 to avoid paying capital gains tax.
THE WEALTH REPORT THE WEALTH REPORT 34 35 HOME PHUKET 213 CAPE TOWN 196 BARBADOS 143 GOLD COAST 112 PROVENCE 129 BARCELONA 110 MARBELLA 101 LAKE COMO 91 CHAMONIX 63 QUINTA DO LAGO 67 ST TROPEZ 32 VERBIER 28 IBIZA 50 BAHAMAS 62 ASPEN 20 SECOND HOME LOCATION SQ M/US$1M CITY LOCATION SQ M/US$1M 100 SQ M MUMBAI 103 MADRID 96 DUBAI 91 MIAMI 60 TOKYO 64 SYDNEY 43 SHANGHAI 42 PARIS 40 NEW YORK 34 LOS ANGELES 38 SINGAPORE 32 HONG KONG 22 LONDON 33 GENEVA 34 MONACO 16 100 SQ M
HOME
THE WORLD
2024 ELECTIONS AROUND
In September 2023, a de facto ban on short-term lets came into effect. Partial home stays of less than 30 days remain permissible, if the property is registered with the Mayor’s Office and the host present throughout.
The year ahead
While markets have rallied, geopolitical uncertainty ensures the road ahead remains bumpy
for investors
Market conditions are better now than they were a year ago. Inflation appears to be largely under control and the question is when, not if, interest rates will be cut. Labour markets are solid, forced sellers are largely absent, constrained housebuilding has cushioned prices and pandemic savings have yet to run dry in some advanced economies.
But the geopolitical landscape is precarious. The lights are “absolutely flashing red,” in the words of the UK Foreign Secretary, with a spike in energy prices due to the escalation of conflicts a real possibility. In addition, GDP growth is likely to slow from the levels seen in 2023.
Add to this the biggest election year in history, China’s subpar growth, further trade fragmentation and the looming spectre of climate
change-induced disasters, and investors will need to work harder than ever to make informed and timely decisions.
WHERE’S HOT, WHERE’S NOT?
Auckland leads our prime price forecast, while Sydney is the frontrunner in our rental forecast for 2024. Prime price growth across the 25 cities tracked is forecast to reach 2.5%, up from 1.7% in 2023 with Mumbai, Dubai, Madrid and Sydney joining Auckland to complete the top five. Prime rents are moderating from their post-pandemic highs but a lack of stock in key cities will keep annual growth in positive figures for most advanced economies. Canada and New Zealand’s restrictions on foreign buyers will push demand towards the rental sector, while high mortgage costs, taxes for landlords and red tape will keep supply in check.
2024 OUTLOOK
1. Politics will usurp economics as the major downside risk for property markets in 2024.
2. Auckland leads our prime price forecast, while Sydney leads for rents.
3. Stock levels will be the key determinant of price and rental performance, with rate cuts, taxes and red tape influencing factors.

TOP THREE RISKS
Our global research teams share their insights on the key risks and opportunities facing their prime markets
1 2 3
Election resulting in policy change/ higher taxes
Climate risk Undersupply of luxury homes
TOP THREE OPPORTUNITIES
1 2 3
Relaxation of tax and property regulations
Property’s appeal as a means to diversify/ spread risk
Safe haven capital flight
If planning to purchase a new home, which location will it most likely be in? %
Other: 33%
Source: The Attitudes Survey
THE WEALTH REPORT 37 THE WEALTH REPORT 36
Prime price forecast Annual % change, 2024 Sources: Knight Frank Research, Douglas Elliman, Ken Corporation MUMBAI 5.5 DUBAI 5.0 SYDNEY 5.0 MADRID 5.0 STOCKHOLM 4.5 MIAMI 4.0 MELBOURNE 3.0 MONACO 3.0 ZURICH 2.5 LISBON 2.5 SEOUL 2.5 NEW YORK 2.0 VANCOUVER 2.0 PARIS 2.0 TOKYO 2.0 SHANGHAI 2.0 DUBLIN 0.5 GENEVA 0.5 HONG KONG 0.5 VIENNA 0.0 SINGAPORE -0.5 EDINBURGH -2.0 AUCKLAND 10.0 22% of UHNWIs plan to buy a home in 2024 Sources: Knight Frank Research, Douglas Elliman, Ken Corporation Prime rent forecast Annual % change, 2024 TORONTO 6.0 LONDON 5.5 NEW YORK 5.0 HONG KONG 4.0 MONACO 4.0 SINGAPORE 4.0 GENEVA 2.0 TOKYO 1.5 AUCKLAND 6.0 SYDNEY 12.0 HOME HOME Attitudes Survey 1. UK 17.7% 2. US 9.8% 3. FRANCE 7.2% 4. AUSTRALIA 5.6% 5. UAE 5.4% 6. SWITZERLAND 5.4% 7. SPAIN 4.5% 8. ITALY 4.0% 9. PORTUGAL 3.8% 10. INDIA 3.5% LONDON 1.0 LOS ANGELES 1.0
Source: Knight Frank Research
The big five
Kate Everett-Allen identifies the key themes set to influence prime property markets in the years ahead
Policy
Cited as both the biggest risk and opportunity for UHNWIs by our research teams this year, changing policy can dictate the fortunes of a market. From planning regulations to taxes, from restrictions on holiday rentals and foreign buyers to new visas and the quest for greater transparency, the global landscape is made up of multiple moving parts which influence the flow of wealth, and ultimately, market performance. As public debt escalates and housing affordability diminishes across advanced economies, policymakers are poised to scrutinise wealth and property even more, injecting another dimension into strategic considerations for UHNWIs.
AI
The buzz around artificial intelligence (AI) in real estate now transcends basic chatbots, and looks set to usher in a transformative era of structural change. Currently, the spotlight is on improving productivity in knowledge-centric roles – for example, streamlining mortgage assessments and valuations, and identifying sites for development.
But for the luxury residential sector, dominated as it is by heightened demand for personalised experiences, AI looks set to offer sophistication, customisation and efficiency, providing insights into client behaviour, preferred locations, favoured architects and developers, and lifestyle preferences.
Currency
Is the dollar past its peak? The world’s reserve currency hit a two-decade high in late 2022 against every other major currency and has since drifted downwards, eroding some of the currency advantage enjoyed by US dollar and dollar-pegged buyers when purchasing overseas in recent years.
The consensus is that the dollar will remain overvalued given the lack of any viable global alternative – but it may weaken. High levels of government debt, along with interest rate differentials as central banks start to pivot, could offer those investors considering a foothold in the US, or in dollar-pegged economies such as Dubai, Hong Kong, Barbados and the Bahamas, a potential chink of light.
Climate
Rising sea levels and extreme weather events such as heatwaves, droughts and wildfires are leading some UHNWIs to consider where they buy. Despite the escalating vulnerability of our environment, the luxury residential sector has been slow to embrace sustainable living and integrate green technologies en masse.
However, impending energy compliance regulations in advanced economies are poised to catalyse change. Landlords, facing bans or rent caps unless they significantly improve poorly rated properties, will see rental stock decline and sales inventories increase, unless institutional investors see an opportunity in acquiring this older stock.
Wellness
Wellness is becoming big business. Supercharged by the Covid-19 pandemic, the industry is now worth an estimated US$5.65 trillion – a trend which has not escaped the attention of luxury developers. By way of example, The Well, a new luxury residence in Miami, not only features a state-of-the-art fitness and wellness centre but has a team of holistic experts on hand for residents.
Moreover, yoga and meditation retreats are now ubiquitous in the top ski resorts, and off-grid locations in the Caribbean, Nordics and Asia are increasingly in demand. The race to provide ever more enticing amenities to meet the physical and spiritual needs of wealthy residents is well and truly on.
Ones to watch
We asked our global network for their pick of the property types and locations set to attract wealthy buyers in 2024
HIGH-END APARTMENTS IN FLORENCE

There is appetite for super-luxury homes due to growing demand from the global wealthy relocating here to take advantage of Italy’s flat tax regime. There isn’t enough stock of the right quality, so our tip for developers and investors is to target areas along the River Arno such as Lungarno Vespucci to the north or San Frediano to the west.
BILL THOMSON, CHAIR OF THE ITALIAN NETWORK

Head online to knightfrank.com/wealthreport to view the full 12 markets
CLASSIC PARISIAN APARTMENTS IN THE 7TH & 8TH ARRONDISSEMENTS WATERSIDE APARTMENTS IN ÖSTERMALM, STOCKHOLM

In 2024, architecturally-inspired residences with bespoke furnishings, yet classic in style, featuring views across the River Seine or the Eiffel Tower will be in high demand. This heightened interest will primarily be driven by our Chinese and US clients, as Paris takes centre stage ahead of the 2024 Olympic Games.
ALISON ASHBY, DIRECTOR, JUNOT FINE PROPERTIES
THE TOTAL PACKAGE, NEW YORK CITY INLAND COMMUNITIES IN DUBAI

In a city at the forefront of luxury living, global buyers want it all. Projects that meet their exacting standards will outperform, but it’s not all about location. There is a long tick list: a starchitect-designed home; a globally recognised brand; the full amenity offering; celebrity chefs in on-site restaurants; and a commitment to sustainability, all turn-key ready.
HUGH DIXON, KNIGHT FRANK PRIVATE OFFICE

With Dubai’s 65km coastline mostly built out, global UHNWIs are increasingly focused on securing homes with access to green space, paving the way for the creation of inland communities. Locations such as Al Barari, Tilal Al Ghaf, Jumeirah Islands and Jumeirah Golf Estates are already on our watchlist to be upgraded to prime status.
FAISAL DURRANI, HEAD OF RESEARCH, MENA

A leading contender in most quality-oflife rankings, the exclusive Östermalm district has seen prices dip 11% since their February 2022 peak. With interest rate cuts on the horizon, and the Swedish krona comparatively weak, further discounts are on offer for overseas buyers. The absence of any wealth tax or inheritance tax in Sweden further adds to its appeal.
JASON MANSFIELD, KNIGHT FRANK INTERNATIONAL
WILDERNESS RETREATS IN TASMANIA, AUSTRALIA

Prime values along Hobart’s Derwent River are up 142% over the past decade, although the city still offers great value, with prestige homes starting from A$1.2 million. Those seeking a better work/life balance and less exposure to climate risk are attracted by the opportunity to design a modern, sustainable home.
MICHELLE CIESIELSKI, HEAD OF RESIDENTIAL RESEARCH, AUSTRALIA
THE WEALTH REPORT 38 HOME THE WEALTH REPORT 39 HOME
Invest
Explore the trends and influences driving global investment and property markets
42 NAVIGATING THE RECOVERY
As commercial real estate rallies, private investors remain firmly in the driving seat
46 INSIDER KNOWLEDGE
Want to know where to put your money?
Knight Frank’s experts have the answers
50 IS ESG OVER?
As the spotlight falls on the wealth carbon footprint gap, it’s time to get ESG back on track
53 RENEWING REAL ESTATE
Our five REs set out a framework for delivering a more sustainable real estate sector
56 ARE YOU READY FOR AI?
For the clued-up investor, new technology offers unprecedented opportunities for wealth creation
58 GREEN DIRT
Could investing in farmland help tackle some of the world’s hottest issues – including climate change?
62 GEAR CHANGE
The ups and downs of luxury asset classes, as captured in our unique index


THE WEALTH REPORT 40 INVEST
Crowning glory – A gold and diamond crown ring once owned by Tupac Shakur sold at Sotheby’s Hip Hop auction in July for US$1 million – three times the estimate. Image courtesy of Sotheby’s 41
Navigating the recovery
Against a backdrop of global economic and geopolitical tensions, 2023 was a year of softer trading conditions for commercial real estate investment – but investors are positioning themselves for a recovery, argues Antonia Haralambous
Global commercial real estate (CRE) investment fell by 46% in 2023 to US$698 billion as investors grappled with elevated interest rates and higher debt costs. Much of the contraction in investment was due to a retrenchment among US investors. Outbound US investment declined by 52% year-on-year in 2023, as investors tried to reconcile elevated domestic debt and navigate the perception that conditions in the US CRE market reflected global real estate trends.
While global investment was relatively soft, private investors remained the most active global CRE buyers for the third consecutive year.
Private capital invested US$338 billion globally in 2023, equating to a 49% share of total investment, slightly up on 48% in 2022 and the highest share on record.
Although private investment in 2023 nearly halved on 2022 volumes, this was a smaller contraction than institutional and public investment, both falling by 53%. Meanwhile, investment from HNWIs in global CRE saw the smallest year-on-year decline at 19%.
The fact that private buyers, including HNWIs, were the most active in 2023 is perhaps unsurprising. This group is relatively well positioned to transact in a higher interest rate environment, as private
capital is typically less reliant on debt than other investors.
SECTORS IN DEMAND
Industrial and logistics was the most invested CRE sector for the first time on record, taking a quarter of all global investment at US$174 billion. While industrial and logistics, retail, hotel and seniors housing and care all increased their share of total investment in 2023, the office market fell from 25% in 2022 to 22%, and the living sector share contracted from 30% to 24%. All sectors recorded an
The who…
annual decline in total investment in 2023, with seniors housing and care (-28%) seeing the smallest decline.
However, the story was slightly different for private buyers in 2023. Living sectors were the most targeted by private capital, followed by industrial and logistics, and offices. For HNWIs, offices reclaimed its place as the top sector for investment having trailed living sector investment in 2022. Here, it is likely that HNWIs capitalised on reduced competition, potentially seeking trophy assets in a sector with a less timeintensive operational model.
The what…
To where…
Top cross-border CRE investment flows (US$bn)
PRIVATE INVESTORS
housing & care 10.6
THE WEALTH REPORT THE WEALTH REPORT 42 43 INVEST INVEST
Total global CRE investment in 2023 (US$bn) % CHANGE VS 2022 % CHANGE VS 10-YEAR LONG-TERM AVERAGE -53% -53% -2% -52% -63% 18% User/other 65.2 Institutional 221.4 Private 337.9 Public 73.1 -48% -24%
RCA, Knight Frank Research Sources: RCA, Knight Frank Research
Sources:
(US$bn) Industrial & logistics 174.3 Living 167.2 Office 152.7 Hotel 55.2 Retail 129.7 Seniors housing
care
ALL INVESTORS ALL INVESTORS Industrial & logistics 70.7 Living 100.0 Office 66.6 Hotel 30.9 Retail 59.1 Seniors
Global CRE investment by sector in 2023
&
18.4
-28% % CHANGE VS 2022 % CHANGE VS 10-YEAR LONG-TERM AVERAGE -57% -53% -32% -34% -40% -30% -37% -58% -32% -29% -9% -22% % CHANGE VS 2022 % CHANGE VS 10-YEAR LONG-TERM AVERAGE -36% -46% -44% -35% -59% 5% 12% -41% -23% -12% -31%
UK US Canada Germany Japan Chinese mainland Australia France Singapore Spain -28% -51% 49% -60% -16% -39% -58% -45% -12% -60% US 29.6 Japan 8.7 Chinese mainland 6.0 Canada 9.7 Germany 9.6 UK 20.3 Australia 5.7 Spain 5.7 France 5.3 Singapore 5.1 Germany US UK Singapore Spain Chinese mainland Netherlands Ireland Italy Japan -46% -22% -52% -25% -35% 266% -23% 26% -58% -16% Chinese mainland 1.1 Singapore 1.5 Spain 1.3 US 5.5 Germany 3.0 UK 2.8 Netherlands 1.1 Japan 0.9 Ireland 0.7 Italy 0.7 PRIVATE INVESTORS
% CHANGE VS 2022 % CHANGE VS 2022 Definitions PRIVATE: Companies whose control is in private hands and whose business is primarily geared towards operating, developing or investing in commercial real estate. HIGH NET WORTH (HNW): Private family wealth invested directly into commercial real estate.
From where…
Top
“For the first time in four years, a new sector has topped the investor wish list. The living sectors are the most in demand in 2024, with 14% of Attitudes Survey respondents looking to target the asset class”
WHO’S BEEN ACTIVE?
Investors from the US, Canada and Singapore accounted for just under half of all cross-border global CRE investment in 2023. However, of the top 10 global cross-border capital sources, the only investors to increase investment in 2023 were from UAE (+349%) and Japan (+156%). For Japanese capital, 2023 was a record year for cross-border investment at US$8 billion, with buyers taking
advantage of a significantly lower cost of domestic debt, a slower speed of transactions and a reduced global competition pool. In fact, Japanese investors were the fifth largest source of cross-border capital in 2023, their first ever appearance in the top 10.
Investors from France were the largest source of private cross-border capital in 2023, with US$3.1 billion invested. Private French capital mainly targeted European assets in 2024, particularly in Germany, Spain, Italy and the UK. Investors from the US dropped from pole position in 2022 to sixth in the top 10 sources of private cross-border capital in 2023, with investment moderating -72% year on year to US$1.3 billion. Meanwhile, cross-border capital from Spain was the largest source of HNWI investment in 2023, targeting CRE in the US, Ireland, the Netherlands and the UK.
London was the top city destination for total cross-border
were looking to invest directly in CRE in 2024, with investors from the Middle East (23%) and Asia (21%) likely to be the most active.
Top cities
Leading hubs for cross-border CRE investment flows in 2023 (US$bn)
WHAT WILL THEY BE TARGETING?
For the first time in four years, a new sector has topped the investor wish list. The living sectors are the most in demand in 2024, with 14% of Attitudes Survey respondents looking to target the asset class. Interest is strongest in Europe, the Middle East, North America and Asia. Healthcare is not far behind, with 13% of respondents interested in the asset class. However, intentions do not necessarily equate to transactions, due to factors including availability of stock, market size and competition. For HNWIs, the traditional sectors, including offices, retail and hotels, have usually been the most transacted over the past 10 years. More specialist sectors such as healthcare and student housing are often high on investors’ wish lists due to their strong rental growth prospects and counter-cyclical nature. However, in practice, some investors may hesitate to transact due to the specialised management and operational expertise required for these assets, alongside strict regulatory and compliance challenges.
investment in 2023, with US$7.6 billion invested. However, New York was at the top of the list for overseas private capital, surpassing London for the first time since 2016. For HNWIs, the 2023 target list looked slightly different, with Singapore, Berlin and Dublin the most invested urban centres.
LOOKING TO THE FUTURE
With interest rates expected to remain elevated globally into the second half of 2024, we anticipate private capital to remain active. Indeed, during previous times of dislocation, private capital has typically rotated back into CRE. Following the global financial crisis, the private buyer share of global CRE investment grew from 30% to 38% and in 2021, following the first year of Covid-19, its share grew to 45% from 39% pre-pandemic. We expect this trend to continue in 2024: 19% of respondents in our Attitudes Survey
Sectors in demand
If your clients are investing in commercial property in 2024, which sectors will they target?
(% share of all responses by sector)
Living sectors
land
centres 9%
THE WEALTH REPORT THE WEALTH REPORT 44 45 INVEST INVEST
(US$bn) 32.2 26.3 11.0 8.7 8.0 7.0 6.5 4.7 5.2 4.4 Sources: RCA, Knight Frank Research Source: The Wealth Report Attitudes Survey % CHANGE VS 2022 156% -8% -62% -18% -52% -33% -64% -73% 349% -42% ALL INVESTORS % CHANGE VS 2022 -5% 57% -43% 38% -31% -72% -34% 13% -50% 67% PRIVATE INVESTORS
cross-border sources of CRE investment
Development
Hotels
Life
Offices
Forestry
Real
Retail
Residential private rented sector 8% Seniors housing 3% Student housing 3% LIVING SECTOR SPLIT...
14% Healthcare 13% Education 11%
10% Data
Industrial & logistics 8%
& leisure 7% Farmland 6%
sciences 5%
5%
4%
estate debt 4%
3%
Sources: RCA, Knight Frank Research ALL INVESTORS London Singapore Toronto New York Paris Berlin Tokyo Los Angeles Melbourne Sydney 7.6 5.1 5.0 4.8 4.1 3.0 2.5 2.3 2.2 2.1 PRIVATE INVESTORS New York London Singapore Berlin Dublin Amsterdam Guangzhou Tokyo Los Angeles Shanghai 1.8 1.6 1.5 1.2 0.7 0.6 0.6 0.6 0.5 0.5 3.1 2.1 1.8 1.5 1.3 1.3 1.3 1.0 1.2 0.9
US
Germany US France Singapore Japan Chinese mainland Hong Kong SAR Spain Canada Hong Kong SAR Singapore Attitudes Survey
France
Germany UAE Switzerland Switzerland Japan UK Israel
Insider knowledge
How would Knight Frank experts invest in 2024? The Wealth Report finds out
JAMES FARRELL Head of Rural Consultancy
The opportunity to do well by doing good has never been clearer. News coverage of climate change, habitat degradation and violent weather events provides an almost daily reminder of how the world is changing around us. Roughly 55% of global GDP, an estimated US$58 trillion, is moderately or highly dependent on nature, according to a 2023 study by PwC and the World Economic Forum.
With that in mind, the best investment anyone can make in 2024 is in nature, the ecosystem and the economic prosperity that it underpins.
ED MANSEL LEWIS Head of Viticulture
The value of bare land suitable for vines in the south east of England has risen from £11,000 per acre to £20,000 per acre in eight years. This is still some way off prices in Champagne, where land often trades for more than €400,000 per acre. Perhaps this is why French wine producers including Taittinger and Pommery have bought land in the UK – in the expectation that land values will continue to climb. I would agree with them.
KATE EVERETT-ALLEN
Head of International and Country Research
Acquiring private rented stock in markets introducing new energy efficiency rules for landlords such as Paris and Amsterdam would be my pick for 2024. Tenant demand continues to outweigh supply in most developed markets due to affordability constraints and demographics.
Some landlords with multiple properties will relinquish their assets due to the cost of retrofitting multiple homes to meet the new energy efficiency rules. Properties that aren’t upgraded will face a rental ban although in most cases the rules do not apply to furnished holiday lets. Similar policies could start to emerge across Asia-Pacific and perhaps the US, depending how high up the political agenda ESG matters sit in the next administration.
ANNA WARD Associate, Residential Research
I’d invest into building new London lab space. The capital’s property market is struggling to provide biotech and life sciences entrepreneurs with the research space they need. Knight Frank data shows that demand for lab space in the capital stands at 974,500 sq ft, while availability is just 179,295 sq ft – less than a quarter of current requirements.
“From equities to art, the outlook for asset values is brighter. We expect investors to grow increasingly confident that they can secure returns that beat the cost of any mortgage debt they take on”
“ The best investment anyone can make in 2024 is in nature, the ecosystem and the economic prosperity that it underpins”
The surge in demand comes after life sciences firms in London secured £1.8 billion of venture capital investment last year. That helped spur a 60% rise in new company incorporations year-on-year.
WILLIAM MATTHEWS
Head of Commercial Research
It might seem a strange time to advocate for offices, but well-trodden arguments over occupancy and corporate demand are, at the very least, nuanced by geography and a host of local factors.
In a recent survey for our (Y)our Space research report, 56% of global corporates felt a hybrid workstyle was the future with only a tiny share taking a “remote first” approach. Meanwhile, rents for the best buildings are rising, partly because build cost inflation has severely curtailed new supply, and the somewhat indiscriminate move away from offices has left yields looking attractive on an historic basis. The sector is now a fertile hunting ground for mispriced assets – none more so than those comparatively rare poorquality buildings in good locations, which can be efficiently redeveloped to modern standards.
CHRISTINE LI
Head of Research, Asia-Pacific
In the next decade, trillions of dollars are expected to shift to the next generation in Asia, reshaping the investment and wealth management landscape. Around 70,000 HNWIs from Asia are poised to pass on approximately US$2.5 trillion in the next 10 years, surpassing the combined GDPs of South Korea and Taiwan, according to Euromoney People Intelligence.
This shift is already transforming the investing landscape, fuelled by a growing emphasis on sustainable
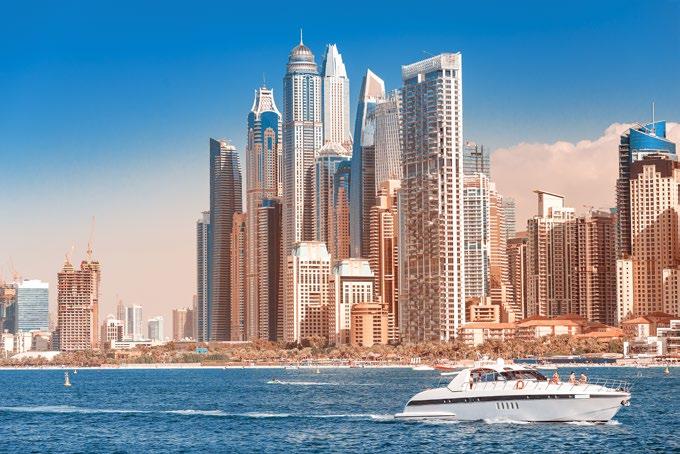
investing and ESG considerations. Traditional investments like art, wine or jewellery may give way to a preference for those with a more positive impact on society, such as contributing to food security, mitigating climate risk and healthcare.
FLORA HARLEY Head of ESG Research
Refurbishing office stock in central global cities like London, Paris, New York and Singapore is my pick for 2024. There is increasing demand for net zero-enabled buildings that support occupier wellbeing, yet supply doesn’t match up. Half of the world's 2,000 biggest listed companies have set a target to get to net zero emissions by 2050. There is also a huge need to repurpose offices across smaller towns and cities. This presents a fantastic opportunity to alleviate some of the worst aspects of the housing crisis, albeit to a limited degree.
WILL MCKINTOSH
Regional Head of Residential, MENA
Dubai is a good bet. The population is growing rapidly and there is a very limited supply of land and new projects.
Combine that with the fact that the city is now regarded as a truly global destination, and I think investors have a raft of opportunities for 2024 and beyond. While we will see normal market cycles, the “boom and bust” that we have seen previously presents less of a risk. Residential would be my pick, but there is also a lack of supply in office space and investment grade assets – hotel occupancy also remains very buoyant, for example.
ANDREW SHIRLEY Head of Rural Research
Echoing James Farrell, I would be looking very carefully at farmland or forestry opportunities that can offer ultra-high-integrity and reputably
certified nature-based solutions that are able to withstand the scrutiny of even the most forensic “greenwashing” tests. Ideally, they would also provide a commercial income in addition to any carbon or biodiversity credits.
SIMON GAMMON
Managing Partner, Knight Frank Finance
Inflation has turned a corner and debt costs will fall as the year progresses. We will reach a point at which debt becomes a viable part of any investment strategy once again. From equities to art, the outlook for asset values is brighter. We expect investors to grow increasingly confident that they can secure returns that beat the cost of any mortgage debt they take on. For 2024, I would seek to utilise finance to free up liquid capital, positioning myself to capitalise on new opportunities the moment they emerge.
THE WEALTH REPORT THE WEALTH REPORT 46 47 INVEST INVEST
“Despite various headwinds, Europe is predicted to remain the largest destination for global cross-border capital in 2024, with industrial and residential expected to be the most invested sectors”
for rental accommodation while specifically targeting the 25–34 age bracket. Vacancy rates are close to 1% nationally and younger renters in the major cities are seeking new options besides the more established student housing and build-to-rent markets, which target younger and older age groups respectively.
STEPHEN SPRINGHAM Partner, Head of UK Markets
JUDITH FISCHER Associate, European Research
BEN BURSTON
Chief Economist, Australia
Investors are seeking greater diversification and the living sectors are at the front of the queue. While institutional investors are predominantly focused on largescale investment in build-to-rent, private investors have an opportunity to gain exposure to living sectors through the development of co-living assets. That should allow them to tap into surging underlying demand
Supermarkets are my pick for 2024, but only those that meet certain criteria spanning turnover, sales density, local population density and the level of competition from other operators.
The right supermarket investments will deliver stable, low-risk, longterm income comfortably above all commercial real estate averages. Annual total returns are greater than 7% and annual income returns are north of 5%. Supermarkets are in vogue with investors, but there is considerable merit in straying from the herd and going against the grain of common investment criteria.

Despite various headwinds, Europe is predicted to remain the largest destination for global cross-border capital in 2024, with industrial and residential expected to be the most invested sectors. There will likely be some significant pockets of resilience. In Spain, for example, we expect the hotel sector to see inbound investment, supported by above-average economic growth. In the office sector, pricing opportunities across Europe from shifting yields are increasing. Prime office yields in cities such as Munich, Dublin, Berlin and Frankfurt have expanded by more than 100 basis points from their recent lows.
HUGH DIXON Partner, Head of Private Office New York
I would recommend spreading the investment across different property types and geographic locations to minimise risk. Explore emerging markets with potential for growth and development, while ensuring you have a foothold in stable and established markets with a history of steady appreciation.
We are seeing real value in commercial markets across multiple locations, specifically New York and London. Residential properties, including apartments or single-family homes, can provide a steady income stream through rent. Our UHNWI clients are seeking unique assets in this space which are hard to replicate. I would favour areas with a growing technology sector, which often experience increased demand for real estate. This is the case in Miami, with Amazon and other big tech companies looking at Florida. Additionally, the Middle East is driving tech-related investment associated with large projects such as NEOM in Saudi Arabia.
ERIN VAN TUIL Partner, Head of Residential, Australia
The success of Crown Residences at One Barangaroo, Australia’s first fully integrated hospitality branded residences, made it clear that
service provision is still an aspect of apartment living that is yet to be fully harnessed by Australian developers. I see a strong opportunity for forward-thinking developers and luxury hoteliers to expand into this sector to deliver more hospitalitybranded residences.
Crown Residences at One Barangaroo is the only truly superprime building in Sydney, if not Australia. When you consider that alongside the considerable growth in Australian UHNWIs we’re likely to see over the coming years, super-prime developments that offer exceptional design, location and service, albeit perhaps not linked to a hotel brand, would also be a sector I expect will perform strongly.
VICTORIA ORMOND
Partner, Capital Markets Research
Thinner competition is creating opportunities for investors across the risk spectrum, especially for those not reliant on debt. This ranges from opportunities in sectors with structural tailwinds, including “beds, sheds, eds and meds”. Other opportunities are likely to arise from some sectors being over-sold, including – selectively for the right building in the right location –offices. This creates opportunity for contrarian investors. There are likely to be liquid, trophy assets coming to the market, as some investors look to raise capital. At the other end of the spectrum, selective secondary and tertiary assets with good bones and the right location, but undergoing significant repricing, will create opportunities for repurposing and refurbishment.
DAVID GOATMAN
Global Head of Energy and Sustainability
As we move towards greater electrification in all areas of our lives, property projects and land with substantial grid connectivity, both import and export, will become increasingly valuable. I would seek to develop light industrial and logistics with co-located renewables and a super-charging hub for fleet and trucks. Demand for this co-located approach will grow substantially over the next few years.

Interest rates are predicted to fall swiftly and the forward curve pricing three- and five-year debt is now more than 100 basis points lower than only a few months ago. However, with inflation still sticky and projected CAGRs topping 4% over the same period, there is once more a narrow window of negative real rates.
This will provide a compelling opportunity for those nimble enough to find assets that directly benefit from inflation-linked rental growth. As forced sellers continue to provide mis-priced opportunities, it’s a market that requires high conviction underwriting – those who can access these opportunities with attractive supply/demand fundamentals and apply requisite ESG future-proofing will generate outperformance.
We’re seeing increasing numbers of people opt for another base in European gateway cities. A lack of suitable product has weighed on activity in several markets, but developers have responded and choice is now improving.
For anybody looking to put money into an apartment to rent out, or visit with family, that is likely to benefit from strong growth in capital values, I would invest in Italy. The tax regime allowing non-domiciled Italian residents to pay an annual flat tax of €100,000 on foreign income has been hugely popular. Milan gives you the international airport. Lake Como gives you the lifestyle with the connectivity.
Florence is a year-round city, both from a business and cultural perspective. Venice, too, gives you waterfront living, and it’s a quick nip into Cortina for some fresh mountain air.
THE WEALTH REPORT THE WEALTH REPORT 48 49 INVEST INVEST
JOSEPHINE JONES Partner, Knight Frank Capital Advisory
ALASDAIR PRITCHARD Partner, Private Office
Is ESG over?
Once the corporate buzz word, ESG has slipped out of focus of late. Flora Harley makes the case for bringing it back into the spotlight – and sets out a new framework for action
Everything Everywhere All at Once is both the title of the winner of the 2023 Oscar for Best Movie, and a neat summary of the current state of ESG. Writing in The Wealth Report last year, Liam Bailey cited Hester Peirce, Commissioner on the US Securities and Exchange Commission, who in a speech as far back as 2020 described ESG as “broad enough to mean just about anything to anyone.”
The term, first coined in 2005 by the UN, was initially intended as a framework for measuring processes and outputs to drive transparency and accountability, ultimately ensuring that we achieve equitable sustainability. But somewhere along the line it’s got lost in translation.
In a year which saw the impacts of climate change writ large as we entered what one research report described as “uncharted climate territory”,1 the implications of this lack of focus have never been clearer. Amid growing politicisation and ever more negative coverage, how can we get ESG back on track, and convince UHNWIs – whose actions have disproportionate impact, and are also subject to most scrutiny – that they can make a difference while still pursuing their wealth goals?
Defining some broad focus areas – the REs to REimagine ESG, if you will – may help crystallise thinking and counter scepticism with a dose of tangible action. Here are five to get us started: REduce energy consumption, create more REnewable energy, REuse what we have, REstore nature and REengage stakeholders (see page 53 for more on what these might mean in practice).
“A report by Oxfam and the Stockholm Environment Institute states that the richest 1% of the global population is responsible for more emissions than the poorest 66%”
It’s important too to remember this is not about striving to tackle everything, everywhere all at once. As Voltaire said, “The perfect is the enemy of the good”. Action, however incremental, is always better than inaction and, when compounded, stands to make a real difference.
MIND THE GAP
Reducing emissions is the thread that runs through the five REs of ESG. As the impact of climate change intensifies, so does the spotlight on the wealth carbon footprint gap, whereby more prosperous nations, and indeed individuals, play an outsized role in emissions while developing countries bear the brunt of climate change.
A report by Oxfam and the Stockholm Environment Institute states that the richest 1% of the global population is responsible for more emissions than the poorest 66%. This gap is exacerbated as individuals create vast emissions, yet can shelter from climate change’s most damaging effects due to mobility and ability to pay.
65% of UHNWIs are actively trying to reduce their personal carbon footprint
1 in 5
Aside from their philanthropic endeavours, is there any evidence that wealthy individuals are endeavouring to change their habits and close the gap? In short, yes. According to our Attitudes Survey, almost two-thirds of UHNWIs are attempting to reduce their carbon footprint, while a fifth are trying to measure it.
“Wealthy families and UHNWIs have an increasing commitment to environmental responsibility,” notes Maryann Bell of Wingspan, a business designed to maximise family unity, business success and societal impact. She sees them “shifting lifestyles” but points out that this “actively requires intentionality”. Europeans are the most active, with three-quarters seeking to reduce their emissions, while those based in the Middle East are the least engaged, with 58% seeking cuts.
“The IEA predicts a yearly growth rate of 36% for EVs and this rapid adoption will affect property owners and investors as charging facilities are increasingly sought in homes, offices and retail locations”
CHANGING LIFESTYLES
So what actions are UNHWIs actually taking?
Let’s start with transport, where some 40% of UHNWIs are switching to electric vehicles (EVs). The International Energy Agency (IEA) predicts a yearly growth rate of 36% for EVs, and this rapid adoption will affect property owners and investors as charging facilities are increasingly sought in homes, offices and retail locations.
But not all transport is made equal: just 10% of UHNWIs plan to reduce air travel, while 14% intend to cut down on private jet use. “This is the hardest change as it has an efficiency and time element,” notes Bell. “But we are seeing a lot more conversations about offsetting that travel.” Change at an industry level is also making headway, with the first commercial transatlantic flight using reportedly sustainable aviation fuel taking off in November 2023.
Investment decisions and business operations are increasingly seen as tools for reducing emissions, with around a quarter of UHNWIs screening potential investments against ESG criteria. Wider adoption of ESG screening could mean more capital being directed to sustainable activities – and greater scrutiny over how businesses impact the planet. Reflecting this,

THE WEALTH REPORT THE WEALTH REPORT 50 51 INVEST INVEST
UHNWIs are attempting to measure carbon emissions
https://academic.oup.com/bioscience/article/73/12/841/7319571
Renewing real estate
Taking strides
Proportion of UHNWIs taking the following actions to reduce their carbon emissions
Shifting priorities
The most popular changes to lower emissions, ranked by % of UHNWIs doing each
30% of UHNWIs are reducing the carbon footprint of their business operations. While family-run businesses often do not require outside capital and therefore have limited accountability mandates, ESG can still be business-critical. “Family businesses encapsulate and share family values,” says Bell. “Environmental and social responsibility is at the forefront of minds and being recognised and communicated as part of those values.”
Two of the top three actions for reducing emissions were improving the energy efficiency of homes and investment property. Looking ahead, we can expect more attention to be paid to lifestyle externalities and the carbon wealth gap. In a more transparent digital world, Bell
points out, “there is no hiding”. Action – or lack of it – becomes more visible, and accountability more broad-based. We could also see governmental action: in January, Switzerland’s Young Socialists collected signatures for a national vote on a new tax on the wealthy to cover climate change costs.
Wealthy individuals will need to identify their sustainability goals, which are being driven particularly by the younger generations (see page 14 for more on this), and implement adjustments across all aspects of their lives to deliver these. As Bell muses, “it’s being elevated in the conversation, and whilst they may not be as good as they can be, they are trying and making active choices.”
Real estate is pivotal to the delivery of our five REs to REimagine ESG. Flora Harley looks at how UHNWIs view ESG in property – and the key considerations for the future
Real estate is a critical lever for UHNWIs in pursuing their sustainability goals. With the built environment responsible for 40% of global emissions, a herculean effort will be required to reach net zero. While real estate is linked to all five of our REs of ESG, here we focus on three, exploring how UHNWIs are seizing opportunities in these spaces.
RE 1: REDUCING ENERGY CONSUMPTION
What’s it all about?
Not only will measures to reduce consumption and increase efficiency cut energy costs and emissions, reduced demand is vital to enabling greater electrification of heating, adoption of EVs and support for future infrastructure. There may also be additional rewards for investors. Our previous research has identified a sales premium for greenrated buildings of up to 18% and a rental premium of up to 12% due to the unwavering demand for “best in class” assets, dependent on location, which still outstrips supply.
How engaged are UHNWIs?
While improving energy efficiency in their homes and investment property is a top priority, UHNWIs may lack urgency compared with other investment actors. Our 2023 survey of 45 pan-European property investors found that more than threequarters were looking to improve their existing assets compared with just over a third of UHNWIs. However, the spectre of more stringent energy efficiency minimums and demand from occupiers means that UHNWIs too will have to bring buildings in line in the near term.
There is a broader trend of retrofitting and refurbishment. Just over a fifth of UHNWIs want to acquire and upgrade assets with weaker ESG credentials to upgrade or reposition, while almost 60% of the pan-European property investors surveyed are actively seeking poor-performing assets to improve/upgrade. However, retrofit is not for everyone. The predominant ESG investment strategy for UHNWIs has the potential to carry a lower risk profile, with 29% opting to invest in the most sustainable/prime assets.

Shaping an ESG strategy
Proportion of UHNWIs following each ESG strategy when investing in commercial real estate
THE WEALTH REPORT THE WEALTH REPORT 52 53 INVEST INVEST
Source: The Wealth Report Attitudes Survey Note: Respondents could choose multiple options 29% 27% 23% 21% 20% 19% Attitudes Survey
Switching to electric vehicles 40% Improving the energy efficiency of their investment property 34% Source: The Wealth Report Attitudes Survey Attitudes Survey Improving the energy efficiency of their homes 34% Reducing the carbon footprint of business operations 30% ESG screening of investments 24% Investing in nature-based solutions 21% Owning fewer homes 14% Reducing private jet travel (for those who fly private) 14% Reducing personal vehicle ownership 10% Reducing air travel 10% AFRICA ASIA AUSTRALASIA EUROPE LATIN AMERICA MIDDLE EAST NORTH AMERICA Only invest in the most sustainable/prime assets Invest in renewable energy projects Sell poor ESG-performing assets Acquire and upgrade assets with weak ESG credentials Acquire and reposition (change of use) assets with weak ESG credentials Invest in carbon sequestration opportunities through land acquisition 2 3 6 8 1 4 7 10 5 9 7 6 5 4 2 3 1 8 10 9 7 8 5 4 2 1 3 6 9 10 5 7 6 3 4 2 1 8 9 10 6 8 5 4 1 2 3 7 9 10 6 8 5 4 1 2 3 7 9 10 6 7 5 4 1 3 2 8 10 9
What should be the focus?
Energy efficiency ratings (such as Energy Performance Certificates or EPCs) are the clearest signal for UHNWIs, with 60% assessing property acquisitions against them. For the broader property investor market, some three-quarters of investors have a minimum certification requirement when acquiring new investment properties.
Interest in green/sustainable certifications such as BREEAM, LEED, NABERS and Green Mark is growing, with 46% citing this as a consideration, up from 25% last year. When undertaking improvements, investors must consider the requirements of occupiers and future investors, including the need for data to show how buildings are actually being used.
Thanks to the inexorable rise of the EV, 39% now look for EV charging when assessing a building for acquisition, up from 25% last year. Furthermore, a quarter are assessing provision of amenities, compared with the 9% seeking cycle facilities in our 2023 report. Social and wellbeing aspects will come to the fore as more actors come to grips with the E side – indeed, the more forward-thinking are already making these areas a priority.
Efficiency is key
“Interest in green/ sustainable certifications is growing, with 46% citing this as a consideration, up from 25% last year”
RE 2: RENEWABLE ENERGY CAPACITY
What’s it all about?
Governments globally are offering investment incentives and tax breaks. According to the IEA, some US$310 billion has been committed to lowcarbon electricity, with more than US$2.2 trillion for all energy spending. For leased investment properties, the provision of stabilised, zero-carbon power could be a draw, providing more predictable energy costs and a way for occupiers to reach their own net zero goals.
How engaged are UHNWIs?
More than a quarter of UHNWIs are planning to invest in renewable energy projects. The greatest appetite is among Europeans with 28%, followed by Asian UHNWIs with just over 27%. Others are not far behind, with 26% of North American UHNWIs pursuing this strategy.
What should be the focus?
Rooftop solar solutions can reduce or eliminate energy costs, lower emissions, potentially provide ancillary income and, particularly for investment property, increase capital value. Electricity grids globally need upgrades; on-site power
Proportion of UHNWIs using ESG-related criteria to assess property acquisitions
Renewable power source (e.g. solar panels)
48%
Green/ sustainable certifications (e.g. BREEAM, LEED, DGNB, Green Mark, NABERS)
46%
EV charging points
39% Impact on nature and biodiversity (e.g. green roofs/space)
32%
Impact on wider community (e.g. community facilities, open space/cafés) 26%
Amenity-rich assets (e.g. cycle facilities, wellbeing space)

generation and storage offer security of supply. For landowners, there are broader opportunities for ground-mounted solar and battery projects. “We have seen a number of UHNWIs seeking ways of using their land for renewable opportunities to diversify income as well as for sustainability objectives,” says David Goatman, Global Head of Energy and Sustainability at Knight Frank. “In addition, the market has witnessed sizeable rental growth of 10–20% per annum in recent years.”
RE 3: RESTORING NATURE
What’s it all about?
Nature is in the spotlight following the Global Biodiversity Framework agreement in December 2022 and the release of the Taskforce for Naturerelated Financial Disclosures (TNFD) Framework in September 2023. Half of global GDP depends on nature in some way, but the benefits extend to include health, food production and emissions reduction, for example through carbon capture.
How engaged are UHNWIs?
Wealthy individuals are seeking opportunities to lower their emissions and secure returns, with 21% investing in nature-based solutions and 19% in carbon sequestration opportunities through land acquisition. Previous editions of The Wealth Report have looked at how UHNWIs are rewilding or protecting marine habitats. With the markets for nature evolving, be that biodiversity credits or carbon credits, the appetite for such projects looks likely to increase.
“The market [for renewable projects] has witnessed sizeable rental growth of 10–20% per annum in recent years”
What should be the focus?
Almost a third of UHNWIs assess a building’s impact on nature and biodiversity before acquisition. This trend is likely to build: in the UK, for example, new developments now require a minimum of 10% net biodiversity gain. The burgeoning market for “nature credits” presents an opportunity for private investors – albeit there is a need for rigorous attention to verifiable benefits to avoid any risk of “greenwashing”.
WHERE TECH MEETS REAL ESTATE
Miguel Nigorra, partner and Head of Europe at Fifth Wall, on emerging trends in the growing arena of property technology (proptech)
Within the three macro trends where we see opportunities in the built world – companies aiming to increase ancillary revenue, delivering solutions to reduce operations expenditure, and future-proofing assets – we divide the energy retrofitting space into five verticals: data collection, retrofit assessment, financing, installation and reporting.
Plenty is happening across all five, but the most impactful today are the second and the third, with capital expenditure (capex) increasingly important to generate additional returns. While a significant amount of energy consumption data is being harvested, it is not being acted upon. There is real innovation in taking that data, benchmarking portfolios and delivering retrofit plans. Software solutions can provide accurate payback periods and return on investment for different interventions. Already evident in the US and increasingly in Europe is the shortage of labour to perform capex retrofits, pointing to a need for labour optimisation, retraining and upskilling, and the development of platforms to facilitate this.
When it comes to financing the green retrofitting challenge, there is a massive gap and an opportunity. Companies have solutions for channelling capital towards retrofit and garnering better returns, but this will vary by stage of investment and the parties involved. For example, heat pump installers do not necessarily require venture capital funding, but debt facilities to front-load equipment purchases. The average household might not have the cash or may need a push to make decisions once incentives get eliminated, and there are multiple models emerging – from zero upfront capex solutions to leasing or saving agreements – to address the issue of how retail investors will finance asset transformations in the space.
Fifth Wall With
THE WEALTH REPORT THE WEALTH REPORT 54 55 INVEST INVEST
Attitudes Survey
Source: The Wealth Report
Energy Efficiency Rating (e.g. EPC)
25%
61% Attitudes Survey
around US$3 billion under management, Fifth Wall is the world’s largest asset manager focused on future-proofing and decarbonising the built world.
Are you ready for AI?
Artificial intelligence may deliver more than we bargained for, argues Ian McGuinness, Knight Frank’s Head of Research Analytics. So how can investors position themselves to reap the rewards?
Pick any successful real estate developer from a previous generation and try to put your finger on what made them successful.
Whoever you’re thinking about, their success was almost certainly heavily skewed towards who they knew, which in turn dictated how they found the best sites and accessed the finance to build them out.
Success in this industry has always been about insider knowledge. That’s why it’s so exciting that we are at the beginning of a revolution in artificial intelligence (AI) – one that will enable us to make sense of quantities of information that would have seemed impossible only a few years ago.
Indeed, our expanding AI-driven data processing capabilities will result in the largest improvement to productivity since the arrival of the internet, saving the average worker more than 100 hours a year, according to Google. In the UK alone, the company estimates that AI-powered innovation is expected to create
£400bn
more than £400 billion in economic value by 2030. GDP is expected to be more than 10% higher over the same period than it otherwise would have been, according to PwC.
EARLY ADOPTERS
Those investors who engage with AI early stand to command the largest slice of those gains. In the property sector in particular, rapidly improving technology offers a once-in-a-generation opportunity to make money.
But first, some terminology. The explosion in popularity of large language models such as Open AI’s ChatGPT can make it appear as though AI only arrived in 2023, but the natural language processing (NLP) technology that underpins these chatbots has been with us for several years. The beauty of ChatGPT was its simple interface that enabled hundreds of millions of people to get their first taste of what AI might offer.
NLP enables us to extract value from huge amounts of unstructured text. Some readers of The Wealth Report might have experienced the frustration of manually moving data from a PDF into a spreadsheet so it can be manipulated and mined for insights. AI automates that process on an enormous scale. These models can put words into context and draw inferences in a manner that the world is only just beginning to understand.
“Investors who engage with AI early stand to command the largest slice of those gains. In the property sector, rapidly improving technology offers a once-in-a-generation opportunity to make money”
VISION OF THE FUTURE
We began experimenting with NLP four years ago by turning it loose on planning databases. It immediately became apparent that there were troves of information in the thickets of commentary added by planners that would be impossible to compile manually. We were able to track how businesses across the country were adapting to the Covid-19 pandemic by changing the use of properties, for example.
It was immediately clear that NLP could be used most profitably to find sites, particularly when paired with other techniques. The Knight Frank Research Analytics Team has deep expertise across data manipulation, analysis and visualisation. We view AI as a chain of processes that includes language processing but also spans machine vision, classification and learning techniques that enable us to address data gaps and make cleareyed predictions.
If you could take a walk with me through prime central London right now, for example, I could show you every available development site and explain their positioning relative to lifestyle elements such as the highest performing schools, fine dining establishments and private members’ clubs. I could also point out how many wealthy individuals live nearby, their property preferences, plus how much they have to spend. With AI we can do it all over coffee at Knight Frank’s HQ.
LOCAL INTELLIGENCE
These technologies get more interesting when they are applied to more complex problems, particularly during periods of elevated borrowing costs. The financial viability of retrofitting commercial buildings

to achieve higher BREEAM or EPC ratings varies depending on underlying values or rents. By feeding our models with the relevant data, we can produce accurate contour lines over a vast area that display exactly where investing is most likely to generate the best returns.
Seniors housing is another sector for which development viability turns on dozens of factors. People over 60 tend to purchase property only within three miles of where they live, so any feasible development site must have the depth of market nearby. Our models account for the 20% equity release that most movers in that demographic seek to lock in. Developers come to us for highly localised answers as to where it is feasible to start digging, but at the touch of a button we can apply our criteria to the entire country, at times providing hundreds of suitable sites.
One of the many examples of scalability was our study of car park land for officials at the Department for Levelling Up, Housing and Communities who wanted to find out whether any public sector-owned
car parks could be put to more valuable uses, such as retail or residential. We studied more than 30,000 car parks and found that, while they were well served by public transport, almost 70% didn’t appear to support a retail centre. Considering land values and redevelopment potential, we identified enough land to support more than 100,000 new homes, all while maintaining car parking services that are vital in supporting our high streets.
NEW HEIGHTS
Data is rapidly proliferating, and how real estate investors manage so much of it is now among their biggest challenges. AI will help capture “lightning in a bottle” opportunities, because only its computational power can fully resolve and scale the myriad physical, socioeconomic and environmental conditions underpinning success
NLP, computer vision and machine learning techniques will all play increasingly prominent roles, but they are still best combined with the relationship-building and foresight
“ We view AI as a chain of processes that includes language processing but also spans machine vision, classification and learning techniques that enable us to address data gaps and make clear-eyed predictions”
that have been utilised by successful developers for decades.
The abundance of information fuels the potential for a generation of property investors to achieve new heights – if they can bring fresh perspectives and discern the signals within the noise. Returns will increasingly correlate with the quality of the data and interpretation you have access to. Success is still about “insider knowledge”; but that term no longer means what it used to.
THE WEALTH REPORT THE WEALTH REPORT 56 57
estimated boost to economic value from AI-powered innovation in the UK by 2030
Green dirt
FHow is the burgeoning interest in nature-based solutions affecting farmland markets around the world? With the help of Knight Frank’s global network of agricultural experts, Andrew Shirley, our Head of Rural Research, does some digging eeding the world is still the number one reason to invest in farmland, according to this year’s Attitudes Survey; but saving the environment is the second most popular driver.
Almost half of respondents picked food production as a good rationale for acquiring agricultural property, while just over 40% felt that environmental benefits meant farmland warranted some kind of portfolio allocation.
Interestingly, though, the results reveal mixed feelings about how those environmental benefits might be delivered. Given the current focus of governments and NGOs on the ability of woodland and forests to mitigate climate change, it is surprising that only a quarter of our respondents logged planting trees as a reason to invest. Harvesting income from carbon credits, which are also grabbing headlines at the moment, piqued the interest of just 30%.
These results are perhaps to be expected. Even in terms of vanilla food production, farmland is still often considered to be very much an alternative class by most fund managers, including those who specialise in real estate. This despite it accounting for almost 5 billion hectares, or around 40%, of global landmass.
However, with investment funds increasingly preoccupied with the likes of ESG and net zero, the ability of farmland to offer nature-based solutions to some of the world’s hottest issues – including climate change – is beginning to attract more attention.
There is plenty of scope for this to happen. According to the International Panel of Climate Change, agriculture, forestry and change of land use account for as much as 25% of humaninduced greenhouse gas emissions. In particular, agriculture is one of the main sources of emitted methane and nitrous oxide.
“We are seeing a new range of investors who’ve never looked at farmland before, but where somebody in the business has said they should be doing something around natural capital,” says Nick Tapp of Craigmore

Sustainables, an investment manager
specialising in New Zealand farms and forestry.
According to analysis by Agri Investor, the amount of capital raising activity for straight agri-food and forestry funds slumped to just US$1.4 billion in the first half of 2023, the lowest six-month allocation since 2011. Conversely, the amount earmarked for climate-related funds had hit more than US$30 billion by Q3, says climate economy tracker CTVC.
“The ability of farmland to offer nature-based solutions to some of the world’s hottest issues –including climate change – is beginning to attract more attention”
A good chunk of that could be targeted at farmland-based schemes, such as tree planting, regenerative agriculture or carbon credit schemes. As Tapp points out, though, larger funds favour scale, simplicity and diversification, which can be hard to deliver via relatively complex assets such as farmland and natural capital. “Some proposals are frankly bonkers and, unless investors invent new markets for trading the carbon or natural capital they’ve created, they are very likely to fail,” he says, “and that would be a shame for what should be a really important component of a traditional asset class.”
As one carbon credit giant discovered last year, greenwashing allegations are another pitfall. A press investigation claimed that 90% of “avoided rainforest deforestation” credits were essentially worthless – claims which have been strongly refuted by the industry.
Polluting businesses can buy credits derived either from tree or soil carbon sequestration to offset their own carbon emissions, but this nascent voluntary market is often referred to as a wild west. First, there is a lack of regulation and transparency, with questions being asked about the different methodologies used to measure carbon sequestration by trees and soil. Second, the whole concept, even morality, of offsetting is coming under increasing scrutiny. A new piece of EU legislation, for example, means that businesses will essentially be banned from labelling their products as “climate neutral” or “carbon neutral” if they rely on offsetting to balance their emissions. “Carbon neutral claims are greenwashing, plain and simple,” says Ursula Pachl, the deputy director of EU consumer advocate body BEUC.
James Cairns, a regenerative agriculture investment specialist at Lombard Odier Investment Managers, agrees that farmland and forestry funds need to look carefully at the rationale behind their investments. “Rather than relying on something volatile like carbon credits to help deliver a return, we think it can make more sense to try to disrupt existing value chains and price the provision of nature and climate services directly into the value of the crops you are growing.”
Rare breed –The 3,800-hectare Rothbury Estate in Northumberland is one of the few largescale natural capital opportunities to come to the market in the UK. It is priced at £35 million and is attracting significant interest from environmentally focused buyers
Markets that are either non-voluntary, such as the New Zealand Emission Trading Scheme and England’s newly introduced biodiversity net gain rules for property developers, or voluntary but government regulated like the UK’s Woodland Carbon and Peatland Codes, offer investors more certainty, but they can still lack the scale and ease of management beloved by bigger funds.
VALUING NATURAL CAPITAL
Against this backdrop of eco enthusiasm, how have farmland markets been performing? And is natural capital being factored into valuations?
“There is still a lot of money looking at African farmland, but tapping into natural capital markets has not been a big topic of conversation,” says Susan Turner, Managing Director of Knight Frank South Africa and rural valuations expert. “Some funds and owners of conservation properties are looking into the potential of carbon credits and practices to reduce agriculture’s environmental footprint. Currently, I am not including it in my valuations –natural capital by its nature does not have a direct market value and measuring its impact is complex. But we will need to consider it in the future.”
But that’s not to say farming sustainably isn’t a hot topic in South Africa. “It’s something farmers are increasingly being told they must do to supply large retailers and processers here,” Turner says.
THE WEALTH REPORT THE WEALTH REPORT 58 59 INVEST INVEST
In the UK it’s a mixed picture. “There are definitely a lot of potential institutional and private buyers out there who are driven by various environmental concerns,” agrees Knight Frank’s Head of Farm and Estate Sales Will Matthews. “But I wouldn’t say they are buying a huge amount of farmland. Average values in England rose by 7% in 2023, but natural capital certainly wasn’t the biggest influence.
“When we put a property up for sale now we are definitely highlighting its natural capital opportunities, whether that’s tree planting or nature restoration, but it’s not something we are currently adding a premium for. It’s just too hard to value at the moment,” he explains.
But north of the border in Scotland, farms expert Tom Stewart-Moore says there is evidence that the carbon market has pushed up the value of certain land types. “A lot of poorer quality grazing land in the uplands has been bought by investors looking to plant trees and claim carbon credits under the Woodland Carbon Code.”
According to Knight Frank’s Scottish Farmland Index, this type of land has seen the strongest price growth over the past two decades with values rising by over 900%, compared with around 300% for good arable soil. Prices, however, have started to fall back, says Stewart-Moore. “The cost of land, planning issues, higher borrowing costs, a drop in timber values and changes to the Woodland Carbon Code have all made it more difficult to make the numbers stack up.”
A lack of availability, coupled with the tax planning benefits of farmland ownership, tends to insulate the UK’s farmland market from some of the economic fundamentals such as lower commodity prices, cost inflation and higher interest rates that might overwise put pressure on values. But elsewhere in the world values are starting to slip or flatline.
“The market has been a lot more subdued over the past 12 months,” says Nick Hawken,
Hay day
property
Head of Rural Property at Knight Frank’s New Zealand associate Bayleys. “It’s probably the slowest I’ve seen it since the global financial crisis.” Much higher interest rates and a drop in commodity prices are to blame, he says. “Farmers were fighting to break even this season, but there remain good buying opportunities throughout all our rural sectors.”
As in Scotland, large-scale forest creation, abetted by the country’s emissions trading scheme, had been driving up the value of some pastureland, but the government has now been accused by its own Climate Change Commission of relying too heavily on tree-planting to hit its net zero targets instead of actually cutting emissions.
There had also been hopes that the recent election would lead to the relaxation of New Zealand’s strict overseas investment rules, which could open up the market to more environmental investors, points out Hawken, but the politics of coalition government means this has not been a priority. “But if you are an expat Kiwi who wants to come home and farm, or a farmer who wants to emigrate here for the quality of life, now is a great time to buy,” he reckons.
INFLECTION POINT
Across the Tasman Sea, farmland values in Australia also seem to have reached an inflection point after a period of strong growth. Average values across the country rose by just 0.1% year-on-year in the first half of 2023, according to Rural Bank’s Australian Farmland Values Report.
“Over the past few months, we have seen a softening in enquiry numbers for campaigns in Tasmania compared with 12 months ago. However, property values continue to hold up very well in the current market,” says Rob Dixon of Knight Frank Australia.
opportunities”
“We understand the market trajectory has likely plateaued. But buyers are still appreciating the key fundamentals of Tasmanian rural real

estate – water, climate and affordability. More recently, larger transactions undertaken by Knight Frank Agri-Business suggest that HNWIs and corporates are still active in our markets,” adds Dixon. Renewable and carbon opportunities are attracting buyers, such as sustainable forestry business ActivAcre, but so far there is no solid evidence that this has pushed up values, he says. According to figures from the US Department of Agriculture, average farmland values in key crop-producing states rose sharply in 2023, but analysts are predicting that pressure on cash rents will moderate growth in 2024. Politicians are also calling for curbs on who can buy farmland as safe
Aussie
opportunity –“Big Run”
20-year
price change of Scottish farmland
Tax planning 35% Income from carbon credits 30% Planting trees 25% Lifestyle opportunities 37% Safe-haven investment 38% Environmental benefits 41% Food production 49% Source: The Knight Frank Scottish Farmland Index Q4 2023 312% 216% 338% 707% 498% Good arable
haven-seeking local and overseas investors snap up millions of acres.
There is no doubt that there is a significant amount of cash available to be invested in property assets such as farmland and forestry, which offer the potential to deliver naturebased solutions such as carbon sequestration and boosting biodiversity.
But monetising a living and unpredictable landscape to deliver those solutions at scale, and in a way that provides reliable investor returns without attracting greenwashing accusations, is not as easy as investing in bricks-and-mortar real estate with a regular rent roll.
This means that the vast majority of the world’s farmland is still valued based on more traditional attributes such as capacity for food production. But, at the same time, farmers are being expected to produce that food in more sustainable and nature-friendly ways by their customers. That often incurs a financial cost, a cost that doesn’t always attract a premium price.
Extracting more equity out of the food supply chain to help them do their part to save the world is arguably the biggest challenge facing farmers and landowners today. Investors who recognise that are best placed to benefit from the focus on nature-based solutions.
THE WEALTH REPORT THE WEALTH REPORT 60 61 INVEST INVEST
is one
three properties
in northeast Tasmania that offer
combined 2,700 hectares of agricultural, natural capital, renewable and
opportunities.
Andrew Shirley co-ordinates Source: The Wealth Report Attitudes Survey *Respondents were asked to choose the options that best matched their sentiment towards farmland investment
Knight Frank’s global farmland initiative. Please get in touch if you need help buying, selling or valuing agricultural land around the world.
of
for sale near Musselroe Bay
a
agri-tourism
The total guide price is around A$24.5 million
Reasons to invest in farmland (global average*)
Average arable Arable/grass Upland pasture suitable for tree planting Hill land
Can’t see the wood
capital
“When we put a
up for sale now, we are definitely highlighting its natural
Gear change
A slew of record-breaking sales can’t hide the fact that luxury investment markets weakened in 2023. Andrew Shirley investigates
Ups and downs

The Knight Frank Luxury Investment Index Q4 2023

The priciest bottle of Scottish whisky.
The most expensive Ferrari 250 GTO.
The costliest blue diamond. Even the dearest sword. In 2023, the major auction houses achieved a string of record-breaking sales. It sounds like a bumper year for luxury investments, but the latest results of the Knight Frank Luxury Investment Index (KFLII), which tracks the performance of 10 popular investments of passion, reveal a less positive
picture. For only the second time, KFLII edged into negative year-end territory, albeit by a fraction of a percent, as several stalwart members of the index dropped into the red or showed minimal gains.
However, a peek behind the headlines reveals it’s not all doom and gloom, with some of the losses simply down to the froth coming off markets, according to the experts who supply the data for KFLII.
PRICE CHANGE
10-year 12-month
Notes: All data to Q4 2023. KFLII is a weighted average of individual asset performance. Contact andrew.shirley@knightfrank.com for full methodology Sources: Compiled by Knight Frank Research using data from Art Market Research (art, coins, furniture, handbags, jewellery and watches), Fancy Color Research Foundation (colour diamonds), HAGI (cars), Rare Whisky 101 and Wine Owners ART 105% 11% JEWELLERY 37% 8% WATCHES 138% 5% COINS 56% 4% COLOUR DIAMONDS 8% 2% WINE 146% 1% KFLII 100% -1% FURNITURE 40% -2% HANDBAGS 67% -4% CARS 82% -6% RARE WHISKY BOTTLES 280% -9% Pole position –This Ferrari 250 GTO was the most expensive car auctioned in 2023. Image courtesy RM Sotheby's THE WEALTH REPORT THE WEALTH REPORT 62 63 INVEST INVEST


THE WEALTH REPORT THE WEALTH REPORT 64 65 INVEST INVEST ART US$139.4m Femme à la montre by Picasso Sotheby’s 4,561 sq m CAR US$51.7m 1962 Ferrari 330 LM/250 GTO RM Sotheby’s 1,692 sq m WHISKY US$ 2.7m The Macallan Adami 1926 Sotheby’s 88 sq m WINE US$0.28m Five magnums of Romanée-Conti 1999 Sotheby’s 9 sq m COIN US$2.7m 1795 US$10 Capped Bust Gold Eagle 9 Leaves GreatCollections 89 sq m FURNITURE US$2.8m Louis XVI gilt walnut chair for boudoir of Marie-Antoinette Sotheby’s 91 sq m JEWELLERY US$43.8m Bleu Royal (ring featuring 17.61 carat fancy vivid blue diamond) Christie’s 1,433 sq m HANDBAG US$ 0.36m Himalaya Niloticus crocodile diamond Birkin 25 with 18k white gold and diamond hardware Christie’s 12 sq m Living in luxury How many square metres of prime London property the top luxury collectible sales* of 2023 will buy you Acknowledgements: Images courtesy of Sotheby’s, Christie’s and GreatCollections Notes: *As far as can be ascertained sales represent the most expensive item sold at auction from each asset class in the Knight Frank Luxury Investment Index. Where not sold in US$, price based on mid-market exchange rate on day of auction. **Excluding the Bleu Royal WATCH US$8.5m Patek Philippe Ref 2523J gold two-crown world time wristwatch Christie’s 278 sq m COLOUR DIAMOND** US$34.8m The Eternal Pink (10.57 carat fancy vivid purplish pink diamond) Sotheby’s 1,139 sq m
KNOWLEDGE IS CRITICAL
Whisky, our worst annual performer, is a good example, explains Andy Simpson. “To some degree, 2023 continued to be a challenging year with the Knight Frank Luxury Whisky Index dipping almost 9%. But while the worst performing 50 bottles lost 26% of their combined value, the remaining 50 bottles gained 5%, with the 20 best performers increasing by a respectable 20%.”
This is further proof that knowledge is ever more critical when it comes to selecting the right bottles and distilleries, Andy points out. “In my opinion some bottles that lost significant value in 2023 will return through the next two years as they are simply so scarce and, right now at least, so undervalued.”
Classic car guru Dietrich Hatlapa is also sanguine. “The value of the HAGI Top Index was up 22% in 2022, so a retreat of 6% isn’t all that bad,” he says, noting that the strong performance of other investment classes such as equities may have dampened collectors’ appetites. “It’s a very small market so it only takes a minor change in portfolio allocations to have an effect, and there has also probably also been a degree of profit taking.”
But it wasn’t all one-way traffic, he notes. Some marques like BMW (+9%) and Lamborghini (+18%), which appeal to a younger breed of collector, bucked the trend in 2023.
CLASSICS ENDURE
Handbags, which topped KFLII just a few years ago, were also notable fallers. Sebastian Duthy of AMR, which supplies data for a number of the asset classes we track, says bags are one of the investments of passion more influenced by the retail market.
“The secondary market for handbags follows the retail market more closely than any other collectible. A dip in the share price of the top luxury brands last autumn appears to have spooked collectors wanting top-of-the-range bags.
“Last autumn it was possible to pick up an Hermès white Niloticus Himalaya Birkin in good condition for under £50,000. This is a far cry from a slightly better condition but refurbished bag that sold for the equivalent of more than £130,000 18 months earlier in Hong Kong. The recent slide reflects a general correction at the upper end that’s been under way for some time rather than changing attitudes to the harvesting of exotic skins. Collectors are prepared to pay a premium if the bag has recently left the Hermès workshops and so prices are also dependent on annual production.
“At lower price points, bags such as the Birkin in Togo leather in classic colourways such as gold and black remain very popular. Prices for these versatile bags have increased slightly over the year, with one nearly new bag reaching £15,000. At times of great economic stress, it is normal for people to reach for reliable fashion standards. The ongoing cost-of-living crisis appears to have encouraged the same behaviour.
“It’s
a very small market so
only
For the love of it
The reasons UHNWIs collect investments of passion
1. JOY OF OWNERSHIP
2. INVESTMENT
3. STATUS AMONG PEERS
4. TO BELONG TO A COMMUNITY
5. INTELLECTUAL INTEREST
Tangible assets
20%
The proportion of UHNWI portfolios allocated to luxury collectibles
Source:
“Another example where prices have edged up is the iconic Kelly in crocodile which Hermès has produced since the 1960s. One exceptional vintage example from 1962 sold for the equivalent of £14,500 at Sotheby’s in November.”
The market for fine wine – up just 1% according to the Knight Frank Fine Wine Icons Index (KFFWII) – is going through a period of price correction, asserts Nick Martin of Wine Owners. “It’s been a hell of a long run, so I’m not that surprised.” Some wines from very small producers that had enjoyed the most exuberant growth have seen the biggest drops, he says. “It had got a bit silly, £50 bottles had shot up to £200 or £300.” That KFFWII still just edged into the black shows the value of a diversified cellar, he adds. “The wider Burgundy market has dropped by 12% since the autumn.”
“In such an increasingly financialised climate, it was no surprise to see collectors chase the most iconic and truly rare timepieces. A Rolex John Player Special broke the model record when it sold for £2 million at Sotheby’s in May, double the price for a similar example sold at Phillips in 2021. Prices of classic Cartier watches continued their journey northwards, with a number of asymmetric designs coming to market.
“The top 10 of the most expensive watches to be auctioned last year once again included a high proportion of independent watchmakers such as Philippe Dufour, Roger Smith and Richard Mille, as well as rare Patek Phillipe watches. Their total value was £42 million, an increase of 40% over the previous year.”
Jewellery put in another strong performance with annual growth of 8%. “The demand for colour gemstones of exceptional quality, iconic signed period jewels and single-owner collections, as well as items with historic provenance stood out in 2023,” Duthy notes.
I’m often asked if younger collectors have different attitudes to their parents. Duthy says the impact of hip hop culture on the jewellery market is a good example and shouldn’t be underestimated, particularly as the trend for male music stars to add jewellery to their look continues to grow.
“Sotheby’s Hip Hop auction in July offered several possessions that belonged to the music legend Tupac Shakur, but none more personal than a gold ruby and diamond crown ring. The buyer was soon revealed to be the artist Drake, another huge hip hop star, who used his purchase to promote his new album on Instagram. Drake paid US$1 million for the ring – three times the estimate.”
Talking of shiny things, colour diamonds continued to perform steadily, says Miri Chen, CEO of the Fancy Color Research Foundation. “In 2023, we observed a shift towards smaller sizes and higher colour saturations, along with a slight decline in the prices of pinks and blues. The overall trend indicates a steady increase in prices for the whole segment. We are delighted to witness the continued resilience of the fancy colour market in comparison to other markets, including colourless diamonds.”
NOTABLE SALES
it
takes a minor change in portfolio allocations to have an effect”
Surprising to many market observers will be the fact that watch prices, as tracked by KFLII, rose by 5% to take third place in our luxury rankings. AMR’s Duthy explains: “Sales of watches at the big three auction houses totalled £488 million in 2023, a very slight increase on the previous year. This includes post-millennial watches as well as true vintage pieces, which typically attract separate collector bases. Our index tracks prices of the latter; the biggest slide in values recently has been for the newer watches.
“2023 continued to be a challenging year with the Knight Frank Luxury Whisky Index dipping almost 9%”
by then, it was clear that the confidence among sellers, set by the previous year’s record-busting figures, was ebbing away. In the same month, modern and contemporary works from the collection of the late financier Gerald Fineberg sold well below pre-auction estimates. With all but five lots selling, it was clear the market had swung in favour of the buyer.”
There was even less appetite for the ultracontemporary or “red-chip” sector, which experienced the biggest contraction in 2023, he adds. “Works by a growing group of artists born after 1980 have been heavily promoted by mega galleries and auction houses in recent years. With freshly painted works in excess of £100,000 almost doubling in 2022, it was little surprise that this sector was one of the biggest casualties last year. There is a risk there are now simply too many fresh paint artists with none really standing out.”

For more detailed KFLII insight, head online to knightfrank.com/wealthreport
BEST OF THE REST
HNWI collecting activity is of course not limited to the assets tracked by KFLII – their collections are increasingly eclectic. Here are some of 2023’s other top sellers


Art, which leads KFLII, was the only one of our 10 index constituents to hit double-digit growth in 2023, but all of the gains came in the first half of the year with values sliding significantly later on, according to AMR’s All-Art Index.
“The auction year traditionally begins with sales of Old Masters, and last season started with some notable sales, including a record for a work by Bronzino,” says Duthy. But the same could not be said for other key sectors, he points out.
“It was telling that in May, Sotheby’s inserted one of its top Old Master lots – a Rubens’ portrait – into a 20th Century Modern evening sale. But


Michael Jordan’s
2 Air Jordan 13s from the famous “The Last Dance” season –one of the most significant items from his renowned career, and his final year with the Chicago Bulls – sold for US$2.2 million with Sotheby’s, establishing a new world record for a pair of sneakers sold at auction.
Bonham’s set a new record for a sword and Islamic object when it auctioned Tipu Sultan’s fabled 18th century gold koftgari-hilted steel bedchamber sword for £14 million at its Islamic and Indian Art sale in May. The Indian ruler’s sword had an estimate of £1.5 million to £2 million.
A Hebrew Bible more than 1,000 years old and described as “one of the most important and singular texts in human history” became the most valuable manuscript ever sold at auction. The Codex Sassoon, dating from the late 9th or early 10th century, sold for US$38.1 million at Sotheby’s in New York in May.
Rapper Post Malone paid a reported US$2 million for a unique Lord of the Rings “One Ring” card, part of the popular Magic the Gathering (MTG) table-top and trading game. The card was not sold at auction, but in true Willy Wonka-style was included in a standard retail pack of MTG cards.
Attitudes Survey
The Wealth Report Attitudes Survey
THE WEALTH REPORT 66 THE WEALTH REPORT 67 INVEST INVEST
1998 NBA Finals Game
Databank
See below for a selection of findings from The Wealth Report Attitudes Survey 2024
The Attitudes Survey is based on responses provided during December 2023 by more than 600 private bankers, wealth advisors, intermediaries and family offices who between them manage over US$3 trillion of wealth for UHNWI clients.
WEALTH
On average, how do you expect your clients’ total wealth to change in 2024?
On average, how do you expect your clients’ total wealth to change in 2024? (overall score, 5 = maximum)
INVESTMENT
What proportion of your clients invested directly in commercial property in 2023?
What proportion of your clients are planning to invest in commercial property in 2024?
Which of the following do you see as a good reason to invest in farmland? (Select all that apply)
What % of your clients follow ESG strategies when investing in commercial properties?
What % of your clients plan to apply for a second passport or obtain new citizenship in 2024?
How engaged are your clients in reducing their carbon emissions by...
What ESG-related criteria do your clients use when assessing property acquisitions? (Select all that apply)
THE WEALTH REPORT THE WEALTH REPORT 68 69 THE NUMBERS BEHIND THE WEALTH REPORT
AFRICA ASIA AUSTRALASIA EUROPE LATIN AMERICA MIDDLE EAST NORTH AMERICA GLOBAL AVERAGE Decrease significantly (above 10%) 0.0% 1.1% 0.5% 0.3% 0.0% 0.0% 0.0% 0.4% Decrease marginally (below 10%) 1.7% 6.0% 1.1% 6.7% 16.4% 0.0% 4.7% 5.6% Remain the same 43.6% 11.9% 16.1% 29.1% 10.9% 6.3% 26.6% 22.5% Increase marginally (below 10%) 54.7% 38.7% 58.1% 50.9% 54.5% 46.3% 56.8% 50.3% Increase significantly (above 10%) 0.0% 42.3% 24.2% 13.0% 18.2% 47.4% 11.8% 21.1%
AFRICA ASIA AUSTRALASIA EUROPE LATIN AMERICA MIDDLE EAST NORTH AMERICA GLOBAL AVERAGE 3.53 4.15 4.04 3.69 3.75 4.41 3.76 3.86
AFRICA ASIA AUSTRALASIA EUROPE LATIN AMERICA MIDDLE EAST NORTH AMERICA GLOBAL AVERAGE 11% 19% 21% 18% 17% 24% 21% 20%
AFRICA ASIA AUSTRALASIA EUROPE LATIN AMERICA MIDDLE EAST NORTH AMERICA GLOBAL AVERAGE 13% 21% 17% 17% 15% 23% 19% 19%
AFRICA ASIA AUSTRALASIA EUROPE LATIN AMERICA MIDDLE EAST NORTH AMERICA GLOBAL AVERAGE 38% 13% 4% 13% 43% 5% 26% 19%
AFRICA ASIA AUSTRALASIA EUROPE LATIN AMERICA MIDDLE EAST NORTH AMERICA GLOBAL AVERAGE Attempting to reduce their personal carbon footprint? 59% 62% 65% 72% 68% 58% 62% 65% Attempting to measure carbon usage? 18% 20% 20% 26% 25% 16% 15% 20% ESG screening of investments? 25% 24% 27% 29% 16% 25% 22% 24% Improving the energy efficiency of their homes? 35% 30% 38% 42% 44% 30% 30% 34% Improving the energy efficiency of their investment property? 29% 27% 33% 40% 17% 30% 37% 34% Investing in nature-based solutions? 32% 21% 17% 19% 15% 13% 24% 21% Owning fewer homes? 30% 24% 12% 13% 6% 7% 9% 14% Reducing air travel? 26% 13% 9% 12% 1% 5% 8% 10% Reducing personal vehicle ownership? 21% 17% 7% 11% 1% 4% 6% 10% Reducing the carbon footprint of business operations? 23% 26% 27% 32% 16% 26% 32% 30% Reducing private jet travel (where applicable)? 19% 19% 16% 17% 6% 14% 9% 14% Switch to electric vehicles? 24% 35% 29% 37% 40% 29% 47% 40%
AFRICA ASIA AUSTRALASIA EUROPE LATIN AMERICA MIDDLE EAST NORTH AMERICA GLOBAL AVERAGE Food production 46% 53% 53% 50% 51% 53% 45% 49% Safe-haven investment 37% 35% 31% 39% 40% 39% 41% 38% Income from carbon credits 43% 29% 33% 28% 29% 23% 31% 30% Environmental benefits 35% 41% 36% 40% 37% 42% 44% 41% Planting trees 30% 24% 18% 25% 26% 32% 26% 25% Lifestyle opportunities 33% 38% 48% 38% 37% 33% 35% 37% Tax planning 32% 35% 36% 37% 36% 33% 35% 35%
AFRICA ASIA AUSTRALASIA EUROPE LATIN AMERICA MIDDLE EAST NORTH AMERICA GLOBAL AVERAGE Only invest in the most sustainable/ prime assets 28% 29% 29% 28% 28% 29% 29% 29% Acquire and upgrade assets with weak ESG credentials 23% 22% 23% 22% 21% 19% 20% 21% Acquire and reposition (change of use) assets with weak ESG credentials 19% 20% 22% 21% 22% 17% 19% 20% Sell poor ESG-performing assets 24% 22% 22% 20% 21% 23% 26% 23% Invest in renewable energy projects 26% 27% 26% 28% 26% 24% 26% 27% Invest in carbon sequestration opportunities through land acquisition 21% 21% 18% 19% 21% 17% 16% 19%
AFRICA ASIA AUSTRALASIA EUROPE LATIN AMERICA MIDDLE EAST NORTH AMERICA GLOBAL AVERAGE Energy efficiency rating (e.g. EPC) 43% 55% 57% 63% 62% 78% 62% 61% Green/sustainable certifications (e.g. BREEAM, LEED, DGNB, Green Mark, NABERS) 48% 48% 55% 45% 37% 51% 45% 46% Renewable power source (e.g. solar panels) 31% 49% 48% 51% 39% 47% 45% 48% Impact on nature and biodiversity (e.g. green roofs/space) 42% 29% 25% 28% 39% 20% 37% 32% EV charging points 35% 42% 34% 36% 26% 34% 41% 39% Amenity-rich assets (e.g. cycle facilities, wellbeing space) 39% 26% 30% 26% 38% 24% 23% 25% Impact on wider community (e.g. community facilities, open space/cafés) 39% 27% 29% 28% 37% 25% 24% 26% Attitudes Survey
Which investments of passion are becoming more popular among your clients? (Select all that apply)
THE KNIGHT FRANK WEALTH SIZING MODEL
What are the key reasons your clients collect investments of passion? (1 = highest priority)
What share of your clients’ investment portfolio is allocated to luxury investments?
What are the main motivations behind your clients’ future home purchases? (1 = top motivation)
Note: Our model is dynamic, so these numbers are subject to change and may not be identical to those in the hard copy of the report or previous editions
THE WEALTH REPORT THE WEALTH REPORT 70 71
UHNWI POPULATION (US$30M+) % CHANGE REGION/COUNTRY/TERRITORY 2022 2023 2028 2023 VS 2022 2028 VS 2023 World 601,300 626,619 802,891 4.2% 28.1% Africa 2,886 2,996 3,506 3.8% 17.0% Asia 161,177 165,442 228,849 2.6% 38.3% Australasia 17,437 17,934 22,776 2.9% 27.0% Europe 152,459 155,232 189,882 1.8% 22.3% Latin America 13,654 13,159 15,556 -3.6% 18.2% Middle East 17,689 18,790 24,102 6.2% 28.3% North America 235,998 253,066 318,220 7.2% 25.7% Australia 14,922 15,347 19,491 2.9% 27.0% Austria 2,160 2,167 2,500 0.3% 15.4% Canada 27,378 27,928 35,516 2.0% 27.2% Chinese mainland 95,435 98,551 144,897 3.3% 47.0% Finland 1,220 1,269 1,403 4.1% 10.5% France 24,879 24,941 31,221 0.2% 25.2% Germany 28,711 29,021 35,134 1.1% 21.1% Hong Kong SAR 5,812 5,957 7,290 2.5% 22.4% India 12,495 13,263 19,908 6.1% 50.1% Indonesia 1,420 1,479 1,984 4.2% 34.1% Ireland 1,882 1,890 2,346 0.4% 24.1% Italy 15,364 15,952 18,929 3.8% 18.7% Japan 21,646 21,710 24,502 0.3% 12.9% Malaysia 723 754 1,015 4.3% 34.6% Netherlands 8,372 8,390 10,428 0.2% 24.3% New Zealand 2,515 2,587 3,285 2.9% 27.0% Norway 2,251 2,276 2,837 1.1% 24.6% Portugal 777 800 1,000 3.0% 25.0% Singapore 4,601 4,783 5,535 4.0% 15.7% South Africa 846 835 998 -1.3% 19.5% South Korea 6,921 7,310 9,470 5.6% 29.5% Spain 9,975 10,149 11,914 1.7% 17.4% Sweden 4,024 4,125 5,128 2.5% 24.3% Switzerland 14,003 14,734 16,703 5.2% 13.4% Taiwan 7,666 7,640 9,174 -0.3% 20.1% Thailand 882 889 1,020 0.8% 14.7% Turkey 1,761 1,932 2,760 9.7% 42.9% United Kingdom 22,379 23,072 28,734 3.1% 24.5% United States 208,560 225,077 282,626 7.9% 25.6% Vietnam 734 752 978 2.4% 30.0%
AFRICA ASIA AUSTRALASIA EUROPE LATIN AMERICA MIDDLE EAST NORTH AMERICA GLOBAL AVERAGE 17% 21% 18% 18% 23% 23% 20% 20%
Residential properties AFRICA ASIA AUSTRALASIA EUROPE LATIN AMERICA MIDDLE EAST NORTH AMERICA GLOBAL AVERAGE What share of your clients’ total wealth is allocated to primary and secondary homes? 26% 30% 37% 31% 30% 16% 26% 29% What share of your clients’ residential portfolios are located outside their country of residence? 26% 23% 10% 28% 25% 41% 24% 27% How many homes do your clients own? 4.49 3.02 3.04 3.70 4.34 3.73 4.21 3.72 What % of your clients bought a home in 2023? 30% 16% 17% 22% 22% 16% 31% 24% What % of your clients are planning to buy a home in 2024? 32% 18% 21% 23% 21% 23% 25% 22% Do your clients rent out their second homes? 49% 35% 32% 37% 40% 28% 30% 33%
HOME
AFRICA ASIA AUSTRALASIA EUROPE LATIN AMERICA MIDDLE EAST NORTH AMERICA GLOBAL AVERAGE Education 2 2 3 4 4 4 5 3 Investment 3 1 1 1 1 Job relocation 5 4 5 6 3 6 6 6 Lifestyle 1 3 2 2 2 3 1 2 Safe haven 4 5 6 5 5 2 4 5 Tax 6 6 4 3 5 5 3 4
AFRICA ASIA AUSTRALASIA EUROPE LATIN AMERICA MIDDLE EAST NORTH AMERICA GLOBAL AVERAGE Art 38% 58% 59% 53% 34% 58% 37% 48% Classic cars 28% 29% 45% 39% 30% 38% 43% 38% Wine 32% 38% 45% 39% 26% 36% 30% 35% Rare whisky 23% 24% 15% 23% 28% 13% 27% 26% Jewellery 31% 32% 22% 25% 27% 25% 28% 28% Watches 41% 47% 51% 40% 43% 67% 39% 42% Coloured diamonds 15% 8% 10% 10% 21% 3% 21% 14% Coins 23% 10% 6% 18% 27% 4% 17% 15% Luxury handbags 24% 24% 19% 19% 28% 23% 22% 22% Furniture 23% 10% 7% 13% 13% 13% 15% 13%
AFRICA ASIA AUSTRALASIA EUROPE LATIN AMERICA MIDDLE EAST NORTH AMERICA GLOBAL AVERAGE Investment 2 1 2 2 2 2 2 2 The joy of ownership 2 1 1 1 To belong to a community 4 4 5 5 4 4 4 4 Status among peers 3 3 4 3 3 3 3 3 Intellectual interest 5 5 3 4 5 5 5 5
Final word
The period to 2028 will see more wealth created in Asia-Pacific than in any other region. Christine Li, Head of Research for Knight Frank Asia-Pacific, assesses the outlook for two critical elements of the region’s investment story: Chinese investors and Japanese real estate
To understand the future of private investment across the Asia-Pacific region, we have to understand China.
For years, property has been the favoured asset class for wealth accumulation for the Chinese, with many investing as much as 70% of their savings in real estate, both domestically and internationally.
Small apartments and condominiums in South-East Asia, for instance, were a popular choice for the Chinese middle classes in the late 2010s due to affordability and geographic proximity. For the more affluent, top destinations included Australia, the UK and the US.
But a protracted property crisis at home and slower growth mean many Chinese are taking a more conservative approach, curbing domestic home purchases and overseas investments.
In 2023, total sales by China’s top 100 developers were down 17.3% from a year earlier, as property companies grappled with a liquidity crisis. The slowdown has been a major blow to consumer and investor confidence. Governmental efforts to revive the market by reducing interest rates and down payment requirements have had a muted effect.
The key impact has been that Chinese buyers have become much more selective. South-East Asia, especially Thailand and Malaysia, have fallen out of favour. In contrast, Japan and UAE have seen increased Chinese purchases, while Australia maintains its position as the top choice for overseas property purchases.
A substantial recovery hinges on a resolution of the credit crisis, though we still expect opportunities to emerge across the risk spectrum, particularly within private credit and government-approved sectors such as logistics and data centres. Any pick up in economic momentum could be swift, given the government’s recent shift towards a more accommodative stance and the rollout of policies aimed at kickstarting growth.
JAPAN’S RISING SUN
In terms of markets in demand from regional investors Japan is firmly in the spotlight, with real estate investment here running above the long-term average. Japan stands alone among
“In terms of markets in demand from regional investors Japan is firmly in the spotlight, with real estate investment here running above the long-term average”
the world’s major central banks in holding interest rates low, and the country’s economic revival suggests that Prime Minister Abe’s economic strategy is bearing fruit. The total transaction volume exceeded ¥5 trillion (US$34 billion) in 2023, down about 9% but still elevated compared with pre-pandemic levels.
Investors have been pricing in a normalisation of monetary policy in 2024. Structural reforms focusing on improving governance and shareholder value have propelled the country’s stock markets to a 30-year high.
Still, after three decades of deflationary pressures, we can expect authorities to stay cautious. Any rise in policy rates will be gradual, and the impact on funding costs will remain manageable. With prime capitalisation rates in Tokyo ranging from 3–4.4%, spreads continue to remain compelling. The weight of capital seeking acquisitions should limit yield expansion.
Leasing fundamentals will remain key to sustaining cash flow and preserving value. The strengthening of manufacturing supply chains has enabled demand for logistics space to keep pace, despite an elevated pipeline of new supply. Multifamily assets also continue to attract the attention of investors, particularly as rents are expected to grow in line with wage increases.
Asian buyers, especially from Taiwan, Hong Kong and Singapore, dominate the Japanese market, compensating for lower activity from Western investors. The rise of private investment is notable, with family offices increasingly moving capital into Japan amid uncertainties in the wider region.
The stable investment climate and the depth of its real estate market mean that Japan will remain central for many regional investment strategies. With the yen likely to appreciate, there is also a window of opportunity for investors to lock in value at current exchange rates.

Our global network
604 offices across 58 countries and territories supported by more than 25,000 people
228 offices
10,999 people
82 offices
3,093 people
THE AMERICAS Canada, The Caribbean, USA
EUROPE
Austria, Belgium, Bulgaria, Czech Republic, Denmark, Finland, France, Germany, Greece, Hungary, Ireland, Italy, Netherlands, Poland, Portugal, Romania, Serbia, Spain, Sweden, Switzerland
UK England, Scotland, Wales, Jersey
104 offices
1,091 people
PRIVATE OFFICES
Dubai, Hong Kong, London, Monaco, New York, Singapore
23 offices
644 people
AFRICA
Botswana, Egypt, Kenya, Malawi, Nigeria, South Africa, Tanzania, Uganda, Zambia, Zimbabwe
7 offices
285 people
THE MIDDLE EAST
Bahrain, Qatar, Saudi Arabia, UAE
SINGAPORE
160 offices
9,616 people
ASIA-PACIFIC Australia, Cambodia, Chinese Mainland, Fiji, Hong Kong SAR, India, Indonesia, Japan, Malaysia, New Zealand, Philippines, Singapore, South Korea, Taiwan, Thailand, Vietnam
SYDNEY
Douglas Elliman contacts: For any Press Enquiries please contact:
New York City, New Jersey, Massachusetts, Westchester and Connecticut
Richard Ferrari
President and CEO of Brokerage, NYC and Northeast Region 212.891.7628
rferrari@elliman.com
Long Island, Hamptons and North Fork
Todd Bourgard
CEO of Brokerage, Long Island, Hamptons and North Fork Regions 631.723.4300 todd.bourgard@elliman.com
Florida
Jay Phillip Parker
CEO of Brokerage, Florida Region President, DE Development Marketing, Florida 305.695.6300 jay.parker@elliman.com
Western Region
Stephen H. Kotler CEO of Brokerage, Western Region 469.273.1431 stephen.kotler@elliman.com
Metro D.C.
Rick Moeser
CEO of Business Development 703.552.4180 rick.moeser@elliman.com
New Development
Susan de França President and CEO, DE Development Marketing 212.891.7102 sdefranca@elliman.com
Stephen Larkin
Executive Vice President & Chief Communications Officer 212.891.7042 stephen.larkin@elliman.com
Samantha Feld
Associate Vice President of Public Relations 212.891.7735 samantha.feld@elliman.com
THE WEALTH REPORT 73 THE WEALTH REPORT 72
CHRISTINE LI HEAD OF KNIGHT FRANK ASIA-PACIFIC RESEARCH
NEW YORK SAN FRANCISCO
NAIROBI DUBAI LONDON BERLIN PARIS MUMBAI HONG KONG SHANGHAI
Your partners in property
