


Volume 114 Number 05 Kolkata May 2016
CONTENTS
Editorial :
Phonosurgery —Arevolution in the treatment of voice disorders — Debasish Mukherjee.....................................................................................................................45
OriginalsandPapers:
Study to evaluate the influence of pre-pregnancy weight, height, BMI and weight gain during pregnancy on birth weight of baby — Shyamal Dasgupta, Poushali Sanyal, Amitava Mukherjee, Shyamali Dutta, Biswajit Ghosh, Sajal Kr Mondal.........................................47
Practitioners’Series : Preliminary Report: CurrentTopic: PictorialCME: BookReview
Chemotherapy&diabetes:interactionofBMI&steroidsonbloodglucoselevels: ashort study Riyaz Mohammed ....................................................................................................51
HealthStatusofchildrenunderthreeyearsofageresidinginslumsofRajkotCity, Gujarat,India— Anupam Banerjee, Umed Patel, Pramod Verma, Ankit Viramgami, Mayur Vala............................................................................................................54
Useofvolatileproductionpatternstodetectefficacyofantifungalagentsagainst Fungalpathogens— Pritam Sukul.....................................................................................................58
Eponymsinhumananatomy:rememberingthegreatpeoplebehindthem — Abraham AA .................................................................................................................................66
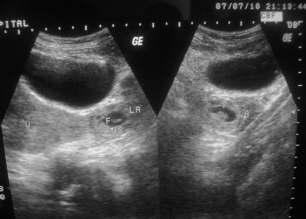
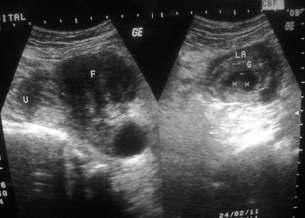
Ararecaseofrecurrent(consecutive)ectopicpregnancywithfibroiduterus
— Owvass Hamied Dar, Maqsood Ahmad Dar, Ghanshyam, Pankaj Sharma ....................................72
Supplement

May everybody be happy May every one of us see to it
That nobody suffers from any pain or sorrow I do not ask for crown
Nor wish to be in Heaven or reborn I only want to alleviate the suffering of those people Who are burning in fire of sorrow
http://www.ima-india.org/ima/left-side-bar.php?scid=14
Editorial

We, the members of Indian Medical Association Stand here to salute our National Flag Its honour and glory shall be our light and strength And its course shall be our course. We pledge our allegiance to it And realizing our responsibilities as the accredited members of this national organization, We swear We will dedicate everything in our power To see it fly high in the comity of nations.

Debasish
MBBS, DLO, MS Honorary Editor, JIMA
Phonosurgery — A revolution in the treatment of voice disorders
Historical aspects : Hippocrates described the importance of lungs, trachea, lips and tongue in phonation in the early 5th century B.C. Claudius Galen who was the founder of laryngology and voice science first recognised the importance of brain in controlling phonation and distinguished between speech and voice. In 1805 Manuel Garcia, famous opera singer invented indirect laryngoscopy by using a dental mirror is still a basic tool for visualisingvocalfoldsbyotolaryngologists.
1. IMARareBloodGroupOnlineBloodBankDirectory ima-india.org/Rare
2. IMAOnlineTBNotificationinitiative ima-india.org/tbnotify
3. IMAOnlineEventsReportinginitiative http://www.ima-india.org/ima/left-side-bar.php?scid=228
4. ProformaforHypertensionScreening http://module.ima-india.org/
5. IMAOnlineSentinelEventsReportingInitiative ima-india.org/sentinel
6. IMADiseaseNotification http://disnotif.ima-india.org/
7. IMARISEandSHINE http://imariseandshine.com/
8. IMABloodDonationInitiative http://www.ima-india.org/ima/left-side-bar.php?scid=289
9. IMAFlagSalutation http://www.ima-india.org/ima/left-side-bar.php?scid=14
10. IMAPrayer http://www.ima-india.org/ima/left-side-bar.php?scid=14
11. IMADigitalTV http://www.ima-india.org/imalive/ 12. IMASlideShare http://www.ima-india.org/ima/free-way-page.php?scid=287 13. IPledgeMyOrgan http://module.ima-india.org/ipmo/ 14. IMALive http://www.ima-india.org/imalive/ 15. eMedinexus/ART http://emedinexus.com/artbill/ 16. eMedinexus/Satyagraha http://emedinexus.com/satyagraha
17. IMA/ART http://ima-india.org/artbill
18. IMA/Satyagraha http://ima-india.org/satyagraha
19 IMA/Webcast http://ima-india.org/ima/ 20 IMADigitalTV http://ima-india.org/digitaltv
IMAHeadquarters
DrSSAgarwal (National President)
Prof(Dr)AMarthandaPillai (Imm Past National President)
DrShailendraNVora (National Vice President)
DrKPrameelaSurenderRao (National Vice President)
DrOmParkashSinghKande (National Vice President)
DrSharadKumarAgarwal (National Vice President)
DrKKAggarwal (Hony Secretary General)
DrRNTandon (Hony Finance Secretary)
DrRajeevArdey (Hony Jt. Secretary)
DrRaviMalik (Hony Jt. Secretary),
DrRameshKumarDatta (Hony Jt. Secretary)
DrSanjoyBanerjee (Hony Jt. Secretary Calcutta)
DrPravinGogia (Hony Jt. Secretary)
DrHansRajSatija (Hony Asst. Secretary)
DrManjulMehta (Hony Asst. Secretary)
DrHarishGupta (Hony Jt. Fin. Secretary)
DrUjjwalKrSengupta (Hony Jt. Fin. Secretary Calcutta) IMACGP
DrVinodKumarMonga (Dean of Studies)
DrARajaRajeshwar (Hony Secretary)
IMAAMS
DrKranshankarWDeoras (Chairman)
DrPullaraoPasumarthy (Hony Secretary)
IMAAKN Sinha Institute
DrShivkumarUtture (Hony Director)
DrArbindKumarSinha (Hony Executive Secretary)
JIMA
DrDebasishMukherjee (Hony Editor)
DrSantanuSen (Hony Secretary)
Your Health
DrAmitabhaBhattacharya (Hony Editor)
DrRahulDutta (Hony Secretary)
Apka Swasthya
DrPrabhatKumarTewari (Hony Editor)
DrArvindSingh (Hony Secretary)
IMANSS Scheme
DrKirtiMPatel (Chairman)
DrYogendraSModi (Hony Secretary)
IMANPPScheme
DrKrishnaMParate (Chairman)
DrJayairishnanAV (Hony Secretary)
IMAHospital Board of India
DrRVAsokan (Chairman)
DrRaviWankhedkar (Hony Secretary)
DrAnilSPachnekar (HQs. Secretary)
IMANational Health Scheme
DrAshokSAdhao(Chairman)
DrAlexFranklin(Hony Secretary)
IMANational Pension Scheme
DrSudiptoRoy(Chairman)
DrKVDevadas(Hony Secretary)
The term phonomicrosurgery was first introduced by Von Laden in 1962. The term phomomicrosurgery was introduced in 1994. Use of surgical microscope for endolaryngeal microsurgery was introduced by Kleinsasser in 1960. Hirano's description of structured layer of vocal fold in early 20th Century has formed the basis for Phonomicrosurgicaltechniques.
The techniques of laryngoplastic phonosurgery were first introduced by Payr in 1915, but the real concept was created by Isshiki in 1975. Isshiki, a japanese surgeon has the credit for the concept of modern laryngeal framework surgery in the managementofvoicedisorders.ItwaspopularisedbyKoufmanandZeitelsinUnitedStatessince1986.Ithasbeenpractisedin Indiasince1996andgainingalotofpopularityasasubspecialityofotolaryngology
Definition :
Phonosurgery is composed of procedures that are intended to maintain or improve the quality of the voice by correcting defects in laryngeal sound production. These procedures are rooted in a rich medical history that dates back to the early 19th century There has been a recent convergence of physiologic principles of voice production with surgical technique theory Recognition of this interdependence has provided a catalyst for collaboration among surgeons, scientists, speech pathologists,vocalpedagogists,andperformingartists.Weliveinasocietythatislinkedtoeffectivecommunication,andthere is a growing population of individuals who have professional voice responsibilities as part of everyday life.This has created a needfortherecentdevelopmentsinphonosurgeryanditsemergenceasasubspecialtyofotolaryngology
Phonosurgery : Surgical procedures that maintain, restore, or enhance the human voice. Phonosurgery includes phonomicrosurgery (microsurgery of the vocal folds done through an endoscope), laryngoplastic phonosurgery (open-neck surgery that restructures the cartilaginous framework of the larynx and the soft tissues), laryngeal injection (injection into the larynxofmedicationsaswellassyntheticandorganicbiologicsubstances),andreinnervation(restorationofthenervesupply) ofthelarynx.Theterm"phonosurgery"wascoinedintheearly1960s.
Purpose & Procedure :
The term Phonosurgery denotes restoration of Voice by using various surgical techniques. The melody of human voice depends on the vocal ligament an elastic structure of the vocal folds, which is not present in any other species. So there is no experimental model for human voice. Human voice acts as a primary instrument to project our personalities in the society. Voice problems may arise from laryngeal or systemic disease or trauma or misuse. The result of voice dysfunction is sometimes dewasting, endanger the life of professional voice users like singers, actors, politicians, educatorsetc.Manypeople,sufferingfromvoicedisorderslivedesperatelyinsocietywiththeopinionthatnopropertreatment isavailablefortheirproblems.Infactinventionofphonosurgicaltechniqueshascreatedarayofhopeforsuchvictimsofvoice disorders.
Voiceproblemsmaybeofcongenital,traumatic,inflammatory,neoplastic,neurologicalorfunctionalorigin.Thediagnosis ofvoicedisordersstartswithdetailedhistoryfromthepatientandindirectlaryngoscopicexaminationbytheotolaryngologist. Foralongtimeperceptualvoiceanalysis(byhearingthepatientsvoiceandjudgingitsquality)hasbeenabasictoolindeciding the prognosis of the patients. Recently computerised objective voice analysis methods like voice spectrograms electroglottography, phonotograms etc are gaining importance in judging the prognosis and also for documentation. The inventionofvideolaryngoscopy,andvideolaryngostroboscopytechniqueshavemadediagnosismorepreciseinthevoicecare.
The management of voice disorders is a team work consisting of otolaryngologist, speech pathologist, Voice coach, psychiatrist,andsometimesplasticsurgeonsandpediatriciansetc.
The voice disorders may be of functional or organic (eg.vocal nodules) orgin, and it is sometimes difficult to demarkate betweenthesetwoasonemaypredisposetheother Voicetherapyplaysagreaterroleinthecorrectionofmostofthefunctional voice disorders which form 80% of voice problems. It also acts as an important adjuvant treatment modality before and after voicesurgeryorphonosurgery
Techniques:
Thephonosurgicaltechniquesbroadlyconsistsof(I)PhonosurgeryovertheVocalfoldsforvoicegeneration
A. Phonomicrosurgery of mass lesions like nodules, cysts, deficits of vocal folds etc. B. Laryngoplastic Phonosurgery (Thyroplasty)forcorrectingpositionofvocalfoldasinvocalcordparalysisandalsoforcorrectingthetensionofthevocalfold. C.Nervemuscleinnervationtechniques.D.VocalFoldInjectionTechniques.
46 J INDIAN MED ASSOC, VOL 114, NO 5, MAY 2016
(II)Phonosurgeryforvoiceresonance.
Phonomicro Surgery :
Theincludescorrectionofcleftpaltate,cleftlip,orthodonticsurgerypharyngoplastyandendoscopicsinonasalsurgeries. Phonomicrosurgical techiques have revolutionised the management of benign vocal fold lesions like vocal cysts, nodules, polyps without damaging the voice. For centuries the benign vocal fold lesions like cysts were managed by direct excision of the mass or cyst over the vocal fold by stripping of the vocal fold either by naked eye direct laryngoscopyorbymicrolaryngealsurgery Intherecenttimesthistechniqueisabandonedasitwasfoundtoproducescarring of the vocal folds resulting in poor voice. The modern concept of phonomicrosurgery is based on Hirano's principle of structured layer of the vocal folds. In this technique the vibratory epithelium is protected during excision of the mass for preservingthevoice.
Thissurgeryisdoneunderendotrachealgeneralanesthesiausinganoperatingmicroscope.Thebasicprocedureconsistsof injectionofvocalfoldwithnormalsalineandmicroflapdissectionforremovingthemassoverthevocalfoldsbypreservingthe vibratoryepithelium.Thistechniqueisalsoappliedforaugmentationofvocalfoldswithfatorfasciaforcorrectionofvoicefor vocal cord atrophy with bowing of vocal folds which may be either congenital or developmental. This surgery has come into practice in India very recently This has become a ray of hope for correction of voice disorders in professional voice users like singers,politicians,educatorsetc.
Most of the phonomicrosurgery techniques are done with cold, steel instruments reserving the laser for more vascular lesions,asthelaserproducesheatandscarringofthevocalfold.
Laryngoplastic phonosurgery :
This is otherwise known as thyroplasty, or laryngeal frame work surgery This is of 4 types.
1.ThyroplastytypeI:
Indications :
Thisisalsoknownasmedialisationlaryngoplasty(M.L) (A) Unilateral vocal cord paralysis, paralytic dysphonia :Thyroplasty type I has largely replaced the teflon injection technique, which was practised for several years in the management of paralytic dysphonia. In this technique, under local anaesthesia a window is cut in the thyroid lamina in the neck on the paralysed side and the piece of thyroid cartilage is depressedinwardstowardsthemidlineuntilthenormalcordtouchestheparalysedcord,thusclosingtheglotticgapresultingin normal voice. The thyroid cartilage in the window is held in place with a silastic block. As this surgery is done under local anaesthesiapatientsvoicecanbemonitoredontheoperatingtableitself.Thistechniqueissometimessupplementedbyanother technique called arytenoid rotation to close large posterior glottic gaps in vocal cord paralysis. This is the commonest type of thyroplasty in practice. The success rate is of about 80%. (B) Other indications M.L. are vocal cord atrophy, bowing of the vocalcordetc.
2. Thyroplasty type II :
In this technique the vocal folds are displaced laterally away from the midline under local anaesthesia.Thistechniqueispresentlyappliedinthemanagementofspasticdysphonia.
3.ThyroplastytypeIII:
In this technique the vocal cords are pushed back posteriorly thus shortening the vocal folds resulting in lowering of the pitch. This technique is commonly applied in the management of puberity Dysphonia a developmental disorder of larynx in males, refractory to voice therapy. By applying this technique the high pitched voice or feminine voice in males can be convertedintolowpitchedornormalvoice.
4.ThyroplastytypeIV:
ThyroplastyType-IVofIsshikialsodescribedasCricothyroidApproximation.Itisindicatedforraisingofpitchinfemales whohavemalevoice(Androphonia) Nerve muscle pedicle surgery involves implanting a portion of sternohyoid musclewithitsintactmotorbranchfromansahypoglossiintoaparalysedposteriorcricoarytenoidmuscle.Thisisindicatedin the management of bilateral vocal cord paralysis of varied aetiology The operation has not been universally satisfactory becauseofitsvarriedsuccessrate.
Nerve muscle innervation techniques :
Laryngealinjectiontechniques:
ForseveralyearsinjectionofTeflonintothevocalfoldshasbeenpractisedforcorrection of paralytic dysphonia. Eventhough it has been largely replaced by techniques of thyroplasty and arytenoid rotation it is still indicated for preventing aspiration in children with vocal fold paralysis. Injection of fat and collagen are widely practised for correctionofparalyticdysphoniaastemporatymethodsbeforeproceedingtothyroplastytechniques. Introduction of phonomicrosurgery and laryngoplasitc phonosurgery techniques has revolutionised the management of voice disorders. It has created a ray of hope for victims of voice problems thus forming a new subspeciality in thefieldofOtolaryngology
Conclusion :
Study to evaluate the influence of pre-pregnancy weight, height, BMI and weight gain during pregnancy
on birth weight of baby
1 2 3 4
Shyamal Dasgupta , Poushali Sanyal , Jhuma Biswas , Chiranjit Ghosh , 5 6 7 8
Biswajit Ghosh , Sajal Kr Mondal , Shyamali Dutta , Amitava Mukherjee
To study the influence of different maternal variables on birth weight, as it is the most important and valuable indicator for neonatal survival. It is a prospective one year study in a tertiary institute to evaluate the effect of maternal anthropometric variables on birth weight. A total of 125 mothers were followed up till delivery to collectthedataofdifferentvariablesandanalysedby(a)StatisticaVersion6and(b)MedcalcVersion11.6.The study shows the mean as well as standard deviation and standard error of different variables like age, prepregnancy maternal weight, weight gain in pregnancy, BMI and birth weight in tabulated form. Correlation matrix and regression equation shows that most variables have significant relation with birth weight of which weightgainhasthestrongestone(0.52,p<0.0001).Studyshowingstatisticallysignificantresultofmostofthe variables of mother and alteration of these with social and economic intervention definitely improves the outcomeofneonatesinrelationtotheirsurvival.
[J Indian Med Assoc 2016;114: 47-50]
Key words : Pre-pregnancy weight, BMI, Weight gain, Birth weight.
Neonatal and infant mortality and obviously morbidityisdirectlyrelatedtothebirthweightofthe baby and probably the most important and rerliable 1,2 indicator for their survival Though the causes of low birth weight are multifactorial, maternal anthropometric indices are important birth weight determinant Determination of standard maternal anthropometric variables affecting birth weight is important to suggest appropriate remedial measures. We conducted a hospital basedstudytofindouttheinfluenceofdifferentvariables like pre-pregnancy weight of mother, maternal height, weightgainduringpregnancyandpre-pregnancyBMIon birthweightofbabywiththeirstatisticalsignificance.
MATERIALAND METHOD
A prospective study regarding influence of maternal
Disclaimer
The information and opinions presented in the Journal reflect the views of the authors and not of the Journal or its Editorial Board or the Publisher Publicationdoesnotconstituteendorsementbythejournal. JIMA assumes no responsibility for the authenticity or reliability of any product, equipment, gadget or any claim by medical establishments/institutions/manufacturersoranytrainingprogrammeintheformofadvertisementsappearinginJIMAandalsodoesnotendorse orgiveanyguaranteetosuchproductsortrainingprogrammeorpromoteanysuchthingorclaimsmadesoafter — Hony Editor
DepartmentofObstetrics&Gynaecology IPGME&R,Kolkata700020 MD, DGO (Obstet & Gynaecol), Assistant Professor, At present : AssociateProfessor,RGKarMedicalCollege,Kolkata700004 MD(Obstet&Gynaecol),SeniorResident MBBS, MD (Obstet & Gynaecol), Assistant Professor Bankura SammilaniMedicalCollege,Bankura722102 MBBS,MS(Obstet&Gynaecol),RMO cum ClinicalTutor,RGKar MedicalCollege,Kolkata700004 MD (Obstet&Gynaecol),RMO cum ClinicalTutor MD (Obstet & Gynaecol), RMO cum Clinical Tutor, Calcutta NationalMedicalCollegeandHospital,Kolkata700014
MD,DGO(Obstet&Gynaecol),RMO cum ClinicalTutor
MD(Obstet&Gynaecol),AssociateProfessor
anthropometricindicesonbirthweightwasconductedata tertiary teaching institution from 1st January 2011 to 31st December 2011.Women included in the study were those who attended the antenatal clinic between 15-20 days of conception from 1st January 2011 and who delivered a term baby within 31st December 2011. The weight at 1520 days of conception (± 7 days of first missed period of almost regular cycle) is considered as the initial weight at 4 conception, that is, pre-pregnancy weight Period of gestation was calculated from the first day of the last menstrualperiodandafirsttrimesterultrasonography
The lowest correlation coefficient in our study is 0.21 and after multiplying by a constant, the minimal sample size in relation to our study comes to 96. The actual number of samples taken is 125 which is enough to get a conclusion.
The sample selection was done after excluding multiple pregnancy (with USG), smokers, polyhydramnios, any doubt about the period of gestation and any other factors which may be a confounding factor of weight gain.Weighing was done at each antenatal visit andattermwithinoneweekbyusingaweighingmachine (adult) with minimum clothing after correction of zero error to nearest 100 gram. Height was taken on level ground, without footwear against the wall to nearest 0.5 cm Baby weight was taken without
48 J INDIAN MED ASSOC, VOL 114, NO 5, MAY 2016
clotheswithastandardweighingmachineaftercorrecting zeroerror
Dataanalysiswasdonebythefollowingsoftware–(1) Statistica Version 6 [Tulsa, Oklahoma: Statsoft Inc.2001] and (2) Medcalc version 11.6 [Mariakenke,Belgium: MedcalcSoftware2011].
RESULTS
Aspersampleselectioncriteriaatotalof125pregnant women were followed up till delivery at hospital who delivered live born singleton babies within 31st December, 2011. The Table 1 summarises the characteristics of the study population. It shows that the mean age at conception is 24.78 years with a range of 1738years(S.D4.29,S.E0.38).Thepre-pregnancyweight( Mean 54.19 kg, with a range of 38 to 91 kg, S.D 6.33, and S.E 0.57) and maternal height (mean 157.64 cm, with a rangeof147to167cm,S.D4.16andS.E0.37)arethetwo parameters used to calculate the BMI, the mean of which is20.93.Theaveragebirthweightofthebabiesis2821gm (range 1608gm to 4130 gm), with S.D 595.60 and S.E 53.27. The mean weight gain is 9.53 kg (range 7.50 to 14.00kg,S.D
1.12andS.E0.10).
The data related to female babies (*) and male babies(+)is alsodocumentedinthesametableandshows that the range of BMI of mother and baby weight in relation to female babies are slightly lower without any statisticalsignificance,whichisanincidentalfinding.
In Table 2, the correlation matrix shows a statistically significant correlation of pre-pregnancy weight, weight gain, height of mother and BMI with baby weight. The dataoffemalebabies(*)andmalebabies(+)areseparately tabulated and show almost same result, but with slight variation.
The scatter plot of BMI versus baby weight shows slight but definite positive correlation between the variables(Fig1).
IntheTable3,showingMultipleregressionanalysisin relation to baby weight, weight gain in pregnancy shows the most significant (p<0.0001) positive correlation. Among the other variables, though height and prepregnancy weight are positively related, only the data in relation to height is weakly statistically (p=0.0242) significant.
1 — Descriptive Characteristic
DISCUSSION
Inourstudythemeantotalweightgain for all women is 9.53 ± 1.2 which is slightly higher than the mean of a study conducted among Indian women but comparable to the same study among 4 higher income group In our study the mean pre-pregnancy BMI is 20.93 ± 2.1, (which is derived from height and prepregnancy weight) but is much less than the BMI obtained in a western study done by Murrin C et al, which is 23.74 ± 4.21. It may be explained by the difference in the ethnic groups of the study population. A study conducted on Indian mothers in Karnataka shows comparable results to our study regarding BMI, height and pre2 pregnancyweight(18.4±2.4kg/m,154.2 ± 5.2 cm and 43.4 ± 6.6 kg) In our study the mean birth weight is 2821 + 595.60 whichisveryclosetotheabovestudy
In another study on Asian babies, the maternal height and maternal weight data were very close to our study but BMI was much higher than that of our study (24.8 2kg/m)


Table 2 — Correlation Matrix (Pearson’s Correlation Coefficient R values) (n = 125)
Practitioners' Series Practitioners' Series
likeobesity,diabetes,hypothyroidism, which may result in IUGR babies in women with increased pre-pregnancy weight.
Lastly, the predictive equation of birth weight was determined from our study, but for universal acceptance, a larger multicentric study is required for different race of people and differentethnicgroups.
CONCLUSION
Table 3 — Multiple Regression Analysis (n = 125) Regression Equation (in relation to baby weight), R2 – adjusted - 0.3530 Independent Coefficient t Pvalue Zeroorder
Pre-pregnancy weight, height, BMIandweightgainduringpregnancy are important maternal factors influencing birth weight of term babies. Any management, specially pre-pregnancy (girl child) immunisation, sanitation and antenatal nutrition through different nutritional programmes organised by the government may improve the birth weight. This may directly influence the mortality and morbidity rates of neonatesinourcountry.
REFERENCES
1 Yasmin S, Obrin D, Paul E, Costello A —Neonatalmortalityoflowbirthweightinfantsin Bangladesh. Bull World Health Organ 2001; 79: 608-14.
2 Cifuentes J, Bronstein JM — Mortality in low birth weight infants accordin g to level of neonatal at hospital of birth. Paediatrics May 2002:109:745-51.
Astudy on similar context which showed higher BMI at the first antenatal visit shows a greater percentage of bodyfatamongtheoffspring(birthweight)withstatistical significance
The correlation matrix of different variables (Table 2) showsthatthevariableslikeageareveryweaklysensitive for birth weight prediction. On the other hand, prepregnancy weight and weight gain in pregnancy are more significantly related to birth weight than BMI and height of mother It is very close to the observation of the study 9 conductedbyNShamsun et al
The scatter plot shows a positive correlation of BMI with baby weight. It is comparable to another study, where they show that the maternal pre-pregnancy weight, BMIandweightgainofdifferentgroupsareverysensitive anthropometricvariablesinrelationtobirthweight. Multiple regression analysis (Table 3) shows that apart from other maternal anthropometry, weight gain during pregnancy has an independent role in determining 6,10 birth weight which is very close to other observations . On the other hand, the independent variables height and weightbotharesignificant,butthesignificanceisslightly higher with height. This differs marginally from the analysis of another study, probably due to other confoundingfactors
3 Deshmukh JS, Motghare DD, Zodpey SP, Wadhwa SK — Lowbirthweightandassociatedmaternalfactorsinanurban area. Indian Pediatr 1998:35:33-6.
4 Shobeiri F, Nazari M — Patterns of weight gain and birth weightamongstIndianwomen. Iran J Med Sci Jun 2006:31: 94-7.
5 Murr n C, Segonds-P chon A Se f-reported prepregnancy maternal body mass index and infant birth weight. Ir Med J 2007;100:Suppl20-3.
6 Phaneendra Rao RS, Prakash KP, Sreekumaran Nair N — Influence of pre-pregnancy weight, maternal height and weight gain during pregnancy on birth weight. Bahrain Medical Bulletin 2001:23:22-6.
7 Tan KH, Yeo GSH. Influence of maternal height, weight and body mass index on birth weight in an Asian population. The internet journal of Gynaecology and Obstetrics 2009: 11: 15.
8 Reynolds RM, Osmond C, Phillips DIW, Godfrey KM — Maternal BMI, parity and pregnancy weight gain : Influence on offspring adiposity in young adulthood. The Journal of Clinical endocrinology & metabolism 2010:95:5365-9.
9 Samsun N — Maternal anthropometry as a predictor of birth weight. Public Health Nutrition 2007:10:965-970.
10 Frederick JO, Williams MA — Pre pregnancy body mass ndex, gestational we ght gain, and o her ma ernal characteristics in relation to infant birth weight. Maternal and child health Journal 2008:12:557-67.
Chemotherapy & diabetes : interaction of BMI & steroids on blood glucose levels : a short study
1 Riyaz Mohammed
A study was conducted to determine the interaction and interrelationship of BMI and steroids on blood glucose levels on 383 cancer patients on chemotherapy. During the study we have seen that prediabetics and patientswithhighBMIarepronetodevelopdiabeteswhichcouldhavebeenprecipitatedduetosteroids. A BMI between 25 and 30 should be viewed as medically significant and worthy of therapeutic intervention, especially in the presence of risk factors that are influenced by adiposity, such as hypertension, hyperglycemia, insulin resistance, dyslipemia, cancer. The present study was done to highlight strict glycemiccontrol,(FBS<110&PLBS<140-160mg/dL) J Indian Med Assoc 2016;114: 51-3] Key words : Chemotherapy Prediabetes High BMI Interrelationship Diabetes Steroids.
Glucocorticosteroids (steroids) have profound effects on glucose metabolism, particularly on postprandial hyperglycemia.Patientswithcanceroftenreceivesteroids asacomponentoftheirchemotherapy,asameasuretotreat orpre¬ventnausea,orasadjuvanttherapy
Instances of hyperglycemia during chemotherapy are known. Incidents, implications and literature on this subject are not easily available in India. Hence this study was conducted to make chemotherapists in India aware of the incidence and measure the blood sugar level before, during and after chemotherapy in diabetes and more so in un-established cases of diabetes as revealed in this study Occasionally an unknown diabetes mellitus case can even developseverecomplicationslikeDKA.
During the study we have seen that prediabetic and persons with high BMI are prone to develop diabetes whichcouldhavebeenprecipitatedbysteroids.
MATERIALSAND METHODS
Three hundred eighty three cases undergoing chemotherapyinBIACI&RCwereselectedrandomlyand studied.Theirpre,concurrentandpost-chemobloodsugar levelswererecordedat2nd,3rd,7thand14thday The Age, Sex, and BMI of the patients were noted along with diagnosis and the chemotherapy being given. The patients having fasting blood sugar level of 100-125mg/dl were identified and from them gathered information and included in the study.Patients having Hypertension, Coro
MD (Gen Med), Dip Diabetology, PGC Diabetology (USA), DFM (UK), PDCR, PGC Diabetology (IMA-AKN Sinha), Consultant Physician and Diabetologist, Department of Internal Medicine Basavatarakam Indo-American Cancer Hospital and Research Centre, Hyderabad500034
nary artery disease, CVD or acute and chronic complicationofdiabeteswereexcludedfromthestudy
A detailed history and examination was carried out, and baseline investigations like HBA1C, serum creatinine, microalbuminuria, lipids, retinal examination, chestX-rayandECGweredone.
Majority of the chemotherapeutic agents are given withdexamethasoneinadoseof8–16mgandincasesof multiple myeloma the dexamethasone is given as high as 40 mg. Most of the times dexamethasone causes derangementofbloodsugarlevels.
RESULTS
Among the 383 patients studied, 291(75.97%) cases remained at normal glycemic levels throughout chemotherapy and 92(24.02%) developed a derangement oftheirbloodsugarlevels.(Table1).
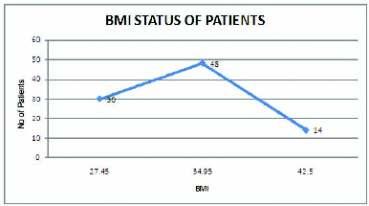
O u t o f 9 2 patients, average BMI was (Table 2).
• 30 patients with average BMI of27.45+/-2,
• 48 patients with average BMI of34.95+/-3,
• 14 patients with average BMI of42.50+/-2.
Table 1 92
76% Euglycemic Deranged glycemic status
Sixty eight cases (17.75%) reverted to normal glycemic status & 24 patients (6.26%) developed diabetes. Out of these 24, 20 cases developed diabetes and 4 cases developed acute complication like Diabetic ketosis and accelerated hypertension induced left ventricular dysfunction. These patients have BMImorethan32+/-5.(Table3).
Only one case having normal BMI went in to complications and developed DKA in our study The patient was a case of acute lymphocytic leukemia, which was given LAsparaginase and High dose steroid. The majority of patients who developed diabetes had BMI which was higher than normal and had various maladieslike Ca Breast, NHL, and MultipleMyelomafor treatmentwithchemotherapy.
DISCUSSION
After going through all the references which were 1-7 predominantly from western literature , many a times managing hyperglycemias is complicated. These patients may require higher doses of insulin to get blood sugar undercontrol.Especially,patientswhorequirelargedoses of steroids like cases of multiple myeloma, acute lymphocytic leukemia, Non-Hodgkin’s lymphoma, CNS lymphoma. In these cases the insulin requirement may varyfrom100-150unitsofinsulinperday It has been shown that patients on L-Asparaginase, Streptozocin and Cytokine interferon – alpha are associated with drug induced insulin dependent diabetes mellitus.
Prediabetesisthestateinwhichsomebutnotallofthe diagnosticcriteriafordiabetesaremet.Prediabetesisalso referred to as borderline diabetes, impaired glucose tolerance(IGT),and/orimpairedfastingglucose(IFG).
Impaired fasting glycaemia or impaired fasting glucose (IFG) refers to a condition in which the fasting bloodglucoseiselevatedabovewhatisconsiderednormal levels but is not high enough to be classified as diabetes mellitus. It is considered a pre-diabetic state, associated with insulin resistance and increased risk of cardiovascular pathology, although of lesser risk than impaired glucose tolerance (IGT). IFG sometimes progresses to type 2 diabetes mellitus.There is a 50% risk over 10 years of progressing to overt diabetes. A recent study cited the average time for progression as less than threeyears
• WHO criteria: fasting plasma glucose level from 6.1mmol/l(110mg/dL)to6.9mmol/l(125mg/dL).
• ADA criteria: fasting plasma glucose level from 5.6mmol/L(100mg/dL)to6.9mmol/L(125mg/dL).
Impaired glucose tolerance (IGT) is a pre-diabetic state of dysglycemia, that is associated with insulin
diabetes;particu
larlyundertheseconditions.
Obesity is a state of excess adipose tissue mass. The most widely used method to gauge obesity is the body 2 mass index (BMI), which is equal to weight/height (in kg/m). Other approaches to quantifying obesity include anthropometry (skin-fold thickness) densitometry (underwater weighing), CT or MRI, and electrical impedance.
BMI:1)<18.5 -Underweight
2)18.5-24.9 -Normal
3)25–29.9 -Overweight
4)30-39.9
-Obesity
5)>40 -Morbidobesity
A BMI between 25 and 30 should be viewed as medically significant and worthy of therapeutic intervention, especially in the presence of risk factors that are influenced by adiposity, such as hypertension and glucose intolerance, insulin resistance, dyslipidemia & cancer
However the present study was done to highlight the importanceofmaintainingstrictglycemiccontrol,(Target glucose levels are < 110 mg/dL pre-meal and < 140–160 mg/dL 2 hours postprandial) regular follow up of cases who have developed drug induced diabetes and maintaining strict glycemic control which prevent any further target organ damage due to uncontrolled glycemic status..
We are continuing our study to establish the interrelationofdiabetesandcancerchemotherapyagent.
CONCLUSION
ACKNOWLEDGMENT
resistance
IGT may precede type 2 diabetes mellitus by many years. IGTisalsoariskfactorformortality
The possible mechanism which was attributed to hyperglycaemiaandDKAandHONKwereinourpatients areasfollows:
(1)Steroidinduceddiabeticketoacidosis
(2) Chemotherapy induced insulin dependent diabetes mellitusleadingtodiabeticketoacidosis
(3) Steroid induced glucose intolerance superadded to ketoacidosis(probabilityofearlystarvationmayleadtoit)
As all of us know that steroid do cause diabetes and certain chemotherapeutic agents also induce diabetes whichcouldbetemporary?
Wehaveobservedandfoundthereisalsoanimportant role of high BMI in patients who are receiving chemotherapy. Hence, the idea of highlighting the importance (of patients with high BMI) developing andincreasedriskofcardiovascularpathology.
Many Physicians and Endocrinologists do know that obese persons (high BMI) are prone to develop diabetes duringthecourseofchemotherapy(asshowninthestudy), Hypertension,CAD,dyslipidemia,etc.
Thisstudyisverysignificantasitoutlinesthenecessity ofawarenessandprecautionstobeobservedwhendealing with patients with raised BMI without diabetes mellitus who are also likely to go in to hyperglycaemic and in extreme cases even ketoacidosis. They need urgent identificationandmanagementotherwisetheyarelikelyto go into complications. Some other patients without diabetes mellitus can become diabetic and require regular management like any other diabetic. Patients with high BMI and prediabetic patients are prone to develop diabetes. We have given special attention to such patients as these patients can be prevented from developing diabetes.
A BMI between 25 and 30 should be viewed as medically significant and worthy of therapeutic intervention, especially in the presence of risk factors that are influenced by adiposity such as hypertension, hyperglycemia,insulinresistance,dyslipemia,cancer The present study was done to highlight strict glycemic control,(FBS<110&PLBS<140-160mg/dL).
Our thanks to management of Basavatarakam IndoAmerican Cancer Hospital and Research Centre for permittingthisstudyanditspublication.
We also thank the Medical oncologist, Surgical oncologist, Radiation oncologist of the indo-American cancerhospitalwhosupportedusinthisstudy
REFERENCES
1 nduced hyperg ycemia and tumour chemotherapy –experimenta and cl n cal s ud es,os nkysp et,al, chemotherapy1990.
2 Weiser MA, Cabinillas et al, department of internal medicine,cancer 2004 sep1:101(5) : 1100- 1 relation between duration of remisson and hyperglycemia during inducedchemotherapyinALL.
3 Influence of type 2 diabetes and cancer future directions. clinical practiceofoncology2005(1)48-53.
4 Prevalence of transient hyperglycemia during induction chemotherapy in pediatric ALL. Stefanic R lowas MD et al , pediatric hematology- oncology, science university ,Poland ,Oregonpublishedonlineon3rdmarch2009.
5 Glucose intolerance during adjuvant chmeotherpy for breast cancer, tamos hickish et al online march 24th 2009, journal ofnationalcancerinstitute2009-10-101(7)537.
6 Pediatric blood cancer 2009:52:814-818, prevalence of transienthyperglycemiainL-aspaginateissignificantinALL.
7 Furnary AP, Wu Y, Bookin SO — Effect of hypergly¬cemia andcontinuousintravenousinsulininfusionsonoutcomesof cardiac surgical procedures: the Portland Diabetic Project. Endocr Pract 2004;10:21-33.
8 The ACE/ADA Task Force on Inpatient Diabetes. American Co ege of Endocr no ogy and American Diabetes Association consensus statement on inpa¬tient diabetes and glycemic control: a call to action. Diabetes Care 2006;29:1955–1962.
9 Clement S, Braithwaite SS, Magee MF — Management of diabetes and hyperglycemia in hospitals. Diabetes Care 2004;27:553–591.
10 Umpierrez GE, Isaacs SD, Bazargan N — Hyperglycemia: an independent marker of in-hospital mortality in patients with undiagnosed diabetes. J Clin Endocrinol Metab 2002;87:978–982.
11 Krinsely J — Effect of an intensive glucose man¬agement protocol on the mortality of critically ill adult patients. Mayo Clin Proc 2004:79:992-1000.
12 Furnary AP, Zerr K, Grunkemeier G — Continuous intravenous insulin infusion reduces the incidence of deep sternal wound infection in diabetic patients after cardiac surgicalprocedures. Ann Thorac Surg 1999;67:352-362.
13 Furnary AP, Gao G, Grunkemeier GL — Continuous insulin infusion reduces mortality in patients with diabetes undergoing coronary ar¬tery bypass grafting. J Thorac CardiovascSurg2003;125:1007-1021. CHEMOTHERAPY & DIABETES INTERACTION OF BMI & STEROIDS ON BLOOD GLUCOSE LEVELS
Practitioners' Series Practitioners' Series
Health Status of children under three years of age residing in slums of Rajkot City, Gujarat, India
1 2 3 4 4
Anupam Banerjee , Umed Patel , Pramod Verma , Ankit Viramgami , Mayur Vala
This study was designed to assess the health status and utilization of various health services among the children less than three years of age, residing in the slums of Rajkot city and was a part of a Multi Indicator Cluster Survey (MICS). Each slum area was designated as a cluster. The Rajkot Municipal Corporation (RMC) had 257 slum areas within its boundary limits. In stage one 30 clusters were selected proportionate to their size. In second stage 60 households were selected from each cluster. A total of 344 children less than three years of age were found in the 1800 households surveyed. The under three sex ratio was 965.71. Theprevalenceoflowbirthweightwas19.9%.Thecompletevaccinationcoverageinchildrenbetweenone to two years of age was 68.2%. Vitamin A coverage among the eligible children during the August 2010 round of the biannual Vitamin A campaign was 44.2%. Exclusive breast feeding in children less than six monthsofagewas81.8%.RegistrationofthechildrenintheMamtaSessions(HealthandNutritionDay)and in the local Anganwadi centre was 41%. There were 13.7% children who had presence of any morbidity duringthesurvey.Thestudyfoundthatspecialfocusneedstobegivenontheincreasingtheenrollmentof thechildrenintheMamtaDivassessionsaswellasinthelocalanganwadis.Focusshouldalsobegivenon improvingthequalityhealthcareofferedtothebeneficiariesinthesecenters.
[J Indian Med Assoc 2016; 114: 54-7]
Key words : Multi indicator cluster survey, cluster, quadrant, households, mamta sessions, complete vaccination, drop-out rate.
Children and women are classically recognized as the vulnerable sections of any society. Slums areas of a city are high risk areas for various disease transmissions. Maternal and child heath indicators among slum dwellers show that their health status is two to three times worse than those in the other urban areas Recognizing the seriousness of the problem, the 11th Five Year Plan has launched the National Urban Health Mission with special 2 focus on the slums and the urban poor This study was formulatedtoevaluatetheheathstatusofchildrenresiding intheslumareasofRajkotcity.
MATERIALAND METHOD
This study was a part of a ‘Multi Indicator Cluster Survey’(MICS)undertakentoassessthehealthstatusand utilization of various health services by the slum dwellers ofRajkotcity
Located in the center of the Saurashtra region of Gujarat, Rajkot is the headquarters of Rajkot district.
Department of Community Medicine, PDU Government Medical College,Rajkot360001
1MD(PSM)AssistantProfessor
2MD(PSM)AssociateProfessor
3MD(PSM),DIHProfessor&Head
4MBBS,Resident
‘slum area’ was designated as a cluster The Rajkot
Municipal Corporation (RMC) had identified 257 slum areaswithinthe23differentwardsofthecity Award-wise listoftheslumsofRajkotcitywasobtainedfromthehealth department of the RMC. In stage one, 30 clusters were selected proportionate to their size. From each cluster 60 ‘households’ were selected for detailed evaluation. A ‘household’ was considered as a group of persons who usually lived together and ate from the same kitchen. For adequate representation of the entire cluster, the slum area was divided into four quadrants. From each quadrant 15 households were selected for detailed questioning and examination.
Questions regarding various aspects pertaining to the health status and utilization of health services were asked to the mothers of all the children less than three years of age,whowerefoundinthe1800householdssurveyed.The Government of Gujarat had launched the MamtaAbhiyan (Health and Nutrition Day) in 2006 to increase the effective delivery of comprehensive maternal and child care Various services (antenatal, intranatal, post natal care, early neonatal care, vaccination details, growth monitoring, infant and young child feeding) rendered to the mother and child are documented in a pictorially designedinformativecardknownasthe‘MamtaCard’.
Details of the vaccination status of all the children between one to two years of age were obtained by oral recall and verification of Mamta/vaccination cards (when available). Coverage of the booster doses of DPT and OPV was elicited from all the children between two to three years of age. Details of breast feedingwereaskedforallthechildren. Various activities of the Mamta Abhiyan (registration, attendance pattern, growth monitoring and counseling) were assessed by looking into the Mamta Cards and specifically asking regarding the same to the mothers of the children. Registration of the children in theAnganwadis was also enquired. All the children who were present during the survey were examined for signs of severe malnutritionandseverepalmarpalloraspertheguidelines oftheIntegratedManagementofNeonatalandChildhood 4 Illness (IMNCI) modules The mothers were asked regarding the perception of their child’s health. Those mothers who complained of any health related ailment in their children (during the time of the survey) were further asked questions aimed to elicit the treatment seeking pattern as well as the very basic quality of treatment rendered.
A pre-tested structured performa was used to collect the data. The survey was conducted during October and November 2010 by the intern and post graduate students of the department under watchful guidance and observation of the department faculty All the data were entered and analyzed using Epi Info software Version 3.3.2
OBSERVATIONS
Atotalof344childrenlessthanthreeyearsofagewere found in the 1800 households surveyed. The various salient features of the population and the children are giveninTable1.
A Mamta Card or a vaccination card was available in 225outof344(65.4%)ofthechildren.
It is observed in Table 2 that the vaccine with the maximumcoverageisBCG(94.4%).Thecommonplaces of vaccination were Government hospital (Urban Health Centre or Corporation Hospital or the district Hospital) in 46.5% of the children, followed by Anganwadi centers (28.7%)andprivatehospital(24.8%).
Out of 106 children between two to three years of age, 65 (61.3%) received the booster doses of DPT and OPV betweentheagesof16-24months.
An effort was made to elicit the number of children who had received a dose of Vitamin A during the August 2010 session of the bi-annual round of pulse Vitamin A campaign. It was seen that 68 (44.2%) out of 154 eligible
Table 1 – Salient features of the population in the slums
children had received a dose of VitaminAduring August 2010round.
Table3showsthepatternofbreastfeedingobservedin the children. The rate of exclusive breast feeding in childrenlessthansixmonthsofagewas81.8%.
Table 4 deals with some of the activities carried out in the Mamta sessions. Weight is noted in 61.9% of all the children who had the Mamta card. However only 25% of
* Base =All children who had received BCG injection. BCG scar waslookedforintheleftupperarm.
†FullImmunization:Achildreceivingallthesevaccines–BCG,3 doses of DPT 3 doses of OPV (excluding Polio 0) and 1 dose of Measles.
‡ Drop Out Rate = Coverage of first dose minus coverage of third dose.
§ Complete vaccination dropout rate = Highest coverage antigen dose (in our case BCG) minus lowest coverage antigen dose (in our caseMeasles).
56 J INDIAN MED ASSOC, VOL 114, NO 5, MAY 2016
all the 144 parents (whose children were registered), had properunderstandingoftheirchild’sgrowthpattern.
Out of 344 children surveyed, 141 (41%) were registeredintheAnganwadicenters.
Visibleseverewastingwasnotedinnine(2.8%)outof 318 children who were physically present during the survey Bilateral pedal oedema and severe palmar pallor were noted in one (0.3%) and 13 (4.1%) of the 318 childrenrespectively.
Three hundred and twelve (90.7%) out of the 344 mothers felt that their child was ‘healthy’. There was no significant difference in the opinion of the mothers across the different age groups (<1 year, 1-2 years, 2-3 years) of thechildren(c =1.59,P=0.81). Theiropinionregarding the health status of the children did not vary significantly across the different sexes of the children (c = 0.38, P = 0.83).
There were 47 mothers (13.7%) of the 344 children who had some complain regarding their children’s health during the time of the survey The common complaints were – common cold (10.2%), fever (5.5%), and diarrhea (1.5%). Forty out of the 47 children (85.1%) who were having some complain were taken for treatment. The commonest place of seeking treatment was private hospitals (82.5%). Out of the 19 children who had fever, two (10.5%) were tested for Malaria parasites; while one out (20.0%) of the five children who had diarrhea was given Oral Rehydration Solution (ORS) during the episodeoftheillnessbythetreatingdoctor
Table 3 — Pattern of
breast
HEALTH STATUS OF CHILDREN UNDER THREE YEARS OFAGE RESIDING IN SLUMS OF RAJKOT — BANERJEE ET
4
3
5
animal milk, other liquid, soft mushy food etc.) were consideredas‘exclusivelybreastfed’.
Table 4 — Activities in the Mamta Sessions
Registrationandattendance: Registrationofchildren (InMamtasessions) 144/344 41.9 Registeredchildrenattending Mamtasessions
GrowthMonitoringandCounseling: WeightnotedinMamtaCard (amongchildrenvisitingthelast Mamtasessionandhavingthe MamtaCard) 73/118
Parentscounseledaboutthe weightgain(inthosechildren whoseweightisnoted
Mothers
DISCUSSION
Thepercentageofchildrenwithfullvaccinationinour studyis68.2%.Therehasbeennoincreaseintheratefrom 2006 (68.0%) which was obtained from the MICS undertaken in the Rajkot city slum areas. The rates are higher than that observed for the slum areas of Surat (25.1%), in a similar survey of 2007 Though Vitamin A (first dose) and Measles are intended to be given at the same age, none the less a vast gap of 17% is observed in this present survey This has however improved as compared to that of the MICS of 2006 where the gap betweenMeaslesandVitaminA(firstdose)was37%
The low coverage of the bi-annual Vitamin A during August 2010 session (44.2%) leaves a lot of scope of improvement.BhanderietalreportedVitaminAcoverage of 76.9% for August round of 2007 in the rural areas of 8 Anand district of Gujarat. In a survey conducted in the rural areas of Surendranagar district (which happens to be adjacent to Rajkot District) it was found that 59.1% of the eligible children had received the Vitamin A dose in 9 August2007roundofVitaminAcampaign
In the MICS conducted in the slums of Rajkot city and Bhavnagar city10 in 2006 it was found that 6.4% and 28.6% respectively of under two years age children had beenstartedonbreastfeedingwithinthefirsthourofbirth. Though this has increased to 61% in the present survey, it leaves a lot to be achieved especially considering that fact thatinitiationofbreastfeedingwithinthefirsthourofbirth 11 can reduce 22% of all neonatal mortality Exclusive
feeding for the first six months can cut down about will help in increasing the overall knowledge of the parents of the children which will ensure more client centered,demanddrivenqualityhealthcaredeliveryinthe future.
1 15% of all child deaths In the MICS conducted in the ruralareasofSurendranagardistrictofGujaratin2008,the rate of exclusive breast feeding in children (less than six monthsofage)was50%.
Bhanderi et al found the registration of children in the MamtaAbhiyan of rural areas ofAnand district of Gujarat tobe90.5%in2007 Theregistrationlevelof41.9%inthe presentsurveyiscompoundedbythehugefalloutorgapin the rendering of services to those registered in the Mamta Abhiyansessions:asisevidentbytheattendanceprofileof the children and monitoring and counseling of the growth andfeedingofthechildren(Table4).
The low (41%) registration of the under three children in the localAnganwadi centers is also an issue of concern. The neighboring district of Surendranagar had shown the registration of children (under three years) in the Anganwadicentersas44.6%intheyear2007-2008
In spite of so much repeated advertisements in print as well as in the mass media regarding the necessity of blood testing in cases of fever (for Malarial Parasites) and use of ORS in cases of diarrhea, their practice in real life by the doctors has remained abysmally low in the children who hadtheseillnessesduringthesurvey
The study undertaken in the slums of Rajkot city has highlighted the lacunae existing in the health status of the under three children. However, in any survey of this nature, the fallacy of recall bias should also be kept into consideration. This study elicited data predominantly of a quantitative nature. The causative factors behind the observations were not a part of the survey Reasons as to whyVitaminAcoverage(bothwithroutinevaccinationas well as in the bi-annual rounds) remains low need to be identified and addressed on a priority basis. Improvement in the quality of the Mamta Abhiyan sessions undertaken by the government in the Anganwadi centers of the city
REFERENCES
1 Rao BT, Thakur JS — Vulnerability assessment in Slums of UnionTerritory,Chandigarh. Indian J Community Med 2007; 32:189.
2 National Urban Health Mission (NUHM). Available from: hhhp://www.uhrc.in/module-Content Express [Accessed on 2011May05].
3 VitalStatisticsDivision,CommissionerateofHealth,Medical Services, Medical Education and Research, Gujarat State, Gandhinagar: Health review draft, Gujarat 2007-2008, D e c
: gujhea h gov n/Draft%20Hea th%20Rev ew pdf [Accessedon2008Dec30].
4 Integrated Management of Neonatal and Childhood Illness Modules Min stry of Hea th and Fami y We fare, GovernmentofIndia,NewDelhi2003.
5 CentersforDiseaseControlandPrevention.EpiInfoversion 3 3 2, 2005 Ava ab e from: www cdc gov/epi nfo/ [Accessedon2005Feb09].
6 Report on Multi Indicator Cluster Sampling survey in slums of Rajkot City conducted by Department of Community Medicine,PDUMedicalCollege,Rajkot2006.
7 Sharma R, Desai VK, Kavishvar A. Assessment of immunization Status in the Slums of Surat by 15 Clusters Multi Indicators Cluster Survey Technique. Indian J Pub Heath 2009;34:152-55.
8 Bhanderi DJ, Mukherjee SM, Gohel MK, Christian DK — An Evaluation of the Utilisation of Reproductive and Child Health Services provided by Government to the Rural Community of Anand District, Gujarat. Indian J Pub Heath 2009;53:250-52.
9 ReportonMultiIndicatorClusterSamplingsurveyinvillages of Surendranagar District conducted by Department of CommunityMedicine,PDUMedicalCollege,Rajkot2008.
10 Report on Multi Indicator Cluster Sampling survey in slums of Bhavnagar City conducted by Department of Community Medicine,GovernmentMedicalCollege,Bhavnagar2006.
11 Kishore J. Reproductive and Child Health Program-II. In National Health Programs of India. 9th ed. New Delhi: CenturyPublications;2011.p153.
Use of volatile production patterns to detect efficacy of antifungal agents against fungal pathogens
1 Pritam Sukul
Conventionalculturemethodsforinvitrolaboratorydiagnosisoffungalpathogensandpreclinicalevaluation of antifungal drug responses are very time consuming and require skillful technical experts. Few fungi are known to produce different volatile fingerprints. The objective of this project was to examine the potential for using qualitative volatile fingerprints by using a hybrid electronic nose system for anti-fungal susceptibility testing for a more rapid screening approach. Initial studies were carried out with three fungicides and an antioxidant to determine the ED50 and ED90 values to use for examining volatile production patterns. These studieswerecarriedoutonsolidagarmedia(forAspergillusfumigatus)andinliquidnutrientbrothmedia(for Candida albicans). The growth rate curves under different concentrations of these antifungals were used to determine the ED50 and ED90 values. Subsequently, the volatile production patterns of cultures of A. fumigatus and C. albicans were studied using an Electronic-nose (E-nose) system respectively after 72-120 and 24-72 hours incubation on solid malt extract agar (MEA) at 25°C. The data obtained from E-nose experiments were statistically analysed by using principal component analysis (PCA) and cluster analysis (CA)toshowthediscriminationanddifferencebetweengrowthresponsesofthesetwospeciesrelativetothe control and blank media. The best results for treatment discriminations were obtained in different PCA and CAsafterspecifictimesofincubationfordifferentantifungals.thebestresultswereobtainedforbenomyland tebuconazole against A. fumigatus after 96 hours, fluconazole and tebuconazole against C. albicans after 48 hours. From this study it was concluded that this alternative path for rapid screening could be beneficial for laboratory diagnosisand treatment as well as providinga measure of whether any drug resistance buildup is takingplace.Itmayalsohaveapplicationsinpre-clinicalandclinicalevaluationofnewpotentialdrugs. [J Indian Med Assoc 2016;114: 58-65]
Key words : antifungal susceptibility testing, cluster analysis, electronic nose, effective dose 50% & 90%, malt extract ager, metal oxide sensors, metal-oxide-silicon field-effect-transistor, principal component analysis, parts per million, ventilator associated pneumonia, volatile organic compound.
Aspergillosis and Ventilator Associated Pneumonia (VAP) are the most common microbial infections 2,3 due to colonization of bronchopulmonary tissue These two fungal infections of human has a vast geographical 2,9distribution These diseases are spreading rapidly worldwide including Europe and America. Aspergillus fumigatus and Candida albicans are two of the main 3,4 causativeorganismsforthesetwodiseasesrespectively A. fumigatus is a saprophytic fungus which helps in carbon and nitrogen recycling in the environment. It lives insoilandgrowsonorganicwastematerials Becausethe spores are mainly air borne conidia infection 4 predominantly occurs in bronchopulmonary tissue On the other hand C. albicans is a natural flora of the humancolon It lives with other microbial organisms as a parasite Because of excessive use of antibiotics,
constipation, abnormal and uneven diet Candida can invade the blood stream and the spores can affect some 3 humid tissue and organs like lung, bronchial tissue etc
Aspergillosis includes infection, allergy and fungal growth. In the past A. fumigatus was regarded as a week pathogenic fungus but in immunocompromised patients there is a significant increase in infections and an unexpected high mortality rate, due to invasive aspergillosis
VAP can be caused by colonization of the respiratory tractbyCandida.Nearly70%ofVAPcasesarereportedto involveC.albicans Thereisanincreasedriskofbacterial infection together with C. albicans because bacteria like 1 Pseudomonascaneasilyinteractwiththisfungus
The two above named fungi can easily be identified and diagnosed by conventional mycological confirmatory
University, England, UK
USE OF VOLATILE PRODUCTION PATTERNS TO DETECT EFFICACY OFANTIFUNGALAGENTS — SUKUL 59
7 tests in the laboratory; however this requires time To reduce the time of continuous real-time monitoring, diagnosis and treatment risk new sensor technologies like E-nosesarebeingdevelopedformorerapidresults
MATERIALSAND METHODS
Fungal species:
Two fungal species Aspergillus fumigatus and Candida albicans were used from two seprately incubated colonies in this study as positive controls to estimate effective dose 50% (ED50) and effective dose 90% (ED90) effects of some antifungal agents. This was an in vitro study which was done in Applied Mycology laboratory of Cranfield Health of CranfieldUniversity England.
Malt Extract Agar (MEA) and Nutrient Broth:
MEA medium was used as a growth culture medium for bothofthefungi.Itwaspreparedbymixingdistilledwater and MEA powder (CM0059, Oxoid, UK). The mixture was shaken and autoclaved for 30 minutes. The cooled medium was poured into 9 cm Petri plates (sterile). Nutrient broth was prepared by adding nutrient broth powder (CM0001, Oxoid, UK) in distilled water and autoclaved for 30 mins. The autoclaved, cooled medium waspouredinto250mlsterileconicalflaks.
Antifungal Drugs and Antioxidants:
Three antifungal drugs Benomyl, Tebuconazole, Fluconazole andantioxidentn-PropylGallatewereusedforbothofthe fungi in the in vitro studies. Drugs were supplied by the Applied Mycology GP as a stock solution with a concentration of 1000 ppm, 1000ppm and 2000ppm respectively The first two stock solution were kept at 4°C and the third solution was kept at 20° C incubation room. Forth stock solution with a concentration of 200 ppm was preparedbymixingtheaboveantioxidantwithethanol.
Spectrophotometer:
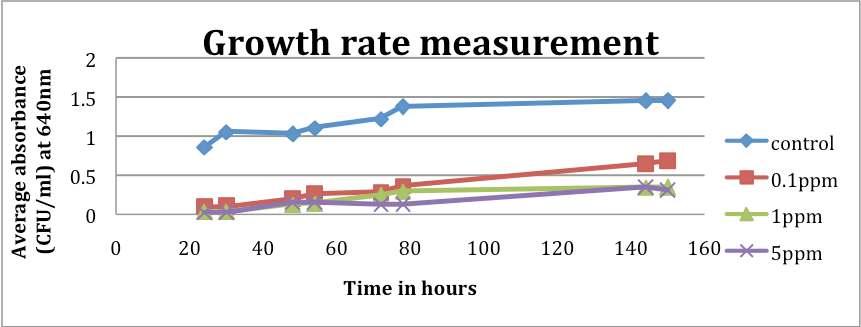
Optical densities of liquid cultures were measured by using a M350 Double Beam UV-visible spectrophotometer (Camspec, UK) in the Applied Mycology laboratory of Cranfield Health. It contains 7 cuvette cells. The absorbance of liquid culture mediumofCandidaalbicanswasanalysedat640nm.
E-nose:
This system to detect volatile organic compounds had a hybrid array of 12 Metal Oxide sensors and 10 Metal-Oxide-Silicon Field-Effect-Transistor sensors and a humidity sensor The E-nose system used in this study was an Applied Sensor 3320 model (Applied Sensor Group, Sweden). It contains a 12 position carousel for temperature controlled vial inoculation prior to analysis. Heating regimes of up to 65°C can be set using the software. The 10 MOSFET sensors operate in the temperature range 140°C - 170°C.Asoftware system was usedtocontrolthesamplingandtoanalysethesensordata.
Avacuum pump pulls an air sample by a hollow tube in a small chamber with an array of sensors. At first the
standardization of active elements of sensors is done by cleanandnon-humidairflowandflowofreferencegases. After that the sample handler brings the sensors to an odourant. The VOCs produced by the sample react with active element on the sensor As a result the steady state condition achieved in sensor specific time is recorded as the sensor response data in the single-processing unit. Aftergettingareading,awashinggaslikealcoholfumeis passed over sensors for a while (maximum 1 minute) to wash the active elements of sensors. In the next step the standardization is again done by reference gas to prepare the E-nose for another study cycle. Thus using an E-nose system we can identify, estimate, distinguish and characterize any unknown odour by following the mechanismofhumanolfaction.
In Vitro study:
ED50 and ED90 are the effective doses (ED) of antifungal agents at which the growth of myceliaandgerminationofsporesarereducedat50%and 90% respectively The ED50 and ED90 values of the antifungal agents were calculated by plotting growth rate data which were obtained from growth rate measurement on MEAplates and in Nutrient Broth media.After this the confirmatoryinvitrotestforvalues(obtainedfromgrowth rate measurements) were carried out using the Applied Sensor 3320 E-Nose. The MEA Petri plates (with and without known ED values) were inoculated with both fungi and incubated. Plates with A. fumigatus were incubated for 72, 96 and 120 hrs and for C. albicans incubation was done for 24, 48 and 96 hours. Cultured samples were taken after each scheduled time and were examined in the E-nose system to analyse the production patterns of volatile organic compounds E-Nose technology was used to detect the ED50 & ED90 value of antifungalagentsagainstAfumigatusandCalbicans. According to requirement, the spore cell suspensions of both A. fumigatus and C. albicans were prepared in Universal bottles (25ml) separately but in a similar way from 15-20 daysoldcolony(onpre-culturedonMEA)withthehelpof a sterile metal loop wire within the biological safety cabinettopreventcontamination.
Preparation of spore suspensions:
Growth rate measurements:
(a) Experiments with Benomyl and Tebuconazole: Different quantities of the stock solution of these two fungicides were mixed with molten MEA media within a biological safety cabinet to obtain a series of treatment concentration dilutions of 0.01ppm, 1.0ppm, 5.0ppm and 10ppm (ppm=µg/ml) respectively Three sterile Petri plates (9cm) were poured with each treatment concentration media and control (3 MEA replicate plates) and were used for both the fungi separately Onedropof0.5mmdiametersporesuspension was taken from the Universal bottle with the sterile metal wire-loop and inoculated at the centre of each Petri
60 J INDIAN MED ASSOC, VOL 114, NO 5, MAY 2016
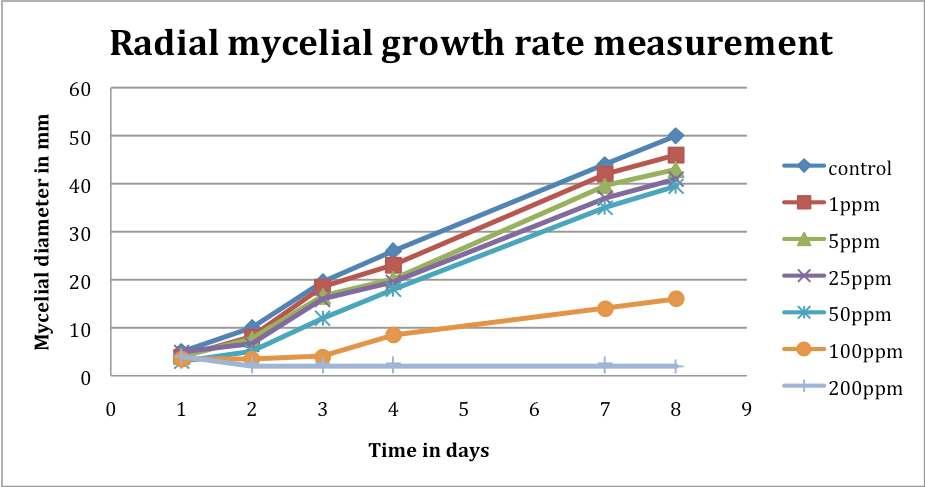
plateswithinasterileflowbench.Atotalof15plateswere inoculatedwithA.fumigatusandC.albicansrespectively A second set of experiments with 30 Petri plates (15 for each antifungal drug) with same treatment concentration and fungicides were also used for A. fumigatus. Here the main difference was that the spore suspension for inoculation was made from 15-20 days old colony stored in 4°C incubation room instead of 25°C incubation room (used for spore suspension for set 1). This was done to observe any expected difference in treatment response between the two sets due to the difference in inoculation temperature (external parameter) for making spore cell suspension. Petri plates of both sets were inoculated at 25°C. Every day the mycelial extension of mycelia (in mm) forA. fumigatus were measured in two directions at rightangletoeachotherwitharuleratthesametimeofthe day After measurement the Petri plates were kept at 25°C in closed plastic bags to prevent contamination with other microorganisms. The measurements were taken for 8 days.Themeanoftwodiametersweretakendailyforeach replicate of each treatment and control.The collected data wereplottedinMS-Excel(ProgramofMS-officeversion2007, Product of Microsoft Corporation) to obtain growth curves. For Ccndida comparison between different cell growth in amended antifungals qualitatively for 8 days. Key used was ‘x’- very little growth; ‘xx’- slow growth; ‘xxx’- increasing growth; ‘xxxx’- good growth; ‘xxxxx’verygoodgrowth.
(b)ExperimentwithFluconazole:Theinoculationand measurements were taken for 8 days as described previously for A. fumigatus and C. albicans. This experiment was also repeated only for A. fumigatus against higher concentrations of 10 - 100 ppm because lower concentrations had no effect. After inoculation, measurementsweretakenfor8days.
(c) Experiment withAntioxidant: Stock solution of nPropyl Gallate was mixed with molten MEA and used at sixdifferentconcentrations(1.0,5.0,25.0,50.0,100.0and 200.0 ppm) against growing colonies of Aspergillus and fivedifferentconcentrations(1.0,5.0,25.0,50.0and100.0 ppm) against Candida. For benomyl and tebuconazole the othermethodsweresameasdescribedprimarily.
(d)Growthexperimentinliquidculture:Liquidculture of nutrient broth was used for growth measurement of Candida. Only benomyl was excluded from this study becauseofitslowefficacyagainstC.albicans(observedin growth rate measurement experiment). Other two drugs were mixed with nutrient broth separately in different quantities to get the required treatment dilutions of 0.1, 1.00 and 5.00 ppm. Three replicate conical flasks (max vol. - 250 ml) were used for each treatment concentration andcontrol(onlynutrientbrothmedia).Eachconicalflask contained 150 ml of liquid medium was inoculated with 1.5 ml of spore cell suspension (7.45×10⁶ CFU/ml;
0.633mean absorbance at 640nm). From the next day the optical density of treatments were measured by M350 spectrophotometerin1mlcuvettesat640nmwavelength. Thedensitywasmeasuredwithrespecttoacuvettewith1 ml of sterile water as a blank. Two readings were taken everydayattwotimesatanintervalof6hours.Aftereach reading the flasks were kept at 25°C in the dark in the shaker. From the next day of inoculation the measurements were taken for 6 days. The growth curves were obtained by plotting the optical density against time inMS-Excel.
Calculation of Effective Dose (ED) values: ED values of all the antifungal agents against both fungi were calculated from their growth curves by plotting growth ratesagainstcorrespondingdose.
Experiment for early detection of volatile production and differentiation between treatments using volatile production patterns: Antifungal susceptibility testing by Benomyl and Tebuconazole against Aspergillus and by fluconazole and tebuconazole against Candida was done using E-nose. Molten MEA media were poured in 9 cm plastic Petri plates with previously calculated ED50 and ED90 values of benomyl, tebuconazole and fluconazole. The spore suspensions were made to a concentration of 1×10⁶ spores/ml by using a haemocytometer for each speciesfrom15-20daysoldcolonies.30Petriplateswere used in total forA. fumigatus (5 plates for each treatment, control & blank or negative control) and 25 plates were used for C. albicans (5 plates for each treatment and control). 100 µl of spore suspension was inoculated in the centre of each Petri plate and was spread with a sterile glassspreaderoverthewholesurfaceofthemedium.After this the plates were incubated at 25°C in the dark. They wereincubatedfor72,96and120hoursandfor24,48and 72 hours repetively At every time point 2 cm diameter plugs of agar were sampled randomly from each replicate plate with a sterile cork borer The sampled plugs were kept in sterile glass vials. The vials were capped with a screw-toplidandaseptum.Afterthisthevialswereleftfor an hour to equilibrate.At the end of the hour headspace of eachvialwasanalyzedwiththeE-nose. Data obtained from growth rate experiments were analyzed by Microsoft Office Excel (version2007).ThePCAonobtaineddatawasdonebythe inbuilt NSTSenstool software of E-nose 3320. The CAof these data was also done using Statistica 8. PCA is a complex unsupervised and multidimensional statistical method for linear pattern recognition. Here two or three dimentional plot is used to evaluate an n-dimentional analysis. It helps to correlate multidimensional data by exposing their similarities and dissimilarities. The
Data analysis :

USE OF VOLATILE PRODUCTION PATTERNS TO DETECT EFFICACY OFANTIFUNGALAGENTS — SUKUL 63
between multidimensional data is more
difference elaborately analyzed by another multivariate, linear pattern and unsupervised statistical method called cluster analysis (CA). This is also an unsupervised and multivariate analysis which enhances the diffrences between response vectors in n-dimentional space. In this methodaparticularclustersetisanalyzedregardinghigher degree of similarities between samples within a cluster rather than within different cluster. The results obtained from PCA and CA were refined by eliminating outlier (responses 25-50% higher than the mean of other replicates) and redundant sensors (value near 0) from experiment. These sensors generally have no effective contribution in the difference or correlation between treatments. Generally higher value for particular PC contributes more score to PCAloading plots and indicates towardsdiscriminatingsensor
RESULTS
In vitro Studies to determine ED50 and ED90 values:
To determine the ED50 and ED90 values of antifungal agents against A. fumigatus, daily mycelia extension on control and amended MEA plates were measured and plotted. Similar liquid culture studies with C. albicans by measuring and plotting mean absorbance values obtained from plain and amended nutrient broth media. After determining the ED50 and ED90 valuesofantifungalagentsthegrowthresponses to the effective doses of benomyl and tebuconazole against A fumigatus and fluconazole and tebuconazole against C albicans were analysed by PCA and CA of volatile fingerprints obtained from the E-nose system.
Calculation of Effective Dose values of antifungal agents:
Growth rates relative to control were used to calculate the 50% and 90% of effective doses (ED50 & ED90) of employed antifungal agents against both of the fungal species (Table 2). In liquid media the highest employed doses of tebuconazole and fluconazole were regarded as the 90% effective dose. Any less effective or ineffective treatment as n-Propyl Gallate was excluded and not accounted in the following Table (Table 2) of ED50andED90values.
Electronic nose detection of differences between cultured ED50 and ED90 concentrations:
After the calculation of ED50 and ED90 values, the rapid discrimination between growth responses of A. fumigatus and C. albicans against calculated effective doses (ED50 and ED90) of employed antifungal drug treatments was measured in this in vitro study. Thiswasthefinalobjectiveofthisstudy The72120 hours period was chosen for A. fumigatus and24-96hoursperiodwastakenforC.albicans for early detection and differentiation of their
growth responses The significant identification of microscopic growth response and treatment differentiationareverydifficultinsuchearlystagesbutthe PCA and CA of volatile production pattern by using Enosesystemcanhelpinearlydetectionanddifferentiation betweenantifungaltreatments.
ThePCAoftheresponseofthehybridsensorbasedEnosetoinaculatedtreatmentofammendedMEA(atED50 and ED90 of benomyl and tebuconazole) and positive control of A. fumigatus togather with blank MEA (negativecontrol)after72,96and120hoursandsimilarly for C. albicans with ammended MEA with the ED50 and ED90 of fluconazole and tebuconazole and positive controle after 24,48 and 72 hours were presented in PCA plots to account the data which are described by the principalcomponents.
The hierarchical CA of these data by using Euclidean distance were done to meassure the distance between sample forming clusters and Ward’s linkage method to create the distance between the clusters. The CA dendrogram showed distinct clusters of treatment groups, controlesandblank.
DISCUSSION
Conventional culture methods are time consuming and always costly. Early detection and rapid identification is
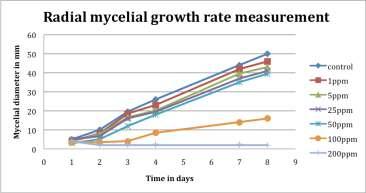
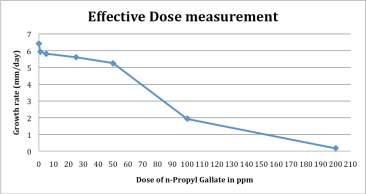
Table 1 — Comparative growth for C albicans of control and against 0.1, 1.0, 5.0 and 10.0ppm concentration of tebuconazole
Concentrationof fungicide noofobservation
essential in the fields of Antifungal susceptibility testing (AST) for treatment actualisation.An E-nose system was used for rapid assessment of treatment responses of antifungal drugs against A. fumigatus and C. albicans. Firstlytheconventionalculturemethodswereusedinboth solid and liquid media to determine the effective doses of employed antifungal agents against those two fungi.Then the volatile production patterns were analysed to rapidly discriminate between fungal species growing against amended treatments, controls (un-amended) and blanks (only media without fungal species). The early detection and differentiation between treatment responses were done within 120 hours and 72hoursofincubationforA.fumigatusand C. albicans respectively by analysing their volatile fingerprints. Similar studies were donewithtenmicrobialorganismincluding A. fumigatus and C. albicans for rapid 6 identification of each individual Three antifungal drugs benomyl, fluconazole and tebuconazole were used against the fungal isolates. In culture studies, among these threedrugsbenomylandtebuconazolewere effective against A fumigatus and fluconazole and tebuconazole were effectiveagainstC.albicans.TheED50and ED90 values were calculated only for these cases(Table2).Higherdosesoffluconazole were also remain ineffective against A. fumigatus. In this study benomyl was not used in further against Candida and fluconazole was excluded from E-nose experimentswithAspergillus.Higherdoses of antioxidant (n-Propyl Gallate) were
relatively effective against Aspergillus. Due to having a low efficiency it was excluded from further experiments. The discrimination between growth responses of A. fumigatus growing on plain media (control), media amended with the ED50 and ED90 of benomyl and tebuconazole and negative control or blank (only media) were measured after 72-120 hours Highest discriminationswereobtainedafter120hoursforbenomyl and 72 hours for tebuconazole. Even the discrimination between these two drugs were successfully observed after 96hours.
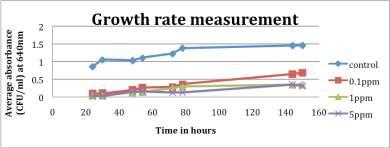
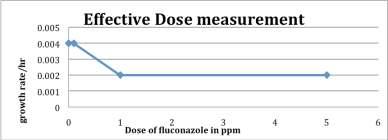
Table 2 — The calculated effective dose (ED50 & ED90) values of employed antifungal agents
ED50&ED90valuesfordifferentantifungalagents: FungalSpecies
Aspergillusfumigatus Candidaalbicans
Set1 Set2
Antifungalagentsand EffectiveDose
BenomylED50 0.3ppm 0.25ppm Noteffective
BenomylED90 1.23ppm 0.57ppm Noteffective
TebuconazoleED50 2.16ppm 2.16ppm 0.99ppm
TebuconazoleED90 4.22ppm 4.18ppm 5ppm
FluconazoleED50 Noteffective Noteffective 1ppm(Example;Figure3&4)
FluconazoleED90 Noteffective Noteffective 5ppm(Example;Figure3&4)
n-PropylGallateED50 72ppm(Example; Figure1&2) Notapplicable Lesseffectiveso Notapplicable
n-PropylGallateED90 162ppm(Example; Figure1&2) Notapplicable Lesseffectiveso Notapplicable
Table 3 — Best discrimination of volatile fingerprints found for different antifungal agents against fungal pathogens in PCA and CA FungalSpecies Aspergillusfumigatus Candidaalbicans
AntifungalagentsandEffectiveDose Hoursforhighestdegreeofdiscriminationresults
BenomylED50&ED90 120hours Notapplicable
TebuconazoleED50&ED90 72hours Notapplicable
Benomyle ED50&ED90& 96hours
Tebuconazole,ED50&ED90 (Example;Figure:5) Notapplicable
FluconazoleED50&ED90and Notapplicable 48hours TebuconazoleED50&ED90 (Example;Figure:6)
Among these two drugs tebuconazole showed relatively rapid response and efficacy than benomyl. The growth responses of C. albicans growing on media (control) and those amended with the ED50 and ED90 of fluconazole and tebuconazole were measured in the E-nose system after 24-72 hours.The best discriminations were obtained fromthePCAandCAafter48hours.Bothofthedrugshad shown almost equal efficiency against Candida. The sensorresponsesoftwodrugsamplesandcontrolsamples wereobtainedasdistinctlyseparateclustersbutthesensor responses against ED50 and ED90 values of individual drugs were obtained as a mixed cluster Different studies have shown relevant influence of culture media on volatile production patterns of microorganisms 10. However, there are some contradictory results regarding influence of media on volatile
production.
In a study of four
dermatophyte species responses after 96 hours incubation where except the media all other parameters were constant5. This study did not show any influence ofmediaonfungalgrowth.Ihave measured the ED values in the EnoseexperimentwithCandidaon solid MEA media and the discriminations I have obtained were according to expectations. I have used the spore suspension with 106 CFU/ml for inoculation in E-nose experiments. In my opinion a highe
pore concentration would be able to give quicker results. Due to having faster growth rate the
discriminations are more rapidly identifiable Candida Such studies can authenticae the use negative controls or blank by PCA. This study can potentialy contribute to the preclinical drug data bank of pharmaceutical industries for future antifungal drug research and clinical evaluation (personal conversation between me and my research supervisor
Professor Naresh Magan, Director of research, Cranfield Health) Recent studies have also shown the d i f f e r e n t i a t i o n b e
dermatophyte infection in humans and animals8 Development in sensor technologies can bring a revolutionary change and perfection ofinvitrotreatmentanalysisinfuture.
ACKNOLEDGEMENTS
My sincere thanks and gratitude to my supervisor Professor Naresh Magan (Director of research Cranfield Health, UK), Neus Plans Pont and Esther Baxter (Technitian Applied Mycology Laboratory, Cranfield Health, UK) for their consistant help and support throughoutmyprojecttomakeitasuccess.
REFERENCES
1 AzoulayE,TimsitJean-F,TaffletM,LassenceAde,Darmon M, Zahar Jean-R, et al — Ventilator-Associated Pneumonia and Subsequent Pseudomonas Candida Colonization of the Respiratory Tract: American College of Chest Physicians, CHEST 2006;129:110–7
2 Davis C—- Candida albicans. [Descriptions of Fungi and Bacteria www cabi org (CAB ABSTRACTS): CAB I n t e r n a t o n a 2 0 0 8
http://www.cababstractsplus.org/abstracts/Abstract.aspx?A cNo=20056400871(accessed Jan15,2009)
3 J o n e s W T r e d , Headaches, Irritable, Aches And Pains? I Cou d Be Candida!: isnare.com Articles, 2 0 0 8 http://www anysub ect com/c and da-treatment-cand dainfection- a b canscand da-symptom asp (accessed Jan15,2009)
4 Latgé Jean-P — Aspergillus fumigatus and Aspergillosis: Amer can Soc e y or Microbiology: Clin Microbiol Rev 1999;12 310-350 http //www pubmedcentra n h gov/art clerender fcgi?art d =88920 (accessed Jan 15, 2009).
5 Magan N, Sahgal N, Monk B, Was l M Trichophyton spec es use of vo a e ingerpr n s or rap d den ficat on and discr m nation: Brit sh Journa of Dermatology 2006; 155: 1209-16.
6 Moens M, Smet A, Naudts B, Verhoeven J, Ieven M, Jorens P, et al Fast identification of ten clinically important microorganisms using an electronic nose: Letters n Appl ed Microbiology2006;42:121-6.
7 NagalHT,Gutierrez-OsunaR, Schiffman SS — The WHO and WHY of ELECTRONIC NOSES: IEEE SPECTRUM 1998;35:22-31.
8 Sangha N, Magan N Fungal volatile fingerprints: d scrimination between derma ophyte spec es and strains by means of electronic nose: Sensors and Actuators B,InPress.
9 The Aspergi us website [owned by Fungal Research Trust]- Aspergillosis, 2008 http://www.aspergillus.org.uk/ asperg los s rameset html (accessed Jan15,2009)
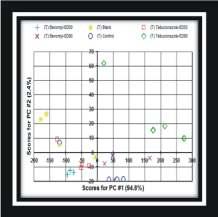
Fig 5 : PCAscore plot differentiating between plain MEA(blank),A. fumigatus growing on plain MEA(control) and ED50 and ED90 of benomyl and tebuconazole treatments after 96 hours [Upper left picture]. CAof blank,A. fumigatus growing as control and against ED50 and ED90 of benomyl and tebuconazole treatments after 96 hours. (Key: B – benomyl and T –tebuconazole) [Upper right picture]
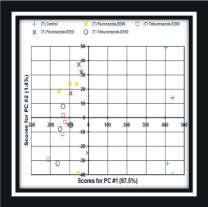
Fig 6: PCAscore plot differentiating between C. albicans growing on plain MEA(control) and ED50 and ED90 of fluconazole and tebuconazole treatments after 48 hours [Upper left picture]. CAof C. albicans growing as control and against ED50 and ED90 of fluconazole and tebuconazole treatments after 48 hours. (Key: F – fluconazole, T – tebuconazole) [Upper Right picture]
10 Turner, Anthony PF, Magan N — Electronic noses and disease diagnostics: NATURE REVIEWS. Micro-biology 2004;2:161-6.
We request you to send QualityArticle addressed to : Hony. Editor, Journal of IMA(JIMA), 53, Sir Nilratan Sircar Sarani (Creek Row), Kolkata 700 014
Dr. Debasish Mukherjee Dr. Santanu Sen Hony. Editor, JIMA Hony. Secretary, JIMA Hony. Secretary, IMA Bengal