15 minute read
Sudhir Mehta, Shaurya Mehta, Prabhav Bhansaly


JOURNAL OF THE INDIAN MEDICAL ASSOCIATION, VOL 118, NO 07, JULY 2020
Review Article RDW & RBC Histogram — All that Physicians should Know & Apply in Clinical Practice
Advertisement
Sudhir Mehta 1 , Shaurya Mehta 2 , Prabhav Bhansaly 3
Traditionally, anemias have been classified on the basis of blood indices (MCV, MCH, and MCHC) and reticulocyte count (reticulocyte production index- RPI). This traditional classification has enjoyed long innings with pathologists and hematologists. Newer automated blood cell analyzers provide an index of red cell volume distribution width (RDW) or heterogeneity and a histogram display of red cell volume distribution. This write- up on classification of anemias based on mean corpuscular volume (MCV) and heterogeneity (RDW) will help clinicians in the initial classification of anemias based on the print-out of automated counters. Also, this new classification obviates the use of reticulocyte count in the initial categorization of anemias. Understanding of RDW & RBC histogram is useful not only in diagnosing early deficiency states when RBC indices are normal but also, in following these patients after treatment, whether the response is physiological or pathological.
[J Indian Med Assoc 2020; 118(7): 18-23]
Key words : Cell counter, RBC histogram, RDW, MCV.
The present-day classification of anemia is dependent on values of blood indices (MCV, MCH, and MCHC) and the corrected reticulocyte count (reticulocyte production index-RPI) 1,2 . The change from chamber counts to flow cytometry for routine blood counts has brought not only improved speed and precision, but also new measurements permitted by the analysis of large numbers of single-cell measurements. The distribution of red cell volume now is displayed in histogram form 3 . Measured as coefficient of variation (CV) and reported as red cell distribution width (RDW), the heterogeneity of distribution of red cell size (the equivalent of “anisocytosis” in analysis of peripheral blood smear) now forms part of the reported automated blood count. The present article highlights the fact that using the data generated from the automated hematology analyzers in terms of MCV and RDW, the anemias can be re-classified without the consideration of RPI and how the classification based on the mean and heterogeneity of red cell size is more physiologic.
Before discussing this new classification, a basic
1 MD, MNAMS, FRCP (London), FRCP (Edin), FACP (USA), FICP, Senior Professor & Head, Medical Unit, Department of Medicine, SMS Medical College & Attached Group of Hospitals, Jaipur, Rajasthan and Corresponding Author 2 MD, DNB Nephrology Trainee, Department of Nephrology, Jaslok Hospital & Research Centre, Mumbai 3 MD, Senior Resident, Department of Medicine, Maulana Azad Medical College, New Delhi
Received on : 03/03/2020 Accepted on : 07/03/2020 Editor's Comment :
RDW has
added new dimension to the understanding of RBCs given more meaningful clinical classification of
anemias
given a bedside parameter to make prompt clinical
diagnosis of anemia
great importance in detection of early iron
deficiency & megaloblastic anemias when RBC indices are normal
knowledge of RBC histogram and its components is put forth for better understanding.
Histogram :
Hematology histogram is a graphic representation of different blood cell types. Hematology analyzers count and size thousands of cells to produce a histogram. A histogram is displayed by plotting the number of cells on the y-axis. The cell size in fl is displayed on the x-axis.
Red Cell Histogram :
A hematology analyzer aspirates the blood sample, measures, dilutes and feeds it into the transducer chamber. During each analysis, analyzer’s pneumatic system creates a vacuum and blood cells passes through the aperture on one end of the transducer chamber. This causes change in the resistance of the conductive diluent. RBC and platelets are counted simultaneously in the same channel. Particles falling between 2fl and 30 fl are grouped together as platelets, while particles larger than 40 fl are counted as red cells (Fig 1).
18
JOURNAL OF THE INDIAN MEDICAL ASSOCIATION, VOL 118, NO 07, JULY 2020
Fig 1
The RBC histogram has various components (Fig 2). The MCV is calculated by drawing a perpendicular from the peak to the baseline. The point where it intersects is the MCV. RBC abnormal distribution flags appear when the RBC histogram shape, width or position exceeds certain limits. In this situation, the smear should be scanned for abnormal RBC morphology such as anisocytosis, poikilocytosis, RBC agglutination, fragmented RBCs, rouleaux formation, multiple RBC populations (following blood transfusion). A RBC histogram may show double or multiple peaks in dimorphic anemia, following blood transfusion, sideroblastic anemia or when there is marked reticulocytosis.
When MCV is very low (<55fl), RBC histogram may merge with platelet histogram. In this situation, both RBC and platelet counts will be inaccurate.
Factors producing falsely high RBC count include 19

Fig 2
presence of large platelets, marked thrombocytosis and fragmented red cells. Falsely low RBC count is generated in presence of cold agglutinins, EDTAdependent agglutination or RBC lysis due to mishandling. Falsely high MCV is produced by red cell agglutination, excess EDTA, EDTAdependent agglutination or samples stored at room temperature. Falsely low MCV is produced by hypochromic RBC, severe anemia associated with marked thrombocytosis and increase in ambient temperature. The red cell distribution width (RDW) is a measure of anisocytosis i.e. this value indicates the degree of red cell size variation or how much difference exists between the largest and smallest red cells. This value is derived from the MCV histogram. An increased RDW corresponds with an increase in anisocytosis on the peripheral smear. The RDW is reported in two ways. The RDW-SD measured in fl is determined by measuring the actual distribution width of the RBC population at 20% above the baseline. The RDW-CV is the coefficient of variation based on the standard deviation of the distribution width divided by the MCV. The RDW is only available if it is included in the instrument menu. Although different manufacturers use slightly different methods of obtaining data, the RDW is generally thought of as the coefficient of variation of red cell volume distribution.
RDW-CV = (standard deviation of RBC volume / mean MCV) X 100 1 SD reflects the size variation of the erythrocytes round the mean. As the 1 SD is divided by the MCV, the RDW-CV also depends on the mean size (MCV) of the erythrocytes.
RDW-CV is sensitive to pick small RBCs (microcytes) in the blood.
Reference values: 11.5-14.5%
RDW-SD is the actual measurement of the width of the erythrocyte distribution curve. This measurement is performed at a relative height of 20% above the baseline. RDW-SD is more sensitive to pick large RBCs (macrocytes).
Reference values: 35-45 fL.
The RDW, coupled with the MCV, gives more relevant information than an individual index. The following is an attempt to clarify the relationship of the MCV and RDW. 1. Red cells that are all microcytic or
macrocytic will have a RDW in the reference range
JOURNAL OF THE INDIAN MEDICAL ASSOCIATION, VOL 118, NO 07, JULY 2020
and a decreased or an increased MCV. 2. Red cells that vary in size and have an average size within the reference range will have an increased RDW and a normal MCV. 3. Red cells that vary in size and have an average size below or above the reference range will have an abnormal MCV and RDW. In essence, RDW in conjunction with MCV can provide a means to reclassify anemias (Tables 1,2,3). Also, it is worth mentioning that no erythrocyte disorder can have low RDW. Low RDW is not observed normally but theoretically, it is possible only at marrow level when RBC produced by marrow have less heterogeneity than the accepted normal. Low RDW with low MCV is quoted in thalassemia minor and likewise, low RDW with high MCV in aplastic anemia. But in general, both these fall under normal RDW.
DISCUSSION
The initial classification of anemia can be improved substantially by including RDW and histograms of red cell volume as these variables have become part of automated hemogram. Because the MCHC varies little except in severe iron deficiency, the terms “hypochromic” and “normochromic” parallel low or normal MCV and therefore are redundant 4 . Use of MCV and RDW suggests the new terms of homogeneous microcytic (normal RDW, low MCV), heterogeneous microcytic (high RDW, low MCV) and so forth (Tables 1,2,3).
Nutritional deficiency, whether of iron, folate or vitamin B12, always causes increased red cell volume heterogeneity. While these patients are anemic on the average, even those who are not anemic have high RDW. As the nutritional deficiency progresses, more abnormal cells are produced and admixed in the peripheral blood 5 . In early or mixed nutritional deficiency, RDW is high while MCV remains within the normal range; heterogeneous normocytic indices then are the earliest clue.
In contrast, normal RDW accompanies pure hypoproliferative anemia resulting from chronic disease, marrow toxicity or aplasia, independent of the MCV; homogeneous micro-, normo-, macrocytic anemia. Thus, early iron deficiency is heterogeneous normocytic in contrast to chronic disease, which is homogeneous normocytic; more advanced iron deficiency is heterogeneous microcytic, in contrast to thalassemia minor, which is homogeneous microcytic. Patients with long standing aplastic anemia have high MCV unless they have been transfused. Since the RDW is normal, such aplastic states are associated with a homogeneous macrocytic anemia in contrast to patients with folate or vitamin B12 deficiency 20
Table 1 — Classification of microcytic anemias on basis of RDW MCV low & RDW normal MCV low & RDW high (microcytic homogeneous) (microcytic heterogeneous) Alpha thalassemia minor Iron deficiency Beta thalassemia minor HbS-beta thalassemia Hb E trait Homozygous Hb E Anemia of chronic disease Severe thalassemia- HbH disease, Hb E/beta thalassemia, homozygous beta thalassemia Red cell fragmentation
Table 2 — Classification of normocytic anemias on basis of RDW
MCV normal & RDW normal MCV normal & RDW high (normocytic homogeneous) (normocytic heterogeneous)
Normal Early iron deficiency Chronic liver disease Microangiopathic hemolytic anemia Hb S & C trait Hereditary spherocytosis with spleen Transfusion Myelofibrosis Acute bleeding Hb SS disease Hereditary spherocytosis Hb SC disease without spleen Anemia of cancerChemotherapy acute leukemia, solid tumors CLL, CML
Table 3 — Classification of macrocytic anemias on basis of RDW
MCV high & RDW normal MCV high & RDW high (macrocytic homogeneous) (macrocytic heterogeneous)
Aplastic anemia Normal newborn infants Preleukemia Folate deficiency Vitamin B12 deficiency Immune hemolytic anemia Hemolytic disease of newborn Aplastic anemia in remission Cold agglutinins Acute leukemia (on treatment & post-BMT)
(heterogeneous macrocytic) 6 .
Among the hereditary hemoglobinopathies, there is a direct relation between anemia and heterogeneity 5 . Hemoglobin S or C trait is associated with a normal RDW unless there is concomitant iron or folate deficiency 7 . While heterozygous thalassemia generally is associated with normal hemoglobin and RDW, when there is slight anemia associated with thalassemia, RDW will be increased slightly. Likewise, in hemolytic disorders, “shift” reticulocytosis and therefore an increased MCV is proportional to the duration and degree of anemia 8 . When reticulocytosis is due to transient blood loss or hemolysis or to
compensated hemolytic anemia, reticulocytes are only
JOURNAL OF THE INDIAN MEDICAL ASSOCIATION, VOL 118, NO 07, JULY 2020
5-8% larger than and nearly as heterogeneous as the cells into which they mature and the MCV and RDW are normal. Therefore, in increased red cell destruction from any cause and with any MCV, nonanemic compensated disorders are homogeneous; in contrast, anemic disorders are heterogeneous.
Chronic lymphocytic leukemia, cold agglutinin disease and RBC fragmentation all have artifactually abnormal MCV and RDW because flowcytometry technology defines red cells by volume thresholds instead of hemoglobin pigmentation. Any cell 36-360 fl will be counted as a red cell; any spurious cell that is >1% as numerous as the red cells will influence the reported values.
Case-based Discussion :
Case 1 : A 50 years old man presented in Medicine OPD with shortness of breath. On examination he had marked pallor. An automatic haematology analyser revealed Hb of 6.8gm/dL, MCV of 53.3 fL with RBC histogram peaking to left, high RDW-CV and normal WBC and Platelet histograms.
Case 2 : A 20 years old primigravida presented in antenatal OPD for routine checkup. CBC by haematology analyser revealed Hb of 11.5gm/dL, total RBC of 6.55 million/uL, MCV of 58.2 fL and RDW 25.6 suggestive of homogenous population of RBCs.
Case 3 : A 18 years old pure vegetarian male presented to medicine OPD with mild icterus and easy fatigability. On examination he had mild pallor. Blood analysis showed Hb of 8.2 gm/dL, MCV of 113.4 fL and RDW of 119.4 fL with shift of RBC histogram to right.
Case 4 : A 12 years old boy presented with marked pallor, purpura and fever. Complete blood count revealed pancytopenia. RBC histogram skewed to right, RDW was normal. WBC histogram shows lymphocyte peak and faint neutrophil dome. Platelet histogram has 21 abnormal distribution and descending slope not touching baseline.
Case 5 : A 55 years old male presented with icterus and occasional hematuria. Complete blood count revealed Hb of 11.2gm/dL, total RBC count of 2.24 million/µL, MCV of 98.2fL, Hct-22%, MCH 50 and MCHC 50.9.
Now a detailed study of the cases :
Case 1 : Iron Deficiency Anaemia (IDA)
A low MCV with high RDW (i.e anisocytosis) suggests iron deficiency anaemia (Table 1). The RBC histogram is broad with most cells in the microcytic area. IDA was confirmed by Iron studies & presence of occult blood in the stool.
Case 2 : ß-thalassemia minor.
Low MCV with normal RDW suggests heterozygous hemoglobinopathy like ß-thalassemia (Table 1). RBC histogram shows a microcytic peak with narrow base as the cells shows very little size variations. Hb is normal but TRBC is disproportionately high as compared to low MCV 58.2. PBF examination revealed uniformly sized RBCS (homogenous RBCs, normal RDW). Hb Electrophoresis by HPLC revealed high HbA2 suggestive of Beta-thalassemia trait.
Case 3 : Megaloblastic Anaemia.
In this case, MCV is high with increased RDW (heterogenous RBCs) suggestive of most common cause i.e. megaloblastic anemia (Table 3). RBC histogram has shifted to the right with large population of RBCs seen in 150-200 fl range. Diagnosis is confirmed by estimating serum Vitamin B12 & RBC Folic acid.
Case 4 : Aplastic Anaemia
Pancytopenia with macrocytic anemia, normal RDW is suggestive of aplastic anaemia (Table 3) which was later confirmed on bone marrow biopsy. WBC
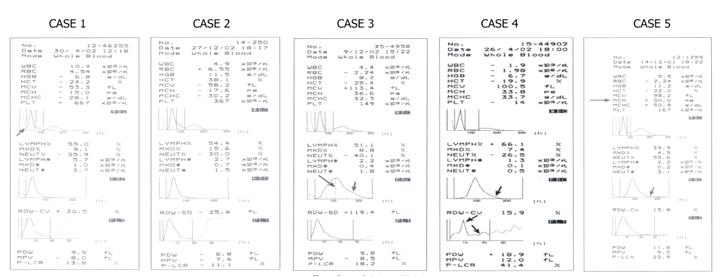
histogram revealed predominant lymphocytic
JOURNAL OF THE INDIAN MEDICAL ASSOCIATION, VOL 118, NO 07, JULY 2020
population with scanty neutrophils.
Case 5 : AIHA with cold agglutinins
Complete blood count shows mild macrocytosis (MCV-98.2fl) with disproportionately low TRBC & haematocrit with high MCH, MCHC. RBC histogram revealed a descending slope extended to right. In this case agglutinated RBCs produced a lower RBC count resulting in spuriously high MCH & MCHC.
Role of RDW In Diagnosis of Early Iron Deficiency & Its Followup (Fig 3)
In early iron deficiency state when Hb & RBC indices are apparently normal, RDW is the ONLY parameter to be deranged which is reflected in unimodal but slightly widened RBC histogram. At this stage, RDW is the only parameter which differentiates from normal state.
In frank IDA, changes in RDW & RBC histogram are very much apparent as discussed in Case 1.
When IDA is treated with parenteral Iron therapy, TRBC start increasing but MCV takes more time to normalize. Two populations of RBCSpre-existing microcytes & newly formed normocytes exist which can be easily seen on RBC histogram but not so much clear on PBF. This type of normocytic response is physiological.
In another situation, MCV normalizes earlier but there are two populations of RBCS- microcytes & macrocytes, which manifest as bimodal RBC histogram as seen in Fig 3. This type of macrocytic recovery is apparent only on RBC histogram and is suggestive of unmasking of megaloblastic anemia due to Vit B12 /Folate deficiency. Realising this fact is useful in IDA patients in whom Hb starts falling after initial rise.
Role of RDW in Diagnosis of Early Megaloblastic Anemia & Its Follow-up (Fig 4)
Like in IDA, early megaloblastic changes manifest as change in RDW-SD before there are changes in RBC indices. At this stage, HB is normal & PBF does not reveal apparent anisocytosis.
In frank MA, changes in RDW & RBC histogram 22
IRON DEFICIENCY ANAEMIA
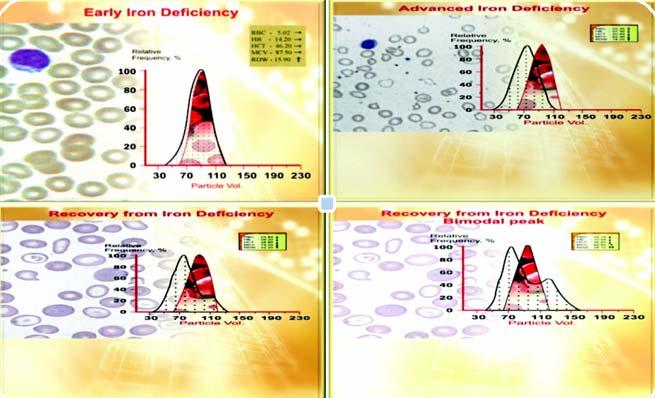
Fig 3
Fig 4
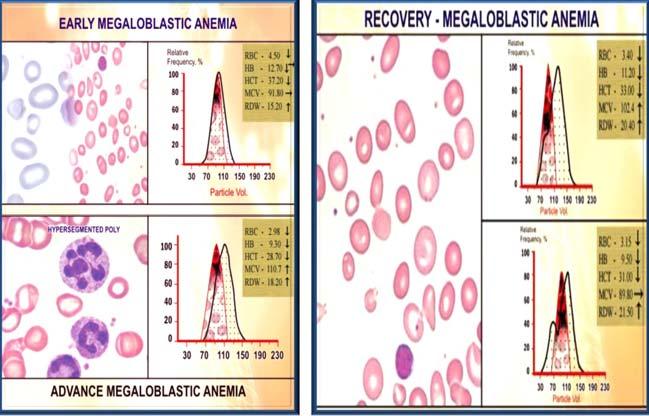
are very much apparent and diagnosis can be easily made.
When MA is treated, there can be either normocytic or microcytic response. The latter type of microcytic response is pathological and is suggestive of unmasking of iron deficiency anemia.
CONCLUSION
The six categories described in Tables 1, 2, 3 yield a short, fast and accurate differential diagnosis from the initial blood count (MCV and RDW) generated by automated hematology analyzer and suggest the more physiologic basis for classifying the anemias. Combining the older and newer classifications, anemias can be grossly summarized as:
• Hypoproliferative disorders- independent of MCV,
JOURNAL OF THE INDIAN MEDICAL ASSOCIATION, VOL 118, NO 07, JULY 2020
have normal heterogeneity/ homogeneity (normal RDW). • Nutritional Disorders- independent of MCV, have increased heterogeneity (raised RDW). • Hemolytic Disorders- independent of MCV, have heterogeneity that is increased in direct proportion to the degree of anemia.
Understanding of RDW & RBC histogram is useful not only in diagnosing early deficiency states when RBC indices are normal but also, in following these patients after treatment, whether the response is physiological or pathological.
Funding : None
Conflict of Interest : None REFERENCES
1 Wintrobe M M — Anemia: classification and treatment on the
basis of differences in the average volume and hemoglobin content of the red cell corpuscule. Arch Intern Med 1934; 54:256-80. 2 Monzon CM — Anemia in infancy and childhood: a systematic approach to evaluation. Postgrad Med 1985; 78: 275-92. 3 Brecher GF, Jakobek EF, Stohlman FA, et al — Size distribution of erythrocytes. Ann NY Acad Sci 1962; 99: 242-61. 4 Bessman JD — Evaluation of whole blood platelet counts and particle sizing. Am J Clin Pathol 1980; 74: 157-62. 5 Bessman JD — Heterogeneity of red cell volume:
Quantification, clinical correlation and possible mechanisms.
Johns Hopkin Med J 1980; 146: 226-30. 6 Lewis SM, Verwilghen RL — Dyserythropoiesis and dyserythropoietic anemias. Prog Haematol 1974; 8: 99. 7 Hammersley MW. What’s an RDW? Am J Clin Pathol 1981; 76: 242. 8 Weiser MG, Kociba GJ — Persistent macrocytosis assessed by erythrocyte subpopulation analysis following erythrocyte regeneration in cats. Blood 1982; 60: 295-303.
If you want to send your queries and receive the response on any subject from JIMA, please use the E-mail or Mobile facility.
Know Your JIMA
Website : https://onlinejima.com For Reception : Mobile : +919477493033 For Editorial : jima1930@rediffmail.com Mobile : +919477493027 For Circulation : jimacir@gmail.com Mobile : +919477493037 For Marketing : jimamkt@gmail.com Mobile : +919477493036 For Accounts : journalaccts@gmail.com Mobile : +919432211112 For Guideline : https://onlinejima.com
23