


The Journal of the Indian Medical Association (JIMA) was founded by doyens of Medical Profession namely Sir Nilratan Sircar, Dr Bidhan Chandra Roy, Dr Kumud Sankar Ray and others in the year 1930 with only 122 Doctors. Indian Medical Association launched its own journal in the name of ”Indian Medical World” . The first issue was published in March 1930, under the able Editorship of Sir Nil Ratan Sircar. Dr. A. N. Ghosh was the Secretary. An All-India Editorial Board of 21 members was also formed. Altogether 18 monthly issues of the “Indian Medical World” in two Volumes of 12 issues and six issues were published. The last issue of the Indian Medical World was dated August 1931.
In the 7th All India Conference of IMA, which was held in Pune, under the Presidentship of Dr. Jivraj N. Mehta, it was resolved to change the name of the journal as ”Journal of the Indian Medical Association” . The change was made effective from September, 1931 issue. The change of the name did not connote any change in the policy of the journal. The main objective of the Journal of the Indian Medical Association (JIMA) was to promote the advancement of medical and allied sciences in the country; the improvement of public health and medical education in India and uphold the honour and dignity of the medical profession.
Journal of the Indian Medical Association (JIMA) publishes original research articles, Case Reports, Editorials, and Short Communication in all areas of medical science. The journal also considers publication of letters to the editor commenting on research already published in the journal, as well as manuscripts describing new hypotheses or clinical trial protocols. JIMA does not consider research work that has been published, is in press or has been submitted elsewhere. The journal has recorded steady

Prof
(Dr) Ranjan Bhattacharyya MBBS (Cal), MD, DNB (Psychiatry) Hony Editor, JIMA
all round growth from year to year. It is indexed with Copernicus and Scopus now. It is subscribed by most of the Medical Colleges and Libraries in the country.
Journal of the IMA, popularly known as JIMA has been the mouthpiece of Indian Medical Association since its inception. So, to say about the history of JIMA, it is necessary to say about IMA first. Prior to the formation of the Association, four All India Medical Conferences had been held, the first at Calcutta in 1917 under the Presidentship of Lt. Col. Raghavendra Rao, the second at Delhi in 1918 with Sir Nil Ratan Sircar as the President, the third in 1919 with Dr. M. N. Odedar as its President and the Fourth at Nagpur in 1920 under the Presidentship of Rao Bahadur Dr. Maharaj Krishnan Kapur. It was at the 5th conference held at Calcutta on 28th December, 1928 under the Presidentship of Dr. G. V. Deshmukh of Bombay, that a resolution was adopted forming an AllIndia Medical Association with the objects of promotion and advancement of medical and allied sciences in their different branches, the improvement of public health and medical education in India and the maintenance of honour and dignity of the medical profession. In the year 1930, the All-Indian Medical Association and the body was duly registered under the Societies Registration Act, XXI of 1860.
Though the Association was formed with only handful members. Yet even with this numerical strength, it could achieve its position of strength and command respect from the British rulers. It could prevent the appointment of British rulers. It could prevent the appointment of British IMS Officer as a Commissioner of Medical Education in 1929 and it could achieve to organize an all-India Medical Register and include the licentiates in it. The Medical Council of India Act was got amended to have an elected
Message of Editor. Bhattacharyya R.
President in place of a nominated one and it was a matter of a pride that Dr. B. C. Roy, one of the most illustrious past Presidents of IMA, became the first elected President of Medical Council of India followed by many other illustrious presidents of IMA gracing the exalted chair including the past president of the Medical Council of India Late Dr. A. K. N. Sinha.
The Headquarters Office of the IMA was originally located in Calcutta. At the suggestion of Dr. S. C. Sen supported by Dr. B. V. Mulay, Dr. Chamanlal C. Mehta and Maj. General Amirchand, the IMA Headquarters was shifted to Delhi in January 1949, after the attainment of Independence. The Journal of IMA continued to be published from Calcutta. Dr. S. C. Sen also obtained a plot of land in Indraprastha Estate, New Delhi at the concessional rates from the Government and the project of construction of IMA Building thereon was undertaken, supported by Dr. B. V. Mulay, Dr. Chamanlal Mehta, Dr. C.S.Thakar, Dr.A.P.Mitra, Dr. Ved Prakash, Dr. R.C.Goulatia, Dr. P.C. Bhatia and Dr. D.S. Mehra. The foundation stone of IMA House was laid by the first President of India, Dr. Rajendra Prasad on September 19, 1958 and the construction of the building was started under the supervision of Dr. P.C.Bhatia who supervised it brick by brick. With his untiring efforts, the building was completed and opened on September 6, 1964 by the then President of India, Dr. S. Radhakrishnan.
During the British Rule, some selected members of the profession were members of the British Medical Association which had branches in India. The stalwarts of IMA ultimately succeeded in reaching an agreement with British Medical Association that they would have no branches in India and got mutually affiliated, which relationship continues even today. In the year 1964, IMA helped in the organization of the world body viz., the World Medical Association and thus became its founder member through the efforts of Dr. S.C.Sen, Dr. R.V.Sathe, the then President, IMA held the chair of the President of WMA when the WMA met in New Delhi in 1962. It’s a matter of pride that another illustrious Past President of IMA Dr. A.K.N. Sinha also held the office of the WMA. The IMA has been playing an important role in the deliberations of the World Medical Association at New Delhi in the year 1966. later developments, however, forced us to take decision to withdraw from World Medical Association in 1985, since the organization refused to expel South Africa despite its dismal record of racial discrimination. The
Indian Medical Association after consideration of all aspects of the matter decided in February, 1993 that IMA may again become a member of the World Medical Association. In pursuance of the above, 45th General Assembly of the World Medical Association at its meeting held on October 2-5, 1993 approved IMA’s membership of the WMA. The IMA has continued to play an important role in the affairs of the Commonwealth Medical Association.
In that conference on the historic day of 28th December, 1928, All India Medical Association was born. Dr. G. V. Deshpande became the first president and Bharat Ratna Dr B.C. Roy and Sir Nil Ratan Sircar became Vice President. Dr. K.S. Roy (Calcutta), Dr. A.N. Ghose (Calcutta) and Dr. D.D. Sathe (Bombay) became joint General Secretaries.
All India Medical Association was renamed as “Indian Medical Association” in the year 1930. Till Association Year 1933-34 there was no State or Local branches. The members were directly under IMA Headquarters. During the session 1934-35 it was decided to form Local and State branches. On 29th June, 1935, the first local branch of IMA, that is “IMA Calcutta Branch” was formed. The first president was late Lt. Col. Prof K.K. Chatterjee and Hony. Secretary was Dr Giris Banerjee.
IMA headquarter was at Calcutta from its inception in 1928 till 1948, after that it was shifted to New Delhi.
Indian Medical Association launched its own journal in the name of “Indian Medical World”. The first issue was published in March in the year 1930, under the able Editorship of Sir Nil Ratan Sircar, while Dr. A. N. Ghosh was made the Secretary. An All-India Editorial Board of 21 members was also formed.
All together 18 monthly issues of the “Indian Medical World” in two Volumes of 12 issues and six issues were published. The last issue of the Indian Medical World was dated August 1931.
Change of Name — In the 7th All India Conference, which was held in Poona, under the Presidentship of Dr. Jivraj N. Mehta, it was resolved to change the name of the journal as “Journal of the Indian Medical Association”. The change was made effective from September, 1931 issue. The change of the name did not connote any change in the policy of the journal.
The first JIMA was published in March 1930 from Calcutta.
Message of Editor. Bhattacharyya R.
JIMA got indexed in “Index Medicus” (USA). Due to unavoidable circumstances the publication of JIMA was stopped for the period March, 2014 to July, 2015. Due to this it lost its indexing. Then from August, 2015 JIMA resumed its publication again from Kolkata.
After a long struggle JIMA initially got indexed under “Index Copernicus” in 2019. But our target was to index JIMA in SCOPUS, PUBMED & DJOA. We are happy to let you know that since August 2021 JIMA is indexed with “SCOPUS” also. We publish both in Print and online version. JIMA is now full online. Website and portal for Online article submission is working well. The journal is being peer reviewed thoroughly. Some of the Reviewer supported in an excellent way. We have invited Reviewer from National and International fraternity in all across specialities. We follow a strict protocol to check PLAGIARISM before publication. We follow a guideline to select the article for Publication.
Issues to be Addressed
(1)We must receive a greater number of original articles from all over India and from International Author. IMA HQs should ask its members to submit original papers to JIMA online.
(2)Working meticulously for indexing in PUBMED and DJOA.
(3)Need a strong team of Reviewer who are computer friendly.
(4)As per NMC requirement and Editorial policy, we’ll encourage and expedite the following category of articles; original research article, metanalysis, systemic review and case reports.
The World Health Organisation has accepted & published a paper from JIMA “Surgeon’s Dilemma during COVID19" as GLOBAL LITERATURE in their website and this is a small example of quality control of JIMA.
The JIMA Websites: We are regularly uploading it in www.ejima.in (cover to cover, maintained by Galaxy Publications, Indore), www.ima-india.org (by IMA Headquarters) and www.jimaonline.com (only articles & indexing, maintained by Evangel) EVANGEL PUBLICATIONS are maintaining the portal of online article submission and all related work on behalf of JIMA.
Jio Mag: Digital JIMA is already available in Jio-Mag (in your mobile phones) and all our official websites & linking sites. JIMA issues are also available in the National Library, Kolkata.
DIGITAL JIMA: Now Digital JIMA has become a reality. We are in the process of creating an E-library by Digitalising all JIMA issues since 1930. In the E-library all past issues of JIMA will be available in digital format since its inception. It will also be available online through our official website. ALL THE ISSUES SINCE 1930 HAS BEEN DIGITALIZED. Kindly note this big step is taken by JIMA Committee which will improve the Citation Score or Impact Factor by linking the metadata of all original articles in future and will also help us to get the PUBMED & DOAJ indexing.
It is a proud moment to say that JIMA is completely digitalised in all respect and every work is now through web portal. It has been a great achievement for “TEAM JIMA” to revive this oldest journal of India and I am proud to be one of them. Lastly, I must thank each and every member of “Team JIMA” (past & present office bearers) for this achievement. The undersigned is specially thankful; to our National President Dr Anil Kumar J Nayak Hony Secretary General DR Sarbari Dutta and past National president Dr Santanu Sen for their valuable guidance.
Long Live JIMA
Long Live IMA

Digital Health Infrastructure (DHI) refers to the foundational systems, technologies, standards, and governance frameworks that enable the delivery of healthcare services through digital means. The Core building blocks of DHI are a) Connectivity & hardware (Internet / mobile networks (4G/5G, broadband); devices e.g smartphones, tablets, wearables, sensors and health facility e,g IT hardware (servers, computers)b) Digital platforms & applications e.g Electronic Health Records (EHRs) , Telemedicine platforms, Mobile health (mHealth) apps , Digital therapeutics (DTx) c) Data layer (Health data repositories, Cloud storage , Health information exchanges (HIE), Interoperability standards. The analytics & AI have multiple interphases e.g Clinical decision support systems (CDSS) , Predictive analytics , AI/ ML models for diagnosis, risk stratification, triage , dashboards for providers and policymakers. The security, privacy and governance is of paramount importance which includes data encryption and access controls , c onsent management systems , cybersecurity frameworks and regulatory compliance e.g Health Insurance Portability and Accountability Act 1996 (HIPAA), (General Data Protection Regulation 2018 (GDPR), Digital Personal Data Protection (DPDP) Act 2023 in India) . The human & organizational capacity requires trained digital health workforce, cl inical informatics specialists, change management systems and d igital literacy for patients and providers. There are many service providers include National digital health policies, Unique health identifiers, Public–private partnerships and Open-source architectures . The uses of digital health infrastructure are many which encompasses teleconsultations, remote patient monitoring, disease surveillance, supply chain management, h ealth insurance & claims and public health planning. The benefits of Digital Health Infrastructure are many e.g Improved access and continuity of care, cost efficiency, data-driven decisionmaking, scalability of health services and personal care. The challenges are many e.g interoperability gaps, digital divide, data privacy concerns, sustainability and funding, provider resistance to adoption. The Indian context (brief). Ayushman Bharat Digital Mission (ABDM), the Health ID (ABHA), eSanjeevani, CoWIN, National Digital Health Blueprint etc. The AI-native health systems include Digital public goods (DPGs), integration with genomics & precision medicine , cross-border health data exchange, patient-owned health data models.
In 2026, the Digital Health Initiative has evolved from a series of emergency pandemic responses into a permanent, integrated global framework. The focus has shifted from “proving technology works” to “delivering measurable value”—specifically in clinical outcomes, economic efficiency, and patient experience. Here is a breakdown of the current landscape of digital health as of early 2026.
The World Health Organization (WHO) is currently in the final year of its Global Strategy on Digital Health 2020–2025 and is transitioning toward a new post-2025 framework. Global Initiative on Digital Health (GIDH): Launched during India’s G20 Presidency, GIDH is now a fully operational “network of networks.” It focuses on four pillars: Investment Tracker: Aligning global funding to prevent “pilot-itis” (redundant small projects). Ask Tracker: Identifying specific country needs for digital tools. The Library of Digital Goods shares open-source code and software for health systems.
The knowledge Sharing by scaling regional successes globally and national Integration with over 130 countries now have formal national digital health strategies, up from roughly 85 in 2015.
In 2026, the advantages of digital health have moved beyond simple “convenience” to becoming the primary driver of Value-Based Care. The focus is no longer just on digitizing records, but on using real-time data to prevent illness before it requires hospitalization.
Here are the core advantages categorized by their impact on the healthcare ecosystem.
The shift from reactive to proactive medicine is the most significant benefit for individuals.
• Continuous Monitoring: Wearables and “smart patches” now provide clinical-grade data (glucose, heart rate variability, blood pressure) in real-time. This allows for “early warning” alerts that catch complications days before a patient feels symptoms.
• Improved Access: Telehealth has matured into “Hospital-at-Home” models, allowing patients in rural or underserved areas to receive specialist care without traveling hundreds of miles.
• Empowerment & Literacy: Patient portals and AIdriven “health coaches” provide 24/7 answers, helping people understand their own labs and treatment plans, which significantly increases adherence to medications.
(2) For Providers: Operational Efficiency & Accuracy
Digital tools are actively combating the global clinician burnout crisis by automating the “drudgery” of medicine.
• AI-Driven Diagnostics: AI algorithms are now routinely used to triage imaging (X-rays, MRIs) and pathology slides, often reducing reporting turnaround times by up to 40%.
• Reduced Administrative Burden: Ambient AI “scribes” listen to patient encounters and automatically generate clinical notes, allowing doctors to focus on the patient rather than the keyboard.
• Precision Medicine: Integrated data platforms allow doctors to tailor treatments based on a patient’s unique genetic profile and lifestyle data, rather than a “one-size-fits-all” approach.
(3) For Health Systems: Economic & Clinical Value
In 2026, digital health is the primary tool for reducing the massive costs associated with chronic disease.
• Reduced Readmissions: Programs utilizing Remote Patient Monitoring (RPM) have shown up to a 15–20% reduction in hospital readmissions for conditions like heart failure and diabetes.
• Optimized Resource Allocation: Predictive analytics help hospitals forecast “surge periods,” allowing them to staff appropriately and manage bed capacity more efficiently.
• Scalability: Cloud-based platforms allow health systems to scale mental health and chronic care services to thousands of patients simultaneously without the need for new physical buildings.
While digital health offers transformative benefits, the landscape in 2026 also presents significant challenges. As systems become more interconnected and reliant on AI, new vulnerabilities have emerged that impact patients, providers, and healthcare institutions.
Here are the primary disadvantages of digital health today.
(1)
The “digitization of everything” has made healthcare the #1 target for global cybercrime.
• Ransomware & Breaches: Hospitals are frequent targets for ransomware, which can paralyze entire health systems, leading to canceled surgeries and exposed patient records.
• Data Exploitation: There are growing concerns that sensitive health data (from wearables or apps) could be used by third parties, such as insurance companies, to adjust premiums or discriminate based on genetic risks.
• Medical Identity Theft: Unlike a stolen credit card, a “stolen” medical history cannot be reset, potentially leading to permanent issues with
insurance or incorrect treatments being added to a patient’s file.
(2) The “Digital Divide” & Inequity
Digital health risks widening the gap between different socioeconomic groups.
• Access Inequality: Patients without high-speed internet or the latest smartphones are often left out of the “hospital-at-home” revolution, creating a two-tier healthcare system.
• Digital Literacy: Older adults or those with lower technical proficiency may find navigating complex patient portals and AI-triage tools frustrating or impossible, leading to disengagement from care.
• Algorithmic Bias: AI models trained on nonrepresentative data (e.g., primarily urban or specific ethnic populations) can provide less accurate diagnoses for minority groups, worsening existing health disparities.
(3) Provider Burnout & Technical Friction
While technology aims to help, it often adds new layers of stress for clinicians.
• “Alert Fatigue”: The constant stream of data from patient wearables can overwhelm doctors with notifications, making it difficult to distinguish between a critical emergency and a minor data glitch.
• Interoperability Gaps: Many systems still don’t “talk” to each other. Doctors often have to use multiple logins and manual “workarounds” to move data between different platforms, which reduces time spent with patients.
• Erosion of the Human Element: Over-reliance on screens and AI-generated summaries can lead to a “de-personalized” experience, where the nuanced, empathetic connection between doctor and patient is diminished.
(4) Reliability & Accuracy Issues
• “Hallucinations” in AI: In 2026, generative AI is widely used for clinical notes, but it still carries the risk of “hallucinating” or misinterpreting medical facts if not strictly supervised.
• Diagnostic Errors: A patient misusing a digital tool (e.g., placing a smart patch incorrectly) can feed “garbage data” into a system, leading to an incorrect diagnosis or unnecessary hospital visit.
• Self-Diagnosis Risks: The ease of accessing digital health data can lead to “cyberchondria,” where patients misinterpret their own data and experience high levels of anxiety or delay professional medical help.
Prof (Dr) Ranjan Bhattacharyya MBBS (Cal), MD, DNB (Psychiatry) Hony Editor, JIMA
Akanksha Bisht1
The Haemovigilance Programme of India (HvPI), launched in December 2012, is implemented by the National Institute of Biologicals (NIB), NOIDA, under the Ministry of Health & Family Welfare. Serving as the National Coordinating Centre (NCC), HvPI aims to monitor, report, investigate, and analyze adverse reactions related to blood transfusion and donation across India.
To date, 1,728 blood centres have enrolled under HvPI, and over 80,000 adverse reaction reports have been submitted via the Haemovigilance software. Although reporting is currently voluntary, the data collected helps formulate expert-led guidelines and recommendations to improve transfusion safety nationwide which are freely available on NIB Website nib.gov.in
HvPI also focuses on capacity building. It has conducted 86 Continuing Medical Education (CME) Programmes, Workshops and Webinars, training over 16,400 healthcare professionals. The participants have predominantly been from blood centres, including medical officers, nurses, technical staff, as well as blood donors and motivators. Moving forward, we aim to enhance collaboration with our clinical colleagues, who play a critical role in recognizing bedside transfusion reactions and promptly reporting them to the blood centres. Strengthening this partnership is essential for improving patient safety and transfusion outcomes.
A toll-free helpline (1800-180-2588) is available to provide assistance and answer queries related to the programme.
Blood centres can enroll in HvPI free of cost by submitting the required enrolment form, available at https://nib.gov.in/ media/Annexure7.pdf either by post to NIB, NOIDA or via email at haemovigilance@nib.gov.in.
HvPI has also developed a key reference document, “Good Blood Transfusion Practices – Guidance for Rational Use of Blood”, available at https://nib.gov.in/ media/Good%20Blood%20Transfusion%20Practices% 20Guidance.pdf, to support rational and safe blood use.
Active clinician participation and increased reporting serves as a critical tool in ensuring patient safety and improving clinical outcomes in transfusion medicine. By actively reporting adverse transfusion reactions, clinicians contribute to a national database that enhances protocols, and reduces preventable risks. Participation in HvPI not only reinforces a culture of continuous learning but also empowers clinicians with data-driven insights to make safer, more informed decisions. Embracing this programme is a step toward advancing quality care and safeguarding the well-being of every patient receiving blood transfusion therapy.
Haemovigilance Programme of India (HvPI) looks forward to a collaborative partnership with the prestigious Indian Medical Association (IMA) to enhance the safety and quality of blood transfusion practices across the country.
(1)Dr Neelam Marwaha, Former Professor & Head, Department of Transfusion Medicine, PGIME&R, Chandigarh.
(2)Prof Ravneet Kaur, Head, Department of Transfusion Medicine, GMCH, Chandigarh.
(3)Dr Debasish Gupta, Former Professor & Head, Department of Transfusion Medicine, SCTIMST, Trivandrum, Kerala.
(4)HvPI acknowledges all the blood centres for their active participation in HvPI and reporting of adverse transfusion/donor reactions to the central database.
1S-I & Head Haemovigilance Programme of India, NIB Noida , MoHFW, GoI.
How to cite this article : Haemovigilance Programme of India : Strengthening Blood Transfusion Safety. Bisht A. J Indian Med Assoc 2026; 124(1): 21.
Jeevithan Shanmugam1, Feny Elizabeth Easo2, Malarkodi M3, Aparnavi Periasamy4
Abstract
Background : Social media is a catalyst for negative attitudes and high-risk behaviors.
Aims and Objectives : The current study aims to find the extent and attitude toward Social Media usage among adolescent girls in Coimbatore.
Materials and Methods : A cross-sectional study was done on 100 adolescent girls from an urban and another 100 from a Rural area in Coimbatore. A pre-designed pre-tested questionnaire was used to collect data on the role of social media and its usage. Ethical clearance was obtained from the Institutional Committee.
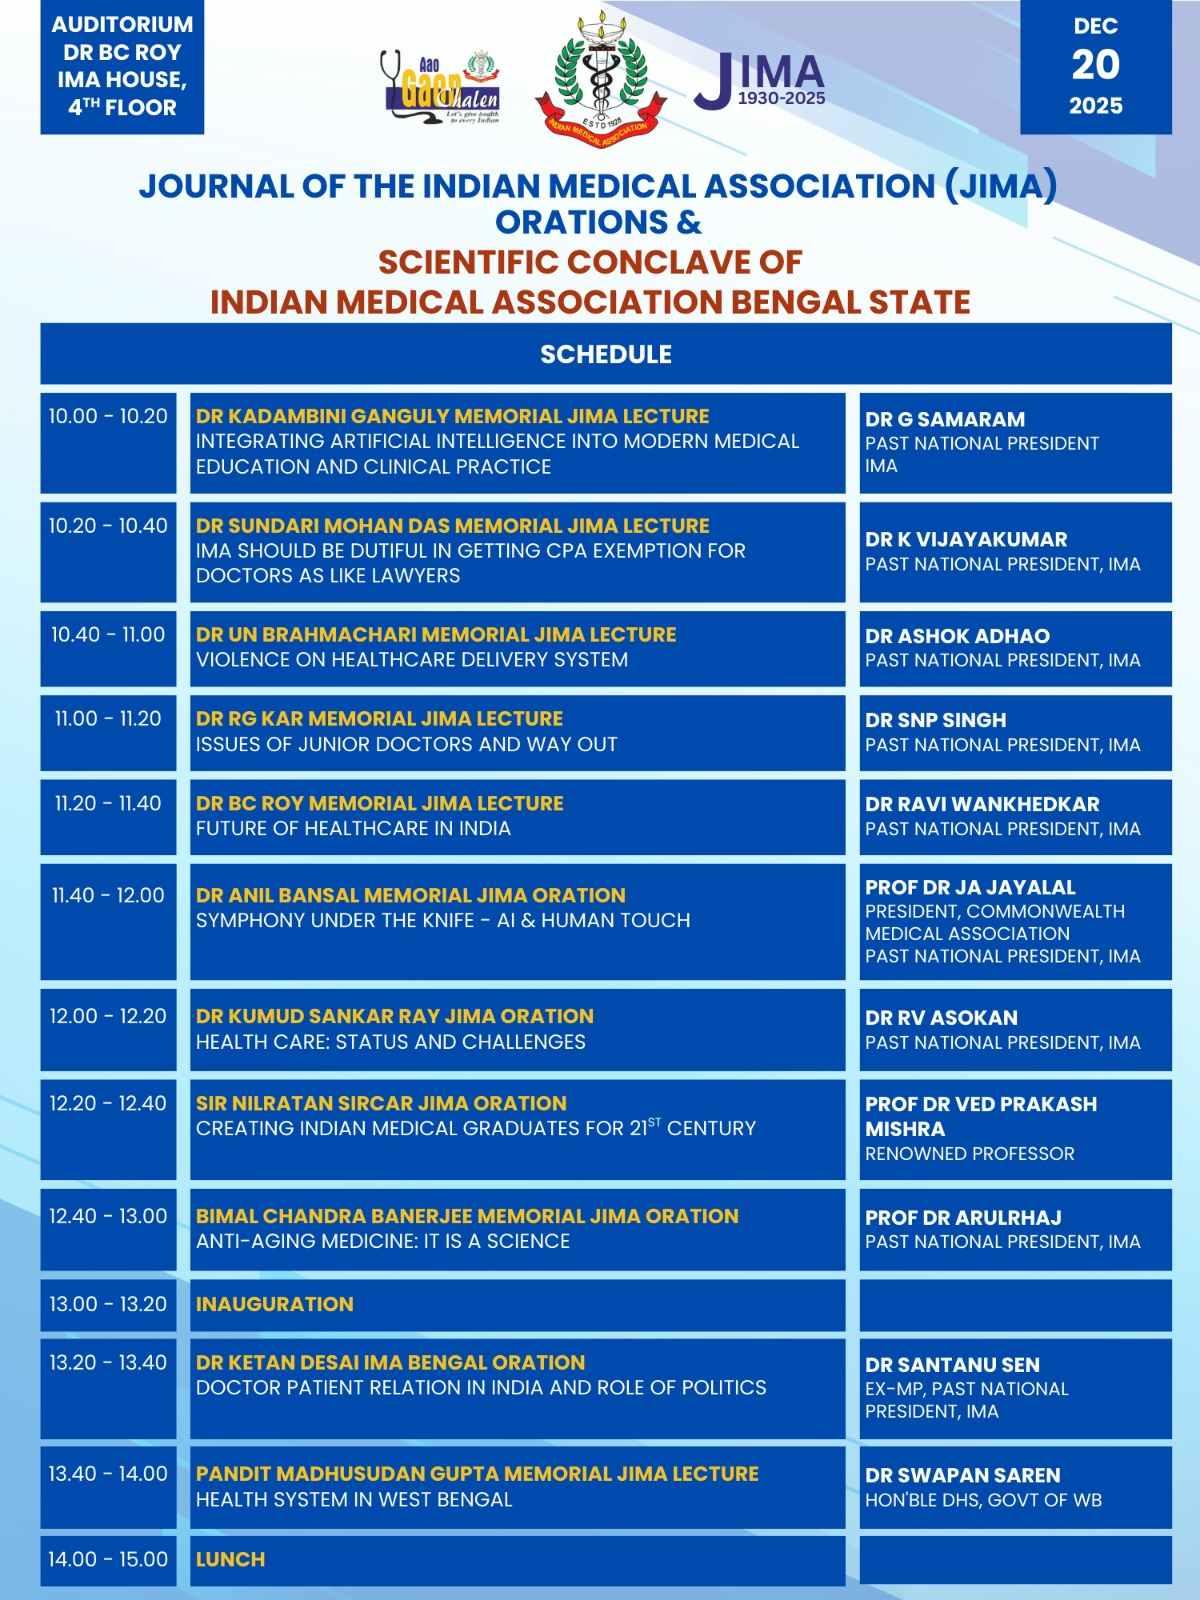
Results : The mean±SD score on the duration and frequency of social media usage score was slightly higher in the rural area (20.5±3.9) but was not statistically significant. The proportion of people reporting an overall positive role (<30) towards soc ial media was significantly higher in the Rural area (58.2%).
Conclusion : The study is one of its kind which focuses on the perception of social media exclusively by adolescent girls. The study concludes that there is no significant difference in social media usage patterns between Urban and Rural adolescents. Social media was seen to have an overall negative role in more than 50% of adolescents.
Key words : Social Media, Adolescent, Social Media Attitude.
Adolescence is a critical period of the psychological, biological, and social transition of a child to an adult. This is a phase of rapid physical and psychological transition making them a vulnerable group of concern. During this development phase, a sense of identity and greater autonomy are built in1. In the current digital era, the challenges faced by adolescents are unique and incomparable to the previous generations.
A social networking service/ social media is a platform to connect with people who share similar interests, activities, backgrounds, or real-life connections through digital platforms with interactive participation. These sites commonly are used to socialize by sharing news, photos, ideas, or thoughts with other people. A survey among adolescents in the Western world in 2018 revealed that about 97% of adolescents were using common social media platforms2. Though these platforms are credited by adolescents for positive outcomes like strengthening friendships, widening contacts, exposing them to different viewpoints, knowing the diverse world, supporting causes they care about2 and for professional growth, the negative aspects tend to greatly impact them. The negative role of social media includes poor social participation, poor academic performance, bad social influence exposing
Department of Community Medicine, KMCH Institute of Medical Science and Research, Coimbatore, Tamil Nadu 641014
1MD, Professor and Corresponding Author
2BSc, Nursing, KMCH College of Nursing, Tamil Nadu 641048
3PhD, Assistant Professor
4MD, Assistant Professor
Received on : 03/04/2024
Accepted on : 09/05/2024
Editor's Comment :
! ! ! ! ! Social media use among adolescent girls shows similar patterns in both Rural and Urban settings, but more than half perceive its overall role as negative. While Rural adolescents reported relatively more positive perceptions, excessive use remains linked to adverse psychosocial outcomes.
! ! ! ! ! Targeted health education and responsible social media use interventions are essential to mitigate potential harms during this vulnerable developmental period.
them to illegal/immoral activities and harmful substances, and constant overwhelmed pressure to construct only positive images of oneself2. Social media also acts as a catalyst for negative attitudes and high-risk behaviors3 Due to peer influence, they are forced to post images or messages documenting engagement in risky behaviors4 Adolescents are also victimized by stalking, cyberbullying, identity theft, and rumors due to improper use of Social media. As a result, improper social media use is associated with Depression, Anxiety disorders5,6 and other mental health problems 7. The pervasive use of social media has given rise to behavioral addiction disorders such as instant messaging disorder and social media disorder, which are increasingly recognized as significant mental health problems. Research suggests that these disorders are particularly prevalent among adolescents, highlighting the need for greater attention to be paid to this issue in the literature8,9
The effect or role of social media might be influenced by various factors including gender, developmental differences, or socio-economic factors. Females are twice as likely to experience mental health disorders 10,11 .
How to cite this article : Perceived Role of Social Media Use : A Cross-sectional Study Comparing Adolescents in Rural and Urban Areas. Shanmugam J, Easo FE, Malarkodi M, Periasamy A. J Indian Med Assoc 2026; 124(1): 22-5.
Females tend to use social media in a different way, and to a different degree, than males do12 . Hence, the current study was intended to be done on female adolescents. The geographical disparity in accessing technology has been well known 13 . But beyond various social and geographical barriers, information and communication technologies including social media have become an integral part of education, socialization and other aspects of life14 . Hence, the current study aims to find the extent of use and role of social media among adolescent girls in Coimbatore.
•To estimate the pattern (duration and frequency) of social media usage among adolescent girls in selected Urban and Rural areas.
•To estimate the role of social media usage among adolescent girls in selected Urban and Rural areas.
•To find the socio-demographic determinants affecting social media among adolescent girls in selected Urban and Rural areas.
A community-based cross-sectional study was conducted by KMCH College of Nursing in the field practice area of the Department at Sarkarsamakulam in 2018-2019. One Urban area (Kalapatti) and one Rural area (Idikarai) were chosen by stratified random sampling from the list of areas covered by the Sarkarsamakulam Primary Health Center (PHC). The sample size was calculated to be 200. Nonprobability purposive sampling was used to select 100 adolescent girls between the ages of 10 and 19 years from both Urban and Rural areas. Inclusion criteria: Adolescent girls residing in that area for at least the last 6 months. Exclusion criteria: adolescent girls with chronic diseases like diabetes, asthma, etc, and those who were mentally or physically challenged. A detailed methodology has been explained in the parent article of the current research15. Data on social media usage was collected using a pre-designed, pre-tested, intervieweradministered questionnaire that had one part with 11 questions on duration and frequency of use and the second part on the role of social media with 15 questions. The responses to all 26 questions were recorded on a 4point Likert scale. The negative questions were scored with 4 as strongly agree and 1 as strongly disagree and positive questions were reversely scored. Regarding the role of social media, the responses to 15 questions were summed and a value of 3S0 and above was considered a negative role. In addition, socio-demographic data were recorded. Ethical clearance was obtained from the Institutional Ethical Committee of KMCHIHSR (EC/AP/ 681/03/2019) and formal permission was obtained from
the Medical Officer of the PHC. Written informed consent was obtained from the participants before enrolment. Data analysis was analyzed using SPSS version 21. Mean±SD was calculated for quantitative data and proportions for qualitative data. Student t-test was used to compare means and the Chi-square test was used to compare proportions. The p value of <0.05 was considered as statistical significance.
The age of the participants ranged from 10 to 19 years and the majority in both Urban (61%) and Rural (54%) areas were in the 10 to 14 years age group. The most common religion practiced was Hinduism in both Urban (69%) and rural (74%) areas followed by Christianity. The majority lived in nuclear families (Urban-76%, Rural-73%) and followed mixed diets (Urban-93%, Rural-96%) in both the areas studied. A slightly higher proportion of people in the Rural area (43%) had more than 4 members in the family than in the Urban area (36%). More than 95% of the parents in both Urban and Rural areas were literate. The distribution of age group, type of family, food habits, number of family members, and literacy of parents were statistically (chi-square test, p>0.05) similar across both Rural and Urban areas among the selected samples. Though statistically insignificant, the mean±SD score on the duration and frequency of social media usage score was slightly higher in the Rural area (Table 1). The proportion of people reporting a positive role (<30) in social media was significantly higher in Rural areas (58.2%) than in Urban areas (41.8%)(Table 2, Fig 1). The mean difference between Urban and Rural areas in pattern of use was 0.7 and in the role of social media was 5.46. However, these differences were not statistically significant (unpaired ‘t’ test, p>0.05). The role of social media on adolescent girls was statistically similar across various socio-demographic characters in both Rural and Urban except for education in the Rural areas (Table 3).
In the current study majority of the adolescents in both areas were in the younger age group of 10-14 years and it was also seen that the overall role of social media in their lives was negative. In explanation, in the qualitative study by Radovic A, et al16 adolescents perceived that the pattern of social media use gradually shifted from more negative to positive as they aged from early adolescence
Table 1 — Comparison between social media usage and the role of social media among adolescent girls in Urban and Rural areas
Mean ± SDp value
Urban33.6 ± 4.80.7
Rural39.1±6.4
Shanmugam J, et al. Perceived Role of Social Media Use : A Cross-sectional Study Comparing Adolescents in Rural and Urban Areas.
Table 2 — The perceived role of social media among adolescent girls in Urban and Rural areas (N=200)
Positive role (%)Negative role (%)p value*Mean ± SD
Urban41 (41.8)59 (57.8)0.0233.6 ± 4.8
Rural57 (58.1)43 (42.1)39.1±6.4
Total98 (99.9)102 (99.9)
*chi-square test
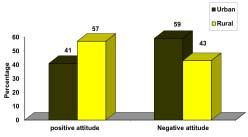
Fig 1 — Distribution of the role of social media among adolescent girls in Urban and Rural areas (N=200)
through the middle to late. A qualitative study by O’Reilly M, et al17 in the UK on adolescents with a comparable age group (mean age was 13.6 years) from varied ethnicities brought out that social media had both positive and negative roles on mental health. On the positive front social media reduced isolation by allowing for continued communication and improving social skills. Among the negative roles, missing out on social connection without necessarily a device, bullying, and trolling were addressed by the adolescents in the report by O’Reilly M, et al17
The current study reports that more than half the
adolescent girls perceive the role of social media as negative. The study by Jayaraj N, et al 18 on internet use among adolescents also reported that on the whole usage for education, purposes was lower than for entertainment on social media. In accordance with the current finding, many other cross-sectional studies have shown that social media has a negative role in life manifesting as poor satisfaction, poor psychological well-being, and poor social competence 19-21. Girls also reported that academic performances were negatively affected by the duration of social media use. This finding was supported by similar studies on social media in adolescents22 . In contrast to the belief that social media platforms help in networking and staying connected literature has shown that adolescents feel more lonely when they are affected by social media disorder19,20. Though overall scores pointed towards the negative role of social media, the usage mean score on pattern and duration of use among both urban and Rural girls remained lower than 50%. This was in contrast to the findings of a multinational study which reported that Problematic Internet Use (PIU) was higher among Asian countries. This might be because of the difference in the study tool, the age group and the gender.
Thus the study concludes that in the current era of globalization, there is no difference in the pattern and duration of social media use among adolescents in Rural or Urban areas. Though the overall mean score on the role of social media was negative in both Rural and Urban areas, a higher proportion of adolescents in the Rural
Family income
*chi-square test
Shanmugam J, et al. Perceived Role of Social Media Use : A Cross-sectional Study Comparing Adolescents in Rural and Urban Areas.
areas experienced social media to have a positive role. Other than the place of residence, no other Sociodemographic variable affected the role of social media in their lives. Since this is a cross-sectional analysis of only perceptions, it carries the limitation of not understanding the actual role and impact of social media. Also, research on the correlates of addictive-like social media use is much more limited. Hence, longitudinal studies should be carried out on this hypothesis. Since a high proportion of adolescents have reported that social media plays a negative role, it is recommended that further research on the consequences of social media in adolescents. Similarly, because a high score in frequency and pattern of use is also observed, further research on the effects of this on sleep, diet, and other aspects of health problems associated with should be carried out. The study also recommends that interventions like health education should be planned to ensure the proper use of social media by adolescents.
Funding : None.
Conflict of Interest : None.
1Kemph, JP. Book review on Identity, youth and crisis. New York: W. W. Norton Company, 1968. Systems Research and Behavioral Science 196;14:154-159. Last accessed: 12th Feb 2024 Available from: https://onlinelibrary.wiley.com/doi/full/10.1002/bs.3830140209
2Teens’ Social Media Habits and Experiences. Pew Research Center. Web Link: https://www.pewresearch.org/internet/2018/11/28/ teens-social-media-habits-and-experiences/ Year: 2024.
3Lamblin M, Murawski C, Whittle S, and Fornito A — Social connectedness, mental health and the adolescent brain. Neurosci Biobehav Rev 2017; 80: 57-68. DOI: 10.1016/j.neubiorev.2017.05.010
4Groth GG, Longo LM, and Martin JL — Social media and college student risk behaviors: A mini-review. Addict Behav 2017;65:87–91. Available from: https://pubmed.ncbi.nlm.nih.gov/27816044/
5Vidal C, Lhaksampa T, Miller L, and Platt R — Social media use and depression in adolescents: a scoping review. Int Rev Psychiatry 2020; 32(3): 235-53. DOI: 10.1080/09540261.2020.1720623
6Primack BA, Shensa A, Escobar-Viera CG, Barrett EL, Sidani JE, Colditz JB, et al — Use of multiple social media platforms and symptoms of depression and anxiety: A nationally-representative study among U.S. young adults. Comput Hum Behav 2017; 69: 1–9. DOI: https://psycnet.apa.org/doi/10.1016/j.chb.2016.11.013
7Ivie EJ, Pettitt A, Moses LJ, Allen NB — A meta-analysis of the association between adolescent social media use and depressive symptoms. J Affect Disord 2020; 275: 165-74. DOI: 10.1016/ j.jad.2020.06.014.
8Kuss DJ, and Griffiths MD — Internet and gaming addiction: a systematic literature review of neuroimaging studies. Brain Sci 2012; 2(3): 347-74. DOI: 10.3390/brainsci2030347
9Pantic I — Online social networking and mental health. Cyberpsychol Behav Soc Netw 2014; 17(10): 652-7. DOI: 10.1089/ cyber.2014.0070
10Albert PR — Why is depression more prevalent in women? J Psychiatry Neurosci 2015; 40(4): 219-21. DOI: 10.1503/jpn.150205.
11Zender R, and Olshansky E — Women’s mental health: depression and anxiety. Nurs Clin North Am 2009; 44(3): 355-64. DOI: 10.1016/j.cnur.2009.06.002.
12Baker DA, and Algorta GP — The Relationship Between Online Social Networking and Depression: A Systematic Review of Quantitative Studies. Cyberpsychol Behav Soc Netw 2016; 19(11): 63848. DOI: 10.1089/cyber.2016.0206
13Reddick CG, Enriquez R, Harris RJ, Sharma B — Determinants of broadband access and affordability: An analysis of a community survey on the digital divide. Cities 2020; 106: 102904. DOI: 10.1016/ j.cities.2020.102904.
14Ahn J — Teenagers’ Experiences With Social Network Sites: Relationships to Bridging and Bonding Social Capital. An Int J 2012; 28(2): 99-109. DOI: https://doi.org/10.1080/01972243.2011.649394
15Malarkodi M, Madhavi S, Elizabeth Easo F, Shanmugam J, Kumar M — Distribution of Body Mass Index and its demographic determinants among adolescent girls in urban and rural Coimbatore: A community based analytical cross-sectional study. IOSR Journal of Nursing and Health Science 2024; 12(1): 10-6. DOI: 10.9790/ 1959-1201051016
16Radovic A, Gmelin T, Stein BD, Miller E — Depressed adolescents’ positive and negative use of social media. J Adolesc 2017; 55: 5. DOI: 10.1016/j.adolescence.2016.12.002
17O’Reilly M — Social media and adolescent mental health: the good, the bad and the ugly. J Ment Health 2020; 29(2): 200-6. DOI: 10.1080/09638237.2020.1714007.
18Jayaraj N, Shanmugam J, Duraisamy S, Loganathan P — Internet Usage Pattern among Adolescents in South India – A Cross-sectional Study. Ann Community Heal 2020; 8: 31-5.
19Cock D, Morales R, De Cock R, Vangeel J, Klein A, Minotte P, et al Compulsive use of social networking sites in Belgium: prevalence, profile, and the role of attitude toward work and school. CyberPsychology, Behav Soc Netw 2014; 17(3): 166-71. DOI: 10.1089/cyber.2013.0029.
19Van Den Eijnden RJJM, Lemmens JS, Valkenburg PM — The Social Media Disorder Scale: Validity and psychometric properties. Comput Human Behav 2016; 61: 478-87. DOI: 10.1016/ j.chb.2016.03.038
20Satici S, and Uysal R — Well-being and problematic Facebook use. Comput Human Behav 2015; 49: 185-90. DOI: https://doi.org/ 10.1016/j.chb.2015.03.005
21Aladwani AM, Almarzouq M — Understanding compulsive social media use: The premise of complementing self-conceptions mismatch with technology. Comput Human Behav 2016; 60: 575-81. DOI: https://psycnet.apa.org/doi/10.1016/j.chb.2016.02.098
22Huang H, and Leung L — Instant messaging addiction among teenagers in China: Shyness, alienation, and academic performance decrement. Cyberpsychology Behav 2009; 12(6): 675-9. DOI: https:/ /psycnet.apa.org/doi/10.1089/cpb.2009.0060
Abhipsa Dey1, Sanjib Bandyopadhyay2, Sukanta Majumdar3, Soma Chakrabarti4, Aparajita Mondal5
Abstract
Background : The vaccination campaign against COVID-19 was started on 16 January, 2021 using two of the approved vaccines namely COVISHIELD and COVAXIN. Emerging severe breakthrough infections have health authorities concerned regarding vaccine effectiveness.
Aims and Objectives : This study was done to generate evidence regarding the effectiveness of vaccines in preventing severe disease. Materials and Methods : A case-control study was conducted among attendees of a post COVID-19 follow-up clinic of a Tertiary Care Hospital in Kolkata. Total 64 study participants (16 cases and 48 controls) were interviewed and all treatment records were reviewed. Those who had severe COVID-19 disease were taken as cases, whereas those who had mild/moderate disease (as per WHO guidelines) were taken as controls. Three controls were matched against each case.
Results : Fifty-one percent of the study participants were found to be fully vaccinated and among them only 12% had developed severe breakthrough disease. Fear of adverse effects was cited to be the commonest cause for vaccine hesitancy. Vaccine efficacy in preventing severe disease was calculated to be 78%. After adjusting for possible confounders, the adjusted vaccine efficacy was calculated to be 94%.
Conclusion : The vaccines against COVID-19 are effective and fully vaccinated individuals are less likely to develop severe disease.
Key words : COVID-19 Vaccine, Vaccine Effectiveness, Case-control Study.
On March, 2020, the World Health Organization (WHO) declared the Coronavirus disease 2019 (COVID-19) caused by the Severe Acute Respiratory Syndrome Coronavirus-2 (SARS CoV2) a pandemic. It had devastating effects in India with over 4 lac deaths (till November, 2021). A herd immunity level of 60-70% was imperative to control the spread of infections during the pandemic and vaccines remained the most crucial weapon to control the same1.
The Government of India launched world’s biggest COVID-19 vaccination campaign on 16th January 2021, with two vaccines [Covaxin (BBV152), Indigenous, Bharat Biotech Ltd; Covishield (ChAdOx1nCoV-19), Serum Institute of India with technology transfer from Oxford University and AstraZeneca]3
Emergence of breakthrough infections concurrent to
Department of Community Medicine, IPGME&R and SSKM Hospital, Kolkata 700020
1MD (Community Medicine), Senior Resident and Corresponding Author
2MD (Community Medicine), Associate Professor, Department of Community Medicine, Burdwan Medical College and Hospital, Burdwan 713104
3MD (Community Medicine), Department of Community Medicine, Calcutta National Medical College and Hospital, Kolkata 700014
4MD (Community Medicine), Assistant Professor
5MBBS, Junior Resident
Received on : 09/02/2024
Accepted on : 30/06/2024
Editor's Comment : ! ! ! ! ! This study demonstrates that COVID-19 vaccination is highly effective in preventing severe disease, with markedly reduced odds of severe illness among fully vaccinated individuals, even after adjusting for confounders. However, persons with underlying comorbidities remain at higher risk of severe breakthrough infection, underscoring the need for targeted protection of vulnerable groups. Addressing vaccine hesitancy through focused health education is essential to improve coverage and further reduce severe COVID-19 outcomes.
vaccination efforts, it became a global concern both clinically and epidemiologically. As per Centers for Disease Control and Prevention (CDC), a vaccine breakthrough infection is defined as the detection of SARS-CoV-2 RNA or antigen in a respiratory specimen collected from a person >14 days after receipt of all recommended doses of an FDA-authorized COVID-19 vaccine4 A vaccine effectiveness is a measure of how well vaccines work in the real World (WHO). None of the vaccines approved in India had reported 100% effectiveness and the mutant variants of SARS-CoV2 were found to evade immunity offered by vaccines in some individuals. Thus, the population remains susceptible to SARS CoV2 despite full vaccination (ie, two doses of vaccines, as recommended during the study period4 With this in mind, the study was done to determine the effectiveness of COVID-19 vaccines in preventing severe disease and to find the factors associated with it.
How to cite this article : Effectiveness of COVID-19 Vaccines in Preventing Severe Disease : A Retrospective Study among Patients Attending a Post COVID-19 Follow-up Clinic of a Hospital. Dey A, Bandyopadhyay S, Majumdar S, Chakrabarti S, Mondal A. J Indian Med Assoc 2026; 124(1): 26-9.
This observational, analytical study of case- control study design was conducted in the post-COVID-19 follow-up clinic of Infectious Disease & Beleghata General Hospital in Kolkata from 1st October, 2021 to 30th November, 2021 among clinic attendees aged >45 years.
The total sample size of 64 was obtained (taking the Confidence Interval - 95%, power- 80%, ratio of controls to cases: 3 and odds ratio 0.184, as obtained from a pilot study) out of which there were 16 cases and 48 controls.
All patients aged >45 years (as this age group was eligible for vaccination during the period) who attended the clinic during the reference period and had recovered from COVID-19 in the preceding 3 months were included in the study. Whereas, those who were infected within 14 days of vaccination or were partially vaccinated (received less than two doses) were excluded.
Selection of Cases and Controls :
Cases : Patients who had severe COVID-19 disease (as per WHO guidelines) were taken as cases5
Controls: Patients who did not have severe COVID-19 disease (mild/moderate disease, as per WHO guidelines5 were taken as controls. Three controls were taken against each case, matched appropriately with respect to age (±2 years) and sex.
Hospital records such as admission certificate, treatment records, bed head tickets were reviewed for the purpose of selection of cases and controls (Fig 1).
With due clearance from the Institutional Ethics Committee (Memo no: IDBGH/Ethics/344) and hospital authorities, participants were enrolled into the study after obtaining a written informed consent, consecutively and categorised as cases and controls. Three controls were matched against each case till desired sample size achieved. to avoid duplication of data, OPD registration number was taken into consideration. Participants were interviewed using a pre-tested, pre-designed schedule and were assured about the confidentiality and anonymity of their information.
Data was analysed for consistency and completeness and entered in Microsoft Excel datasheet. IBM SPSS software version 23 was used to analyse the data. Mean (±Standard Deviation) and percentages were used to present the summary measures. Pearson’s Chi square test was use to elicit association between categorical variables. The protective effect of vaccine in preventing severe disease was statistically tested using univariate logistic regression and was expressed in Odds Ratio (OR). Vaccine Effectiveness (VE) was calculated using the following formula: VE = [(1-OR) X 100 %]. Univariate analysis followed by binomial logistic regression analysis were
During the reference period those attending the post COVID-19 follow-up clinic were included into the study
Those who provided written, informed consent, and satisfied the inclusion and exclusion criteria were included in the study. (n=64)
Medical records of the subjects were reviewed and participants were consecutively enrolled and categorised as cases and controls*
Three controls were taken against each case, matched appropriately with respect to age (±2 years) and sex.
Those who had severe COVID-19 disease (as per WHO guidelines) were taken as cases (n= 16)
Those who did not have severe COVID-19 disease (ie, mild/moderate disease per WHO guidelines) were taken as controls. (n=48)
Participants were interviewed using a pre-tested, pre-designed schedule.
*Medical records included admission certificate, discharge certificate, treatment records, bed head tickets.
Fig 1 — Chart showing the selection of cases and controls
performed to find out the factors associated with breakthrough COVID-19 disease severity. A P-value of <0.05 was considered significant.
Among the attendees of the post COVID-19 clinic, a total of 64 individuals (comprising of 16 cases and 48 controls) were interviewed during the study period. In this study the mean age of the study participants was 59.3 (±8.8) years and comprised of 56% females and 44% males among both cases and controls. Fifty-one percent of the study participants were found to be fully vaccinated out of which only 12% had developed severe breakthrough disease. Majority (75%) of the cases and 40% of the controls were not vaccinated. Sixty-nine percent of the cases and 29% of controls had at least one chronic comorbidity. Thirty-one percent of the cases and 63% of the controls had been infected more than once (Table 1). Fear of adverse effect was cited as the predominant cause for vaccine hesitancy. Vaccination status was found to be significantly associated with disease severity (P= 0.019, OR= 0.22) and vaccine efficacy in preventing severe disease was calculated to be 78% (Table 2). After adjusting for factors such as age, practice of the recommended COVID-19 appropriate behaviour, presence of comorbidities and history of previous COVID-19 infection, the adjusted vaccine efficacy {(1-aOR) X 100} was found to be 94% (aOR= 0.06)
On Univariate analysis breakthrough COVID-19 disease severity was found to be significantly associated with the presence of comorbidities (p= 0.11, OR= 14.4) and previous
Table 1 — Background characteristics of the study participants (n=64)
VariablesCases N(%)Control N(%)p-value
Age (years)<60 years1 (5.8)16 (94.2)0.376a
>60 years3 (16.7)15 (83.3)
VaccinatedYes4 (12.1)29(87.9)0.019b
No12 (38.7)19 (61.3)
ComorbiditiesPresent3 (37.5)5 (62.5)0.011b Absent1 (4)24 (96)
COVID-19Practiced2 (18)9 (82)0.450b appropriateNot practiced2 (9)20 (91) behaviour
a= unpaired t-test ; b= χ2 test
COVID-19 infection (p=0.04, OR= 0.09) (Table 3). On binary logistic regression after adjusting for possible confounders such as Age and Practice of Covid appropriate behaviour and previous COVID-19 infection, individuals with comorbidities were found more likely to develop severe breakthrough COVID-19 disease (p= 0.011, aOR= 3.8, 95% CI : 1.38-9.13).
DISCUSSION
The Government of India has rolled out a rigorous vaccination campaign with two effective vaccines to curb the ongoing pandemic. Currently the vaccines are being administered on persons aged >45 years and has contributed significantly in reducing morbidity and mortality 5. Although there is evidence suggestive of immunity obtained from SARS-CoV2 infection have protective role against reinfection but the waning nature of this natural immunity is evident as reinfections continue to occur, thus vaccines are imperative, even for those who have been already infected5. In this study the overall unadjusted effectiveness of vaccines against COVID-19 among completely vaccinated individuals (two doses) was found to be 78% and the adjusted vaccine effectiveness was found to be 94%. Those with chronic comorbidities were more likely to develop severe breakthrough COVID19 disease.
Multiple large-scale studies have been done to assess the effectiveness of the various approved vaccines Worldwide. The VIVALDI cohort study conducted in the
Table 3 — Binary logistic regression analysis for association of different factors with breakthrough COVID-19 disease
Variables Severe COVID-19p-valueORaOR (95% CI)(95% CI) Yes, N (%)No, N(%)
Age (years) : <60 years1 (5.8)16 (94.2)0.3760.3 0.26 (0.01-5.05) >60 years3 (16.7)15 (83.3)11
Comorbidities : Present3 (37.5)5 (62.5)0.01114.430.88 (13.8-58.3) Absent1 (4)24 (96)11
COVID-19 appropriate behaviour : Practiced2 (18) 9 (82)0.4502.20.38 (0.02-6.54) Not practiced2 (9)20 (91)11
United Kingdom among older adults aged >65 years reported 68% effectiveness (adjusted HR-0.32, 95% CI0.15-0.66) of the Oxford-AstraZeneca ChAdOx1in vaccine in preventing SARS-CoV-2 infection at 35-48 days of vaccination6. In a test negative case-control study done in England among older adults reported an effectiveness of the Oxford-AstraZeneca vaccine to be 60% (41% to 73%) from 28 to 34 days postvaccination, which was found to increase to 73% (27% to 90%) after 35 days7
In a comprehensive systematic review and meta-analysis of the efficacy and effectiveness of COVID-19 vaccines done in China showed a cumulative effectiveness of 79.5% (95% CI: 73.9%, 83.8%), 80.2% (95% CI: 74.1%, 84.9%), 95.1% (95% CI: 93.1%, 96.5%), and 92.4% (95% CI: 88.6, 94.9) to prevent Delta variant infection, COVID19, severe COVID-19, and COVID-19-related death, respectively 8. A meta-analysis of large observational studies done to determine the real- world effectiveness of the BNT162b2 mRNA vaccine reported an effectiveness of 53% (95% CI 32-68%) after 1 dose and 96% (95% CI 95-97%) after two doses9
Similar studies done in India have also generated evidence regarding vaccine effectiveness, one such being a study done in eastern India, where the adjusted vaccine effectiveness was reported to be 52.0% (95% CI 39.0–63.0%) and 83.0% (95% CI 73.0–89.0%), after partial and
Table 2 — Effectiveness of vaccines in preventing severe
VariablesCases N= 16(%)Control N=48(%) ORaORVE (%)Adjusted VE(%)
Age in completed years<6010 (62.5)25 (52)1.53(0.48-4.89)3.64(0.63-21.21) >606 (37.5)23 (48)11
VaccinatedYes4 (25)30(62.5)0.22(0.06-0.78) 0.06 (0.09-0.37)7894 No12 (75)18 (38.5)11
ComorbiditiesPresent11 (69)14(29) 5.343(1.57-18.22)7.19(1.38-37.03) Absent5 (31) 34 (71)11
COVID-19 appropriate behaviour Practiced9 (56.3)31(64.6)1.42(0.45-4.49)1.17(0.27-5.07) Not practiced7 (43.7)17(35.4)11
Previous COVID-19 infectionYes11 (68.7)18 (37.5)3.67(1.09-12.27)0.19(0.04-0.93) No5 (31.3)30 (62.5)11
Dey A, et al. Effectiveness of COVID-19 Vaccines in Preventing Severe Disease
complete vaccination respectively. They have also stressed on the most common reason for not receiving the vaccine to be inaccessibility to vaccination centres compared to this study where fear of adverse effects was the most cited cause10. In another study done in Mumbai, the effectiveness of COVID-19 vaccines was found to be 70% among completely vaccinated individuals and 88% among those with a history of previous infection11
There were some limitations in our study. The combined effectiveness of both Covaxin (BBV152) and Covishield (ChAdOx1nCoV-19) vaccines was determined. The individual effectiveness could not be determined. Also, the vaccine was approved for usage among those aged 45 years and above, thus its effectiveness among the younger age group was beyond the scope of this research.
Nevertheless, the study has generated useful information on the effectiveness of COVID-19 vaccines which can further contribute in fortifying the indisputable role of vaccines in combatting the pandemic that currently has the World in its grips. The information is also expected to appease the hesitancy and combined with a more vigorous vaccination campaign help improve vaccination coverage.
In this study it was found that the approved vaccines against COVID-19 were effective and those vaccinated, were less likely to develop severe disease. The vaccine effectiveness was found to be significantly higher among individuals who were younger, without any chronic comorbidity, practiced the recommended COVID-19 appropriate behaviour and had history of previous infection. However, vaccine hesitancy was a considerable problem during the study period which was reflected in the vaccine coverage among the study participants, also the practice of precautions necessary after vaccination were found to be unsatisfactory. A rigorous vaccination campaign combined with health education to target populations is recommended to combat vaccine hesitancy. A study on a larger scale is recommended to further explore the vaccine effectiveness against disease caused in the younger age group and that by the newer variants of the virus.
Financial support : This research received no specific grant from any funding agency in the public, commercial, or not-for-profit sectors.
Conflict of interest : None.
1Sharma A, Ahmad Farouk I, Lal S — COVID-19: A Review on the Novel Coronavirus Disease Evolution, Transmission, Detection, Control and Prevention. 2021.
2Who coronavirus (COVID-19) dashboard [Internet]. World Health Organization; Available from: https://covid19.who.int/ (Accessed on 12th march 2022)
3COVID19_Vaccine_Operational_Guidelines [Internet] . Available from: http s://www.mohfw .gov.in/pdf/ COVID19VaccineOG111Chapter16.pdf. (accessed on 12th December 2021)
4Covid-19 vaccine breakthrough infections reported to CDC - United States, January 1–April 30, 2021. Centers for Disease Control and Prevention; 2021 accessed on 12th December 2021)Available from: https://www.cdc.gov/mmwr/volumes/70/wr/mm7021e3.htm
5Chirico F, Teixeira da Silva JA, Tsigaris P, Sharun K — Safety & effectiveness of COVID-19 vaccines: A narrative review [Internet]. U.S. National Library of Medicine; 2022 [cit. Available from: https:/ /www.ncbi.nlm.nih.gov/pmc/articles/PMC9552389/
6Shrotri M, Krutikov M, Palmer T, Giddings R, Azmi B, Subbarao S, et al — Vaccine effectiveness of the first dose of Chadox1 nCoV-19 and BNT162B2 against SARS-COV-2 infection in residents of longterm care facilities in England (Vivaldi): A prospective cohort study. The Lancet Infectious Diseases 2021; 21(11): 1529-38. doi:10.1016/ s1473-3099(21)00289-9
7Lopez Bernal J, Andrews N, Gower C, Robertson C, Stowe J, Tessier E, et al — Effectiveness of the Pfizer-BioNTech and OxfordAstraZeneca vaccines on covid-19 related symptoms, hospital admissions, and mortality in older adults in England: test negative case-control study. BMJ 2021; 373: n1088. doi: 10.1136/bmj.n1088. PMID: 33985964; PMCID: PMC8116636.
8He X, Su J, Ma Y, Zhang W, Tang S — A comprehensive analysis of the efficacy and effectiveness of COVID-19 vaccines. Frontiers in Immunology. 2022;13. doi:10.3389/fimmu.2022.945930
9Kow CS, Hasan SS — Real-world effectiveness of BNT162B2 mRNA vaccine: A meta-analysis of large observational studies. Inflammopharmacology 2021; 29(4): 1075-90. doi:10.1007/s10787021-00839-2
10Singh C, Naik BN, Pandey S, Biswas B, Pati BK, Verma M, et al — Effectiveness of COVID-19 vaccine in preventing infection and disease severity: A case-control study from an eastern state of India. Epidemiology and Infection 2021; 149. doi:10.1017/ s0950268821002247
11Contractor A, Shivaprakash S, Tiwari A, Setia MS, Gianchandani T — Effectiveness of COVID-19 vaccines (CovishieldTM and Covaxin ®) in healthcare workers in Mumbai, India: A retrospective cohort analysis. PLOS ONE 2022; 17(10) . doi:10.1371/ journal.pone.0276759
Poonam Ashok Kamath1, Meghana Shridhar2, Chandrashekhar UK3
Abstract
Background : Dengue fever and Scrub Typhus are the most common causes of acute febrile illness in tropical and subtropical areas of the World. The clinical and laboratory features of both infections are often similar, making differentiation challenging during the initial presentation. The aim of this study was to observe the differences in clinical and laboratory characteristics between these two infections and to design a clinical scoring model that may be used as a guide for early detection of these infections.
Materials and Methods : We conducted a cross-sectional study among 184 patients confirmed to have either Dengue or Scrub Typhus. Various clinical and laboratory variables were studied. A scoring model based on nine variables-age, altered sensorium, hemoglobin, total leucocyte count, neutrophil-lymphocyte ratio, platelet count, total bilirubin, CRP, albumin was formed. A cut-off score of four was calculated using a ROC curve.
Results : When validated, this scoring model showed sensitivity of 72% for Dengue and 48% for Scrub Typhus.
Conclusion : Dengue and scrub typhus can have appreciable clinical and laboratory overlap. The scoring model can be used for earlier diagnosis and expedite management.
Key words : Dengue, Scrub Typhus, Scoring Model, Acute Febrile Illness.
Dengue and Scrub Typhus account for more than half of all acute febrile illnesses in several parts of India, including Karnataka and peak during the rainy season1. Dengue fever is spread by Aedes mosquitoes. It is caused by one of the four Dengue virus serotypes (DEN-1, DEN-2, DEN-3 and DEN-4) of the Flavivirus genus. Dengue fever presents with a wide range of clinical manifestations with an unpredictably variable clinical course and outcome. Despite supportive therapy, published research in India reported a death rate of 3% to 11% among adults owing to DHF and DSS2 Patient outcomes can be improved with early diagnosis and supportive treatment, as well as cautious hydration management and constant monitoring 3 .
Scrub Typhus infection is caused by infection with the intracellular bacterium, Orientia tsutsugamushi, which is transmitted to humans by the bite of an infected larva of trombiculid mites 4 According to reports, eschar, a diagnostic hint for Scrub Typhus infection, is not always present and is only seen in 20-87% of scrub typhus patients5 Scrub Typhus responds quickly to antibiotic
1MBBS, MD, FAGE, Assistant Professor, Department of General Medicine, Kasturba Medical College, Manipal Academy of Higher Education (MAHE), Manipal, Karnataka 576104 and Corresponding Author
2MBBS, MD, Assistant Professor, Department of General Medicine, Manipal Academy of Higher Education, Manipal, Karnataka 576104
3MBBS, MD, Professor, Department of General Medicine, Manipal Academy of Higher Education, Manipal, Karnataka 576104
Received on : 13/03/2024
Accepted on : 17/01/2025
Editor's Comment :
There is an overlap of clinical features and laboratory investigations between Dengue and Scrub Typhus.
! A scoring model based on nine variables which gave a cut off score of 4. A score of <4 suggested Dengue and >4 suggested Scrub Typhus. When validated, this score demonstrated a sensitivity of 72% for Dengue and 48% for Scrub Typhus. ! ! ! Believe that this scoring model when used for a larger population can provide early clue to disease etiology which can guide better treatment decision making and improve patient outcome.
treatment, with patients becoming afebrile in 24 to 48 hours. The mortality rate in severe cases of multi-organ failure might be as high as 24%6,7. Dengue fever (NS1antigen or IgM Dengue ELISA) and Scrub Typhus (IgM ELISA) diagnostic tests are time-consuming and can result in false positives due to prior infections or cross-reactivity in serological assays8.
The aims and objectives of this study are to study the clinical and laboratory features to differentiate Dengue and Scrub Typhus infections at presentation and to develop a clinical scoring model to identify the differences in the characteristics of these infections during their initial stages.
A cross-sectional observational study was conducted at Kasturba Hospital, Manipal between September, 2019 and September, 2021. Sample size of 164 was calculated
How to cite this article : A Clinical and Laboratory Scoring Model for Early Differentiation of Dengue and Scrub Typhus Infection. Kamath PA, Shridhar M, Chandrashekhar UK. J Indian Med Assoc 2026; 124(1): 30-4.
using the formula:
Z1-α/2(AUC)/d 2, where Z1-α/2 is the standard normal variate (1.96 at p<0.05), AUC is derived from previous studies and d2 represents the absolute error.
Adults >18 years of age admitted to Medicine wards with the diagnosis of Dengue or Scrub Typhus infection confirmed by serological tests were recruited in our study. Patients with evidence of a primary focus of infection (eg, consolidation on chest x-ray, symptoms and signs of urinary tract infection, cellulitis), patients with concurrent culture proven bacterial infections and patients with concomitant febrile illnesses along with Dengue or Scrub Typhus infection such as malaria, leptospirosis, typhoid and influenza were excluded from the study. Since this study was done during the COVID pandemic, patients who were tested COVID positive were excluded from our study.
Demographic data including age, sex, occupation, area of residence, and clinical data including symptoms, vital signs and examination findings were individually collected on study case record forms after obtaining written informed consent. Routine laboratory parameters, such as complete blood count, liver and renal function tests, serum electrolytes, and blood sugars were noted. Chest x-ray findings were noted if done. Oxygen saturation (SpO2) by pulse oximeter was checked if the patient was breathless or tachypnoeic. Confirmation of dengue positivity was done by assessing dengue-specific IgM antibodies using the kit from National Institute of Virology, Pune. The presence of Dengue non-structural glycoprotein-1 (NS1) antigen was tested using the Pan bio-ELISA kit. Presence of Scrub Typhus infection was confirmed by Scrub Typhus IgM ELISA (In Bio-USA). The illness outcome was assessed in terms of course in the hospital and duration of hospital stay. The patient condition at the time of discharge was noted (survivors/non-survivors).
Study Definitions :
Dengue fever was diagnosed based on compatible clinical and laboratory features as per WHO 2009 classification, with a positive test for non-structural protein (NS1) antigen or Dengue IgM antibodies by ELISA (Pan Bio ELISA). Scrub Typhus was diagnosed based on the presence or absence of eschar, with a positive test for Scrub IgM antibodies by ELISA (In Bio-USA). The Institutional Ethics Committee provided approval for the study (IEC No.: 621/ 2019) before commencement of data collection.
Statistical Methods :
Sample size was calculated based on classification ability of the scoring system for distinguishing between Dengue and Scrub Typhus. Previous studies have demonstrated an area under the ROC curve of 0.8 based on 6 studies. Anticipating an increase of 7.5% in the area under the ROC curve by incorporating potential clinical and
laboratory variables, the minimum required sample size in each group was 82 (total 164). An additional 25 samples for each group were taken for the validation of the derived score. The P value was calculated using Fisher’s test for the comparison of clinical and laboratory parameters between the two groups. Based on these findings, a scoring model was developed with arbitrary cut off values. ROC curve demonstrated that for a cut off score of 4, the sensitivity would be 84.1%.
SPSS for Windows version 10.0 was used to gather and analyze the data. The average Standard Deviation was used to represent quantitative data. The Mann–Whitney U-test was used to establish statistical significance for continuous variables, while Fisher’s exact test/Chi-square test was used for dichotomous variables. Statistical significance was defined as a P-value of <0.05.
A total of 164 patients were enrolled, comprising 82 patients with dengue and 82 patients with Scrub Typhus. The mean age of Dengue patients was 33.9 years, while that of Scrub Typhus patients was 46.4 years. In the Dengue group, the majority of patients were within the age group of 21-30 years (n=32, 39.02%). In Scrub Typhus, most patients were in the age group of 41-50 years (n=21, 25.60%). Males outnumbered females in both groups, with 67 males (81.7%) and 15 females (18.3%) in the Dengue group, and 46 males (56.3%) and 36 females (43.9%) in the Scrub Typhus group. The maximum number of dengue cases were from Udupi district (n=33, 40.2%), followed by Uttara Kannada (n=13, 15.8%). In contrast, the maximum number of Scrub Typhus cases were from Davangere district (n=23, 28.04%), followed by Chitradurga (n=14, 17.07%).
On the analysis of symptoms in both infections, fever was most common, with 80 cases (97.56%) in Dengue and 77 cases (93.9%) in Scrub Typhus, followed by Myalgia with 51 cases (62.6%) in dengue and 37 cases (45.1%) in Scrub Typhus. The mean duration of fever was 4.79 days in Dengue and 7.25 days in Scrub Typhus. Skin rash was present in 26.8% of Dengue patients (n=22) and 4.8% of scrub typhus patients (n=4). Eschar was present in 17.07% of Scrub Typhus patients and lymphadenopathy was present in 2.4% of Scrub Typhus patients. Altered sensorium was noted in 7.3% of Scrub typhus patients (n=6). Jaundice was reported in 40.2% of Scrub Typhus patients, while only 4.8% of Dengue patients had Jaundice. The mean duration of hospital stay was 4.15 days for Dengue and 6.00 days for Scrub Typhus.
The mean pulse was 84.43 ± 12.31 per minute in Dengue and 93.46 ± 18.78 in Scrub Typhus. Mean SBP (mmHg) and DBP (mmHg) was 112.01 ± 19.85 and 72.44 ± 8.10 in Dengue respectively and 111.95 ± 13.74 and 71.16 ±
11.82 in Scrub Typhus respectively. The mean temperature recorded was 98.58 ± 0.36 in dengue and 98.9 ± 0.98 in Scrub Typhus. More number of patients with Scrub Typhus had hepatomegaly (18.2%) when compared to Dengue (7.3%), whereas Splenomegaly was more common in Dengue (9.7%) than Scrub Typhus (6%).
Complications such as hepatitis, acute kidney injury, encephalitis, ARDS, myocarditis and pancreatitis were more frequently observed in the Scrub Typhus group compared to Dengue. Polyserositis was more common in Dengue, as shown in the graph below. Mortality was seen in the Scrub Typhus group (n=1, 3.5%). The cause of mortality in the Scrub Typhus group was multi-organ dysfunction syndrome. Laboratory investigations done has been summarized in Table 1.
Variables with significant values were selected to devise a scoring model. The nine variables were divided into two groups based on arbitrary cut-off values. A cut-off score was then calculated using a ROC curve to distinguish between the two illnesses.
The model (Fig 1) has a classification ability of 80% (Area under ROC curve), with cut off value of 4.5 with 84.1 % sensitivity and 55% specificity. Therefore, a cut off score of 4 was chosen. A total score of <4 suggested Dengue, and >4 suggested Scrub Typhus.
This model was applied to another subset of patients, with 25 patients in each group for both Dengue and Scrub Typhus, and the results were obtained as mentioned in Table 2. The sensitivity was 72% and 48% when applied on patients who were tested positive for Dengue and Scrub Typhus respectively.
There is an overlap of clinical features and laboratory investigations between Dengue and Scrub Typhus. Early detection is important to prevent significant morbidity and mortality. The mainstay of treatment for Dengue is supportive management and for Scrub Typhus, it is antibiotics.
1 — ROC curve of age, hemoglobin, TLC, NLR, platelets, total
CRP, albumin and altered sensorium
Males outnumbered females in the current study, which is in contrast to study in Vellore by Mitra, et al where there was male preponderance in Scrub group (55.7%) and female in Dengue (56.4%)9. In both Dengue and Scrub Typhus, the mean age was 33.9 years and 46.4 years, respectively, which was similar to the earlier research in Vellore, where the mean age was 29.8 years in Dengue. The possible explanation for male preponderance in all studies could be due to increased outdoor activity, leading to increased exposure to mosquito bites.
Table 1 — Laboratory features in Dengue and Scrub Typhus
LaboratoryDengue (n=82)Scrub TyphusP value
Features Mean ± SD/(n=82)
Median (Q1, Q3)Mean ± SD/ Median (Q1, Q3)
Haemoglobin (gm/dL)14.93 ± 2.0112.00 ± 2.240.000*
TLC (cells/µL)4750 (3400,6900)7700 (5875,11125)0.000*
Platelet (cells/µL)775001135000.001* (33000,126500) (64250,160750)
Neutrophil (%)51.8 ± 16.162.2 ± 16.50.000*
Lymphocyte (%)53.9 (41.8, 64.4)21.5 (16.4, 33.5)0.005*
NLR1.9 (1.0,3.0)3.0 (1.6,4.3)0.001*
Creatinine (mg/dL) 1.0 ± 0.31.1 ± 0.70.947
VariablesScore 0Score 1
Age (years)<40>40
Haemoglobin (gm/dL)<14>14
TLC (cells/µL)<4000>4000 NLR>2<2
Platelets (cells/µL)<50000>50000
Total bilirubin (mg/dL)<1.2>1.2
CRP (mg/L)<6>6
Albumin (gm/dL)>3.5<3.5
Altered sensorium AbsentPresent
Sodium (meq/L)136.41 ± 3.41 132.28 ± 5.090.000*
Potassium (meq/L)4.25 ± 0.464.16 ± 0.630.298
Total bilirubin (mg/dL)0.5 (0.4,0.8)1.2 (0.7, 4.1)0.000*
Direct bilirubin (mg/dL)0.2 (0.1, 0.3)0.7 (0.3, 3.5)0.000*
AST (IU/L)91 (52, 164)90.5 (57.8, 161.3)0.583
ALT (IU/L)58 (36.5, 117)80 (51.5, 121.5)0.123
Total protein (gm/dL)6.96 ± 0.596.33 ± 0.730.000*
Albumin (gm/dL)4.03 ± 0.41 3.13 ± 2.980.000*
CRP (mg/dL)8.5880.250.000* (4.64, 26.32)(45.13, 161.06)
Kamath PA, et al. A Clinical and Laboratory Scoring Model for Early Differentiation of Dengue and Scrub Typhus Infection.
The mean duration of fever was 4.79 days and 7.25 days in Dengue and Scrub Typhus respectively. This was similar to what was observed by Mitra, et al where the mean duration was 5.9 days for Dengue and 8.1 days for Scrub Typhus9. In Dengue fever, the median hospital stay was 4 days, while in Scrub Typhus, it was 6 days. In our study, fever was the most common presenting symptom followed by myalgia in both the groups. In another study conducted by Laul, et al done in North India on Dengue, fever (100%) was the most common symptom followed by headache (87%)10 . Bleeding manifestations were present in 3.7% of patients of Dengue infection. This contrasts with a previous study by Laul, et al where it was 21%10 Eschar was noted in 17.07% of patients with Scrub Typhus. Previous studies noted a much higher percentage, as observed in the study by Chang, et al in Taiwan, where it was 62.5% and in the study by Premraj, et al where eschar was present in 58% of cases11,12
Skin rash was present in 26.8% of Dengue patients whereas the study done in Vellore noted a skin rash in 14.2% of the patients9. 4.8% of Scrub Typhus patients also reported a skin rash. In our study, hypotension was noted in 9.7% of Scrub Typhus and 3.6% of Dengue patients. 40.2% of patients with Scrub Typhus had icterus, whereas only 4.8% of patients of Dengue had icterus.
Hepatomegaly was found to be more common in Scrub Typhus (18.2%) when compared to Dengue (7.3%), whereas Splenomegaly was more frequently noted in Dengue (9.7%) than Scrub Typhus (6%). As reviewed in an article by Zubair, et al the incidence of Hepatomegaly in adult patients with Dengue infection ranges from 4 to 52%13 The wide variations in the clinical manifestations observed in patients may be attributed to the differences in the age groups of the population affected along with the extent of severity of disease in them. Laboratory parameters such as haemoglobin, total protein, albumin, sodium, NLR, platelet, total bilirubin, and direct bilirubin values were statistically significant between the two groups. This was similar to what was observed by Mitra, et al9 However, our study found no significant difference of liver enzymes like ALT, AST between the two groups. The median CRP levels in Dengue was 8.58mg/ dL and 80.25mg/dL in scrub typhus. Voung, et al noted a median CRP level of 30.2mg/dL in their study on Dengue whereas Kim HL, et al reported a mean CRP of 10.54 in their study of Scrub Typhus patients14,15 Hepatitis was noted in 63.4% of Scrub Typhus and 45.1% of Dengue patients. Another study by Griffith, et al in Vellore noted Hepatitis in 63.8% of cases 16 . Patients in the Scrub Typhus group had more complications, such as ARDS (23.1%), encephalitis (9.7%) and myocarditis (7.3%) when compared to Dengue (ARDS: 12.1%, encephalitis:1.2%, myocarditis: 12.2%). This could be attributed to the more complex pathogenesis
of Scrub Typhus infection. Mortality was observed in the Scrub typhus group (n=1, 3.5%). The cause of mortality in the Scrub Typhus group was multi-organ dysfunction syndrome. In a study conducted by Patil, et al on Dengue infection, hepatitis was present in 33% of patients, and 3% had ARDS, while another 3% had encephalitis. The mortality rate was 3.2% in their study 17 .
Few studies have observed the differences in clinical and laboratory features between these two illnesses. A study by Chang, et al in Taiwan showed significant differences in clinical features such as cough and eschar and the laboratory features showed that WBC count, platelet count, PT, APTT, BUN and creatinine were significantly different between the two groups11
A study done in Vellore by Mitra S, et al identified seven clinical variables based on multivariate analysis which included age, oxygen saturation, altered sensorium, haemoglobin, total leucocyte count, total bilirubin and AST values9 Six different scoring models were developed, and among them, model 2 exhibited a sensitivity of 84%. A cut off score of 13 was used. This model was however not validated. In our study, we devised a scoring model based on nine variables: age, haemoglobin, total leucocyte count, neutrophil-lymphocyte ratio, platelets, total bilirubin, CRP, albumin and altered sensorium. In this model, a total score of <4 suggests Dengue, and >4 suggests Scrub Typhus. When tested on a different group of patients, this scoring method had a sensitivity of 72% for patients with Dengue fever and 48% for patients with Scrub Typhus.
Very few studies have been undertaken to distinguish between these two most prevalent causes of acute febrile illness. Although certain features overlap, there are differences which can be incorporated to devise a model which can help differentiate the two at the time of presentation. Our study aimed to do the same.
Clinical features significant between the two infections were myalgia, arthralgia, breathlessness, altered sensorium, pulse rate, respiratory rate, temperature and hepatomegaly. Additionally, laboratory features such as hemoglobin, total leucocyte count, platelet, neutrophillymphocyte ratio, CRP, total bilirubin, and albumin were found to be significant between the two groups. When compared to Dengue fever, patients with Scrub Typhus had more complications such as ARDS, encephalitis and Myocarditis. A scoring model based on nine variables gave a cut off score of 4. A score of <4 suggested Dengue and >4 suggested Scrub Typhus. When validated, this score demonstrated a sensitivity of 72% for dengue and 48% for scrub typhus.
Limitation :
Logistic regression analysis would have given a better scoring model based on Odds Ratio but could not be used owing to the limited study population. The etiology for acute febrile illnesses is vast and this scoring model is limited only to Dengue and Scrub Typhus infections.
Funding : None.
Conflict of Interest : None.
1Chrispal A, Boorugu H, Gopinath KG, Chandy S, Prakash JA, Thomas EM, et al — Acute undifferentiated febrile illness in adult hospitalized patients: the disease spectrum and diagnostic predictorsan experience from a tertiary care hospital in South India. Trop Doct 2010; 40(4): 230-4.
2Chadwick D, Arch B, Wilder-Smith A, Paton N — Distinguishing dengue fever from other infections on the basis of simple clinical and laboratory features: application of logistic regression analysis. J Clin Virol 2006; 35(2): 147-53.
3Dengue Viruses | Learn Science at Scitable [Internet]. Nature.com. 2019 [Accessed 22 July 2020]. Available from: https:// www.nature.com/scitable/topicpage/dengue-viruses-22400925
4Majumdar R, Jana CK, Ghosh S, Biswas U — Clinical spectrum of dengue fever in a tertiary care centre with particular reference to atypical presentation in the 2012 outbreak in Kolkata. J Indian Med Assoc 2012; 110(12): 904-6.
5Rajapakse S, Rodrigo C, Rajapakse A — Treatment of dengue fever. Infect Drug Resist 2012; 5: 103-12.
6Peter JV, Sudarsan TI, Prakash JA, Varghese GM — Severe scrub typhus infection: clinical features, diagnostic challenges and management. World J Crit Care Med 2015; 4(3): 244-50.
7Kundavaram AP, Jonathan AJ, Nathaniel SD, Varghese GM — Eschar in scrub typhus: a valuable clue to the diagnosis. J Postgrad Med 2013; 59(3): 177-8.
8Prakash JAJ — Scrub typhus: risks, diagnostic issues, and management challenges. Res Rep Trop Med 2017; 8: 73-83.
9Mitra S, Gautam I, Jambugulam M, Abhilash KP, Jayaseeelan V — Clinical score to differentiate scrub typhus and dengue: A tool to differentiate scrub typhus and dengue. J Global Infect Dis 2017; 9: 12-7.
10Laul A, Laul P, Merugumala V, Pathak T, Miglani U, Saxena P — Clinical Profiles of Dengue Infection during an Outbreak in Northern India. Journal of Tropical Medicine 2016; Article ID 5917934, 7 pages, 2016.
11Chang HC, Lin MC, Liu SF, Su MC, Fang WF, Chen YC, et al — The clinical differences between dengue and scrub typhus with acute respiratory failure in southern Taiwan. Infection 2012; 40(4): 35965.
12Premraj SS, Mayilananthi K, Krishnan D, Padmanabhan K, Rajasekaran D — Clinical profile and risk factors associated with severe scrub typhus infection among non-ICU patients in semiurban south India. J Vector Borne Dis 2018; 55: 47-51
13Zubair A, Qureshi AA, Murtaza Jafri SA — Assessment of Dengue Fever Severity Through Liver Function Test, Dengue - Immunopathology and Control Strategies. July, 2017. Márcia Aparecida Sperança, IntechOpen, DOI: 10.5772/intechopen.68949. (Accessed on 12 August 2021). Available from: https://www.intechopen.com/ chapters/56427
14Vuong NL, Le Duyen HT, Lam PK, Tam DTH, Vinh Chau NV, Van Kinh N, et al — C-reactive protein as a potential biomarker for disease progression in dengue: a multi-country observational study. BMC Med 2020; 18(1): 35.
15Kim HL, Park HR, Kim CM, Cha YJ, Yun NR, Kim DM — Indicators of severe prognosis of scrub typhus: prognostic factors of scrub typhus severity. BMC Infect Dis 2019; 19(1): 283.
16Griffith M, Peter JV, Karthik G, Ramakrishna K, Prakash JA, Kalki RC, et al — Profile of organ dysfunction and predictors of mortality in severe scrub typhus infection requiring intensive care admission. Indian J Crit Care Med 2014; 18(8): 497-502. doi: 10.4103/ 0972-5229.138145.
17Patil ST, Virupaksha, KL, Kavyashree NG — A study of clinical manifestations and complications of dengue fever in a medical college hospital. Int J Med Res Rev 2019; 7(3): 224-30. Kamath PA, et al. A Clinical and Laboratory Scoring Model for Early Differentiation of Dengue and Scrub Typhus Infection.
If you want to send your queries and receive the response on any subject from JIMA, please use the E-mail or Mobile facility.
Know Your JIMA
Website:https://onlinejima.com www.ejima.in For Reception:Mobile : +919477493033 For Editorial :jima1930@rediffmail.com Mobile : +919477493027 For Circulation :jimacir@gmail.com Mobile : +919477493037 For Marketing:jimamkt@gmail.com Mobile : +919477493036 For Accounts:journalaccts@gmail.com Mobile : +919432211112 For Guideline:https://onlinejima.com
Suparno Pal1, Goutam Sarkar2, Reena Ray Ghosh3
Abstract
Background : This study is done to determine the occurrence of Candidemia among the neonatal patients during 3 years of observation alongwith to analyze the trend in species distribution and to examine in vitro susceptibility to common antifungal drugs.
Materials and Methods : A retrospective review of 2312 blood samples collected from the neonates admitted in Neonatal Intensive Care Unit and Sick Newborn Care Unit in 2019, 2020, 2021 and 2022 were done. Neo-nates who had a positive blood culture for fungal element, were enrolled. Incidence of albicans and non-albicans candidemia were evaluated. Drug sensitivity test was employed to determine the sensitivity of Voriconazole, Itraconazole, Fluconazole and Amphotericin B.
Results : Out of blood samples collected from 2312 neonates with suspected Blood stream infection, 568 (24.6%) samples were detected with blood stream infection. Among which 89 samples were identified as fungal isolates and out of those samples candidemia afflicted 83 samples. Among the positive isolates predominant isolate was Candida albicans 47.0% (39/83) followed by Candida tropicalis 26.5% (22/83), Candida glabrata 13.3% (11/83), Candida parapsilosis 7.2% (6/83) and Candida guillermondii 6.0% (5/83). Majority of candidemia were due to Non-albicans Candida ie, 53.0% of total positive cases. Among the Low Birth Weight (LBW) babies majority were due to C albicans. Susceptibility testing revealed that 92.8% of the retrieved Candida isolates were sensitive to voriconazole, 48.2% to Fluconazole while only 31.3% to Itraconazole and 26.5% to Amphotericin B Albicans candida showed comparatively higher resistance to Fluconazole (58.8% against 45.4%) & Itraconazole (71.8% against 65.9%); whereas Non-albicans Candida showed comparatively higher resistance to Voriconazole (9.1% against 5.1%) and Amphotericin B (88.6% against 56.4%).
Conclusion : Candida spp are assuming an increasing role in nosocomial infections in neonates. The World-wide progressive shift towards Non-albicans Candidemia and increasing resistant pattern to many regularly used antifungals necessitates regular surveillance and monitoring of laboratory data.
Key words : Neonatal Candidemia, Low Birth Weight, Albicans Candidemia, Non-albicans Candidemia.
Invasive candidiasis in neonates is a serious and common cause of late onset sepsis and has a high mortality (25 to 35%) 1. The incidence of such fungal infections has increased 11 fold over the past 15 years. Candida species are the 3rd most frequent organism (after coagulase negative Staph and Staph aureus) isolated in late onset sepsis in Very Low Birth Weight (VLBW) infants (ie, <1,500 g). Preterm infants are predisposed to Candida infections because of immaturity of their immune system and invasive interventions. Transmission of Candida may be vertical (from maternal vaginal infection) or nosocomial. Colonization of health workers is as high as 30%1. Initial site of colonization is usually the gastrointestinal tract. Risk factors for candidiasis include: low birth weight
1MD, Technical Officer, Department of SPSRC, Swasthya Bhawan, Kolkata, West Bengal 700091 and Corresponding Author
2MD, Technical Officer, Department of Microbiology, Swasthya Bhawan, Kolkata, West Bengal 700091
3MD, Professor & Head, Department of Microbiology, Diamond Harbour Government Medical College & Hospital, Diamond Harbour, South 24 Parganas 743331
Received on : 02/05/2024
Accepted on : 24/06/2024
Editor's Comment :
!
! ! The study gives insight into the occurrence of Candidaemia among the neonatal patients and their susceptibility to common antifungal drugs, isolated from blood samples collected in a tertiary care hospital.
!
! ! Overall, majority of candidemia were due to non-albicans Candida, although Candida albicans is the major single species isolated as causative agent, but among the low birth weight babies Candida albicans isolates are dominated than non-albicans isolates.
!
! ! ! ! It is also observed from the study that both albicans and nonalbicans isolates show moderate to high levels of resistance to different commonly used antifungals.
(<1,500 g); use of broad spectrum and/or multiple antibiotics; central venous catheters; parenteral alimentation and intravenous fat emulsion; colonization with Candida and/or previous episode of mucocutaneous candidiasis; prolonged urinary catheterization. Although initial reports indicated most cases were due to Candida albicans, more recent studies show emergence on nonalbicans species including C parapsilosis, C glabrata and C tropicalis. Immunologic immaturity and altered cutaneous barriers play some role in the vulnerability of neonates to nosocomial infections. The better prognosis of the patient is associated with the early diagnosis and
How to cite this article : Neonatal Candidaemia — A Retrospective, Observational Study with Comparison between Albicans and Non-albicans Candida among Low Birth Weight and Normal Birth Weight Babies. Pal S, Sarkar G, Ray Ghosh R. J Indian Med Assoc 2026; 124(1): 35-9.
fast treatment. The current antifungal agents that are available to treat fungemia among newborns and children are based on clinical trials in adults, since there are few comparative studies of antifungal agents in infants. The most commonly used drugs for the treatment of invasive fungal infections in neonates are classified in four different classes: polyene, azoles, analogs of pyrimidines and echinocandins. Estimates suggest that >1.4 million neonatal deaths worldwide annually are due to invasive infections2,3. The incidence of bloodstream infections due to Candida species in the overall population ranges from 1.7 to 10 episodes per 1,00,000 inhabitants. An estimated 33–55% of all episodes of Candidemia occur in intensive care units and are associated with mortality rates ranging from 5 to 71%3. In the NICU in the 1990s, the overall incidence of Candidemia increased because of the increased survival and intensive care of extremely preterm infants. During that time period, the proportion of candidemia decreased because of C albicans, whereas increased because of C. parapsilosis4,5. Although Blood Stream Infection (BSI) due to Candida species (spp) in the Neonatal Intensive Care Unit (NICU) is less frequent than that due to Gram-positive or Gram-negative bacteria, it has higher morbidity and mortality rates. Risk factors for neonatal Candidemia include prematurity, use of central venous lines, endotracheal tubes, parenteral nutrition, broad-spectrum antibiotic administration (especially third-generation cephalosporins), prolonged hospitalization, abdominal surgery, exposure to H2 blockers, and Candida colonization. Although Candida albicans is the most prevalent yeast pathogen, BSIs caused by Candida non-albicans, particularly Candida parapsilosis complex and Candida glabrata complex, have increased in recent years. India contributes to one-fifth of global live births and more than a quarter of neonatal deaths. About 0.75 million neonates die every year in India, the highest for any country in the world6. Neonatal sepsis is the second leading cause of death in this population in India and is responsible for almost a quarter of total neonatal deaths 7. Candida parapsilosis and Candida tropicalis are other species getting notorious in Neonatal Intensive Care Unit (NICU) outbreaks. The signs and symptoms are nonspecific and include temperature instability, refusal of feeds, respiratory distress, abdominal distension, apnea, lethargy, bradycardia, decreased perfusion, or seizures. Systemic Candidiasis lead more frequently to end-organ damage than other newborn infections and can involve kidneys, brain, lungs, eyes, liver spleen, bones and joints8
Purpose of the Study :
This study aimed to determine the occurrence of Candidaemia in the NICU of a Tertiary Care Hospital in West Bengal during 4 years of observation; to analyse the trend in species distribution; and to examine in vitro susceptibility to common antifungal drugs.
A retrospective review of 2312 blood samples collected from the neonates with suspected blood stream infection admitted in Neonatal Intensive Care Unit and Sick Newborn Care Unit in 2019, 2020, 2021 and 2022were done. Blood samples were collected into Glucose and Bile broths, which were incubated at 37°C for 7 days. Subcultures were made on blood and MacConkey's agar. Candida spp. isolated were confirmed by: (a) Germ tube production, (b) growth on cornmeal agar (Hi-Media), (c) pigmentation on Hi-Chrome Candida differential agar (HiMedia), (d) sugar assimilation tests as per standard techniques. Candidemia was diagnosed by isolation of Candida species from at least one positive blood culture containing pure growth of Candida species with supportive clinical features. Neonates who had a positive blood culture for Candida species, were enrolled. Incidence of Albicans and Non-albicans Candidemia were evaluated. Drug Sensitivity Test was employed to determine the sensitivity of Voriconazole, Itraconazole, Fluconazole and Amphotericin B on Muellar Hilton agar with Methylene blue following the CLSI guidelines.
Out of blood samples collected from 2312 neonates with suspected Blood stream infection, 568 (24.6%) samples were detected with Blood stream infection. Among which 89 samples were identified as fungal isolates and out of those samples 83 ie, 93.2% samples were detected as Candida isolates. Among the Candida isolates majority were belong to Candida albicans (39/89, 43.9%) followed by Candida tropicalis (22/89, 24.7%), Candida glabrata (11/89, 12.4%), Candida parapsilosis (6/89, 6.7%) and Candida guillermondii (5/89, 5.6%).
Among the positive Candida isolates Share of Candida albicans was 47.0% (39/83) followed by Candida tropical is 26.5% (22/83), Candida glabrata13.3% (11/83), Candida parapsilosis 7.2% (6/83) and Candida guillermondii 6.0% (5/83).
Majority of candidaemia were due to non-albicans Candida ie, 49.4% of total isolates and 52.8% of total positive isolates, although largest share among all positive isolates were belong to Candida albicans ie, 47.0% (39/ 83)(Tables 1A & 1B).
Among the samples,59.6% (53/89)were collected from male patient and 40.4% (36/89)from female patients. Male: female ratio was 1.5:1. Among which 50% of Candida albicans and Candida glabrata isolates, 100% Candida parapsilosis isolates and 66.7% Candida tropicalis isolates belong to blood sample collected from male babies; 100% of Candida guillermondii isolates were detected from the blood sample collected from female babies (Table 2).
Pal S, et al. Neonatal Candidaemia — A Retrospective, Observational Study with Comparison between Albicans and Non-albicans Candida.
Table 1A — Distribution of isolates among the samples
Name of organismNumber of isolateProportion
Candida albicans3943.8%
Candida glabrata114412.4%49.4%
Candida guillermondii5
Candida parapsilosis6
Candida tropicalis2224.7% NG66.7%
Grand Total89100.00%
Table 1B — Distribution of isolates among the positive samples
Name of organismNumber of isolateProportion
Candida albicans3947.0%
Candida glabrata114413.3%53.0%
Candida guillermondii5 6.0%
Candida parapsilosis6 7.2%
Candida tropicalis2226.5%
Grand Total83100.00%
Table 2 — Distribution of sex among individual isolates
Name of organismProportion amongProportionTotal number female babyamong male babyof isolates
Candida albicans50.0%50.0%39
Candida glabrata 50.0%50.0%11
Candida guillermondii100.0% 0.0%5
Candida parapsilosis 0.0%100.0%6
Candida tropicalis33.3%66.7%22 NG33.3%66.7%6
Among the positive isolates 30.1% (25/83) belong to low birth weight babies ie, birth weight <2.5 kg, among which majority were isolated as Candida albicans (22/25, 88.0%) isolates and rests are Candida tropicalis (3/25, 12.0%) isolates. Among the babies with birth weight > 2.5 kg ie, 69.9% of total isolates, 29.3% (17/58) isolates belong to Candida albicans, 32.8% (19/58) Candida tropicalis, 19.0% (11/58) Candida glabrata, 10.3% (6/58) Candida parapsilosis and 8.6% (5/58) belong to Candida guillermondii (Table 3).
In 37 out of 39 isolates (94.9%), which were later identified as Candida albicans, were germ tube positive. In 2 other isolates, which were later identified as Candida tropicalis, were also germ tube positive. Other isolates were germ tube test negative (Table 4).
Drug susceptibility testing revealed that 7.2% (6/83) of all the retrieved Candida isolates were resistant to voriconazole, 51.8% (43/83) resistant to Fluconazole,
Table 3 — Isolates prevalence according to birth weight (among the positive isolates)
Birth weight< 2.5 kg> 2.5 kgGrand Total
Candida albicans2288.0%17 29.3%39
Candida glabrata1119.0%11
Candida guillermondii5 8.6%5
Candida parapsilosis610.3%6
Candida tropicalis312.0%19 32.8%22
Grand Total25(30.1%)58(69.9%)83
Table 4 — Germ tube test positivity among positive isolates
Name of organismsGerm Tube TestGrand Total -+
Candida albicans23739
Candida glabrata711
Candida guillermondii35
Candida parapsilosis46
Candida tropicalis20222
Table 5 — Resistant pattern of all isolates
Name of drugs ResistantSusceptible Grand Total
Voriconazole7.2% (6)92.8% (77)83
Fluconazole51.8% (43)48.2% (40)83
Itraconazole68.7% (57)31.3% (26)83
Amphotericin B73.5% (61)26.5% (22)83
68.7% (57/83) resistant to Itraconazole and 73.5% (61/ 83) resistant to Amphotericin B (Table 5).
Among the individual isolates, 5.1% (2/39) Candida albicans isolates are resistant to Voriconazole, 58.8% (23/ 39) resistant to Fluconazole 71.8% (28/39) resistant to Itraconazole and 56.4% (22/39) resistant to Amphotericin B. None of the Candida glabrata isolates resistant to voriconazole, 54.4% (6/11) resistant to Fluconazole, 45.4% (5/11) resistant to Itraconazole and 81.2% (9/11) were resistant to Amphotericin B. All Candida guillermondi isolates was resistant to itra-conazole and amphotericin B, 40.0% (2/5) resistant to voriconazole and 60.0% (3/5) resistant to Fluconazole. Isolates diagnosed with Candida parapsilosis 83.3% (5/6) were resistant to Fluconazole and itraconazole, none was resistant to voriconazole & all were resistant to Amphotericin B. 9.1% (2/22) Candida tropicalis isolates were resistant to Voriconazole, 27.3% (6/22) to Fluconazole, 63.6% (14/22) to Itraconazole and 86.4% (19/22) resistant to Amphotericin B (Table 6).
Table 6 — Resistance pattern of different isolates with respect to available antifungals Name
Pal S, et al. Neonatal Candidaemia — A Retrospective, Observational Study with Comparison between Albicans and Non-albicans Candida.
On analysis of the resistance pattern of Albicans and Nonalbicans Candida, it has shown that Albicans Candida are comparatively more resistance to Fluconazole (58.8% against 45.4%) & Itraconazole (71.8% against 65.9%); whereas Non-albicans Candida are comparatively more resistance to Voriconazole (9.1% against 5.1%) and Amphotericin B (88.6% against 56.4%)(Table 7).
On analysis of the susceptibility of the anti-fungals according to birth weight, it was seen that In LBW, Candida albicans isolates showed higher resistance to Fluconazole (63.6% versus 52.9%) & Amphotericin-B (59.1% versus 52.9%) than normal birth weight babies (Table 8).
Candidemia is a significant cause of morbidity and mortality in neonates admitted in the NICU. Although historically Candida albicans was the most frequently isolated Candida spp. from cases of neonatal septicaemia, recently Non-albicans Candidaemia notably Candida tropicalis, Candida glabrata, Candida parapsilosis have emerged as important pathogens. The isolation rate of neonatal candidaemia varies from place to place. Candidaemia was found to be responsible for (53/334) 15.8% cases of neonatal septicaemia in present study, which is consistent with the observations of Diana M Hassan, et al (32/214) 15%9 and Jain, et al reported that Candidemia accounted for 15.8% of the neonatal Blood stream infections10. Although a higher incidence of 20.4% was reported by Rao, et al11. Male female ratio in our study was 1.5:1, which is consistent with the study by Giuseppina Caggiano in ic2017, where this ratio was 1.6:112
In the present study, majority of candidaemia were due to non-albicans Candida ie, 49.4% of total isolates and 52.8% of total positive isolates; although the major single species isolated as causative agent was Candida albicans (47.2%) and majority of the isolates due to Non-albicans candida. Although among the low birth weight babies Candida albicans isolates are dominated than nonalbicans isolates (88.0% against 12.0%). Jinjian Fu, et al observed 39.6% Candida albicans (19/48) among the isolates found in their study and consistent with our observation13 and MS Srinibas Rao, et al observed growth of 26.92% Candida albicans, in their study14, a lower proportion from our study. Both of the study found majority of isolates as Non-albicans candida, Candida spp. proportion in candidemia may be varied because of geographical variation in different regions.
The most frequent Candida spp. isolated from the blood stream (among the positive isolates) in the present study was Candida albicans (47.0%) followed by Candida tropicalis (26.5%),Candida glabrata (13.3%), Candida parapsilosis (7.2%)and Candida guillermondii (6.0%).
Jinjian Fu, et al observed 39.6% Candida albicans (19/
Table 7 — Comparative resistance pattern of Albicans & Non-albicans Candida
Name of drugsCandida albicansNon-albicansGrand Total (n=39)candida (n=44) (n=83)
Voriconazole5.1% (2)9.1% (4)7.2% (6)
Fluconazole58.8% (23)45.4% (20)51.8% (43)
Itraconazole71.8% (28)65.9% (29)68.7% (57)
Amphotericin B56.4% (22)88.6% (39)73.5% (61)
—
Name of drugsBW <2.5 KgBW >2.5 KgGrand Total (n=22)(n=17) (n=39)
Voriconazole0.0% (0)11.8% (2)5.1% (2)
Fluconazole63.6% (14)52.9% (9)58.8% (23)
Itraconazole68.2% (15)76.5% (13)71.8% (28)
Amphotericin B59.1% (13)52.9% (9)56.4% (22)
48) followed by Candida glabrata at 33.3% (16/48), and Candida tropicalis at 27.1% (13/48)13 . MS Srinibas Rao, et al observed growth of 26.92% Candida albicans, 36.53% Candida tropicalis, 19.23% Candida glabrata, 7.69% Candida parapsilosis and 3.84% Candida guillermondii in their study14
In our study, 92.8% Candida isolates were found to be susceptible to Voriconazole, 48.2% susceptible to Fluconazole, 31.3% susceptible to Itraconazole and only 26.5% susceptible to Amphotericin B. Study done by Hassan DM, et al reported 75% Candida isolates susceptible to Voriconazole, 87.5% to amphotericin B and 81.25% to Fluconazole. In this study, all isolates showed higher sensitivity than our study9.
In any case, the variation in the distribution and susceptibility pattern of Albicans or Non-albicans Candida isolates de-tected in neonatal population admitted in critical care set up may be due to variations in the population studied, pre-dominance of nosocomial pathogens inhabiting in the labour room, operation theatres, NICU or SNCUs, surgical procedures, asepsis maintained during surgical procedure, in house infection control measures taken and infection prevention policies alongwith geographical distribution, resistance patterns of the fungal isolates in question; moreover, contamination due to poor personal hygiene during normal labour or Postprocedural contamination and localized outbreaks may be possible reasons for the differences reported.
In our study, majority of Candida albicans isolates showed sensitivity to Voriconazole (94.9%) followed by Amphotericin B (43.6%), Fluconazole (41.2%) and Itraconazole (28.2%). Among the non-candida isolates, Candida glabrata showed most (100%) sensitivity to Voriconazole and laeast (18.8%) to Amphotericin B. Candida guillermondii isolate found in our study showed resistant to Itraconazole & Amphotericin B and sensitive to
Pal S, et al. Neonatal Candidaemia — A Retrospective, Observational Study with Comparison between Albicans and Non-albicans Candida.
Voriconazole (60.0%) and Fluconazole (40.0%); 9.1% Candida tropicalis isolates showed resistant to Voriconazole & 27.3% to Fluconazole whereas 63.6% & 86.4% isolates showed resistant to Itraconazole & Amphotericin B respectively. Candida parapsilosis isolates showed 100% sensitivity to Voriconazole but major resistant to Fluconazole and Itraconazole (83.3% each) &100% resistant to Amphotericin B Candida isolates showed higher resistant to Fluconazole than non-Candida isolates (58.8% versus 45.4%). Whereas study done by MS Srinibas Rao, et al showed 91% Candida tropicalis isolates, 67.8% Candida parapsilosis isolates & 62.5% Candida glabrata isolates were sensitive to Fluconazole14, and study done by Mamta Lamba, et al revealed Nonalbicans Candida (NAC) showed good sensitivity to Fluconazole as compared to Candida albicans. But, regarding Fluconazole sensitivity of Candida tropicalis (93%), Candida glabrata (67%) and Candida parapsilosis (100%) and 57% in Candida albicans is much higher than our study. The sensitivity to Amphotericin B was 95% among all Candida isolates in contrary to 29% in our study15
Limitations of the present study are mainly related to its retrospective nature with limited follow-up data. Nevertheless, this study shows that Candida spp. plays a significant role in neonatal candidaemia and assuming an increasing role in nosocomial infections in neonates with predisposition to Non-albicans Candidemia. This study also shows increasing resistant pattern to many regularly used antifungals which necessitates regular surveillance and monitoring of laboratory data.
Funding : None.
Conflict of Interest : None.
1Intensive Care Nursery House Staff Manual, UCSF Medical Centre
2Benjamin D, Stoll B, Gants M, Walsh M, Sánchez P, Das A, et al — Neonatal candidiasis: Epidemiology, risk factors and clinical judgment. Paediatrics 2010; 126(4): e865-e873.
3Shane AL, Stoll BJ — Neonatal sepsis: Progress towards improved outcomes. The Journal of Infection 2014; 68(Suppl 1): S24e32.
4Huang Y, Lin R, Chou Y, Kuo C, Yang P, Hsieh W — Candidaemia in special care nurseries: Comparison of albicans and para-psilosis infection. The Journal of Infection 2000; 40: 171.
5Lupetti A, Tavanti A, Davini P, Ghelardi E, Corsini V, Merusi I, et al Horizontal transmission of Candida parapsilosis candidemia in a neonatal intensive care unit. Journal of Clinical Microbiology 2002; 40(7): 2363-9.
6Liu L, Oza S, Hogan D, Perin J, Rudan I, Lawn JE — Global, regional, and national causes of child mortality in 2000-13, with projections to inform post-2015 priorities: An updated systematic analysis. Lancet 2015; 385: 430-40.
7Million Death Study Collaborators, Bassani DG, Kumar R, Awasthi S, Morris SK, Paul VK, et al — Causes of neonatal and child mortality in India: A nationally representative mortality survey. Lancet 2010; 376: 1853-60.
8Rao S, Ali U — Systemic fungal infections in neonates. J Postgrad Med 2005; 51 Suppl 1: S27
9Hassan DM, Yousef RHA, Abu Elhamed WA, Ali AA, Madkour LA — Candidemia in the Neonatal Intensive Care Unit: Insights on Epidemiology and Antifungal Drug Susceptibility Patterns. Arch Pediatr Infect Dis 2019 ; 7(1): e81090. doi: 10.5812/pedinfect.81090
10Jain A, Rawat SK, Rai A— Rising incidence of non-albicans Candida and changing susceptibility pattern of bloodstream Candida isolates in neonates. J Clin Diagn Res 2017; 11(11). doi: 10.7860/ JCDR/2017/29492.10804.
11Rao MS, Surendernath M, Sandeepthi M — Prevalence of neonatal candidemia in a tertiary care institution in Hyderabad, South India. Int J Res Med Sci 2017; 2(3): 1016-9. doi: 10.5455/23206012.ijrms20140858.
12Caggiano G, Lovero G, De Giglio O, Barbuti G, Montagna O, Laforgia N, et al — Candidemia in the Neonatal Intensive Care Unit: A Retrospective, Observational Survey and Analysis of Literature Data. BioMed Research International 2017, Article ID 7901763, 12 pages, 2017. https://doi.org/10.1155/2017/7901763
13Jinjian Fu, Yanling Ding, Yongjiang Jiang, Shengfu Mo, Shaolin Xu, Peixu Q — Persistent candidemia in very low birth weight neonates: risk factors and clinical significance. BMC Infectious Diseases 2018; 18: 558. https://doi.org/10.1186/s12879-018-3487-9
14Srinivas Rao MS, Surendernath M — Prevalence of neonatal candidemia in a tertiary care institution in Hyderabad, South India. Int J Res Med Sci 2014; 2(3): 1016-9. www.msjonline.org pISSN 2320-6071 | eISSN 2320-6012
15Lamba M, Sharma D, Sharma R, Vyas A, Mamoria V — To study the profile of Candida isolates and antifungal susceptibility pattern of neonatal sepsis in a tertiary care hospital of North India. J Matern Fetal Neonatal Med 2021; 34(16): 2655-9. doi: 10.1080/ 14767058.2019.1670799. Epub 2019 Oct 3. PMID: 31581861.
Basanta Manjari Hota1, NS Sai Anusha2
Abstract
Background : Medical termination of pregnancy is an induced abortion in a scientific method before the viability of the conceptus considering the safety of the mother. It is guided by the Medical Termination of Pregnancy Act 1971 with amendments at intervals for better application, the latest being in 2021. With this legalization, the number of terminations of pregnancy, unprotected free sex, and sexually transmitted infections are increasing affecting the reproductive health of the woman.
Material and Methods : The present retrospective cross-sectional study was carried out in Mamata Medical College Hospital, Khammam, Telangana over two years to find the incidence and indications of termination of pregnancy aiming to find the corrective methods to reduce the incidence and improve maternal morbidity and mortality. All the relevant data was collected from the medical records of patients after the Institutional Ethical Committee’s permission. Microsoft Excel - 2021 was used for descriptive statistical analysis.
Results : The incidence of medical termination of pregnancy was 28/1000 deliveries. The majority of women (80.36%) were of the 21-30 years age group. Indication in 66.07% of cases was failed contraception and unwanted pregnancy. The complication was in 01.79%. Tubal sterilization following termination of pregnancy was done in 57.14% of cases.
Conclusion : Illiteracy, unawareness of contraception and reproductive health, and social customs in the region need improvement with better counseling. Improving contraception acceptance not only reduces the incidence of pregnancy termination but also protects the reproductive health of the women.
Key words : Medical Termination of Pregnancy (MTP), Contraception,
Medical Termination of Pregnancy (MTP) is ending the pregnancy before viability of the conceptus in a scientific method considering the safety of the mother and is an induced abortion 1. India is one of the few nations to legalize MTP by formulating the MTP Act of 1971 to promote reproductive health and prevent maternal morbidity and mortality2. It succeeded in reducing the Maternal Mortality Ratio (MMR) by 77% from 1990 to 2016 in contrast to a 43% decline in Global MMR and was appreciated by the World Health Organization (WHO)3 Amendments are made to this Act from time to time with advancements in diagnostic technologies and new and safer procedures and requirements. MTP Amendment Act 2021 is the latest one which allows MTP even beyond 24 weeks of gestation with certain regulations and restricted indications4 The cost of the service is covered by the government for women belonging to economically weaker sections with different packages for specific gestational ages under Ayushman Yojana5. India is the first country to legalize paid leave for abortion and extra leave for complications arising from abortion/MTP6,7. The country has faced 3,90,928 MTPs from April, 2018 – March, 2019
Department of Obstetrics and Gynecology, Mamata Medical College, Khammam, Telangana 507002
1MBBS, DGO, Senior Resident and Corresponding Author
2MS, Senior Resident
Received on : 13/08/2024
Accepted on : 20/03/2025
Editor's Comment :
! ! ! ! ! MTP though a safe procedure is not free of complications.
! ! ! ! ! Finding the causes of high prevalence of medical termination and taking steps to reduce it will improve the women’s health.
! ! ! In addition to the Government schemes, other organizations must work for it and increase awareness among target population.
with different indications and at different gestational ages8 Legalization of MTP allows the woman to adopt it in favor of self, conceptus, and family keeping her safety as the priority. But no procedure is always safe even with the best available precautions and methods.
The average complication of postabortion/MTP in India as found in 2021-2022 was 1.8%9. But it was high in certain regions depending on the status of and approach to abortion facilities. Illegal abortions are still occurring due to privacy, Socio-cultural and religious restrictions, ignorance about free healthcare facilities and legalization, leading to increasing complications. Many MTPs are done for unwanted pregnancies which could have been prevented with adequate contraception. Though legally punishable, many female feticides in the second trimester are still occurring. Unprotected and free sex is increasing the number of MTPs affecting reproductive health and increasing sexually transmitted diseases. Comprehensive reproductive health needs the prioritization of health, safety, and reproductive rights of MTP seekers 10 Considering this, the present study was carried out to find the incidence and indications for MTP in a Tertiary Care
How to cite this article : Clinical Analysis of Medical Termination of Pregnancy in a Tertiary Care Centre : A Step towards Reduction in the Incidence of the Procedure. Hota BM, Anusha NSS. J Indian Med Assoc 2026; 124(1): 40-3.
hospital which caters basically to a Rural population, and to suggest the possible steps to reduce the rate of MTP without affecting women’s health.
This observational retrospective cross-sectional study was conducted in a Medical College Hospital in South India including women admitted for MTP. Women taking medical methods of abortions on a daycare basis were excluded from the study as patient compliance is very poor for follow-up visits in this region. The study period spread over two years, from January, 2022 to December, 2023. With permission from the Institutional Ethical Committee, a detailed Socio-demographic; past medical, surgical, and obstetrics history was taken from the MTP register of the hospital without revealing the patient’s identity. Gestational age, indication, the method used, post-MTP contraception, and any complication in present MTP were noted. All the data was compiled and analyzed by simple descriptive statistics, frequency table, and percentage variables for different categories. Microsoft Excel Version 2021 was used as a tool for the descriptive data analysis. The study was critically discussed and compared with similar studies. A conclusion was drawn for present deficiencies leading to high incidences of MTP and corrective measures were suggested.
As the hospital is located in a district headquarters, the majority of women were from Rural areas, from illiterate to secondary school educated, housewives or daily laborers, and low Socio-economic class. There were 112 MTPs in the study period constituting 28/1000 deliveries. Actual incidence was higher, as patients with the medical method of MTP without admission were not included in the study. The age range was 17-38 years and the majority of cases were between 21-30 years of age (80.36%). There was no case beyond 38 years of age as the social trend in the region is early marriage and completion of family followed by tubal sterilization. The age distribution of patients is presented in Table 1.
Rural belonging, poverty, lack of education, and awareness about reproductive health and family planning are prevalent among these patients. The sociodemographic profile of cases is presented in Table 2.
Indication of MTP was failure of contraception and unwanted pregnancy in 66.07% which on further study was found to be a natural method of contraception, in particular abstinence, has a maximum failure rate and not a practical method of contraception for young sexually active women. Hence, for all practical purposes, unwanted pregnancy was the indication in all these cases. One case was for failed tubectomy and reported in the second trimester as she was ignorant about method failure. Second trimester MTP was more than early first-trimester gestation for ignorance of risk, illegal pregnancy in teens, fear of losing their wage, and fetal anomaly. Arranging money for expenditure, and privacy was the reason in many second-trimester MTP cases for their ignorance about free service and privacy in Government facilities. Medical method of MTP was done in 64.29% of cases. The major complication of excessive bleeding was found in two cases needing blood transfusion. One of these was a case of retained adherent placenta in the second
trimester MTP which was managed with Injection Methotrexate. The majority of women were parous with an unwanted pregnancy. Post-MTP tubectomy was opted by 57.14% of them. In spite of best possible counseling, 30.36% of cases did not adopt any contraception for fear and the decision was taken by family members. Details of MTP and post-MTP contraception are shown in Table3.
The number of one previous MTP was in 16 (14.29%) cases, two previous MTPs in 04 cases (03.57%), and four previous MTPs in 04 cases (03.57%) in this study.
Access to contraception and access to MTP are two main determinants of reproductive health and family planning11 The Government is making good schemes for both. But what is lagging is education and awareness of the facilities. The present study found 112 cases over two years period, as the medical method of MTP without hospital admission was not included in the study population. The rate of MTP in admitted cases was 28/1000 deliveries compared to 27.93/1000 deliveries by Rajshree D Katke12 and 27.75/ 1000 live births by Ke Manga Reddy13 . Sharma B, et al found it to be 96/1000 live births in their study over three years14 Age group of 21-30 years constituted the major (80.36%) MTP seekers in the present study as compared to 71.29% by Yadav Anita, et al 15, 81.63% by Ke Manga Reddy, et al13 Jain Mahima, et al reported 55.7% of women in 20-30 years grop16 Majority of women in the study were from Rural background, illiterate, and daily wagers. Ignorance of availability and methods of contraception, access to information on reproductive and sexual health, and economic scarcity were the main causes behind this17. In the present study, 80.36% of the study population were from Rural backgrounds compared to 70.40% as found by Yadav Anita, et al in their study.15 There were 73.21% of women were illiterate in the present study as compared to 72.30% of women being illiterate or had primary school education as reported by R Maheswari Uma, et al 18. Failed contraception or no contraception for all practical purposes and unwanted pregnancy were the main indication (66.07%) of MTP in this study which was found to be 83.20% by Sharma Bhawna, et al14 and 80.60% by Sharma R, et al19 . The present study had 57.14% cases of MTP in first trimester compared to the report by R Maheswari U, et al18 as 95.10% as they included the cases without admission. Many of the early first-trimester MTP cases in this study were managed by medical methods on a daycare basis and excluded from this study as per the protocol. Medical method was adopted in 64.29% of cases, whereas combined medical and surgical methods of MTP were carried out in 87.50% of cases, which included both surgical methods as initial
treatment to start with and failed medical method cases with retained product of conception. Complications of excessive hemorrhage needing blood transfusion were present in two cases (01.79%) out of which one had retained adherent placenta compared to an overall complication of 1.80% in India 9 . Post-MTP tubal sterilization was accepted in 57.14% of cases as they all had completed their family, which was 58.33% as reported by Yadav A15, 55.9% by Jain M16 and 58% by Patel R20 Despite intensive counseling 30.36% did not accept any contraception compared to 20.70% and 23% as reported by Jain Mahima, et al 16 and Ke Manga Reddy 13 respectively.
Unwanted pregnancy due to lack of knowledge and access to contraception is the main reason behind the high incidence of abortion in the region. As per the World Health Organization, six out of ten unwanted pregnancies are terminated by abortion. Restriction on access to abortion does not reduce the rate but increases the incidence of unsafe abortion affecting maternal morbidity and mortality21 . The real requirement is the restriction of the need for abortion. Therefore, contraception is the best answer to it. Education, awareness, and accessibility to contraception will reduce the rate of MTP.
The purpose of the legalization of MTP is to prevent illegal abortion, protect reproductive health, and improve maternal morbidity and mortality. Awareness, approach, and acceptability of contraception, and quality MTP services are the keys to the success of the scheme. Education makes a person aware and it is lacking in this region. Improvement of Socio-economic conditions and cultural taboos of early marriage have to be abolished. Counseling of contraception, availability and free provision in public health care facilities, maintenance of privacy, and sex education are important aspects to reduce the incidence of unwanted pregnancies and MTP should start at the grass root level by health workers and NGOs as the woman consults the Tertiary Care Center for further management. All women during antenatal care must be counseled for contraception. Health camps should be arranged in this region at appropriate times of the day when women are free of work to educate them about the service and care should be taken to remove the fear of complication from contraception.
Acknowledgment : Nil.
Source of Support : Nil.
Conflict of Interest : There is no conflict of interest.
Financial disclosure : None.
1Van Look PF, Bygdeman M — Medical approaches to termination of early pregnancy. Bull World Health Organ 1989; 67(5): 567-75. PMID: 2692870; PMCID: PMC2491296.
2Medical Termination of Pregnancy ACT, 1971. Act No. 34 of 1971. Ministry of Health and Family Welfare Government of India.10 Aug 1971. Available from: https://main.mohfw.gov.in/actsrules-and-standards-health-sector/acts/mtp-act-1971
3Pai SN, Chandra KS — Medical Termination of Pregnancy Act of India: Treading the Path between Practical and Ethical Reproductive Justice. Indian J Community Med 2023; 48(4): 510-513. doi: 10.4103/ijcm.ijcm_540_22. Epub 2023 Jul 14. PMID: 37662131; PMCID: PMC10470576.
4Medical Termination of Pregnancy (Amendment) Act,2021. No.8 of 21. MINISTRY OF LAW AND JUSTICE (Legislative Department). Government of India.25 March 2021. Available from: https:// prsindia.org/files/bills_acts/acts_parliament/2021/ MedicalTermination of Pregnancy AmendmentAct2021.pdf.
5AYUSHMAN BHARAT Comprehensive Primary Health Care through Health and Wellness Centers Operational Guidelines. Ministry of Health and Family Welfare, Government of India.2018;pp11-20. Available from: http s://www .nhm.gov.in>letter> OperationalGuidelinesforPHC.pdf.
6Maternity Benefit Act,1961. Section 9. No.53 of 1961. Government of India. 12 December 1961. Available from: https://labour.gov.in/ sites/default/files/the_maternity_benefit_act_1961_0.pdf
7Maternity Benefit Act, 1961. Section 10. No. 53 OF 1961 Government of India. 12 December 1961. Available from: https:/ india kanoon. Org > doc.
8Sharma S, Jaiswal AK, Singh RK, Kumar P, Mehra S — Differential access to facilities for medical termination of pregnancy and delivery in India: A secondary analysis. Clinical Epidemiology and Global Health 2021; 12: 100825. doi: http://doi.org/10. 1016/j. cegh.2021.100825.
9Reproductive, Maternal, Newborn, Child and Adolescent Health (RMNCH+A).HMIS 2020-2021 & 2021-22(An Analytical Report)2021 & 2021-22, HMIS-Health Management Information System. Government of India, Ministry of Health & Family Welfare Statistics Division.2022; pp16-27. Available from: https://www.hmis.mohfw.gov.in.
10Shannon C, Brothers LP, Philip NM, Winikoff B — Ectopic pregnancy and medical abortion. Obstet Gynecol 2004; 104(1): 161-7. doi: http://doi.org/10.1097/01.AOG.0000130839.61098.12. PMID: 15229016.
11Leichombam R, Bawiskar D — Exploring the Safety and Efficacy of Medical Termination of Pregnancy: A Comprehensive Review. Cureus 2023; 15(10): e46444. doi: http://doi.org/10.7759/ cureus.46444. PMID: 37927767; PMCID: PMC10622735.
12Katke RD, Prabhudesai AA — Socio-epidemiological factors of medical termination of pregnancy: an overview in a tertiary care institute. Int J Res Med Sci 2016; 4: 1061-4. doi: http://dx.doi.org/ 10.18203/2320-1770.ijrcog20160858.
13Ke Manga Reddy, Lakshmi Priyanka K, Kanya Kumari D, Betha K — Prevalence and determinants of medical termination of pregnancy in a rural tertiary teaching hospital. European Journal of Molecular & Clinical Medicine 2022; 9(2): 2601-207.
14Sharma B, Saxena N, Sharma A, Arora N — Epidemiology of MTP in a tertiary care center over a period of 3 years. Int J Reprod Contracept Obstet Gynecol 2017; 6: 4918-22. doi: http://dx.doi.org/ 10.18203/2320-1770.ijrcog20175000.
15Yadav A, Sharma C, Mehrotra M, Saha MK, Yougin S, Kaviya Lakshmi P — Profile of abortion seekers and decision makers of post abortion contraceptive acceptability in Andaman and Nicobar Islands, India. Int J Reprod Contracept Obstet Gynecol 2016; 5(10): 3491-95. doi: http://dx.doi.org/10.18203/2320-1770.ijrcog20163429.
16Jain M — A survey of indications of MTP and concurrent contraceptive practices in a tertiary care institute. Int J Reprod Contracept Obstet Gynecol 2014; 3(4): 1073-5. doi: https://doi.org/10.5455/ 2320-1770.ijrcog20141238.
17Ayamolowo LB, Ayamolowo SJ, Adelakun DO, Adesoji BA — Factors influencing unintended pregnancy and abortion among unmarried young people in Nigeria: a scoping review. BMC Public Health 2024; 24: 1494. doi: https://doi.org/10.1186/s12889-024-19005-8.
18Uma Maheswari R, Jayanthi TP — Abortion seeking behaviour: a study from tertiary care hospital. Int J Community Med Public Health 2017; 4(7): 2303-7. doi: http://dx.doi.org/10.18203/23946040.ijcmph20172648.
19Sharma R, Radhakrishnan G, Mehdiratta A, Gupta G — Awareness, Attitude, and Acceptability for Abortion Law among MTP Seekers at a Tertiary Care Center of East Delhi. J South Asian Feder Obst Gynae 2019; 11(2): 120-5. doi: https:/ /doi.org/10.5005/jp-journals-10006-1676.
20Patel R, Ghosh R — KAP study of contraception in clients undergoing MTP and sterilization in Gujarat, India. Int J Reprod Contracept Obstet Gynecol 2017; 6(6): 2503-2506.doi: http://dx.doi.org/ 10.18203/2320-1770.ijrcog20172340.
21Bearak J, Popinchalk A, Ganatra B, Moller AB, Tunçalp Ö, Beavin C, et al — Unintended pregnancy and abortion by income, region, and the legal status of abortion: estimates from a comprehensive model for 1990-2019. Lancet Glob Health 2020; 8(9): e1152-e1161. doi: https://doi.org/ 10.1016/S2214-109X(20)30315-6. Epub 2020 Jul 22. PMID: 32710833.1
Sumanta Chakraborty1, Indrajit Saha2
Abstract
Background : Aging presents significant challenges for older adults, increasing their vulnerability to malnutrition due to various factors. Poor nutritional status is often associated with reduced functional ability, which can lead to higher rates of illness and mortality. Early detection of malnutrition risk can improve their autonomy and overall health, ultimately enhancing their Quality of Life.
Aims and Objectives : This study aims to explore the relationship between nutritional status and measures of functional ability and morbidities among the elderly.
Materials and Methods : A cross-sectional study was performed involving 210 elderly individuals from Bankura district in West Bengal, employing a 30-cluster sampling method. Three standardized tools were used: the Mini-Nutritional Assessment – Short Form (MNA-SF), the Katz Index of Independence in Activities of Daily Living (Katz ADL), and the Cumulative Illness Rating ScaleGeriatric (CIRS-G). Data analysis included Chi-square tests, independent t-tests, and one-way ANOVA for mean comparisons.
Results : The study examined 210 elderly individuals, with a mean age of 72.1±6.6 years. Among them, 18.6% were classified as malnourished, while 50% were identified as being at risk of malnutrition. There was a significant association between MNASF Indicators of Nutritional Status with Katz ADL Categories and CIRS-G Indicators of Morbidity.
Conclusion : The nutritional status of the elderly population significantly influences their functional capabilities and morbidity profiles. Considering this fact, conducting regular nutritional risk assessments in healthcare settings can help identify at-risk individuals early, allowing for prompt interventions. Regular screening and cost-effective interventions may combat the public health challenge of geriatric malnutrition.
Key words : Old Age, Nutritional Status, Functional Capacity, Morbidity, India, Public Health.
The progress in technology, expanded educational access, the empowerment of women, and economic development has all played a significant role in demographic transition. This transition is marked by a concurrent decline in both birth and death rates, leading to elevated dependency ratios. Such transformations are an inevitable result of demographic transition, which every country must confront through development and effective governance.
On a global scale, the population of older adults, defined as individuals aged 60 and above, is rising in nearly every nation, a trend that is anticipated to continue. In 2023, there were 1.1 billion older adults population worldwide, constituting 13% of the global population. By 2030, this number is expected to surpass 1.4 billion, with a considerable proportion living in low-income countries1. In India, the elderly population was 10.1% in 2021 and is projected to reach 13.1% by 2031. This figure is expected to exceed 300 million by 2050, representing 20% of the total population2,3
Elderly individuals are particularly vulnerable to malnutrition, facing numerous challenges in meeting their
1MBBS, MD, Assistant Professor, Department of Community Medicine, Diamond Harbour Government Medical College & Hospital, Diamond Harbour, South 24 Parganas 743331 and Corresponding Author
2MD, Director of Medical Education, Department of Community Medicine, Swasthya Bhawan, Kolkata, West Bengal 700091
Received on : 13/06/2025
Accepted on : 01/08/2025
Editor's Comment :
!
!
! ! ! Nutrition underpins healthy aging : Poor nutritional status in community-dwelling older adults is closely linked to reduced functional capacity and a higher burden of chronic morbidities, highlighting nutrition as a core determinant of geriatric health.
!
!
! ! ! Function is the missing connector : Functional capacity acts as a critical bridge between nutrition and morbidity—malnutrition accelerates functional decline, which in turn worsens disease outcomes and dependence.
! ! ! Integrated community action is essential : Routine nutritional screening, functional assessment, and morbidity management should be combined at the primary-care and community level to prevent disability and improve Quality of Life among the elderly in Eastern India.
nutritional needs4. Their dietary requirements can be ambiguous, as aging often results in decreased lean body mass and basal metabolic rate, which diminishes energy needs per kilogram of body weight. While some nutrient needs may decline, others may increase with age, underscoring the necessity to re-evaluate current daily nutrient guidelines for this demographic5. Older adults are at heightened risk of malnutrition due to various factors, including diminished appetite, inadequate intake of vital nutrients, impaired nutrient absorption and metabolism, functional disabilities, polypharmacy, and chronic health conditions associated with age-related physiological and psychological changes6,7. The aging process contributes to a decline in organ function, increasing susceptibility to chronic conditions such as Hypertension and Diabetes 8
How to cite this article : Assessment of the Missing Link between Nutritional Status, Functional Capacity and Morbidity Profile in the Communitydwelling Geriatric Population of a District of Eastern India. Chakraborty S, Saha I. J Indian Med Assoc 2026; 124(1): 44-8.
While healthcare improvements may extend life, challenges like poverty and insufficient elderly support jeopardize their health, particularly in India, where families often provide critical long-term care. This situation leads to underreported malnutrition, highlighting the need to explore its relationship with functional abilities and health outcomes among older adults in the community, as research in this area remains scarce.
A descriptive epidemiological study with a cross-sectional design was conducted in the Bankura district of West Bengal, located in the Eastern region of India. This district, positioned in the Southern part of West Bengal, comprises three subdivisions and 22 Community Development Blocks, with a portion falling under the jurisdiction of Jungal Mahal. Bankura is primarily a rural district, with 91.67% of its population residing in rural areas and it has a higher proportion of Scheduled Castes (32.7%) and Scheduled Tribes (10.3%) compared to the state average of West Bengal, according to the 2011 Census9,10.
The research was carried out over a period of six months, from February, 2021 to August, 2021. The participants in the study were elderly individuals aged over 60 years who were permanent residents of the designated area. Individuals who were unwilling or unavailable to participate were excluded from the study. The sample size was determined using a single proportion formula appropriate for cross-sectional studies, taking into account various factors such as the desired confidence level, acceptable margin of error, relative precision (considering a finite population), the design effect of the sampling method, and the expected prevalence of malnutrition among the elderly. There was a community-based study reporting the prevalence of malnutrition among the elderly in Bankura. Therefore, that study conducted in Bankura among geriatric residents, published in 2020, and was referenced, which indicated that 81.09% of the elderly population experienced malnutrition or were at risk of it11. Consequently, the anticipated prevalence of malnutrition in the study population was set at 81.09%. With a confidence level of 95% and a relative precision of 10%, the sample size was calculated using the specified formula.
n = Z2 (1 -α/2) P (1 - P)/ e2 where:
•Z (1 -α /2) = 1.96 (at 95% confidence interval)
•P = anticipated proportion of malnutrition (81.09%)
•e = relative precision (10% of 81.09)
Thus, the calculated sample size became n = (1.96)2 x 0.8109 x 0.1891 / (0.10 X 0.8109)2 = 90.
Considering 10% non-responders, the sample size was 99. As cluster sampling was done, a design effect of 2 was taken. Thus, sample size came out to be 198.
Bankura was chosen through simple random sampling
from all districts in West Bengal. The study subjects were selected using a cluster sampling technique, where each village in the Bankura district was treated as a ‘cluster’. Initially, a comprehensive list of all villages was compiled, including their respective populations and cumulative totals based on the 2011 Census data. From this list, 30 clusters (villages) were identified according to the principles of cluster sampling. In the subsequent stage, an equal number of study subjects were selected from each chosen cluster, resulting in a cluster size of approximately 7 individuals (198/30). Within each identified cluster, a list of all geriatric residents was created with assistance from local authorities. Seven geriatric individuals were then randomly selected without replacement from this list in each cluster. Their addresses were previously obtained from local health workers and interviews were conducted at their homes at mutually agreed times. In cases where any of the selected seven individuals did not respond, additional participants were randomly chosen from the same sampling frame to ensure the cluster size remained at seven. Consequently, data was collected from a total of 210 study subjects.
Pre-designed pre-tested interview schedule consisting ofBackground characteristics & Socio-demographic characteristics, MNA-SF tool, the Katz Index of Independence in Activities of Daily Living (Katz ADL), the Cumulative Illness Rating Scale-Geriatric (CIRS-G) and any relevant medical records/prescription.
MNA-SF tool is a simple validated screening tool to assess the extent of malnutrition in community settings with specificity (100 %), sensitivity (97.9 %) and diagnostic accuracy (98.7 %) for the diagnosis of malnutrition, mainly in older adults. The internal consistency of the scale is good (Cronbach’s α =0.843)12,13. It has 6 questions with anthropometric measurements like BMI or calf circumference and questions on loss of appetite, weight loss over past 3 months, mobility, acute illnesses, neuropsychological morbidities etc. BMI was calculated by dividing weight (kg) by the square of the participants’ height (m2). Weight was calculated by digital weighing scale and height by non-stretchable elastic measuring tape.
Katz index of activities of daily living in assessing functional status of older people has an internal consistency measured with Cronbach’s alpha of 0.82 and test-retest reliability evaluated with intra-class correlation (ICC) (95% CI) of 0.94 (0.89-0.96) (p<0.001) from a study published in 2023 in Sri Lanka14 .
The CIRS-G evaluates 14 organ systems, scoring from 0 to 56, using a 5-point scale. A score of 0 indicates no issues, while a score of 4 signifies extremely severe problems within that system. Participants who scored 0 were deemed to have no issues, whereas those with scores ranging from 1 to 4 were identified as having illness or impairment in that specific system. The overall CIRS-
G score was divided into tertiles. This scale demonstrates a moderate Cronbach’s alpha of 0.55 for comorbidity, attributed to the independent nature of the component items that represent various organ systems. Cumulative Illness Rating Scale-Geriatric (CIRS-G) showed good divergent validity vis-a-vis functional disability in predicting mortality and hospitalization15.
Interviewing of the study subjects, clinical and anthropometric examinations and reviewing of records like prescriptions, laboratory reports, social security cards were done for the study purpose.
The operational definitions utilized in the index study are as follows:
•Elderly refers to individuals aged 60 years or older16
•Literate denotes the ability to read and write meaningfully in any language.
•Earning is defined as the means of livelihood, excluding any social assistance.
•Socio-economic status is assessed using the modified B.G. Prasad scale (as revised according to AICPI January 2021), categorizing individuals into Upper (Class I & II) and Lower (Class III, IV & V) classes 17 .
The research was conducted following the approval of the Institutional Ethics Committee at Bankura Sammilani Medical College, with permission granted by the Chief Medical Officer of Health in Bankura district. Informed consent was secured from all participants involved in the study. Eligible elderly individuals were interviewed using a pre-designed and pre-tested questionnaire, which was tailored for the study with input from public health experts. Data collection was carried out by the researchers after the questionnaire underwent translation, back-translation, and re-translation with the assistance of language specialists, followed by pre-testing among a convenience sample of 30 individuals visiting the outpatient department of Bankura Sammilani Medical College & Hospital. The individuals who participated in the pre-testing were excluded from the final study sample.
Utilizing the MNA-SF tool scores, the prevalence of malnutrition and the risk of malnutrition were assessed. This assessment categorizes individuals into three groups: normal nutrition (12-14 points), at risk of malnutrition (8-11 points), and malnourished (0-7 points). Individuals identified as at risk of malnutrition may exhibit diminished reserves and heightened risk factors, potentially leading to a transition towards malnourishment. Consequently, we have combined the two categories—those at risk of malnourishment and those classified as malnourished— into a single group for comparative analysis against individuals with normal nutritional status, aiming to elucidate the predictors of malnutrition among the elderly12,13
The Katz Activities of Daily Living (ADL) assessment
measures six essential functions: bathing, dressing, toileting, transferring, continence, and feeding. Each function is assigned a score of 0 for independence or 1 for dependence, resulting in a total score that ranges from 0, indicating complete independence, to 6, indicating complete dependence14
The Cumulative Illness Rating Scale for Geriatrics (CIRSG) evaluates 14 organ systems on a scale from 0 to 56, utilizing a 5-point scale where a score of 0 signifies no issues and a score of 4 indicates extremely severe problems within that system. Participants receiving a score of 0 are considered to have no issues, while those with scores ranging from 1 to 4 are identified as experiencing illness or impairment in the respective organ system15
Data were collected according to a predetermined and validated schedule, ensuring strict confidentiality. The information was input into Microsoft Excel, and all analyses were conducted using IBM’s Statistical Package for the Social Sciences (SPSS), Version 20.0 18 Descriptive statistics were employed to summarize demographic and anthropometric variables, reporting percentages and frequencies for categorical variables, while means and Standard Deviations were provided for continuous variables. The Chi-Square test assessed the association among the MNA-SF, ADL and CIRS-G categories. An independent t-test was utilized to evaluate the differences in MNA-SF scores between dependent and independent participants. One-way ANOVA was applied to compare the means of anthropometric and CIRS-G scores across MNASF categories. A significance level of p values <0.05 was established for all statistical tests.
A total of 210 elderly study subjects were enrolled for the index study. The prevalence of malnutrition in this community based epidemiological study was 18.6% and at risk of malnutrition was 50%.
Socio-demographic characteristics of the study subjects: There were a slight female (55.2%) predominance among our study subjects. Early older adults (60-74 years) and middle older adults (75-84 years) were almost similar in prevalence among our study subjects at 42.8% and 40% respectively. About three-fourth of the study subjects belonged to the lower socio-economic class (74.8%). There was a significant association between age and nutritional status and socio-economic class (p < 0.001), in contrast, gender did not show any significant association with nutritional status. Another noteworthy finding was, there was a progressive decline of proportions of well-nourished elderly individuals with advancement of age (Table1).
Anthropometric details of the study subjects: The mean weight of the participants was 68.1 ± 7.8 kg. BMI was significantly associated with nutritional status (p < 0.001).
Among the malnourished participants, 68.7% had BMI<19 kg/m 2 while about half (49.4%) of well-nourished participants had a BMI >23 kg/m2 (Table 1).
Association of nutritional status with functional capacity: Table 2 displays the association of MNA-SF indicators of nutritional status with Katz ADL categories. About one-third of the participants were totally dependent (28.1%). There was progressive increment of proportions of dependent study subjects across the spectrum of malnutrition with 66.7%, 20.9% and 16.7% of them being malnourished, at risk of malnutrition and well-nourished respectively as per MNS-SF categories. There was a significant association between MNA-SF Indicators of Nutritional Status and Katz ADL Categories (p-value<0.001).
Association of nutritional status with indicators of morbidity: The association of CIRS-G indicators of morbidity with MNA-SF categories is outlined in Table 3. Malnourished participants had a significantly higher mean CIRS-G score (11.4 ± 5.1) than those at risk of malnutrition (9.4 ± 3.9) and well nourished (5.2 ± 2.7) (p<0.001). Nearly half of the malnourished participants (46.5%) belonged to the highest tertile for CIRS-G score while about onetenth of the well-nourished study subjects (11.6%) were in the highest tertile for CIRS-G score. There was significant association between CIRS-G Indicators of Morbidity with MNA-SF Indicators of Nutritional Status.
In the index study, the prevalence of malnutrition in this community based epidemiological study was 18.6% and at risk of malnutrition was 50% ie, about one-fifth and half of the study subjects respectively. This prevalence corresponds with the national estimate (18.3 %) but almost half (18.6% versus 32.2%) from another study in the same district of Eastern India. about half (49.4%) of well-nourished participants had a BMI >23 kg/m2, suggesting that BMI is not a sensitive indicator of malnutrition in the elderly as obesity may be due to an underlying co-morbidity may mask the effects of malnutrition, frailty, and sarcopenia19-20
Table 2 — Association of MNA-SF Indicators of Nutritional Status with Katz ADL Categories
VariableTotalDependentIndependentp-value (n=210)(n = 59)(n = 151)
MNA-SF category, n(%)0.001*
Malnourished39 (18.6) 26 (66.67%)13 (33.33%)
Risk of malnutrition105 (50.0)22 (20.95%)83 (79.05%)
Well nourished66 (31.4)11 (16.67%)55 (83.33%)
*denotes statistical significance
Table 3 — Association of CIRS-G Indicators of Morbidity with MNA-SF Categories
VariableTotalMalnourished At risk ofWellp-value (n = 210)(n = 39) malnutritionnourished (n = 105) (n = 66)
CIRS-G score, n (%)
0.0000000397*
T1 (0–4)73 (34.8)13 (17.81%)28 (38.36%)32 (43.84%)
T2 (5–13)94 (44.8)6 (6.38%)59 (62.77%)29 (30.85%)
T3 (>13)43 (20.4)20 (46.51%)18 (41.86%)5 (11.63%)
*denotes statistical significance
A significant association between MNA-SF Indicators of Nutritional Status and Katz ADL Categories was found in the index study which is in accordance with other studies both in India and abroad 21-24 . The reason for such association may be many-fold but many researchers suggests, that malnutrition may be responsible for muscle atrophy, osteopenia and sarcopenia which in turn may lead to decreased functional mobility and warrants functional disabilities in the elderly populations.
Nearly half of the malnourished participants (46.5%) belonged to the highest tertile for CIRS-G score while about one-tenth of the well-nourished study subjects (11.6%) were in the highest tertile for CIRS-G score. There was significant association between CIRS-G Indicators of Morbidity with MNA-SF Indicators of Nutritional Status which is in accordance with other studies, although the organ system considered in different studies are different but in the index study, morbidities of all organ systems were considered25,26. In this regard, it is pertinent to point that loss of vision, hearing impairment, dysphagia, multimorbidities may all contribute to decreased appetite and reduced food-intake in the elderly contributing to malnourishment in them. The consumption of quality
Table1 — Demographic and Anthropometric Characteristics by MNA-SF Categories
VariableTotal (n = 210)Malnourished (n = 39) At Risk (n = 105)Well Nourished (n = 66)p-value
Gender, n (%) 0.873
Male 94 (44.8%)16 (17.0%)48
Early older adults (60–74 years)78(42.8%)15 (19.2%)17 (21.8%)46 (59.0%)
Middle older adults (75-84 years)96 (40.0%)19 (19.8%)40 (41.7%)37 (38.5%)
Late older adults (85+ years)36 (17.2%)17
BMI category, n (%)
<19 kg/m²32 (15.2%)22 (68.75%)7 (21.88%)3 (9.38%)
19 to <21 kg/m²56 (26.7%)11 (19.64%)37 (66.07%)8 (14.29%)
21 to <23 kg/m²29 (13.9%)3 (10.34%)17 (58.62%)9 (31.03%) >23 kg/m²93 (44.2%)3 (3.23%)44 (47.31%)46 (49.46%)
*denotes statistical significance
Chakraborty S, et al. Assessment of the Missing Link between Nutritional Status, Functional Capacity and Morbidity Profile.
nutrient–dense food, may further be deterred by certain socio-economic correlates like the increased price of foods, limited spending capacity of the elderly dependent population and out of pocket expenditure on health11
In this study, the majority of the elderly were at risk of malnutrition or were malnourished. Indicators of nutritional status were significantly associated with indicators of morbidity profile and categories of functional dependence. Considering the present trend of ageing population and the potential health challenges that may arise thereby, it is advisable to establish routine screening programs in community settings. These programs should assess the elderly for malnutrition risk in a timely manner. By identifying malnutrition risk early, healthcare providers can implement appropriate nutrition interventions. These may include dietary modifications, the provision of supplements, preventing catastrophic health expenditure and promoting food security in the otherwise financially dependent elderly population. Such actions will help ensure adequate nutrient intake, which is essential for maintaining health and improving quality of life. Addressing the unique needs of the elderly through proactive measures allows for the necessary support and care to maintain their health and well-being. However, due to the cross-sectional research survey design employed in this study, we were unable to establish a causal relationship between nutritional status, functional capacity, and morbidity profile. Future research aim a multi-centric study with a larger sample size, a more diverse population, and a longitudinal research design may overcome these limitations.
Credit authorship contribution statement : Chakraborty S : Project administration, Formal analysis, Methodology, Writing – original draft, Saha I.: Conceptualization, Supervision, Writing – review & editing.
Financial Support and Sponsorship : Nil.
Conflicts of Interest : There are no conflicts of interest.
Declaration of Competing Interest : The authors declare that they have no known competing financial interests or personal relationships that could have appeared to influence the work reported in this paper.
Acknowledgement : We acknowledge all the participants who participated in this study.
1World Health Organization. WHO clinical consortium on healthy ageing 2023: meeting report, Geneva, Switzerland, 5-7 December 2023. World Health Organization; 2024 Sep 6.
2Malik C, Khanna S, Jain Y, Jain R — Geriatric population in India: Demography, vulnerabilities, and healthcare challenges. Journal of family medicine and primary care. 2021 Jan 1;10(1):72-6.
3Baruwa A — THE URBAN ELDERLY POPULATION: A Socio-Economic and Demographic Study in Upper Assam. The Write Order Publication; 2024 Jun 6.
4Biswas P, Chakraborty A, Mondal R, Bhattacharya T, Das DK — Nutri-
tional status and family dietary pattern among slum dwelling geriatric population in an area of Burdwan Municipality, West Bengal. IOSR Journal of Dental and Medical Sciences (IOSR-JDMS) 2018; 17: 59-64.
5Volkert D, Beck AM, Cederholm T, Cruz-Jentoft A, Hooper L, Kiesswetter E, et al — ESPEN practical guideline: Clinical nutrition and hydration in geriatrics. Clinical Nutrition 2022; 41(4): 958-89.
6Norman K, Haß U, Pirlich M — Malnutrition in older adults—recent advances and remaining challenges. Nutrients 2021; 13(8): 2764.
7Rodrigues DA, Herdeiro MT, Figueiras A, Coutinho P, Roque F — Elderly and Polypharmacy: Physiological and Cognitive. Frailty in the Elderly: Understanding and Managing Complexity 2021; 31: 73.
8Kopp W — Aging and “age-related” diseases-what is the relation? Aging and disease 2024; 16(3): 1316.
9Chel S — Population growth and Socio-Economic Condition of people: A study from district of Bankura in West Bengal, India. Economy Polity Environment (2583-6390) 2021; 3(2): 1-5.
10Paul S, Das Chatterjee N, Guchhait S — Sptial pattern of population growth and human development: An enquiry in Bankura district of West Bengal (Doctoral dissertation, Vidyasagar University, Midnapore, West Bengal, India).
11Chakraborty S, Banerjee S, Saha I — Prevalence and determinants of geriatric malnutrition among rural populations: A Community based cross-sectional Study in Eastern India. Social Determinants of Health 2020; 6: e30-.
12Rubenstein LZ, Harker JO, Salv‘a A, Guigoz Y, Vellas B — Screening for undernutrition in geriatric practice: Developing the short-form mininutritional assessment (MNA-SF). The Journals of Gerontology Series a: Biological Sciences and Medical Sciences 2001; 56(6): M366-M372.
13Mathew AC, Jose J, Athira S, Vijayakumar M — The reliability of Mini Nutritional Assessment (MNA) questionnaire in screening malnutrition among elderly aged 60 years and above. Asian Pacific Journal of Health Sciences 2015; 2(3): 47-8.
14Rathnayake N, Karunadasa R, Abeygunasekara T, De Zoysa W, Palangasinghe D, Lekamwasam S — Katz index of activities of daily living in assessing functional status of older people: Reliability and validity of Sinhala version. Dialogues in Health 2023; 2: 100134.
15Parmelee PA, Thuras PD, Katz IR, Lawton MP — Validation of the Cumulative Illness Rating Scale in a geriatric residential population. Journal of the American Geriatrics Society 1995; 43(2): 130-7.
16Elderly population [Internet]. South-East Asia Regional Office. 2019 [cited 12 June 2025]. Available from: http://www.searo.who.int/entity/health_situation_trends/data/chi/elderly-population/en/
17Sharma N, Aggarwal P — Modified BG prasad socio-economic classification, update–2021. Journal of Integrative Medicine and Public Health 2022; 1(1): 7-9.
18Nie N, Hull C, Bent DJ — IBM statistical package for the social sciences (SPSS Version 20). Computer Software. Chicago, IL: SPSS. 2011.
19Debia N, Oliveira AC, da Silva Rego L — Prediction of nutritional risk in elderly using MNA®-SF and its association with anthropometric measures. IOSR Journal of Nursing and Health Science 2021; 10: 1-5.
20Basibüyük GO, Ayremlou P, Aeidlou SNS, Çinar Z, Faruk AY, Bektas Y, Vita´lyos GA — Evaluation of malnutrition among elderly people living in nursing homes by Mini Nutritional Assessment Short Form (MNA-SF) in Turkey. 2019. Mædica, 14(1): 38.
21Agarwalla R, Saikia AM, Baruah R — Assessment of the nutritional status of the elderly and its correlates. Journal of Family & Community Medicine 2015; 22(1): 39.
22Jain M, Jain P, Kumari A, Jain N — An exploration of nutritional status in relation to diet quality, functional and mental ability among elderly in Tonk, India. Malaysian Journal of Medicine and Health Sciences 2021; 17(3): 232-8.
23Tan´ski W, Wo´jciga J, Jankowska-Polan´ska B — Association between malnutrition and quality of life in elderly patients with rheumatoid arthritis. Nutrients 2021; 13(4): 1259.
24Ning H, Du Y, Ellis D, Deng HW, Hu H, Zhao Y, Feng H — Malnutrition and its associated factors among elderly Chinese with physical functional dependency. Public Health Nutrition 2021; 24(6): 1404-14.
25de Sire A, Ferrillo M, Lippi L, Agostini F, de Sire R, Ferrara PE, Migliario M — Sarcopenic dysphagia, malnutrition, and oral frailty in elderly: A comprehensive review. Nutrients 2022; 14(5): 982.
26Shawel S, Baraki N, Alemeshet Y, Abebe DS, Egata G — Undernutrition and associated factors among adults with mental and neurological disorders in public health hospitals, Eastern Ethiopia, 2019: A cross-sectional study. BMC Psychiatry 2023; 23(1): 617.
Chakraborty S, et al. Assessment of the Missing Link between Nutritional Status, Functional Capacity and Morbidity Profile.
Thamilselvi Ramachandran1, Poovizhi Inbasekaran2, Shanthi K C3, Manivannan Ekambaram4
Abstract
Background : The traditional lecture method is teacher centred& promotes passive learning for students. An incorporation of Case Based Learning (CBL) with traditional lecture will be an active learning strategies for better understanding of Patholo gy subject knowledge and be able to correlate in the context of clinical disease during their medical practice. Aim is to find out the usefulness of CBL in Pathology as a students perspective.
Materials and Methods : After obtaining the Institutional Ethical Committee clearance, 140 students of phase II MBBS were included in this study. students were randomly divided into 2 equal groups of 70 each A & B groups. Each group were given structured Pre test Questionnaires & they were taught Case Based Learning on Breast & Thyroid modules. At the end, post test Questionnaires & feedback was obtained using 5 point Likert scale. The comparison of mean of pre- test & Post-test scores of the groups were done.
Results : The mean pre-test score in Breast module was 7.22 and Thyroid module was 9.44 and the post test mean scores were 11.38 and 15.53 respectively. Both these scores were analysed by using independent ‘t’ test & Mann Whitney U with the help of statistical software & the mean differences of these scores were statistically significant.
Conclusion : CBL can be combine with lecture classes to promote self directed learning and enhances the knowledge of reallife situations, promotes the critical thinking, communication & analytic skills.
Key words : Case Based Learning, Breast & Thyroid Modules, Likert Scale.
Pathology being one of the fundamental sciences in medical curriculum where teaching is mostly lecturebased, with practical and tutorials as interactive sessions. It is taught as an individual subject without any interdisciplinary interaction leading in failure to associate and correlate the pathophysiology of the disease with the clinical presentation and diagnosis of the disease and in applying this theoretical knowledge to clinical practice 1
The introduction of Competency-based Medical Education (CBME) for medical graduates as per the Graduate Medical Education Regulations (GMER), the educational scenario in India has undergone a paradigm shift. The aim of the new CBME pattern emphasizes on application of the gained knowledge. Many innovative teaching learning methods have been developed over the years to achieve it. One of them is Case Based Learning (CBL), where clinical cases are used to assist in teaching the concepts. It is an effective teaching method as it links learning across multiple disciplines and allows for clinical integration2,3
Department of Pathology, Vinayaka Missions Kirupananda Variyar Medical College & Hospital, VMRF (DU), Salem, Tamil Nadu 636308
1MD, Professor and Corresponding Author
2MBBS, MD, Associate Professor
3MBBS, MD, Professor and Head, Department of Anatomy
4MBBS, MD, Professor and Head, Department of Pharmacology
Received on : 27/12/2024
Accepted on : 13/01/2025
Editor's Comment :
! ! ! ! ! Advanced case-based learning transforms pathology from rote memorization into meaningful clinical reasoning, enabling Phase II MBBS students to integrate mechanisms of disease with patient care.
!
! ! ! ! This learner-centered approach enhances diagnostic thinking, long-term retention and preparedness for real-world clinical practice.
There is not a set definition for CBL. An excellent definition has been proposed by Thistlewaite et al in a review article. In their 2012 paper, a CBL definition is “The goal of CBL is to prepare students for clinical practice, through the use of authentic clinical cases. It links theory to practice, through the application of knowledge to the cases, using inquiry-based learning methods”4.
In a review of the literature, Williams (2005) describes how CBL utilizes collaborative learning, facilitates the integration of learning, develops students' intrinsic and extrinsic motivation to learn, encourages learner selfreflection and critical reflection, allows for scientific inquiry, integrates knowledge and practice, and supports the development of a variety of learning skills5
Students were finding difficulty to read pathology & applied aspect after attending the traditional lecture classes. We plan to assess the perception of students after introducing a teaching method of Case Based Learning in Pathology & thereby develop interest in the same.
How to cite this article : Impact of Advanced Case Based Learning in Pathology for Phase II MBBS Students. Ramachandran T, Inbasekaran P, Shanthi KC, Ekambaram M. J Indian Med Assoc 2026; 124(1): 49-52.
AIMS AND OBJECTIVES
1)To create the Case Based Learning (CBL) module in Pathology.
2)To implement the CBL module to Phase II MBBS students.
3)To assess the usefulness of CBL in Pathology from students’ perspective.
MATERIALS AND METHODS
This was a pre-post interventional study carried out at Tertiary Care Medical College and Hospital in the Second year MBBS students in the Department of Pathology. After taking permission from Institutional Ethics Committee, the present study was conducted in a batch of 140 students of Phase II MBBS Students.
faculty were done to support & promote learning. Skill Lab was also used in addition, for the demonstration of Breast carcinoma & Axillary lymph node metastasis. Gross microscopic details of specimens & application of treatment details were discussed. By observing their interaction, & analysing the perception of learning pathology will be assessed in the form Pre test & Post test questionnaires.
Statistical Analysis :
Statistical significance between the mean differences of the scores were tested by Independent t test and Mann Whitney 'U' test using JAMOVI software 2.3.21
!
! ! Study Type & design – Intervention study
! ! ! ! ! Study Setting : Setting: Phase II MBBS Students in VMKVMC & H, Salem.
! ! ! ! ! Study Target population : Phase II MBBS Students (2021 – 2022Batch).
140 students of the second-year MBBS were exposed to this Case Based Learning for Thyroid and Breast topic. All 140 students gave Pre- and Post-tests for Case Based Learning (Table 1) and also completed the feedback analysis.
! ! ! ! ! Inclusion Criteria : All students who provided consent !
! ! ! Exclusion Criteria : Absentees
! ! ! ! ! Sample size for quantitative studies: 140 Phase II MBBS Students
! ! ! Modules – 2 ( Modified CBL of Thyroid & Breast )
! ! ! ! ! Study period – January, 22 – April, 22 (4 months)
! ! ! Methods of data collection - Pre-test & Post-test Questionaries.
Students perspective view of pathology was obtained by structured Pre- and Post test Questionnaires. Attitude & Perceptions of Group A & Group B students towards Case Based Learning sessions were assessed by feedback of self administered questions using 5 point Likert Scale ranging from 1- strongly disagree to 5- strongly agree.
After the sensitization of the students about the project and getting the informed consent from the students, the study was done for a period of 3 months in Lecture Hall on the topics of modules from Breast & Thyroid. Among the total of 145 students Phase II MBBS, 140 were included in this study & divided into 70 and 70 students were participated & five students were on leave. Two CBL sessions were conducted where the students were instructed to go through the request form of Thyroid & Breast specimens received from the surgical departments, Analysing the clinical details with patient examination, Lab investigations (USG, Mammogram), with demonstration of fine needle aspiration cytology & interpretation of Lab details followed by facilitation by
There is a substantial increase in mean scores from Pretest to Post-test. In the Breast topic, the mean scores increased from 7.22 to 11.38, and in the Thyroid topic, from 9.44 to 15.53. Which suggests that case-based scenarios are effective in enhancing knowledge. The pvalues for case- based scenarios on Thyroid and Breast topic are <0.0001, indicating that the improvements observed are statistically significant.
Feedback analysis (Table 2) on Attitude & Perceptions of CBL by student showed majority (94%) either agree or strongly agree that CBL sessions help achieve learning objectives, indicating alignment between the sessions and educational goals. Sixty percent agreed that CBL sessions stimulate active learning, which is crucial for engagement and deeper understanding. Over 90% of respondents find CBL sessions helpful in learning content comprehensively.
Approximately 91% believe that CBL sessions are effective for teaching differential diagnosis. A majority (94.5%) feel that CBL sessions enhance their ability to propose appropriate investigations, indicating practical application of knowledge. While a majority (86%) agree, there's a notable portion (11.7%) who are neutral, indicating room for improvement in bridging basic science and clinical scenarios. Fifty percent agree that CBL aids in better retention of knowledge, highlighting its potential benefits for long-term learning.
Table 1 — Effectiveness of CBL in Pretest and posttest. Case-Based Scenario
0.0001< 0.0001
T, et al. Impact of Advanced Case Based Learning in Pathology for Phase II MBBS Students.
Table 2 — Feedback analysis of case based learning from students.
Feedback QuestionnairesAgreeStronglyNeutralDisagreeStrongly AgreeDisagree
Case Based Learning (CBL) Sessions helped me to achieve the Learning Objectives of the topic.56%38%5% 0.8%0.8%
CBL Sessions stimulates Active learning.60%33% 6.7%-0.8%
CBL helped me to learn the content in a Comprehensive manner.54%37%
CBL Sessions are better teaching tool to make Differential Diagnosis.50%41%
CBL sessions enhanced my ability to propose appropriate Investigations. 57.5%37% 4.2%0.8%0.8%
CBL helped me to apply concepts of basic sciences to Clinical situation’s better than traditional lecture.54%32%11.7%0.8%0.8%
CBL helped me in better retention of Knowledge.50%35%13.3% 0.8%0.8%
CBL Session is an Effective Learning Tool.53%34%11.7%-0.8%
CBL enhances Self Directed Learning.46%32%20.8%- 1.7%
CBL enhanced my Problem Solving Skills.53%32%14.2% 0.8%0.8%
Over 87% perceive CBL sessions as an effective learning tool, although there's a small portion (11.7%) who are neutral. Forty-six percent agree that CBL enhances selfdirected learning, suggesting room for improvement in fostering autonomy among learners. Over 85% believe that CBL enhances their problem-solving skills, indicating practical application and critical thinking development.
Need for active productive mental activity to make comprehend a certain area of knowledge, it is best to involve students in active learning process 6 . New evidence-based researches in medical education and improved understanding of memory retention and reproduction have revealed the shortcomings of traditional methods. Traditional method cannot fulfill the needs of current medical education system as there is rapid development in the medical and science technology, understanding pathology cannot be effective through traditional method 7. The purpose of this study was to show the effectiveness of CBL method among MBBS students in the subject of pathology.
CBL is a participatory, discussion-based way of learning where students gain knowledge & skills in critical thinking, communication and group discussion. Studies have shown that case-based learning approach brings more attention for students in discussion of specific situations and thus can be perceived challenging, interesting and helpful towards learning8.
In our present study analysis (Table 1) of MCQ based test results showed there was significant difference in the Pre-test & Post-test mean scores of CBL, indicating case based scenario was effective in terms of acquiring knowledge as (immediate) Post-test mean scores were significantly higher than Pre-test mean scores in CBL.
Study by Datta A, et al9 showed post-test mean scores of CBL groups were significantly higher than that of DL groups which is similar to our current study as there was significant difference in the posttest of CBL. Study by
Nishal A, et al7 showed the same, increase in the mean score of CBL in the posttest conducted.
A study by Ciraj AM, et al10 found that including the CBL in routine teaching as a learning strategy was superior to teaching without any CBL sessions in the curriculum. Vora MB, et al 11; Tathe SS, et al 13; Joshi KB, et al 12 have suggested that CBL was an effective teaching method in different pre- and para-clinical subjects like Pharmacology, Microbiology, Biochemistry etc. They also opined that perceptions of Students and Teachers to CBL were very positive and highly satisfactory11-13.
Study by Datta A, et al9 also found that the perceptions of students and teachers to CBL were very positive and no significant lacunae or drawbacks were revealed from their feedback responses. CBL promotes team work, retention of key concepts and their application to patient care situations. Study by Nishal A, et al7 revealed that 87% of the students agreed with the usefulness of CBL in better understanding of the topic and retention in memory. They also acclaimed that it encouraged their critical thinking and decision-making qualities.
Two recent studies conducted on the pharmacology subject also concluded that CBL was an effective tool in teaching the subject to a large group of students14,15. CBL provided better motivation and satisfaction to the students. It also improved students’ attendance in class15. Hasamnis AA, et al 14 also concluded that CBL helped in amalgamating theoretical knowledge into clinical pharmacology practices. Pearson D, et al16 were able to conclude that the innovative CBL paradigm appeared to be an effective adjunct to the traditional lecture format. Study by Gogoi G, et al 17 students agreed that CBL is a good method and it stimulated their desire to learn. They also felt confident to apply the knowledge of basic sciences and pathology to solve clinical cases17. The study by Kassebaum DK, et al18 was able to show that students undertaking the CBL format were better able to ask questions and make comments during class and CBL made the learning more enjoyable.
In our study showed that majority of the students revealed
that, CBL enhances the problem solving skills, Self Directed Learning (SDL), promotes effective learning tool & helps in better retention of knowledge. CBL promotes team work, retention of key concepts and their application to patient care situations. CBL take a lot of time and demand for active engagement from the faculty19
CBL is a tool that can supplement & combine with lecture classes and promote self directed learning and deep understanding of the subject.
CBL enhances the ability to apply knowledge to real-life situations, promotes & enhance the critical thinking, communication & analytical skills.
This project is done as a mandatory requirement of NMC ACME course at NMC Nodal Centre for National Faculty Development Programmes at CMC, Vellore.
Prof Dr Vinay Oommen, Prof Dr R Kanagalakshmi, Dr Margaret Shanthi & MEU, CMC, Vellore for being a facilitator and helping in this project.
Dr. Nirmal Sujitha (Department of Community Medicine, VMKVMC&H, Salem) has done the statistical analysis;
Dr V Eswari, (Department of Pathology, MMMC&RI, Kanchipuram.) for validating the questionnaires and Dr BeyarilChitra C, Department of Pathology, Govt Kanyakumari Medical College for validating the questionnaires.
Dean Prof Dr K Ezhil Vendhan, Department of Ophthalmology, Vinayaka Missions Kirupananda Variyar Medical College & Hospital, VMRF (DU), Salem.
Funding : None.
Conflict of interest : No Conflicts of Interest declared by any author.
1Kar A, Kar T, Dash K, Rout N, Bhuyan P, Panda S, et al — Undergraduate Pathology Education: Meeting the Challenge Ahead. Int J Clin Med 2012; 3(2): 83-7.
2Shah N, Desai C, Jorwekar G, Badyal D, Singh T — Competencybased medical education: Anoverview and application in pharmacology. Indian J Pharmacol 2016; 48(Suppl 1): S5-9.
3Harden RM, Grant J, Buckley G, Hart IR — BEME Guide No. 1: Best Evidence Medical Education. Med Teach 1999; 21(6): 55362.
4Thistlethwaite JE, Davies D, Ekeocha S, Kidd JM, MacDougall C,Matthews P, et al — The effectiveness of case-based learning in health professional education. A BEME systematic review: BEME Guide No.23. Med Teach 2012; 34(6): e421-444
5Williams B — Case-based learning - a review of the literature: is there scope for this educational paradigm in prehospital education? Emerg Med 2005; 22: 577-81.
6Ghosh S — Combination of didactic lectures and case-oriented problem-solving tutorials toward better learning: perceptions of students from a conventional medical curriculum. Adv Physiol Educ 2007; 31(2): 193-7.
7Nishal A, Patel J, Balvalli R, Preeti P — Yadav, Parmita Jayani, Ravina Singh et al. A Comparative Study of Case-Based Learning vs. Traditional Teaching Method in Pathology in Indian Medical Graduates. J Med Edu 2022; 21(1): e127188.
8Joseph A — Mayo Using case-based instruction to bridge the gap between theory and practice in psychology of adjustment. J Constructivist Psychol 2010; 17(2): 137-46.
9Datta A, Ray J — Case Based Learning in Undergraduate Pathology – A Study to Assess its Efficacy and Acceptability as TeachingLearning Tool. IAIM 2016; 3(6): 93-100.
10Ciraj AM, Vinod P, Ramnarayan K — Enhancing active learning in microbiology through case based learning: experiences from an Indian medical school. Indian J Pathol Microbiol 2010; 53(4): 72933.
11Vora MB, Shah CJ — Case-based learning in pharmacology: Moving from teaching to learning. Int J Appl Basic Med Res 2015; 5(Suppl 1): S21–S23.
12Joshi KB, Nilawar AN, Thorat AP — Effect of case based learning in understanding clinical biochemistry. Int J Biomed Adv Res 2014; 5(10): 516-8.
13Tathe SS, Singh AL — Case Based Lecture Versus Conventional Lectures for Teaching Medical Microbiology to Undergraduate Students. Int J Cur Res Rev 2014; 6(4): 35-41.
14Hasamnis AA, Arya A, Patil SS — Case-based Learning: Our Experience in Clinical Pharmacology Teaching. J Pharm Bioallied Sci 2019; 11(2): 187-9.
15Kaur G, Rehncy J, Kahal KS, Singh J, Sharma V, Matreja PS, et al Case-Based Learning as an Effective Tool in Teaching Pharmacology to Undergraduate Medical Students in a Large Group Setting. J Med Educ Curric Dev 2020; 7: 1-6.
16Pearson D, Pandya H — Shared learning in primary care: participant’s views of the benefits of this approach. J Interprof Care 2006; 20(3): 302-13.
17Geetanjali Gogoi. Introduction of case based learning in Undergraduate pathology teaching. Paripex- Indian Journal of Research 2021; 10(1): 56-8.
18Kassebaum DK,Averbach RE, Fryer Jr GE — Student preference for a case based vs. lecture instructional format. J Dent Educ 1991; 55(12): 781-4.
19Mrudula C, Rajneesh, Challa SR — Perception of students and faculty regarding the implementation of Case Based Learning in pre and para clinical MBBS students. Int J Curr Res Biol Med 2017; 2(5): 6-11.
Manas Das1, Priya Bansal2, Anupam Prakash3, Rosmy Jose4
Abstract
Background : Glycogenic Hepatopathy (GH) is an underdiagnosed complication of poorly controlled diabetes. It is reversible and has a better prognosis in comparison to Non-alcoholic Fatty Liver Disease. Through this review, the authors wish to discuss the various salient features of this condition.
Key words : Glycogenic Hepatopathy, Diabetes Mellitus, Non-alcoholic Fatty Liver Disease
Glycogenic Hepatopathy (GH) is an under-diagnosed complication seen in children and young adults with poorly controlled T1DM and a few patients with T2DM1,2 It causes hepatomegaly and a transient rise of liver enzymes due to reversible accumulation of glycogen in hepatocytes. It is confirmed with the help of Liver Biopsy and staining of glycogen using Hematoxylin & Eosin (H&E) stain.
Etiology :
Glycogenic Hepatopathy was first explained by Pierre Mauriac in 1930 in a child with brittle T1DM who presented with cushingoid features, hepatomegaly and poor growth, as part of the Mauriac Syndrome3,4. Other terminologies which were used before ‘glycogenic hepatopathy’ are ‘hepatic glycogenosis’, ‘hepatic glycogen storage disease’ and ‘glycogen storage hepatomegaly’5-10. Torbenson and colleagues formulated the term ‘Glycogenic Hepatopathy’ in 2006, which has now been adopted worldwide10
Glycogenic Hepatopathy has also been noticed in patients with dumping syndrome after gastrectomy, anorexia nervosa, azathioprine use, high dose corticosteroids and insulin usage9,11-13
Epidemiology :
Exact statistical data of incidence and prevalence of Glycogenic Hepatopathy (GH) are not known; much of the information is through reported case studies, case series, retrospective cohort study, and more recently casecontrol studies4,15. The prevalence of liver disease among diabetics is approximated to be between 17% to 100%, with NAFLD and GH being the most common16. Around 98% of GH cases have been reported in T1DM while the
Department of Medicine, Lady Hardinge Medical College and Associated Hospitals, New Delhi, Delhi 110001
1MD, Resident Doctor, Cleveland Clinic Fairview Hospital, Cleveland, Ohio
2MD, MRCP, Professor and Corresponding Author
3MD, Director Professor
4MD, Assistant Professor
Received on : 24/05/2024
Accepted on : 10/06/2024
Editor's Comment :
! ! ! Glycogen Hepatopathy (GH) is an underdiagnosed complication of poorly controlled Diabetes Mellitus.
! ! It occurs due to accumulation of glycogen in hepatocytes. ! ! ! GH leads to hepatomegaly and derangement of Liver Function Tests.
! ! GH is reversible with adequate glycemic control.
rest 2% in T2DM. Out of the reported cases 62% were females, while 38% were males, indicating a slight female predominance, adolescence being the most common age group17.
Pathophysiology :
The pathophysiology of GH is unclear. It is probably due to the glycemic variation with hyperglycemia, hypoglycemia and hyper-insulinization. The disease occurs when long standing hyperglycemia is treated with supra-physiological amounts of insulin 10 .
After meal, the liver takes up glucose via GLUT 2 and uses it for fuel and the excess to be converted into glycogen, the reservoir form of glucose. The balance of glycogen levels in the liver is maintained by glycogenosis and glycogenolysis19.
How to cite this article : The Bright Liver of Glycogenic Hepatopathy. Das M, Bansal P, Prakash A, Jose R. J Indian Med Assoc 2026; 124(1): 53-5.
With continuous glycogen storage, hepatomegaly may develop within a few days to week and can reverse rapidly once the hyperglycemia is controlled21.
Clinical Presentation17,26 :
! ! ! Asymptomatic elevated liver enzymes associated with symptoms of hyperglycemia.
! ! ! Symptoms of diabetic ketoacidosis like nausea, vomiting or abdominal pain.
! ! ! Children can present with delayed puberty, growth failure and hepatomegaly.
!
! ! ! ! Abdominal pain
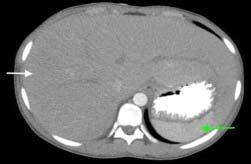
!
! ! ! ! Hepatomegaly, which can be tender.
! ! ! ! ! Ascites is uncommon; may be due to sinusoidal compression by the enlarged glycogen-laden hepatocytes.
Biochemical Features :
The liver synthetic functions are preserved. However, in more than 90% of patients with hepatomegaly, there has been transaminitis without an increase in Alkaline Phosphatase. This is due to the cell membrane injury rather than necrosis.
Histopathology :
Liver Biopsy is considered to be the gold standard for the diagnosis of Glycogenic Hepatopathy. Typical feature is swollen hepatocytes. The H&E stain shows enlarged and pale hepatocytes with multiple glycogenated nuclei. Empty hepatocytes (“Ghost Cells”) are seen when Diastase enzyme is added to the Periodic Acid-Schiff (PAS) stained specimen due to enzymatic degradation of glycogen 22
Imaging :
Ultrasound Imaging :
It cannot differentiate GH from NAFLD and shows hepatomegaly with uniform echogenicity.
Computed Tomography Scan :
It can help in differentiating GH from fatty liver. The glycogen loading of the liver in GH appears hyperdense on the CT scan whereas, fatty liver appears hypodense (Fig 1). The “Shining Liver” on CT scan is the important clue that points to a diagnosis of Glycogenic Hepatopathy. The other cause of increased hepatic attenuation is hemochromatosis23 .
Magnetic Resonance Imaging (MRI) :
Dual-Echo MRI detects deposition of glycogen by identifying low intensities on T2 weighted images and differentiates GH from Inflammatory Fatty Liver Disease and NAFLD 23,27 . A new modality, 13C Magnetic
Resonance Spectroscopy (MRS), can provide quantitative information of hepatic glycogen deposits28
Differential Diagnosis :
Other diseases that can cause hepatomegaly with transaminitis in patients with Diabetes Mellitus include: ! ! Non-alcoholic Fatty Liver Disease (NAFLD) ! ! Viral hepatitis ! ! ! ! Autoimmune hepatitis ! ! Celiac disease
! Wilson disease ! ! Hemochromatosis
Management :
Glycogenic Hepatopathy is benign and reversible. Improved glycemic control is the most important part of effective management; with which both clinical and biochemical features of GH can reverse within days to weeks24 . The exact glycemic control is not yet established but aggressive insulin treatment is not warranted. In a case report published by Parmar, et al only 0.6% improvement in HbA1c led to the relief of abdominal pain and fall in liver enzymes25
Prognosis :
With good glycemic control, GH is completely reversible. Being a benign condition, it has a very good prognosis, and must be differentiated from NAFLD because the latter can progress to fibrosis while GH does not.
Glycogenic Hepatopathy remains an under-recognized complication of T1DM characterized by severe transaminitis and hepatomegaly, which is reversible with
adequate glycemic control. Glycogenic Hepatopathy must be differentiated from NAFLD as prognosis differs. Early diagnosis and appropriate treatment by achieving good glycemic control will lead to a very favourable prognosis.
Funding : None.
Conflict of Interest : None.
1Ruschhaupt DG, Rennert OM — Recurrent hepatomegaly and transient alteration of liver functions in an adolescent with diabetic acidosis. Clin Pediatr (Phila) 1970; 9(2): 122-4.
2Umpaichitra V — Unusual glycogenic hepatopathy causing abnormal liver enzymes in a morbidly obese adolescent with well-controlled type 2 diabetes: resolved after A1c was normalized by metformin. Clin Obes 2016; 6(4): 281-4.
3Atmaca M, Ucler R, Kartal M, Seven I, Alay M, Bayram I, et al — Glycogenic Hepatopathy in Type 1 Diabetes Mellitus. Case Reports Hepatol 2015; 2015: 236143.
4Fitzpatrick E, Cotoi C, Quaglia A, Sakellariou S, Ford-Adams ME, Hadzic N — Hepatopathy of Mauriac syndrome: a retrospective review from a tertiary liver centre. Arch Dis Child 2014; 99(4): 3547.
5Berman MC — Hepatic glycogen storage during uncontrolled diabetes mellitus. A case report. S Afr Med J 1973; 47(5): 184-6.
6Munns CF, McCrossin RB, Thomsett MJ, Batch J — Hepatic glycogenosis: reversible hepatomegaly in type 1 diabetes. J Paediatr Child Health 2000; 36(5): 449-52.
7Sayuk GS, Elwing JE, Lisker-Melman M — Hepatic glycogenosis: an underrecognized source of abnormal liver function tests? Dig Dis Sci 2007; 52(4): 936-8.
8Abaci A, Bekem O, Unuvar T, Ozer E, Bober E, Arslan N, et al — Hepatic glycogenosis: a rare cause of hepatomegaly in Type 1 diabetes mellitus. J Diabetes Complications 2008; 22(5): 325-8.
9Tsujimoto T, Takano M, Nishiofuku M, Yoshiji H, Matsumura Y, Kuriyama S, et al — Rapid onset of glycogen storage hepatomegaly in a type-2 diabetic patient after a massive dose of long-acting insulin and large doses of glucose. Intern Med 2006; 45(7): 46973.
10Torbenson M, Chen YY, Brunt E, Cummings OW, Gottfried M, Jakate S, et al — Glycogenic hepatopathy: an underrecognized hepatic complication of diabetes mellitus. Am J Surg Pathol 2006 30(4): 508-13.
11Kransdorf LN, Millstine D, Smith ML, Aqel BA — Hepatic glycogen deposition in a patient with anorexia nervosa and persistently abnormal transaminase levels. Clin Res Hepatol Gastroenterol 2016; 40(2): e15-8.
12Resnick JM, Zador I, Fish DL — Dumping syndrome, a cause of acquired glycogenic hepatopathy. Pediatr Dev Pathol 2011; 14(4): 318-21.
13Burda P, Hochuli M — Hepatic glycogen storage disorders: what have we learned in recent years? Curr Opin Clin Nutr Metab Care 2015; 18(4): 415-21.
14Iancu TC, Shiloh H, Dembo L — Hepatomegaly following shortterm high-dose steroid therapy. J Pediatr Gastroenterol Nutr 1986; 5(1): 41-6.
15Mukewar S, Sharma A, Lackore KA, Enders FT, Torbenson MS, Kamath PS, et al — Clinical, Biochemical, and Histopathology Features of Patients with Glycogenic Hepatopathy. Clin Gastroenterol Hepatol 2017; 15(6): 927-33.
16Al-Hussaini AA, Sulaiman NM, Alzahrani MD, Alenizi AS, Khan M — Prevalence of hepatopathy in type 1 diabetic children. BMC Pediatr 2012; 12: 160.
17Sherigar JM, Castro J, Yin YM, Guss D, Mohanty SR — Glycogenic hepatopathy: A narrative review. World J Hepatol 2018; 10(2): 172-85.
18Tomihira M, Kawasaki E, Nakajima H, Imamura Y, Sato Y, Sata M, et al — Intermittent and recurrent hepatomegaly due to glycogen storage in a patient with type 1 diabetes: genetic analysis of the liver glycogen phosphorylase gene (PYGL). Diabetes Res Clin Pract 2004; 65(2): 175-82.
19Chatila R, West AB — Hepatomegaly and abnormal liver tests due to glycogenosis in adults with diabetes. Medicine (Baltimore) 1996; 75(6): 327-33.
20Aljabri KS, Bokhari SA, Fageeh SM, Alharbi AM, Abaza MA — Glycogen hepatopathy in a 13-year-old male with type 1 diabetes. Ann Saudi Med 2011; 31(4): 424-7.
21Stone BG, Van Thiel DH — Diabetes mellitus and the liver. Semin Liver Dis 1985; 5(1): 8-28.
22Shah ND, Sasatomi E, Baron TH — Acute and Relapsing Hepatitis Caused by Glycogenic Hepatopathy. Clin Gastroenterol Hepatol 2017; 15(6): A23-A24.
23Sweetser S, Kraichely RE — The bright liver of glycogenic hepatopathy. Hepatology 2010; 51(2): 711-2.
24Al Sarkhy AA, Zaidi ZA, Babiker AM — Glycogenic hepatopathy, an underdiagnosed cause of relapsing hepatitis in uncontrolled type 1 diabetes mellitus. Saudi Med J 2017; 38(1): 89-92.
25Parmar N, Atiq M, Austin L, Miller RA, Smyrk T, Ahmed K — Glycogenic Hepatop athy: Thinking Outside the Box. Case Rep Gastroenterol 2015; 9(2): 221-6.
26Silva M, Marques M, Cardoso H — Glycogenic hepatopathy in young adults: A case series. Rev Esp Enferm Dig 2016; 108(10): 673-6.
27Glycogenic hepatopathy and non-alcoholic fatty liver disease in type 1 diabetes patients. Saikusa M, Yatsuga S, Tonan T, Koga Y. Pediatr Int 2013; 55: 806-7.
28Absolute quantification of the hepatic glycogen content in a patient with glycogen storage disease by 13C magnetic resonance spectroscopy. Roser W, Beckmann N, Wiesmann U, Seelig J. Magn Reson Imaging 1996; 14: 1217-20.
Anam Sarwar1, Ashwani Verma2, Samrat Joshi3, Leena Saini4
Abstract
Background : Posterior Reversible Encephalopathy Syndrome (PRES) is a neurological disorder characterised by reversible subcortical vasogenic oedema, typically presenting with headache, altered mental status, seizures and visual disturbances. The etiology is multifactorial and includes hypertension, immunosuppressive therapy, eclampsia and renal failure.
Aims and Objective : This case series aims to explore the clinical presentation, imaging findings, predisposing factors, management strategies and outcomes of patients diagnosed with PRES.
Materials and Methods : We conducted analysis of four cases of PRES admitted to National Institute of Medical Sciences, Jaipur. Clinical data, imaging studies, laboratory results, treatment modalities and patient outcomes were reviewed.
Results : In our study posterior reversible encephalopathy syndrome was associated with eclampsia and characterized by seizures, altered and loss of consciousness, visual disturbances. White matter abnormalities in posterior parietooccipital region on Computed Tomography (CT) and Magnetic Resonance Imaging (MRI) were observed. Management usually includes stabilization of patient control of blood pressure and prevention of seizures.
Conclusion : Our case series underscores the diverse clinical manifestations and predisposing factors associated with PRES. Early recognition and prompt management are essential for optimizing patient outcomes.
Key words : Posterior Reversible Encephalopathy, Pres, Neurological Disorder, Clinical Presentation, Predisposing Factors, Management, Outcome.
Posterior Reversible Encephalopathy Syndrome (PRES) is a neurological syndrome associated with a number of conditions including pre eclampsia, eclampsia, severely high blood pressure, renal failure, SLE and the assumption of immunosuppressive agents1,2
The triggering events for PRES seems to be an abrupt increase in blood pressure leading to an acute disruption of blood brain barrier. However, cases in normotensive patients have also been reported 3,4
PRES is first identified by Hinchy in 19965
PRES is also characterized by headache, confusion, vomiting, altered consciousness, visual disturbances and seizures5
Previously this condition has been known by various names like reversible posterior leukoencephalopathy syndrome and reversible occipital parietal encephalopathy, but PRES is now widely accepted term6,7 MRI and CT show diffuse abnormalities due to vasogenic oedema predominantly within territories of posterior circulations
Department of Obstetrics and Gynaecology, National Institute of Medical Sciences, Jaipur, Rajasthan 303121
1MBBS, Postgraduate Resident
2MS, Assistant Professor
3MD, Professor, Department of Anaethesia, Balvir Singh Tomar Institute of Medical Sciences and Research, Jaipur, Rajasthan 303002
4MS, Professor, Department of Obstetrics and Gynaecology, Balvir Singh Tomar Institute of Medical Sciences and Research, Jaipur, Rajasthan 303002 and Corresponding Author
Received on : 11/04/2024
Accepted on : 29/04/2024
Editor's Comment :
! ! ! PRES is a reversible warning from the Brain in women with preeclampsia and eclampsia. When severe hypertension and endothelial dysfunction overwhelm cerebral autoregulation, timely diagnosis and gentle blood-pressure and seizure control can restore normalcy.
! ! ! ! ! Missed antenatal care turns a preventable condition into a lifethreatening event – early screening for pre-eclampsia protects not only the placenta and fetus, but also the mother’s brain.
and primarily affecting the subcortical white matter of the parieto-occipital lobes8. Eclampsia is characterized by new onset seizures/convulsions in a women with pre eclampsia in the absence of any other causes. Both pre eclampsia and eclampsia may be associated with PRES9-12
PRES is usually reversible, but permanent damage can occur if cerebral ischemia or haemorrhage occurs1.
We present four cases of PRES in eclamptic women.
A 22 year primigravida at 37 weeks 5 days period of gestation was attended at emergency department in state of altered sensorium (GCS score – E1V2M5 ) with blood pressure of 220/118 mmhg .
She was intubated according to RSI protocol and foley’s catheterization was done.
Patient was given Injection Levipil 1 gm iv, Injection labetalol 20 mg iv along with Injection magnesium sulphate loading dose of 14 gm.
How to cite this article : Posterior Reversible Encephalopathy Syndrome in Eclamptic women. Sarwar A, Verma A, Joshi S, Saini L. J Indian Med Assoc 2026; 124(1): 56-61.
On per abdominal examination – Uterus was 36 weeks, cephalic presentation, uterus relaxed, fetal heart rate was 98 bpm.
Patient underwent emergency cesarean section under GA and delivered a female child. The neonate weighed 2.41 kg . Liquor was meconium stained and baby was born limp, bag and mask was done for 1 minute and was intubated, baby got admitted in NICU. APGAR score at 1 and 5 min was 4 and 5 respectively. Cord blood gas was normal.
Postdelivery patient was shifted to ICU for intensive monitoring.
On day 1 of post partum blood pressure values of 186/ 100 mmhg was seen . Treatment with infusion Labetalol at 5ml/hr started and titrated according to blood pressure. Investigations showed haemoglobin value of 7.4 g/dl, platelet counts of 1,41,000 and urine albumin was 3+, Magnesium sulphate infusion was continued at 1gm/hr in post partum period for 24 hours.
MRI brain including T2-FLAIR and DWI showed radiological picture suggestive of PRES syndrome.
On neurology consultation Injection Mannitol 100 cc iv 8 hourly with Injection Levipil 500 mg i.v 8 hourly was started.
48 hours post partum patient was extubated, neurological examination was normal and blood pressure maintained at 130/80 mmhg on Tab Amlodipine 5 mg 12 hourly with Tab Nicardia 20 mg 8 hourly and adequate pain
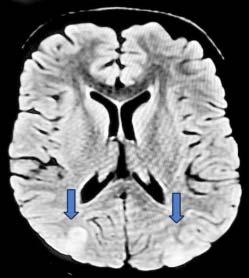
management. Patient was transferred to obstetric ward. Neonate outcome was good and was shifted to mothers side.
On 7th day patient was discharged from hospital in good health with anti hypertensive therapy. Follow up MRI at 1 month from the event was completely normal.
Histopathological examination of the placenta revealed chronic hypoxia acute inflammatory cells along the chorion.
A 24 year primigravida at 27 weeks 3 days period of gestation with one episode of seizure along with tongue bite and one episode of vomiting with severe headache.
Patient was attended at emergency department and blood pressure was 220/118 mmhg and was semiconscious, drowsy and disoriented (GCS score – E3V2M6) on examination B/L pitting pedal edema was present. Patient had 2nd episode of GTCS at emergency department also. Patient was in post ictal phase with GCS score – E2V2M5. Patient was given Injection Levipil 1 gm iv, Injection Labetalol 20 gm i.v with Injection MgSo4 loading dose of 14 mg, oxygen support and shifted to ICU.
Per abdominal examination – Uterus – 24 weeks size, cephalic presentation, uterus relaxed, fetal heart sound124 bpm.
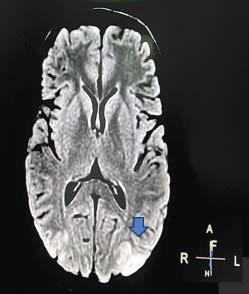
Per vaginal examination – Cervical Os closed, uneffaced cervix, vertex high up, no leaking or bleeding per vaginum. Steroid coverage (Dexamethasone) for fetal lung maturity was given.
Neurology opinion advised Injection levipil 500 mg 8 hourly with Intravenous Magnesium Sulphate infusion for next 24 hours. USG fetal well being was done which was suggestive of single live intrauterine fetus of 26 weeks 2 days with AFI – 8.2 cm, placenta posterior upper, estimated fetal weight of 734 gms. USG fetal color doppler showed absent diastolic flow in umbilical artery with raised PI value in mean maternal uterine artery.
Urine albumin level was 1155.7, UACR – 9472.95 . Blood investigations included Hb – 10.5 g/dl, WBC count of 12.32, platelet – 193, renal and liver functions was normal. As BP was not controlled she was started on injection labetalol infusion at 5ml/hr and nifedipine orally. Magnesium sulphate maintenance dose i.e 1 gm/hr by continuous infusion.
Neonatology opinion for fetal outcome and probable prognosis was done and patient was planned for Caesarean section which was performed under general anaesthesia. The newborn weighted 695 gms and APGAR score of 2 at 1 min and 4 at 5 min, with arterial base excess – 11 millimoles/L and was admitted to NICU.
Postdelivery patient was shifted to ICU for intensive monitoring.
On postpartum day 1 patient had blood pressure values of 180/110 mmhg and heart rate of 92/min with SpO2 at 100% on ventilatory support treatment with infusion labetalol at 5ml/hr and infusion fentanyl was given. Injection Levipil was continued with infusion of magnesium sulphate maintenance dose.
Patient was extubated 24 hours postoperatively and maintained a blood pressure of 160/100 mmhg with heart rate of 84/min on injection NTG infusion and amlodipine 5 mg orally 12 hourly and tablet labetalol 200 mg 8 hourly along with tablet levipil 500 mg 8 hourly.
Patient complained of severe headache and showed persistently raised blood pressure on neurology consultation Injection Mannitol 100 cc IV 8 hourly with Injection levipil 500 mg iv 8 hourly was started.
MRI brain with DW showed patchy area of hyperintensity on T2W/FLAIR in cortical and subcortical location of parieto occipital region s/o likely PRES.
Bed side 2D echo and USG renal doppler was normal.
72 hours after delivery neurological examination was normal and blood pressure maintained at 140/90 mmhg on Tab Amlodipine 5 mg 12 hourly with Tab Nicardia 20 mg 8 hourly and adequate pain management.
On fifth day of delivery patient was shifted to PNC ward neurological examination was normal and blood pressure of 130/80 mmhg.
Neonate had poor prognosis, died on day 6 due to refractory septic shock.
Antecedent cause – Extreme pre maturity and RDS. FLAIR MRI : cortical – subcortical hyperintense lesions in parieto occipital region
On day 8th she was discharged from the hospital in good health and anti hypertensive therapy.
On follow-up after 15 days pedal edema was significantly reduced and pre conceptional counselling was don.
Placental examination showed chronic hypoxia, multiple infarcts and chronic villitis inter-villitis.
A 37 year primigravida at 36 weeks 5 days period of gestation with HIV positive on antiretroviral therapy (lamivudine, tenofovir, dolutegravir) since 4th month of gestation. She was attended at emergency department referred from periphery health centre in unconscious state with history of abnormal body movement since 4 hours, multiple episodes of vomiting since last night. On examination GCS score – E1V2M4, blood pressure was 220/120 mmhg, heart rate – 48/min, SpO2 – 48 % on room air. Tongue bite and bilateral pitting edema was present.
She was intubated according to RSI protocol and foley’s catheterization done.
Patient was given Injection levipil 1 gm iv, Injection Labetalol 20 gm iv and Magnesium sulphate loading dose
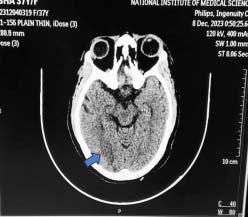
of 14 gm. Postintubation GCS score – E1VTM1 (under sedation) SpO2 – 100% maintained at FiO2 – 100%, blood pressure – 170/100 mmhg and heart rate of 76/ min.
Per abdominal examination – Uterus – 36 weeks size, cephalic presentation, uterus relaxed, fetal heart was 87 bpm Per vaginum examination – Cervix 1 cm dilated, uneffaced, vertex -1 station, membranes present flat, leaking present clear and no bleeding.
Patient underwent emergency ceasrean section under general anaesthesia and delivered a male child. Baby did not cry immediately after birth and did not had respiratory efforts so bag and mask ventilation given for 60 sec, after which baby cried and was shifted to NICU on CPAP for post resuscitation care. APGAR at 1 and 5 min was 4 and 7. The birth weight of neonate was 2.5 kg. As baby was maintaining saturation well ,was shifted to room air next day. Cord blood gas was normal.
Postdelivery patient was shifted to ICU for intensive monitoring
On postpartum day 1 - Patient had blood pressure of 150/ 110 mmhg and heart rate of 92/min with SpO2 of 100% on ventilatory support under sedation with Injection fentanyl infusion, injection atracurium injection, Injection levipil 500 mg iv 12 hourly and MgSo4 infusion maintenance dose was continued.
Patient was extubated 48 hours post operatively and had persistenly raised blood pressure (invasive – arterial) of 170/110 mmhg with heart rate of 94/min with continuous intravenous infusion of injection NTG and injection labetalol.
Haemoglobin was 9.9 g/dl, platelet count - 154, TLC –11.37, D.dimer – 2.85.
PT/INR - 12.8/0.95, Thyroid stimulating hormone – 8.53, anti TPO – 4.57.
Tab Eltroxin 37.5 mcg was started and patient resumed taking anti retroviral drugs.
Patient complained of blurring of vision on 3rd day postpartum and dizziness, fundoscopy examination revealed signs of advanced hypertensive retinopathy. On retina multiple flame shaped haemorrhages and cotton wool spots with hard exudates were present.
NCCT of brain showed mild low density in right occipital white matter.
Renal doppler and 2D echo was normal.
On 4th day post delivery patient complained of pain upper abdomen and nausea.
Ultrasonography of abdomen showed pancreas appear bulky and free fluid in morrisons pouch s/o Ascites.
Amylase – 148, lipase – 640, C reactive protein – 6.5, procalcitonin – 0.096, lifer function tests and renal function test was normal, electrolytes were normal. Gastrology opinion adviced adequate analgesics and liquid diet for the patient.
On day 8th her blood pressure was 140/90 mmhg, pulse rate – 82/min, SpO2 – 98 % on room air with oral Tab Nifidipine 20 mg 6 hourly, clonidine 100 mg 8 hourly, Tab Metroprolol 50 mg 12 hourly.
Her vision had completely returned and pain abdomen was subsided. Patient was shifted to obstetrics ward on 11th day and was discharged on oral anti hypertensives. Follow-up of MRI after 1 month from the event was completely normal. Neonate outcome was good.
Pathological examination of placenta revealed chronic hypoxia, fibrous stroma of chorionic villi.
A 27 year G2P1L1 at 30 weeks 5 days period of gestation was attended at emergency department referred from peripheral health centre with altered sensorium since 10 mins and abnormal body movements with history of 2 episodes of seizure and vomiting (GCS score – E2V1M2), her blood pressure was 180/108 mmhg, heart rate – 148/ min, SpO2 – 90% on room air.
IV line was secured with two large bore IV cannula.
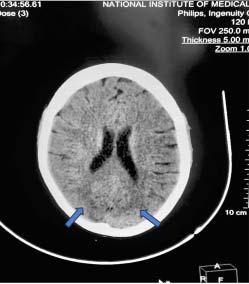
She was intubated according to RSI protocol , Ryle’s tube with foley’s catheter was inserted in triage Patient was given Injection Levipil 1 gm iv, Injection labetalol 20 gm iv and Injection magnesium sulphate 14 gm loading dose given.
Following which GCS score – E1VTM1 ( under sedation ) SpO2 – 100% maintained at FiO2 – 100%, blood pressure – 128/180 mmhg and heart rate of 110/min.
Arterial blood gas analysis showed metabolic acidosis.
Per abdominal examination – Uterus –28 weeks size, cephalic presentation, uterus relaxed, fetal heart rate was 150 bpm.
Per vaginum examination – cervix 1 cm dilated, uneffaced, vertex -1 station, membranes present flat, no leaking or bleeding.
For steroid coverage 1st dose was given and senior paediatrician was informed. Patient underwent caesarean section under GA and delivered a female child. The neonate weighed 1.13 kg. Liquor was absent and baby cried immediately after birth. APGAR at 1 and 5 min was 6 and 8. Cord blood gas was normal. Neonate was shifted to NICU due to respiratory distress on NIPPV and OG feed was started.
Postdelivery patient was shifted to ICU for intensive monitoring. On first day post partum blood pressure values of 178/116 mmhg was seen. Treatment with infusion labetalol at 2 ml/hr was given.
Blood investigations post delivery showed haemoglobin value of 6.6 g/dl, platelet count of 2,36,000 and urine albumin as 3+, renal and liver functions was normal. Magnesium sulphate infusion was continued at 1gm/hr in post partum period for 24 hours for eclampsia prophylaxis.
Bed side renal doppler was done and showed normal findings.
2D Echo was done which showed grade 1 left ventricular diastolic dysfunction for which patient was managed conservatively.
36 hours post partum neurological examination was normal and blood pressure maintained at 140/100 mmhg on infusion labetalol which was titrated according to blood pressure.
1 unit packed RBC was transfused.
NCCT brain was done, radiological picture suggestive of PRES syndrome.
On neurology consultation Injection Levipil 500 mg IV 8 hourly and Injection Midazolam 1ml/kg was started.
48 hours post partum blood pressure maintained at 140/ 90 mmhg on Tab Amlodipine 5 mg 12 hourly with Tab Nicardia 20 mg 8 hourly and adequate pain management.
On fifth day of delivery patient was shifted to PNC ward neurological examination was normal and blood pressure of 130/90 mmhg.
On 7th day she was discharged on oral anti hypertensives. Follow-up of MRI after 1 month from the event was completely normal. Neonate outcome was good.
Pathological examination of placenta revealed chronic hypoxia , fibrous stroma of chorionic villi.
PRES is a remarkably heterogenous disorder, the severity and extent of symptom depends upon the involved area of the brain, therefore recognizing various manifestations of PRES is important8
There are various medical causes or clinical entities associated with causation of PRES which include hypertensive encephalopathy, pre eclampsia, eclampsia, acute or chronic renal diseases, hemolytic uremic syndrome, use of cytotoxic and immunosuppressant drugs, blood transfusion, and electrolyte disturbances13. However the ones which predominate in the causation of PRES are pre eclampsia and eclampsia3. Pathogenesis of brain lesion till now have been explained by two theories. The first theory proposes that hypertension can cause abnormal cerebral vascular autonomic modulation which causes vasodilatation as blood increases, this is mediated by endothelium, which causes hyper perfusion within the white matter. The second theory suggests that hypertension causes activation of autoregulatory system which causes vasoconstriction and decreases perfusion which causes ischemia5
In some rare cases PRES had been identified in the patient with normal blood pressure. It can be due to endothelial activation as an immune response causing production of molecule which alter the normal homeostasis of blood brain barrier, fluid leakage and oedema occurs due to weakening of vessel tight junctions. This scenario describes hypertension as a secondary syndrome of the underlying mechanism and not the cause14
Diagnosis of PRES is usually done by computed tomography and MRI. In our cases hyperintensity cortico subcortical location of parieto occipital region was seen in T2W FLAIR MRI in two cases and hypodensity in occipital lobe on NNCT in two cases.
Early diagnosis of PRES and reduction of blood pressure and early initiation of therapy is necessary . Blood pressure and seizure control remains the mainstay of therapy. Aggressive blood pressure control is not advised, because this may reduce the blood pressure below the autoregulatory range and may lead to ischemic events15
Labetalol and nicardipine are the are the first line drug for
lowering blood pressure in PRES patients16. Magnesium sulphate therapy should be initiated as soon as eclampsia or PRES in pregnancy is suspected , as it treats seizures17.
The prognosis of PRES is good and 75% - 90 % of patients fully recover18
In our study, we discussed about four cases, three out of four women were nulliparous, one was in late second trimester and other three were is third trimester. All women were unbooked cases and presented as eclampsia and three women were intubated in emergency. All women underwent caesarean section under general anaesthesia out of which one had poor fetal outcome (died on day 6 due to refractory septic shock, Antecedent cause –extreme pre maturity and RDS) rest three had good fetal outcome.
On histopathological examination of placenta signs of chronic hypoxia and impaired placentation was seen, indicating presence of chronic disease that could have been diagnosed at earlier stages during routine checkups.
In this study four cases of PRES in antenatal women with eclampsia were presented.
All the women were unbooked and none of the women had undergone early screening for pre eclampsia, so effective pre eclampsia screening in first trimester is needed, based on combination of clinical, biophysical, biochemical markers and uterine artery doppler and would allow the administration of therapy to improve placentation and to reduce the risk of PRES as although PRES is reversible but also has potential for serious complication.
Funding : None.
Conflict of Interest : None.
1Hinchey J, Chaves C, Appignani B — A reversible posterior leukoencephalopathy syndrome. The New England Journal of Medicine 1996; 334(8): 494500, View at: Publisher Site | Google Scholar
2Onder AM, Lopez R, Teomete U — Posterior reversible encephalopathy syndrome in the pediatric renal population. Pediatric Nephrology 2007; 22(11): 1921-9. View at: Publisher Site | Google Scholar
3Kastrup O, Maschke M, Wanke I, Diener HC — Posterior reversible encephalopathy syndrome due to severe hypercalcemia. J Neurol 2002; 249: 1563-6. [PubMed] [Google Scholar]
4Ay H, Buonanno FS, Schaefer PW, Le DA, Wang B, Gonzalez RG, et al — Posterior leukoencephalopathy without severe hypertension: utility of diffusion-weighted MRI. Neurology 1998; 51: 1369–
76. [PubMed] [Google Scholar]
5Rho JD, Kim YH, Shin JH, Kim TK — Case report: A case of posterior reversible encephalopathy in postpartum preeclampsia. Medicine (Baltimore) 2023; 102(47): e36023. doi: 10.1097/ MD.0000000000036023. PMID: 38013383; PMCID: PMC10681536.
6Liman TG, Bohner G, Heuschmann PU — The clinical and radiological spectrum of posterior reversible encephalopathy syndrome: the retrospective Berlin preS study. J Neurol 2012; 259: 155–64.doi:10.1007/s00415011-6152-4 pmid:http:// www.ncbi.nlm.nih.gov/pubmed/21717193 CrossRefPubMedGoogle Scholar.
7Brewer J, Owens MY, Wallace K — Posterior reversible encephalopathy syndrome in 46 of 47 patients with eclampsia. Am J Obstet Gynecol 2013; 208: 468.e1–468.e6.doi:10.1016/j.ajog.2013.02.015 pmid:http://www .ncbi.nlm.nih.gov/pubmed/23395926 PubMedGoogle Scholar.
8Hinchey J, Chaves C, Appignani B, Breen J, Pao L, Wang A, et al A reversible posterior leukoencephalopathy syndrome. N Engl J Med 1996; 334: 494-500. [PubMed] [Google Scholar].
9Gestational hypertension and preeclampsia: ACOG Practice Bulletin, Number 222. Obstet Gynecol. 2020, 135:e237-e260. 10.1097/ AOG.0000000000003891.
10Verma AK, Garg RK, Pradeep Y — Posterior encephalopathy syndrome in women with eclampsia: predictors and outcome. Pregn Hypertens 2017; 10: 74-82. 10.1016/j.preghy.2017.06.004.
11Junewar V, Verma R, Sankhwar PL — Neuroimaging features and predictors of outcome in eclamptic encephalopathy: a prospective observational study. Am J Neuroradiol 2014; 35: 1728-34. 10.3174/ ajnr.A3923
12Fisher N, Saraf S, Egbert N, Homel P, Stein EG, Minkoff H — Clinical correlates of posterior reversible encephalopathy syndrome in pregnancy. J Clin Hypertens (Greenwich) 2016; 18: 522-7. 10.1111/ jch.12656.
13Stott VL, Hurrell MA, Anderson TJ — Reversible posterior leukoencephalopathy syndrome: a misnomer reviewed. Inter Med J 2005; 35(2): 83-90
14Marra A, Vargas M, Striano P, Del Guercio L, Buonanno P, Servillo G — Posterior reversible encephalopathy syndrome: The endothelial hypotheses. Medical Hypotheses 2014; 82(5): 619-22,ISSN 03069877,https://doi.org/10.1016/j.mehy.2014.02.022.
15Katwal S, Ghimire A, Bhusal A, Bajracharya A — Posterior reversible encephalopathy syndrome in postpartum patients with gestational hypertension: A case report emphasizing early recognition and management. Radiology Case Reports 2013; 18(12):
16[19]G Servillo, F Bifulco, E De Robertis, O Piazza, P Striano, F Tortora, et al — Posterior reversible encephalopathy syndrome in intensive care medicine. Intensive Care Med 2007; 33: 230-6.
17Striano P, Striano S, Tortora F, Robertis ED, Palumbo D, Elefante A, et al — Clinical spectrum and critical care management of posterior reversible encephalopathy syndrome (PRES). Med Sci Monit 2005; 11(11): CR549CR553.
18Roth C, Ferbert A — Posterior reversible encephalopathy syndrome: long-term follow-up. J Neurol Neurosurg Psychiatry; 81(7): 7737.Google Scholar
Manoj Seval1, Pankaj Kumar Jain2, Ravi Verma3, Datar Singh4
Abstract
Background : Haemoglobin D Iran variant is very rare in India, in heterozygous as well as homozygous forms. Here we report a 32 year old female who visited home clinic for day to day complaints of weakness and fatigue. On analysing the blood sample using High Performance Liquid Chromatography (HPLC), Haemoglobin A2 window displayed area percentage of 47.7%. As Hb D Iran elutes in the Hb A2 window, constituting usually more than 40% of the total Haemoglobin with a range of 40 to 48%, so it’s confirmed our diagnosis as Hb D Iran heterozygous.
Key words : Haemoglobinopathy, Hb D Iran, High Performance Liquid Chromatography, Haemoglobin Variant.
Haemoglobinopathies is a group of disorders in which there is abnormal production or structure of the Haemoglobin molecule. It’s passed down through families. Haemoglobin D is a rare form of Haemoglobinopathy in homozygous as well as heterozygous form.
Phenotypically Hb D Iran heterozygous present as a asymptomatic carrier state and genotypically it’s described as beta 22 – Glu-> Gin(GAA ->CAA). Haemoglobin D Iran first described in 1973 and found in Pakistani and Iranian families. In India it’s seen in north western regions, particularly in Punjab. The present case report describes a rare case of heterozygous Hb D Iran in 32 years old lady from Kota, Rajasthan.
We report a case where we unexpectedly found a young female patient to have Haemoglobin D Iran heterozygous. My patient was a 32-year-old Indian Hindu female, who visited home clinic with complaints of weakness and fatigue of long duration. On Clinical examination she looked pale but there was no history of chronic blood loss. Blood sample of patient collected and sent for complete blood counts and peripheral blood film detail study. Complete blood count was done using automated blood analyser. Finding of complete blood count and PBF detail study were suggestive of microcytic hypochromic anemia with Haemoglobin value of 6.8 gm%. The sample was further subjected to haemoglobin detection using High Performance Liquid Chromatography based haemoglobin typing system. The high performance liquid chromatography report displayed haemoglobin A2 window with variant percentage being 47.7% with retention time of 3.06 minute as shown in Fig 1.
After the diagnosis was made, it was conveyed to the patient
Department of Internal Medicine, Government Medical College, Kota, Rajasthan 324005
¹MD (Medicine), Senior Resident & Corresponding Author
²MD (Medicine), Professor & Unit Head
³MD (Medicine), Assistant Professor
4Junior Resident, Department of Internal Medicine
Received on : 30/04/2024
Accepted on : 25/07/2024
Editor's Comment :
Heterozygous Haemoglobin D Iran represents an asymptomatic carrier state; however, accurate identification is essential for appropriate genetic counseling and population screening, particularly in regions with higher prevalence. High Performance Liquid Chromatography (HPLC) is a useful initial screening modality, while molecular genetic analysis remains the definitive diagnostic gold standard.
and counselled regarding the condition and advised her to have her children screened for the same.
It was Itano in 1951 who first described a group of Haemoglobinopathy in a white family and classified it as Haemoglobin D (Hb D)1. After two decades in 1973 Rahbar independently found a substitution of Glutamic acid -> Glutamine (GAA -> CAA) at beta 22 and labelled it as haemoglobin D- Iran2
In our case, the retention time of the Variant Haemoglobin on HPLC (3.06 min)which was slightly differ with the finding of Joutovsky A, et al (3.49 min) but was quite distinct from the retention time of Hb A2 (3.63 min), Hb E (3.69 min) and Hb Lepore (3.37 min)3. In our HPLC instrument, there are separate window-D (for Hb D Punjab), window-S (for Hb S), window-C (for Hb C) but limitation of HPLC is that, it cannot differentiate between Haemoglobin D Iran, Haemoglobin A2, Hb Lepore and Hb E, as all of these Haemoglobin elutes in the same A2 window.
Various studies have reported that the quantity of Hb D Iran elating in the Hb A2 window in HPLC varies from 36.0 to 47.7% in a heterozygous condition while in compound heterozygous states the quantity varies between 47.3 to 94.4 %4-8. Similar to results of these studies, in our case also percentage area of eluting in the A2 window in HPLC was 47.7% which is suggestive this case as a heterozygous Hb D Iran.
Similar study done by Seema Rao, et al 9 reported mean percentage area of Hb D Iran (40.6%) which was close to value of our case (47.7%) made us suspect of Hb D Iran.
How to cite this article : An Indian Female with Heterozygous Haemoglobin D Iran : A Rare Haemoglobinopathy. Seval M, Jain PK, Verma R, Singh D. J Indian Med Assoc 2026; 124(1): 62-3.
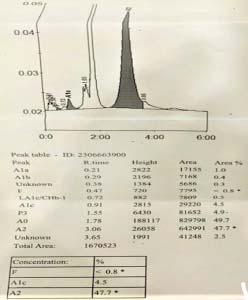
Fig 1 — Chromatogram of the patient
As per Bio Rad Library of abnormal Haemoglobin version 3, the abnormal Hb in A2 window is most likely due to Hb D Iran or Hb E, which elutes closely at that position. However, Hb D Iran was considered to be a better possibility in view of the amount of this abnormal Haemoglobin to be between 38 to 48%, similar to our case. In case of Hb E this percentage area may be between 22 to 36%.
Limitation of our study was that we could not perform DNA analysis for further confirmation of Hb D Iran as DNA analysis was too much costly and patient financial condition didn’t allow for that.
Although Hb D Iran heterozygous is an asymptomatic carrier state but diagnosis is necessary for research purposes as well pre-conceptional or neonatal screening programmes. Cation exchange High Performance Liquid Chromatography (HPLC) is emerging as a method of choice for the initial screening of such type of Haemoglobinopathies. However, gene sequencing still remains the gold standard and can be done for further study in this field.
Financial Support and Sponsorship : Nil
Conflict of interest : None
1Itano HA — A third abnormal haemoglobin associated with hereditary haemolytic anemia. Proc Natl Acad Sci USA 1951; 37(12): 775-84.
2Rahbar S — Haemoglobin D Iran: 2 22 glutamic acid leads to glutamine (B4). Br J Haematol 1973; 24(1): 31-5.
3Rohe RA, Sharma V, Ranney HM — Haemoglobin D Iran alpha A2 beta 22 2-Glu leads to GIn in association with thalassemia. Blood 1973; 42(3): 455-62.
4Serjeant B, Myerscough E, Serjeant GR, Higgs DR, Moo-Penn WF — Sickle cell-hemoglobin D Iran: benign sickle cell syndrome. Hemoglobin 1982; 6(1): 57-9.
5Gupta A, Saraf A, Dass J, Mehta M, Radhakrishnan N, Saxena R — Compound heterozygous hemoglobin D-Punjab/hemoglobinDIran: a novel hemoglobinopathy. Indian J Hematol Blood Transfus 2014; 30(Suppl.1): S409-S412.
6Bhat VS, Mandal AK, Mathew B — Co-inheritance of HbD(Iran)/ beta thalassemia IVS1-5(G > C) trait in a Punjabi lady with diabetes. Ind J Clin Biochem 2012; 27(2): 202-6.
7Agrawal MG, Bhanushali AA, Dedhia P, Jeswani KD, Dayanand S, Dasgupta A — Compound heterozygosity of Hb DIran (ß22Glu’!Gln) and ß0-thalassemia (619 bp-deletion) in India. Eur J Haematol 2007; 79(3): 248-50.
8Rohe RA, Sharma V, Ranney HM — Hemoglobin D Iran á2Aß2,22-Glu -> Gln in association with thalassemia. Blood 1973; 42(3): 455-62.
9Rao S, Kar R, Gupta SK, Chopra A, Saxena R — Spectrum of haemoglobinopathies diagnosed by cation exchange-HPLC & modulating effects of nutritional deficiency anaemias from north India. Indian J Med Res 2010; 132(5): 513-9.