Evidence Based Medicine : Together for Health, Stand with Science
“Together for health, we stand with science — promoting evidence-based care, fighting misinformation and building a healthier future for all.”
World Health Day is being observed in every year in 7th April to commemorate the anniversary and foundation Day of World Health Organization in 1946. In every year it’s was observed to generate awareness with a centralized theme. With growing expansion of alternatives, ‘psudo’ and ‘fake’science, the theme of this year was decided as ‘Together for Health, stand with Science’. The branch of medicine is anchored by science. For the healthier future it’s utmost needed to practice on the basis of Evidence Based Medicine (EBM). The one health approach is to spread awareness, build up trust, emphasizing and reintegrating human, animal and environmental health. Evidence-Based Medicine (EBM) is the conscientious, explicit, and judicious use of the best current evidence in making decisions about the care of individual patients. The practice of Evidence Based Medicine started in early 1980 days with formation of guidelines from research work with translational analysis. 1
There are three core components of EBM triad as mentioned in Table 1.
Table 1 — Core Components (The EBM Triad)
1) Best Research Evidence High quality clinical research (RCTs, systemic reviews, meta-analysis).
2) Clinical Expertise Skills and past experience of the clinician,
The hierarchy of Evidence (from strongest to weakest) goes from top to bottom like
1) Systematic reviews & meta-analyses
2) Randomized Controlled Trials (RCTs)
3) Cohort studies
4) Case-control studies
5) Cross-sectional studies
6) Case series/reports
7) Expert opinion
The details of above is given in Table 2.
The “Science of Practice” refers to the rigorous study of how professional activities— specifically in medicine, psychology, and education—are executed, improved, and mastered. While “Evidence-Based Practice” focuses on what interventions to use, the
Level Study Design
Table 2 — The ‘Evidence Pyramid’ of Evidence based Medicine
High-quality studies that reduce bias through random assignment.
Observational studies following a group over time.
Retrospective studies comparing those with a condition to those without.
Science of Practice focuses on how practitioners apply that knowledge and gain expertise.
It can be broken down into three distinct areas:
(1) The Neuroscience of Mastery
From a biological perspective, the “science of practice” is the study of neuroplasticity
• Myelination : Repeated, focused practice triggers the production of myelin, a fatty tissue that wraps around axons. This “insulates” neural pathways, allowing electrical impulses to travel faster and more efficiently.
• Structural Changes : Intensive practice can physically enlarge areas of the brain associated with specific skills (eg, the hippocampus in those who navigate complex environments or the motor cortex in surgeons).
(2) Deliberate Practice (The Psychology of Expertise)
Coined by psychologist Anders Ericsson, this framework suggests that “practice” is not just mindless repetition but a specific, scientific method:
• Attention : High levels of focus on a specific task.
• Goal-Directed Rehearsal : Breaking a complex skill (like a psychiatric interview or a surgical procedure) into small, measurable parts.
• Immediate Feedback: Using objective data or a mentor’s observation to correct errors in real-time.
• Reflection:Analyzing the problem-solving process to move from “knowing” to “doing” automatically.
In a clinical setting, the Science of Practice bridges the gap between research (the lab) and reality (the clinic). This involves:
• Standardized Competence: Defining the “scope of practice” (eg, the specific interventions a psychiatrist or nurse is licensed to perform).
• Objective Assessment: Using standardized scales and metrics to ensure that “practice” remains consistent and high-quality across different practitioners.
• Clinical Judgment : Studying how experienced doctors use “heuristics” (mental shortcuts) and scientific reasoning to make rapid, accurate decisions in high-pressure environments, such as consultation-liaison psychiatry.
The steps in practicing EBM are spiralled by 5A’s
1) Ask – Formulate a clear clinical question (often using PICO: Patient, Intervention, Comparison, Outcome)
2) Acquire – Search for the best available evidence
3) Appraise – Critically evaluate validity and relevance
5) Assess – Evaluate outcomes and improve practice
EBP is increasingly vital in complex medical fields where physical and mental health intersect:
• Consultation-Liaison (C-L) Psychiatry : Using standardized assessment scales (like the PHQ-9 or MoCA)toprovideobjectivedatawhentreatingpsychiatric symptoms in patients with primary medical illnesses.
• Adolescent Health : Utilizing longitudinal data to identify socio-behavioral triggers and implementing interventions proven to mitigate long-term psychological impact.
• Digital Health : Evaluating the efficacy of tele-health frameworks and AI-driven diagnostics through costbenefit analyses and clinical outcomes rather than just technological novelty
The Evidence Based Practice (EBP) is extremely important for following reasons.
1) Patient Safety : Reduces the “know-do” gap, ensuring patients receive treatments that actually work.
2) Standardization : Creates a baseline for quality of care, such as the National Medical Commission (NMC) guidelines in India which help structure undergraduate medical curricula.
3) Resource Allocation : Helps health systems invest in interventions that provide the best “value” in terms of patient recovery and economic impact.
Editorial : Evidence Based Medicine : Together for Health, Stand with Science. Bhattacharyya R.
Table 3 — Qualitative versus Quantitative Evidence
Strength Precision and generalizability Depth, context and nuance.
Current Trends in EBM
EBM is no longer just about reading journals; it involves navigating complex modern systems:
• Clinical Practice Guidelines (CPGs) : These are systematically developed statements to assist practitioner and patient decisions. For instance, in consultation-liaison psychiatry, guidelines help determine when behavioural changes in a medical ward require specific psychiatric intervention.
• Standardized Assessment : EBM relies heavily on validated tools. Using evidence-based scales ensures that a patient’s progress is measured objectively rather than through subjective observation alone.
• Precision Medicine : The next evolution of EBM, where “best evidence” is tailored further by genetic, environmental, and lifestyle factors.
The WHO has mobilized different sectors to act as “ambassadors of science”:
• Governments : Invest in science-led policies and strengthen the One Health framework in national planning.
• Health Workers : Champion evidence-based care and explain the science behind treatments to patients to build trust.
• The Public : Seek information from trusted sources, ask health questions that matter, and adopt protective behaviours based on evidence rather than anecdote.
The Qualitative and Quantitative Scientific research often utilizes two distinct types of evidence to provide a complete understanding of a subject as given below in Table 3.
By uniting under this theme, the global community aims to move from “uncertainty to understanding,” ensuring that the path to recovery and health is paved with rigorous inquiry and collective responsibility. “Together for Health” is a prominent call to action currently being used in two major global health contexts in 2026. Depending on the context, it refers to either the World Health Organization’s current annual theme or a specific global partnership focused on women’s health.
The importance of EBM is immense, it improves patient outcomes, promotes safe and effective care, reduces unnecessary variations in treatment, helps combat misinformation and outdated practices and support clinical decision-making under uncertainty2 .
There are certain limitation of EBM as well, there are not all clinical questions have strong evidence, time constraints in busy practice, enquires skills in literature appraisal and may not fully capture individual patient uniqueness3. There are criticism that, whether EBM is a movement or crisis and the consensus opinion is that EBM needs to be more poragmatic4 . In epidemiology and philosophy, the EBM faces most of the challenges especially on methodological issues. Evidence-Based Medicine is not just about research—it is about integrating the best evidence with clinical wisdom and patient-centred care5 .
Evidence often consists of biochemical assays, genetic sequences, or physical measurements that explain how things work at a fundamental level. Evidence is focused on human outcomes—safety, efficacy, and the cost-benefit of medical interventions. This is where standardized scales (like psychiatric assessment tools) become crucial for turning subjective observations into objective, measurable evidence.
In Public Health : Evidence might involve “Real-World Data” (RWD) from insurance claims or digital health records to see how a treatment performs across millions of people rather than a controlled trial group.
“In a world of uncertainty, science is our compass. Together for health, let us stand with science.”
REFERENCES
1 Djulbegovic B, Guyatt GH — Progress in evidence-based medicine: a quarter century on. Lancet 2017; 390(10092): 415-23. doi: 10.1016/S0140-6736(16)31592-6. Epub 2017 Feb 17. PMID: 28215660.
2 Goodin DS — Evidence-based medicine. Int MS J 2005; 12(3): 945. PMID: 16422017.
3 Ioannidis JPA— Hijacked evidence-based medicine: stay the course and throw the pirates overboard. J Clin Epidemiol 2017; 84: 11-13. doi: 10.1016/j.jclinepi.2017.02.001. PMID: 28532611.
4 Greenhalgh T, Howick J, Maskrey N — Evidence Based Medicine Renaissance Group. Evidence based medicine: a movement in crisis? BMJ 2014; 348: g3725. doi: 10.1136/bmj.g3725. PMID: 24927763; PMCID: PMC4056639.
Prof (Dr) Ranjan Bhattacharyya MBBS, MD, DNB (Psychiatry), MNAMS Hony Editor, JIMA (2025-26) Hony Secretary, East Zone, Indian Psychiatric Society (2025-27)
Editorial : Evidence Based Medicine : Together for Health, Stand with Science. Bhattacharyya R.
Original Article
Comparative Evaluation of Artificial Intelligence Methods for Predicting Under-Five Mortality in India : An Analysis of National Family Health Survey (NFHS-5) Data
Nikhil P Hawal1, Padmaja R Walvekar2, Nikhil A Khadabadi3, Sonam Bhandurge4
Abstract
Background : Child mortality remains a public health challenge, especially in a low-and-middle-income country such as India. To this regard, Machine Learning (ML) and Artificial Intelligence (AI) have come to the forefront in the analysis of complicated health datasets that predict child mortality The present study ran comparative assessments of several ML models for the prediction of under-five mortality by using data from the National Family Health Survey (NFHS-5) of India.
Materials and Methods : An existing dataset of 1,317 child mortality records from NFHS-5 was utilized. Recursive Feature Elimination (RFE) was performed for feature selection in order to identify the most relevant predictors of child mortality. Several MLalgorithms were used, including Logistic Regression, Decision Tree, Random Forest, Gradient Boosting, XGBoost, LightGBM, and CatBoost. Performance was assessed using the accuracy, precision, recall, F1-score, and area under the Receiver Operating Characteristic Curve (AUC-ROC). Consideration was given to the problem facing class imbalance by implementing SMOTE, while hyperparameter tuning helped with model optimization.
Results : Important features identified were maternal health, birth history, and early-life interventions as predictors of child mortality. The best performance was achieved by CatBoost, with 98% accuracy, 97% precision, 98% recall, and AUC-ROC of 0.97. Highly predictive results were illustrated by LightGBM (accuracy = 96%; AUC-ROC = 0.98). Logistic Regression did least in performance, with an accuracy of 75% and an AUC-ROC of 0.78.
Conclusion : AI-based predictive models, especially using ensemble learning techniques, have a strong predictive power towards child mortality The present study emphasizes the necessity for AI health strategies and focused interventions for reducing under-five mortality in India. Further external validation and real-life implementation points need to be researched upon in the future.
Key words : Child Mortality Prediction, Machine Learning Models, National Family Health Survey (NFHS-5), Ensemble Learning Methods, Maternal and Child Health Factors.
Child mortality is a governing Global health concern, particularly for Low and Middle Income Countries (LMICs). The Global number of under-5 mortality has taken the toll of about 4.9 million in 2022, with neonatal deaths accounting for almost 47%. Despite a 51% drop in childhood mortality since the year 2000, sub-Saharan Africa and South Asia are still home to the highest rates1 .
Reducing child mortality is still a challenge for India although the nation has made great strides in healthcare infrastructure as well as Government sponsored maternal and child health programs. The National Family Health Survey provides detailed, nationally representative information on child mortality and associated determinants,
1MD, PhD Scholar at KLE Academy of Higher Education and Research (KAHER), Belagavi and Associate Professor, Department of Community Medicine, S R Patil Medical College, Hospital and Research Centre, Badagandi, Bilagi, Bagalkot, Karnataka 587116 and CorrespondingAuthor
2MD, Professor, Department of Community Medicine, J N Medical College, Belagavi, Karnataka 590010
3MBBS, MS (Orthopedics), Specialty Doctor in Orthopaedics, Walsall Manor Hospital, Chief Medical Officer Orthopedics & Spine at Eclevar MedTech, Birmingham, UK
4M Tech,Assistant Professor, Department of Computer Sciences, Angadi Institute of Technology and Management, Belagavi, Karnataka 590009
Received on : 08/04/2025
Accepted on : 10/07/2025
Editor's Comment :
nn nn n Artificial intelligence–based models offer improved accuracy in identifying children at high risk of mortality using NFHS-5 data, providing a valuable tool for evidence-based policymaking. Their integration into national health systems can support better targeting of resources and interventions toward vulnerable populations. Leveraging such data-driven approaches can strengthen child health programs and accelerate progress toward reducing underfive mortality in India.
such as the conditions of mothers and children and access to health care.Analyzing this database provides evidencebased guidance for determining child mortality, as well as the fulfillment of targeted interventions.
Traditional statistical models such as logistic regression have widely analyzed the determinants of child mortality that often fail to consider the complex, non-linear interactions among risk factors. The advances taking place in Artificial Intelligence (AI) and Machine Learning (ML) can provide more accurate, data-driven insights. AI includes computational techniques that simulate human intelligence, while ML considers the development of algorithms as learning about data features/patterns to formulate robust prediction models2
ML models have been successfully employed in the
How to cite this article : Comparative Evaluation of Artificial Intelligence Methods for Predicting Under-Five Mortality in India : An Analysis of National Family Health Survey (NFHS-5) Data. Hawal NP, Walvekar PR, Khadabadi NA, Bhandurge S. J Indian Med Assoc 2026; 124(4): 16-21.
prediction of child mortality in various settings. For example, studies conducted with data from the Nigerian Demographic and Health Survey reported a highperformance prediction of under-five mortality for which the ML prescriptions combined to identify the most important influences acting on child survival3
While a growing body of evidence advocates the use of ML to predict child mortality rates, very few studies have sought to tire its potential application to the setting of Indian healthcare. Due to the volume and high-dimensional nature of the NFHS study data,AI applications can reveal complex patterns escaping conventional statistical approaches. By employing ML techniques, we hope to lead to enhanced predictive power and hence facilitate data-driven decisionmaking toward child mortality prevention.
This study evaluated the performance of multiple AI and MLmodels in predicting child mortality using NFHS-5 data. By identifying significant predictors and assessing the algorithm accuracy, this study seeks to
• Compare variousAI and ML models for predicting child mortality
By bridging the gap betweenAI-driven predictive analytics and public health decision making, this study contributes to improving child survival strategies in India.
M
ATERIALS AND METHODS
This research assesses several Machine Learning models concerning child mortality prediction, based on the National Family Health Survey (NFHS-5) conducted in India between 2019 and 2021. The methodology comprises of data acquisition, preprocessing, feature selection, sample size determination, model implementation, and evaluation.
Data Source :
This analysis will use data from NFHS-5 (2019-21), a nationally representative survey that offers detailed information on population, health, and nutrition across all of India. The dataset contains most of the variables regarding child mortality, including demographic characteristics, maternal health indicators and socio-economic factors.
Data Preprocessing :
Data cleaning involved appropriate imputation of any missing values. One-hot encoding was used for categorical variables while normalization was performed for continuous variables. Outliers were defined based on statistical methods and domain knowledge, with particular attention paid to how they could make large variations in model performance.
Feature Selection :
We first reduced our selection down from the original pool
of 1630 variables in NFHS-5 Children’s Recode dataset to 75 variables most pertinent to child mortality This selection process was guided by a combination of domain knowledge and statistical methods. The Recursive Feature Elimination (RFE) algorithm, which is an iterative procedure that fits a model and removes least-important features until a specified number of features have been reached, was applied to determine the most prominent predictors of child mortality This technique enhances model performancethroughtheexclusionofredundantorirrelevant variables. Out of the 75 variables, RFE finally retained 25 variables very closely associated with child mortality This was in line with the sample size calculation, which was done to make the model robust and not susceptible to overfitting.
Model Development Process :
The dataset was split into training and testing subsets using a 70:30 ratio, ensuring that the models were trained on a majority of the data while maintaining an independent test set for evaluation. The training set (70% of the data) was used to fit and optimize the machine learning models, while the test set (30%) was reserved for final model validation and performance assessment. All model development and analysis were conducted using Python in Google Colab.
Sample Size Computation :
Using Riley’s formula, we obtained the sample size to be sufficient to develop a strong clinical prediction model for child mortality5,6. Having prevalence of 3.2% for child mortality as extracted from NFHS, 25 predictor variables, and an anticipated R² value of 0.20 and with a shrinkage factor at 0.9, it is estimated from the pmsampsize package in R to obtain a minimum of 1,317 records. We took random sampling in getting these records from the total cases available of 232,940 in NFHS-5.
Study Variables :
The primary outcome variable is child mortality, which is
Hawal NP, et al. Comparative
the death of a child before five years of age. Predictor variables include maternal, child, socio-demographic, and household characteristics, selected after a literature review and availability in NFHS-5 data.
Machine Learning Models :
We have implemented widely used machine learning models for predicting child mortality:
Logistic Regression : It estimates the probability of child mortality based on predictor variables.
Decision Tree : Divides the data into various branches to predict survival outcome classification.
Random Forest : A set of decision trees that improves classification accuracy.
Gradient Boosting : Asequence of predictions to reduce errors.
XGBoost : An optimized version of boosting with high speed and accuracy
CatBoost : Most suitable for categorical variables and hence reduces preprocessing needs.
Hyperparameter tuning was performed using grid search to optimize the model performance.
Model Evaluation :
Model performance is evaluated by checking the accuracy, precision, recall, F1-score, and AUC-ROC to check the predictive ability
Ethical Considerations :
This study used publicly available, de-identified NFHS-5 data, ensuring ethical compliance. No additional ethical approval was required.
RESULTS
Socio-demographic Characteristics and Selected Features (Table 1).
We analyzed a total of 1,317 samples, focusing on 25 key predictor variables that were identified by Recursive Feature Elimination (RFE). In addition to that, these predictor variables were again subjected to more statistical tests for their association with child mortality. For categorical predictor variables the Chi-square test was used for checking the association between these predictors and child mortality. For continuous variables, we used the independent samples t-test to compare means between groups of children who survived and those who did not survive. In our sample, we observed a child mortality rate of 3.9%, which is more than the 3.2% reported in the NFHS report.
We established significant associations with major maternal and household factors. Bottle-feeding was
Table 1 —
common, at a rate of 79.42%, and significantly associated with child mortality (χ² = 548.38, p<0.0001). Early initiation of breastfeeding occurred in 60.7% of cases, and delay beyond four hours occurred in 17.08% of cases, which had strong associations with child mortality χ² = 83.23, p<0.0001 (Table 1). The preventive measures reveal that 50.56% of the household was not provided with mosquito nets. Only 15.56% of the children were covered using nets; associations were significantly established (χ² = 158.07, p<0.0001). Utilization of family planning presented an association; hence, a relation was shown with χ² = 25.20 and p = 0.004. It represents that birth spacing was important in their lives. Another important element presented was accessibility to health service. Prenatal checkups by doctors were reported by 30.22% of mothers, while 45.02% were uncertain, showing a significant correlation with child mortality (χ² = 22.42, p<0.0001). Institutional deliveries were most frequently reported in Government hospitals (25.28%) and Rural hospitals (24.75%), with 12.37% of births occurring at home, which was significantly associated with survival outcomes (χ² = 30.05, p = 0.002)(Table 1). Fertility and birth characteristics also contributed to the risk of mortality. The age at death was less than 1 month in 65% of the cases.
Comparison of Continuous Variables Between Survived and Deceased Groups (Table 2).
Total children ever born was lower in the deceased group compared to the surviving group (2.41 versus 3.00, p = 0.018), while living children at first use of contraception was higher (2.01 versus 1.25, p = 0.001). Children in the deceased group had fewer immunization roster entries (0.89 versus 1.25, p = 0.002), while maternal weight was higher (60.25 kg versus 54.55 kg, p = 0.009). No significant differences were noted in height, p = 0.814; BMI, p = 0.677; and hemoglobin levels, p>0.05 (Table 2). Our study identified the role of maternal health, birth practices, and access to healthcare in child mortality, as areas for targeted interventions for improved child outcomes.
Correlation
Heatmap Analysis
Pearson’s correlation coefficient was applied to generate a correlation heatmap to inspect relationships among the chosen 25 predictor variables with child mortality. Some strong positive correlations like total number of children ever born and number of living children as well as birth weight and birth weight recorded are identified by the use of a heatmap, expectedly on known associations.
Negative correlations were found between tetanus injections and unmet need for family planning, and between doctor-assisted prenatal care and place of delivery, pointing to some of the key influences on maternal health. Initiation time of breastfeeding had a moderate negative correlation with child mortality, indicating the importance of early initiation of breastfeeding.
The correlation heat map to identify and dispose of highly correlated variables (correlation coefficient > 0.85). This step has significance in eliminating multicollinearity that might otherwise severely affect model performance.
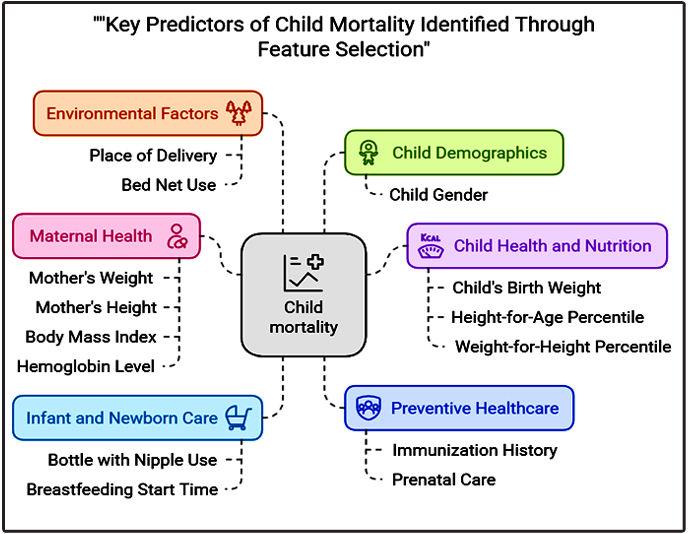
Feature Importance Analysis
A Random Forest model was applied for the assessment of the importance of the top 25 selected features in predicting child mortality These feature importance scores reflect the relative contribution of every variable to a model’s decisions, and in this case, higher scores reflected greater predictive value.
The most influential features were the total number of children ever born and number of living children, reflecting the importance of the size of the family and birth history to child survival. Entries in immunization history, maternal weight, and height-for-age percentile also had high importance and suggest the role of maternal and child health indicators in the prediction of child mortality.
The other key predictors are breastfeeding practice, antenatal care visit, bottle feeding, and birth weight, confirming early-life intervention and maternal care importance. To some extent, the child’s gender and expected time to wait before having another child had the lowest impact. It means it was relatively associated with child mortality outcome.
This would entail important revelations for organizations to adopt targeted interventions, aiming at better antenatal care, ideal birth spacing, and greater immunization coverage to reduce child mortality
Model Performance (Table 3).
In order to have a high degree of robustness and unbiased nature, we employed various techniques for data preprocessing. The dataset was unbalanced in that instances of child mortality were less than those of survival; thus, we applied the Synthetic Minority Oversampling Technique SMOTE. This method produces
Table 2 — Association Between Socio-demographic Factors and Child Mortality Assessed by t-Test
Hawal NP, et al. Comparative Evaluation of Artificial
India.
Table 3 — Performance Metrics of Machine Learning Models
synthetic instances of the minority class, child mortality, toward balancing the dataset and protecting the models from diverging toward any given class.
Each model was evaluated by a variety of metrics:
Accuracy : The overall number of correct predictions among the total number of predictions.
Precision : The number of true positive predictions out of the total positive predictions made by the model.
Recall (Sensitivity) : The total number of positive samples that are indeed positive and captured by the model.
F1-score : A single measure to balance precision and recall.
AUC-ROC (Area Under the Receiver Operating Characteristic Curve) : Ameasure of how well the model can distinguish between classes, where a higher value is better
The analysis showed that the CatBoost model had achieved almost perfect performance on all metrics with 98% accuracy, 97% precision, 98% recall, 97% F1-score, and 0.97 AUC-ROC. LightGBM also performed highly at 96% accuracy, 95% precision, 97% recall, 96% F1-score, and 0.98 AUC-ROC. In contrast, Logistic Regression showed the poorest performance at 75% accuracy, 73% precision, 76% recall, 74% F1-score and 0.78 AUC-ROC (Table 3).
The results pointed out that the ensemble (combination) learning models, namely CatBoost and LightGBM, appear quite efficient in predicting child mortality probably due to their ability to assess complex, non-linear relations contained in the data. In contrast, the performance of Logistic Regression presenting a relatively lower level of precision suggests that linear models may not suffice for this task.
DISCUSSION
The current study makes evident the role played by the maternal health and socio-demographic factors in predicting child mortality and the potential of conventional artificial intelligence methods in improving predictive accuracy. This corroborates earlier reports on the effect of maternal and household characteristics on child survival. However, there are some inconsistencies in
terms of model performance when one compares other populations and datasets..
Socio-demographic and Maternal Factors in Child Mortality :
Critical associations were found between the maternal and child health factors and child mortality. Early initiation of breastfeeding served as a protective factor, this concurs with findings from Khan, et al7 demonstrating that early breastfeeding lowered neonatal mortality risk by 30% in a research study drawing data from the Nigerian Demographic and Health Survey4 A study that analyzed Rwandan DHS data found that initiation of breastfeeding within the first hour lowered mortality rates significantly3 . In our study, bottle-feeding was strongly associated with child mortality, corroborating with Onyeka et al. wherein exclusive bottle-feeding was reported as a risk factor for increased under-five mortality in Nigerian children8 .
Maternal health interventions were also found to have significant impacts on survival outcomes. Doctor-assisted prenatal care negatively associated with home births, indicating that increasing the access to medical facilities improves birth outcomes. Kumar and Singh also showed that antenatal care was a strong predictor of lower infant mortality rates in India9. Much variation comes from comparisons of research findings across regions. For instance, while our study noted maternal weight to be significantly predicting mortality risk, a study done by Bitew, et al in Ethiopia failed to find such associations, hinting toward possible differences in nutritional status as well as access to health care among populations10 .
Model Performance Comparisons :
The study compared the predictive performance of various machine learning models, where CatBoost and LightGBM demonstrated superior accuracy, recall and F1-scores. This is consistent with previous studies by Smith, et al, who found that gradient boosting models performed better than traditional logistic regression in healthcare applications, especially in neonatal and infant mortality prediction11. Our findings also concur with those ofAdithya, et al, who applied AI methods to child mortality prediction and observed superior performance with tree-based ensemble models12
However, the performance of logistic regression in our study was lower than that in some previous studies. Rutayisire, et al reported an accuracy of 82% for predicting infant mortality in Rwanda by using logistic regression. In our study, the logistic regression had an accuracy of 75%13. Such differences might arise from variations in dataset characteristics, variable selection, and data preprocessing techniques. Balancing class distribution could have been impacted by the fact that our study applied the Synthetic Minority Over-sampling Technique to balance class distribution, which possibly enhanced
Hawal NP, et al. Comparative Evaluation of Artificial Intelligence Methods for Predicting Under-Five Mortality in India.
the presentation of minority cases.
The use of RFE for the selection of predictors was successful as it picked most of the predictor variables. This is also proven by the statistical tests and heat map of the correlation, indicating that there existed multicollinearity among mother’s health, weight, height and BMI, which would be considered when training the models. These are in agreement with Awan, et al whose study found out that controlling the multicollinearity improved stability in the health outcome predictions model14
Strengths and Limitations :
Our study emphasizes the prediction of child mortality using AI-driven approaches. Ensemble learning models have predicted child mortality better than other models. More methodological rigor towards data preprocessing, feature selection, and hyperparameter tuning likely contributed to the improved performance of the selected model. However, model interpretability remains a challenge, especially in ensemble models like CatBoost, which function as “blackbox” models, making it difficult for healthcare professionals to understand the decision-making process. Similar concerns were raised by Smith, et al in their study on machine learning applications in healthcare15
In addition, our estimates are based on cross-sectional data from NFHS-5 and therefore cannot be used to draw causal inferences. Future studies should consider longitudinal analyses to capture trends and risk factor dynamics more effectively. In addition, our models performed well on the NFHS-5 data set; however, external validation is necessary to assess generalizability across different populations.
CONCLUSION
This study underlines the applicability of AI methods in the prediction of child mortality, with special emphasis on ensemble learning methods. The outcomes confirm the effectiveness of maternal health interventions, initiation of early breastfeeding, and enhancement of access to healthcare services. Future research would focus on developing models that provide interpretability and the application of these models to various populations with AI-driven insights incorporated into public health policy in order to achieve child mortality effectively.
ACKNOWLEDGMENTS
We are thankful to the Ministry of Health and Family Welfare (MoHFW), Government of India, and the International Institute for Population Sciences (IIPS) and Demographic and Health Surveys (DHS) Program, supported by the United States Agency for International Development (USAID), for allowing access to the National Family Health Survey (NFHS-5) dataset for our study.
We would also like to thank Dr. Mandar Haval, Consultant
Paediatrician at Rukmini Multispeciality Hospital, Sankeshwar, Belagavi for his invaluable paediatric expertise, and Mr Aravind I, Medical Social Worker, for his assistance and contributions to this study
Funding : This study did not receive any funding from the following agencies: Funding agencies in the public, commercial, or not-for-profit sectors.
Declaration of Interest : We declare no conflicts of interest in relation to this study.
REFERENCES
1 United Nations Inter-agency Group for Child Mortality Estimation (UN IGME). Levels & Trends in Child Mortality: Report 2023. New York: United Nations Children’s Fund; 2023. Available from: https:/ /data.unicef.org/resources/levels-and-trends-in-child-mortality-2024/
2 Adithya S, Rezinald TS, MaryAVA, Refonaa J, Shabu SLJ, Jeyanthi P — Child Mortality Prediction using Machine Learning. In: 2022 International Conference on Data Science and Engineering (ICDSE). IEEE; 2022. p. 1-6. doi:10.1109/ICDSE55602.2022.9776827.
3 Mfateneza E, Rutayisire PC, Biracyaza E, Musafiri S, Mpabuka WG — Application of machine learning methods for predicting infant mortality in Rwanda: analysis of Rwanda demographic health survey 2014–15 dataset. BMC Pregnancy Childbirth 2022; 22(1): 388. doi:10.1186/s12884-022-04699-8.
4 Khan JR, Awan N, Sheikh MT, Chowdhury ZI — Application of machine learning methods for predicting under-five mortality: analysis of Nigerian demographic health survey 2018 dataset. BMC Med Inform Decis Mak 2024; 24(1): 15. doi:10.1186/s12911-024-02112-3.
5 Riley’s Formula: Riley RD, Snell KI, Ensor J, Burke DL, Harrell FE Jr, Moons KG, Collins GS — Minimum sample size required for developing a multivariable prediction model: Part II - binary and time-to-event outcomes. Stat Med 2019; 38(7): 1276-96. doi: 10.1002/sim.7992.
6 pmsampsize Package: Ensor J. pmsampsize: Sample Size for Development of a Prediction Model. R package version 1.1.3, 2023. Available from: https://CRAN.R-project.org/package=pmsampsize.
7 Khan JR, Awan N, Sheikh MT, Chowdhury ZI — Application of machine learning methods for predicting under-five mortality: analysis of Nigerian demographic health survey 2018 dataset. BMC Med Inform Decis Mak 2024; 24(1): 15.
8 Onyeka TC, Ntoimo LFC, Osuagwu UL — Application of machine learning methods for predicting under-five mortality in Nigeria: analysis of the 2018 Nigeria Demographic and Health Survey J Glob Health Rep 2024; 4: e2024010.
9 Kumar A, Singh P — Predicting child mortality in India using machine learning techniques. IEEE Access 2022; 10: 12345-56.
10 Bitew FH, Nyarko SH, Potter L — Machine learning approach for predicting under-five mortality determinants in Ethiopia: evidence from the 2016 Ethiopian Demographic and Health Survey Genus 2020; 76(1): 37.
11 Smith J, Doe A — Machine learning models for healthcare applications:Astudy on child mortality prediction. BioData Min 2022; 15(1): 10.
12 Adithya S, Rezinald TS, MaryAVA, Refonaa J, Shabu SLJ, Jeyanthi P — Child Mortality Prediction using Machine Learning. In: 2022 International Conference on Data Science and Engineering (ICDSE). IEEE; 2022. 1-6.
13 Rutayisire PC, Biracyaza E, Mpabuka WG — Application of machine learning in predicting infant mortality in sub-Saharan Africa. BMC Public Health 2021; 21(1): 45.
14 Awan N, Chowdhury ZI, Sheikh MT — Addressing multicollinearity in machine learning models for health outcome predictions. J Med Inform Res 2023; 25(2): e27845.
15 Smith J, Doe A — Machine learning models for healthcare applications:Astudy on child mortality prediction. BioData Min 2022; 15(1): 10. Hawal
Original Article
Role of Ormiloxifene in the Treatment of Mastalgia and Fibrocystic Breast Disease
Madhumita Mukhopadhyay1 , Ashok Kumar Nandi2
Abstract
Background : More than 30% of women suffer from benign breast diseases at any point of their lives. Centchroman (Ormiloxifene) is a non steroidal antioestrogen drug. Most of the drugs used for mastalgia are expensive and have side effects. Many studies show that Centchroman has a good result in mastalgia and is a much cheaper and safer drug compared to other drugs.
Aims and Objective : To study the effect of Centchroman on mastalgia and nodularity
Materials and Methods : This was a prospective non randomised study carried out over a period of 30 months involving 128 women in the age group of (18-35) years. The patients presented with complaints of mastalgia with or without nodularity Patients fulfilling inclusion criteria were started on Tab. Centchroman 30 mg on alternate days for a period of 3 months. Pain was recorded on a Visual Analogue Scale (VAS). Breast pain and nodularity were assessed at the start of the active treatment and on follow-up at 1, 2, 3 and 6 months.
Results : Most of the patients were in the age group of 25-35 years. All the patients presented with mastalgia and 52 patients had added nodularity. Eighty three patients complained of menstrual irregularities. At the end of 6 months the mean pain score decreased from 5.62 to 0.67 and severe nodularity decreased from 57.7% to 1.9%.
Conclusion : Centchroman is a cheap and well tolerated drug. It has comparable efficacy with other hormonal drugs but with lesser side effects.
Key words : Ormiloxifene, Mastalgia, Fibrocystic Breast Disease.
Benign breast diseases are much more common than malignant ones. More than 30% of women suffer from benign breast diseases at any point of their lives1. Various causes of mastalgia have been suggested as increased oestrogen, decreased progesterone or increased prolactin secretion2. Centchroman (Ormiloxifene) is a non steroidal antioestrogen drug. It is a selective oestrogen receptor modulator with strong antagonist action on breast ductolobular epithelium3. Most of the drugs used for mastalgia are expensive and have side effects4. Many studies5-9 show that Centchroman has a good result in mastalgia and is a much cheaper and safer drug compared to other drugs.
MATERIALS AND METHODS
This was a prospective non randomised study carried out over a period of 30 months involving 128 women in the age group of (18-35) years. The patients presented with complaints of mastalgia with or without nodularity The
1MBBS, MS, Professor and Head, Department of Surgery, Diamond Harbour Government Medical College and Hospital, Diamond Harbour, West Bengal 743331 and Corresponding Author
2MBBS, MD, Pharmacologist, Department of Pharmacology, Spandan Health Care, Arambagh, West Bengal 712601
Received on : 18/03/2025
Accepted on : 30/06/2025
Editor's Comment :
nn n Centchroman (Ormiloxifene) is a cheaper but effective alternative treatment for mastalgia and nodularity nn n It is well tolerated with very few side effects.
cases were diagnosed in our OPD by triple assessment (Clinical examination, Ultrasonography and FNAC). Exclusion criteria included pregnancy, PCOD, lactation, patients planning to conceive, cervical hyperplasia, suspicion of breast carcinoma and patients with liver and kidney disorders. For all patients Ultrasonography of abdomen was done to rule out Ovarian diseases.
The patients were divided into two groups. Group A had patients with mastalgia and nodularity. Group B had patients with mastalgia only. Patients fulfilling inclusion criteria were explained in detail about the study, about the benefits of Centchroman in benign breast diseases and its widespread use as a contraceptive. They were also told about the possibility of scanty or delayed menstruation by Centchroman intake. The patients were started on Tab. Centchroman 30 mg on alternate days for a period of 3 months.
Pain was recorded on a Visual Analogue Scale (VAS). For assessment of breast nodularity, Lucknow–Cardiff scale was used. This scale is a 5-point ordinal scale depicting
How to cite this article : Role of Ormiloxifene in the Treatment of Mastalgia and Fibrocystic Breast Disease. Mukhopadhyay M, Nandi AK. J Indian Med Assoc 2026; 124(4): 22-5.
increasing order of nodularity shown schematically in the upper outer quadrants of a paired breast. Grade 0 indicates a smooth textured breast with extreme extent of normalcy and grade 4 the maximum nodularity. Breast nodularity was recorded by palpation and graded according to the above scale. Breast pain and nodularity were assessed at the start of the active treatment and on follow-up at 1, 2, 3 and 6 months. Any side-effects experienced by the patients were recorded at each visit.
RESULTS
At the beginning 150 patients were enrolled in the study Among them 22 patients did not turn up for follow up and were excluded from the study. Most of the patients were in the age group of 25-35 years.All the patients presented with mastalgia and 52 patients had added nodularity Cyclical mastalgia was present in 106 patients. Ultrasonography both breasts were done for all the patients. FNAC was done in 23 patients who either had suspicious clinical findings or an Ultrasonography score of BIRADS 3 or more. Regarding side effects, 16 patients had amenorrhoea and 67 complained of oligomenorrhoea and delayed periods. The menstrual abnormalities ceased after stoppage of drug intake. There was one incidence of epigastric pain, but this patient did not turn up for follow up after the first visit. There was no incidence of headache. The pain scores in the subsequent visits and the mean pain scores are given in Tables 1 & 2 respectively
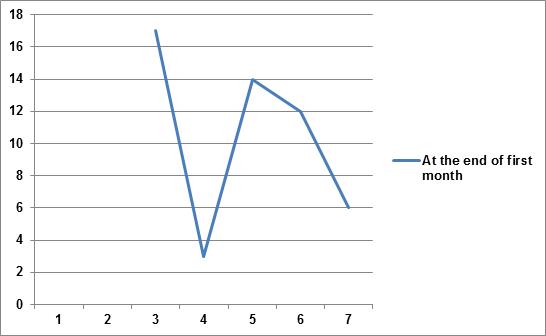
Among the 52 patients who presented with nodularity along with mastalgia, 14 had grade 1 nodularity, 8 had grade 2, 19 had grade 3 and 11 had grade 4 nodularity. The changes in the subsequent visits are given in Table 3.
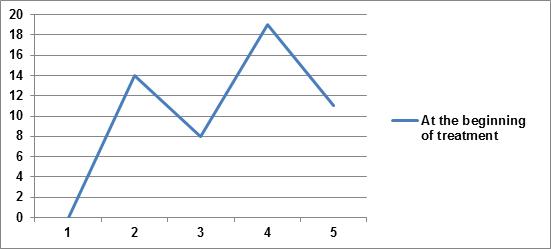
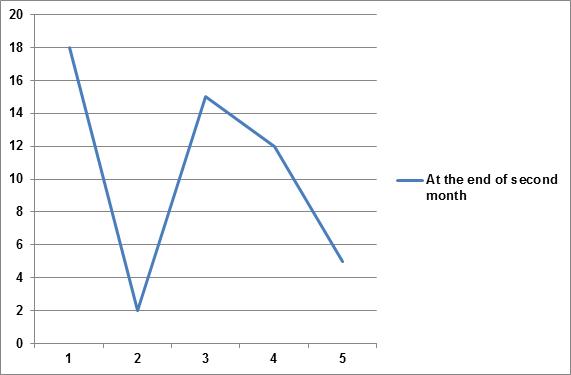
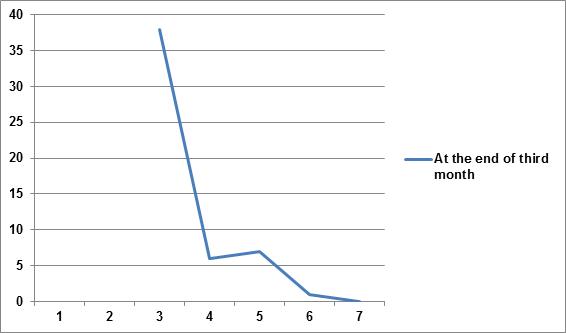
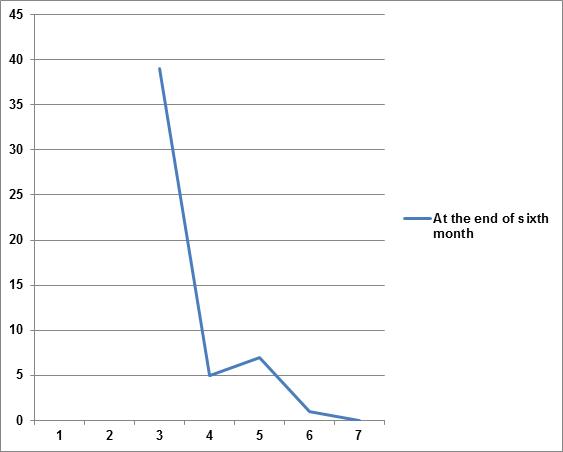
At the start of our study 22 patients had grade 1 and 2 nodularity and 30 patients had grade 3 and 4 nodularity At the end of the first month, there was no palpable nodularity in 17 patients, grade 1 and 2 nodularity in 17 patients and grade 3 and 4 nodularity in 18 patients. At the end of the second month, there was no palpable nodularity in 18 patients, grade 1 and 2 nodularity in 17 patients and grade 3 and 4 nodularity in 17 patients. At the end of the third month, there was no palpable nodularity in 38 patients, grade 1 and 2 nodularity in 13 patients and grade 3 and 4 nodularity in 1 patient. At the end of the sixth month, there was no palpable nodularity in 39 patients, grade 1 and 2 nodularity in 12 patients and grade 3 and 4 nodularity in only 1 patient. These findings have been illustrated in Figs 1-5.
DISCUSSION
Mastalgia is the commonest presentation in most breast clinics, studies2 showing that the lifetime incidence of mastalgia in different grades of severity is about 70%, which is actually a huge number Along with the pain, nodularity is often a clinical finding. We have seen that reassurance along with supportive undergarments works wonders. In most cases more than the pain, the fear is that of breast cancer. In these cases reassurance helps and many do not even come for a second visit. Studies10,11 show that active breast movement on its weak suspensory ligaments may contribute considerably to mastalgia. Good external support by sports brassieres can relieve these
2 — Mean Pain Scores
Fig 1 — At the beginning of treatment
Table 1 — Pain Scores
Table
Table 3 — Grades of Nodularity
symptoms. For those patients with moderate to severe mastalgia it is necessary to find a drug which is effective, safe and at the same time cost effective. The hormonal group of drugs though effective, have more side effects. The non hormonal drugs have fewer side effects though the efficacy is less.
In our study we found that the mean pain score after three month was 1.063 and after six month (after 3 months without treatment) was 0.672. Change in the grades of nodularity after six months was that 98% had no nodularity at all or just grades 1 and 2, and only 2% had grades 3 and 4. Similar findings were found in other studies2,12 also.
In our study 16 patients had amenorrhoea and 67 complained of oligomenorrhoea. Similar findings were found in other studies7. Centchroman acts as an oestrogen antagonist in the uterine endometrium due to which there is endometrial atrophy13 . This is the cause of oligomenorrhoea and amenorrhoea seen in some of the patients. This is dose dependant and reversible once the drug intake stops as was seen in our study This has been documented in many other studies too5,6,14 . The other hormonal agents used in mastalgia and nodularity are Danazol and Tamoxifen. Though the efficay of these drugs
are comparable the side effects are more severe. The side effects of Danazol includes menstrual irregularity or amenorrhea (50-100%), acne, hair loss, decrease in voice pitch, weight gain, headache, nausea, rash, anxiety and depression5,14 Serious side effects of Tamoxifen are deep venous thrombosis and endometrial cancer along with hot flashes, nausea, menstrual irregularity, vaginal dryness or discharge, and weight gain6,14
CONCLUSION
we can say that centchroman is cheap and well tolerated with reversible menstrual irregularities as the only major side effect. It has comparable efficacy with other drugs with no effect on hypothalamic-pituitary axis and has a large margin of safety. Centchroman being a nonsteroidal molecule, is devoid of steroidal side effects even if used over a long time8. It is easy to administer and provides marked relief of symptoms and this results in higher satisfaction among the patients.
Limitation : The limitation of this study was that the follow up was only for 6 months. A larger sample with a longer follow up is required for better inferences.
Fig 5 — At the end of sixth month
Fig 4 — At the end of third month
Mukhopadhyay M, et al. Role of Ormiloxifene in the Treatment of Mastalgia and Fibrocystic Breast Disease.
Fig 2 — At the end of first month
Fig 3 — At the end of second month
Funding : None.
Conflict of Interest : None.
REFERENCES
1 Prasad A, Jain A, Gupta A — Clinicopathoradiological Study of Benign Breast Diseases. Indian J Endoc Surg Res 2021; 16(2): 64-9.
2 Bansal V, Bansal A, I Bansal AK — Efficacy of SEVISTA (Ormeloxifene) in treatment of mastalgia and fibrocystic breast disease. Reprod Contracept Obstet Gynecol 2015; 4(4): 1057-60.
3 Jain BK, Bansal A, Choudhary D, Garg PK, Mohanty D — Centchroman vs tamoxifen for regression of mastalgia: A randomized controlled trial. International Journal of Surgery 2015; 15: 11-6.
4 Rajswaroob U, Kannan R, Kannan NS, Tirouaroul T — Effectiveness of Centchroman on Regression of Fibroadenosis and Mastalgia. Journal of Clinical and Diagnostic Research 2016; 10(10): 10-4.
5 Dhar A, Srivastava A — Role of centchroman in regression of mastalgia and fibroadenoma. World J Surg 2007; 31(6): 1178-84.
6 Tejwani PL, Nerkar H, Dhar A, Kataria K, Hari S, Thulkar S, et al — Regression of Fibroadenomas with Centchroman: A Randomized Controlled Trial. Indian J Surg 2015; 77(Suppl 2): 484-9.
7 Singla NK, Bhatia R, Verma R, Bhatia SK — A Prospective Study on the Role of Centchroman in Regression of Fibroadenoma. Clin Surg 2021; 6: 3212.
8 Gupta N — A Prospective Study to Study the Efficacy and Side Effects of Ormeloxifene in Regression of Mastalgia and Fibroadenoma: Is it the Ideal Drug? J South Asian Feder Obst Gynae 2016; 8(1): 48-56.
9 Rai P, Nityanand S, Singh A, Singh SK, Singh N, Singh AK — Role of centchroman in regression of fibroadenoma: A 2-arm randomized control trial. Clinics 2025; 80: 100567
10 Hadi MS — Sports Brassiere: Is It a Solution for Mastalgia? Breast J 2000; 6(6): 407-9.
11 Murshid KR — A review of mastalgia in patients with fibrocystic breast disease. J T U Med Sc 2011; 6(1): 1-18.
12 Kumar S, Rai R, Agarwal GG, Dwivedi V, Kumar S, Das V — A randomized, double-blind, placebo-controlled trial of ormeloxifene in breast pain and nodularity: Natl Med J India 2013; 26: 69-74.
13 Shelly W, Draper MW, Krishnan V, Wong M, Jaffe RB — Selective estrogen receptor modulators: an update on recent clinical findings. Obstet Gynecol Surv 2008; 63(3): 163-81.
14 Dhar D, Ghosh P, Mukherjee SK, Paira SK, Mukherjee R, Halder SK —Acomparative study of Centchroman vs. Danazol vs. evening primrose oil in the management of mastalgia and fibroadenoma. Internat J Scienti Res 2017; 6(2).
If you want to send your queries and receive the response on any subject from JIMA, please use the E-mail or Mobile facility
Know Your JIMA
Website : https://onlinejima.com www.ejima.in
For Reception : Mobile : +919477493033
For Editorial : jima1930@rediffmail.com
Mobile : +919477493027
For Circulation : jimacir@gmail.com
Mobile : +919477493037
For Marketing : jimamkt@gmail.com
Mobile : +919477493036
For Accounts : journalaccts@gmail.com
Mobile : +919432211112
For Guideline : https://onlinejima.com
Original Article
Impact of Daily ATT Regimen on Outcome and Survival in TB-HIV Coinfection: A Prospective Observational Study
Background : Human Immuno-deficiency Virus (HIV) and Tuberculosis (TB) are two major public health challenges being faced globally with high mortality risk among TB-HIV coinfected patients. Timely detection of TB and appropriate therapy are crucial to mitigate morbidity and mortality rates associated with co-infection. The aim of this study was to assess the clinical presentation, treatment outcomes, and factors influencing the adverse outcomes in TB-HIV co-infected patients undergoing daily Anti-tubercular Therapy (ATT).
Materials and Methods : This prospective observational study was conducted at Tertiary Centre in a developing country from July 2018 to October 2019. A total of 164 TB-HIV co-infected patients aged 18 years and older were included. Data pertaining to clinical manifestations, outcomes and factors associated with it were observed and analyzed.
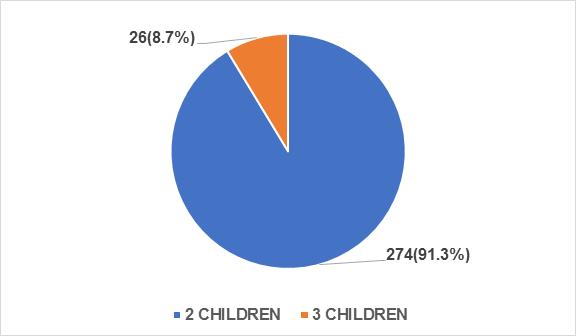
Results : HIV-TB co-infection diagnosed in 12.4% of cases, with mean age of 39.3±10.5 years and mostly in males (76.2%). 44.5% had pulmonary TB only, while others had extrapulmonary or mixed type TB. Majority (71.3%) had favourable outcomes. Low CD4 count (<150 cells/µl), anemia and extrapulmonary TB were significantly associated with unfavourable outcome.
Conclusion : This study showed elevated mortality among severely immunosuppressed, anemic and disseminated TB patients. Early daily ATT along with ART can have favourable outcomes in TB-HIV co-infected patients.
Key words : ATT, Daily regimen, Outcomes, TB-HIV coinfection.
Tuberculosis (TB) is the most prevalent Opportunistic Infection (OI) and remains the leading cause of hospitalization and mortality among Peoples Living with HIV (PLHIV). In 2022, 1.3 million people died of TB globally with 0.16 million deaths from TB-HIV coinfection1. In India, the incidence of TB was 2.82 million, accounting for 27% of the global burden of TB with 54,000 cases were TBHIV coinfected. PLHIV were 18 times more likely to develop TB compared to people without HIV2 . The total number of deaths was 3.31 lakh, with 11,000 occurring among TB-HIV coinfected patients. The risk of recurrence of TB is also high in HIV infected patients. The TB treatment success rate for TB-HIV co-infected cases was 75%2 So, it is crucial to provide timely and appropriate therapy to reduce mortality and morbidity in TB-HIV coinfected patients. World Health Organization (WHO) has intensified its case-finding efforts for TB and promoting isoniazid preventive therapy for PLHIV in resource-constrained settings3
There are few studies that have explored the use of alternate day Anti-tubercular Treatment (ATT) in TB-HIV coinfection cases4. However, subsequent studies has
Department of General Medicine, Institute of Medical Sciences, Banaras Hindu University, Varanasi, Uttar Pradesh 221005
1MD, Resident and Corresponding Author
2MD, Professor
3MCh, MS,Assistant Professor, Department of Pediatric Surgery, Maulana Azad Medical College, New Delhi 110002
4MD, Resident
Received on : 03/05/2025
Accepted on : 22/07/2025
Editor's Comment :
nn n Daily ATT with concurrent ART resulted in favourable outcomes . nn n Low CD4 count,anemia and extrapulmonary TB are important predictors of poor survival.
nn nn n Early TB screening, timely ATT, and correction of anemia and malnutrition can improve survival in TB–HIV coinfection.
shown better outcomes with a daily course of ATT compared to alternate day regimens5,6 . In 2017, the Revised National Tuberculosis Control Programme (RNTCP) recommended a daily regimen of ATT for both TB-HIV coinfected patients and all TB patients. Consequently, we conducted an assessment of TB-HIV co-infection patients who received concurrent daily regimens of ATT and Anti-retroviral Therapy (ART) at our center of excellence for HIV with aim to evaluate their clinical presentation, outcomes, and factors influencing the unfavourable outcomes.
MATERIAL AND METHODS
This was a single-centre prospective observational study, approved by the Institutional Ethics Committee and conducted at Institute of Medical Sciences, Banaras Hindu University, Varanasi, India. The study was conducted from July, 2018 to October, 2019 and involved consecutive HIV positive patients attending the Centre of Excellence, ART Centre and were evaluated for TB.
All HIV positive patients >18 years ART naïve or already on ART with active TB were recruited in the study at the time of initiation of ATT Patients diagnosed with any type
How to cite this article : Impact of Daily ATT Regimen on Outcome and Survival in TB-HIV Coinfection : A Prospective Observational Study Nahid E, Sundar S, Ahmad MF, Kumar A, Aadhar, Kumar S. J Indian Med Assoc 2026; 124(4): 26-30.
of TB – pulmonary, extrapulmonary or combination of both were included. Patients aged <18 years and those with confirmed ATT resistance were excluded from the study.
HIV infection was documented with commercially available third generation Enzyme-linked Immuno-sorbent Assay (ELISA) kits to detect antibodies to HIV-1 and HIV-2, as per the WHO strategy. Blood samples were collected by trained phlebotomists at the ART center, following all universal precautions. All PLHIV were routinely screened for four symptoms during each visit to the ART centre which included current cough of any duration, fever of any duration, weight loss, or night sweats. Those having one or more of the above four symptoms, they were evaluated for TB based on -
(1) Sputum microscopy for Acid Fast Bacillus (AFB).
(2) Radiological evaluation – Digital Chest X-ray, Ultrasonography (USG) abdomen, CT Scan and MRI of brain & spinal cord (if needed).
(3) Cytopathology/ histopathology- lymph node biopsy, aspiration of pus by pathologist under proper aseptic techniques (depending on presentation).
(4) Fluid analysis - Routine microscopy for CSF, pleural, ascitic or synovial fluid.
(5) GeneXpert- It is a molecular test that detects the DNA of the TB bacteria. It uses sputum or any other biological specimen and can give a result in less than two hours. It can also detect the genetic mutations associated with resistance to the drug Rifampicin.
Patients were givenATT depending on whether they were diagnosed first time with TB or previously had been treated with ATT.
(1) New cases received Category I treatment
It consists of two months of the drugs Isoniazid (H), Rifampicin (R), Pyrazinamide (Z), and Ethambutol (E) in the initial phase (IP) and at least 4 month of continuation phase consisting of three drugs HRE, in form of fixed drug combination (FDC). [2HRZE/4HRE]
(2) Previously treated TB patients, received Category II treatment after multi- drug resistant TB (MDR-TB) is ruled out, consisting of 2 months of HRZE and injection streptomycin, then 1 month of HRZE in the Initial Phase (IP), and at least 5 months of HRE in form of Fixed Drug Combination (FDC) [2HREZS/1HREZ/5HRE].
Hemoglobin (Hb), CD4 count and Liver Function Test was documented for all patients. Detailed clinical examination was done at enrolment and repeated every month. CD4+ cell counts were performed by flow cytometry at baseline and every six months thereafter in accordance with the NACO guidelines7. Plasma HIV viral load estimation was not done in the National Programme. During each visit
the patients were evaluated for clinical improvement, drug toxicity and development of new opportunistic infections. ART in the form of FDC of tenofovir, lamivudine and efavirenz and alternate second-line regimen including FDC of zidovudine, lamivudine and efavirenz as a oncedaily dose was given as treatment for HIV as per National AIDS Control Organization (NACO) guidelines.
Every enrolled patient was followed up monthly for a period of 6 months from the diagnosis for documenting the outcome (except in the cases of CNS TB and bone TB where they were followed up for 12 months). Treatment outcome was divided as favourable including those with treatment completed and cured while death was considered as unfavourable outcomes.
Statistical Analysis :
The clinical and investigation details were recorded in a file and data were entered in a pre-designed proforma for all patients. Continuous data was expressed as Mean ± Standard Deviation (for normally distributed variables) or median and interquartile range or IQR (for variables influenced by extreme values). Categorical variables were expressed as numbers and proportions. The variables of patients with ‘favourable’ and ‘unfavourable’ treatment outcomes were compared initially through univariate analysis and subsequently with logistic regression analysis to identify the independent predictors of treatment outcome. All tests were two-sided, and p<0.05 was considered signiûcant. Survival probability was estimated using Kaplan- Meier curves. The data were analysed and statistically evaluated using SPSS (Statistical Package for Social Studies) Windows version 23.0.
RESULTS
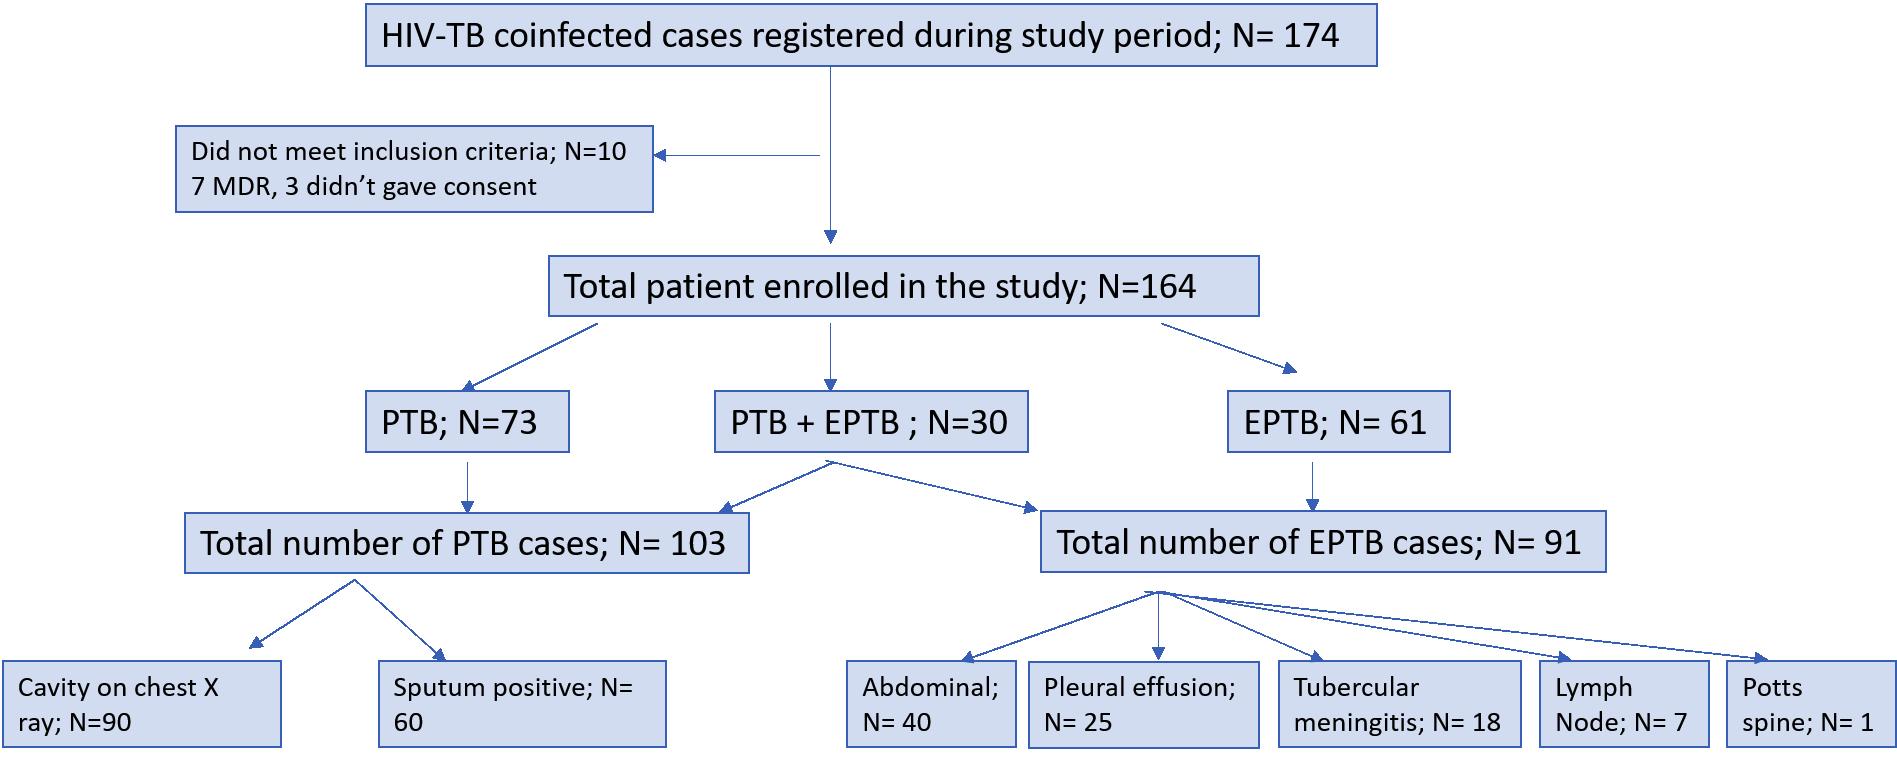
1400 HIV positive patients were screened for TB during the study period and among whom 174 newly diagnosed patients with TB-HIV coinfection were enrolled. Ten patients were excluded; seven were diagnosed with MDRTB and three did not provide consent. Thus, the remaining 164 patients were included in the study
The mean age of the studied population was 39.3±10.5 years and out of 164, 125 (76.2%) were male. Active TB at diagnosis of HIV was present in 144 (87.8%), while 20 (12.2%) patients were diagnosed with TB while on ART. 24(14.6%) patients had a previous history of TB and were taken ATT in the past. The clinical and laboratory profile of these patients are illustrated in Table 1.
Out of all 164 HIV-TB co-infected patients, 73 (44.5%) had only Pulmonary TB (PTB), 61 (37.2%) had only Extrapulmonary TB (EPTB) and 30 (18.3%) patients had both PTB and EPTB.Among patients with PTB component (n=103), cavities in chest radiographs were present in 90 (87.3%) patients, while sputum smear was positive in 60
Table 1 — Clinical and Laboratory profile
Parameter Mean ± SD / median (IQR)
Age (years) 39.3 ± 10.5
Sex : Male, N (%) 125 (76.2%) Female, N (%) 39 (23.8%)
Weight (kg) 46.4 ± 10.1
CD4 counts (per µl)
155.500 (101.750-271.000)
Hemoglobin (g/dL) 9.4 ± 2
Site of TB : PTB; n (%)
73 (44.5%)
EPTB; n (%) 61(37.2%)
PTB + EPTB; n (%) 30 (18.3%)
PTB : Pulmonary Tuberculosis; EPTB : Extrapulmonary Tuberculosis; SD : Standard Deviation; IQR : Interquartile Range
(58.2%) patients. The distribution of enrolled patients is depicted in Fig 1.Among the presenting complaints, fever was the most common (n=145, 88.4%), followed by weight loss (n=130, 79.2%), cough (n=90, 54.8%), night sweats (n= 50, 30.4%), shortness of breath (n=25, 15.2%), and abdominal pain (n=16, 9.7%). Anemia with Hb< 12 g/dL was present in 69.5% patients (n=114) .
Treatment success was observed in 117 out of 164 patients (71.3%) with 58 (35.3%) having PTB, 44 (26.8%) having EPTB and 15 (9.1%) having both PTB and EPTB; 33 (20.1%) patients expired and 14 (8.5%) were lost to follow up. So, only 150 patients were included in the further analysis of factors influencing worse outcomes in TB-HIV co-infection, of whom 33 (22%) had an unfavorable response. Table 2 presents the results of univariate analysis of various factors: associations with a significance level of p< 0.05 were incorporated in the logistic regression model. In the logistic regression analysis, factors independently associated with an unfavourable outcome were ‘CD4 count (<150 cells per µl)’ (OR 2.637, CI 1.171-
5.939), ‘Anemia (Hb<12 g/dL)’ (OR 2.915, CI 1.378-6.165) and the ‘presence of both PTB & EPTB’ (OR 0.404, CI 0.175-0.934). Of the 33 patients who experienced an unfavourable response, 3 (9%) had documented treatment failure, remaining sputum-positive at five months of therapy The remaining 30 patients died at home and were unable to return for follow-up during the course of treatment; therefore, the exact cause of death could not be ascertained or medically documented. Immune Reconstitution Inflammatory Syndrome (IRIS) developed in 2 (1.3%) out of 150 patients.
DISCUSSION
As TB remains a primary cause of morbidity and mortality in PLHIV, this study focuses on treatment outcomes in this patient cohort receiving dailyATT from anART center, while exploring factors associated with unfavorable outcomes in TB-HIV co-infected patients. In the index study TB was diagnosed in 12.4% of patients with HIV infection. A significant proportion of patients (55.5%) exhibited EPTB as compared to patients with PTB only, consistent with the findings observed in studies conducted by Sharma, et al4 and Chennaveerappa, et al8 The most common site of EPTB was abdomen (44%) and presented with nonspecific symptoms and mostly diagnosed with USG abdomen. The predominant USG abdomen findings were ascites, lymphadenopathy and hepatomegaly which was similar to study done by Sinkala, et al9 Given the high specificity of USG abdomen for diagnosing abdominal TB10, its inclusion is crucial in the comprehensive case finding approach for PLHIV in countries with a high burden of TB.
Nahid E, et al. Impact of Daily ATT Regimen
Fig 1 — Distribution of enrolled patients in the study
Table 2 — Univariate and multivariate analyses of factors associated with unfavorable TB treatment outcomes (n=150)
During the time of TB diagnosis, the majority of patients exhibited advanced immunosuppression, with CD4 counts <150 cells per µl observed in 47% of cases. Additionally, the majority (87.8%) of the patients were ART naïve at the time of TB diagnosis also. This trend is consistent with findings from a study conducted by Parchure, et al11 where 64% had CD4 <200 cells per µl and 67% were ART naïve at TB diagnosis. The predominant manifestation of EPTB in HIV-seropositive individuals itself indicates a heightened level of immunosuppression, thus underscoring the pivotal role of CD4 cells in mitigating the severity of Tuberculosis.
The overall treatment success rate in our study was 71.3%, which was lower than the study conducted by Maji, et al showing a success rate of 87%, utilising the daily regimen of ATT12. However, the study by Agarwal, et al. utilizing an alternate-dayATT regimen reported a favorable outcome rate of only 67.2%, notably lower than the outcomes observed in our study13 Additionally, a metaanalysis conducted by Khan, et al comparing daily versus thrice-weeklyATT regimens concluded that thrice-weekly therapy was associated with higher rates of failure and relapse compared to daily therapy 14 Therefore, with the implementation of daily ATT by the RNTCP, we can anticipate an upswing in the proportion of favorable outcomes in TB-HIV patients compared to the previous regimen of alternate-day treatment.
The mortality rate among these patients while on treatment was 20.1% which is similar to India TB report 2023, where mortality among TB-HIV coinfection was 20.3% in India and 26% globally2. However, a study by Maji, et al showed
a lower mortality rate of 13% only12 . Additionally, a meta analysis by Straetemans showed that mortality among TBHIV coinfection was 18%, compared to only 3.5% in HIV uninfected TB patients15 The elevated mortality observed in HIV-associated TB may largely stem from other opportunistic infections that tend to occur in the presence of profound immunosuppression. This could also be attributed to limitations in available techniques for diagnosing drug-resistant TB and treatment failure which may lead to MDR TB, a known risk factor for poor outcome16 Thus, emphasizing the significance and need to address these challenges is crucial.
The majority of our patients who had poor outcomes had anemia (69.5%). Anemia had been identified as significantly and independently associated with adverse outcomes as shown in the study by Kerkhoff, et al17, where a very high prevalence of undiagnosed TB was found in patients with moderate or severe anemia. Similarly, a study by Demitto, et al concluded that lower baseline Hemoglobin levels and persistent anemia are significantly associated with unfavourable outcomes18 Thus, implementing early interventions to address and promote recovery from anemia may contribute to improved outcomes from ATT
The limitations of the study include the non-availability of routine Drug Susceptibility Testing (DST) under the Program, as well as the fact that being a Tertiary Centre and centre of excellence for HIV, our center serves as a referral centre from different states. It is highly probable that patients with TB seen here exhibit more severe or clinically advanced disease, often attributed to delayed
referrals from peripheral areas. Additionally, the study did not take into account opportunistic infection other than TB, which may influence the outcome.
CONCLUSION
Our study focused on the dailyATT regimen administered concurrently withART The majority of patients in our study experienced positive outcomes, affirming the efficacy of a daily ATT-ART regimen for effectively treating TB-HIV coinfected individuals. Comprehensive disease knowledge, awareness of factors linked to poor outcomes, early screening and treatment for anemia, and nutritional support are crucial components for optimal management, contributing to the reduction of mortality and morbidity Thus, clinicians should screen all HIV patients for TB followed by immediate initiation of appropriate treatment regimens for this lethal combination.
ACKNOWLEDGEMENT
We extend our sincere appreciation to all the authors for their diverse contributions throughout the research process and in the preparation of this manuscript. Their collective efforts have enriched the depth and quality of this study There is no conflict of interest among the authors. Additionally, we would like to acknowledge our institute for its support and facilitation in conducting this research.
Our heartfelt gratitude extended to the patients who generously provided their informed consent to participate in this study Their participation is invaluable, and we express our deepest appreciation for their involvement and support.
Funding : None.
Conflict of Interest : None.
REFERENCES
1 Global tuberculosis report 2023 [Internet]. 2023. Available from: https://iris.who.int/.
2 INDIA TB REPORT 2023 [Internet]. Available from: http:// www.tbcindia.gov.in
3 WHO Policy on Collaborative TB/HIV Activities. Creative Lynx [Internet]. 2012 [cited 2023 Dec 15];330:2–36.Available from: https:/ /www.ncbi.nlm.nih.gov/books/NBK131887/
4 Sharma SK — Clinical profile & predictors of poor outcome of adult HIV-tuberculosis patients in a tertiary care centre in north India. Indian J Med Res 2014; 139(1): 154-60.
5 Swaminathan S — Long term follow up of HIV-infected patients with tuberculosis treated with 6-month intermittent short course chemotherapy Natl Med J India 2008; 21(1): 3-8.
6 Jenks JD — Improved tuberculosis outcomes with daily vs. intermittent rifabutin in HIV-TB coinfected patients in India. Int J Tuberc Lung Dis 2016; 20(9): 1181-4.
7 National AIDS Control Organization Ministry of Health and Family Welfare Government of India. 2018. Available from: https:// naco.gov.in/
8 Chennaveerappa PK — TB-DOTS Outcome in Relation to HIV Status: Experience in a Medical College. J Clin Diagn Res 2014; 8(1): 74-6. Available from: https://pubmed.ncbi.nlm.nih.gov/24596728/
9 Sinkala E — Clinical and ultrasonographic features of abdominal tuberculosis in HIV positive adults in Zambia. BMC Infect Dis. 2009;9.Available from: https://pubmed.ncbi.nlm.nih.gov/19374757/
10 Sculier D — Performance of abdominal ultrasound for diagnosis of tuberculosis in HIV-infected persons living in Cambodia. J Acquir Immune Defic Syndr 2010; 55(4): 500-2. Available from: https:// pubmed.ncbi.nlm.nih.gov/20574410/
11 Parchure R — Treatment outcomes of daily anti-tuberculosis treatment in HIV-infected patients seeking care at a private clinic in India. Int J Tuberc Lung Dis 2016; 20(10): 1348-53.
12 Maji D — Clinicodemographic profile and outcome of tuberculosis treatment in TB-HIV co-infected patients receiving daily ATT under a single windowTB-HIV services delivery initiative. Monaldi Archives for Chest Disease 2023; 93(3)
13 Agarwal U, Kumar A, Behera D — Profile of HIV associated tuberculosis at a tertiary institute in setting of free anti-retroviral therapy J Assoc Physicians India 2009; 57: 685-90.
14 Khan FA — Treatment of active tuberculosis in HIV-coinfected patients: a systematic review and meta-analysis. Clin Infect Dis 2010; 50(9): 1288-99. Available from: https://pubmed.ncbi.nlm.nih.gov/ 20353364/
15 Straetemans M —Assessing tuberculosis case fatality ratio: a metaanalysis. PLoS One 2011; 6(6): e20755.
16 Alpert PL — A prospective study of tuberculosis and human immunodeficiency virus infection: clinical manifestations and factors associated with survival. Clin Infect Dis 1997; 24(4): 661-8. Available from: https://pubmed.ncbi.nlm.nih.gov/9145741/
17 Kerkhoff AD — Predictive value of anemia for tuberculosis in HIVinfected patients in Sub-Saharan Africa: an indication for routine microbiological investigation using new rapid assays. J Acquir Immune Defic Syndr 2014; 66(1): 33-40. Available from: https:// pubmed.ncbi.nlm.nih.gov/24346639/
18 Demitto FO — Impact of Persistent Anemia on Systemic Inflammation and Tuberculosis Outcomes in Persons Living With HIV Front Immunol. 2020;11. Available from: https:// pubmed.ncbi.nlm.nih.gov/33072136/
Original Article
A Study to Assess the Effects of Intercostal Nerve Block in the Management of Primary Costosternal Syndrome
Background : Primary Costosternal Syndrome (Costochondritis) causes non-cardiac chest pain and limits chest wall mobility, leading to significant patient distress. Intercostal Nerve Blocks (ICNB) are emerging as a potential therapeutic intervention. This study evaluates the efficacy of ICNB in reducing pain and improving Chest Wall Expansion (CWE) in affected patients.
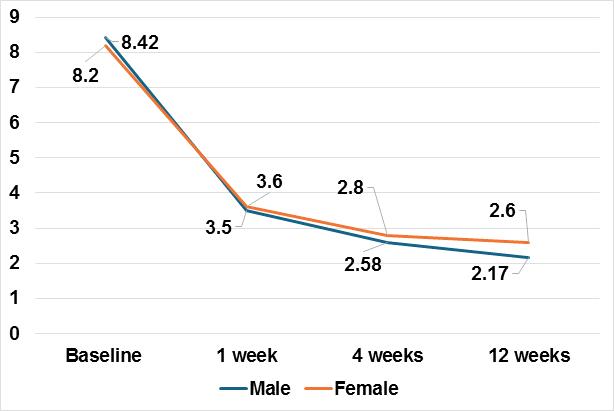
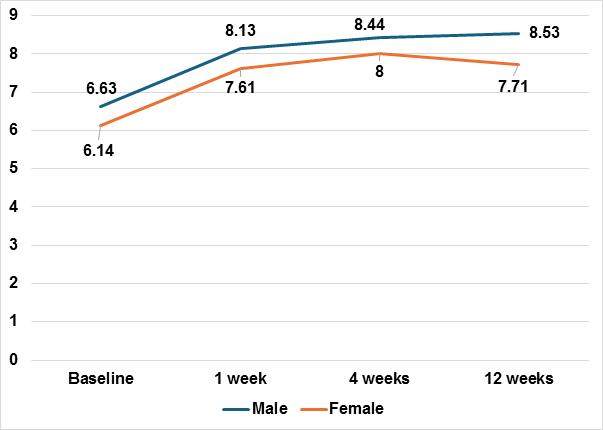
Materials and Methods : This prospective interventional study, conducted at R.G. Kar Medical College, included 17 participants aged 25-60 years with pain scores=4 on the Numeric Rating Scale (NRS). Exclusions encompassed congenital chest abnormalities, prior interventions and contraindications to the procedure. ICNB was performed under ultrasound guidance. Pain Severity (NRS) and CWE were measured at baseline, 1 week, 4 weeks and 12 weeks. Statistical analysis utilized SPSS® v23.0, with significance set at p<0.05.
Results : At baseline, mean NRS was 8.35 (SD=0.93), reducing to 3.53 (SD=1.41) at 1 week, 2.65 (SD=1.11) at 4 weeks and 2.29 (SD=0.47) at 12 weeks (p<0.001). CWE improved from 6.49 cm (SD=1.37) to 8.29 cm (SD=0.84) at 12 weeks (p<0.001). No significant sex-based differences were observed. ICNB provided significant and sustained pain relief and functional improvement. Conclusion : ICNB is a safe and effective intervention for primary costosternal syndrome, significantly reducing pain and enhancing chest wall mobility over 12 weeks. Larger, randomized studies are warranted to validate these findings.
Primary Costosternal Syndrome, commonly referred to as costochondritis, is a non-cardiac chest pain condition characterized by localized tenderness and pain in the costosternal, costochondral, or costovertebral joints1 Although the condition is typically benign, it can be debilitating for patients due to its chronic nature and resemblance to more serious cardiac conditions, often leading to unnecessary investigations and delayed relief2 The underlying pathophysiology of Costosternal Syndrome is not fully understood, but it is generally believed to involve musculoskeletal inflammation, resulting in localized pain that is exacerbated by movement or palpation. Effective management is essential to alleviate symptoms and improve patients’ Quality of Life.
Conventional treatment options for costosternal syndrome include Non-steroidal Anti-inflammatory Drugs (NSAIDs), physical therapy, and corticosteroid injections. While these
Department of Physical Medicine and Rehabilitation.
1MBBS, MD, FPM, Senior Resident, Calcutta National Medical College and Hospital, Kolkata 700014 and Corresponding Author
2MBBS, MD, Former Senior Resident, Midnapore Medical College and Hospital, Midnapore, West Bengal 721101
3MBBS, MD, Professor and Head, RG Kar Medical College and Hospital, Kolkata 700004
4MBBS, MD, Senior Resident, Jalpaiguri Government Medical College and Hospital, Jalpaiguri, West Bengal 735101
5MBBS, MD, Assistant Professor, NRS Medical College and Hospital, Kolkata 700014
Received on : 14/03/2025
Accepted on : 06/11/2025
Editor's Comment :
nn nn n Primary Costosternal Syndrome is a difficult to treat entity and is notorious for relapses following conservative management. nn nn n This study aims to show that Interventional Pain Management in the form of Ultrasound-Guided Intercostal Nerve Block is highly effective in reducing pain, preventing relapses and improving the Quality of Life of patients suffering from this distressing condition.
approaches provide relief for many patients, their effectiveness varies and some individuals experience persistent pain despite optimal management3. Intercostal Nerve Blocks (ICNB) have emerged as a promising alternative in managing refractory cases of chest wall pain, including Costosternal Syndrome. By delivering local anesthetic directly to the intercostal nerves, ICNB targets the source of pain, offering both diagnostic and therapeutic benefits4 This technique has been widely used in managing Post-thoracotomy pain, rib fractures, and chronic neuropathic pain, demonstrating its safety and efficacy.
Despite its established utility in other conditions, the role of ICNB in Primary Costosternal Syndrome remains underexplored. Limited data are available on its effectiveness in alleviating pain and improving chest wall mobility in this specific patient population. This study aims to address this gap by evaluating the effectiveness of Intercostal Nerve Blocks in patients with primary Costosternal Syndrome. The study focuses on two critical outcomes: improvement in pain severity, assessed using the Numeric Rating Scale (NRS) and enhancement in chest wall expansion, a functional parameter directly
How to cite this article : A Study to Assess the Effects of Intercostal Nerve Block in the Management of Primary Costosternal Syndrome. Mukherjee S, Sasmal S, Mandal PK, Singha Roy A, Mandal K. J Indian Med Assoc 2026; 124(4): 31-5.
impacted by chest wall pain and stiffness.
MATERIALS AND METHODS
This prospective interventional descriptive study was conducted in the Department of Physical Medicine and Rehabilitation at RG Kar Medical College and Hospital, Kolkata, over a duration of 12 months (January, 2021 to December, 2022). The study aimed to evaluate the effectiveness of Intercostal Nerve Blocks (ICNB) in patients with Primary Costosternal Syndrome. The inclusion criteria for the study encompassed individuals aged 25 to 60 years who presented with pain and tenderness over the costochondral junction and reported a daily pain score of >4 on the Numerical Rating Scale (NRS). Patients with congenital chest wall abnormalities, clinical evidence of Tietze syndrome, thoracotomy history, or intercostal neuralgia were excluded. Additionally, exclusion criteria included cardiopulmonary or systemic causes of anterior chest wall pain, contraindications to anesthetic agents or corticosteroids, prior interventions or surgeries for Costosternal Syndrome, anatomical abnormalities near the injection site, untreated cutaneous infections, systemic illnesses, immuno-compromised states, bleeding disorders, anticoagulant use and refusal to participate. Patients who showed improvement with conservative management were also excluded.
The sample size was calculated based on the pain improvement as per Numeric Rating Scale using the formula N=2XSD2X(Z1-α/2+Zβ)2 / d2 where Z1-α/2 is 1.96 at 95% confidence level, Zβ is 0.84 at 80% power, and SD and d (hypothesised difference from the baseline) are 1.027 and 1 respectively This calculation yielded a sample size of 16.53, rounded up to 17 participants.
The Intercostal Nerve Block procedure was performed under sterile conditions. Patients were placed in a prone position with the ipsilateral arm hanging to the side. The injection site was prepared with a sterile field and an Ultrasound (US) probe was used to identify the external and internal intercostal muscles. A needle was inserted using an in-plane technique to penetrate the external and internal intercostal muscles, targeting the internal intercostal muscle. After confirming negative aspiration, the anesthetic drug was injected. Proper deposition of the drug was verified by visualizing the depression of the parietal pleura on the Ultrasound. The puncture site was subsequently cleaned and dressed aseptically.
Data were collected at four time points: baseline (Visit 0), 1 week (Visit 1), 4 weeks (Visit 2), and 12 weeks (Visit 3). The primary outcome measure was the reduction in pain severity assessed using the NRS, while the secondary outcome was the improvement in chest wall expansion. Statistical analysis was conducted using SPSS® version
23.0, with a confidence interval of 95% and a significance threshold of p<0.05 p<0.05 p<0.05. Data were organized and managed using a grand chart prepared in MS Excel. This methodological approach provided a structured and reliable framework for assessing the efficacy of ICNB in Primary Costosternal Syndrome.
Ethical clearance for the study was obtained from the study institution’s Ethics committee (RKC/36 dated 21.11.2019). The study was registered in the Clinical Trials Registry of India (CTRI) [Regn no.CTRI/2021/06/033919].
RESULTS
The mean age of the participants was 45.1 years (SD = 9.4), with the majority being male (70.6%). The condition predominantly affected the right side in 58.8% of participants. The effectiveness of Intercostal Nerve Blocks (ICNB) was assessed by evaluating changes in pain severity and Chest Wall Expansion (CWE) at baseline, 1 week, 4 weeks, and 12 weeks after the intervention.
At baseline, the mean pain severity on the Numeric Rating Scale (NRS) was 8.35 (SD = 0.93). Following ICNB, a significant reduction in pain was observed at all subsequent time points. At 1 week, the mean NRS score dropped to 3.53 (SD = 1.41), further reducing to 2.65 (SD = 1.11) at 4 weeks and 2.29 (SD = 0.47) at 12 weeks. The reduction in pain severity was statistically significant (p<0.001) across all time intervals, indicating the sustained effectiveness of ICNB in managing costosternal syndrome-related pain.
ChestWall Expansion (CWE), a functional measure of chest wall mobility, also showed a significant improvement over time.At baseline, the mean CWE was 6.49 cm (SD = 1.37). This increased to 7.98 cm (SD = 1.05) at 1 week, 8.31 cm (SD = 0.86) at 4 weeks, and 8.29 cm (SD = 0.84) at 12 weeks.TheimprovementinCWEwasstatisticallysignificant (p<0.001), demonstrating that ICNB contributed not only to pain relief but also to enhanced chest wall function.
Sex-based comparisons revealed no statistically significant differences in either pain severity or chest wall expansion at any time point. Male participants exhibited slightly higher baseline CWE (mean = 6.63 cm, SD = 1.31) compared to females (mean = 6.14 cm, SD = 1.61), but the difference was not significant (p = 0.517). Similarly, pain scores between males and females showed no notable variation throughout the study duration (p>0.05), underscoring the uniform efficacy of ICNB across sexes.
Overall, the findings demonstrate that ICNB is an effective intervention for managing Primary Costosternal Syndrome. Significant and sustained improvements were observed in both primary (Pain Severity) and secondary (CWE) outcomes, with benefits persisting up to 12 weeks post-intervention (Tables 1-5, Figs 1&2).
Mukherjee
Table 1 — Distribution of study participants according to their Sociodemographic characteristics (n=17)
Table 2 — Distribution of study participants according to their pain severity over time as per Numeric Rating Scale (n=17) NRS
Table 3 — Distribution of study participants according to their chest wall expansion over time (n=17) CWE Mean
1 — Sex-wise difference in pain severity over time as per Numeric Rating Scale (n=17)
Table 4 — Sex-wise difference in pain severity over time as per Numeric Rating Scale (n=17)
2 — Sex-wise difference in chest wall expansion over time
Table 5 — Sex-wise difference in Chest Wall Expansion over time (n=17)
p-value
DISCUSSION
Primary Costosternal Syndrome, a condition characterized by localized chest wall pain, often resembles serious cardiopulmonary conditions, leading to diagnostic delays and patient distress. While conventional treatments such as NSAIDs, corticosteroids, and physical therapy provide relief, refractory cases remain a clinical challenge3 . The present study evaluated the efficacy of Intercostal Nerve Blocks (ICNB) for managing Primary Costosternal Syndrome. The findings demonstrated significant and sustained improvements in pain severity and Chest Wall Expansion (CWE) over a 12-week follow-up period, underscoring the therapeutic value of ICNB in this context.
Pain severity, a primary outcome measure in this study, was significantly and consistently reduced following Intercostal Nerve Block (ICNB) intervention. At baseline, participants reported a mean pain severity score of 8.35 on the Numeric Rating Scale (NRS), reflecting the debilitating intensity of symptoms associated with Primary Costosternal Syndrome. By 1 week Post-ICNB, this score had dropped sharply to 3.53, indicating rapid analgesic effectiveness. Further reductions were observed at subsequent follow-ups, with mean scores of 2.65 at 4 weeks and 2.29 at 12 weeks, demonstrating sustained pain relief throughout the study period (p<0.001). These results align with the findings of prior studies, such as Maheshwari. et al and Patoli, et al who reported the efficacy of ICNB in reducing chronic chest wall pain5,6 The mechanism underlying this effect involves targeted nerve blockade, which interrupts pain transmission and reduces localized inflammation. By directly targeting the intercostal nerves, ICNB interrupts the transmission of pain signals, offering immediate relief7 The addition of corticosteroids to the local anesthetic may contribute to
Fig
(n=17)
Fig
prolonged analgesia by mitigating local inflammation at the site of pain generation. This combination of immediate and sustained effects makes ICNB particularly valuable for managing conditions like Costosternal Syndrome, where pain is a central and persistent symptom.
The rapid decline in pain scores within the first week postintervention suggests that ICNB is an effective modality for achieving swift symptom control, which is critical for improving patient Quality of Life. Persistent chest wall pain, as experienced by individuals with Costosternal Syndrome, often leads to significant physical and psychological distress, reducing the ability to perform daily activities8. By providing near-immediate pain relief, ICNB not only alleviates discomfort but also enables patients to resume functional activities earlier, promoting overall recovery.
The sustained pain relief observed at 4 and 12 weeks further highlights the long-lasting benefits of ICNB. Unlike conventional treatments such as Non-steroidal AntiInflammatory Drugs (NSAIDs), which require ongoing use and are associated with potential systemic side effects, ICNB offers a localized, durable solution9 This makes ICNB particularly suitable for patients who experience refractory pain despite conservative management or those who have contraindications to systemic medications. Additionally, the durability of analgesia reduces the need for repeated interventions, enhancing patient convenience and compliance10
Chest wall expansion, a functional parameter reflecting chest wall mobility, also improved significantly, increasing from 6.49 cm at baseline to 8.29 cm at 12 weeks (p<0.001). Enhanced CWE suggests a reduction in stiffness and improved functional capacity, critical for patients’ Quality of Life. The observed improvement in CWE likely results from multiple mechanisms of action. First, by blocking the intercostal nerves, ICNB interrupts the pain-spasm-pain cycle, a common phenomenon where pain induces muscular spasm, further exacerbating stiffness and reducing mobility. Breaking this cycle allows the chest wall muscles to relax, facilitating improved expansion11. Second, the inclusion of corticosteroids in the injection may have reduced localized inflammation around the costosternal and costochondral joints, further aiding in restoring chest wall flexibility Third, reduced nociceptive input from the blocked nerves likely contributed to increased patient confidence and willingness to perform activities requiring chest wall movement, indirectly promoting greater expansion. The significant and sustained improvement in CWE highlights ICNB’s utility in addressing a key limitation of conventional therapies, which often focus solely on pain relief without adequately addressing functional recovery Improved CWE directly impacts the Quality of Life in
patients with Primary Costosternal Syndrome, as chest wall mobility is integral to performing routine activities such as deep breathing, physical exertion, and postural changes. Restricted chest wall expansion in these patients can lead to compensatory breathing patterns, contributing to fatigue and secondary musculoskeletal complications12 By improving CWE, ICNB not only alleviates primary symptoms but also prevents the downstream consequences of chronic musculoskeletal restriction.
Sex-wise comparisons revealed no significant differences in either pain severity or CWE improvements, indicating the uniform efficacy of ICNB across sexes. This finding contrasts with some studies like that done by Sahu, et al and Tolba, et al that suggest sex-based variations in pain perception and response to interventions. The absence of significant sex-related differences in this study may be attributed to the small sample size, which limits subgroup analyses.
Compared to other interventional strategies, ICNB offers distinct advantages, including targeted action, minimal systemic side effects, and dual diagnostic-therapeutic benefits. While NSAIDs and physical therapy remain firstline treatments, their limitations in refractory cases necessitate alternative approaches5. Corticosteroid injections, though effective, may pose risks such as local tissue atrophy or systemic effects. In contrast, ICNB provides localized, sustained relief with a favorable safety profile, as demonstrated in this study
Strengths and Limitations :
The study’s strengths include a prospective design, objective assessment of both pain and functional outcomes, and the use of Ultrasound guidance to ensure precise drug delivery. However, limitations warrant consideration. The small sample size (n=17) limits the generalizability of findings, and the absence of a control group precludes definitive conclusions about the relative efficacy of ICNB compared to other treatments.Additionally, the short followup period, while adequate for assessing immediate and intermediate outcomes, does not capture long-term effects or recurrence rates. Future studies with larger cohorts, randomized controlled designs, and extended follow-ups are needed to validate these findings and explore potential predictors of response.
CONCLUSION
In conclusion, ICNB emerges as a promising intervention for managing Primary Costosternal Syndrome, offering significant and sustained reductions in pain severity and improvements in chest wall mobility. Its safety, efficacy, and functional benefits position it as a valuable addition to the therapeutic arsenal for this challenging condition.
Funding : None.
Conflict of Interest : None.
REFERENCES
1 Bolandrini A, Totti V, Segat M, Zaninetti M, Fascia M, Segat A, et al
Costochondritis syndrome and thoracic-chest related pain: a scoping review medRxiv 2024: 2024-02.
2 Winzenberg T, Jones G, Callisaya M. Musculoskeletal chest wall pain. Aust Fam Physician 2015; 44(8): 540-4.
3 Proulx AM, Zryd TW — Costochondritis: diagnosis and treatment. Am Fam Physician 2009; 80(6): 617-20.
4 Rogers FB, Larson NJ, Rhone A, Amaya D, Olson-Bullis BA, Blondeau BX — Comprehensive review of current pain management in rib fractures with practical guidelines for clinicians. J Intensive Care Med 2023; 38(4): 327-39.
5 Maheshwari A, Gotlib D — Bedside injections for costochondral pain. In: Bedside Pain Management Interventions. Cham: Springer International Publishing; 2022. 409-16.
6 Patoli DM, Malik T — A 45-year-old patient with chronic chest wall pain. In: Practical Chronic Pain Management: A Case-Based Approach. 2020. 139-45.
7 Elkhashab Y, Wang D —Areview of techniques of intercostal nerve blocks. Curr Pain Headache Rep 2021; 25: 1-5.
8 Moore DC, Sridenbaugh LD — Intercostal nerve block in 4333 patients:indications,technique,andcomplications. AnesthAnalg 1962; 41(1): 1-6.
9 Hwang EG, Lee Y — Effectiveness of intercostal nerve block for management of pain in rib fracture patients. J Exerc Rehabil 2014; 10(4): 241-4
10 Kaushal B, Chauhan S, Saini K, Bhoi D, Bisoi AK, Sangdup T, et al Comparison of the efficacy of ultrasound-guided serratus anterior plane block, pectoral nerves II block, and intercostal nerve block for the management of postoperative thoracotomy pain after pediatric cardiac surgery J Cardiothorac Vasc Anesth 2019; 33(2): 418-25.
11 Guerra-Londono CE, Privorotskiy A, Cozowicz C, Hicklen RS, Memtsoudis SG, Mariano ER, et al — Assessment of intercostal nerve block analgesia for thoracic surgery: a systematic review and meta-analysis. JAMA Netw Open 2021; 4(11): e2133394.
12 Chin KJ, Versyck B, Pawa A — Ultrasound guided fascial plane blocks of the chest wall: a state of the art review Anaesthesia 2021; 76: 110-26.
Original Article
Ideal Family Size and Factors Influencing
Desired Number of Children among Married Women of Reproductive Age Group in Rural Area in Goa
Ronald Robin1, Vanita G Pinto Da Silva2
Abstract
Background : Global fertility rates are declining sharply. In India, the total fertility rate is projected to fall further to 1.04 by 2100, with Goa’s TFR already at 1.3. This downward trend in fertility rates will have far-reaching consequences, including aging populations and declining workforces.
Aims and Objectives : To determine the ideal family size and desired number of children among married women of reproductive age in Rural Goa and to study the factors associated with it.
Materials and Methods : A Community based cross sectional study was conducted amongst married women of reproductive age group residing in field practice area of Rural Health & Training Centre, Mandur, Goa. A semi structured questionnaire was used to collect data. At a proportion of 23%, 95% confidence interval, 5% absolute error the sample size was 300.Systematic random sampling was employed.
Results : The mean age of the study participants was 34.3 ± 6.62 years, and mean age at menarche was 13 ± 1.05 years. The majority of participants, 263 (87.7%), considered the ideal family size to be two or fewer children, while the desired number of children was two among 274 (91.3%) participants. Only 35 (11.7%) participants expressed a desire for another child. Education, Religion, Occupation and Living Sons were found to be significantly associated.
Conclusion : This study reveals a strong preference for smaller families among married women, with most favouring two or fewer children. Policymakers should enhance family planning services and education while addressing the long-term impacts of declining fertility by preparing for an aging population and promoting workforce sustainability
Key words : Family, Ideal, Reproductive Age, Rural, Women.
The size of a family plays a critical role in shaping not only national development but also the health and wellbeing of individuals, families and communities. In recent years, Global demographic patterns have shown a notable decline in fertility rates across all regions. The reduction in fertility has far-reaching effects, not only on population structure but also on long-term economic growth, as societies shift from having younger to older populations.
Demographic data from recent years indicate that Total Fertility Rates (TFR) in several nations have dropped below the replacement level of 2.1 children per woman, the threshold needed for a stable population in the absence of migration. This ongoing fertility decline raises concerns about future population trends, as many countries may face an aging population and a reduced working-age group, creating challenges for healthcare systems, social services, and labour markets1,2
In countries like India, examining fertility trends is especially crucial due to their significant impact on population dynamics. Early recognition of fertility issues helps uncover underlying causes and supports the formulation of appropriate responses. Some theories
Department of Community Medicine, Goa Medical College, Goa 403202
1MBBS, Postgraduate Trainee and Corresponding Author
2MD, Associate Professor
Received on : 08/12/2024
Accepted on : 02/06/2025
Editor's Comment :
nn nn n Most married women in Rural Goa prefer small families, especially two children or fewer, reflecting changing social and economic priorities.
nn n Key factors like education, occupation, religion, and having sons significantly influence these preferences.
nn nn n Declining fertility highlights the need for stronger family planning services and preparation for an aging population.
highlight the potential for a demographic dividend, where falling fertility leads to a larger proportion of working-age adults, temporarily boosting economic growth. However, this predicted recovery in fertility has not been seen in many countries.
Globally, the United Nations estimates that the population could grow from 7.8 billion in 2020 to 10.9 billion by 2100, with fertility rates expected to converge around replacement levels. Despite these projections, more than half of the World’s population currently resides in regions with sub-replacement fertility
According to National Family Health Survey-5, India’s TFR has decreased dramatically over the past century, from 6.18 children per woman in 1950 to 2.0, already below the replacement level of 2.1. Projections suggest that by 2100, India’s TFR could fall further to 1.04, significantly influencing future population growth. In Goa, the total fertility rate is 1.3 per women which is well below the replacement level of fertility3-5
How to cite this article : Ideal Family Size and Factors Influencing Desired Number of Children among Married Women of Reproductive Age Group in Rural Area in Goa. Robin R, Da Silva VGP J Indian Med Assoc 2026; 124(4): 36-40.
This phenomenon, referred to as the demographic transition, is marked by long-term low fertility and an increasingly aging population. The aging trend poses various social and economic challenges, including financial strain on social and healthcare systems and labour shortages. Understanding fertility trends and the factors influencing them is essential for planning for the future6
Family size is a key factor in this demographic shift. Ideal family size represents the number of children parents would ideally like to have without economic or social barriers, while desired number of children reflects the number of children parents plan to have based on their real-life circumstances. Both concepts help explain fertility choices and their role in shaping population patterns.
However, there was limited information on ideal family size and desired number of children in Goa. Therefore, this study was done to determine decision on ideal family size and factors influencing desired number of children among married women of reproductive age in Goa.
MATERIALS AND METHODS
This community-based cross-sectional study took place over two months, from September, 2024 to November, 2024, in the Rural Health and Training Centre (RHTC) field practice area in Mandur, Goa, covering the villages of Mandur, Azossim, and Neura. The study focused on married women aged 15 to 49 residing in the area who provided informed consent to participate. Inclusion criteria specified that all married women within the reproductive age range (15-49 years) from the RHTC Mandur Rural area were eligible, except those with a known psychiatric illness or those who were unavailable for three consecutive visits.
A sample size of 300 was determined using the formula n = Z(1-α) 2 pq/d2, based on a 23% rate for the desire for another child from NFHS-5 data4 and allowing a 5% margin of error. Systematic random sampling was used to select participants from the 1,588 households in the study area, which has a population of 5,812. A sampling interval (K) of approximately 5 was calculated by dividing the total number of households (1,588) by the required sample size (300). Starting from a randomly chosen household within the first interval, every fifth household was then selected for inclusion. In cases where multiple eligible participants were present in a household, one was chosen randomly through a simple lottery
Following ethical clearance from the Goa Medical College Ethics Committee (GMC IEC/2024/302), data collection proceeded with voluntary, informed consent from each participant, ensuring confidentiality. Data on Sociodemographic factors, such as Age, Religion, Education, and Occupation, were gathered through face-to-face
interviews using a pre-designed and pre-tested proforma. Educational attainment was measured using the Modified Kuppuswamy Socio-economic Scale (2024)7, while Socioeconomic status was assessed using the Updated BG Prasad’s Classification (2024)7
Statistical Analysis :
Data collected was entered in MS excel and data analysis was done using IBM Corporation (2013) IBM SPSS Statistics for Windows, Version 22.0. IBM Corporation, Armonk, New York, USA. Chi square test was applied to analyse the data and p value <0.05 was taken as significant.
RESULTS
As depicted in Table 1, the Socio-demographic profile of the 300 study participants indicates that the majority of the study participants was 40-49 years 104(34.6%), followed by the 25-29 years group 68(22.7%), with smaller groups in the 35-39 years 63(21%), 30-34 years 44(14.7%), and 18-24 years 21(7%) age groups.The mean age of the study participants was 34.3 ± 6.62 years. Most participants identified as Hindu 204(68%), followed by Christian 53(17.7%) and Muslim 43(14.3%). Educational attainment varied, with 73(24.3%) participants completing Secondary Education, 62(20.6%) participants completing Higher Secondary Education, 56(18.6%) as Graduates or Higher, while 37(12.3%) were Illiterate. Regarding employment status, most participants were Homemakers 197(65.7%), while 103(34.3%) were Employed. Socio-economic status distribution according to modified BG Prasad scale 2024, indicated that nearly half of the participants belong to Class 2 143(47.7%), followed by Class 3 89(29.7%), Class 4 38(12.7%), and smaller percentages in Class 1 23(7.6%) and Class 5 7(2.3%).
Table 1 — Socio-demographic characteristics of Study Participants (n = 300)
Robin R, et al. Ideal Family Size and Factors Influencing Desired Number of Children among Married Women of Reproductive Age Group.
As shown in Table 2, menstrual history of the participants indicated that the majority experienced menarche between the ages of 13-14 years 229(76.4%), with fewer reporting menarche at 11-12 years 55(18.3%) and 9-10 years 16(5.3%). The mean age at menarche was 13 ± 1.05 years. Most Women 260(86.7%) reported regular menstrual cycles, with only 40(13.3%) experiencing irregular cycles. A slight majority 162(54%) had cycles lasting more than five days, while 138(46%) reported cycles of five days or fewer. Heavy menstrual bleeding was reported by 167(55.7%) participants, while the remaining 133(44.3%) experienced normal bleeding. Dysmenorrhea was prevalent, affecting 180(60%) participants, with the remaining 120(40%) reporting no dysmenorrhea.
As per obstetric history, most participants were married between 18-29 years 201(67%), with 99(33%) marrying at 30 years or older Age at first pregnancy followed a similar trend, with 181(60.3%) participants conceiving between 18-29 years and 119(39.7%) at 30 years or older. Pregnancy complications were relatively low, with only 25(8.3%) participants reporting complications, while 275(91.7%) had uncomplicated pregnancies. Miscarriages were rare, with 16(5.3%) participants reporting a miscarriage, while 284(94.7%) had not experienced one. Most deliveries were normal vaginal deliveries 195(65%), while 105(35%) were caesarean sections. Regarding family size, 174(58%) women had two living children, 89(29.7%) had one child, and 37(12.3%) had no children. Over half of the participants 160(53.3%) had no living son, while 140(46.7%) had one. The majority of participants 265(88.3%) did not have desire for another child, with only 35(11.7%) expressing a desire for another child.
As shown in Fig 1, the majority of study participants considered the ideal family size to be two or fewer children, while a smaller proportion believed it to be three children. Similarly, Fig 2 illustrates that the majority of participants expressed a desire for two children, with some desiring three children.
Fig 1 — Ideal family size decision among married women of reproductive age group (n=300)
Fig 2 — Desired number of children among married women of reproductive age group (n=300)
As depicted in Table 3, factors such as Age group, Education, Occupation and Religion were found to be significantly associated with the ideal family size. Furthermore, Table 4 demonstrates that Education, Occupation, Religion, Dysmenorrhea, complications during pregnancy, and the number of living sons were associated with the desired family size among participants.
Table 3 — Association of Socio-demographic factors with ideal family size decision (n=300)
*Denotes statistically significant association according to the Chi-square test of association
Robin R, et al. Ideal Family Size and Factors Influencing Desired Number of Children among Married Women of Reproductive Age Group.
Table 2 — Menstrual history of study participants (n = 300)
Table 4 — Association of selected factors with desired family size decision (n=300)
*Denotes Statistically SignificantAssociationAccording to the Chi-square Test of Association
DISCUSSION
In this study involving 300 participants, we found that the largest age group, comprising 34.6% of the sample, fell into the 40-49 year range. This distribution aligns with Saya et al8 findings, where a similar majority was observed in this age group, indicating a possible pattern in age demographics within similar studies. Additionally, 68% of study participants identified as Hindu, a proportion that is in line with Saya et al8 results, suggesting that religious distribution in this study population is reflective of broader trends observed in comparable research.
The employment status of our participants showed that 65.7% were unemployed or homemakers, closely matching the distribution noted by Saya et al, 8 indicating a consistency in participation rates among homemakers and unemployed individuals in similar contexts. Furthermore, the average age at menarche among our participants was 13 ±1.05 years, which closely mirrors findings reported by Meher and Sahoo, et al9. Such consistency suggests that the average age at menarche may remain relatively stable across these study populations.
In terms of menstrual health, this study found that 60% of participants experienced dysmenorrhea, a prevalence rate consistent with findings from Amita, et al10, underscoring the prevalence of this condition among similar groups. This prevalence highlights the need for increased attention to menstrual health issues in public health discussions, as dysmenorrhea can significantly impact Quality of Life.
Majority 87.7% of participants considered two or fewer children to be the ideal family size. This preference aligns with the National Family Health Survey (NFHS-5)5 findings for Goa, suggesting that preferences for smaller families may be widespread and reflective of changing family planning ideals. This study also identified significant associations between preferred family size and factors such as Age, Education, Occupation and Religion, which echo trends seen in other studies8, indicating that family size preferences are influenced by a range of Sociodemographic factors.
Furthermore, 91.3% of study participants expressed a preference for having two children, a rate higher than that reported byAkram et al11. in a nationwide study conducted in Bangladesh. This difference could indicate regional variations in family size ideals. Additionally, a systematic review by Ranjbar et al12 supports study findings by identifying Education, Occupation, Religion and the presence of sons as influential factors on desired family size, suggesting that these variables consistently play a role across different populations.
CONCLUSION AND RECOMMENDATION
This study demonstrates a strong preference for smaller families among married women, with most favouring two or fewer children. This trend reflects evolving attitudes influenced by Socio-economic factors such as financial planning and Quality of Life considerations. Policymakers should prioritize enhancing family planning services and educational outreach to support informed reproductive choices. Additionally, declining fertility rates highlight the need for strategies to address an aging population and potential future workforce shortages. To mitigate these impacts, policies should encourage workforce sustainability and support for older individuals. By addressing both family planning needs and demographic shifts, policymakers can better prepare for future societal challenges.
LIMITATIONS
Since this study is conducted using a cross-sectional design, it captures participants’ preferences at a single point in time, which restricts the ability to track changes in attitudes toward family size over time. Furthermore, the reliance on self-reported data may introduce response
bias, as participants might underreport or overreport their ideal family size due to social desirability or cultural expectations. The study’s focus on a specific Rural area in Goa may also limit the generalizability of the findings to other regions or Urban settings, where demographic and socio-economic factors could differ significantly. Finally, while the study examined key Socio-demographic factors, it did not explore other influential variables, such as economic conditions or familial pressures, which could provide deeper insights into the complexities surrounding family size preferences.
Financial Support and Sponsorship : Nil
REFERENCES
1 Ahinkorah BO, Seidu AA, Armah-Ansah EK, Ameyaw EK, Budu E, Yaya S. Socio-economic and demographic factors associated with fertility preferences among women of reproductive age in Ghana: evidence from the 2014 Demographic and Health Survey Reprod Health 2021; 18(1): 2.
2 Azmoude E, Behnam H, Barati-Far S, Kabirian M — The Relationship of Socio-Demographic Factors, Fertility Behavior and Child’s Perceived Value with Fertility Int J Community Based Nurs Midwifery 2017; 5(2): 123-33.
3 Bhattacharjee NV, Schumacher AE, Aali A, Abate YH, Abbasgholizadeh R, Abbasian M, et al — Global fertility in 204 countries and territories, 1950–2021, with forecasts to 2100: a comprehensive demographic analysis for the Global Burden of Disease Study 2021. The Lancet 2024; 403(10440): 2057-99.
4 NFHS-5_INDIA_REPORT.pdf [Internet]. [cited 2024 Jun 1]. Available from: https://rchiips.org/nfhs/NFHS-5Reports/NFHS5_INDIA_REPORT.pdf
5 Goa.pdf [Internet]. [cited 2024 Jun 1]. Available from: https:// rchiips.org/nfhs/NFHS-5Reports/Goa.pdf
6 Nguyen VD, Nghiem TT. Family size desires and intentions in the lowest fertility region in Vietnam. F1000 Research 2022; 11: 1165.
7 Javalkar SR, Naveen HS, Davalgi S, GSV — Socio economic status assessment in India: history and updates for 2024. Int J Community Med Public Health 2024; 11: 1369-77.
8 Saya GK, Premarajan KC, Roy G, Sarkar S, Kar SS, Olickal JJ, et al — Extent of difference between male and female gender preference and associated factors among currently married women of reproductive age group in Puducherry, India. Clinical Epidemiology and Global Health 2021; 10: 100692.
9 Meher T, Sahoo H — Secular trend in age at menarche among Indian women. Sci Rep 2024; 14(1): 5398.
10 Amita S, Vivek P, Arpita S, Bhupendra R, Vandana D. Menstrual Pattern and Prevalence of Menstrual Disorders among Young Women and Adolescent Girls Reside In Rural Area of Central India, Rewa, MP Sch J App Med Sci 2018; 6(11): 4466-71.
11 Akram R, Sarker AR, Sheikh N, Ali N, Mozumder MGN, Sultana M — Factors associated with unmet fertility desire and perceptions of ideal family size among women in Bangladesh: Insights from a nationwide Demographic and Health Survey PLOS ONE 2020; 15(5): e0233634.
12 Ranjbar M, Rahimi MK, Heidari E, Bahariniya S, Alimondegari M, Lotfi MH, et al — What factors influence couples’ decisions to have children? Evidence from a systematic scoping review BMC Pregnancy Childbirth 2024; 24(1): 223.
Original Article
Study on Electrocardiographic and Echocardiographic Changes in Patients with Liver Cirrhosis in Absence of Classical Cardiac Risk Factors
Sriparna Das1, Spandan Saha2, Saumik Datta3
Abstract
Background : Abnormalities in cardiac electrophysiology are well documented in patients with liver cirrhosis and prolonged QTc interval has emerged as the electrophysiological hallmark of Cirrhotic Cardiomyopathy (CCM). Prolongation of the QT interval on the electrocardiogram is common, with a prevalence exceeding 60% in patients with advanced stage of cirrhosis. In such cases, beta blockers and antiarrhythmic drugs should be used with caution and with close ECG monitoring. A prolonged QTc interval particularly in patients with decompensated cirrhosis can lead to ventricular arrhythmias and sudden death.
Aims and Objectives : This study was done to evaluate the prevalence of ECG changes in patients of Chronic Liver Disease attending a Tertiary Care Hospital and to analyse its correlation with disease severity according to Child-Pugh class.
Materials and Methods : The present study was conducted on 100 patients suffering from cirrhosis with different etiologies who presented to the Department of Medicine, BMC&H. The Child-Pugh score was used to determine the disease severity in cirrhotic patients. Standard 12-lead ECG and Echocardiography was recorded in all cases.
Results : Prolongation of QTc interval on ECG was observed in the majority (66%) of cirrhotic patients along with other ECG and Echocardiographic changes out of which diastolic dysfunction was the most significant.
Conclusion : QTc prolongation on ECG may be an early marker of cardiac involvement in patients of cirrhosis and is significantly associated with disease severity
Key words : Cirrhosis, CCM, QTc, Tpe.
Chronic Liver Disease (CLD) is a progressive deterioration of liver functions including synthesis of clotting factors, other proteins, detoxification of harmful metabolic products and bile excretion. Chronic Liver Disease leads to disruption of the architecture of the liver, development of widespread nodules; Vascular rearrangement, neoangiogenesis and extracellular matrix deposition. The underlying cause of cellular-level fibrosis and cirrhosis is the mobilization of stellate cells and fibroblasts,while parenchymal regeneration depends on stem cells in the hepatic sinusoids.
Cirrhotic cardiomyopathy has been used to describe chronic cardiac dysfunction in cirrhotic patients with no previous structural heart disease. From a pathophysiological perspective, CCM is characterized by a hyperdynamic state, with both diastolic and systolic ventricular dysfunction, prolonged ventricular depolarization and an inappropriate chronotropic response. The pathogenic mechanisms of cirrhotic cardiomyopathy include impairment of beta-adrenergic
1MD, Senior Resident, Department of General Medicine, Burdwan Medical College and Hospital, Purba Bardhaman, West Bengal 713104
2MD, DM (Gastroenterology), Senior Resident, Department of Medical Gastroenterology, RG Kar Medical College and Hospital, Kolkata 700004 and Corresponding Author
3MD, DM (Endocrinology), Professor and Head, Department of General Medicine, Burdwan Medical College and Hospital, Purba Bardhaman, West Bengal 713104
Received on : 18/12/2022
Accepted on : 04/12/2023
Editor's Comment :
nn n QTc prolongation and other ECG abnormalities are common in cirrhosis and correlate significantly with disease severity, making them useful early markers of cirrhotic cardiomyopathy
nn n Diastolic dysfunction is the most frequent echocardiographic abnormality and increases with advancing Child-Pugh class. Routine ECG and echocardiographic evaluation can help identify subclinical cardiac involvement and guide risk stratification in cirrhotic patients.
receptor signalling pathways, altered cardiomyocyte plasma membrane properties, and abundance of negative-inotropic factors such as nitric oxide, endocannabinoid systems and other endotoxins1 The current proposed criteria include assessment of systolic dysfunction (a left ventricle ejection fraction of less than 50%) and several signs of diastolic dysfunction (low septal e’ velocity, high E/e’ ratio, high indexed volume of left atrium and high velocity of tricuspid regurgitation), while ECG modifications, and biomarkers are considered to add supportive information for the diagnosis2 The most commonly encountered ECG pattern in CCM is a prolonged QT interval3. Possible explanatory mechanisms for prolonged QT interval include dysfunction of membrane potassium channels and a hyper-reactivity of the sympathetic–adrenergic discharges, causing downregulation of beta-adrenergic receptors4 . Low-voltage ECG is also frequent in cirrhotic patients and has been associated with a higher mortality risk in patients without prior cardiovascular diseases5. Newer ECG markers for arrhythmogenesis include the T-peak to T-end interval
How to cite this article : Study on Electrocardiographic and Echocardiographic Changes in Patients with Liver Cirrhosis in Absence of Classical Cardiac Risk Factors. Das S, Saha S, Datta S. J Indian Med Assoc 2026; 124(4): 41-4.
(Tpe) and the Tpe/QT ratio. In this study we evaluated QTc interval,QRS voltage and TPe along with echocardiographic changes in 100 patients with different eitiologies of CLD. We also found significant correlation between ECG parameters and increasing severity of CLD as per child-pugh score.
AIMS AND OBJECTIVE
To estimate the prevalence of cardiac dysfunction with respect to different electrocardiographic and echocardiographic parameters in patients of hepatic cirrhosis in the absence of classical cardiac risk factors.
MATERIALS AND METHODS
Study Design/Experimental Design : An observational cross sectional study
Study Setting : Indoor patients with cirrhosis admitted in Department of General Medicine BMC&H after due consideration of the exclusion and inclusion criteria comprised the study population.
Haematological and biochemical investigations were carried out in laboratories on-campus under supervision of the Department of Pathology and Department of Biochemistry, Burdwan Medical College and Hospital, Burdwan.
Echocardiography was performed in collaboration with Department of Cardiology, superspeciality wing of Burdwan Medical College and Hospital, Burdwan.
Place of Study : Department of General Medicine, Burdwan Medical College & Hospital.
Period of Study : 1st May, 2020 to 31st October, 2021 (total 1 year & 6 months).
Inclusion Criteria :
All patients with cirrhosis, aged between 18-75, including both gender.
Exclusion Criteria :
Patients with other cardiac disease or classic risk factors (rheumatic heart disease, congenital heart disease & preexisting cardiac disease before they present with cirrhosis.
n Patients with acquired causes of QT prolongation (drugs and dyselectrolytemia).
n Patients with history suggestive of congenital long QT
n Patient with end stage respiratory disease.
n Patients with renal disease & other major illness.
n Patients with HIV (human immunodeficiency virus) infections.
n Patients with Haemoglobin (Hb)%< 9%.
n Patients with corrected serum total calcium level <9mg/dl.
Stastistical Analysis :
All the data collection will be compiled on MS Excel 2013 and analysed using SPSS (IBM). Continuous variables were reported as the mean and Standard Deviation. Categorical variables were reported as frequencies and percentages.Associations between Continuous variables are captured using Spearman’s Rank Correlation Coefficient. The statistical software SPSS version 20 has been used for the analysis.An alpha level of 5% has been taken, ie, if any p-value is less than 0.05 it has been considered as significant.
RESULT AND ANALYSIS
Severity of cirrhosis was calculated based on Child Turcotte Pugh criteria. Majority of the subjects were in severity group of Child B (46%) or Child A (41.0%). Only 13% patients were in severity group of Child C (Table 1, Figs 1&2).
Mean QRS voltage among study subjects according to the severity of cirrhosis is mentioned in Fig 3. We found significant difference with the increasing grade of cirrhosis. A comparison between QTc and Tpe in patients with decompensated cirrhosis (Child Pugh class B and C) proved to have increased QT duration (p value <0.001) and shortened Tpe (p value <0.001) (Tables 2,3 & Fig 4).
Fig 4 shows the echocardiographic changes among study subjects. Out of 100 cases 34 (34%) had diastolic
Table 1 — Etiology in patients with cirrhosis of liver
Fig 1 — Severity of disease by Child Turcotte Pugh Score in patients with cirrhosis of liver
Table 2 — Electrocardiographic Changes in different class of
dysfunction, 23 (23%) had pericardial effusion, 7 (7%) had systolic dysfunction and 6 (6%) had pulmonary arterial hypertension respectively. In 30 (30%) patients showed no changes in Echocardiography
In Child Pugh class A out of 41 only 8 (19.5%) had echocardiographic changes in the form of diastolic dysfunction. In child class B out of 46 cases 16 (34.8%)
had diastolic dysfunction, 14 (30.4%) had pericardial effusion, 3 (6.5%) had systolic dysfunction and pulmonary arterial hypertension respectively. In class C out of 13 patients, 10 (76.9%) had diastolic dysfunction, 6 (69.2%) had pericardial effusion, 4 (30.8%) had systolic dysfunction and 3 (23.1%) had pulmonary arterial hypertension.
DISCUSSION
In our study we investigated 100 patients with cirrhosis of liver with different eitiologies and found a significant correlation between QTc interval and TPe with increasing severity of Chronic Liver Disease.We also found significant Echocardiographic changes among which diastolic dysfunction was the commonest.
In this study the most common etiology for cirrhosis was Alcoholic Liver Injury (62%) followed by Chronic Hepatitis B (21%) and Hepatitis C (2%). In the remaining patients, the etiology was unknown (15%).
Table 3 — Echocardiographic changes among study subjects according to Child-Pugh score
Das S, et al. Study on Electrocardiographic and Echocardiographic Changes in Patients with Liver Cirrhosis.
Fig 3 — Mean QRS Voltage according to Child-Pugh stage
cirrhosis of liver patients according to Child-Pugh score
Fig 4 — Echocardiographic Changes in patients with cirrhosis of liver
Fig 2 — Frequency of ECG changes among study population (n=100)
Among the cirrhotic, 41 patients (41%) were in Child Pugh class A, 46 Patients (46%) were in severity class B, 13 patients (13%) were in severity Class C.
We found that QTc-prolongation was present in approximately 66% of the patients regardless of disease severity. QTc duration did not differ significantly between patients with alcoholic (mean QTc 448.61msec) and nonalcoholic cirrhosis (mean QTc 448.65msec).
Additionally, this study revealed that the QTc interval was higher with increasing severity of disease according to Child-Pugh class. A comparison of QTc interval amongst patients with decompensated cirrhosis (child pugh classB & class C) showed increased QTc duration (p value <0.001) with increasing severity of the disease. Our results were similar to Bernardi, et al and Salari, et al who also showed significant correlation between QTc and ChildPugh in their studies6,7 .
Also there was significant decrease in mean QRS voltage in both precordial and limb leads (p value 0.001 and 0.002 respectively) with increasing severity of disease. As with QTc prolongation, the presence of low-voltage QRS complex in ECG signifies impaired cardiac function and increased mortality8
We also found significant correlation between Tpe and increasing severity of cirrhosis with Child Pugh class B and C having shortened Tpe as compared to class A (p<0.001).These findings are in line with previous studies that recognize shortened Tpe as marker of autonomic dysfunction and repolarization abnormalities9
Among the various cardiovascular disease abnormalities, the incidence of diastolic dysfunction (34%) was found to be the commonest followed by pericardial effusion (23%), systolic dysfunction (7%) and pulmonary arterial hypertension had 6 (6%). In 30% patients there were no changes in Echocardiography
The comparison of diastolic dysfunction between three classes (Child Pugh class A , B & C) of cirrhosis of liver showed that there was statistically significant differences in two classes ie, Child Pugh class B versus C and A versus C. (p value were 0.008 and 0.0002 respectively). Therefore the diastolic dysfunction was significantly correlated with advancing stage of cirrhosis. Morever this diastolic dysfunction could be attributed to cirrhotic cardiomyopathy as there were no classical cardiac risk factors in our study population.This finding is similar to the study conducted by Salari A, et al10 .
While comparing the systolic dysfunction between three groups (Child Pugh ScoreA, B & C) we have found there was statistically significant differences between two groups ie, Child Pugh class B versus C & A versus C (p value were 0.028 and 0.001 respectively). Therefore systolic dysfunction was also well correlated with severity
of cirrhosis of liver
Similarly the differences in incidence of Pericardial effusion was also statistically significant in all three groups ie, Child Pugh class A versus B, B versus C and A versus C. p value were 0.001, 0.013 and 0.001 respectively
CONCLUSION
Cardiac dysfunction is a common complication of advanced cirrhosis that can present with variety of disturbances, especially QT interval prolongation and diastolic dysfunction. In conclusion, we showed that patients with cirrhosis exhibited prolongation in QTc interval and shortening of Tpe which are associated with the severity of the disease, regardless of the etiology of cirrhosis. Patients with cirrhosis with QTc prolongation have a worse prognosis, as compared to patients with normal QTc duration. In this regard QTc, QRS voltage and Tpe appear to be well correlated to the severity of the liver disease and may be used as diagnostic markers in the initial cardiologic evaluation of cirrhotic patients.Similarly Echocardiography plays a significant role in detecting early diastolic changes which can be attributed to CCM particularly in the absence of other cardiac risk factors.
Conflict of Interest : Authors report no conflict of interest. Funding : None.
REFERENCES
1 Liu H, Song D, Lee SS — Cirrhotic cardiomyopathy Gastroenterol Clin Biol 2002; 26: 842-7. [PubMed] [Google Scholar]
2 Izzy M, VanWagner LB, Lin G, Altieri M, Findlay JY, Oh JK, et al — Cirrhotic Cardiomyopathy Consortium. Redefining Cirrhotic Cardiomyopathy for the Modern Era. Hepatology 2019; 71: 334-45, doi:10.1002/hep.30875.
3 Bernardi M, Maggioli C, Dibra V, Zaccherini G — QT interval prolongation in the liver cirrhosis: Innocent by stander or serious threat? Expert Rev Gastroenterol Hepatol 2012; 6: 57-66.
4 Ma Z, Meddiings JB, Lee SS — Membrane physical properties determine cardiac beta-adrenergic receptor function in cirrhotic rats. Am J Physiol 1994; 267: G87-G93.
5 Usoro AO, Bradford N, Shah AJ, Soliman EZ — Risk of mortality in individuals with low QRS voltage and free of cardiovascular disease. Am J Cardiol 2014; 113: 1514-7.
6 Bernardi M, Calandra S, ColantoniA, Trevisani F, Raimondo ML, et al — Q-T interval prolongation in cirrhosis: prevalence, relationship with severity, and etiology of the disease and possible pathogenetic factors. Hepatology 1998; 27: 28-34.
7 Salari A, Shafaghi A, Ofoghi M, Saeidinia A, Mansour-Ghanaei F — Diastolic dysfunction and severity of cirrhosis in nonalcoholic cirrhotic patients. International Journal of Hepatology. 2013.
8 Madias JE — Low QRS voltage and its causes. Journal of Electrocardiology 2008; 41: 498-500.
9 Toma L, Stanciu AM, Zgura A, Bacalbasa N, Diaconu C, Iliescu L Electrocardiographic Changes in Liver Cirrhosis—Clues for Cirrhotic Cardiomyopathy
10 Salari A, Shafaghi A, Ofoghi M, Saeidinia A, Mansour-Ghanaei F : Diastolic dysfunction and severity of cirrhosis in nonalcoholic cirrhotic patients. International Journal of Hepatology
Original Article
Functional and Radiological Outcome of Shaft Humerus Fracture Treated with Anterior Bridge Plating by Minimally Invasive Plate Osteosynthesis Technique
Suchit V Shah1, Rajnikant Machhi
2,
Hareshkumar P Parmar
3
Abstract
Background : The humerus can be considered the most versatile bone in the human body in view of the fact that it can be successfully approached by a variety of methods for fracture fixation including functional bracing, plating (posterior, lateral and anterior), and intramedullary nailing (antegrade and retrograde). Plating can be performed using a classic open approach or minimally invasive methods. Historically, non-operative treatment has been effective, as these fractures heal relatively quickly, with shoulder and elbow joints compensating for any malalignment. However, modern patients seek faster recovery and earlier return to daily activities. In recent decades, significant advancements have been made in the surgical management of these fractures to improve healing rates and functional outcomes.
Aims and Objectives : To evaluate functional and radiological outcome of Anterior Bridge Plating for humerus shaft fracture using Minimally Invasive Percutaneous Osteosynthesis (MIPO) technique.
Material and Methods : This prospective study involves 20 cases of fracture with Diaphyseal Humerus Fracture aged more than 18 years. All patient underwent close reduction and internal fixation using Anterior Bridge Plating with MIPO technique. Functional and Radiological outcome were assessed using Constant and Murley Score System and Mayo Elbow Performance score as patient were followed up for 18 weeks.
Results : We had 80% excellent result,15% good result and 5% poor result and thus keeping result into consideration close reduction and internal fixation using Anterior Bridge Plating with MIPO technique remain the excellent treatment option for fracture of shaft humerus.
Conclusion : At the end of the study we concluded that Closed reduction with internal fixation with anterior bridge plating with Minimally Invasive Percutaneous Osteosynthesis (MIPO) technique gives anatomical reduction and stable fixation at fracture site hence leading to early mobilization of patient postoperatively. However, potential complications such as infection, implant failure, malunion and nonunion should be carefully considered and monitored.
Epidemiology and other social parameters related to Diaphyseal Humeral Fractures have not been extensively studied as those related to fractures occurring in other parts of the human skeleton, such as the proximal femur or the distal radius1 Nevertheless, the available bibliographical resources report that the general incidence of Humeral Shaft Fractures constitutes 1% to 2% of all fractures occurring in the human body2,3 and 13% to 14% of all fractures of the humerus4
It is obvious that little has changed in the nonoperative treatment of Diaphyseal Humeral Fractures since ancient times, as humeral fractures heal within a short time. During the treatment, patients are mobile and the shoulder and elbow joints compensate for residual malalignment. However, patients in modern times demand faster union rates and earlier return to pre-injury activities while preserving the functionality and motion of nearby joints.
Department of Orthopaedics, Sir Sayajirao General (SSG) Hospital, Vadodara, Gujarat 390001
1MS (Ortho), Orthopaedics
2MS (Ortho), Associate Professor and Corresponding Author
3MS (Ortho), Associate Professor
Received on : 02/04/2025
Accepted on : 27/04/2025
Editor's Comment :
nn nn n Anterior Bridge Plating using the MIPO technique is a safe, effective, and reproducible method for treating humeral shaft fractures, offering high union rates within 12 to 18 weeks and superior functional recovery nn n This approach minimizes surgical trauma and preserves blood supply, resulting in minimal scarring and a low risk of iatrogenic radial nerve injury
Therefore, over the last few decades, there have been significant advances in the field of surgical management of Diaphyseal Humeral Fractures.
Up to the age of 60 years, Diaphyseal Humeral Fractures occur equally in men and women and the incidence does not seem to increase with age. After the age of 60 years, 80% of patients are women5 and Humeral Shaft Fractures become more frequent (Fig 1)6,7 In a recent review study, Pidhorz reported that 15% to 25% of the fractures of the humeral diaphysis are located at the proximal third (usually oblique), 49% to 64% at the middle third (usually transverse) and 11% to 35% at the distal third (often accompanied with radial nerve injury), while their morphology is usually simple (56% to 63% of cases).
How to cite this article : Functional and Radiological Outcome of Shaft Humerus Fracture Treated with Anterior Bridge Plating by Minimally Invasive Plate Osteosynthesis Technique. Shah SV, Machhi R, Parmar HP J Indian Med Assoc 2026; 124(4): 45-9.
Plate fixation is a time-honoured procedure extensively studied over a long period of time giving satisfactory results. The disadvantages of conventional plate fixation include the need for a large incision, greater soft tissue damage, a higher risk of iatrogenic neurovascular injury, and an increased likelihood of implant infection.
Primary advantage of Anterior Bridge Plating that it involves a small incision with better cosmetic outcomes, minimal tissue damage, and reduced blood loss. The procedure lowers the risk of infection, radial nerve palsy, nonunion, and rotator cuff injury. It is suitable for a deformed humerus and allows early mobilization (Fig 1).
MATERIAL AND METHOD
This prospective study involves 20 cases of Diaphyseal Humerus Fractures managed with internal fixation using Anterior Bridge Plating using Minimally Invasive Percutaneous Osteosynthesis (MIPO) technique. Patients presenting with displaced Diaphyseal Humerus Fractures in skeletally matured cases, managed surgically with an Anterior Bridge Plating were included in the study Exclusion criteria include age of less than 18 years, any atraumatic, compound fracture and fracture with any neurovascular injury This study was undertaken at a Government-run Tertiary Care Centre with approval from the Institutional Ethics Committee of Medical College and Sir Sayajirao General Hospital, Vadodara, India, from November, 2021 to December, 2022.
All the patient was operated with Brachial block and sedation; the supine position was taken on a plain table. Arm positioned on a radiolucent board, Shoulder is kept in slight abduction to allow access to the anterior humerus, Elbow flexed at 90 degrees to relax the radial nerve and prevent excessive tension. Proximal window was created by taking incision of 5-7 cm long beginning just below coracoid process (Identify groove between deltoid and biceps tendon. Identify and protect cephalic vein) and distal window was created by taking and incision of about 5-7 cm longitudinally over lateral border of biceps brachii in distal third of arm (identify muscular interval between
biceps brachii and brachialis) to reduce diaphyseal humerus fracture. A 4.5-mm stainless steel or titanium locking compression plate was advocated for fixation in all fractures. The Diaphyseal Humerus Fracture segment was reduced with closed reduction and fixed with locking compression plate proximally and distally using an image intensifier. All patients were given CC sling for temporary immobilization postoperatively till they got accustomed to physiotherapy. Parenteral broad-spectrum antibiotics and analgesics were given for 2 days after surgery until the first dressing and shifted to oral antibiotic and analgesic. After first dressing, patients were prescribed to do Elbow flexion-extension followed by 90 degrees shoulder abduction on 7th postoperative day. On discharge oral nonsteroidal anti-inflammatory drugs (as and when required) were given for pain management and oral antibiotics till suture removal on the 14th postoperative day (Fig 2).
First, we did follow-up at the 4th week, clinical status and fracture union noted, X-ray were taken to confirm the progress of union. The shoulder and elbow range of motion were noted, any complaint regarding pain was noted. Patient were regularly followed up at every 4 weeks till 24 weeks.At each follow-up, shoulder and elbow range of movements, suture site infection, or other complications were noted and X-rays were done to assess fracture healing. At the final follow-up at 24 weeks, the outcome was evaluated using Constant and Murley score and Mayo Elbow Performance score.
OBSERVATIONS AND RESULTS
Our study comprises 20 cases with fractures of the diaphyseal humerus. All patients were managed using a Shaft humerus locking compression plate. The age distribution was from 18 to 70 years, in our study majority of the patients (90%) are of age group 18-60 years which is working age, with a mean age of 40.55 years. The sex ratio was 3:2 with 60% (12) males and 40% (8) females. Left-side fractures were more common in our study than
Fig 1 — Frequency of incidence according to age
Fig 2 — Intra-operative images
Shah SV, et al. Functional and Radiological Outcome of Shaft Humerus Fracture Treated with Anterior Bridge Plating.
Right-side fractures (left: 12, right 8). Road traffic accident was noted in 12 patients, fall on outstretched hand was noted in 6 patients and Assault was noted in 2 patients. In our study 14(70%) patients did strenuous work including 4(20%) Manual laborers and 10(50%) Farmers. Most of the patients in our study were young and had no comorbidities only 2(10%) had Hypertension, 1(5%) had Diabetes and 1(5%) patient was a chronic Smoker
As perAO classification 3 patients had Type-A1,7 patients had Type-A2,7 patients had Type-A3,3 patients had TypeB2. Open grade fractures were less common (2 patients). Associated injury like head injury were less common (2 patients). All the patients were operated within 5 days of injury
On the basis ofAO Classification all 3 patients with TypeA1 fracture had excellent result, out of 7 patients with Type-A2 fracture 6 patients had excellent and 1 patient had Good Outcome, out of 3 patients in fracture group Type-B2, 1 patient had excellent and 1 patient had good result while 1 patient had poor result.
Out of the 20 patient 1 patient developed superficial infection after 7 days for which blood investigations and culture and sensitivity were done. Superficial infection was resolved by debridement, daily dressing and parenteral antibiotics. This patient was discharged from the hospital after the wound healed with oral antibiotics (Table 1, Fig 3).
Illustrative Case
24-year-old male presented after a Road traffic accident with closed injury over Left arm. He was diagnosed with 12B2 type fracture of middle 1/3rd shaft humerus left side. The patient was primarily managed by giving injectable
pain killer and essential fluid and then the fracture was provisionally stabilized with high above elbow slab when he came to the hospital. We operated on the same day of admission. Closed reduction internal fixation using locking compression plating (Figs 4-8).
Fig 3 — Results on the basis of AO Classification
Table 1 — Observation and Result according to AO/OTA Classification
Fig 4 — Pre-operative X-ray
Fig 5 — Intra-operative X-ray
Fig 6 — Immediate Post-operative X-ray
Fig 7 — Final Follow-up X-ray After 6 Month
Shah SV, et al. Functional and Radiological Outcome of Shaft Humerus Fracture Treated with Anterior Bridge Plating.
DISCUSSION
Operative Techniques for Diaphyseal Humerus Fractures include closed reduction techniques like humerus Ender’s nail, TENS, humerus interlocking nail and open reduction techniques like posterior plating, posterolateral plating. For open grade humerus diaphyseal fractures external fixator can be used. Anterior bridge plating combines the advantage of closed reduction through MIPO technique and advantages of plating8-11 .
The primary advantage of Anterior Bridge Plating (ABP) is the combination of stability with minimal soft tissue and periosteal disruption12,13. Unlike the posterior plating option, it requires a small incision and adheres to the MIPO principle, which is biologically and cosmetically preferable. In addition, the rotator cuff is spared preventing any major shoulder pathology later on, which is the case in humeral nailing14
The potential for rotator cuff damage during conventional antegrade nailing makes it an unattractive option in this population. The posterior plating involves greater soft tissue stripping and larger incisional scars. The ABP is the ‘logical middle’ in this case.
TheABP follows the principle of relative and elastic stability instead of the absolute rigidity in the Open Reduction and Internal Fixation (ORIF) achieved by a posterior approach. In the former, healing takes place by secondary healing and callus formation, which is stronger, whereas in the latter, it is done by primary healing without callus formation15,16,17 The purpose of using a long plate inABP is to decrease the stress per unit area as by distributing
over a larger surface area18. So this plate, which is placed on the ‘anterior tensile surface,’ can withstand a larger amount of rotational and bending stresses than the shorter plate.
The radiological union was seen at a mean time of 13.5 weeks. According to Constant and Murley score after 6 months follow-up 16(80%) patient had excellent,3(15%) patient had good result,1(3%) had poor result owing to associated habit of chronic smoking and noncompliance of Physiotherapy. Patient has persistent pain and reduced range of motion and limitation of daily activity According to Mayo Performance score at 6 months of follow up, 16(80%) patient had excellent, 3(15%) patient had good result and rest 1 (5%) had poor outcome. Average Outcome score at 1-month follow-up was 66.6 and that at 6 months follow-up was 93.
CONCLUSION
The study was done on 20 patients and we concluded that Anterior Bridge Plating is an effective minimally invasive surgical technique for managing Diaphyseal Humerus Fractures, especially in comminuted and segmental fractures. It provides relative stability, preserves periosteal blood supply, and minimizes soft tissue damage, leading to faster healing and functional recovery This technique is particularly useful in cases where traditional plating or intramedullary nailing may not be ideal. However, careful preoperative planning, proper limb positioning, and meticulous surgical technique are essential to avoid complications such as radial nerve injury or malalignment. Overall, Anterior Bridge Plating offers a biologically friendly and clinically effective alternative to conventional fixation methods, with high union rates and good functional outcomes.
Funding : None.
Conflict of Interest : None.
REFERENCES
1 Brinker MR, O’Connor DP The incidence of fractures and dislocations referred for orthopaedic services in a capitated population. J Bone Joint Surg Am 2004; 86-A (2): 290-7.
2 Court-Brown CM, Caesar B — Epidemiology of adult fractures: A review Injury 2006; 37(8): 691-7.
3 Kanis JA, Johnell O, Oden A — Epidemiology of osteoporosis and fracture in men. Calcif Tissue Int 2004; 75(2): 90-9.
4 Lovald S, Mercer D, Hanson J — Complications and hardware removal after open reduction and internal fixation of humeral fractures. J Trauma 2011; 70(5): 1273-7; discussion 1277-1278.
5 Tytherleigh-Strong G, Walls N, McQueen MM — The epidemiology of humeral shaft fractures. J Bone Joint Surg Br 1998; 80(2): 24953.
6 Kim SH, Szabo RM, Marder RA — Epidemiology of humerus fractures in the United States: Nationwide emergency department
Fig 8 — Clinical images of ROM at final follow up at 6 months (excellent outcome)
Shah SV, et al. Functional and Radiological Outcome of Shaft Humerus Fracture Treated with Anterior Bridge Plating.
sample, 2008. Arthritis Care Res (Hoboken) 2012; 64(3): 407-14.
7 Singer BR, McLauchlan GJ, Robinson CM — Epidemiology of fractures in 15,000 adults: The influence of age and gender J Bone Joint Surg Br 1998; 80(2): 243-8.
8 Reboso MLE AA, Valdes GD, Aguirre-Jaime A — Epidemiological review of humeral shaft fractures in adults. Retrospective study Rev Ortp Traumatol 2001; 45: 10-6.
9 Tsai CH, Fong YC, Chen YH — The epidemiology of traumatic humeral shaft fractures in Taiwan. Int Orthop 2009; 33(2): 463-67.
10 Ekholm R, Adami J, Tidermark J — Fractures of the shaft of the humerus. An epidemiological study of 401 fractures. J Bone Joint Surg Br 2006; 88(11): 1469-73.
11 Kim SH, Szabo RM, Marder RA — Epidemiology of humerus fractures in the United States: Nationwide emergency department sample, 2008. Arthritis Care Res (Hoboken) 2012; 64(3): 407-14.
12 Jiang R, Luo CF, Zeng BF, Mei GH — Minimally invasive plating for complex humeral shaft fractures. Arch Orthop Trauma Surg 2007; 127(7): 531-5.
13 Malhan S, Thomas S, Srivastav S — Minimally invasive plate osteosynthesis using a locking compression plate for diaphyseal humeral fractures. J Orthop Surg (Hong Kong) 2012; 20(3): 292-6.
14 Singisetti K,Ambedkar M — Nailing versus plating in humerus shaft fractures: a prospective comparative study Int Orthop 2010; 34(4): 571-6.
15 Fabio Teruo M, Jun Sugawara TM, Marcelo Hide M, Nicola Archetti N, Flavio F, Joao Carlos B — Minimally Invasive Osteosynthesis with a Bridge Plate Versus a Functional Brace for Humeral Shaft
16 An Z, Zeng B, He X, Chen Q, Hu S — Plating osteosynthesis of mid- distal humeral shaft fractures: minimally invasive versus conventional open reduction technique. Int Orthop 2010; 34(1): 131-5.
Background : Vitamin B12 deficiency is increasingly recognized in India, particularly among populations consuming predominantly vegetarian diets. However, deficiency is also seen in non-vegetarians due to malabsorption and autoimmune causes.
Materials and Methods : A cross-sectional observational study was conducted in a Tertiary Care Hospital in Kolkata. Patients presenting with clinical features suggestive of Vitamin B12 deficiency were evaluated. Serum Vitamin B12 levels were estimated using standard biochemical assays.
Results : Out of approximately 4,000 patients screened, 450 were found to have Vitamin B12 deficiency The male-to-female ratio was 5:4. Vegetarians constituted 80% of cases. Neurological manifestations were seen in 179 patients (39.77%), anemia in 93 patients (20.66%) and both in 178 patients (39.55%). Megaloblastic anemia was present in 211 patients (46.88%), while 60 patients (13.33%) had Dimorphic anemia. Serum Vitamin B12 levels were below 189 pg/mL in 280 patients (62.22%) and below 125 pg/mL in 170 patients (37.77%).
Conclusion : Vitamin B12 deficiency is highly prevalent and often underdiagnosed. Early recognition and timely intervention are essential to prevent irreversible neurological damage. Universal availability and awareness of Vitamin B12 supplementation are necessary irrespective of dietary habits.
Vitamin B12 (cobalamin) is a water-soluble vitamin essential for normal hematopoiesis, DNA synthesis, and neurological function1,2. It is primarily obtained from animal-derived foods such as meat, fish, eggs, and dairy products. Consequently, populations consuming strict vegetarian diets are at increased risk of deficiency1
Despite substantial hepatic stores that may last several years, Vitamin B12 deficiency can occur due to malabsorption, autoimmune gastritis, dietary insufficiency, or prolonged use of certain medications. The clinical manifestations are diverse, encompassing hematological, neurological and psychiatric features1,3 . Due to its insidious onset and nonspecific symptoms, Vitamin B12 deficiency often remains undiagnosed until advanced stages.
MATERIALS AND METHODS
A cross-sectional observational study was conducted in the Outpatient Department of a Tertiary Care Hospital in Kolkata, West Bengal. Patients aged 18 years and above
Department of General Medicine, Jagannath Gupta Institute of Medical Sciences and Hospital, Kolkata 700137
1MD (Medicine), Professor and Corresponding Author
2MD (Medicine), PDT DM Neurology, Department of Neurology, National Institute of Mental Health and Neurosciences, Bengaluru, Karnataka 560029
3MD (Medicine), Professor
4MBBS, Postgraduate Trainee
5MS (Ophthalmology), Professor and Head, Department of Ophthalmology
Received on : 17/02/2026
Accepted on : 04/04/2026
Editor's Comment :
nn n Diseases in India like Vitamin B12 deficiency are relevant particularly in the affluent who are TRUE Vegetarian and poor who cannot afford to take Vitamin B12.
nn nn n Many patients suffering from severe Vitamin B12 deficiency are not properly diagnosed in time.
nn n Food supplements are very important to prevent Vitamin B12 deficiency
presenting with symptoms suggestive of Vitamin B12 deficiency - such as paresthesia, gait unsteadiness, fatigue, cognitive impairment, and visual disturbanceswere included.
Inclusion Criteria :
nn nn n Age >18 years.
nn nn n Clinical features suggestive of Vitamin B12 deficiency.
Exclusion Criteria :
nn nn n Prior treatment with vitamin or mineral supplements within the last two years.
nn n Refusal to give informed consent.
Demographic data including age, sex, dietary habits, and comorbidities were recorded. Detailed clinical examination was performed. Blood samples were collected for estimation of serum Vitamin B12, folate, and ferritin using standard biochemical assays.
Out of 4000 patients evaluated, 450 were identified to have Vitamin B12 deficiency, with or without associated iron or folate deficiency
How to cite this article : Vitamin B12 Deficiency : Tip of the Iceberg. Ghosh S, Bagchi AS, Sarkar M, Saha SK, Mukherjee M, Ghosh MK. J Indian Med Assoc 2026; 124(4): 50-2.
RESULTS
Demographic Profile :
nn n Total patients screened : 4000
nn n Vitamin B12 deficient patients : 450 (11.25%)
nn n Male : Female ratio = 5 : 4
nn n Vegetarians : 360 (80%)
Presenting Clinical Features (Table 1)
Neurological Manifestations (Table 2)
Hematological Findings (Table 3)
Biochemical Parameters (Table 4)
Comparison with Previous Study (Tables 5 & 6)
Table 1 — Summarizes the distribution of presenting issues across the patients
Table 6 — Compares the Neurological features reported between this study and the Wadia RS, et al Neurology India, 2000 study
Neurological Feature Present Study Previous Study*
Table 2 — Summarises the distribution of neurological manifestations across the patients
*Wadia RS et al, Neurology India, 20004
DISCUSSION
This study demonstrates a high prevalence of Vitamin B12 deficiency in an OPD-based population, with a clear predominance among Vegetarians. The findings are consistent with earlier Indian studies and reinforce the association between vegetarian diets and Vitamin B12 deficiency
Case 1 : Megaloblastic Anemia in a Strict Vegetarian
Female
A 45-year-old woman, a strict vegetarian for more than 20 years, presented with progressive fatigue, exertional dyspnea, and generalized weakness for three months. There was no history of blood loss, chronic illness, or prior vitamin supplementation.
Clinical examination revealed pallor without icterus, lymphadenopathy, or organomegaly. Neurological examination was unremarkable. Hematological evaluation showed macrocytic anemia with Hemoglobin of 7.8 g/dL and elevated mean corpuscular volume. Peripheral smear was suggestive of Megaloblastic anemia.
Table 3 — Summarizes the distribution of hematological findings across the patients
Table 4 — Summarizes the results of biochemical parameters tested for namely, Vitamin B12, folic acid and ferritin among the patients
Serum Vitamin B12 level was markedly reduced, while folate and iron studies were within normal limits. A diagnosis of Vitamin B12 deficiency–induced Megaloblastic Anemia was made. The patient responded well to parenteral Vitamin B12 therapy, with improvement in Hemoglobin levels and clinical symptoms. This case highlights dietary deficiency as a common and preventable cause of Vitamin B12 deficiency in vegetarian populations.
Table 5 — Compares the sample size, study population and prevalence of Vitamin B12 deficiency between this study and Wadia RS, et al Neurology India, 2000 study
Parameter Present Study
* Wadia RS, et al Neurology India, 20004
Neurological manifestations were more frequent than hematological manifestations, highlighting the neurotropic nature of Vitamin B12 deficiency. Peripheral neuropathy was the most common presentation, followed by posterior column involvement and psychiatric symptoms. These findings emphasize the need for early detection, as neurological damage may become irreversible if treatment is delayed.
Case 2 : Autoimmune Vitamin B12 Deficiency
Presenting with Neuropsychiatric Manifestations
A69-year-old male presented with long-standing cognitive dysfunction, behavioral changes, and memory impairment for nearly two years, for which he was receiving psychiatric
Ghosh S, et al. Vitamin B12 Deficiency : Tip of the Iceberg.
treatment. Subsequently, he developed progressive fatigue and was found to have severe anemia.
Upper Gastrointestinal Endoscopy with endoscopic Ultrasound was performed as part of anemia evaluation and revealed multiple gastric nodules. Histopathological examination confirmed a gastric neuroendocrine tumor, with tumor cells expressing synaptophysin and chromogranin A on immunohistochemistry.
Further evaluation revealed markedly reduced serum Vitamin B12 levels and positivity for anti-parietal cell antibodies, suggestive of autoimmune gastritis leading to Vitamin B12 deficiency The patient was diagnosed with autoimmune-mediated Vitamin B12 deficiency with neuropsychiatric manifestations.
Vitamin B12 replacement therapy was initiated, leading to partial improvement in hematological parameters and stabilization of neurological symptoms.
This case underscores the importance of considering Vitamin B12 deficiency in patients with unexplained neuropsychiatric symptoms and anemia and highlights autoimmune gastritis as an important non-dietary etiology
The prevalence observed in this study was higher compared to previous inpatient-based studies (4), likely due to broader OPD screening capturing milder and earlier disease stages (Fig 1).
CONCLUSION
Vitamin B12 deficiency is a major yet underrecognized public health problem in India. The high prevalence, particularly of neurological manifestations, underscores the importance of routine screening in high-risk populations such as vegetarians and the elderly1. Early diagnosis and prompt supplementation2 can prevent permanent neurological sequelae. Public health strategies should prioritize awareness and accessibility of Vitamin B12 supplementation1
1 — Endoscopic Ultrasound report of Case 2, showing multiple hyperechoic lesions in the muscularis mucosae of the stomach
Funding : None.
Conflict of Interest : None.
REFERENCES
1 Dubey A — India’s unseen nutritional emergency: A meta-analysis of Vitamin B12 deficiency Eur J Cardiovasc Med 2025.
2 Stabler SP — Vitamin B12 deficiency N Engl J Med 2013; 368: 149-60.
3 Umekar M — Vitamin B12 deficiency and cognitive impairment: A comprehensive review Sci Direct 2025.
4 Wadia RS, Bandishti S, Kharche M — B12 and Folate Deficiency Incidence and Clinical Features. Neurology India 2000; 48(4): 3024.
Fig
Ghosh S, et al. Vitamin B12 Deficiency : Tip of the Iceberg.
Original Article
Parental Education Matters : A Multicentric Study on Adolescent Self-Esteem and Test Anxiety in India
Background : Family and educational environments strongly influence academic success and emotional well-being during adolescence. This multicentric study by the Association of Adolescent and Child Care India (AACCI) examined the relationship between self-esteem and test anxiety among adolescents, focusing on the impact of parental education and coaching class attendance.
Materials and Methods : 1,128 adolescents from four Indian cities - Pune, Mumbai, Surat and Vadodara - participated in the study The Rosenberg Self-Esteem Scale and the Friedben Test Anxiety Scale were administered to assess self-esteem and test anxiety levels, respectively. Data were analysed using appropriate statistical tests to compare mean scores across parental educational levels and coaching attendance (p<0.05 considered significant).
Results : A significant positive association was found between maternal education and adolescent self-esteem (M = 29.06, SD = 4.49; p = 0.005, p<0.01), stronger than that observed for paternal education. Coaching class attendance was associated with lower self-esteem (M = 28.85, SD = 4.20; p = 0.001, p<0.001). With respect to test anxiety, higher maternal education correlated with lower anxiety levels (M = 8.10, SD = 5.24; p = 0.001, p<0.001), while coaching classes were linked to increased test anxiety, particularly among students in Pune (M = 8.17, SD = 5.22; p<0.001).
Conclusion : Higher parental - especially maternal - educational levels enhance adolescent self-esteem and buffer against test anxiety, likely by improving communication, coping strategies and emotional support. Conversely, competitive coaching environments may heighten stress and reduce confidence. Strengthening parental guidance and balanced learning environments can promote healthier adolescent development.
Key words : Adolescent, Self Esteem, Test Anxiety, Parental Education, Coaching Class, Emotional Wellbeing.
In today’s competitive academic landscape, a single mark can open doors to opportunity - or close them just as quickly1 . This intense environment has fueled the rise of extra coaching classes, especially across urban India. Adolescents today are navigating not only textbooks but also a maze of parental expectations, peer comparisons, and self-judgment. These combined pressures can gradually erode emotional resilience and, paradoxically, impair the learning skills they aim to enhance.
Two psychological constructs lie at the heart of this challenge - self-esteem and test anxiety
Research Forum, Association of Adolescent and Child Care in India (AACCI), Pune, Maharashtra 411039
5DNB (Pediatrics), National Parent Forum In-Charge
6PhD, Research Co-ordinator
7MA, Clinical Psychologist, Research Assistant
8M PhD, advisor
9MSc, Chairperson
10PGDIM, Statistician
Received on : 28/11/2025
Accepted on : 04/04/2026
Editor's Comment :
nn nn n Higher parental education - especially maternal educationsignificantly improves adolescent self-esteem, helping children feel more confident, capable and emotionally secure.
nn n Maternal education has a stronger and more consistent impact thanpaternaleducationonbothself-esteemandtestanxiety,likely due to greater day-to-day academic and emotional involvement.
nn nn n Higher parental education is associated with lower test anxiety, enabling adolescentstocopebetterwithexamstressandperform more effectively
nn n Coaching classes, despite their academic intent, are linked to increased test anxiety and reduced self-esteem, highlighting the pressure of competitive learning environments.
nn nn n A supportive, educated home environment enhances emotional resilience and academic confidence, emphasizing that parenting style and involvement matter as much as academic exposure.
Self-esteem acts as a quiet inner compass, guiding adolescents’ sense of worth and competence. During the formative years of identity building, it functions as a psychological glue that helps preserve self-image2 Adolescents with healthy self-esteem approach challenges confidently, recover more easily from setbacks, and sustain focus in academic settings.
In contrast, test anxiety operates like a heavy fog that clouds cognition and performance. It interferes with concentration, disrupts memory retrieval, and distorts self-
How to cite this article : Parental Education Matters :AMulticentric Study onAdolescent Self-Esteem andTestAnxiety in India. Kariya PV, Bhave SY, Pradeep M, Shah SR, Kavade SG, Joshi SV, Pethkar KP, Sovani AV, Bhave YS, Kulkarni L. J Indian Med Assoc 2026; 124(4): 53-60.
assessment, often leading to lower academic outcomes3
Family dynamics - particularly parents’ educational levels - play a vital role in shaping these psychological outcomes4. Parental education often predicts children’s cognitive and emotional development, with maternal education repeatedly linked to higher literacy, healthier behaviours, and greater emotional regulation in offspring5
By contrast, after-school coaching classes, while intended to boost academic performance, can sometimes amplify performance pressure and erode intrinsic motivation, leading to heightened test anxiety and diminished selfworth6
Very few Indian studies have simultaneously explored the interrelationships among parental education, coaching attendance, self-esteem, and test anxiety, particularly in diverse urban settings. The present study aims to fill this gap by analyzing adolescent data across four culturally distinct Indian cities - Pune, Mumbai, Surat and Vadodara—to understand better how family education and external coaching environments influence adolescents’ emotional health and academic confidence.
AIMS AND OBJECTIVES
The Association of Adolescent and Child Care in India (AACCI), founded in 2007, conducts multicentric research on youth behaviour across India using validated psychometric tools. Data collected duringAACCI’s school awareness programs guide evidence-based interventions to enhance students’ emotional well-being and academic performance. With India’s high-stakes exam culture driving stress and self-esteem issues, AACCI focuses on increasing self-esteem and confidence of adolescents while also reducing exam anxiety through programs, that build effective study habits, teach stress management, and engage parents and teachers in creating supportive learning environments.
The following objectives guided the study :
(1) To examine how parental education relates to adolescents’ self-esteem and test anxiety, with specific attention to differences between maternal and paternal education levels.
(2) To identify city-specific trends in these relationships across Pune, Mumbai, Surat and Vadodara, highlighting variations in academic and emotional pressures across urban centres.
MATERIALS AND METHODS
Study Design :
This was a cross-sectional, multicentric study organized by the Association of Adolescent and Child Care in India
(AACCI). Data were collected across four major citiesPune, Mumbai, Surat, and Vadodara - each representing distinct urban demographics and schooling contexts.
Sample Size and Participants
Atotal of 1,128 adolescents aged 10-24 years participated in the study. Participants were recruited through convenience sampling from local schools and coaching institutes. For minors, written informed consent was obtained from both the student and a parent/guardian. Participation was voluntary, and confidentiality was strictly maintained. The Mumbai cohort was from an all-women’s college, whereas the Surat, Vadodara and Pune cohorts were from c-education schools.
Inclusion & Exclusion Criteria
Students were included in the study only if parental consent and student assent were obtained. There were no specific exclusion criteria.
Assessment Tools
(1) Rosenberg Self-Esteem Scale (RSES) –Aglobally validated measure of self-esteem, developed by Rosenberg (1965), comprising 10 items rated on a fourpoint Likert scale7. Low self-esteem scores fall below 14, normal self-esteem scores fall between 15-25 and high self-esteem scores fall above 26. The scale can give the lowest score of 10 and a highest score of 40. It demonstrates a Guttman scale coefficient of reproducibility of 0.92, indicating excellent internal consistency Test-retest reliability over 2 weeks reveals correlations of 0.85 and 0.88, indicating excellent stability. It demonstrates concurrent, predictive, and construct validity using known groups. It also correlates significantly with other measures of self-esteem, including the Coopersmith Self-Esteem Inventory1 .
(2) Friedben Test Anxiety Scale (FTAS) – A standardized instrument assessing three domains of test anxiety: Social Derogation, Cognitive Obstruction, and Tenseness (Friedben, 1981). It provides a comprehensive view of exam-related stress’s emotional, cognitive, and behavioural dimensions8. Scores >7 in each domain is considered significant. The FTAS is a scale of 23 questions each scored between 0 and 1, thus having a minimum score of 0 indicating the absence of test anxiety, and a maximum score of 23. Total scores of 7 and above indicates significant anxiety The scale has 3 components or factors – 8 questions covering “Social Derogation”, 9 questions covering “Cognitive Obstruction” and 6 questions covering “Tenseness”. The internal consistency (Cronbach’s alpha) of the total and the three sub-scales of the FTA has proved satisfactory (range: .81-.91). In terms of validity, the FTAS shows correlations of 0.82 (girls) and 0.84 (boys) with the Test Anxiety Inventory. It has also been shown to be significantly correlated with
Kariya PV, et al. Parental Education Matters : A Multicentric Study on Adolescent Self-Esteem and Test Anxiety in India.
peer evaluations of the degree to which test-related stress is experienced (Total: 0.54; Fear of Social Derogation: 0.52; Cognitive Obstruction: 0.64; and Tenseness: 0.78.
Data Collection Procedure
Data were collected through a secure, anonymous online questionnaire distributed via partner schools and coaching classes. The first page of the questionnaire provided detailed information about the study, emphasized voluntary participation, and assured anonymity. The study lasted from April, 2022 to July, 2022. Ethical clearance was obtained from the AACCI Institutional Ethics Committee, ensuring adherence to all research ethics guidelines on 1st April, 2022 (Ref.No. AACCI/IEC/2022/04).
Statistical Analysis
All data were analysed using GNU PSPP and IBM SPSS (version 26.0). Descriptive statistics (Mean, Standard Deviation and Range) were computed for all continuous variables. Between-group differences were assessed using independent-sample t-tests and one-way ANOVA. Pearson’s correlation coefficient (r) was applied to examine the relationship between self-esteem and test anxiety A p-value <0.05 was considered statistically significant.
RESULTS AND DISCUSSION
Table 1. presents the age and gender distribution of the 1,128 adolescents included in the study. Participants ranged in age from 10 to 24 years, with a mean age of 14.19 years (SD = 2.71) and a median age of 14 years (IQR = 4). The sample comprised 48.67% males and 51.33% females, reflecting a near-equal gender representation.
Most participants belonged to the early (10-13 years) (42.46%) and middle adolescent (14-16 Years) (38.39%) stages, aligning with the age group typically exposed to heightened academic pressures and transitional challenges. A smaller proportion represented late adolescents (17-19 years) (14.98%) and young adults (2024 years) (4.17%)
Table 2 shows the city-wise age and gender distribution of 1128 adolescents from four cities. Overall, 53.1% were
Table 1 — Age and Gender Distribution of Adolescents from 4 cities (n=1128)
Adolescence stage
Early 10-13 years 258 (53.86%)221 (46.14%)479 (42.46%)
Mid 14-16 years 231 (53.35%)202 (46.65%)433 (38.39%)
Late 17-19 years 60 (35.50%) 109 (64.50%)169 (14.98%)
Young Adult 20-24 years 0 (0%) 47 (100.0%) 47 (4.17%)
Total 549 (48.67%)579 (51.33%) 1128 (100.0%)
Age range 10-24 years median age IQR – 14(4) mean Age 14.19 (SD 2.71 )
Table 2 — City-wise Age and Gender Distribution of Adolescents from 4 cities (n=1128)
City and Male No (%) Female No (%) Total No (%)
Adolescence stage
Pune (n=416) 222 (53.37%)194 (46.63%)416 (36.88%)
Early 10-13 years 130 (55.08%)106 (44.92%)236 (20.92%)
Mid 14-16 years 90 (51.43%)85 (48.57%) 175 (15.51%)
Late 17-19 years 2 (40.00%)3 (60.00%) 5 (0.44%)
Age range 10-17 years median age IQR-13(3) mean Age 13.02 (SD 1.76)
Surat (n=418) 219 (52.39%)199 (47.61%)418 (37.06%)
Early 10-13 years 116 (51.10%) 111 (48.90%) 227 (20.12%)
Mid 14-16 years 94 (54.65%)78 (45.35%) 172 (15.25%)
Late 17-19 years 9 (47.37%) 10 (52.63%) 19 (1.68%)
Age range 10-19 years median age IQR-13(4) mean Age 13.16 (SD 2.03)
Early 10-13 years 12 (75.00%) 4 (25.00%)16 (1.42%) Mid 14-16 years 47 (54.65%)39 (45.35%) 86 (7.62%) Late 17-19 years 49 (77.78%)14 (22.22%) 63 (5.59%)
Age range 10-18 years median age IQR-16(2) mean Age 15.87 (SD 1.55) Mumbai (n=129) 0 (0 %) 129 (100.0%) 129 (11.44%) Late 17-19 years 0 (0 %) 129 (100.0%) 82 (7.27%) Young Adult 20-24 years 0 (0 %) 129 (100.0%) 47 (4.17%)
Age range 17-24 years median age IQR-19(2) mean Age 19.17 (SD 1.29)
males and 46.9% females. Pune (36.9%) and Surat (37.1%) contributed the majority of participants, followed by Vadodara (14.6%) and Mumbai (11.4%).
In Pune, most participants were in early adolescence (1013 years; 56.7%) with a mean age of 13.02 ± 1.76 years. Surat showed a similar pattern (mean age=13.16 ± 2.03 years). In contrast, Vadodara participants were predominantly mid-to-late adolescents (mean age=15.87 ± 1.55 years). The Mumbai data was collected from an all-women college, we had taken this as comparison for age from late adolescent and young adult category, (1724 years; mean age 19.17 ± 1.29 years).
Thus, the sample included a balanced gender distribution in early and mid-adolescent groups, with older female participants primarily from Mumbai.
Table 3.1 presents the descriptive statistics for self-esteem scores across the four participating cities. The overall mean self-esteem score was (M=28.95 ± 4.46), with citywise means ranging from 27.73 (Vadodara) to 29.56 (Surat) ie, high self-esteem. Median scores also varied
Table 3.1 — Self-esteem Scores of Adolescents from 4 cities (n=1128) Total Pune Surat Vadodara Mumbai (n=1128) (n=416)(n=418)(n=165)(n=129)
Kariya PV, et al. Parental Education Matters : A Multicentric Study on Adolescent Self-Esteem and Test Anxiety in India.
across locations (27-30), indicating differences in the distribution of self-esteem scores across the four-city samples. Vadodara showed the highest variability (SD = 5.49), while Mumbai had the narrowest score range (SD=3.97). A Kruskal-Wallis test was conducted to compare the self-esteem scores across the four cities, Pune, Surat, Vadodara and Mumbai (ANOVA could not be undertaken as the variance homogeneity requirements for conducting an ANOVA were not fulfilled). The mean ranks for self-esteem scores were 546.05 for Pune, 611.39 for Surat, 503.21 for Vadodara and 550.47 for Mumbai. Results of the Kruskal-Wallis test indicated statistically significant differences in self-esteem scores across the four cities (χ2(3) = 16.16, p=.001). This indicates that the participants across the four cities may be subject to differentiating factors that affect their self-esteem scores. This paper attempts to examine whether parental education is associated with adolescents’ self-esteem and whether these associations vary across the cities sampled.
The Table 3.2 gives more information on how parental educational levels affect self-esteem. It indicates that adolescents whose both parents had completed schooling reported higher self-esteem scores (M = 29.12, SD = 4.49) than those whose one or both parents had not completed schooling (M = 28.10, SD = 4.27). This difference was statistically significant across all four cities (p = 0.043, p<0.05), indicating a positive association between parental educational attainment and adolescent self-esteem.
Table 3.2 suggests that there was a statistically significant positive correlation between self-esteem and parental education. Adolescents whose mothers had completed schooling reported higher RSES scores (29.01 ± 4.51) than those whose mothers had not (27.76 ± 4.43, p = 0.037, p<0.05). Likewise, when both parents had completed at least schooling, self-esteem levels were higher (29.12 ± 4.49) than when one or both parents had not (28.10 ± 4.27, p = 0.043).
When analyzed across three levels of maternal education,
a consistent positive trend was observed: adolescents of postgraduate mothers had the highest self-esteem scores (29.67 ± 4.41), followed by those of graduate mothers (29.07 ± 4.51) and those of below-graduate mothers (28.41 ± 4.47; p = 0.005, p < 0.01). These findings suggest that in our study, these adolescents will most likely experience greater self-worth, emotional security, and academic confidence as maternal educational attainment increases.
Table 4.1 gives information about the distribution of total FTAS scores and their subfactors across 4 cities. Significant variations were found in the distributions of total FTAS score and their subfactor scores across cities. With the exception of the Tenseness Factor (T) scores, all the other scores related to FTAS displayed heteroscedasticity and hence Kruskal-Wallis tests were carried out to test the significance of the difference between the total FTAS scores and two of its subfactor scores namely Social Derogation Factor (SD) scores and Cognitive Obstruction Factor (CO) scores, while ANOVA was carried out to assess the significance of the inter-city difference in T scores.
Total FTAS scores varied significantly across the four cities (χ2(3)=27.91, p<.001), as did the SD scores (χ2(3)=14.85, p=.002), CO scores (χ2(3)=24.91, p<0.001 and T scores (F(3,1124) = 9.61, P <0.001).
The following findings were discovered after the posthoc tests.
Total FTAS scores :
1. Mumbai (Mdn=10) had significantly higher Total FTAS scores than Pune (Mdn=8), Z=-2.8, P=0.005 and Surat (Mdn=7), Z=-4.25, P<0.001
2. Vadodara (Mdn=9) had significantly higher Total FTAS scores than Pune (Mdn=8), Z=-2.7, P=0.007 and Surat (Mdn=7), Z=-4.11, P<0.001
3. Pune (Mdn=8) had significantly higher Total FTAS scores than Surat (Mdn=7), Z=-1.97, P=0.049
a - Valid records where the respondent knew the education level of the concerned parent(s) ; *P<0.05 ; **P<0.01 ; ***P<0.001
Kariya PV, et al. Parental Education Matters : A Multicentric Study on Adolescent Self-Esteem and Test Anxiety in India.
Table 4.1 — Distribution of FTAS and subfactor Scores for Adolescents from 4 cities (n=1128)
Total Pune Surat Vadodara Mumbai (n=416)(n=418)(n=165)(n=129)
Total FTAS Scores (Scores of more than 7 are associated with significant Test Anxiety)
Mean 8.288.177.399.719.65
Median 8879 10
Mode 9996 13
Std Dev 5.245.224.755.91 5.3
2323222321
Social Derogation Factor (SD) Scores
Mean 3.663.733.31 4.2 3.91 Median 44344 Mode 00080
6.956.776.377.368.23
Cognitive Obstruction Factor (CO) scores
Mean 1.941.911.572.692.28 Median 11122
00000
Tenseness Factor (T) Scores
Mean 2.672.532.522.823.46
Median 32234 Mode 22035
Std Dev 1.9 1.871.86 2 1.8 Variance 3.613.493.46 4 3.25 Range 66666 Minimum 00000 Maximum 66666
SD scores :
Surat (Mdn=3) had significantly lower Social Derogation factor scores than Pune (Mdn=4), Z=-2.31, P=0.021, Vadodara (Mdn=4), Z=-3.57, P<0.001, and Mumbai (Mdn=4), Z=-2.03, P=0.042
CO scores :
1. Pune (Mdn=1) had significantly higher Cognitive Obstruction Factor scores than Surat (Mdn=1), Z=-2.34, P=0.019
2. Vadodara (Mdn=2) had significantly higher Cognitive Obstruction Factor scores than Pune (Mdn=1), Z=-2.84, P=0.005 and Surat (Mdn=1), Z=-4.46, P<0.001
3. Mumbai (Mdn=2) had significantly higher Cognitive Obstruction Factor scores than Surat (Mdn=1), Z=-3.22, P=0.001
T scores :
Tukey’s HSD Test for multiple comparisons found that the mean value of Tenseness was significantly different between Mumbai (M=3.46) and all the other centres Pune (M=2.53, P<0.001, 95% CI = [-1.42.-.44]), Surat (M=2.52, P<0.001,95% CI = [-1.43.-.45] ) and Vadodara (M=2.82, P=0.020, 95% CI = [-1.21.-.07].
Table 4.2 indicates the relationship between parental education and test anxiety. There was no significant difference in total FTAS scores across the four cities — Pune, Vadodara, Mumbai and Surat.
Father’s Education and Test Anxiety :
As shown in Table 4.2, higher paternal education showed significates student test anxiety (M = 8.14, SD = 5.23; p = 0.046, p<0.05). Scores above 7 are considered significant. When categorized by education level - below graduation, graduation, and postgraduation - students whose fathers were postgraduates had the lowest anxiety scores (M = 7.76, SD = 5.15), followed by those whose fathers were graduates (M = 8.05, SD = 5.37) and those below graduation (M = 8.87, SD = 4.99).
Mother’s Education and Test Anxiety :
A similar trend was noted for maternal education. Higher maternal education was significantly associated with lower test anxiety (M = 8.10, SD = 5.24; p = 0.001, p < 0.001).
Students of postgraduate mothers reported the lowest anxiety (M = 7.42, SD = 4.88), followed by those of graduate mothers (M = 7.92, SD = 5.28), while students whose mothers’ education was below graduation showed higher anxiety (M = 9.13, SD = 5.39).
Combined Parental Education :
When both parents had completed schooling, test anxiety was lower (M = 8.05, SD = 5.26) compared to when one parent had not completed school (M = 9.36, SD = 5.00), a difference that was statistically significant across all four cities (p = 0.026, p < 0.05).
Overall, parental education - notably higher maternal education - appears to be protective in reducing student test anxiety
FTAS Subfactors and Parental Education : (1) Social Derogation (SD):
Higher parental education was associated with lower test anxiety due to social derogation. Students with more educated fathers showed significantly lower SD scores (M = 3.62, SD = 2.65; p = 0.022, p < 0.05). Those whose fathers had completed postgraduation had the least SDrelated anxiety (M = 3.43), followed by graduates (M = 3.55) and those below graduation (M = 4.04).
Kariya
Demographic
Table 4.2 — Parental Education and FTAS Test Anxiety (Total scores more than 7 are considered significant)
Significant differences in mean SD Sub-factor (Social Derogation) scores
Significant differences in mean CO Sub-factor (Cognitive Obstruction) scores
Significant differences in
(Tenseness) scores
a - Valid records where the respondent knew the education level of the concerned
Similarly, maternal education showed a stronger inverse relationship (M = 3.59, SD = 2.64; p = 0.006, p < 0.01). Students of postgraduate mothers reported the lowest SD scores (M = 3.30), compared to graduate (M = 3.52) and below-graduate mothers (M = 4.01). Thus, higher parental education - especially maternal - reduces anxiety from social evaluation.
(2) Cognitive Obstruction (CO) :
While father’s education showed no significant effect, mother’s education was strongly associated with lower CO scores (M = 1.88, SD = 2.06; p = 0.005, p<0.01). Students of postgraduate mothers had the lowest cognitive obstruction (M = 1.59), compared to graduate (M = 1.86) and below-graduate mothers (M = 2.23).
When both parents had completed school, CO-related anxiety was significantly lower (M = 1.86, SD = 2.05) than
when at least one parent had not (M = 2.44, SD = 2.36; p = 0.030, p<0.05).
(3) Tenseness (T) :
Father’s education did not significantly influence tenseness scores. However, maternal education again showed a protective trend (M = 2.63, SD = 1.91; p = 0.038, p < 0.05). Students of mothers who were graduates or postgraduates reported lower tenseness (M = 2.54 each) compared to those whose mothers had an education below graduation (M = 2.89).
Overall, maternal education emerged as the most consistent factor in reducing test anxiety across all subfactors, highlighting the vital role of an educated home environment in fostering emotional resilience among students.
Kariya
In this multicentric study, parental education emerged as a significant determinant of adolescents’ test anxiety, with the mother’s educational level showing the most consistent and pronounced influence.Adolescents whose mothers had higher education levels reported significantly lower test anxiety scores across total and subfactor domains, suggesting that maternal education contributes to a more supportive emotional and academic environment.
Findings from our previous AACCI study also align with this trend, showing that parental education significantly influences test anxiety levels. Among the subfactors, social derogation consistently showed the highest scores, indicating that Indian students often associate academic failure with bringing shame or disappointment to the family This cultural context - where academic performance is tightly linked with familial pride and social evaluationamplifies anxiety due to perceived disapproval, punishment, or loss of face following poor results16
Further supporting literature highlights that in the Indian context, advanced parental education is associated with better student coping, improved academic understanding, and perceiving parents as facilitators rather than stressors17. Mothers, particularly homemakers, were found to be more involved in their children’s academic lives due to greater availability, which may explain their more substantial influence on test anxiety reduction. Conversely, lower paternal education levels have been linked to increased pressure on children to perform, thereby elevating anxiety scores18
Asian cultural studies reveal that home-based parental involvement - such as supervising homework, rewarding effort, and emphasizing perseverance - strongly enhances self-esteem and academic motivation19 .
Interestingly, one study found that fathers’ education correlated with adolescents’ self-compassion, a protective factor inversely related to test anxiety20,21. Higher selfthe compassion allows adolescents to self-regulate emotional responses to test-related stress, reducing cognitive obstruction and performance anxiety
Overall, our findings emphasize that parental education— especially maternal education - plays a pivotal role in buffering adolescents against test anxiety, likely through greater emotional support, academic understanding, and reduced fear of social derogation.
CONCLUSION
This multicentric study highlights the pivotal role of parental education—especially maternal education - in shaping adolescents’self-esteem and test anxiety. Higher maternal education was consistently linked with greater self-esteem and lower test anxiety, underscoring the influence of
mothers’ engagement in both emotional and academic domains.
While paternal education also contributed, its impact was comparatively modest, likely reflecting traditional caregiving patterns and differing levels of daily involvement. However, educated parents foster a home environment that promotes confidence, emotional stability and academic resilience.
These findings reaffirm that education within the family extends beyond academic credentials - it shapes values, self-belief and coping mechanisms. Empowering parents, particularly mothers, through education and awareness programs can be a vital strategy to enhance adolescents’ well-being and reduce examination-related stress.
LIMITATIONS
While this multicentric study provides valuable insights into the relationship between parental education and adolescents’ self-esteem, certain limitations must be acknowledged.
Self-reported data : Self-administered questionnaires may introduce response bias.
Urban school sample : Participants were drawn mainly from urban schools across four cities, limiting the generalization of findings to rural or higher and middle socio-economically diverse populations.
ACKNOWLEDGMENTS
The authors gratefully acknowledge the school management of the Surat, Pune and Vadodara schools and the Mumbai college for permission to allow students to participate in this study and the students for spending their valuable time in filling the questionnaire.
Funding : This study was self-funded by the Association for Adolescent and Child Care in India (AACCI).
Conflicts of Interest : The authors declare no conflicts of interest related to this work.
REFERENCES
1 Bhave SY, Meghana P, Prashant K — Empowering adolescents: exploring the relationship between self-esteem and test anxiety J Pediatr Neonatal Care 2024; 14(2): 144 154. DOI: 10.15406/ jpnc.2024.14.00558
2 Orth U, Robins RW — Is high self-esteem beneficial? Revisiting a classic question. Am Psychol 2022; 77(1): 5-17. doi: 10.1037/ amp0000922. PMID: 35357851; PMCID: PMC9306298.
3 Friedman IA, Bendas-Jacob O — Measuring Perceived Test Anxiety in Adolescents: A Self-Report Scale. Educational and Psychological Measurement 1997; 57(6): 1035-46.https://doi.org/10.1177/ 0013164497057006012 (Original work published 1997)
Kariya PV, et al. Parental Education Matters : A Multicentric Study on Adolescent Self-Esteem and Test Anxiety in India.
4 Dubow EF, Boxer P, Huesmann LR — Long-term Effects of Parents’ Education on Children’s Educational and Occupational Success:MediationbyFamilyInteractions,ChildAggression,andTeenage Aspirations. Merrill Palmer Q (Wayne State Univ Press) 2009; 55(3): 224-49.doi:10.1353/mpq.0.0030.PMID:20390050;PMCID: PMC2853053.
5 Dubow EF, Boxer P, Huesmann LR — Long-term Effects of Parents’ Education on Children’s Educational and Occupational Success:MediationbyFamilyInteractions,ChildAggression,andTeenage Aspirations. Merrill Palmer Q (Wayne State Univ Press) 2009; 55(3): 224-49.doi:10.1353/mpq.0.0030.PMID:20390050;PMCID: PMC2853053.
6 Barbayannis G, Bandari M, Zheng X, Baquerizo H, Pecor KW, Ming X — Academic Stress and Mental Well-Being in College Students: Correlations,Affected Groups, and COVID-19. Front Psychol 2022; 13: 886344. doi: 10.3389/fpsyg.2022.886344. PMID: 35677139; PMCID: PMC9169886.
7 Tomas JM, Oliver A — Rosenberg’s self esteem scale: two factors or method effects. Struc Eq Model A Multidisciplin J 1999; 6(1): 8498.
8 Von der Embse, Nathaniel P, Kilgus P — Identification and validation of a brief test anxiety screening tool. Int J School Educ Psychol 2013; 1(4): 246-58.
9 Yu, Siyang — The Influence of Mothers’ Educational Level on Children’s Comprehensive Quality Journal of Education, Humanities and Social Sciences 2023; 8: 1264-72.10.54097/ehss.v8i.4461.
10 Krauss S, Orth U, Robins RW — Family environment and selfesteem development: A longitudinal study from age 10 to 16. J Pers Soc Psychol 2020; 119(2): 457-78.doi:10.1037/pspp0000263. Epub 2019 Sep 19. PMID: 31535888; PMCID: PMC7080605.
11 Khampirat B — The relationship between paternal education, selfesteem, resilience, future orientation, and career aspirations. PLoS One 2020; 15(12): e0243283. doi: 10.1371/journal.pone.0243283. PMID: 33290431; PMCID: PMC7723283.
12 Rekha W — Role of Father versus Mother in self-esteem of Adolescence. Journal of Psychosocial Research 2019; 13: 287-96. 10.32381/JPR.2018.13.02.3.
13 Cano T — Changes in Fathers’ and Mothers’ Time with Children: Spain,2002–2010, European Sociological Review 2019; 35(5): 61636, https://doi.org/10.1093/esr/jcz020
14 Kohn ML — Class and conformity: a study in values (Oxford, Dorsey). 1969.
15 Eccles J — Influences of parents’education on their children’s educational attainments: the role of parent and child perceptions”, London Review of Education 2005; 3(3): 191-204. doi: https://doi.org/10.1080/14748460500372309
16 Bodas J, Ollendick TH, Sovani AV — Test anxiety in Indian children: a cross-cultural perspective. Anxiety Stress Coping 2008; 21(4): 387-404. doi: 10.1080/10615800701849902. PMID: 18686055
17 Desai T, Sathiyaseelan A — Role of Parent’s Education, Occupation in Parental Pressure andAdolescents’TestAnxiety Bioscience Biotechnology Research Communications 2020;13.10.21786/bbrc/ 13.1/47.
18 BüberA, Baºay Ö — How Does the Parental TestAnxietyAffect the Test Anxiety of the Student: A Cross-Sectional Study in Secondary Schools in Turkey Turk J Child Adolesc Ment Health 2023; 30(1): 80-8. doi:10.4274/tjcamh.galenos.2022.73644.
19 Ho Esther, Ho Chu — Students’ self-esteem in an Asian educational system: The contribution of parental involvement and parental investment. 2003.
20 Bluth K, Park J, Lathren C — Is parents’education level associated with adolescent self-compassion? Explore (NY) 2020; 16(4): 22530. doi: 10.1016/j.explore.2020.02.003. Epub 2020 Feb 26. PMID: 32245709; PMCID: PMC7654721.
21 O’Driscoll D, McAleese M — The protective role of self-compassion on test anxiety among adolescents. Pastoral Care in Education 2022; 41(2): 211-24. doi: 10.1080/02643944.2022.2054021.
Original Article
Centile Analysis of Fetal Growth and Its Impact on Perinatal Events — A Longitudinal Randomised Study
Background : A longitudinal randomised study was conducted at B S Medical College. Bankura which is a Tertiary Maternity Care Centre under the Govt. of. West Bengal where the annual deliveries go beyond twenty thousand. Three hundred non risk mother carrying singleton pregnancies were selected at their 32 weeks of gestation irrespective of their parity & were reevaluated at 36 weeks both clinically and sonologically to Estimate the Fetal Weight (EFW). The mothers were then followed upto labour room to get the Actual Birth Weight (ABW) of the neonates and to document their mode of delivery eg: Normal, Caeserean Section, Instrumental. The EFW obtained at 32 weeks,36 weeks were plotted on graphic papers separate for clinically estimated data, ultrasound estimated data and Actual Birth Weight data; Thus the 10th centile (red) & 90th centile (blue) EFW & ABW were demarcated by different coloured lines to get a readymade tool for future risk assessment so that mothers with small for date fetuses (below 10th centile) & large for date fetuses (above 90th centile) could be screened for further evaluation eg CTG, Coloured Doppler study of fetal vessels. The study showed that in the District of Bankura, West Bengal EFW of 1300gm by clinical assessment & 1379gm by ultrasound assessment were the 10th centile values at 32 weeks. At 36 weeks the same population of mothers showed an EFW above 2780gm by clinical assessment & above 2850 gm by ultrasound assessment as 90th centile values. Whereas the 10th centile values of Actual Birth Weight (ABW) were 2281.6gm & 90th centile was 3042.8gm. out of 300 mothers studied 209 underwent Normal delivery with 31 (14.8%) SNCU admissions, 63 underwent caesarean section (LSCS) with 17 (26.8%) SNCU admissions, whereas 28 underwent LOW forceps/outlet forceps deliveries with 06 (21.4%) SNCU admissions. Among the Actual Birth Weight (ABW) Category babies with 2 to 2.49kgs & 2.5 to 2.99kgs showed 13.7% & 7.5% SNCU admission respectively ;whereas babies with 3kgs or more ABW had 40% SNCU admission; and small babies below 2kgs had 100% SNCU admissions.
Key words : EFW, ABW, Clinical Assessment, Ultrasound Assessment.
It is an undoubted fact that fetal growth is directly related to fetal well-being in utero. With the advent of ultrasound imaging techniques and analysis of large databases our understanding of normal and abnormal fetal growth has improved and it has become aparent that birth weight and fetal growth vary with a number of factors that can be physiological the so-called constitutional factors and also there can be pathological factors. Physiological factors are Parity, maternal height,weight, ethnicity and fetal gender. Obviously these factors exert direct or indirect influence on fetal growth which an obstetrician can not modify. Pathological factors affecting growth include smoking, alcohol, social classes, nutritional deprivation, multiple pregnancy and pregnancies complicated with placental insufficiency usually due to maternal hypertension, pre-eclampsia, diabetes, renal disease, Heart disease, antepartum haemorrhage where obstetrician has got a role to play because they are strongly associated with adverseperinatal outcome eg. stillbirth, neonatal death, lowapgar score.Assessment of
Department of Obstetrics and Gynaecology, Bankura Sammilani Medical College and Hospital, Bankura, West Bengal, 722102
1MBBS, DGO, MD, DNB, Professor and Corresponding Author
2MBBS, MS, Senior Resident
3MBBS, MS, Medical Officer
4MBBS, Postgraduate Trainee
Received on : 19/03/2026
Accepted on : 08/04/2026
Editor's Comment :
nn nn n This longitudinal study indicates that centile charts of EFW will be a useful tool during antenatal examinations in the third trimester at a level 1 care centre to decide which mother needs a referral to a higher centre.
nn nn n This centile charts helps to select cases for colour doppler assessment & cases who would require a CTG during labour for early detection of fetal distress indicating an Emergency LSCS thus reducing perinatal morbidity at higher centre.
fetal growth during third trimester is now standard practice in Antenatal care both clinically and sonologically Therefore determination of what is ‘normal’ is essential to know what is abnormal growth which would need further evaluation.3,7 Our study aims to define that normal fetal growth in a population where we work in a large Tertiary Maternity Care Centre.
Literature says that in normal uteroplacental environment fetus grows continuously till term and there should not be any terminal flattening of fetal growth curve when the dating is correct using both LMP and 1st trimester ultrasound. In practice growth is assessed by sonological measurements of fetal head, abdomen and femur and the results are plotted in seperate growth charts to know whether the growth is normal.Alternatively Estimated fetal Weight (EFW) which is now considered to be more appropriate to monitor fetal growth. Clinical assessment of fetal growth during 3rd trimester is done by tape
How to cite this article : Centile Analysis of Fetal Growth and Its Impact on Perinatal Events — A Longitudinal Randomised Study. Chakraborty B, Debangshi M, Mondal SK, Basu M. J Indian Med Assoc 2026; 124(4): 61-4.
measurements of Symphysio-fundal height and girth of the abdomen and applying Dare’s formula ie, multiplying the two measurements in centimetres one can get an Estimated fetal weight in grams is the simplest among all methods1,7
Longitudinal assessment of EFW during 3rd trimester when plotted on a graphic paper with Y and X axis representing weight in grams and weeks of gestation respectively provide the pattern of normal fetal growth among women of near identical characteristics and thus a 10th centile and 90th centile curve can be drawn to determine Small for Gestational Age (SGA) and Large for Gestational Age (LGA). This curve when displayed in our antenatal clinic and in the ultra-sound clinic would help the obstetrician and sonologist to screen small or large fetuses for further evaluation and that is the ultimate goal of our endeavour2,4
Fetal growth is regulated by the IGF system which include the two IGF1 and IGF2; The two IGF receptors type 1 and type 2; six different IGF Binding Protein & proteases of which Pregnancy Associated Plasma Protein (PAPPA) is well known. All these growth factors stimulated by human placental lactogen act in balance to induce an optimum fetal growth. Key genes of IGF system in the placenta are imprinted as an epigenetic process so that their code of expression on the fetus varies without changing the actual genome or simply the DNA sequences within their structure. Genomic imprinting is the selective inactivation of a gene within the fetus in relation to whether it is a maternal or a paternal copy. When the maternal copy is expressed the fetus becomes constitutionally smaller than normal and it becomes constitutionally larger than normal when the paternal copy of IGF gene is expressed. Therefore an interplay between these two conflicting effects of IGF gene has to work in balance throughout gestation to produce an optimally and adequately grown fetus to survive and thrive ex-utero. This is actually the genetic growth potential of a fetus from which the definition of fetal growth disorder comes in literature which says that an abnormal fetal growth is that when fetus does not grow according to its genetic growth potential. In day to day obstetric practice this growth potential is never known. Therefore there is a need to define fetal growth in terms of an expected dimension of the fetus or in other words EFW achieved at particular gestational ages and when plotted on a graphic paper gives an indirect limits of normal range. In practice when we work with a particular population, measurements of two standard deviations of the mean are regarded as normal assuming a normal distribution which includes 95% of the population. That means approximately 2.5% of the fetuses will be small and 2.5% will be large for date. In practice error in determining the exact dates of gestational age, subjective error in determining the EFW and also due to variation in true genetic growth potential
it is difficult to pronounce a cut off value that correctly seperates the normal and abnormal fetal growth. If the threshold is set at an extreme low centile a large number of fetuses would be declared as growth retarded and the burden of extra care on the maternity unit would be painful. On the other hand if the threshold is set too high then there is every chance to miss a truly growth restricted fetus who really needed extra care and did not get that causing a perinatal mortality. In India a 10th centile EFW has been taken as the lower limit of normal5
So we have analysed and plotted our data of EFW in 300 cases obtained at 32 weeks and 36 weeks gestation by clinical method and ultrasound assessments to draw a tenth centile and 90th centile line to ascribe normal fetal growth in our study population and we have followed those mothers till delivery to get the actual birth weight of neonates to validate our claim of normal or abnormally grown fetus(in terms of postnatal events like SNCU admission).
MATERIALS AND METHODS
This was a 18 months long study conducted at our Institution & our proposal was cleared by Institutional Ethics Committee. We have selected 300 cases of Antenatal mothers who visited antenatal clinic and followed them up till delivery. The mothers were all permanent inhabitants of home districts ie, Bankura, carrying a singleton pregnancy of 28-30 weeks and were selected irrespective of their parity The fetuses did not have any congenital anomaly as per 2nd trimester ultrasound scan. Obese mothers more than 90 kgs and those with multifetal pregnancies, pregnancy induced hypertension, h/o Antepartum haemorrhage, Polyhydraminos, mal presentation like breech, transverse lie were excluded because clinical assessment of fundal height, abdominal girth in these women do not represent those of normal population. The data collection was done once in a week for a period of 10 months ie, 43 weeks. During this periode total OPD attendance of target population was approximately 40X43=1720 in our unit. Out of these 300 cases were selected via systematic random sampling. So, sampling interval was 1720/ 300=6(approx); that means every 6th patient was included in the study if all the patients were assumed to be in an imaginary que. Then the first patient was selected via simple random sampling from those who were present at the time of data collection on the first day Then every 6th patient was included till the desired number of 300 cases were recruited.The women emptied their bladder, lied Supine and the Fundal Height (SFH) was measured in centimetres by a Flexible tape from the highest point of fundus to the midpoint of upper border of symphysis-pubis keeping the reversed side of the tape up to obviate bias. The abdominal circumference was measured at the level
of umbilicus in centimetres. The clinically estimated Fetal weight was then calculated in each case by multiplying the SFH and AC in centimetres to get as Estimated Fetal Weight (EFW) in Grams as envisaged by Dare’s formula (Dare 1990).
The sonographic estimation of fetal weight was done by a trained sonologist at the Ultrasound room situated adjacent to the Antenatal ward on the same day using an abdominal sector 3.5 MHZ transducer of a series 7 USG machine. The patient lied supine with full bladder over the examination couch and a curvilinear probe was used with application of transmission gel to measure Biparietal Diameter (BPD), Head Circumference (HC), Abdominal Circumference (AC), Femur Length (FL). AC was measured using a tracker ball at the level where umbilical vein meets the left portal vein within the fetal liver. FL was measured between the ends of the femoral diaphysis. BPD was measured from the outer margin of the proximal skull to the inner margin of the distal skull of the fetus on a section showing the thalami, cavum septum pellucidum, the intra-hemispheric fissure and the third ventricle and HC was obtained at the same time. Then the EFW in Grams was calculated using Hadlock’s formula.
Women’s age height, body-weight and parity were documented. 292 (97.3%) out of 300 mothers were of 18-29 years of ages; 280 (93.4%) were primi-gravida or second gravida & 245(81.7%) had a height between 150159cms and their body-weight in between 47-54kgs.
Table 1 shows the 10thcentile& 90thcentile data of Estimated Fetal Weight (EFW) in grams at 32 weeks & 36 weeks obtained clinically by Dare’s Formula & sonologically by Hadlock’s Formula & 10thcentiles & 90thcentiles value of Actual Birth Weight (ABW). When compared using chi-square test the P- value of clinically estimated Fetal Weights was 0.027 & that of ultrasonologically estimated Fetal Weight was 0.33 showing no statistical difference indicating both methods are equally good in estimation of Fetal Weight during 3rd trimester
Table 2 shows the Actual Birth Weight (ABW) of the neonates categorised into four groups & the number of neonates who went to SNCU for special care.
Table 3 shows the modes of delivery namely normal; caesarean (LSCS) & instrumental that eventually
Table 2 — Actual Birth Weights (gms) & SNCU admissions
ABW (Kg) Number of Neonates (n=300) SNCU Admissions (%)
Table 3 — Mode of delivery & SNCU Admissions
Mode of delivery Number of cases (n=300) SNCU Admission (%)
happened to 300 study cases & the respective number of neonates who needed SNCU admission.
We have plotted our results on graphic paper with Y axis representing EFW in grams and X axis representing gestational age in weeks. Figs 1 & Fig 2 shows series 1 (32 weeks) and series 2 (36weeks) & Fig 1 shows Clinical assessment and Fig 2 shows Ultrasonographical assessmens whereas Fig 3 is the 10th& 90thcentile picture of Actual Birth Weight (ABW) at term.
OBSERVATIONS AND DISCUSSION
In our study population EFW below 1300gms at 32 weeks when clinically assessed & 1379gms when ultrasound assessed should be considered Small for Date & EFW above 2780gms at 36 weeks by clinical assessment & above 2850gms by ultrasound assessment should be considered Large for Date. Small for Dates need Colour Doppler interrogation of major fetal vessels as well as
1 — SFHXAC (Clinical)
Fig
Chakraborty
assessment of Amniotic Fluid Index (AFI) & placental grading for making a decision regarding continuation or termination of pregnancy Their SNCU admission rate is 100% (Table 2). Hence, they need a referral to a Tertiary Care Centre. Large for Dates carry an increased risk of LSCS due to prolonged labour & frequently suffers from neonatal distress due to hypoglycaemia, hypocalcaemia causing neonatal admission (40% in Table 2) & thereby calls for a referral to higher centre. The best neonatal performers are 2.5 to 2.99kg weight category followed by 2.0 to 2.49 kg category (7.5% & 13.7 % SNCU admission in table 2) who are the candidates for level 1 care & of course with a “Nischayjan Facility”. There is also an increased risk of SNCU admissions among LSCS (26.98%) & Instrumental deliveries (21.4%, Table 3) for obvious reasons of fetal distress, prolonged labour &meconium staining of liquor
CONCLUSION
The study indicates that centile charts of EFW can be a useful tool during antenatal examinations in the third trimester at a level 1 care centre to decide which mother needs a referral to a higher centre.At higher centre centile charts helps to select cases for Colour Doppler assessment & cases who would require a CTG during labour for early detection of fetal distress indicating an Emergency LSCS thus reducing perinatal morbidity.
Funding : None.
Conflict of Interest : None.
REFERENCES
1 Dare FO,AdemoworeAS, Ifaturoti OO, NganwuchuA — The value of symphysio-fundal height/abdominal girth measurements in predicting fetal weight. International Journal of Gynecology & Obstetrics 1990; 31(3): 243-8.
2 Shittu AS, Kuti O, Orji EO, Makinde NO, Ogunniyi SO, Ayoola OO, Sule SS — Clinical versus sonographic estimation of foetal weight in southwest Nigeria. Journal of Health, Population and Nutrition 2007; 25(1): 14-23.
3 Sherman DJ, Arieli S, Tovbin J, Siegel G, Caspi E, Bukovsky I — A comparison of clinical and ultrasonic estimation of fetal weight. Obstetrics & Gynecology 1998; 91(2): 212-7.
4 Mgbafulu CC, Ajah LO, Umeora OU, Ibekwe PC, Ezeonu PO, Orji M — Estimation of fetal weight: a comparison of clinical and sonographic methods. Journal of Obstetrics and Gynaecology 2019; 39(5): 639-46.
5 Patterson RM, Prihoda TJ, Gibbs CE, Wood RC — Analysis of birth weight percentile as a predictor of perinatal outcome. Obstetrics & Gynecology 1986; 68(4): 459-63.
6 Gallivan S, Robson SC, Chang TC, Vaughan J, Spencer JA — An investigation of fetal growth using serial ultrasound data. Ultrasound in Obstetrics and Gynecology: The Official Journal of the International Society of Ultrasound in Obstetrics and Gynecology 1993; 3(2): 109-14.
7 Gardosi J — Normal Fetal Growth, Jason Gardosi West Midlands Perinatal Institute, Birmingham, UK. Dewhurst’s Textbook of Obstetrics and Gynaecology. Seventh edition; edited by D.Keith Edmonds: Blackwell Publishing, Oxford University Press.2007: Page 29-31
8 Smith GC, Lees CC — Disorders of fetal growth and assessment of fetal well being. Dewhurst’s Textbook of Obstetrics & Gynaecology 2012; Jan 10: 200-7.
9 Gardosi J — Normal Fetal Growth, Jason Gardosi West Midlands Perinatal Institute, Birmingham, UK. Dewhurst’s Textbook of Obstetrics and Gynaecology. Eighth edition; edited by D.Keith Edmonds: Page 200-201.
B, et al. Centile Analysis of Fetal Growth and Its Impact on Perinatal Events — A Longitudinal Randomised Study
Fig 2 — Ultrasonography
Fig 3 — Actual Birth Weight
Chakraborty
Review Article
Patient-initiated Violence in Healthcare : A Systematic Literature Review
Puja
Bansal1 , Anju Verma2, Sarvesh Kumar Pandey3
Abstract
Background : Patient-initiated Violence (PIV) within the healthcare environment, such as verbal abuse, physical assault and psychological intimidation, has emerged as a Global phenomenon with severe ramifications on the well-being, job satisfaction, and patient care quality of healthcare workers. This systematic review of the literature examines the prevalence, risk factors, outcomes, and prevention of PIV, as reported in literature between 2018 and 2023. Emergency rooms, psychiatric wards, and long-term care facilities are especially at risk because of patient mental health, drug addiction, and cognitive dysfunction. The review points out important risk factors such as patient discontent with care, excessive waiting time, poor security, and inadequate staffing. Its psychological and physical effect on healthcare professionals is substantial, causing burnout, PTSD and turnover Multiple preventive interventions, including de-escalation training, enhanced security and staff support systems, have demonstrated potential to decrease PIV, but more research is required to clarify gaps in knowledge regarding long-term psychological impact and the efficacy of available interventions. This review highlights the importance of developing holistic, evidence-based measures for safeguarding healthcare workers and enhancing patient care outcomes across different health care settings.
Key words : Patient Initiated Violence, Healthcare Workers, Doctors, Poor Quality of Life, Stress.
Growing worldwide, Patient-initiated Violence (PIV) against healthcare providers now includes verbal abuse and physical attacks as well as psychological threats used against medical staff by patients or their relatives. A major public health concern underlining its harmful effects on healthcare worker well-being, job satisfaction, and the quality of patient treatment, the World Health Organisation (WHO, 2019)5 has found occupational violence in healthcare as PIV is particularly prevalent in high-risk settings including emergency departments, psychiatric units, and long-term care facilities, where patients with cognitive impairments, mental health disorders, or drug abuse problems are more likely to show aggressive behavior (Phillips, 2019). This systematic literature review reviews research published between 2018 and 2023 to assess PIV’s frequency, risk factors, impact and preventative strategies. Awareness of these components is necessary for good policies and activities that increase workplace safety and forward the wellbeing of healthcare professionals.
Research Methodology :
Research Methodology includes four sections namely Search strategy in which it was defined how searching of database was done by, what keywords or phrases deployed in this process, second one is Selection criterion involves inclusion and exclusion criterion to filter out the
1Research Scholar, Guru Jambheshwar University of Science and Technology, Hisar 125001 and Corresponding Author
2Professor, Haryana School of Business, Guru Jambheshwar University of Science and Technology, Hisar 125001
3MBBS, MS, Attending Consultant, Department of Orthopedic, Indraprastha Apollo Hospital, New Delhi 110020
Received on : 26/03/2025
Accepted on : 14/10/2025
Editor's Comment :
nn nn n Physicians merit our respect, as they are uniquely positioned to provide medical care, without them society can never be healthy and happy
studies, like studies must be published in English only, studies from 2014 to 2022 was included, only the studies related to type II violence and Doctors was required to be included. Third section was Selection process in which firstly studies of other language had been excluded and then studies before 2014 and after 2023 January was not considered after that studies related to doctors was taken and finally only Type II violence was considered and finally and to sum up with required studies which are apt with our topic and finally we are left with 27 studies that were included in our paper
Search Strategy :
Search techniques were created to find studies that discussed the consequences of workplace violence. In order to cover a wide variety of outcomes, databases were chosen (eg, physical, mental health, social science, sickness absence management). Pubmed and Scopus were the databases that were searched. A number of search phrases were employed for each of the three main concepts violence, work, and repercussions. More specifically, the words "violence" (Assault, Aggression, Crime and Physical Violence), "work" (Workplace, Workrelated, Work) and "consequences" were used to structure the database seach (Effect, Impact, Result, Outcome, Repercussion, Consequence, Absenteeism, SicknessAbsence, Sick Leave, Productivity, Psychological Distress, Posttraumatic Stress Disorder and Quality of Life). The search was performed using a combination of thesaurus terms and free text.
How to cite this article : Patient-Initiated Violence in Healthcare : A Systematic Literature Review. Bansal P, Pandey SK. Verma A. J Indian Med Assoc 2026; 124(4): 65-8.
Each concept was searched individually and then combined with the other concepts. In addition, all references from papers identified in the original search strategy were also searched for additional evidence. We searched for studies published from 2013 through 2023. In terms of language restrictions, searches were limited to English only.
Selection Criteria :
If a quantitative study met all of the requirements for inclusion, such as a cohort study or a comparison study, it was included in this review. Participants in the research were to be : (1) persons at least 18 years old; and (2) practising Physicians in a healthcare setting. We limited our focus to physical assaults, threats, verbal abuse, and sexual harassment and only included studies that included measures of workplace violence Type 2 (ie, violence directed at employees by customers, clients, patients, students, or any other individuals for whom an organisation provides services). Moreover, studies were only considered if they assessed at least one type of repercussion (physical, psychological, emotional, work functioning, interaction with patients, social and financial).
Study Selection Process :
First, the titles of all identified articles were screened for relevance by two reviewers to determine their eligibility. If by reading only the title it was unclear whether or not the study met the inclusion/exclusion criteria, the abstract was reviewed. When there was uncertainty regarding the eligibility of the article from the abstract, the full text version of the paper was retrieved and evaluated against the inclusion and exclusion criteria.Aconsensus method was used to resolve disagreements regarding inclusion of a study
Data Extraction and Analysis :
A summary table was created from the relevant information. From the included studies, the following information was retrieved: the article's source (author, journal, publication year, country), the population (gender, job type), workplace violence (type, definition, exposition, perpetrators) and outcomes (physical, psychological, emotional, work functioning, relationship with patients, social/general). To provide an overview of the study types, the methodology used, the participants, the frequency of exposure to workplace violence, and the results, the extracted data were analysed using descriptive statistics. A narrative review was used to summarise the findings as a quantitative pooling of data was not possible due to the heterogeneity of the chosen studies in terms of outcome reporting. We clustered comparable outcomes in order to summarise the findings. Seven alternative outcome categories as a result emerged: Specifically, there are mainly two types of consequences: (1) physical consequences (2) psychological consequence with racial
violence, sexual violence, perpetrators involved and what strategies (suggested by authors) to cope up with this.
Results : Table 1 showing the profile of studies which finally included in studies, in which nineteen studies of 2022, six studies of 2021, one study of 2020 and only one study of 2023 was included. The source Title, Country and Publishers were also the part of this profile Table.
Relative Frequency of Violence Originally Started by Patients Many studies reveal the high occurrence of PIV and suggest that most doctors have come across some
Table 1 — Profile of the studies included for review
Characteristics of the study
(1) Year of publication 2020 1 2021 6 2022 19 2023 1 (2) Source Title
Number of studies (%)
Sl No Search term
(1) WORKPLACE Violence [all fields]
(2) Workplace AGGRESSION [all fields]
(3) Doctors
(4) BURNOUT
(5) 1 OR 2 OR 3
(6) 4 OR 5 OR 6
(7) 7 AND 8
(8) English [language]
form of patient hostility. In a thorough assessment by Shi L, et al (2022)4, almost 60% of healthcare workers reported in about 60% of cases that they had encountered patient-related violence inside the last year. Psychiatric hospitals and emergency rooms had the highest rates; patient violence usually correlates with mental health problems and drug abuse (Angland S, et al, 2020)1
Nowrouzi-Kia, B et al (2019)2 conducted a cross-sectional study whereby verbal abuse was the most regularly occurring type of PIV. Of the nurses reporting such episodes, 25% had been victims of physical violence. Gender inequalities were also evident; while female employees were more commonly exposed to verbal threats and harassment, male healthcare workers were more likely to come across physical hostility (Yang BX, et al, 2022)6
Risk Factors for Patient-Initiated Violence Many factors in hospital settings help to explain PIV frequency. One of the main factors is the occurrence of drug use and mental illness among the patients. Those with mental disorders, dementia, or those intoxicated by drugs or alcohol have been found to be more likely to engage in violent behavior (Nowrouzi-Kia, etal, 2019)2. Moreover, connected to more patient aggression when dissatisfied with delayed medical attention are too long wait times and crowding in healthcare institutions, particularly in Emergency departments (Phillips JP, 2019)3 The frequency of PIV occurrences also affects the lack of security protocols in hospitals and other healthcare settings. Healthcare facilities with insufficient security personnel, limited surveillance, or inadequate training programs handling violent events are more likely to see higher rates of patient aggressiveness (Angland S, et al, 2020)1. Furthermore, too heavy workloads and staff shortages might make it challenging for medical professionals to appropriately handle aggressive patients, therefore increasing the likelihood of violent incidents (Shi L, et al, 2022)4
Consequences for Medical Staff PIV influences not only physical damage but also psychological suffering, burnout, and Post-traumatic Stress Disorder (PTSD), therefore influencing medical practitioners. Yang, et al (2022) investigated how regular exposure to patient aggression raises the stress and emotional exhaustion levels of healthcare professionals). In a 2019 Nowrouzi-Kia B, et
al2 longitudinal study, nurses who reported persistent violence in their jobs were more likely to consider leaving the sector, therefore aggravating present staffing shortages and adding to the workload pressures for surviving staff members.
Preventive and Intervention Strategies : Many strategies have been proposed to lower PIV and raise medical workers’ safety. One of the most generally recommended techniques is de-escalation training since it teaches staff members how to spot early signs of aggressiveness and adopt communication skills aimed to defuse possibly explosive occurrences. Studies have shown that these kind of training sessions can significantly reduce the occurrence of violent episodes in medical settings (Phillips, 2019). Effective in lowering violence directed at healthcare personnel have also been security actions including the presence of trained security staff, the installation of alarm systems, and limiting access to highrisk areas (Shi L, et al, 2022) 4. Moreover, the implementation of zero-tolerance policies against workplace violence coupled with legal actions against offenders serves as a major deterrent and promotes the message that aggressiveness aimed at healthcare professionals would not be acceptable (Angland, et al, 2020)1. Moreover found to be beneficial in allowing staff members to control the psychological consequences of traumatic occurrences is the creation of support systems for medical professionals such as counseling services and peer support groups. Giving workers strategies to manage trauma and stress will help to increase resilience and minimize the long-term effects of occupational violence (Yang, et al, 2022)6 .
Research and Future Orientations : Divisions PIV is growing in importance, yet certain study gaps still remain. Regarding the evolution of PTSD and other mental health problems in particular, not much is known about the longterm psychological effects of patient hostility on medical practitioners. Moreover, more long-term research are needed to evaluate their effectiveness even if deescalation training and security enhancements have been applied somewhat widely. Another obvious difference in the literature is the lack of studies on violence prevention strategies in non-hospital settings - such as home healthcare and primary care offices - where healthcare personnel may operate with less security resources. Future studies should aim to close these gaps and produce comprehensive, evidence-based strategies to reduce PIV in many different healthcare environments.
At last, Patient-initiated Violence still poses a serious challenge for healthcare workers Worldwide with great frequency and severe psychological and bodily consequences. Elements including mental illness, drug addiction, long wait periods and poor security measures define the frequency of violent events. PIV affects more
Table 2 — Explained the List of search terms entered into the PubMed search.
than just acute damage causing stress, burnout, and labor turnover Although several preventive strategies - including de-escalation training, better security measures, and support systems - have shown promise - more research is needed to perfect these interventions and broaden their application over numerous healthcare situations. Dealing with PIV helps to guarantee a safe and inspiring environment for healthcare staff, which also helps to improve patient care results finally
Funding : None.
Conflict of Interest : None.
REFERENCES
1 Angland S, Dowling M, Casey D — Nurses’ perceptions of the factors which cause violence and aggression in the emergency department:Aqualitative study International Emergency Nursing 2020; 50: 100813. https://doi.org/10.1016/j.ienj.2020.100813
2 Nowrouzi-Kia B, Chai DB, Usuba K, Yonemitsu C, Tam WWS — Prevalence of occupational violence by patients and their families against nurses: A meta-analysis. International Journal of Environmental Research and Public Health 2019; 16(1): 134. https://doi.org/ 10.3390/ijerph16010134
3 Phillips JP — Workplace violence against health care workers in the United States. New England Journal of Medicine 2019; 380(8): 679-86. https://doi.org/10.1056/NEJMra1810522
4 Shi L, Li G, Hao J, Wang X — Patient violence against healthcare workers: A systematic review and meta-analysis. Journal of Nursing Management 2022; 30(2): 354-68. https://doi.org/10.1111/ jonm.13544
5 World Health Organization (2019) — Violence against health workers. Retrieved from https://www.who.int/violence_injury_prevention/ violence/workplace/en/
6 Yang BX, Stone TE, Petrini MA, Morris DL — Incidence, type, and impact of workplace violence in emergency departments: A systematic review Journal of Advanced Nursing 2022; 78(4): 116174. https://doi.org/10.1111/jan.15038
Review Article
A
Study on Culture and Sensitivity of Peritoneal Fluid in Perforative Peritonitis Patients in Vimsar, Burla
Background : Perforative Peritonitis is one of the most common surgical emergencies in general surgical practice with secondary peritonitis occurring due to hollow viscus perforation being the most common etiology The treatment of peritonitis includes both use of antibiotics and surgical source control by along with resuscitation in the emergency room. Study of common organisms and antibiotic sensitivity pattern helps to determine the common micro organisms and their sensitivity patterns which helps implementation of judicious empirical antibiotic treatment before surgery to reduce chance of the silently rising antibiotic resistance.
Materials and Methods : A prospective cross sectional study was conducted over a period of 2 years which includes 100 patients with diagnosis of hollow viscus perforation (excluding primary peritonitis patients and traumatic hollow viscus perforation patients). Peritoneal fluid sample was obtained during surgery and was sent to microbiological culture and antibiotic sensitivity
Site of the perforation was noted.
Conclusion : This review highlights the pattern of organisms cultured from the peritoneal fluid and the common antibiotic sensitivity and resistance patterns shown by the organisms that were cultured.
Perforation Peritonitis is one of the most common surgical emergency in General Surgical Practice. Various etiological conditions can cause Perforation Peritonitis, including peptic perforation, appendicular perforations, typhoid, intestinal tuberculosis, diverticulitis, Meckel’s diverticulum, trauma, gastrointestinal carcinomas, foreign body ingestion, gall bladder perforation secondary to gallstones, perforation due to obstruction, and iatrogenic perforation1 .
One of the major and common challenges faced by a General Surgeon is intra-abdominal infection, the causes of which can range from a deep or organ space type of surgical site infection to systemic inflammatory response syndrome to dangerous septic shock2. Signs and symptoms are typical and the diagnosis of peritonitis is usually clinical. Treatment involves adequate resuscitation, antibiotics and surgical intervention. Management of patients with Peritonitis has always been challenging despite the advances in diagnostic and the surgical techniques that help in early diagnosis and treatment. The aetiology of perforation peritonitis in India
Department of General Surgery, Veer Surendra Sai Institute of Medical Sciences and Research (VIMSAR), Burla, Odisha 768017
1MBBS, MS, Assistant Professor and Corresponding Author
2MBBS, MS, Associate Professor
3MBBS, MS, Senior Resident, DDMCH, Keonjhar
4MBBS, MS, Assistant Professor of Surgery, PRMMC, Baripada 757107
5MBBS, MS, MCh, Resident (CTVS), Banaras Hindu University
Received on : 28/02/2023
Accepted on : 01/04/2023
Editor's Comment : nn nn n
In the times of escalating antibiotic resistance, a protocol for the usage of antibiotics is a necessity of utmost importance. With varying microbial sensitivity patterns across the nation, ongoing hospital surveillance to determine the dynamic patterns of microorganisms and their antibiotic sensitivity guides the local empirical therapy nn n This study highlights the patterns of microbes and their sensitivity in a small section of patients presenting with hollow viscus perforation peritonitis marking the importance of developing antibiotic sensitivity patterns based on local microbial patterns.
differs significantly from its western counter parts3 The recent decades have facilitated surgical practice with simultaneous employment of physiological resuscitation, antibiotics and surgery for Peritonitis. The most common scenario faced by the surgeons are the late presentation of patient to the doctor and more recently, encounter with resistant micro organisms that causes Peritonitis and Sepsis. Due to increasing risk of rapidly emerging drug resistance to antibiotics, this problem has to be taken care of in with utmost importance4
A Cross sectional study was done at Veer Surendra Sai Institute of Medical Sciences and Research (VIMSAR), Burla, Odisha from 2020 to 2022, with the objectives to analyse patterns of microbiological growth and antibiotic sensitivity in peritoneal fluid in Perforation Peritonitis patients admitted in the Department of General Surgery, so as to select appropriate empirical antibiotic therapy
The patients aged more than 18 and those who presented with clinical features of Peritonitis and confirmed by chest
How to cite this article : A Study on Culture and Sensitivity of Peritoneal Fluid in Perforative Peritonitis Patients in Vimsar, Burla. Mettu A, Panigrahi S, Sethy S, Swain P, Naik SS, Meher C. J Indian Med Assoc 2026; 124(4): 69-72.
x-ray were included in the study. Patients with features of Peritonitis caused due to trauma were excluded.
After Ethics Committee review, a total of 1532 cases of Perforation Peritonitis were attended in surgical emergency. Of them, 736 were excluded based on exclusion criteria and among the rest of the cases, 100 patients were sampled according to simple random sampling. In the preoperative period, the patients who presented with clinical features of peritonitis, after thorough clinical history and examination, confirmation of diagnosis with Chest X-ray, Routine blood investigations were done and fluid resuscitation started. After getting consent for surgery, the patient is proceeded for emergency laparotomy During the emergency laparotomy done by a mid-line incision, peritoneal fluid was obtained from confirmed non traumatic cases and sent for microbiological culture and sensitivity After thorough peritoneal toileting and perforation repair tailored as per intra-op finding, abdomen is closed after keeping abdominal drains. Following surgery, patients were given the routine postoperative care with intravenous fluids and antibiotics.
Results of the culture and sensitivity of the peritoneal fluid were followed up and the isolated organisms were tested for antimicrobial sensitivity by Kirby-Bauer disc diffusion method using ampicillin, amikacin, ciprofloxacin, ceftriaxone, cotrimoxazole, piperacillin plus tazobactam and cefoperazone plus sulbactam and the culture reports were obtained. Antibiotics were modified as per the sensitivity pattern shown by the organism grown in the culture.
Demographic Data
In our study, the majority of the study subjects were in the age of 31-40 years. 37(37%) of the study subjects were in the age of 31-40 years, 28(28%) of the study subjects were in the age of 20-30 years, 20(20%) of the study subjects were in the age of 41-50 years and 15(15%) of the study subjects were in the age more than 50 years. And also, In the present study the majority of the study subjects were males. 87(87%) of the study subjects are males and 13(13%) of the study subjects are females.
Inthepresentstudyitshowsthatmostofthecasespresented to us with the symptoms of perforation after a duration 2-3 days which is 47(47%) followed by 4-5 days which is about 40(40%). And all patients had clinical features of Peritonitis and were proven by Chest X-ray for Peritonitis (Table 1).
Site of Perforation
Multiple studies show that in India, the perforations of the proximal gastrointestinal tract are more common in contrast to the studies from other countries like USA, Greece and Japan where distal perforations are common3 In our study the most common site of perforation was found to be duodenum 64(64%) followed by ileum which is present among 23(23%) patients and gastric perforation which is present among 13(13%) patients (Table 2).
Table 1 — Duration of symptoms among study subjects
Table 2 — Site of Perforation among study subjects
Peritoneal Fluid Culture
In our study it was observed that the most cultured organism grown in the perforation was Klebsiella which is 46(46%) followed by E coli 36(36%) followed by E coli+Klebsiella, Proteus and Pseudomonas among 2(2%) study subjects each.About 12(12%) of the study subjects had no growth of organisms. Most of the cases which showed negative culture were those who presented within one day with clinical features of peritonitis (probably chemical peritonitis) (Table 3).
Further, the most common organism in ileal perforation was E coli 11(47.8%) followed by Klebsiella 4(17.3%). In case of duodenal perforation Klebsiella being the most common 36(56.2%) followed by E.coli 14(21.8%). There was no growth among 7(10.9%) study subject. In case of gastric perforation the most common organism was E.coli among 05(38.4%) study subjects followed by Klebsiella among 04(30.7%) study subjects (Table 4).
Table 3 — Organisms cultured among study subjects
Table 4 — Organisms cultured according to site of perforation
Organisms cultured Site of Perforation Gastric (n=13) Duodenum (n=64) Ileal (n=23) E coli 05(38.4%)14(21.8%) 11(47.8%) Klebsiella 04(30.7%)36(56.2%)04(17.3%) E coli+Klebsiella 01(7.6%)02(3.1%)02(8.6%)
Mettu A, et al. A Study on Culture and Sensitivity of Peritoneal Fluid in Perforative Peritonitis Patients in Vimsar, Burla.
And also, the most common organism grown during day 1 of perforation is Klebsiella 7(70%) and most common organism grown in more than 5 days of perforation is also Klebsiella among 2(66.7%) study subjects followed by E coli among 3(30%) study subjects. On day 1 of perforation most of the cultures were negative for growth. Overall, the most common organism grown is Klebsiella followed by E coli. this suggest that the flora were originating from the gut contaminating the peritoneal fluid causing Peritonitis (Table 5).
Antibiotic Sensitivity
Most studies in hospital settings suggest that approximately 50% of patients receive at least one antibiotic during their inpatient stay and at least 30% of them receive a broad spectrum antibiotic. Inappropriate and over the counter usage of higher antibiotics without appropriate indication is leading the new global threat of the “superbug” and posing a great challenge in treatment and increasing percentages of mortality due to these resistant strains of microbes4. It requires strong regulation of OTC usage of antibiotics and proper antibiotic protocols that had to be followed in every hospital. In our study, cultures were taken and empirical therapy was started accordingly and after culture report was received the antibiotics were changed accordingly (Table 6).
For better and synergistic results with antibiotics, “Calculated Antibiotic Therapy” (CAT) may be employed in hospital setups. The considerations for CAT are as following, (i) a typical bacterial spectrum expected as per
Table 5 — Organisms cultured and day of perforation
Organisms Day 1 2-3 days4-5 days >5 days cultured n=10n=47n=40n=03
E coli 03(30.0%) 11(23.4%) 22(55%) 00(0.0%)
Klebsiella 07(70.0%)24(51.0%)13(32.5%)02(66.7%)
No growth 00(0.0%) 08(17.0%) 03(7.5%) 01(33.3%)
Proteus 00(0.0%)01(2.1%)01(2.5%)00(0.0%)
Pseudomonas 00(0.0%)02(4.2%)00(0.0%)00(0.0%)
Mixed 00(0.0%)01(2.1%)01(2.5%)00(0.0%)
Table 6 — Sensitivity pattern for common antibiotics for organisms cultured
Antibiotics Organisms Cultured
Mixed growth E coli Klebsiella Proteus Pseudomonas (n=02)(n=36)(n=46)(n=02)(n=02)
Ampicillin 0000460000
Ciprofloxacin 0236460202
Ceftriaxone 0236460202
Cotrimoxazole 0000000000
Amikacin 0236000000
Piperacillin + Tazobactam 0236460202
Cefoperazone + Sulbactam 0236000000
the site of pathology. (ii) bacterial pathogenicity and synergism, iii)antibacterial concentrations at the site of infection, (iv) toxicity and adverse effects of the antibiotic agent, (v) interactions with immune system, (vi) results of properly conducted trials.
In our study, resistance patterns were studies for ampicillin, ciprofloxacin, cotrimoxazole, ceftriaxone, amikacin, piperacillin+tazobactum, cefuroxime+sulbactum.
It was observed that the cultures for E coli were sensitive to ciprofloxacin, ceftriaxone, amikacin, piperacillin+ tazobactum and cefuroxime+sulbactum while resistant to ampicillin and cotrimoxazole.
Whereas, all the cultures for Klebsiella were sensitive to ampicillin, ciprofloxacin, ceftriaxone and piperacillin+ tazobactum while resistant to cotrimoxazole, amikacin and cefuroxime+sulbactum.
Further, It was observed that all the cultures for Proteus were sensitive to ciprofloxacin, ceftriaxone, piperacillin+ tazobactum while resistant to ampicillin, cotrimoxazole, amikacin and cefuroxime+sulbactum.
All cultures for Pseudomonas were sensitive to ciprofloxacin, ceftriaxone and piperacillin+tazobactum while resistant to cotrimoxazole, amikacin, ampicillin and cefuroxime+sulbactum.
All mixed growth cultures were sensitive to amikacin, ciprofloxacin, ceftriaxone, piperacillin+ tazobactum and cefoperazone+sulbactum while resistant to cotrimaxozole and ampicillin.
Complications and Death
Mortality in our study was 4% and most common complication was surgical site infection (22%) followed by dyselectrolytemia and other respiratory complications.
LIMITATIONS
(1) It was a single centre study
(2) Sample size and study period was low
(3) There was no follow up or comparison group.
(4) Common organisms like Typhoid and Tuberculosis were not studied.
(5) SSI organisms in the study subjects were not taken into consideration.
(6) Response to antibiotics was not noted.
CONCLUSION
We conclude the following:
(1) Perforation Peritonitis is one of the common surgical emergencies in India.
Mettu A, et al. A Study on Culture and Sensitivity of Peritoneal Fluid in Perforative Peritonitis Patients in Vimsar, Burla.
(2) Delay in management and treatment of infection would affect the prognosis.
(3) Empirical antimicrobial therapy depending on the hospitals microbiological records must be initiated by Surgeons discretion along with timely surgery
(4) Change of antibiotics to higher spectrum is particularly important with peritoneal fluid culture sensitivity reports to prevent antibiotic resistance.
(5) This may help reducing the incidence of postoperative complications, morbidity and mortality.
(6) Our study had limitations, so a multi-centre prospective observational study with more sample size and duration with consideration of other infective causes is hence warranted.
Funding : None.
Conflict of Interest : None.
REFERENCES
1 Kallely MF, Panchabhai SV, Nichkaode PB — Perforation peritonitis: a clinical profile and management. Sri Lanka J Surg 2020; 38(1): 10. doi:10.4038/sljs.v38i1.8649.
2 Sartelli M, Tascini C, Coccolini F — Management of intra-abdominal infections: recommendations by the Italian council for the optimization of antimicrobial use. World J Emerg Surg 2024; 19(1): 23. doi:10.1186/s13017-024-00551-w
3 Jhobta RJ, Attri AK, Kaushik R, Rajeev S, Aupam J — Spectrum of perforation peritonitis in India-review of 504 consecutive cases. World J Em Sur 2006; 1: 26 https://doi.org/10.1186/1749-7922-1-26.
4 Nwobodo DC, Ugwu MC,Anie CO —Antibiotic resistance: the challenges and some emerging strategies for tackling a global menace. J Clin Lab Anal 2022; 36(9): e24655. doi:10.1002/jcla.24655.
Case Report
Counselling and Monitoring Reinforcement in Patients with Obesity and Diabetes Mellitus
Background : Obesity with Diabetes Mellitus has becoming growing problems, which can be tackled not only by medication, but also needs counselling and monitoring reinforcement on myriad aspects, for long-term adherence to medication and lifestyle modifications. Three such cases were described; where this type of intervention was done, that consequently decreased the morbidity and mortality from these serious chronic conditions.
Key words : Diabetes Mellitus, Obesity, Counselling, Educational intervention, Monitoring.
Obesity is an emerging problem with growing seriousness not only in Western countries, but in South Asian ones also. With rising prevalence of Diabetes Mellitus, India has become a hotspot for obesity as well. There were about 65 million prevalent cases of Diabetes in India in 2016, in comparison to 26 million in 1990, with Diabetes contributed to 2.2% of the total DALYs (Disability-adjusted Life Years) in India in 2016; and BMI (Body Mass Index) had the highest impact among the factors contributing to Diabetes, with 36% of the diabetes DALYs attributed to it1
Obesity and T2DM are intrinsically related with similar pathologic and ecologic factors, which can be tackled together effectively The likelihood and severity of T2DM are closely linked with BMI. A Meta-analysis from 18 relevant studies showed that the relative risk of Diabetes for Obese persons compared with those with normal weight was 7.19 and that for overweight was almost 3-fold2.Among obese individuals without prevalent cardiovascular disease, a dysfunctional adiposity phenotype, characterized by excess visceral fat and biomarkers of insulin resistance, is independently associated with the development of pre-diabetes and diabetes3. Besides, the influence of obesity on T2DM risk is elucidated by the degree of obesity as well as the place of fat accumulations. Increased upper body fat including visceral adiposity, as reflected in increased abdominal girth or waist-to-hip ratio, is associated with the metabolic syndrome, T2DM, and cardiovascular diseases3
Studies have clearly found that lifestyle intervention targeting weight reduction, healthy diet and increased physical activity in high-risk individuals has a long-lasting effect in the prevention
1MBBS, MD, Professor & Head, Department of Pharmacology, Santiniketan Medical College & Hospital, Bolpur, West Bengal 731204
2MBBS, MD, DNB, DM, Professor and Head, Department of Pharmacology, ICARE Institute of Medical Sciences and Research, Haldia, West Bengal 721657 and Corresponding Author
3MBBS, MD, Professor and Head, Department of Pharmacology, Lord Buddha Koshi Medical College and Hospital, Saharsa, Bihar 852221
4MBBS, MD, Senior Resident, Department of Respiratory Medicine, ICARE Institute of Medical Sciences and Research, Haldia, West Bengal 721657
5MBBS, MD, DM,Assistant Professor, Department of Pharmacology, JMN Medical College and Hospital, Chakdaha, Ektarpur, West Bengal 741222
Received on : 25/08/2024
Accepted on : 20/03/2025
Editor's Comment :
nn n Majority of the patients with diabetes have overweight or obesity The weight gain and obesity may worsen insulin resistance and weight loss slows the progression of diabetes complications. Given the elevated risk for diabetes complications in patients with obesity, clinicians must understand how to treat obesity in their patients with diabetes, including providing counselling and behavioural management, referral to weight loss programs, and medication management.
and progression of T2DM. With a relatively short active lifestyle intervention, time free of Diabetes can be extended by approximately 5 years, due to sustained lifestyle changes as well as to the legacy effect of previous glycaemic improvements4
Here, the case reports of three patients with obesity and diabetes are presented. They were uncontrolled in diabesity, and an intensive management and lifestyle intervention pilot project is formatted and continued with them. Our team consists of diabetologist, clinical pharmacologist, dietitian and psychologist. Each patient first came for their problems to clinic after referral from general physicians and all of them were on some medications. All of them, surprisingly, have also tried over-the-counter self-medication of some dubious product or ayurvedic medicine previously to abate their obesity problem. We planned to counsel and follow-up all these patients with obesity and diabetes mellitus every month and a counsellingmonitoring reinforcement-motivational session every 2 month. The plan was made for 1 year prospectively
CASE REPORTS
At presentation, all of these three patients have BMI greater than 30 with uncontrolled Type-2 Diabetes Mellitus. The data at presentations are as follows:
Patient SA : Age 45 years, Male; BP 146/90’ FBG 198, PPBG 376, HbA1c 10.2%, Cholesterol 224, Triglyceride 298, LDLCh 145, Urea 34, Creatinine 0.8, BMI 30.6, and Urine microalbuminuria present.
Patient AC : Age 56 years, Female; BP 150/94, FBG 234, PPBG 358, HbA1c 12%, Cholesterol 284, Triglyceride 308, LDL-Ch 140, Urea 42, Creatinine 1.0, BMI 35.2 and Urine microalbuminuria present.
How to cite this article : Counselling and Monitoring Reinforcement in Patients with Obesity and Diabetes Mellitus. Pal A, Sen S, Prasad MK, Nayak R, Samajdar SS. J Indian Med Assoc 2026; 124(4): 73-6.
Patient TK : Age 38 years, Male; BP 140/100, FBG 174, PPBG 268, HbA1c 9.2%, Cholesterol 308, Triglyceride 278, LDL-Ch 162, Urea 56, Creatinine 0.7, BMI 31.4 and Urine microalbuminuria present.
First, our team have counselled them regarding their health by motivational interviewing. Motivational Interviewing (MI) is a collaborative conversation style for strengthening a person’s own motivation and commitment to change. The overall style of MI is basically guiding, which lies between and incorporates elements of directing and following styles. Ambivalence is a normal part of preparing for change and a place where a person can remain stuck for some time5. Our team had considered these while motivating the changes. Patients were counselled about the need for proper diet and exercise in regular and sustained manner, apart from adherence to therapy Assessment was done on psychological ground on the following:
■ Life at home and at work – support and stress, goals and values
■ Weight management history
■ Disordered eating – emotional eating, Anorexia Nervosa, eating binges, purging, variety in diet, alcohol and substance misuse
■ Depression, anxiety especially social anxiety and obesity stigma
■ Life events and trauma
They were motivated, counselled and treated to control both blood glucose levels and obesity parameters to decrease the ailments and improve the health-related Quality of Life. Patients were individually checked up at clinic for all their attributes, including pulse rate, blood pressure, general and systemic examinations. It was found that all of them have hypertension, dyslipidemia, fatty liver, anxiety, insomnia, neuropathy with bodyache besides their diabesity All of these patients were of sedentary lifestyle, 2 out of 3 were regular smoker of cigarettes, and all said that they were stressed in life and work. Diabetes was diagnosed in them in last 3-5 years. Patients were assessed about their current eating patterns and physical activity and asked about their individualized perception about the needs to change in order to lose weight. A clinically meaningful weight loss was defined by NICE6 as 5-10% as there is evidence that this amount of weight loss can have a favourable impact on obesity comorbidities, although it is acknowledged that a higher percentage weight loss may be needed in people with BMI>35 kg/m2 7 During clinic encounter, psychological problems like anxiety, depression, insomnia were found in all of them and disordered eating habits since childhood in patient TK. They were offered pharmacotherapy accordingly. Patient SA was given medication like linagliptin, empaglifozin, statin, antihypertensives, escitalopram, gabapentin. Patient AC was given dapaglifozin, vildagliptin, metfomin, statin, antihypertensive, basal insulin temporarily and Orlistat, lonazepam. Patient TK was prescribed with metformin, linagliptin, statin, saroglitazar, basal insulin temporarily, and amytriptilline.
2nd educational group session, consisted of counselling by
clinicians and clinical pharmacologists: The learning points were:
■ Benefits of Weight Loss:
• Delay progression from pre-diabetes to Type 2 Diabetes
• Positive impact on glycaemia in Type 2 Diabetes – Most likely to occur early in disease development
• Clinically meaningful reductions in triglycerides, BP, LDL and HDL
• Reduction in need for medications to control BG, BP and lipids8
■ The Foundation of Hyperglycaemic and obesity Management:
• Lifestyle Modifications: Medical Nutrition Therapy and Physical activity
• Pharmacotherapy
• Metabolic Surgery
■ The acute complication of diabesity
■ The chronic complication of uncontrolled diabetes and obesity on different organs, wellbeing, Quality of Life and economic and societal implications
■ Usage of glucometer
Thus, patients were individually prescribed with medication, written advice on lifestyle, and asked to follow-up after 1 month with repeat of blood tests and weight measurement. The diet was customized to achieve and maintain >5% weight loss should be prescribed for patients with overweight or obesity ready to achieve weight loss8. Dietary recommendations were individualized to address individual nutrition needs based on – personal and cultural preferences, health literacy and numeracy, access to healthful foods, willingness/ability to make behavioural changes and barriers to change8. Calorie restriction was the cornerstone that was clarified to the patients and dietary intake of the amount of carbohydrate, fat or protein were modified in accordance with individual preferences and health status.
The 3nd educational group session consisted of dietitian counselling. The learning points were:
■ Stressing the value of losing a small amount of weight and reiterating the motto of: Eat less, move more
■ How to Plan diet and exercise schedules about travelling, and other activities outside normal routine
■ Sick day rule
■ Adverse effects of over-the-counter weight reduction medications
The 4th group counselling session consisted of Psychologist’s counselling. The learning points were:
■ Psychological counselling on social anxiety, obesity stigma, low mood, alternatives to food as a comforter
■ Tips to increase confidence and competence
■ Quit smoking tips Sen S, et al. Counselling and Monitoring Reinforcement in Patients with Obesity and Diabetes Mellitus — A Case Report.
■ Alcohol usage
■ Occupation and shift work in diabetes
■ Problems of substance abuse in patients of diabetes
The 5th group counselling session consisted of physical medicine expert’s counselling. The learning points were:
■ How to exercise and benefits of exercise
■ Precautions to be observed before starting exercise
■ How to avoid hypoglycaemia during and after exercise
■ Types of exercise to do – Dynamic or aerobic, Resistance, Stretching
■ Supervised exercise, Daily movement (unstructured activity), flexibility training, medication effects on exercise responses,
■ Role of Yoga
■ Diabetes and sports
The 6th group counselling session consisted of counselling by podiatrist and bariatric surgeon. The learning points were:
■ Pros and cons of bariatric surgery
■ Foot care
■ Usage of GLP-1 receptor agonist as injectable therapy
■ Checking of proper usage of insulin
■ Regular BP check and role of ambulatory BP measurement
DISCUSSION
Recent evidences suggest several cyto-bio-pathological connections between obesity and T2DM involving proinflammatory cytokines (like tumor necrosis factor and interleukin-6), insulin resistance, deranged fatty acid metabolism, and cellular processes such as mitochondrial dysfunction and endoplasmic reticulum stress. These interactions are complex, with the relative importance of each unclearly defined9 The connection between obesity and T2DM is hypothesized to have two discrete lesions - obesity-induced insulin resistance and beta-cell failure - both disorders sharing an underlying defect, causing progressive weight gain and metabolic impairment, ultimately contributing to beta-cell decompensation9 .
NICE and the Scottish Intercollegiate Guidelines Network (SIGN) provide guidance for multicomponent lifestyle weight management, based on the severity of obesity and the presence of weight related comorbidities6,10, we tried to follow this system for holistic management of the patients. At each clinic visit, lifestyle modification advices were reinforced and medications were reviewed with altered medication or dose. Patients were asked if they were intolerant to some medication or having some allergy, to which all of them said negatively After these follow-ups, another group counselling session was arranged. After every 3 months of follow-up, the tests are repeated. After about 4 months ongoing, all of them admitted that they were feeling better than previous, with lesser anxiety and more motivated to reach their treatment and lifestyle goal
with persistence. All of them said that their Quality of Life in all aspects had significantly improved. The test results also showed the parameters are reaching towards normal level and weight is also decreasing slowly
Stressing on diet was the most important factor of our plan of action. It has become evident that, there is a drastic change in the dietary patterns of Indians over the past decades, which resulted in their unique Asian Indian phenotype, characterized by relatively low BMI, greater abdominal fat, high insulin resistance and high CRP levels, low levels of adiponectin and atherogenic dyslipidemia11. Indian genetic association studies suggest that there is a genetic predisposition of these populations to diabetes under certain environmental triggers. Particularly, adoption of high fat rich and high carbohydrate diet might be triggering the molecular mechanisms leading to their characteristic Asian Indian phenotype.[11] It has been hypothesized that several mechanisms like impaired nonoxidative glucose disposal and nutrient-sensing mammalian target of rapamycin pathway might be leading to the increasing prevalence of diabetes among Indians12. Metabolomic studies revealed that elevated levels of saturated fatty acids and different amino acids like leucine, isoleucine, lysine, proline, threonine, valine, glutamine, phenylalanine and histidine; and lactic acid, 3-hydroxybutyric acid, choline, 3,7-dimethyluric acid, pantothenic acid, myoinositol, sorbitol, glycerol, as well as glucose were observed in Type 2 Diabetes with high BMI when compared to the healthy control with low BMI13. Study has found that plasma concentrations of metabolites, particularly branched-chain amino acids like isoleucine, leucine and valine, are linked to an increased risk of T2DM14. Both the lipid profile and body fat mass have been reported to be the main predictors of metabolic disturbances and critical medical conditions, such as dyslipidemia, hypertension, diabetes and cardiovascular diseases15. Both obesity and T2DM are associated with proatherogenic dyslipidemia, which is characterized as an increase in plasma triglycerides and free fatty acids, a reduction in HDL, and the presence of small, dense LDL particles - which permeates across the endothelial barrier and subsequently accumulated in the vascular wall causing accelerated atherosclerosis16
Exercise plays a major role in the prevention and control of insulin resistance, T2DM, and diabetes-related health complications. In individuals with T2DM performing moderate aerobic exercise, BG utilization by muscles usually raises more than hepatic glucose production, and blood glucose levels tend to decline17 Aerobic exercise has been the mode traditionally prescribed for diabetes prevention and management. Even 1 week of aerobic training can improve whole-body insulin sensitivity in individuals with T2DM18. Moderate and vigorous aerobic training improve insulin sensitivity A combination of aerobic and resistance training may be more effective for BG management than either type of exercise alone19 Thus, the inclusion of an exercise program is critical for optimal health in individuals with obesity and T2DM.
Meta-analysis revealed that bariatric surgery leads to greater weight loss and higher remission rates of T2DM besides greater reductions in usage of antidiabetic, antihypertensive and antidyslipidemic drugs compared with non-surgical treatment for obesity [20] It is evident that motivation is important for selecting patients for bariatric surgery, especially Roux-en-Y gastric Sen S, et al. Counselling and Monitoring Reinforcement in Patients with Obesity and Diabetes Mellitus — A Case Report.
bypass and sleeve gastrectomy, and these result in significant weight loss, weight loss maintenance and metabolic improvement via multiple complex neurohormonal mechanisms rather than simply dietary restriction7 Thus, these patients were scheduled to be counselled for the surgery, with of risks-benefits and postbariatric surgery care.
We further planned to reinforce and repeat these sessions with updated information and patients’conditions in the subsequent years for continuation of optimal patient benefit.
CONCLUSION
In conclusion, obesity and Type 2 Diabetes both pose significant public health challenges. Obesity substantially increases the risk of Type 2 Diabetes. Type 2 Diabetes is a major cause of premature mortality and contributes to a range of long-term adverse health conditions including Cardiovascular disease and microvascular complications like retinopathy, foot disease and Chronic Kidney Disease and neuropathy. With intensive management and counselling reinforcements, the overall metabolic, psychological and Quality of Life profile of the patients are substantially improved. We wish to extend and continue this type of holistic service with more inputs to all our patients suffering from diabesity for better outcomes in them.
Source of funding : This research did not receive any specific grant from funding agencies in the public, commercial, or notfor-profit sectors.
Conflict of interest : The authors have no conflict of interest to declare.
Ethical approval : Ethics approval has been taken from IEC, Santiniketan Medical College & Hospital, West Bengal.
Consent : Informed consent was obtained from all participants before collecting the data.
REFERENCES
1 Tandon N — India State-Level Disease Burden Initiative Diabetes Collaborators. The increasing burden of diabetes and variations among the states of India: the Global Burden of Disease Study 1990-2016. Lancet Glob Health 2018; 6(12): e1352-e1362.
2 AbdullahA, Peeters A, de Courten M — The magnitude of association between overweight and obesity and the risk of diabetes: a meta-analysis of prospective cohort studies. Diabetes Research & Clinical Practice 2010; 89(3): 309-19.
3 Neeland IJ, Turer AT, Ayers CR — Dysfunctional adiposity and the risk of prediabetes and type 2 diabetes in obese adults. JAMA 2012; 308(11): 1150-9.
4 Lindström J, Peltonen M, Eriksson JG, Ilanne-Parikka P, Aunola S, Keinänen-Kiukaanniemi S, et al — Finnish Diabetes Prevention Study (DPS). (2013) Improved lifestyle and decreased diabetes risk over 13 years: long-term follow-up of the randomised Finnish Diabetes Prevention Study (DPS). Diabetologia 2013; 56(2): 28493.
5 William RM, Rollnick S — Motivational Interviewing: Helping People Change. Guilford Publications. 2012.
6 National Institute for Health and Care Excellence (NICE). (2014) Obesity: identification, assessment and management (CG189). URL: https://www.nice.org.uk/guidance/cg189/resources/obesityidentification-assessment-and-management-pdf-35109821097925 (accessed 15.01.2024)
7 Hazlehurst JM, Logue J, Parretti HM,Abbott S, BrownA, Pournaras DJ, Tahrani AA — Developing Integrated Clinical Pathways for the Management of Clinically Severe Adult Obesity: a Critique of NHS England Policy Current Obesity Reports 2020; 9(4): 530-43.
8 American DiabetesAssociation. Obesity management for the treatment of type 2 diabetes: Standards of Medical Care in Diabetes. Diabetes Care 2019; 42(Suppl 1): S81–S89.
9 Eckel RH, Kahn SE, Ferrannini E — Obesity and type 2 diabetes: what can be unified and what needs to be individualized? Diabetes Care 2011; 34(6): 1424-30. doi: 10.2337/dc11-0447. Epub 2011 May 20.
10 Scottish Intercollegiate Guidelines Network (SIGN). Management of obesity: a national clinical guideline. 2010. URL http:// www.sign.ac.uk/assets/sign115.pdf (accessed 15.01.2024).
11 Reddy BM, Pranavchand R, Latheef SAA — Overview of genomics and post-genomics research on type 2 diabetes mellitus: Future perspectives and a framework for further studies. Journal of Biosciences 2019; 44(1): 21.
12 Unnikrishnan R, Anjana RM and Mohan V — Diabetes in South Asians: is the phenotype different? Diabetes 2014; 63: 53-5.
13 Gogna N, Krishna M, Oommen AM, Dorai K — Investigating correlations in the altered metabolic profiles of obese and diabetic subjects in a south Indian Asian population using an NMR-based metabolomics approach. Molecular Biosystems 2015; 11: 505-606.
14 Newgard CB,An J, Bain JR, Muehlbauer MJ, Stevens RD, Lien LF, Haqq AM, et al — A branched-chain amino acid-related metabolic signature that differentiates obese and lean humans and contributes to insulin resistance. Cell Metabolism 2009; 9: 311-26.
15 Du F, Virtue A, Wang H, Yang XF — Metabolomic analyses for atherosclerosis, diabetes, and obesity Biomarker Research 2013; 1: 17.
16 Fu P, Birukov KG — Oxidized phospholipids in control of inflammation and endothelial barrier Translational Research 2009; 153: 16676. 10.1016/j.trsl.2008.12.005.
17 Minuk HL, Vranic M, Marliss EB, Hanna AK, Albisser AM, Zinman B — Glucoregulatory and metabolic response to exercise in obese noninsulin-dependent diabetes. Am J Physiol 1981; 240(5): E45864.
18 Colberg SR, Sigal RJ, Fernhall B — American College of Sports Medicine & American Diabetes Association. Exercise and type 2 diabetes: the American College of Sports Medicine and the American Diabetes Association: joint position statement. Diabetes care. 2010; 33(12): e147-e167.
10 Sigal RJ, Kenny GP, Boulé NG, Wells GA, Prud’homme D, Fortier M, et al — Effects of aerobic training, resistance training, or both on glycemic control in type 2 diabetes: a randomized trial. Ann Intern Med 2007; 147(6): 357-69.
20 Gloy VL, Briel M, Bhatt DL — Bariatric surgery versus non-surgical treatment for obesity: a systematic review and meta-analysis of randomised controlled trials. BMJ 2013; 347.
Sen S, et al. Counselling and Monitoring Reinforcement in Patients with Obesity and Diabetes Mellitus — A Case Report.
Letter to the Editor
[The Editor is not responsible for the views expressed by the correspondents]
Enhancing Antimicrobial Stewardship : The Role of Selective Reporting, BMQ, and Second-line Antibiotics in Combating Drug Resistance
SIR, — Antimicrobial Susceptibility Testing (AST) with selective reporting is a tactic in which the test is conducted as usual, but the findings are only provided to the clinicians for a select few drugs or not reported in cases where colonisation is likely1. Selective reporting aims to support the selection of narrow-spectrum drugs, discourage prescription in cases of colonisation, and assist clinicians in selecting the most appropriate antimicrobial agent based on a susceptibility pattern1
Fighting drug resistance necessitates the use of selective reporting and the breakpoint to Minimum Inhibitory Concentration (MIC) quotient (BMQ), especially when it comes to Antimicrobial Susceptibility Testing (AST) and the determination of clinical breakpoints. MICs for various “bug-drug” combinations are categorised using clinical breakpoints into interpretative groups, such as sensitive, intermediate, and resistant2 The example of a patient with a bloodstream infection whose condition worsened after receiving treatment with an antibiotic that was first recorded as susceptible but later reported as resistant shows how out-of-date clinical breakpoints can lead to difficulties in patient mismanagement2
The BMQ is calculated by dividing the susceptible breakpoint by the MIC of the antimicrobial agent3. It is a parameter used to rapidly evaluate beta-lactam antibiotics’ in vitro bactericidal activity on Enterobacteriaceae strains.
The BMQ is inversely correlated with the Minimum Bactericidal Concentration (MBC) in antibiotic combinations against Enterobacteriaceae strains, providing additional insight for choosing an antibiotic for severe bacterial infections. The BMQ can help identify obsolete breakpoints and guide laboratories in updating their AST breakpoints to the most recent versions3 .
Using outdated breakpoints can have serious consequences, particularly in situations like COVID-19 pandemic, where clinical microbiology laboratories were
grappling with burnout, staffing shortages, and high demand.2 Updating AST breakpoints is challenging, but resources are available to provide guidance and support throughout the process2 .
In addition to the importance of selective reporting and BMQ, the judicious use of second-line antibiotics is also crucial in combating drug resistance. A study presented at CIDSCON 2023 found that judicious use of secondline antibiotics was associated with favourable outcomes in patients with Carbapenem-resistant Klebsiella Pneumoniae (CRKP) infections4
In conclusion, the importance of selective reporting and BMQ in combating drug resistance cannot be overstated. Updating AST breakpoints and using judicious secondline antibiotics are critical components of effective antimicrobial stewardship programs.
REFERENCES
1 Al-Tawfiq JA, Momattin H, Al-Habboubi F, Dancer SJ — Restrictive reporting of selected antimicrobial susceptibilities influences clinical prescribing. Journal of Infection and Public Health 2015; 8(3): 234-41.
2 Updating Breakpoints in Antimicrobial Susceptibility Testing quotient. (2022, February). American Society for Microbiology. https:// asm.org/articles/2022/february/updating-breakpoints-in-antimicrobial-susceptibili
3 Grillon A, Chabaud A, Zambardi G, Caniaux I, Jehl F — Breakpoint to MIC quotient: A parameter to rapidly evaluate the in vitro bactericidal activity of â-lactams on Enterobacteriaceae. Int J Antimicrob Agents 2019; 53(5): 674-7. doi: 10.1016/j.ijantimicag.2019.01.013. Epub 2019 Feb 1. PMID: 30716447.
4 CIDSCON 2023 Selected Abstracts. Journal of Clinical Infectious Diseases Society 2023; 1(1): 27-134. | DOI: 10.4103/33335555.380637
Subbaiah Institute of Medical Darshan Rajatadri Rangaswamy1 Sciences and Research Centre, Niranjan Kamble2 Karnataka 577222 Kiran Kavatagi3
1MBBS, MD, DNB, Assistant Professor, Department of Pediatrics
2MD, Assosciate Professor, Department of Pediatrics
3MD, Associate Professor, Department of Microbiology
How to cite this article : EnhancingAntimicrobial Stewardship : The Role of Selective Reporting, BMQ, and Second-lineAntibiotics in Combating Drug Resistance. Rangaswamy DR, Kamble N, Kavatagi K. J Indian Med Assoc 2026; 124(4): 77.