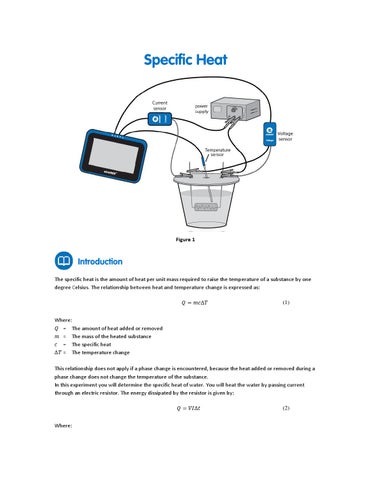
Specific Heat

Page 1

Figure 1

The specific heat is the amount of heat per unit mass required to raise the temperature of a substance by one degree Celsius. The relationship between heat and temperature change is expressed as: đ?‘„ = đ?‘šđ?‘?∆đ?‘‡

(1)

Where: Q = The amount of heat added or removed m = The mass of the heated substance c = The specific heat ΔT = The temperature change This relationship does not apply if a phase change is encountered, because the heat added or removed during a phase change does not change the temperature of the substance. In this experiment you will determine the specific heat of water. You will heat the water by passing current through an electric resistor. The energy dissipated by the resistor is given by: đ?‘„ = đ?‘‰đ??źâˆ†đ?‘Ą Where:

(2)


V = The voltage drop across the resistor I = The current through the resistor

t =

The heating time

The known value of the specific heat of water is 1 calorie/gram °C = 4.186 joule/gram °C

einstein™Tablet+ with MiLAB or Android/iOS Tablet with MiLAB and einstein™LabMate Temperature sensor (-40 °C to 140 °C) Current sensor (2.5 A) Voltage sensor (25 V) Polystyrene cup Plexiglass plate to use as a cover to the polystyrene cup, with two small holes for the resistor’s legs and another hole for the temperature sensor. Power supply (6 V, 2 A) Resistor (5 , 10 W) Two alligator clips Wires

1.

Launch MiLAB (

2. 3. 4. 5.

Connect the Temperature sensor to one of the ports on the einstein™Tablet+ or einstein™LabMate. Connect the Current sensor to one of the ports on the einstein™Tablet+ or einstein™LabMate. Connect the Voltage sensor to one of the ports on the einstein™Tablet+ or einstein™LabMate. Fill the polystyrene cup with 40 mL of water. Measure the volume of water you are using or measure its mass. Assemble the setup as shown in Figure 1 and Figure 2: a. Bend the two legs of the resistor and pass them through the two small holes in the cup’s cover. b. Hold the legs in place with the two alligator clips as shown in Figure 1. Place the cover on the cup. The resistor must be immersed in the water. c. Insert the Temperature sensor through the third hole on the cover. The probe's tip should be immersed in the water as shown in Figure 1. Make sure that only the Temperature sensor, Voltage sensor and Current sensor are selected.

6.

7.

).


Assemble the setup as shown in Figure 1:

Figure 2

Program the sensors to log data according to the following setup: Temperature Sensor (-40 °C – 140 °C)

Temperature (°C)

Current Sensor (2.5 A)

Current (A)

Set As Zero

ON

Voltage Sensor(25 V)

Voltage (V)

Set As Zero

ON

Rate:

1/sec

Duration:

8 Min 20 Sec

Note: Make sure that only the external Temperature sensor (-40 °C – 140 °C) is selected and not the internal Temperature sensor (-30 °C – 50 °C).

1.

Tap Run (

) on the main toolbar to begin recording data.

2. 3.

Switch the power supply to 6V DC and turn it on. Observe the graph.


4.

After 6 minutes tap Stop (

).

5.

Save your data by tapping Save (

).

For more information on working with graphs see: Working with Graphs in MiLAB. 1. 2. 3. 4. 5.

6. 7. 8.

What is the mass of water in the cup? Record the mass in your notebook and explain how you determined this number (by measurement or by calculation?). Use the cursor to read the value of the voltage. Record the value in your notebook. Use the cursor to read the value of the current. Record the value in your notebook. Looking at the temperature graph, what can you say about the relationship between the amount of heat transferred to the water and the temperature change which occurred? Use both cursors to mark two points on the temperature graph. Make sure to select two points in the region where the temperature is increasing. Record the time difference and the temperature difference between the two points in your notebook. Use Equation (2) to calculate the amount of heat dissipated by the resistor. Record the value in your notebook. Use Equation (1) to calculate the specific heat of water. Record the value in your notebook. Compare the value that you have just calculated with the known value (see Introduction).

Repeat the experiment with 80 mL of water and compare the slopes of the two graphs.


Issuu converts static files into: digital portfolios, online yearbooks, online catalogs, digital photo albums and more. Sign up and create your flipbook.