

Introduction Message to the Shareholders Operating Highlights Financial Highlights Philippine Economic Performace Saudi Arabia Economic Performance 04 06 10 18 20 20 EEI
2022 ANNUAL REPORT

Domestic Subsidiaries Report Sustainable Future Board of Directors Our Officers Community Building Corporate Information 24 32 42 44 49 50 Audited Financial Statements 54

Building strong foundations for an inclusive and better tomorrow
Revisiting our roots, breaking new grounds
As 2022 rolled in, it heralded the reopening of economies and the pandemic’s gradual transition to an endemic stage. This period also introduced us to other realities previously obscured by the health crisis, such as geopolitical tensions, rising fuel costs, food shortages, and inflation.
This phase presented us with the opportunity to reassess our priorities so that we could further broaden our impact on the community while accelerating genuine progress among all our stakeholders and the industries we serve.
To achieve our goal of promoting inclusive growth while ensuring profitability, we recalibrated gears and restructured operations. We boldly re-examined how we did business, proactively engaged stakeholders to foster stronger collaborations, and identified the need for better alignment so that the Group could cohesively drive business results and, at the same time, motivate our colleagues in the industry to do the same.
We recognized the weight that interdependence had in transforming and stabilizing ecosystems. These interconnections led to unified and tangible benchmarks, transparency, and enhanced organizational efficiency and productivity. More importantly, it strengthened our culture of integrity and social responsibility and renewed EEI’s commitment to nation-building.
To attain this synergy, we established stronger ties with our vendors, suppliers, subcontractors, workers, clients, and industry partners. Through these closer linkages, we were able reinforce stakeholder relations, optimize workflows, push better collaborations, and inspire the development and adoption of innovations and
new technologies. It also emboldened us to challenge our perception of the industry by motivating members of the Group to help steer EEI as it leads transformational change within the industry.
Our collective efforts have been fruitful as EEI completed 25 projects in 2022. These include two buildings for Torre Lorenzo Development Corporation, five infrastructure projects such as the Metro Manila Skyway Stage 3 Project Sections 3 & 4, and eight electromechanical projects, which include the Compostela Inc. Foundation Works and SMNCI Line A. While the Al Rushaid Construction Company, Ltd. (ARCC) delivered another ten projects, among which include the Shuqaiq 3 IWPP - Sea Water Reverse Osmosis Plant (SWRO) - Civil Work Package and the NEOM Advanced Health Center (ARPIC).
The Group has 38 projects in the pipeline. These include 16 buildings, 11 infrastructures, two electromechanical jobs, and nine projects spearheaded by ARCC.
We also obtained 41 new projects in 2022. These undertakings include Megaworld’s Arcovia Palazzo 3 Towers Residential, the DOTR South Commuter Railway JV, electromechanical works for Capitol Steel Rolling Mill, and manpower and equipment supply for the KJO South Area Safety Facilities.
Although it has been quite a challenging year, we remain hopeful that our efforts toward continuous improvement, coupled with our focus on excellence and shared growth, will continue to usher in more prospects for the Group and, at the same time, become a springboard for all our stakeholders to experience success as well.
5
EEI 2022 Annual Report | Building Strong Foundations for an Inclusive and Better Tomorrow
Message to the Shareholders
The disruptive atmosphere brought about by the pandemic continued in 2022, resulting in economic slowdowns in both domestic and international markets. Although economies slowly reopened and businesses attempted to regain their footing, the first steps toward recovery were arduous.
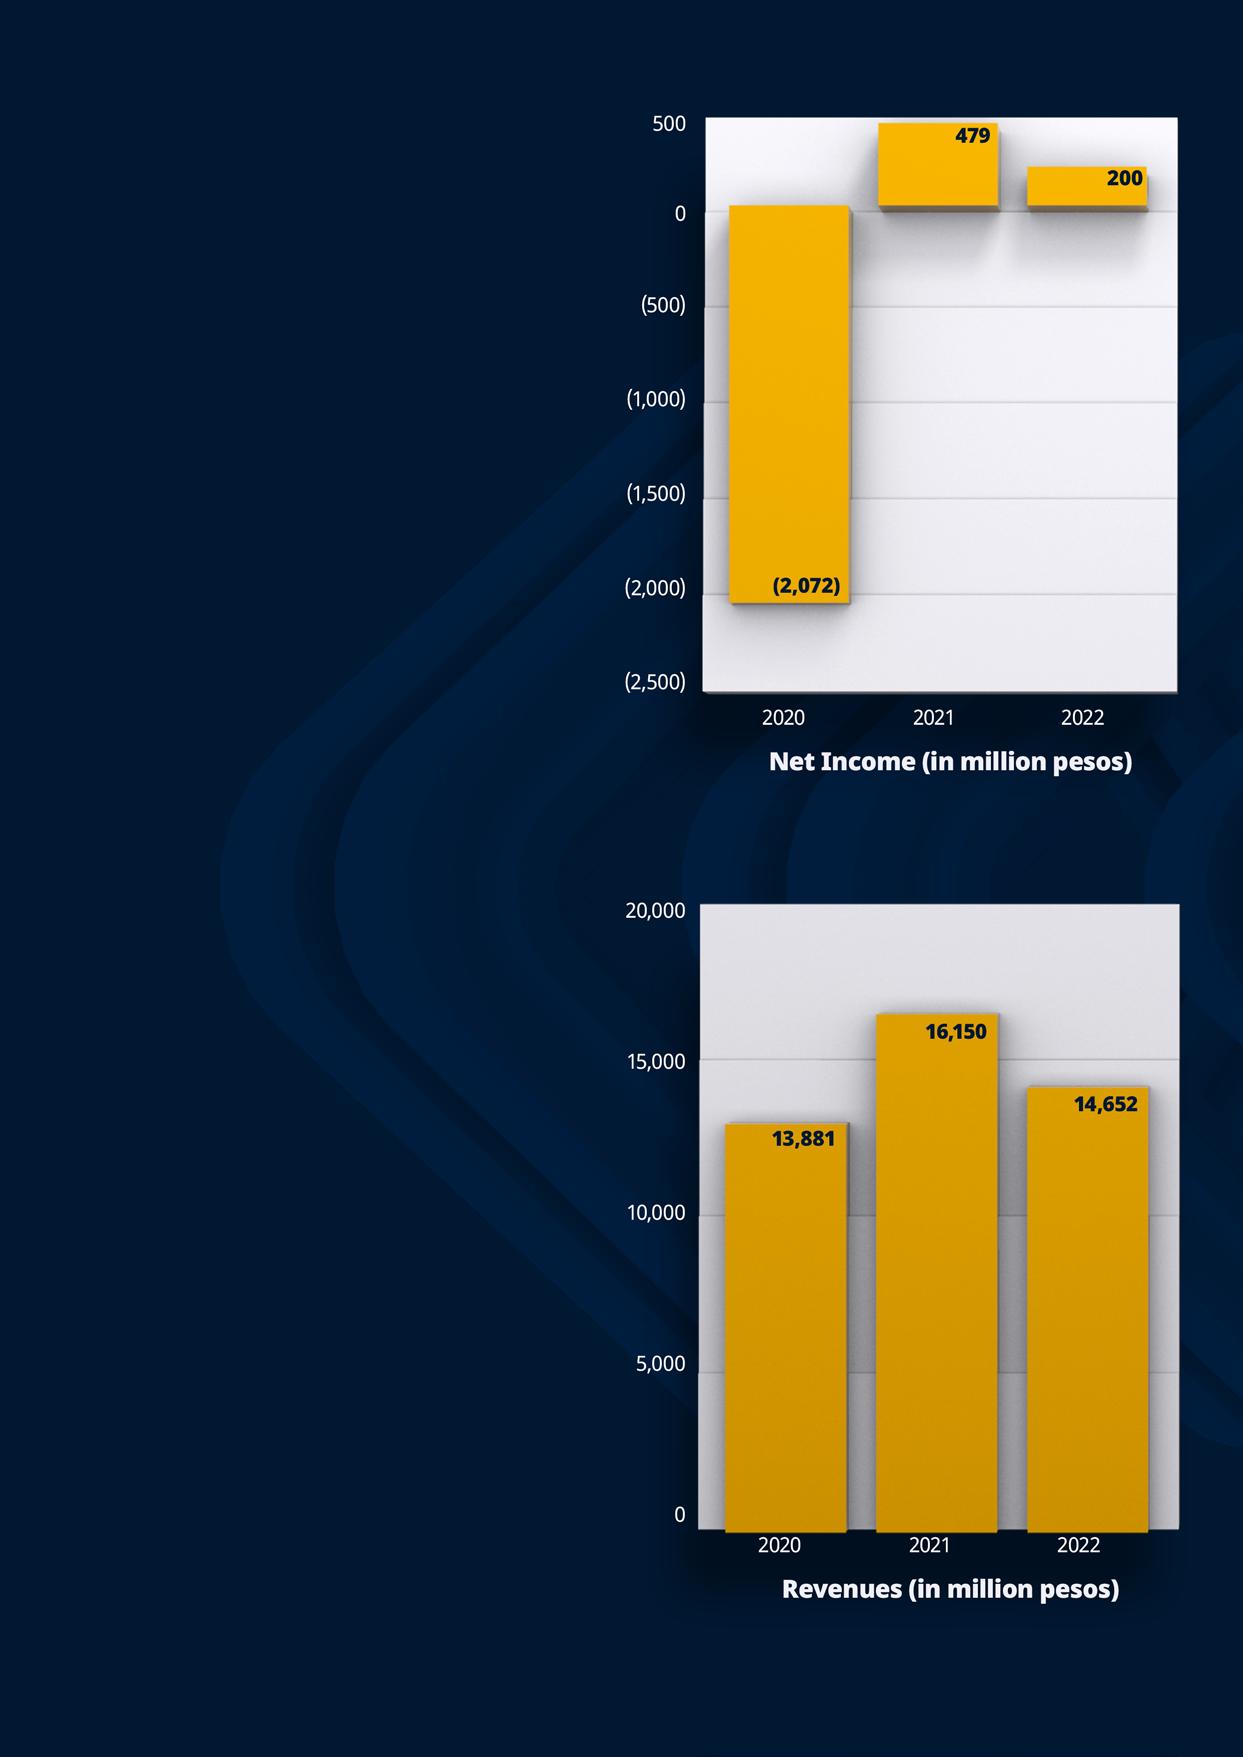
EEI Corporation achieved consolidated revenues of ₱14.7 billion in 2022, 9% lower than the ₱16.1 billion generated the previous year. The Group registered a net income of ₱200 million, lower compared to the ₱479 million posted in 2021.

We had robust construction operations and projects during the year that were supported by strict health protocols and guidelines, and led by an experienced team. However, despite our concerted efforts to stem the lingering effect of the pandemic, our performance continued to be challenged.
EEI Corporation successfully completed 25 projects. Our operations were affected by various delays in executing backlog works which adversely affected revenues. This challenge was further compounded by other factors including a sluggish economy, higher inflation and fuel costs, increasing borrowings, as well as global supply chain issues.
Our subsidiary segment performed well and contributed a noteworthy ₱2.5 billion to the consolidated revenues primarily due to EEI Power’s Retail Electricity Supply Business growth.
EEI 2022 Annual Report | Building Strong Foundations for an Inclusive and Better Tomorrow
HELEN Y. DEE Former Chairperson
ROBERTO JOSE L. CASTILLO
6
Retired President and Chief Executive Officer
To address these deficiencies and help set the Group back on track, we evaluated our operations, identified and addressed weak points, restructured and continued upskilling our workforce, and strengthened our stakeholder relations.
We also brought in new leadership to help the Group gain a fresh and broader perspective of EEI’s competitive advantage and market position. In doing so, we hope to propel EEI to new heights forged in supporting the new economy brought about by changes during the pandemic.

We re-oriented our team on the values, standards, methodologies, targets, and business objectives we uphold. We aligned all employees on the behaviors that are essential for our success: working as a team, leading by example, respecting one another, being open to new ideas, being transparent in our communication, and above all acting with integrity.
More importantly, we instilled in each member of the Group the importance of inclusive growth and our collective duty to uplift the lives of our laborers.
With renewed spirit, we look forward to the completion of the 41 newly-awarded projects we obtained in 2022 and the finalization and delivery of our 38 ongoing projects in the coming months.
EEI 2022 Annual Repo rt | Building Strong Foundations for an Inclusive and Better Tomorrow
As we move forward towards a stronger EEI, we would like to thank our shareholders, clients, business partners, and staff for the unwavering support and confidence they have extended for 91 years and continue to impart to us.
HENRY D. ANTONIO Incumbent President and Chief Executive Officer
7
LORENZO V. TAN Incumbent Chairperson

8 EEI 2022 Annual Report | Building Strong Foundations for an Inclusive and Better Tomorrow

EEI 2022 Annual Report | Building Strong Foundations for an Inclusive and Better Tomorrow 9

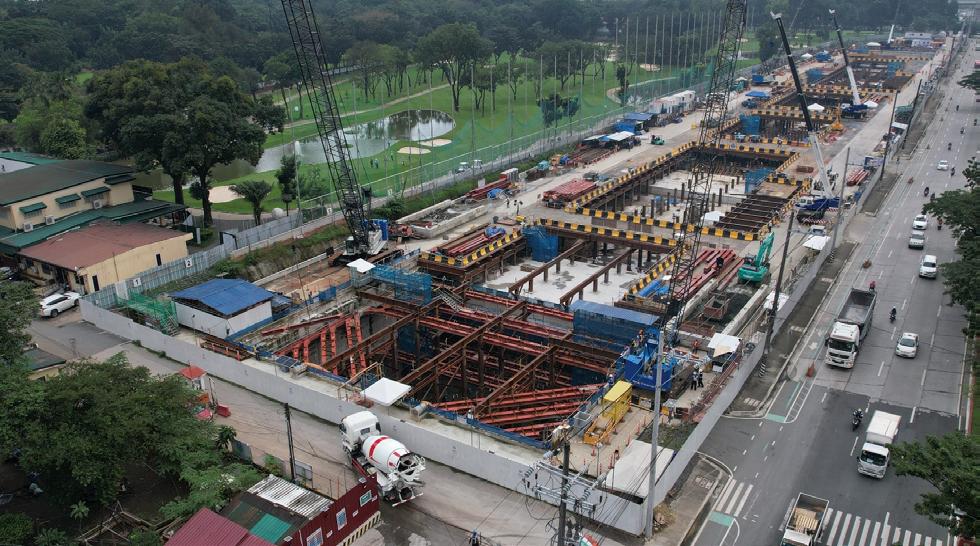
Projects completed in 2022
Despite the formidable headwinds brought about by the industry’s sluggish recovery caused by the pandemic, international geopolitical tensions, and inflation, EEI successfully delivered 25 projects.

These undertakings, which were a mix of building, infrastructure, and electromechanical projects, and commitments by the Al Rushaid Construction Co., Ltd. (ARCC) demonstrated the Group’s resilience and strength to stand firm in the face of the industry’s volatile and competitive landscape.
These are the projects we completed in 2022.
Buildings
• Torre Lorenzo Development Corporation’s 3 Torre Lorenzo General Construction Works
• Torre Lorenzo Development Corporation’s Torre Lorenzo Malate
Infrastructure
• Metro Manila Skyway Stage 3 Project Sections 3 & 4
• Erection and Construction of the Relocation Works for the Affected Transmission Facilities by the MMSS3 Project Sections 3 & 4
• Balintawak Flyover NLEX-SLEX Connection (Section 5) Project
• Sucat-Alabang Viaduct Improvement
• PAG 3 PEC – Installation of Waterwall Panel Opening for Water Cannons and Sootblowers including Heatflux Sensors
Electromechanical
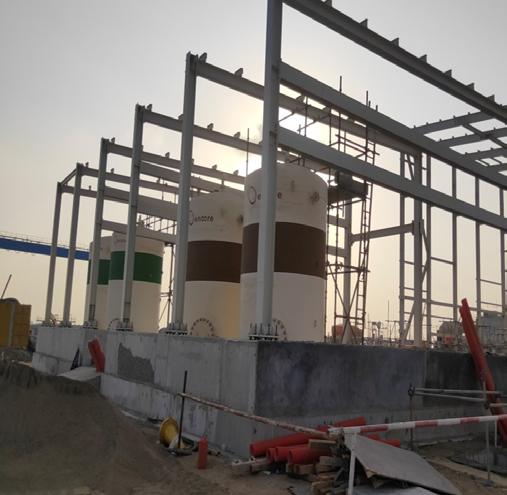
• Natura Aeropack Corporation Four Units Reactors, Drop and Hold Tanks
• SMNCI Line A
• RSFFB Phase 3 Electrical Connection and Installation of Spare LPG Pump for Tank Truck Loading Project
• Compostela Inc. Foundation Works
• Temporary Works for Atimonan Power Plant Project
• Analog B3 South
• Site Preparation Works Atimonan
• Prony Resources New Caledonia – Project Lucy / Supply of Prefabricated Spooling
ARCC
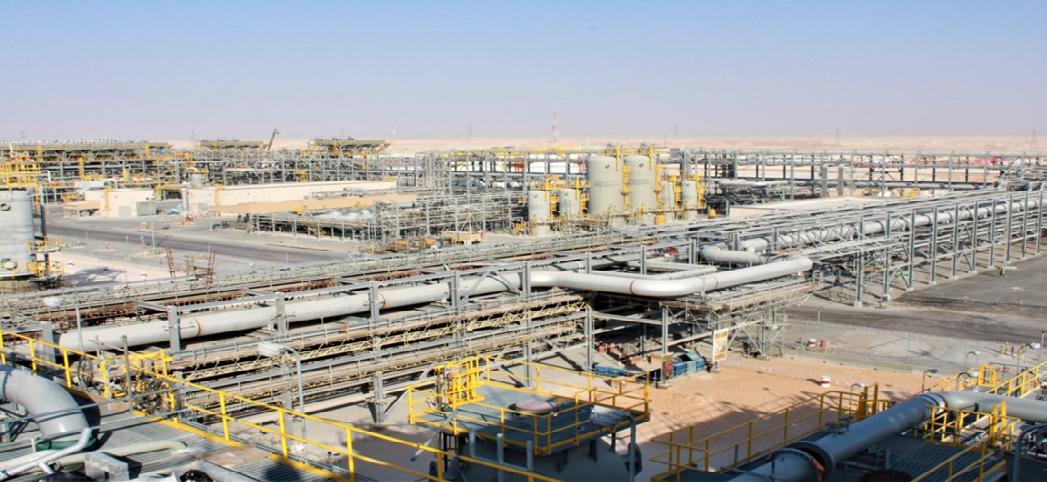
• Fire Protection for Sulfur & Storage Facilities
• Shuqaiq 3 IWPP - Sea Water Reverse Osmosis Plant (SWRO) - Civil Work Package
• NEOM Advanced Health Center (ARPIC)
• Yansab Olefins Plant - Furnace 8 (F-1180)
• Remaining Works Activities for Upgrade Onshore Flare System (BI-10-00184)
• Safaniyah Upgrade Desalinated Water Treatment (SMR#185)
• Furnace 7 Maintenance Services for Saudi
Kayan Plant
• Waste Water Disposal System
Refurbishment Safaniyah (SMR#135)
• Skilled Manpower and Equipment Services for Rabigh II IWSPP Project Chimeny
Repair Works
• Manpower Supply for Air Base Project
EEI 2022 Annual Report | Building Strong Foundations for an Inclusive and Better Tomorrow


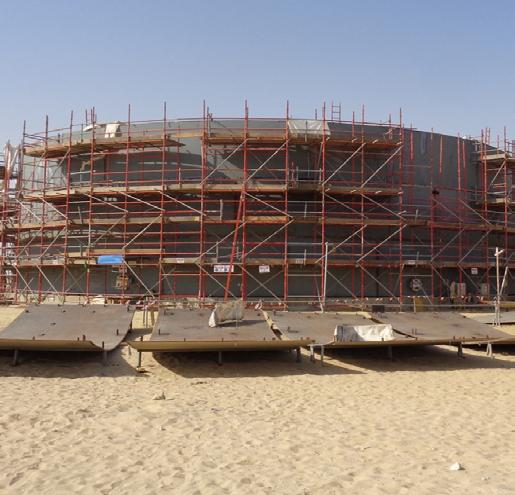
EEI 2022 Annual Report | Building Strong Foundations for an Inclusive and Better Tomorrow NEOM
Advanced Health Center
12
Metro Manila Skyway Stage 2, Sucat Alabang Viaduct Project


EEI 2022 Annual Report | Building Strong Foundations for an Inclusive and Better Tomorrow
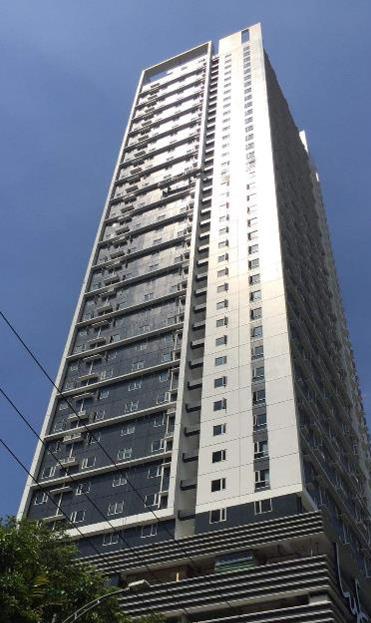
Torre Lorenzo Malate
13
MM Skyway Stage 3 - Section 4
Projects Obtained in 2022
One of our primary objectives as a Group is to become a channel of inclusive growth. To ensure that we carve pathways to progress for our clients, shareholders, subsidiaries, employees, subcontractors, and laborers and, essentially, stimulate nation-building, we have acquired 41 newly-awarded projects.

These undertakings will support EEI’s profitability and, at the same time, expand its reach and capabilities to new markets. These new partnerships will enable EEI to create more employment opportunities for Filipinos while establishing meaningful and transformative collaborations within and beyond the construction industry.
Here are the new projects we obtained in 2022.
Buildings
• Megaworld’s Arcovia Palazzo 3 Towers Residential
• The Yuchengco Centre Phase 2
• STRC The Estate Makati
• Megaworld’s 18 Ave De Triomphe
Infrastructure
• DOTR South Commuter Railway JV Package 7
• Malolos Clark-Railway Project CP N-02 Combined Offer for San Fernando (Concreting and Structural Steel Works)
• Metro Manila Subway Project CP-101 North Avenue Station (NAS) Structure Works Launching Shaft Sections
• Malolos-Clark Railway Project CPN 05: Construction of the GRS Retaining/ Perimeter Wall, Integral Bridge Structural
• Strengthening of Thirteen Link Slabs Along the Candaba Viaduct and Improvement of San Matias Bridge
• Additional Works for Subic Freeport Expressway
• Suez International – Painting Repair of Filters – Calawis WTP
• Shimizu-Fujita-Takenaka Joint Venture; MMSP-CP 101 – Supply and Fabrication of Thrust Frame and Cradle
• Suez International - Painting Repair of Filters - Calawis WTP
• NLEX-SLEX Connector Road Sec. 1 (Fabrication & Delivery of Steel Box Girder)
• Upper Wawa Pumping Station (UWPS) Structural Steel Rib Support
EEI 2022 Annual Report | Building Strong Foundations for an Inclusive and Better Tomorrow
Metro Manila Subway Project
Electromechanical

• Construction of Trenches, Equipment/ Pipe Foundation, Slab on Grade, & Crane Foundation Part 1, Implementation of Site Development & MEPF Work for the Rolling Mill Building

• Capitol Steel Rolling Mill
• Black & Veatch Combined Cycle Power Plant
• Dyson Project Alkaline
• 13.2MW Nabas Phase 2 Wind Farm Project
• Dyson Electronics PTE LTD - Project Alkaline Mechanical Works
ARCC
• Furnace 1391A-B Repair T-A Jobs at Petrokemya South
• KJO South Area Safety Facilities (SMR#258) - Manpower & Equipment Supply
• Expand Vacuum Distillation Unit (VDU) Heater – Riyadh Refinery
• Furnace 5 Partial Retubing at United Plant
• YANSAB LLDPE Shutdown –Manpower Supply
• Furnace 9 Partial Retubing at Saudi Kayan
• Furnace 3 Revamp Shutdown at Saudi Kayan
• Furnace 1 Retubing Services at Yansab
• Oil Water Separation Improvement
• APOC PDH & Complex U&O (HVAC Works)
• Furnace U210 Retubing Services at Yanpet
• SATORP – Manpower Supply
• GCC Electrical Laboratory Project Short Circuit Generator Installation
• Furnace Coil Repair and Recoil Services (Furnace F-1220)
• Jafurah Gas Processing Facilities (JFGPI)
• Zuluf Hydrocardbon Processing Facilities & Utilities and Water Injection (Building BD1 + BD2 and Civil CV2 Package)
• Skilled Manpower & Equipment Services for Rabigh II IWSPP Project
• Furnace #5 Emergency Shutdown at Saudi Kayan
• GCC Electrical Laboratory Project Short Circuit Generator Installation – Manpower Supply
• Furnace #4 Revamp Shutdown at Saudi Kayan
EEI 2022 Annual Report | Building Strong Foundations for an Inclusive and Better Tomorrow
STRC The Estate Makati
15
Megaworld’s Arcovia Palazzo 3 Towers Residential
Ongoing Projects in 2022
The quality of our work is a reflection of how we operate as an organization. To fulfill our commitments, we ensure that all our undertakings have a highly-skilled team, utilize innovative technologies and systems, and adhere to cost-effective processes. This approach demonstrates EEI’s sincerity and enthusiasm to contribute to nation-building. It also proves that we value our clients.
To date, we have 38 ongoing projects. Of these, 16 are buildings, 11 are infrastructures, two are electromechanical, and nine are spearheaded by ARCC.
Here is a compilation of the projects under development for 2022.
Buildings
• Federal Land’s Four Seasons Riviera
• Federal Land’s Seasons Residences
• Federal Land’s Big Apple
• Federal Land’s Grand Hyatt Manila Gold Residences Tower 2 - Superstructure
• Federal Land’s IMET BPO Towers 2, 3, and 4
• Federal Land’s Grand Midori Ortigas
• SMDC’s Air Residences
• SMDC’s Glam Residences
• SMDC’s Light Residences Phase 1, Phase 2, and Architectural
• SMDC’s Sands Residences
• SMDC’s Ice Tower
• Cebu Landmasters’ The Masters Tower Project
• Torre Lorenzo Development Corporation’s Torre Lorenzo Loyola

• Cyberzone Properties’ Cebu Cyberzone
• Filinvest Land’s Clark Mimosa Lifestyle Mall Phase 1 and 2
• The Yuchengco Centre Phase 1 Demolition and Excavation
Malolos-Clark Railway Project
Infrastructure
• Metro Manila Subway Project JV
• Metro Manila Subway Project – Demolition Works for North Avenue Station, Quirino Highway, Tandang Sora Depot
• Metro Manila Subway Project Temporary Yard Development and Piling Works for Depot LS
• Malolos Clark Railway Project CPN 04 (JV Portion with ACCIONA)
• Malolos-Clark Railway Project CPN 05 (Site Clearing and Earthworks Package #1)
• Malolos-Clark Railway Project RC Works
Viaduct and Underground Structures
• Malolos-Clark Railway Project CPN-04 –Structural BR 107 Steel Through Girder
• The Metro Manila Skyway Stage 3, Section
4 – C3-A. Bonifacio Interchange
• The Metro Manila Skyway Stage 3, Section
5 – Balintawak Flyover
• Freyfil – Supply and Fabrication of Structural for Mindanao Bridge

• MRT-7
Electromechanical
• Southern Star Project – SSP Industrial CP01 General Construction Works

• FGen Multipurpose Jetty and Onshore Gas Receiving Facility
ARCC
• APOC PDH/UTOS Project
• Shuaiba Desalination Plant Technology and Expired Assets Replacement Project (Civil Works)
• Shuaiba Desalination Plant Technology and Expired Assets Replacement Project (Supply and Installation of EOT Cranes)
• Abqaiq Plants Restoration
• Abqaiq Plants Restoration (Various CRPOs)
• Debottleneck Onshore Plant – Safaniyah
• Hawiyah Unayzah Gas Reservoir Storage (HUGRS) Project
• Dewatering System & Oily Water Sump Pits – Abqaiq
• Installation of New Seal Leg at DR Module C -Hadeed Plant

SMDC’s Light Residences Phase 1, Phase 2, and Architectural
EEI 2022 Annual Report | Building Strong Foundations for an Inclusive and Better Tomorrow
Federal Land’s Grand Hyatt Manila Gold Residences Tower 2 - Superstructure
17
Financial Highlights

The year began on a hopeful note as mobility restrictions associated with the pandemic were finally lifted, and more businesses and institutions actively began hybrid or face-toface operations. However, other significant events, such as the Russia and Ukraine war, geopolitical tensions, supply chain and food shortages, and rising inflation rates in the Philippines and foreign shores, made business more challenging in 2022.
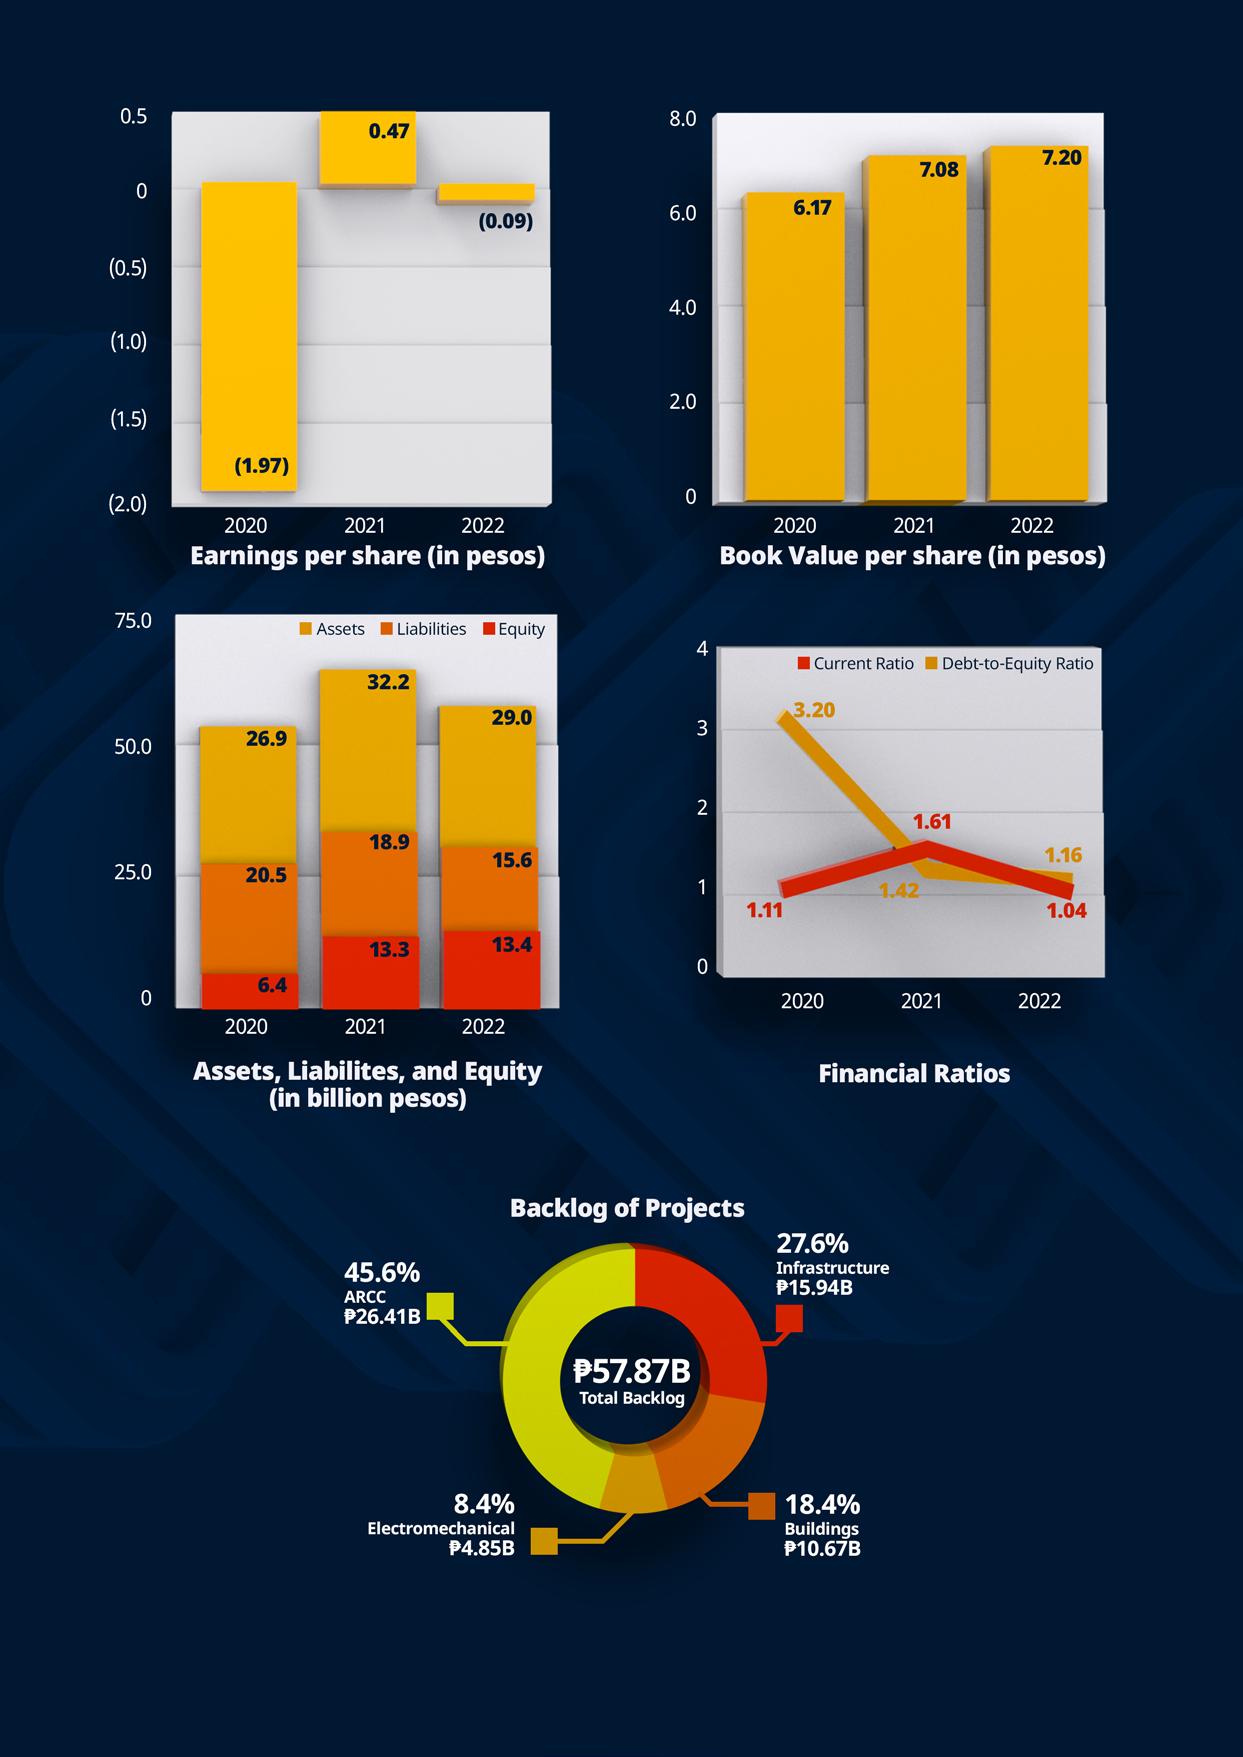
Despite this predicament, EEI posted consolidated revenues of ₱14.7 billion in 2022, 9% lower than the ₱16.1 billion it recorded in 2021. The Group gained a net income of ₱200.3 million, which is lower from the previous year’s ₱479 million.
The Group has a healthy level of backlog projects that will help ensure profitability in the coming year. EEI’s unworked portion of existing contracts amounts to ₱57.87 billion. Of which, ₱15.94 billion are infrastructure, ₱10.67 billion are buildings, ₱4.85 billion are electromechanical, and ₱26.41 billion are ARCC backlog projects.
Here are the highlights of our financial performance and backlog of projects for 2022.
EEI 2022 Annual Report | Building Strong Foundations for an Inclusive and Better Tomorrow
EEI 2022 Annual Report | Building Strong Foundations for an Inclusive and Better Tomorrow
7.6% Economic Growth
in the full year of 2022 fastest
7.2% Economic Growth
in the q4 of 2022
growth
by an emerging asian economy
Saudi Arabia Economic Performance 2022
The Kingdom of Saudi Arabia’s (KSA) economy grew by 8.7 percent in 2022 and 5.4 percent in the fourth quarter of 2022. This performance indicated that the Kingdom has successfully bounced back from the global downturn accompanying the COVID-19 pandemic. Its economy also left behind the period of slower growth that it witnessed before the health crisis following the 2014 downturn in global oil prices.
According to the Oxford Business Group’s “The Report: Saudi Arabia 2022,” the changes in KSA’s domestic structure and policy frameworks, which
based on q4 2022
Real Gross DOmestic Product (GDP) followed by Vietnam at 5.9 percent and China at 2.9 percent
are part of its Vision 2030 socio-economic development plan has benefited the Kingdom. These efforts have helped the country steadily advance its economic diversification and privatization goals since its launch in 2016.
However, continuing uncertainties over the pandemic’s future course and its negative impact on global supply chains continue to impede global recovery. In addition, the effects of Russia’s invasion of Ukraine and the ongoing ramifications of climate change continue to disrupt the way many companies do business. Even so, with Saudi Arabia’s robust economy and ability to capitalize on global market trends such as higher hydrocarbon prices and significant geopolitical influence, the Kingdom stands well placed to continue its socioeconomic progress.

EEI 2022 Annual Report | Building Strong Foundations for an Inclusive and Better Tomorrow
Philippine Economic Performance 2022
The Philippine economy grew by 7.2 percent in the fourth quarter of 2022, exceeding the median analyst forecast of 6.8 percent. This positive fourth-quarter result led to a 7.6 percent full-year growth in 2022 that exceeded the government’s 6.5 to 7.5 percent target. It also defied the 8.1 percent inflation rate seen last December 2022 and the average inflation rate of 5.8 percent reported by the Philippine Statistics Authority.

The country’s growth was the fastest in the region, followed by Vietnam at 5.9 percent and China at 2.9 percent, based on Q4 2022 real gross domestic product (GDP) reports posted by emerging Asian economies. On a seasonally adjusted quarter-onquarter basis, the Philippine economy expanded by 2.4 percent, driven by increased economic activity mainly from pent-up demand as the economy fully reopened in the last three months of 2022.
8.7%
The government remains optimistic about this continuous growth. A statement from the National Economic Development Authority (NEDA) last January 2023 said that the country’s growth will stay robust as the government continuously intensifies its efforts to revive its high-growth trajectory.
In addition, improved COVID-19 risk management protocols and the removal of mobility restrictions have created a positive economic outlook. These factors boosted economic activity and created more jobs despite external headwinds.
The NEDA further stated that the country’s participation in the recent World Economic Forum (WEF) showcased the Philippines as a prime investment destination in the ASEAN region. This positioning demonstrated that the country is now more open to businesses in various industries such as energy, water, logistics, transportation, agribusiness, infrastructure, manufacturing, tourism, health, education, and digital connectivity.
Meanwhile, through the Philippine Development Plan (PDP) 2023-2028, the government will ensure inclusive growth, creating more green or resilient jobs to enable Filipinos to improve their quality of life.
5.4%
EEI 2022 Annual Report | Building Strong Foundations for an Inclusive and Better Tomorrow
Economic Growth in the full year of 2022
Economic Growth in the q4 of 2022

EEI 2022 Annual Report | Building Strong Foundations for an Inclusive and Better Tomorrow 22

23 EEI 2022 Annual Report | Building Strong Foundations for an Inclusive and Better Tomorrow
JP Systems Asia Inc.
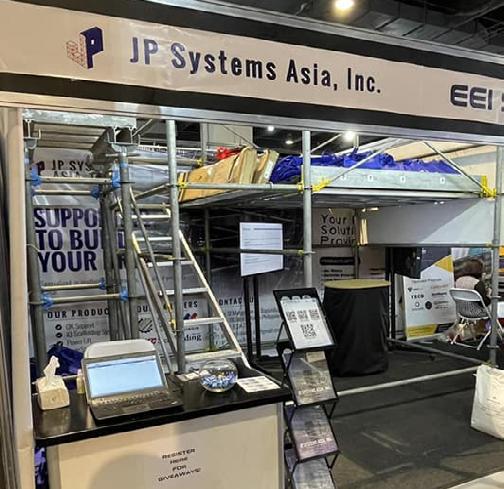
JP Systems Asia, Inc. (JPSAI) continues to improve its performance year-on-year, amassing a ₱23.5 million net income from an annual revenue of ₱149 million in 2022. This performance is a remarkable 70% increase in both net income and revenue compared to 2021 figures.
JPSAI’s revenues were primarily generated from the formworks, shoring, and scaffolding rental for 40 projects under EEI Corp., scaffolding and accessories rental of the MG EXEO Network, Inc. project in La Union, power plant maintenance projects of Powerhaus Industrial Sales & Services, and others.
The main drivers of the company’s 2022 accomplishment came from scaffolding rental at ₱68.41 million, formwork & shoring at ₱49.60 Million, and inventory management services providing ₱23.36 million.
The company also hopes to increase its presence in the rental market and acquire additional rental assets to achieve this.
objectives. JPSAI will also expand its services to include erection and dismantling to offer more value to clients.
Gulf Asia International Corporation (GAIC) and GAIC Manpower Services, Inc. (GAMSI)
The GAIC Group posted a notable consolidated net income of ₱48.1 million in 2022, 66% higher than the 2021 net income of ₱25.94 million.
GAIC: Gulf Asia International Corporation (GAIC) registered a net income of ₱48.9 million in 2022 from a net loss of ₱8.43 million in 2021. This performance was driven by revenues from its inhouse account or the EEI overseas project, which increased substantially by 104% from ₱15.24 million in 2021 with 2,479 men deployed to ₱31.08 million in 2022 with 4,739 men deployed.
₱3.85 million of GAIC’s total revenues were generated from its traditional accounts in Saudi Arabia, Guam, Equatorial Guinea, Japan, and Ascension Island. At the same time, new accounts in Japan, Zambia, and Papua New Guinea contributed P0.76 million in revenues.
In the coming months, JPSAI will continue to provide innovative solutions to its clients by banking on its specialty and expertise in Scaffolding & Formworks Shoring Systems. The company has also launched initiatives to improve asset utilization to support its revenue growth
With the significant improvement in global health and the high vaccination rate in most destination countries, the market for Overseas Filipino Workers (OFWs) is slowly returning to pre-pandemic levels as most international borders have now opened.
25
EEI 2022 Annual Report | Building Strong Foundations for an Inclusive and Better Tomorrow
EEI 2022 Annual Report | Building Strong Foundations for an Inclusive and Better Tomorrow
Some labor markets, particularly in Canada, New Zealand, Australia, and the Middle East, need to fill their skill shortages. OFWs affected by the pandemic are now gradually returning to their jobs abroad. With these developments, GAIC will focus its marketing efforts in New Zealand, Australia, GUAM, Europe, Malaysia, Japan, and the Middle East for the supply of construction workers, healthcare personnel, agricultural workers, and IT staff.
For broader market coverage, the company will also initiate tie-ups with more foreign recruitment or placement agencies in the Middle East, Europe, and Asia. Of these, priority searches will be given to the Kingdom of Saudi Arabia, where there are ongoing Giga Projects. The company will also continue to maximize its referrals from satisfied customers and participate in marketing missions organized by PASEI and JEPPCA.
GAIC will proactively advertise its business in international newspapers and magazines to expand its reach. It will also continue to explore establishing an office in destination countries with a large demand for OFWs.

GAMSI: GAIC Manpower Services, Inc.’s (GAMSI) net income increased from ₱34.41 million in 2021 to ₱39.1 million in 2022. The company’s newly-acquired janitorial, office, and building maintenance service contracts in 2022, such as AEB, Inc., Manila Memorial Park Cemetery, Inc., La Funeraria Paz-Sucat, Inc. EEI Power, IASA, Inc., and Radio Wealth Finance, Inc. contributed ₱1.26 million in total revenue with 58 men. The
Yuchengco Group of Companies (YGC) continues to be the primary client of GAMSI. On the other hand, GAMSI’s one-time cleaning (OTC) / subscription and disinfection services generated ₱7.18 million in total revenue.
The company is optimistic that the coming year could see the diminishing effects of the pandemic on the labor market as restrictions continually ease and the country’s economy gradually recovers. This situation could lead to greater opportunities and increase the demand for local manpower outsourcing services to pre-pandemic levels.
GAMSI will intensify its marketing efforts in Clark Development Corporation to cover the following industries: factory, manufacturing sector, textile and garment, industrial park, and PEZA areas. The company will also work out its accreditation as a service provider at Subic Bay Metropolitan Authority (SBMA) to offer its services to locators and other business establishments inside and nearby provinces. It will continuously expand its One-Time Cleaning Services (OTC) and disinfection and sanitation services in Cebu, Cagayan De Oro, and Davao. These services are expected to generate ₱1.2 million in revenues for 2023. GAMSI will also explore new business opportunities such as printing and enveloping and related services, facility management, and the manufacturing and sales of cleaning chemicals.
With all these in the pipeline, the GAIC Group looks forward to another bright and gainful year 2023.
26
EEI 2022 Annual Report | Building Strong Foundations for an Inclusive and Better Tomorrow
EEI Power Corporation
For the past three years, EEI Power’s revenue stream was led by its power solutions business, or the sale of electrical equipment and services, reaching ₱251.4 million in revenue in 2022 but was lower than its ₱269.27 million in 2021. On the other hand, combined equity earnings from EEI Power’s investments in PetroSolar Power Corporation and PetroWind Energy Inc. reached ₱244 million during the year, higher than the ₱241 million equity earnings in 2021. The company’s overall consolidated net income for 2022 registered at ₱254.0 million.
EEI Power Corporation EEI Power will continue to execute its strategy of actively deploying and utilizing sustainable and renewable energy sources, including expanding its power generation portfolio and growing its presence in the solar rooftop business.
Starting in 2023, EEI Power has begun to see a significant increase in its power sales revenue, attributable to the completion of several solar rooftop projects that are expected to reach megawatt scale. The company’s solar rooftop business, which primarily targets commercial and industrial customers, and to some extent, retail installations in the residential sector, is expected to grow along with the maturation of the market’s awareness of the volatility of electricity prices and the interest in environmental sustainability.
Along the lines of sustainable development, EEI Power is likewise looking at establishing its presence in the area of energy efficiency and conservation (EE & C) by pursuing its certification as an accredited Energy Service Company (ESCO). With the passage of Republic Act No. 11285 or the EE & C Act of 2019, the compliance of establishments on institutionalizing efforts geared toward the judicious use of energy has already been mandated.
from its existing interests in solar and wind. As a solutions provider, EEI Power will continuously expand its menu of electrical products and service offerings to best address the needs of its clients. This includes the addition of innovative products and new service approaches that the company is developing in-house. Additionally, EEI Power will continue to provide turn-key solutions by being an accredited electro-mechanical contractor of the Philippine Contractors Accreditation Board.
EEI Energy Solutions
2022 was an outstanding year for EEI Energy as it achieved ₱882.8 million in revenue, 810% higher than the ₱97 million revenue it earned in 2021. Gains from energy trading efforts in the Wholesale Electricity Spot Market (WESM) significantly complemented EEI Energy’s revenues from retail contracts. EEI Energy’s net income for 2022 reached ₱53.5 million, exponentially higher than its ₱4.14 million net income in 2021.
As a power generation company, EEI Power sets its sight on increasing its presence in the renewable energy (RE) space by expanding its portfolio to include hydropower generation, aside
During this period, EEI Energy served its existing six (6) contestable customers with an aggregate demand of 12MW. These customers include Grobest Feeds Philippines, Limcoma MultiPurpose Cooperative, Wesselton Inc., Genstar
27
EEI 2022 Annual Report | Building Strong Foundations for an Inclusive and Better Tomorrow
Manufacturing Inc., Liwayway Marketing Corporation, and Cathay Steel Pacific Corporation (CAPASCO).
EEI Energy Solutions Corporation continues to gear up for new milestones as the threshold for contestability is expected to go down in the coming years. At the same time, EEI Energy will likewise take an active role in providing clean, renewable energy to qualified customers, having been granted a Green Energy Option Program (GEOP) operating permit by the Department of Energy. In the highly competitive retail electricity market, EEI Energy sets itself apart from the other industry players by positioning itself as one of the most innovative renewable energy services (RES) companies that deliver competitive rates and relevant value-added services to its customers.
EEI Construction & Marine, Inc.
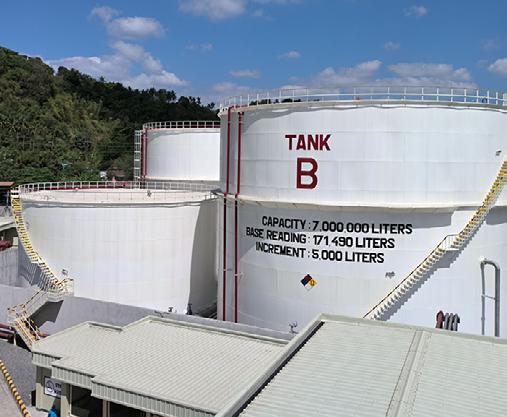
EEI Construction & Marine, Inc. (ECMI) improved its numbers and surpassed targets in 2022 by generating ₱568.3 million in revenue and ₱90 million in consolidated net income. Major contributors came from its petroleum sectors and railway projects.
While the company is currently performing well in the petroleum market, it is also preparing for several business developments and projects, including shipbuilding and repair, modular structure production using cold-formed steels, and fabrication. ECMI will also upgrade its automation of processes by investing in new equipment that will expedite fabrication and repair jobs. Since
the country is entering the post-pandemic period, the company is optimistic that it will have more opportunities to spearhead projects without compromising safety and quality.
ECMI expects to continue its recovery to prepandemic growth levels in the coming months. The company has a healthy backlog from the previous year to sustain operations and continues to secure more projects from petroleum companies and food and beverage businesses.
EEI Business Solutions, Inc.
Transformation became the company’s byword in 2022 as it underwent several significant changes in branding and structure. The shift began with its rebranding from Equipment Engineers Inc. (EE Inc.) to EEI Business Solutions, Inc. (EBSI) to better reflect its services and products. EBSI then rationalized its products trading operations, restructured its organization, and acquired new vendor-partners to add to its product portfolio while maintaining its flagship partners like CETCO & Franklin Fueling Systems. The company also created a Channel Management Group to improve its market coverage outside the National Capital Region.
EBSI renewed focus proved fruitful as it registered ₱300.7 million in revenue with a gross profit of ₱42.5 million in 2022, notably 16% and 4% higher than the previous year, respectively. Major contributors to this growth came from CETCO,
28
EEI 2022 Annual
Report | Building Strong Foundations for an Inclusive and Better Tomorrow
with an annual revenue of ₱88 million, followed by ₱68 million from FFS, ₱26 million from SIKA, and ₱25 million from Lightstrong.
EEI Realty Inc.

For 2022, gross revenue for EEI Realty Corporation (ERC) was ₱3.9 million, a 71% decline from the previous year’s ₱14.0 million. The gross contribution, derived from only one revenue source, amounted to ₱0.85 million or 21%.
Net income after tax amounted to (₱1.4 million), 161% lower than the previous year’s ₱2.3 million. With limited inventories to sell out of the three primary revenue sources, ERC shifted its focus to provide additional rental areas for EEI Corporation during the middle of 2022 while building up its inventories for sale in Suburbia Marikina, RoyalParks @ Grosvenor Place in Tanza, and Puting Lupa, Calamba for the coming years.
Moving forward, EEI Realty continues to monitor the economic landscape and is poised to benefit from any appreciation due to its sizeable landholdings. The most significant holdings are approximately 54 hectares of vacant land in Cavite. This, alongside EEI Realty’s plans for joint ventures with property developers for its other land holdings, ensures EEI Realty’s source of growth in the future.
EBSI’s mother company, EEI Corp., topped the list as its highest source of revenue with ₱141 million in sales of products and services, while Pilipinas Shell, with ₱21 million, came in second. Other outstanding sources of revenue include its Channel Dealer in Visayas & Mindanao at ₱19 million, NW Steel Technologies with ₱14 million, and Unioil with ₱13 million, among others.
EBSI intends to grow revenues by capitalizing on the demand from its parent company EEI’s construction contracts. The reorganization of its parent company and strengthened commercial strategy will create more opportunities for EBSI to cross-sell its products and services. At the same time, EBSI will continue to expand its revenue streams from non-EEI projects. EBSI’s Petroleum Group has also revamped its offering to petroleum clients by providing total solutions for gasoline station projects. This new strategy of supplying design and value engineering services on top of product sales and support is expected to generate more interest from new and existing clients.
29
EEI 2022 Annual Report | Building Strong Foundations for an Inclusive and Better Tomorrow
EEI 2022 Annual Report | Building Strong Foundations for an Inclusive and Better Tomorrow 30
EEI 2022 Annual Report | Building Strong Foundations for an Inclusive and Better Tomorrow
EEI SUSTAINABLE FUTURE
Environmental Sustainability

The Construction Industry is an energy-intensive and fuel-intensive industry. As the business grows, consumption of energy and fuel consequently increases. There is a huge disparity between the usage of fuel for transport vehicles as compared to all other categories. The transport vehicles category comprises service vehicles that ferry employees and equipment and materials to and from the project sites or permanent sites such as the Headquarters, Equipment Yard or the Fabrication Shop.
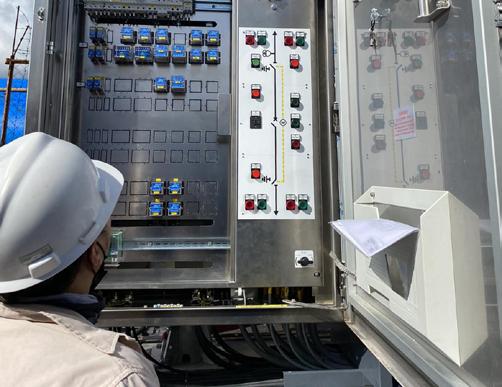
Generator sets are a far second in terms of fuel usage. While permanent sites use electricity from both the grid and solar panels, new projects use generator sets to provide electricity while their applications for electricity connection are pending. Likewise, all project and permanent sites maintain generator sets for backup power in the event of power interruptions.
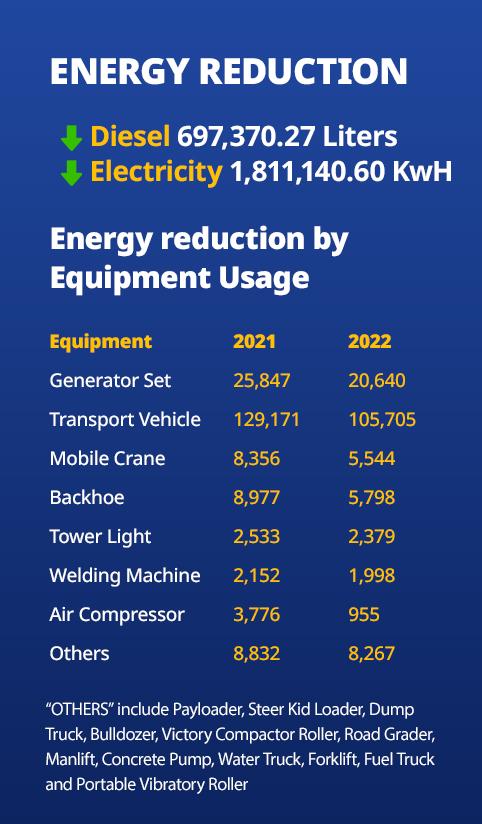
Although the other categories pale in comparison to transport vehicles, their impact on the business cannot be understated. In the case of mobile cranes and backhoes, these are essential equipment at most, if not all, projects. Without any viable alternative, the Company cannot do away with the use of diesel-powered heavy equipment.
With its heavy reliance on fossil fuel, the Company is greatly exposed to fluctuations in fuel prices. This was evident in the reportable year, as fuel companies tried to capitalize on the world slowly returning to its pre-pandemic norm of traveling to and fro for work or leisure. Fuel prices were further aggravated as the supply chains were affected by the advent of the Russia-Ukraine war. The Company’s finances took the brunt of the increases. This is without even considering the
obvious and adverse effects of the use of fossil fuels on the environment.
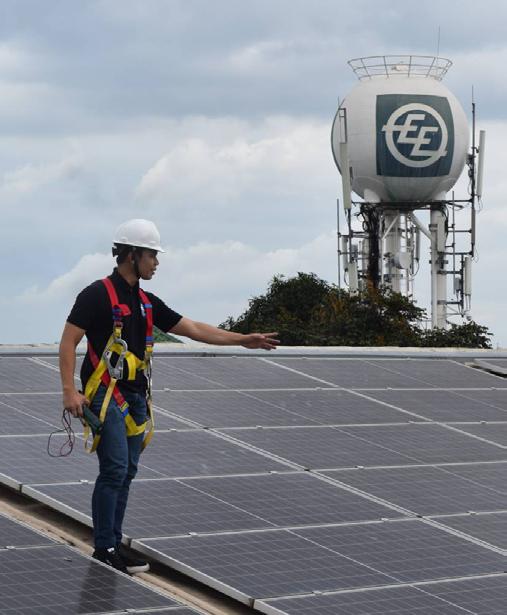
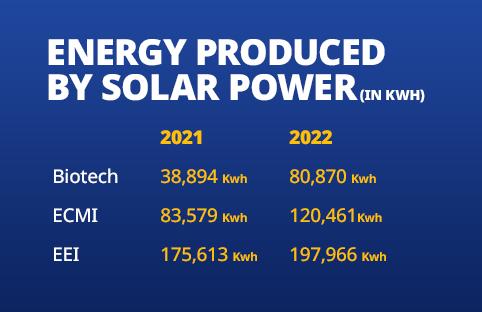
In an effort to offset its reliance on fossil fuel, EEI installed solar panels in its permanent sites to complement power sourced from the grid. The increase of energy generated from the solar panels is an indication of lesser consumption or demand for grid-sourced power.
32
EEI 2022 Annual Report | Building Strong Foundations for an Inclusive and Better Tomorrow
Water is an important part of our daily lives. For EEI, water has a wide variety of applications and is a valuable resource for several activities in its project sites depending on the stages of the construction. Some of the activities that use water are compression of the landfill, manufacturing of concrete, curing of concrete, testing for waterproofing, and cleaning.
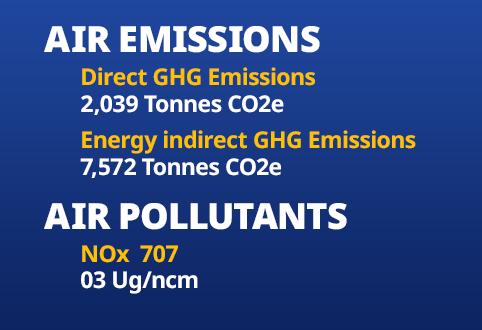
Air pollutants are a risk to both human health and the environment. For employees working regularly in construction sites, there is an increased risk of developing health complications as a result of repeated or prolonged exposure to air pollution. Poor air quality is proven to cause various health problems such as coughs, wheezing, shortness of breath, and other respiratory diseases.
To reduce air pollution contribution, EEI committed to:
EEI is focused on conserving energy and water, and committed to efficient use of power against the established power consuming devices. This was clearly defined in the Occupational Safety, Health, and Environment (OSHE) Objective and Program for the year 2022 resulting in at least a 5% increase in efficiency as compared to the previous reportable year.
Among the activities EEI implemented during the year were:
• Inventory of energy-consuming machines and equipment
• Monitoring of actual fuel consumption and operating hours of machine and equipment
• Inventory of ICT equipment and monitoring of actual operating hours

• Phase-out of all mercury-added lighting products i.e., compact/linear/ cold cathode / external electrode fluorescent lamps, high pressure Hg vapor lamps etc.
• Regular conduct of energy audit in all project sites and offices
• Installation of automatic sensor for switches in toilets and hallways
• Gradual conversion to inverter-type Air Conditioning Units
• Use of power from electricity from grid and solar panels instead of diesel generators
• Use of appropriate capacity of equipment instead of over-rated capacity
• Never burning waste materials, as the smoke emitted releases carbon dioxide and other potentially toxic gases such as methane and carbon monoxide into the atmosphere.
• Using low-sulphur diesel to power heavy equipment and vehicles.

• Improving existing equipment by using particulate filters and catalytic converters.
• Using water sprays or sprinklers to control or minimize dust particles to be carried off in the air and spread to nearby areas, particularly during tasks such as the filling of skips or breaking down of concrete.

• Use of an on-tool extraction to control some types of dust. This is a type of exhaust that fits onto some tools and equipment which captures particulates as they are emitted.
In addition, EEI mandates the use of appropriate personal protective equipment, particularly respiratory protective equipment (RPE) depending on the activity undertaken.
33
33
EEI 2022 Annual Report | Building Strong Foundations for an Inclusive and Better Tomorrow
EEI established procedures in generating, storing, transporting, or disposing of its waste. Alongside such efforts, the Company also aims to continuously reduce the amount of waste generated by its activities by reusing, repurposing, exchanging, or recycling, where applicable opportunities exist, such as:

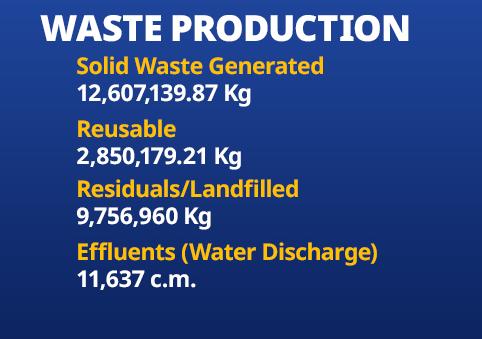
• Reuse of scrap materials such as phenolic board, plywood, lumber, metal, GI sheets and rebars
• Donation/Sale of other wastes to cement plants which can be used as alternative fuel/ co-processing
• Issuance of Memo banning the use of plastics
• Donation of shredded paper to LGU
• Donation of collected PET bottles to LGU
• EEI established a “Return to Supplier Agreement” for all Hazardous Wastes such as paint cans to ensure proper disposal of wastes generated by sites by region. There is also an enormous effort to keep the hazardous components of the waste generated out of landfills, conserve natural resources, and protect human health and the environment. In addition, EEI acquired the services of Hazardous Waste Contractors, accredited by DENR and other government agencies, to ensure that hazardous waste is properly disposed to avoid fines or environmental liability. These contractors are evaluated annually to guarantee efficient Waste Disposal management.
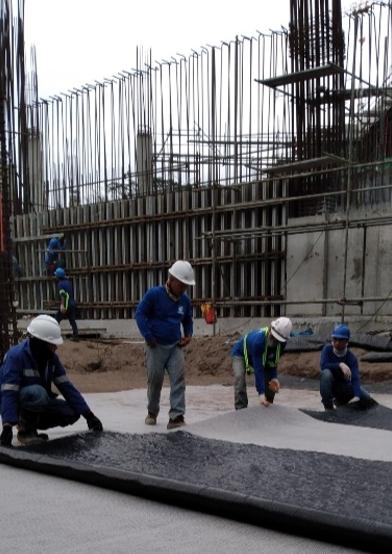
People Inclusive Growth
Occupational safety and health incidents cause human suffering and financial loss. With some 17,000 workers, EEI is continuously promoting a culture of safety and health and brings OSH services to those that need them the most.

For 2022, the following activities were implemented to promote safety awareness in the organization:
• Safety Culture Talk by EEI President & CEO, Roberto Jose L. Castillo
• Safety Leadership Training by Tony Small
• Safety Training Observation Program
• Implementation of Stop Work (Red Card)
• Toolbox meetings every morning to remind workers of the importance of safe workplace

• Incident debriefing wherein incidents are discussed during SHES Meeting
EEI employs fully staffed and competent OSHE personnel that ensure safe working practices in all of its projects. Moreover, safety violations are closely monitored and met with appropriate disciplinary actions to mitigate this risk.
Aside from the policy and procedure on Workplace Conditions, labor standards, and Human Rights, employees are given appropriate OSH Training.
The Company remains compliant with the guidelines set by the Department of Health and the Inter-Agency Task Force, among others.
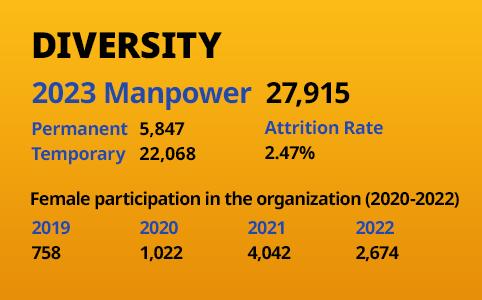
Despite the obvious difficulties of the industry, EEI does not have any standing policy that limits hiring on the basis of gender. Regardless of the nature of the employment opportunity, EEI adheres to the principle of non-discrimination and bases its hiring solely on the qualifications of the applicants. This is evident in job opportunities where manual labor is not the main job description.
34
EEI 2022 Annual Report | Building Strong Foundations for an Inclusive and Better Tomorrow
EEI is very optimistic about growth and opportunities to improve its operations in terms of gender diversity. As technology and other innovations continue to develop that will decrease reliance on brute strength, this will in turn open more opportunities for diversity.
to women to pursue work in other aspects of the construction industry such as engineering, design, information technology, accounting, and management.
With the increased demand and access to resources and information, more women are now joining the construction industry and possess relevant competencies. This is reflected in the increase in the number of female employees with 2,674 female workers for the reportable period for EEI Corporation and its subsidiaries.
EEI’s hiring policy adheres to the equal opportunities and does not discriminate against any applicant on the basis of gender. EEI encourages more women to join the Company and empower women’s participation through the following:

• Training and development are given with equal opportunity for all.
• Selection and Recruitment of EEI prohibit discrimination on the basis of gender


• Implementation of Laws protecting women such as the 105-Day Expanded Maternity Leave Law, Magna Carta of Women, Solo Parents Act, Anti-Sexual Harassment Law, Safe Spaces Act, to name a few.
EEI Corporation supports the advancement of employees’ skills, career growth and treats training as an important investment in making a clear path for employees. Throughout the pandemic, EEI’s Learning and Development Department (L&D) was able to adopt alternative modalities of training and keeping employees motivated in attending face-to-face and online training. To ensure that EEI has sufficient skilled manpower, the Company maintains government-accredited training facilities and certifies workers for highly technical skills like welding and pipefitting. These trainees are sourced from the provinces and provided with the necessary knowledge and skills to allow them to acquire good employment opportunities.

Addressing the problems with gender diversity in the construction industry is a huge undertaking rooted in the primary need of the Company for manual labor often associated with male workers. However, EEI is helping to create a pathway to gender diversity by giving more opportunities
EEI’s OSHE also conducts regular or continuous training on occupational safety to equip its employees with the right knowledge and practices such as (1) Loss Control Management and (2) Course on Effective EHSMS Internal Auditing. Based on Iso 45001:2018. Iso 14001: 2015 Standards.
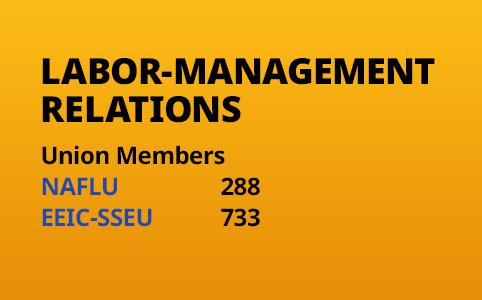
EEI recognizes the constitutionally guaranteed right of every person to selforganization which includes the right to form, join or assist labor organizations for the purpose of collective bargaining through representatives of their own choosing and to engage in lawful concerted activities for the same purpose for their mutual aid and protection.
Industrial peace is a shared responsibility of

35
EEI 2022 Annual Report | Building Strong Foundations for an Inclusive and Better Tomorrow
Management and the Unions. Any imbalance or disruption to industrial peace eventually results in not only delays in project completions but possibly temporary cessation of operations and thereby loss of profit to the Company and to the employees affected.
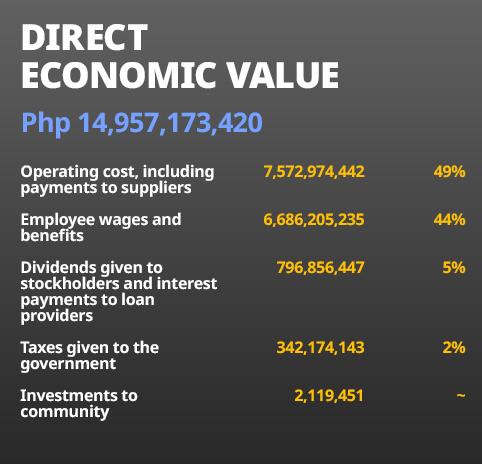
ECONOMIC PARTICIPATION

In 2022, EEI generated a consolidated Php 14,957,173,420 direct economic value, of which 49% was distributed to operating costs, 44% to employee wages and benefits, 5% as dividends and financing cost, 2% as taxes given to the government and the remainder as investments to the community.
erupted, affecting global commodity and oil costs. The construction industry’s challenge in this period of hyperinflation is the rise in fuel prices, driving the construction cost of operation higher and giving the industry a much lower margin of income. Despite all the challenges, the Company makes sure to keep up with these changes. New Projects continue to be awarded in 2022, some of which are part of the national government’s plan to promote and ensure sustainable development within Metro Manila and the nearby cities, municipalities and provinces.
The on-going development and construction of railways and highways will improve accessibility to and from the major cities, boosting development and distributing wealth and opportunities to the various nearby cities, municipalities and provinces. The infrastructure developments likewise aid in the modernization of mass transportation, decongesting of roads and reducing time spent in traffic, all of which greatly improve the quality of life of every Filipino. At the forefront of all these developments is EEI.
The construction industry continues to recover after pandemic-related restrictions have slowly eased. Yet even as the country recovers from the effects of COVID-19, the Russia-Ukraine war
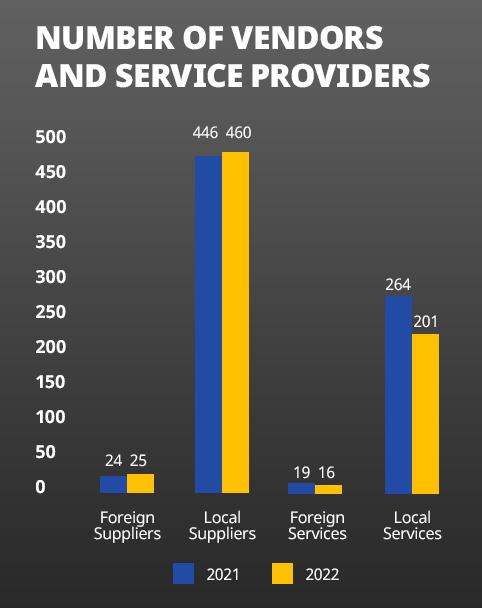
Knowing the local landscape of vendors and service providers in the country can be a big advantage to both ongoing projects and preparation of bid proposals for new projects. Buying from local vendors speeds up the procurement process
36
EEI 2022 Annual Report | Building Strong Foundations for an Inclusive and Better Tomorrow
and results in cost savings, especially for remote projects where supplies and services are sourced locally rather than from Metro Manila. By sourcing locally, EEI also contributes to the local economy by generating more business, which in turn results in more taxes for the local government and more jobs for the local communities.
As the country eases back to the “old normal”, the Supply Chain Management Department is resuming its initiative of mapping the entire country so that it knows ‘what can be bought from which supplier’ anywhere in the Philippines, which was temporarily placed on hold due to the Covid-19 pandemic.
EEI recognizes that corruption not only damages the good reputation of the Company, which it worked hard to build for many years, but also leads to an increase in project cost. As used herein, corruption is understood in its general sense, a type of misconduct affecting the integrity in the workplace, rather than referring solely to the crime of corruption as defined under penal laws.
Corruption can occur among the various departments of the Company and impacts the Company’s overall performance, especially in the following aspects:
• Increased operating cost
• Loss of trust on and reputation of the Company
• Delay in project delivery
• Reduced work efficiency
EEI’s campaign in 2022 focused on the value of “MALASAKIT”, which places the responsibility of looking after the welfare and interest of everyone working for the Company on each and every employee’s shoulders. The Company continued its anti-corruption trainings while also strengthening anti-corruption campaigns through the whistleblowing hotlines that employees may use to communicate concerns or complaints without fear of negative consequences.

GOVERNANCE Ethical/Compliance Management

EEI has a Board Risk Oversight Committee (BROC) that meets regularly to oversee the Company’s enterprise-wide risk management (ERM) program, including Management’s ability to assess and manage its risks, and to provide an open communication between Management and the Board for effective risk management. The BROC meets regularly to discuss the Company’s major risks and opportunities, including those related to the climate.
EEI has a Risk Management Council chaired by the President and CEO, and comprising the Company’s various department heads. The Council oversees the implementation of the enterprise-wide risk management program and is responsible for providing timely, relevant and comprehensive risk information to the Board through the BROC. Part of what the Council oversees is the assessment, treatment and reporting of climate-related risks. Moreover, the Company also has a Risk Management Department that provides technical expertise and assistance to the risk owners for the implementation, monitoring and reporting of the ERM activities.
37
EEI 2022 Annual Report | Building Strong Foundations for an Inclusive and Better Tomorrow
Al Rushaid Construction Co., Ltd. (ARCC) Report
Saudi Arabia remains the largest economy in the Middle East and North Africa (MENA) region and a hub connecting the three continents of Asia, Africa, and Europe. A number of pioneering and pivotal sectors have greatly benefited from Saudi Arabia’s Vision 2030 economic and development framework. The most notable is Saudi Aramco which gained a 46.5% increase in net income or $161.1 billion in 2022, compared to $110.0 billion in 2021.
Even though some Saudi Arabia businesses and markets in 2022 have experienced ups and downs, Al Rushaid Construction Co., Ltd (ARCC) continues to grow and has achieved a revenue of SR 1.09 billion in 2022. ARCC also acquired SR 1.009 billion worth of awarded projects in 2022, increasing its backlog to SR 1.7 billion, of which SR 853 million is workable in 2023.
In 2022, ARCC continuously acquired a stream of projects because of its previous accomplishments, stable business relationships with major Engineering Procurement and Construction (EPC) companies, and reputation from previously completed projects for Saudi Aramco. ARCC again acquired a new contract through the EPC company Samsung Saudi Arabia Co., Ltd. for the construction of the Saudi Aramco Jafurah Gas Processing Facility (JGPF1) Project on November 13, 2022. The JGPF1 is one of the three major work packages in the Jafurah Unconventional Gas Plant Project of the Jafurah Gas Field Development,
considered the world’s biggest shale gas field outside the United States. The other two packages are the Gas Compression Plant and the Utilities and Interconnecting Facilities. The gas field lies southeast of the Ghawar oil field, 190 kilometers from Jubail, Eastern Region, Saudi Arabia.
ARCC also entered a contract with JGC Arabia at the end of 2022 to construct the Saudi Aramco Zuluf Hydrocarbon Processing Facilities & Utilities and Water Injection Project. ARCC will carry out the construction of thirty-seven (37) building structures which covers the procurement of construction materials and installation works involving civil, structural, and architectural segments for a period of 24 months.
Apart from ARCC’s concurrent mega-projects this year, the company was also awarded and signed a contract with Mitsubishi Power Saudi Arabia Ltd. Co. for the GCC Lab, an Electrical Testing Laboratory. This project is expected to become a world-class Electrical Product Testing and Services Hub in the GCC and MENA region, an independent authority for testing and certifying high-voltage, medium-voltage, and low-voltage electrical equipment, and a third party for failure investigations and arbitration that provides low voltage calibration services for electrical equipment and testing tools, and certification courses for engineers and technicians. The Lab is jointly owned by the Saudi Electricity Company 25%), Saudi Aramco (20%), Saudi Government (20%), and King Fahad University (15%).
ARCC continues to impress its clients, particularly Saudi Aramco, SABIC, and Sadara, with its highquality output and early completion of shutdown works. The company is also continuously receiving work orders for plant maintenance, especially heaters and furnaces. ARCC is the preferred Contractor in Kingdom for emergency and shutdown works because of its expertise and capable team with extensive experience on these types of projects.
38
EEI 2022 Annual Report | Building Strong Foundations for an Inclusive and Better Tomorrow
39 EEI 2022 Annual Report | Building Strong Foundations for an Inclusive and Better Tomorrow

40 EEI 2022 Annual Report | Building Strong Foundations for an Inclusive and Better Tomorrow

EEI 2022 Annual Report | Building Strong Foundations for an Inclusive and Better Tomorrow 41
Board of directors

EEI 2022 Annual Report | Building Strong Foundations for an Inclusive and Better Tomorrow
Top row, from left to right: Director Paolo Y. Abaya (Resigned effective May 17, 2023) Director Wilfrido E. Sanchez, Independent Director Gregorio T. Yu, Independent Director Roberto F. de Ocampo, Director Juan Kevin G. Belmonte, Director Renato C. Valencia
Bottom row, from left to right: Director Roberto Jose L. Castillo (Retired effective Apr 30, 2023) Chairperson Helen Y. Dee (Resigned effective May 02, 2023) Director Lorenzo V. Tan (Appointed Chairperson effective May 02, 2023) Director Medel T. Nera

EEI 2022 Annual Report | Building Strong Foundations for an Inclusive and Better Tomorrow 43
our Officers
*Designations reflected in this Annual Report are applicable for year 2022. Designations of some officers have changed in year 2023.

44 EEI 2022 Annual Report | Building Strong Foundations for an Inclusive and Better Tomorrow
 Top row, from left to right: JOSE TION TAN JR. Senior Vice President - Internal Audit
ROBERTO JOSE LARIEGO CASTILLO, President & Chief Executive Officer (Retired effective April 30, 2023)
Bottom row, from left to right: EARL JASON REYES VISTRO, Senior Vice President - Scm And Logistics
HENRY DIZON ANTONIO Chief Operations Officer (President and CEO effective May 1, 2023)
Top row, from left to right: JOSE TION TAN JR. Senior Vice President - Internal Audit
ROBERTO JOSE LARIEGO CASTILLO, President & Chief Executive Officer (Retired effective April 30, 2023)
Bottom row, from left to right: EARL JASON REYES VISTRO, Senior Vice President - Scm And Logistics
HENRY DIZON ANTONIO Chief Operations Officer (President and CEO effective May 1, 2023)
EEI 2022 Annual Report | Building Strong Foundations for an Inclusive and Better Tomorrow 45
CRIS NOEL EVANGELISTA TORRES Senior Vice President And Chief Financial Officer / Managing Director Subsidiaries
our Officers
*Designations reflected in this Annual Report are applicable for year 2022. Designations of some officers have changed in year 2023.

EEI 2022 Annual Report | Building Strong Foundations for an Inclusive and Better Tomorrow
ANDRES PARAS TUMBOKON III, Senior Vice President - Building Operations
NORMAN KU MACAPAGAL, Executive Vice President & General Manager / President-EEI Limited
DANTE GAGAN DESEMBRANA, Senior Vice President - Infrastructure Operationshenry Dizon Antonio

GLENN FAJARDO VILLASENOR Senior Vice President - Business Transformation
FERDINAND MONIS DEL PRADO, Senior Vice President - Sales And Marketing
47 EEI 2022 Annual Report | Building Strong Foundations for an Inclusive and Better Tomorrow
Top row, from left to right:
Bottom row, from left to right:
SAN MIGUEL, SIMON ELMER DECENA
Vice President-Electromechanical / General Manager - Al Rushaid Construction Company Limited

PENUMAJJI, RAMA MOHANA RAO Finance Controller
MANRIQUE, REYNALDO SALVATIERRA Assistant Vice President - Staffing, Talent Acquisition And Recruitment Services Department
IGNACIO, ALBERTO ARIOLA Managing Director
VISAYA, PAUL CALMA Vice President - Buildings
STA. MARIA, EDWIN RAZON
Assistant Vice President - Buildings
SARSOZA, PERMO RESPITO Assistant Vice President - Light Industries
SANTOS, CHRISTOPHER ABILON General Manager, LearnJP & GAMSI Express
SAMSON, KENNETH BADUA Vice President - Sales And Marketing
REYES, JESUS TEODORO CAMACHO Assistant Vice President - Corporate Development
RECIO, VAL JOSEPH ALINSAO Assistant Vice President - HRM Total Rewards And Analytics
PUNZALAN JR, HIPOLITO PAGDANGANAN Vice President - Electromech
PEREZ, VICTOR GONZALES Vice President - Treasury
MONDRAGON, IANNOEL VERZOSA Vice President - Corporate Secretary / Data Protection Officer / Corporate Compliance Officer
MENDOZA, JOSE LUCIO ROQUE Vice President - Light Industries
MEDIAVILLO, MEDVIL TUSCANO ASSISTANT VICE PRESIDENT - SUBCON PROCUREMENT
MATIAS, LAURO FELICISIMO CATRAL Vice President - Information Technology
MASA, ROSELYN MENDOZA Vice President - Finance Controller
MACALINO, GLENN CALARA Manager - Commercial
LAVALLE JR, CORNELIO ARROZA
Assistant Vice President - Engineering I And II
LAPUZ, ROMAN MANALASTAS Vice President - Project Control
GREGORIO, CHARLIE PACIS
Assistant Vice President - Logistics Support
GESULGA, CYRIL CABAYA
Assistant Vice President - Legal
GAYYA, VICENTE ADORNA
Vice President - Electromech
GALICIA, LOUIE IRAL
Assistant Vice President - Organizational Development
FIGUERA, ANNA SHEILA PAYAWA Director - Commercial And Contracts
EVIDENTE, VICTOR CABALLES Assistant Vice President - Welding
ESGUERRA, CHRISTOPHER FIGUEROA Vice President - Sales And Marketing
DIZON, REYNALDO JACINTO Vice President - Human Resources Management
DELA CRUZ, RAUL GILBERTO JABERINA Assistant Vice President - Fabrication Operation
DE GUZMAN, JUSTINO BULAWIT Assistant Vice President - Infrastructures
DADO, LUIS HORA Assistant Vice President - Labor & Employee Relation and Field Administration
CRISTI JR, ERNESTO ERAZO Assistant Vice President - Quality Control
CANLAS, ROMUALDO DE LEON Vice President - Engineering
BRUTAS, CRISANTO BROFAS Vice President - Buildings
BRUGE, LEONARDO Assistant Vice President - International Marketing
BATERINA, STEPHEN FLORENTIN Assistant Vice President - Project Planning
BARTOLOME, RYAN TANADA Assistant Vice President - Forensic Audit
ARGUELLES, MICHAEL DEGANOS Assistant Vice President - Safety, Health, Environment & Security
APOLONIO, FERDINAND DUSUHAN Assistant Vice President - Infrastructures
AMBAT, MARIA CRISTINA RAMIREZ Assistant Vice President - Quality Assurance
ALUA, MA. FATIMA BRAZA Assistant Vice President - Quality Control
ACEVEDO, VIOLY BASILIO Assistant Vice President - Finance
EEI Officers - subsidiaries
CRUZ, GARIZALDY FLORES President & General Manager, EEI, BSI, JP Systems Asia, Inc.
REYES , RICARDO CACDAC President, GAIC
SALIRE, SALVADOR JR. MORALES General Manager, EEI Power Corp. And EEI Energy Solutions Corp./ CEMO, EEI Corporation, EEI Power Corporation
REYES, JEROME MACTAL Assistant Vice President, EEI Construction & Marine, Inc.
NG, JOSEPHINE CECILLE BENITEZ Avp, Human Resources, EEI Business Solutions, Inc.
BAUZA, CESAR ARANDA Head, Customer Relations / Procurement EEI Business Solutions, Inc.
JUNGOY, EFREN JR. COLALJO Head, Vismin Operations EEI Power Corporation
EEI 2022 Annual Report | Building Strong Foundations for an Inclusive and Better Tomorrow
EEI Officers
48
Del Carmen, Surigao Del Norte receives solar-powered streetlights from EEI
The streets of Del Carmen and General Luna in Surigao Del Norte are now lit up with solar-powered streetlights donated by EEI Corporation through AY Foundation. EEI turned over 40 solar-powered streetlights to help residents of the two areas in their
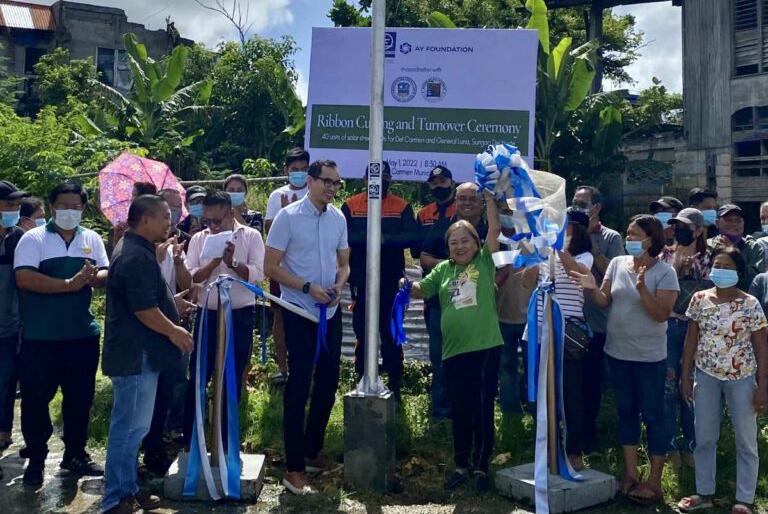
rebuilding process from the devastation caused by Typhoon Odette.
According to EEI Senior Vice President and Chief Financial Officer Cris Noel Torres, the donation is part of the company’s continuing community engagement activities through AY Foundation. He added that “it aligns with YGC’s vision of helping Filipinos be future-ready through our commitment to quality, safe and environmentally sound construction and engineering services.”
Photo shows previous Del Carmen Mayor Proserfina Matugas-Coro with EEI Senior Vice President and Chief Financial Officer Cris Noel Torres during turnover ceremonies held in May 2022. They were joined by representatives from EEI, LGU, and Del Carmen.
49
EEI 2022 Annual Report | Building Strong Foundations for an Inclusive and Better Tomorrow community building
Corporate Information
Corporate Office
12 Manggahan Street, Bagumbayan, Quezon City
1110, Philippines
Tel. No.: (+632) 8-334-2677 (EEI-CORP)
Fax No.: (+632) 8-635-0861
Email: eeicenter@eei.com.ph
Website: https://www.eei.com.ph
Mailing Address
P.O. Box 287 ACPO, Cubao, Quezon City, Philippines
Steel Fabrication Division
Barangay Santa Maria, Bauan Batangas Philippines 4201
CBW M-27
E-mail: rgjdelacruz@eei.com.ph
Tel. No.: (+6343) 727-1602
OVERSEAS JOINT VENTURE
Al Rushaid Construction Co., Ltd.
3rd Floor Tower A, Petroleum Center Building 3927, Prince Sultan Road
Al Jawharah District Unit No.333 Al Khobar 34431-9618, Saudi Arabia
Tel. No.: (00966) 3 801-0000
Fax No.: (00966) 3 801-0177
Website: www.arccksa.com

ARCC Business Development & Marketing Department
Tel. Nos.: (00966) 13-801-0000 ext. 1412, 1200, 1380 & 1188
Emails:
mabodrees@arccksa.com
fgparaisojr@arccksa.com
malek.hemadneh@arccksa.com
jdmanglicmot@arccksa.com mktghq@arccksa.com
SUBSIDIARIES
EEI Business Solutions, Inc
12 Manggahan Street, Bagumbayan, Quezon City 1110, Philippines
Tel. Nos.: (+632) 8-334-2677 loc 3057 and 3064
E-mail: ebsi@eei.com.ph
EEI Power Corporation
12 Manggahan Street, Bagumbayan, Quezon City
1110, Philippines
Tel. Nos.: (+632) 8-635-0843 to 49 loc 3074
Tel. No.: (+632) 8-297-4776
E-mail: power@eei.com.ph
EEI Energy Solutions Corp.
12 Manggahan Street, Bagumbayan, Quezon City 1110, Philippines
Tel. No.: (+632) 8-634-2677 loc 3150
E-mail: eeienergysolutions@eei.com.ph
EEI Realty Corporation
12 Manggahan Street, Bagumbayan, Quezon City 1110, Philippines
Tel. Nos.: (+632) 8-334-2677, (+632) 8-880-1956
E-mail: eeirealty@eei.com.ph
EEI Construction and Marine, Inc.
12 Manggahan Street, Bagumbayan, Quezon City
1110, Philippines
Tel. No.: (+632) 8-880-1936
Email: eeimc@eei.com.ph
Website: www.eeicmi.com
ECMI Fabrication Shop
Lot 5A Maguyam Road, Brgy. Maguyam, Silang, Cavite, 4118
GULF ASIA INTERNATIONAL CORPORATION
GAIC MANPOWER SERVICES, INC.
Ground Floor Topy Building, 3 Economia Street, Bagumbayan, Quezon City 1110, Philippines
Tel. Nos.: (+632) 8-633-7910, (+632) 8-534-4100, (+632) 8-635-7419
Fax Nos.: N/A
Emails:
jqalivarvar@eei.com.ph
aomcardenas@eei.com.ph
rcreyes@eei.com.ph
GAIC CAGAYAN DE ORO
Tan’s Apartment Door#5 Captain Vicente St., Cagayan de Oro, Philippines
Tel. Nos.: (+63) 928-665-8226
Email: rlgomos@eei.com.ph
50 EEI 2022 Annual Report | Building Strong Foundations for an Inclusive and Better Tomorrow
GAIC/GAMSI CEBU
G/F JL & Sons Building
No. 92 Landon Junquera Street., Cebu City
Philippines
Tel. No.: (+6332) 253-4190
E-mails: jjgcabreros@eei.com.ph rcreyes@eei.com.ph
JP Systems Asia, Incorporated

12 Manggahan Street, Bagumbayan, Quezon City 1110, Philippines
Tel. No.: (+632) 8-635-0974
Email: gfcruz@eei.com.ph / gfcruz@jpsai.net
BiotechJP
Central Technopark, Brgy. Lourdes, Tarlac City, Tarlac
Mobile No.: (+639) 917-706-0923
E-mail: info@biotechjp.com.ph
LearnJP Corp.
3rd Floor Topy’s Place, 6 Calle Industria Street, Bagumbayan, Quezon City
Tel. Nos.: (+632) 8-880-1864 loc. 3320
Mobile Nos.: (+63) 997-514-5863, (+63) 966-154-0424
Laguna Office: #39 3rd FlooR RPR Commercial Bldg., 57 Pacita Ave., San Pedro, Laguna
Tel. No.: (+632) 8-880-1865
Mobile Nos.: (+63) 920-810-8746, (+63) 916-630-4069
E-mail: learnjpcorp@eei.com.ph
eCarga
12 Manggahan Street, Bagumbayan, Quezon City 1110, Philippines
Mobile No.: (+63) 917-316-2643
E-mail: support@ecarga.com.ph
Website: www.ecarga.com.ph
ShinBayanihan
12 Manggahan Street, Bagumbayan, Quezon City
1110, Philippines
Tel. No.: (+632) 8-334-2677
E-mails: cabauza@eei.com.ph , jmresmade@eei. com.ph
Tetsuichiro Komatsu
Mobile No.: (+63) 995-365-1156
E-mail: ktetsuichirou@shec.com.ph
SATELLITE OFFICES
Cagayan De Oro Satellite Office
3rd floor Marel Bldg., Pabayo Hayes St., Cagayan De Oro City
Tel. Nos.: (088) 855 0894
(+63) 926-568-7146
(+63) 926-835-1457
(+63) 965-815-5637
E-mail: sblumactod@eei.com.ph
Cebu Satellite Office
AVJ Building 3rd floor Purok Kalubihan Central Poblacion, City of Naga, Cebu
Mobile Nos: (+63) 950-221-0166 , (+63) 981-5680012
E-mailS: jarecla@eei.com.ph cblibrea@eei.com.ph
Davao Satellite Office
Room 208 Goldwin Building
E. Quirino Ave., Davao City, Philippines
Tel. Nos.: (+6382) 224-1332
(+639) 30-880-5635 (+639) 26-111-4921
E-mails: rsvillafuerte@eei.com.ph, llma@eei.com.ph
Stock Transfer Agent
Rizal Commercial Banking Corporation
Auditors
Sycip Gorres Velayo & Co. Certified Public Accountants
51 EEI 2022 Annual Report | Building Strong Foundations for an Inclusive and Better Tomorrow

52 EEI 2022 Annual Report | Building Strong Foundations for an Inclusive and Better Tomorrow

53 EEI 2022 Annual Report | Building Strong Foundations for an Inclusive and Better Tomorrow
INDEPENDENT AUDITOR’S REPORT
The Board of Directors and the Stockholders
EEI Corporation

No. 12 Manggahan Street
Bagumbayan, Quezon City
Opinion
We have audited the consolidated financial statements of EEI Corporation and its subsidiaries (the Group), which comprise the consolidated statements of financial position as at December 31, 2022 and 2021, and the consolidated statements of income, consolidated statements of comprehensive income, consolidated statements of changes in equity and consolidated statements of cash flows for each of the three years in the period ended December 31, 2022 and notes to the consolidated financial statements, including a summary of significant accounting policies.
In our opinion, the accompanying consolidated financial statements present fairly, in all material respects, the consolidated financial position of the Group as at December 31, 2022 and 2021, and its consolidated financial performance and its consolidated cash flows for each of the three years in the period ended December 31, 2022 in accordance with Philippine Financial Reporting Standards (PFRSs).

Basis for Opinion
We conducted our audits in accordance with Philippine Standards on Auditing (PSAs). Our responsibilities under those standards are further described in the Auditor’s Responsibilities for the Audit of the Consolidated Financial Statements section of our report. We are independent of the Group in accordance with the Code of Ethics for Professional Accountants in the Philippines (Code of Ethics) together with the ethical requirements that are relevant to our audit of the consolidated financial statements in the Philippines, and we have fulfilled our other ethical responsibilities in accordance with these requirements and the Code of Ethics. We believe that the audit evidence we have obtained is sufficient and appropriate to provide a basis for our opinion.
Key Audit Matters
Key audit matters are those matters that, in our professional judgment, were of most significance in our audit of the consolidated financial statements of the current period. These matters were addressed in the context of our audit of the consolidated financial statements as a whole, and in forming our opinion thereon, and we do not provide a separate opinion on these matters. For each matter below, our description of how our audit addressed the matter is provided in that context.
We have fulfilled the responsibilities described in the Auditor’s Responsibilities for the Audit of the Consolidated Financial Statements section of our report, including in relation to these matters. Accordingly, our audit included the performance of procedures designed to respond to our assessment of the risks of material misstatement of the consolidated financial statements. The results of our audit procedures, including the procedures performed to address the matters below, provide the basis for our audit opinion on the accompanying consolidated financial statements.
SyCip Gorres Velayo & Co. 6760 Ayala Avenue 1226 Makati City Philippines Tel: (632) 8891 0307 Fax: (632) 8819 0872 ey.com/ph *SGVFS181544* EEI 2022 Annual Report | Audited Financial Statements 55
Recognition of revenue from construction contracts
The Group’s revenue from construction projects on electro-mechanical works, industrial, buildings and infrastructure accounts for 86% of the total revenue of the Group. Under PFRS 15, Revenue from Contracts with Customers, the Group assessed that there is only one performance obligation for each construction agreement that it has entered and that revenue arising from such agreements qualify for recognition over time. The Group also recognized as part of its construction revenue, the effects of variable considerations arising from various change orders and claims, to the extent that they reflect the amounts the Group expects to be entitled to and to be received from the customers, provided that it is highly probable that a significant reversal of the revenue recognized in connection with these variable considerations will not occur in the future. The Group elected to use the input method to measure the progress of the fulfilment of its performance obligation, which is based on the actual costs incurred to date relative to the total estimated cost to complete the construction projects.
Aside from the significance of the amount involved, we consider this as a key audit matter because this process involves significant judgment and estimates, particularly with respect to the estimation of the variable considerations arising from the change orders and claims and calculation of estimated cost to complete construction projects, which requires the technical expertise of the Group’s engineers.
The Group’s disclosures about construction revenue are included in Notes 5 and 20 to the consolidated financial statements.

Audit response
We inspected sample contracts and supplemental agreements and reviewed management’s assessment on the identification of performance obligation within the contract and the timing of revenue recognition. For construction revenue which includes significant effects of the variable considerations, we obtained an understanding and tested the relevant controls over the management’s process to estimate the amount of consideration expected to be received from the customers. For change orders and claims of sampled contracts, we compared the amounts recognized as revenue to the change orders and claims approved by the customers and other relevant documentary evidences supporting the management’s estimate of revenue recognized.
For the measurement of progress of the construction projects, we obtained an understanding of the Group’s processes to accumulate actual costs incurred and to estimate the expected cost to complete and tested the relevant controls. We also tested actual costs incurred by examining sample invoices and other supporting third-party correspondences. We also considered the competence, capabilities and objectivity of the Group’s cost engineers by referring to their qualifications, experience and reporting responsibilities. We examined the approved total estimated completion costs, any revisions thereto, and the cost variance analysis with supporting details. We discussed the status of the projects under construction with the Group’s engineers. We also inspected the related project documentation and inquired about the significant deviations from the targeted completion.
EEI 2022 Annual Report | Audited Financial Statements
Accounting for investment in Al-Rushaid Construction Company Ltd.
The Group owns 49% equity interest in Al-Rushaid Construction Company Ltd. (ARCC), associate accounted for under the equity method. As of December 31, 2022, ARCC recognized deferred tax asset on net operating loss carryover of ₱435.92 million. We consider the accounting for the investment in ARCC as a key audit matter because the Group’s share in ARCC’s net loss and the carrying value of the investment represents 193% of the Group’s consolidated net income and 5% of the Group’s total assets, respectively. The Group’s share in ARCC’s net earnings is significantly affected by ARCC’s revenue recognition from its construction contracts. In addition, management’s assessment process on the recognition of deferred tax asset is based on assumptions, which are affected by expected future market or economic conditions.
The Group’s disclosures about the investment in ARCC are included in Note 11 to the consolidated financial statements.
Audit response
We sent instructions to statutory auditors of ARCC to perform an audit on the relevant financial information of ARCC for the purpose of the Group’s consolidated financial statements. These audit instructions cover their scope of work, risk assessment procedures, audit strategy and reporting responsibilities. We discussed with ARCC’s statutory auditors about their key audit areas, planning and execution of audit procedures, significant areas of estimation and judgment. We reviewed their working papers, focusing on the procedures performed on ARCC’s revenue recognition, and obtained relevant conclusion statements related to their audit procedures. Furthermore, we evaluated management’s assumptions on the recognition of deferred tax assets and inquired with the Group’s management the basis of the financial forecast. We also compared management’s forecast against historical performance of ARCC.
We also obtained the financial information of ARCC for the year ended December 31, 2022 and recomputed the Group’s share in net earnings for the year ended December 31, 2022.
Valuation of unquoted equity investments carried at fair value through other comprehensive income
The Group has unquoted equity investments classified as equity investments at fair value through other comprehensive income (FVOCI) amounting to ₱1.3 billion. The valuation of these investments is significant to our audit because it is inherently subjective as it involves the use of valuation inputs that are not market observable. Management also applied judgment in selecting the valuation technique and the assumptions to be used.
The Group’s disclosures about its unquoted equity investments are included in Notes 12 and 34 to the consolidated financial statements.

57 *SGVFS163860* EEI 2022 Annual Report | Audited Financial Statements
Audit response
We evaluated the competence, capabilities and qualifications of the external valuers by considering their qualifications, experience and reporting responsibilities. For the unquoted equity investment valued using market approach, we inquired from the external appraiser the basis of the adjustments made to the sales price. For the unquoted equity investment valued using earnings-based approach, we involved our internal specialist in the review of the methodology and assumptions used. The key assumptions used are the revenue growth rate and discount rate. We evaluated the revenue growth rate by reference to historical information and relevant market data. We tested the parameters used in the determination of the discount rate against market data. We compared the fair value of the investment against a range of values determined using earnings-based approach. We also reviewed the Group’s disclosures about those assumptions to which the outcome of the valuation is most sensitive; specifically, those that have the most significant effect on the determination of the fair value of the unquoted equity investments.
Other Information
Management is responsible for the other information. The other information comprises the information included in the SEC Form 20-IS (Definitive Information Statement), SEC Form 17-A and Annual Report for the year ended December 31, 2022, but does not include the consolidated financial statements and our auditor’s report thereon. The SEC Form 20-IS (Definitive Information Statement), SEC Form 17-A and Annual Report for the year ended December 31, 2022 are expected to be made available to us after the date of this auditor’s report.
Our opinion on the consolidated financial statements does not cover the other information and we will not express any form of assurance conclusion thereon.
In connection with our audits of the consolidated financial statements, our responsibility is to read the other information identified above when it becomes available and, in doing so, consider whether the other information is materially inconsistent with the consolidated financial statements or our knowledge obtained in the audits, or otherwise appears to be materially misstated.
Responsibilities of Management and Those Charged with Governance for the Consolidated Financial Statements
Management is responsible for the preparation and fair presentation of the consolidated financial statements in accordance with PFRSs, and for such internal control as management determines is necessary to enable the preparation of consolidated financial statements that are free from material misstatement, whether due to fraud or error.
In preparing the consolidated financial statements, management is responsible for assessing the Group’s ability to continue as a going concern, disclosing, as applicable, matters related to going concern and using the going concern basis of accounting unless management either intends to liquidate the Group or to cease operations, or has no realistic alternative but to do so. Those charged with governance are responsible for overseeing the Group’s financial reporting process.

EEI 2022 Annual Report | Audited Financial Statements
Auditor’s Responsibilities for the Audit of the Consolidated Financial Statements
Our objectives are to obtain reasonable assurance about whether the consolidated financial statements as a whole are free from material misstatement, whether due to fraud or error, and to issue an auditor’s report that includes our opinion. Reasonable assurance is a high level of assurance, but is not a guarantee that an audit conducted in accordance with PSAs will always detect a material misstatement when it exists. Misstatements can arise from fraud or error and are considered material if, individually or in the aggregate, they could reasonably be expected to influence the economic decisions of users taken on the basis of these consolidated financial statements.
As part of an audit in accordance with PSAs, we exercise professional judgment and maintain professional skepticism throughout the audit. We also:
• Identify and assess the risks of material misstatement of the consolidated financial statements, whether due to fraud or error, design and perform audit procedures responsive to those risks, and obtain audit evidence that is sufficient and appropriate to provide a basis for our opinion. The risk of not detecting a material misstatement resulting from fraud is higher than for one resulting from error, as fraud may involve collusion, forgery, intentional omissions, misrepresentations, or the override of internal control.
• Obtain an understanding of internal control relevant to the audit in order to design audit procedures that are appropriate in the circumstances, but not for the purpose of expressing an opinion on the effectiveness of the Group’s internal control.
• Evaluate the appropriateness of accounting policies used and the reasonableness of accounting estimates and related disclosures made by management.
• Conclude on the appropriateness of management’s use of the going concern basis of accounting and, based on the audit evidence obtained, whether a material uncertainty exists related to events or conditions that may cast significant doubt on the Group’s ability to continue as a going concern. If we conclude that a material uncertainty exists, we are required to draw attention in our auditor’s report to the related disclosures in the consolidated financial statements or, if such disclosures are inadequate, to modify our opinion. Our conclusions are based on the audit evidence obtained up to the date of our auditor’s report. However, future events or conditions may cause the Group to cease to continue as a going concern.
• Evaluate the overall presentation, structure and content of the consolidated financial statements, including the disclosures, and whether the consolidated financial statements represent the underlying transactions and events in a manner that achieves fair presentation.
• Obtain sufficient appropriate audit evidence regarding the financial information of the entities or business activities within the Group to express an opinion on the consolidated financial statements. We are responsible for the direction, supervision and performance of the audit. We remain solely responsible for our audit opinion.
59 *SGVFS163860* EEI 2022 Annual Report | Audited Financial Statements
We communicate with those charged with governance regarding, among other matters, the planned scope and timing of the audit and significant audit findings, including any significant deficiencies in internal control that we identify during our audit.

We also provide those charged with governance with a statement that we have complied with relevant ethical requirements regarding independence, and to communicate with them all relationships and other matters that may reasonably be thought to bear on our independence, and where applicable, related safeguards.
From the matters communicated with those charged with governance, we determine those matters that were of most significance in the audit of the consolidated financial statements of the current period and are therefore the key audit matters. We describe these matters in our auditor’s report unless law or regulation precludes public disclosure about the matter or when, in extremely rare circumstances, we determine that a matter should not be communicated in our report because the adverse consequences of doing so would reasonably be expected to outweigh the public interest benefits of such communication.
The engagement partner on the audit resulting in this independent auditor’s report is
Wenda Lynn M. Loyola.
SYCIP GORRES VELAYO & CO.
Wenda Lynn M. Loyola Partner
CPA Certificate No. 109952
Tax Identification No. 242-019-387

BOA/PRC Reg. No. 0001, August 25, 2021, valid until April 15, 2024
SEC Partner Accreditation No. 109952-SEC (Group A)
Valid to cover audit of 2021 to 2025 financial statements of SEC covered institutions
SEC Firm Accreditation No. 0001-SEC (Group A)
Valid to cover audit of 2021 to 2025 financial statements of SEC covered institutions
BIR Accreditation No. 08-001998-117-2022, January 20, 2022, valid until January 19, 2025
PTR No. 9564644, January 3, 2023, Makati City
April 11, 2023
EEI 2022 Annual Report | Audited Financial Statements Annual
EEI CORPORATION AND SUBSIDIARIES
CONSOLIDATED STATEMENTS OF FINANCIAL POSITION
61
December 31 2022 2021 ASSETS Current Assets Cash and cash equivalents (Note 6) ₱ 2,571,374,751 ₱ 7,124,222,377 Receivables - net (Note 7) 2,499,010,535 2,366,869,061 Contract assets - net (Note 8) 5,182,274,282 8,741,253,049 Inventories (Note 9) 1,126,814,073 1,195,316,227 Due from related parties (Note 26) 196,097,127 154,351,686 Other current assets (Note 10) 1,193,838,858 882,935,158 Total Current Assets 12,769,409,626 20,464,947,558 Noncurrent Assets Contract assets - net of current portion (Note 8) 5,190,526,530 1,079,458,807 Investments in associates and joint ventures (Note 11) 3,189,929,274 3,259,612,915 Equity investments at fair value through other comprehensive income (FVOCI) (Note 12) 1,276,220,111 1,272,977,284 Investment properties (Note 15) 14,295,711 14,496,211 Property and equipment (Note 13) 2,429,573,259 3,308,019,139 Right-of-use asset (Note 14) 658,508,891 594,107,160 Deferred tax assets - net (Note 25) 1,289,478,853 1,112,394,601 Retirement asset (Note 27) 52,191,565 ‒Other noncurrent assets (Note 16) 2,103,983,174 1,109,058,887 Total Noncurrent Assets 16,204,707,368 11,750,125,004 ₱ 28,974,116,994 ₱32,215,072,562
Current Liabilities Accounts payable and other current liabilities (Note 18) ₱ 5,144,478,462 ₱5,460,072,585 Bank loans (Note 17) 3,400,000,000 3,250,000,000 Current portion of long-term debt (Note 19) 3,193,317,241 3,526,205,077 Current portion of lease liability (Note 14) 102,592,918 52,319,204 Current portion of contract liability (Note 8) 434,405,390 421,090,961 Income tax payable 5,993,068 16,301,158 Due to related parties (Note 26) 2,532,536 2,121,399 Total Current Liabilities 12,283,319,615 12,728,110,384 Noncurrent Liabilities Long-term debt - net of current portion (Note 19) 1,572,868,570 4,737,011,698 Retirement liabilities (Note 27) ‒ 37,278,295 Deferred tax liabilities (Note 25) 128,494,358 127,911,493 Lease liability - net of current portion (Note 14) 617,797,371 435,269,552 Contract liability - net of current portion (Note 8) 826,701,427 565,849,622 Other noncurrent liabilities (Note 18) 128,168,313 242,947,497 Total Noncurrent Liabilities 3,274,030,039 6,146,268,157 Total Liabilities 15,557,349,654 18,874,378,541 Equity Capital stock (Note 29) 1,066,401,386 1,066,401,386 Additional paid-in capital 6,402,046,998 6,402,046,998 Treasury stock (3,720,790) (3,720,790) Other comprehensive income - net (Notes 12 and 27) 1,188,159,597 922,058,654 Retained earnings (Note 30) 4,760,634,470 4,950,157,787 13,413,521,661 13,336,944,035 Non-controlling interests 3,245,679 3,749,986 Total Equity 13,416,767,340 13,340,694,021 ₱ 28,974,116,994 ₱32,215,072,562
EEI 2022 Annual Report | Audited Financial Statements *SGVFS163860*
LIABILITIES AND EQUITY
See accompanying Notes to Consolidated Financial Statements.
EEI CORPORATION AND SUBSIDIARIES
CONSOLIDATED STATEMENTS OF INCOME
*For the year ended December 31, 2020, costs of sales and services includes 1.03 billion cost that the Group incurred during enhanced community quarantine where all construction activities, both private and government projects, in the entire island of Luzon were temporarily suspended. These costs pertain to salaries and wages of its construction workers at project sites during the period of suspension of construction activities.
See accompanying Notes to Consolidated Financial Statements.
62
For the Years Ended December 31 2022 2021 2020 REVENUE FROM CONTRACTS WITH CUSTOMERS (Note 20) ₱14,652,187,065 ₱16,149,705,243 13,881,319,022 COSTS OF SALES AND SERVICES* (Note 21) 12,669,779,160 14,394,288,323 16,093,666,815 GROSS PROFIT (LOSS) 1,982,407,905 1,755,416,920 (2,212,347,793) EQUITY IN NET EARNINGS (LOSS) OF ASSOCIATES AND JOINT VENTURES (Note 11) (105,851,646) 925,173,364 980,867,002 SELLING AND ADMINISTRATIVE EXPENSES (Note 22) 1,638,885,877 1,520,567,340 1,696,611,510 FINANCE COSTS AND OTHER EXPENSES - Net Interest expense (Notes 14, 17 and 19) 398,121,946 469,481,846 466,242,665 Foreign exchange gains losses (gains) – net (19,732,867) (7,068,699) 46,583,668 378,389,079 462,413,147 512,826,333 INTEREST INCOME (Note 6 and 23) 35,161,634 7,721,523 16,955,390 OTHER INCOME - Net (Note 24) 375,676,367 78,328,105 66,405,380 INCOME (LOSS) BEFORE INCOME TAX 270,119,304 783,659,425 (3,357,557,864) PROVISION FOR (BENEFIT FROM) INCOME TAX (Note 25) Current 294,808,234 63,824,530 44,351,618 Deferred (224,995,806) 240,938,396 (1,329,742,992) 69,812,428 304,762,926 (1,285,391,374) NET INCOME (LOSS) ₱ 200,306,876 ₱478,896,499 (₱2,072,166,490) Net income (loss) attributable to: Equity holders of the Parent Company ₱ 209,211,183 ₱489,699,853 (₱2,046,059,914) Non-controlling interests (8,904,307) (10,803,354) (26,106,576) 200,306,876 478,896,499 (2,072,166,490) Earnings (Loss) Per Share – Basic and Diluted (Note 32) (₱ 0.0867) ₱ 0.4662 (₱1.9744)
EEI 2022 Annual Report | Audited Financial Statements
EEI CORPORATION AND SUBSIDIARIES
CONSOLIDATED STATEMENTS OF COMPREHENSIVE INCOME
See accompanying Notes to Consolidated Financial Statements.
63
Years Ended December 31 2022 2021 2020 NET INCOME (LOSS) ₱ 200,306,876 ₱478,896,499 (₱2,072,166,490) OTHER COMPREHENSIVE INCOME (LOSS) Items not to be reclassified to profit or loss in subsequent periods: Fair value change on equity investments at FVOCI (Note 12) 3,242,827 233,107,050 (17,501,993) Share in other comprehensive income of associates (Note 11) (54,668,109) (35,105,272) (14,258,282) Remeasurement gains (losses) on retirement liabilities (Note 27) 187,552,853 372,851,041 (82,143,152) Income tax effect relating to items that will not be reclassified to profit or loss (Note 25) (47,471,062) (153,543,497) 30,571,827 88,656,509 417,309,322 (83,331,600) Item to be reclassified to profit or loss in subsequent periods: Cumulative translation adjustments 177,444,434 82,024,037 (41,824,037) 266,100,943 499,333,359 (125,155,637) TOTAL COMPREHENSIVE INCOME (LOSS) ₱466,407,819 ₱ 978,229,858 (₱2,197,322,127) Total comprehensive income (loss) attributable to: Equity holders of the Parent Company ₱475,312,126 ₱ 989,033,212 (₱2,171,093,551) Non-controlling interests (8,904,307) (10,803,354) (26,228,576) ₱466,407,819 ₱ 978,229,858 (₱2,197,322,127)
EEI 2022 Annual Report | Audited Financial Statements *SGVFS163860*
EEI CORPORATION AND SUBSIDIARIES
CONSOLIDATED STATEMENTS OF CHANGES IN EQUITY FOR THE YEARS ENDED DECEMBER 31 2022, 2021 AND 2020
64
Other Comprehensive Income Capital Stock (Note 29) Additional Paid-In Capital Treasury Stock Remeasurement Gains (Losses) on Retirement Liability (Note 27) Cumulative Translation Adjustments (Note 11) Balances at January 1, 2020 ₱1,036,401,386 ₱477,037,443 (₱ 3,720,790) (₱ 310,518,436) ₱ 321,683,554 Reversal of appropriation of retained earnings (Note 30) ‒ ‒ ‒ ‒ ‒Net loss ‒ ‒ ‒ ‒ ‒Other comprehensive loss ‒ ‒ ‒ (71,650,488) (41,824,037) Total comprehensive loss ‒ ‒ ‒ (71,650,488) (41,824,037) Balances at December 31, 2020 1,036,401,386 477,037,443 (3,720,790) (382,168,924) 279,859,517 Issuance 30,000,000 5,925,009,555 ‒ ‒ ‒Net income (loss) ‒ ‒ ‒ ‒ ‒Other comprehensive income ‒ ‒ ‒ 217,007,502 83,558,335 Total comprehensive income (loss) ‒ ‒ ‒ 217,007,502 83,558,335 Balances at December 31, 2021 1,066,401,386 6,402,046,998 (3,720,790) (165,161,422) 363,417,852 Additional subscription ‒ ‒ ‒ ‒ ‒Net income (loss) ‒ ‒ ‒ ‒ ‒Other comprehensive income ‒ ‒ ‒ 85,996,547 177,444,434 Total comprehensive income (loss) ‒ ‒ 85,996,547 177,444,434 Dividends paid ‒ ‒ ‒ ‒ ‒Balances at December 31, 2022 ₱1,066,401,386 ₱6,402,046,998 (₱ 3,720,790) (₱ 79,164,875) ₱540,862,286 EEI 2022 Annual Report | Audited Financial Statements
Attributable to Equity Holders of the Parent Company
Income - Net of Deferred Tax Effect
65
Fair Value Reserve of Equity Investments at FVOCI (Note 12) Retained Earnings (Note 30) Non-controlling Subtotal Unappropriated Appropriated Subtotal Interests Total ₱536,593,814 ₱547,758,932 ₱ 2,506,517,848 ₱4,000,000,000 ₱ 8,563,994,819 ₱40,781,916 ₱ 8,604,776,735 ‒ ‒ 4,000,000,000 (4,000,000,000) ‒ ‒ ‒‒ ‒ (2,046,059,914) ‒ (2,046,059,914) (26,106,576) (2,072,166,490) (11,559,112) (125,033,637) ‒ ‒ (125,033,637) (122,000) (125,155,637) (11,559,112) (125,033,637) (2,046,059,914) ‒ (2,171,093,551) (26,228,576) (2,197,322,127) 525,034,702 422,725,295 4,460,457,934 ‒ 6,392,901,268 14,553,340 6,407,454,608 ‒ ‒ ‒ ‒ 5,955,009,555 ‒ 5,955,009,555 ‒ ‒ 489,699,853 ‒ 489,699,853 (10,803,354) 478,896,499 198,767,522 499,333,359 ‒ ‒ 499,333,359 ‒ 499,333,359 198,767,522 499,333,359 489,699,853 ‒ 989,033,212 (10,803,354) 978,229,858 723,802,224 922,058,654 4,950,157,787 ‒ 13,336,944,035 3,749,986 13,340,694,021 ‒ ‒ ‒ ‒ ‒ 8,400,000 8,400,000 ‒ ‒ 209,211,183 ‒ 209,211,183 (8,904,307) 200,306,876 2,659,962 266,100,943 ‒ ‒ 266,100,943 ‒ 266,100,943 2,659,962 266,100,943 209,211,183 ‒ 475,312,126 (8,904,307) 466,407,819 ‒ ‒ (398,734,500) ‒ (398,734,500) ‒ (398,734,500) ₱ 726,462,186 ₱1,188,159,597 ₱4,760,634,470 ₱‒ ₱13,413,521,661 ₱ 3,245,679 ₱13,416,767,340 EEI 2022 Annual Report | Audited Financial Statements *SGVFS163860*
EEI CORPORATION AND SUBSIDIARIES CONSOLIDATED STATEMENTS OF CASH FLOWS
CASH FLOWS FROM OPERATING ACTIVITIES
66 See accompanying Notes to Consolidated Financial Statements.
Years Ended December 31 2022 2021 2020
Income (loss) before income tax ₱ 270,119,304 ₱ 783,659,425 (₱3,357,557,864) Adjustments for: Depreciation and amortization (Notes 13, 14, 21 and 22) 546,676,029 598,297,606 766,098,997 Interest expense (Notes 14, 17 and 19) 398,121,946 469,481,846 466,242,665 Equity in net loss (earnings) of associates and joint ventures (Note 11) 105,851,646 (925,173,364) (980,867,002) Movements in retirement assets and liabilities 99,106,334 38,164,681 (8,256,584) Gain on sale of investment properties (Notes 15 and 24) (32,300) (14,750) (204,500) Dividend income (Note 24) (4,004,599) (50,987,679) (37,058,954) Unrealized foreign exchange loss (gain) - net (4,163,044) (7,068,699) 46,583,668 Interest income (Note 23) (35,161,634) (7,721,523) (16,955,390) Gain on sale of property and equipment (Note 24) (343,765,609) (4,248,583) (7,316,671) Operating income (loss) before working capital changes 1,032,748,073 894,388,960 (3,129,291,635) Decrease (increase) in: Receivables (132,504,559) 1,247,048,658 631,056,198 Contract assets (552,088,957) (1,236,960,086) 1,393,590,033 Due from related parties (41,745,441) (88,737,714) 17,098,368 Inventories 68,502,154 219,820,983 328,621,215 Other current assets (310,903,698) 98,072,698 (394,723,607) Other noncurrent assets 205,075,712 (30,174,216) 102,198,678 Increase (decrease) in: Accounts payable and other current liabilities (416,525,261) (1,345,890,036) 156,507,623 Contract liabilities 274,166,234 (861,933,073) (875,200,911) Due to related parties 411,138 2,121,399 (126,417,175) Cash flows generated from (used in) operations 127,135,395 (1,102,242,427) (1,896,561,213) Interest received 35,524,718 7,867,421 17,724,385 Interest paid (382,758,440) (413,103,643) (472,138,293) Income taxes paid (305,116,324) (70,967,692) (63,490,599) Net cash flows used in operating activities (525,214,651) (1,578,446,341) (2,414,465,720) CASH FLOWS FROM INVESTING ACTIVITIES Proceeds from disposals of: Property and equipment (Notes 13 and 24) 1,101,580,894 99,116,617 568,685,883 Equity investment at FVOCI (Note 12) ‒ ‒ 9,900,000 Investment properties (Note 24) 232,800 80,750 873,500 Acquisitions of: Property and equipment (Note 13) (196,668,588) (170,057,061) (489,514,591) Investment in associates (Note 11) (47,761,482) ‒ (450,000) Equity investment at FVOCI (Note 12) ‒ (8,300,000) ‒Loan to retirement fund (1,200,000,000) Proceeds from return of investment (Note 11) ‒ 454,139,216 575,959,275 Dividends received (Notes 11, 12 and 24) 122,804,599 207,891,679 112,058,954 Net cash flows provided by (used in) investing activities (219,811,777) 582,871,201 777,513,021 Forward EEI 2022 Annual Report | Audited Financial Statements
CASH FLOWS FROM FINANCING ACTIVITIES
67 EEI 2022 Annual Report | Audited Financial Statements *SGVFS163860* Years Ended December 31 2022 2021 2020
Availment of: Bank loans (Note 17) 12,462,676,041 10,000,000,000 11,602,000,000 Issuance of preferred shares (Note 29) ‒ 5,955,009,555 ‒Long-term debt – net of transaction costs (Note 19) ‒ 5,457,684,245 4,082,880,748 Payments of: Bank loans (Note 17) (12,312,676,041) (11,765,000,000) (12,492,000,000) Long-term debt (Note 19) (3,526,242,518) (2,765,991,887) (1,260,133,045) Principal portion of lease liabilities (Note 14) (60,977,044) (92,847,405) (105,787,665) Cash dividends (398,734,500) ‒ (5,999,995) Changes in non-controlling interests 8,400,000 ‒ ‒Net cash flows provided by (used in) financing activities (3,827,554,062) 6,788,854,508 1,820,960,043 EFFECTS OF EXCHANGE RATE CHANGES ON CASH AND CASH EQUIVALENTS 19,732,864 (1,420,031) (7,850,763) NET (DECREASE) INCREASE IN CASH AND CASH EQUIVALENTS (4,552,847,626) 5,791,859,337 176,156,581 CASH AND CASH EQUIVALENTS AT BEGINNING OF YEAR 7,124,222,377 1,332,363,040 1,156,206,459 CASH AND CASH EQUIVALENTS AT END OF YEAR (Note 6) ₱ 2,571,374,751 ₱ 7,124,222,377 ₱1,332,363,040
EEI CORPORATION AND SUBSIDIARIES NOTES TO CONSOLIDATED FINANCIAL STATEMENTS
1. Corporate Information and Authorization for Issuance of Consolidated Financial Statements
EEI Corporation (the Parent Company) is a stock corporation incorporated on April 17, 1931 under the laws of the Philippines. On July 15, 1980, the Parent Company’s corporate life was extended for another fifty years starting April 17, 1981. The Parent Company is engaged in general contracting and construction equipment rental. Its registered office address and principal place of business is No. 12 Manggahan Street, Bagumbayan, Quezon City.
The Parent Company’s shares of stock are publicly traded at the Philippine Stock Exchange (PSE). It is a subsidiary of House of Investments, Inc., which is also incorporated in the Philippines. The ultimate parent company of EEI Corporation is Pan Malayan Management and Investment Corporation (PMMIC).
The consolidated financial statements were approved and authorized for issue by the Board of Directors (BOD) on April 11, 2023.
2. Basis of Preparation and Statement of Compliance
Basis of Preparation
The consolidated financial statements have been prepared on a historical cost basis, except for equity investments at FVOCI which have been measured at fair value. The accompanying consolidated financial statements are presented in Philippine Peso (₱), which is also the Parent Company’s functional currency. Except as indicated, all amounts are rounded off to the nearest Peso.
Statement of Compliance
The consolidated financial statements have been prepared in compliance with Philippine Financial Reporting Standards (PFRSs).
Basis of Consolidation
The consolidated financial statements include the Parent Company and the following companies (collectively the Group) that it controls:
68 See accompanying Notes to Consolidated Financial Statements
Percentage of Ownership Place of Incorporation Nature of Business Functional Currency 2022 2021 Direct Indirect Direct Indirect EEI Limited (formerly EEI BVI Ltd.) British Virgin Islands Holding company US Dollar 100 ‒ 100 ‒Clear Jewel Investments, Ltd. (CJIL) British Virgin Islands Holding company US Dollar 100 100 Nimaridge Investments, Limited British Virgin Islands Holding company US Dollar ‒ 100 ‒ 100 EEI (PNG), Ltd Papua New Guinea Holding company US Dollar ‒ 100 ‒ 100 EEI Corporation (Guam), Inc. United States of America Construction US Dollar 100 ‒ 100 ‒EEI Construction and Marine, Inc. Philippines Construction Philippine Peso 100 ‒ 100 ‒EEI Realty Corporation (EEI Realty) Philippines Real estate Philippine Peso 100 ‒ 100 ‒EEI Subic Corporation Philippines Construction Philippine Peso 100 ‒ 100 ‒EEI 2022 Annual Report | Audited Financial Statements Forward
*On May 27, 2022, Equipment Engineers, Inc. was renamed as EEI Business Solutions, Inc., with the purpose of establishing a separate and distinct identity for the Company as it is frequently mistaken as EEI Corporation, its Parent Company.
** On May 14, 2021, EEI Carga Digital Logistics Corporation was incorporated as a wholly owned subsidiary of EE. EEI Carga’s primary purpose is to own and operate a digital logistics platform that enables shippers to deliver their products through various transportation options available in the platform. EEI Carga’s financial year end is December 31.
Control is achieved when the Group is exposed, or has rights, to variable returns from its involvement with the investee and has the ability to affect those returns through its power over the investee.
Specifically, the Group controls an investee if and only if the Group has:
a) power over the investee (i.e. existing rights that give it the current ability to direct the relevant activities of the investee);
b) exposure, or rights, to variable returns from its involvement with the investee; and
c) the ability to use its power over the investee to affect its returns.
Generally, there is a presumption that a majority of voting rights result in control. To support this presumption and when the Group has less than a majority of the voting or similar rights of an investee, the Group considers all relevant facts and circumstances in assessing whether it has power over an investee, including:
a) the contractual arrangement with the other vote holders of the investee
b) rights arising from other contractual arrangements
c) the Group’s voting rights and potential voting rights
The Group re-assesses whether or not it controls an investee if facts and circumstances indicate that there are changes to one or more of the three elements of control. Consolidation of a subsidiary begins when the Group obtains control over the subsidiary and ceases when the Group loses control of the subsidiary. Assets,
69 EEI 2022 Annual Report | Audited Financial Statements *SGVFS163860* Percentage of Ownership Place of Incorporation Nature of Business Functional Currency 2022 2021 Direct Indirect Direct Indirect EEI Business Solutions, Inc. (EBSI) (formerly Equipment Engineers, Inc.)* Philippines Trading Philippine Peso 100 ‒ 100 ‒JP Systems Asia Inc. (JPSAI) Philippines Rental of scaffolding and formworks Philippine Peso ‒ 60 ‒ 60 BiotechJP Corp. Philippines Manufacturing food and therapeutic food Philippine Peso 60 ‒ 60 ‒Learn JP Corp. Philippines Services for improvement in language proficiency Philippine Peso ‒ 60 ‒ 60 EEI Power Corporation (EPC) Philippines Power generation Philippine Peso 89 11 89 11 Gulf Asia International Corporation (GAIC) Philippines Manpower services Philippine Peso 100 ‒ 100 ‒GAIC Professional Services, Inc. (GAPSI) Philippines Manpower services Philippine Peso ‒ 100 ‒ 100 GAIC Manpower Services, Inc. (GAMSI) Philippines Manpower services Philippine Peso ‒ 100 ‒ 100 Bagumbayan Equipment & Industrial Products, Inc. Philippines Consultancy services Philippine Peso 100 ‒ 100 ‒Philmark, Inc. Philippines Construction Philippine Peso 100 ‒ 100 ‒Philrock Construction and Services, Inc. Philippines Manpower services Philippine Peso 100 ‒ 100 ‒EEI Energy Solutions Corporation (EESC) Philippines Retail energy supplier Philippine Peso ‒ 100 ‒ 100 EEI Carga Digital Logistics Corporation (EEI Carga)** Philippines Digital logistics Philippine Peso ‒ 100 ‒ 100
liabilities, income and expenses of a subsidiary acquired or disposed of during the year are included in the consolidated statements of income and consolidated statements of comprehensive income from the date the Group gains control until the date the Group ceases to control the subsidiary.
Subsidiaries are fully consolidated from the date of acquisition, being the date on which the Group obtains control, and continue to be consolidated until the date when such control ceases.
The consolidated financial statements are prepared with the same financial reporting period as the Parent Company using the consistent accounting policies. All significant intercompany balances and transactions, intercompany profits and expenses and gains and losses are eliminated during consolidation.
A change in the ownership interest of a subsidiary, without a loss of control, is accounted for as an equity transaction. If the Group loses control over a subsidiary, it:
• derecognizes the assets (including goodwill) and liabilities of the subsidiary.
• derecognizes the carrying amount of any non-controlling interests.
• recognizes the fair value of the consideration received.
• recognizes the fair value of any investment retained.
• reclassifies to profit or loss, or transfer directly to retained earnings if required by other PFRSs, the amounts recognized in other comprehensive income in relation to the subsidiary; and
• recognizes any resulting difference as a gain or loss in profit or loss attributable to the Parent Company.
Non-controlling interests (NCI) represent the portion of equity not attributable to the Parent Company. Profit or loss and each component of other comprehensive income (OCI) are attributed to the equity holders of the Parent Company and to the non-controlling interests, even if this results in the non-controlling interests having a deficit balance. Non-controlling interests are presented separately in the consolidated statements of comprehensive income and within the equity section of the consolidated statements of financial position and consolidated statements of changes in equity, separately from the equity attributable to equity holders of the Parent Company.
3. Changes in Accounting Policies
The accounting policies adopted are consistent with those of the previous financial year, except that the Group has adopted the following new accounting pronouncements starting January 1, 2022. Adoption of these pronouncements did not have any significant impact on the Group’s financial statements unless otherwise indicated.
The Group did not early adopt any other standard, interpretation or amendment that has been issued but is not yet effective. The adoption of these pronouncements does not have a significant impact on the Group’s consolidated financial statements unless otherwise indicated.
• Amendments to PFRS 3, Reference to the Conceptual Framework
The amendments are intended to replace a reference to the Framework for the Preparation and Presentation of Financial Statements, issued in 1989, with a reference to the Conceptual Framework for Financial Reporting issued in March 2018 without significantly changing its requirements. The amendments added an exception to the recognition principle of PFRS 3, Business Combinations to avoid the issue of potential ‘day 2’gains or losses arising for liabilities and contingent liabilities that would be within the scope of PAS 37, Provisions, Contingent Liabilities and Contingent Assets or PhilippineIFRIC 21, Levies, if incurred separately.
At the same time, the amendments add a new paragraph to PFRS 3 to clarify that contingent assets do not qualify for recognition at the acquisition date.
The amendments are effective for annual reporting periods beginning on or after 1 January 2022 and apply prospectively. The amendment has no impact to the consolidated financial statements.
70
EEI 2022 Annual Report | Audited Financial Statements
• Amendments to PAS 16 , Plant and Equipment: Proceeds before Intended Use
The amendments prohibit entities deducting from the cost of an item of property, plant and equipment, any proceeds from selling items produced while bringing that asset to the location and condition necessary for it to be capable of operating in the manner intended by management. Instead, an entity recognizes the proceeds from selling such items, and the costs of producing those items, in profit or loss.
The amendment is effective for annual reporting periods beginning on or after January 1, 2022 and must be applied retrospectively to items of property, plant and equipment made available for use on or after the beginning of the earliest period presented when the entity first applies the amendment.
The amendments have no impact to the consolidated financial statements.
• Amendments to PAS 37, Onerous Contracts – Costs of Fulfilling a Contract
The amendments specify which costs an entity needs to include when assessing whether a contract is onerous or loss-making. The amendments apply a “directly related cost approach”. The costs that relate directly to a contract to provide goods or services include both incremental costs and an allocation of costs directly related to contract activities. General and administrative costs do not relate directly to a contract and are excluded unless they are explicitly chargeable to the counterparty under the contract.
The amendments are effective for annual reporting periods beginning on or after January 1, 2022. The Group will apply these amendments to contracts for which it has not yet fulfilled all its obligations at the beginning of the annual reporting period in which it first applies the amendments.
The amendments have no impact to the consolidated financial statements.
• Annual Improvements to PFRSs 2018-2020 Cycle
o Amendments to PFRS 1, First-time Adoption of Philippines Financial Reporting Standards, Subsidiary as a first-time adopter
The amendment permits a subsidiary that elects to apply paragraph D16(a) of PFRS 1 to measure cumulative translation differences using the amounts reported by the parent, based on the parent’s date of transition to PFRS. This amendment is also applied to an associate or joint venture that elects to apply paragraph D16(a) of PFRS 1.
The amendment is effective for annual reporting periods beginning on or after January 1, 2022 with earlier adoption permitted. The amendments have no impact to the consolidated financial statements.
o Amendments to PFRS 9, Financial Instruments, Fees in the ’10 per cent’ test for derecognition of financial liabilities
The amendment clarifies the fees that an entity includes when assessing whether the terms of a new or modified financial liability are substantially different from the terms of the original financial liability. These fees include only those paid or received between the borrower and the lender, including fees paid or received by either the borrower or lender on the other’s behalf. An entity applies the amendment to financial liabilities that are modified or exchanged on or after the beginning of the annual reporting period in which the entity first applies the amendment.
The amendment is effective for annual reporting periods beginning on or after January 1, 2022 with earlier adoption permitted. The Group will apply the amendments to financial liabilities that are modified or exchanged on or after the beginning of the annual reporting period in which the entity first applies the amendment. The amendments are not expected to have a material impact on the Group. The amendments have no impact to the consolidated financial statements.
71 EEI 2022 Annual Report | Audited Financial Statements *SGVFS163860*
o
Amendments to PAS
41, Agriculture, Taxation in fair value measurements
The amendment removes the requirement in paragraph 22 of PAS 41 that entities exclude cash flows for taxation when measuring the fair value of assets within the scope of PAS 41.
An entity applies the amendment prospectively to fair value measurements on or after the beginning of the first annual reporting period beginning on or after January 1, 2022 with earlier adoption permitted. The amendments have no impact to the consolidated financial statements.
Standards Issued But Not Yet Effective
Pronouncements issued but not yet effective are listed below. The Group intends to adopt the following pronouncements when they become effective. The adoption of these pronouncements is not expected to have a significant impact on the Group’s consolidated financial statements unless otherwise indicated.
Effective beginning on or after January 1, 2023
• Amendments to PAS 12, Deferred Tax related to Assets and Liabilities arising from a Single Transaction
The amendments narrow the scope of the initial recognition exception under PAS 12, so that it no longer applies to transactions that give rise to equal taxable and deductible temporary differences.
The amendments also clarify that where payments that settle a liability are deductible for tax purposes, it is a matter of judgement (having considered the applicable tax law) whether such deductions are attributable for tax purposes to the liability recognized in the financial statements (and interest expense) or to the related asset component (and interest expense).
An entity applies the amendments to transactions that occur on or after the beginning of the earliest comparative period presented for annual reporting periods on or after January 1, 2023.
The Group is still assessing the impact of the amendments to the consolidated financial statements.
• Amendments to PAS 8, Definition of Accounting Estimates
The amendments introduce a new definition of accounting estimates and clarify the distinction between changes in accounting estimates and changes in accounting policies and the correction of errors. Also, the amendments clarify that the effects on an accounting estimate of a change in an input or a change in a measurement technique are changes in accounting estimates if they do not result from the correction of prior period errors.
An entity applies the amendments to changes in accounting policies and changes in accounting estimates that occur on or after January 1, 2023 with earlier adoption permitted. The amendments are not expected to have a material impact on the Group.
• Amendments to PAS 1 and PFRS Practice Statement 2, Disclosure of Accounting Policies
The amendments provide guidance and examples to help entities apply materiality judgements to accounting policy disclosures. The amendments aim to help entities provide accounting policy disclosures that are more useful by:
o Replacing the requirement for entities to disclose their ‘significant’ accounting policies with a requirement to disclose their ‘material’ accounting policies, and
o Adding guidance on how entities apply the concept of materiality in making decisions about accounting policy disclosures
The amendments to the Practice Statement provide non-mandatory guidance. Meanwhile, the
72
EEI 2022 Annual Report | Audited Financial Statements
amendments to PAS 1 are effective for annual periods beginning on or after January 1, 2023. Early application is permitted as long as this fact is disclosed. The Group is still assessing the impact of the amends to the consolidated financial statements.
Effective beginning on or after January 1, 2024
• Amendments to PAS 1, Classification of Liabilities as Current or Non-current
The amendments clarify paragraphs 69 to 76 of PAS 1, Presentation of Financial Statements, to specify the requirements for classifying liabilities as current or non-current. The amendments clarify:
o What is meant by a right to defer settlement
o That a right to defer must exist at the end of the reporting period
o That classification is unaffected by the likelihood that an entity will exercise its deferral right
o That only if an embedded derivative in a convertible liability is itself an equity instrument would the terms of a liability not impact its classification
The amendments are effective for annual reporting periods beginning on or after January 1, 2023 and must be applied retrospectively. The Group is currently assessing the impact the amendments will have on current practice and whether existing loan agreements may require renegotiation.
Effective beginning on or after January 1, 2025
• PFRS 17, Insurance Contracts
PFRS 17 is a comprehensive new accounting standard for insurance contracts covering recognition and measurement, presentation and disclosure. Once effective, PFRS 17 will replace PFRS 4, Insurance Contracts. This new standard on insurance contracts applies to all types of insurance contracts (i.e., life, non-life, direct insurance and re-insurance), regardless of the type of entities that issue them, as well as to certain guarantees and financial instruments with discretionary participation features. A few scope exceptions will apply.
The overall objective of PFRS 17 is to provide an accounting model for insurance contracts that is more useful and consistent for insurers. In contrast to the requirements in PFRS 4, which are largely based on grandfathering previous local accounting policies, PFRS 17 provides a comprehensive model for insurance contracts, covering all relevant accounting aspects. The core of PFRS 17 is the general model, supplemented by:
• A specific adaptation for contracts with direct participation features (the variable fee approach)
• A simplified approach (the premium allocation approach) mainly for short-duration contracts
PFRS 17 is effective for reporting periods beginning on or after January 1, 2021, with comparative figures required. Early application is permitted. The amendments are not expected to have a material impact on the Group.
Deferred Effectivity
• Amendments to PFRS 10 and PAS 28, Sale or Contribution of Assets between an Investor and its Associate or Joint Venture
The amendments address the conflict between PFRS 10 and PAS 28 in dealing with the loss of control of a subsidiary that is sold or contributed to an associate or joint venture. The amendments clarify that a full gain or loss is recognized when a transfer to an associate or joint venture involves a business as defined in PFRS 3, Business Combinations. Any gain or loss resulting from the sale or contribution of assets that does not constitute a business, however, is recognized only to the extent of unrelated investors’ interests in the associate or joint venture.
73 EEI 2022 Annual Report | Audited Financial Statements *SGVFS163860*
On January 13, 2016, the Financial Reporting Standards Council deferred the original effective date of January 1, 2016 of the said amendments until the International Accounting Standards Board (IASB) completes its broader review of the research project on equity accounting that may result in the simplification of accounting for such transactions and of other aspects of accounting for associates and joint ventures.
4. Significant Accounting Policies Leases - Group as a lessee
The Group assesses at contract inception whether a contract is, or contains, a lease. That is, if the contract conveys the right to control the use of an identified asset for a period of time in exchange for consideration.
Group as a lessee
The Group applies a single recognition and measurement approach for all leases, except for short-term leases and leases of low-value assets. The Group recognizes lease liabilities to make lease payments and right-of-use assets representing the right to use the underlying assets.
Right-of-use assets
The Group recognizes right-of-use assets at the commencement date of the lease. Right-of-use assets are measured at cost, less any accumulated depreciation and impairment losses, and adjusted for any remeasurement of lease liabilities. The cost of right-of-use assets includes the amount of lease liabilities recognized, initial direct costs incurred, and lease payments made at or before the commencement date ease incentives received.
Right-of-use assets are depreciated on a straight-line basis over the shorter of the lease term and the estimated useful lives of the assets, as follows:
EUL
Land
Building
10-66 years
2-10 years
Right-of-use assets are subject to impairment. Refer to the accounting policies in section impairment of non-financial assets.
Lease liabilities
At the commencement date of the lease, the Group recognizes lease liabilities measured at the present value of lease payments to be made over the lease term. The lease payments include fixed payments (including in substance fixed payments) less any lease incentives receivable, variable lease payments that depend on an index or a rate, and amounts expected to be paid under residual value guarantees. The lease payments also include the exercise price of a purchase option reasonably certain to be exercised by the Group and payments of penalties for terminating a lease, if the lease term reflects the Group exercising the option to terminate. The variable lease payments that do not depend on an index or a rate are recognized as expense in the period on which the event or condition that triggers the payment occurs.
Lease liabilities that are expected to be settled for no more than 12 months after reporting period are classified as current liabilities presented as current portion of lease liabilities. Otherwise, these are classified as noncurrent liabilities.
In calculating the present value of lease payments, the Group uses the incremental borrowing rate at the lease commencement date if the interest rate implicit in the lease is not readily determinable. After the
74
EEI 2022 Annual Report | Audited Financial Statements
commencement date, the amount of lease liabilities is increased to reflect the accretion of interest and reduced for the lease payments made. In addition, the carrying amount of lease liabilities is remeasured if there is a modification, a change in the lease term, a change in the in-substance fixed lease payments or a change in the assessment to purchase the underlying asset.
Short-term leases and leases of low-value assets
The Group applies the short-term lease recognition exemption to its short-term leases of machinery and equipment (i.e., those leases that have a lease term of 12 months or less from the commencement date and do not contain a purchase option). It also applies the leases of low-value assets recognition exemption to leases of property and equipment that are considered of low value. Lease payments on short-term leases and leases of low-value assets are recognized as expense on a straight-line basis over the lease term.
Sale and leaseback
When entering into a sale and leaseback transaction, the Group determines whether the transfer qualifies as a sale based on the requirements satisfying a performance obligation under PFRS 15.
When the transfer of the asset is a sale, the Group measures the right-of-use asset arising from the leaseback at the proportion of the previous carrying amount of the asset that relates to the right-of-use retained by the Group. Gain or loss is recognized only at the amount that relates to the rights transferred to the buyer-lessor.
When the transfer of the asset is not a sale under PFRS 15 requirements, the Group continues to recognize the asset in its statement of financial position and accounts for the proceeds from the sale and leaseback as a financial liability in accordance with PFRS 9.
Group as a lessor
Leases in which the Group does not transfer substantially all the risks and rewards incidental to ownership of an asset are classified as operating leases. Rental income arising is accounted for on a straight-line basis over the lease terms and is included in revenue in the statement of profit or loss due to its operating nature. Initial direct costs incurred in negotiating and arranging an operating lease are added to the carrying amount of the leased asset and recognized over the lease term on the same basis as rental income. Contingent rents are recognized as revenue in the period in which they are earned.
Revenue Recognition
Revenue from contracts with customers is recognized when control of the goods or services are transferred to the customer at an amount that reflects the consideration to which the Group expects to be entitled in exchange for those goods or services. The Group has generally concluded that it is the principal in its revenue arrangements, because it typically controls the goods or services before transferring them to the customer.
Revenue from construction contracts
The Group assessed that there is only one performance obligation for each construction agreement that it has entered and that revenue arising from such agreements qualify for recognition over time because the Group’s performance creates or enhances an asset that the customer controls as the asset is created or enhanced by applying par. 35(b) of PFRS 15. Control of an asset refers to the ability to direct the use of, and obtain substantially all of the remaining benefits from, the asset. The customer, having the ability to specify the design (or any changes thereof) of the asset, controls the asset as it is being constructed.
75 EEI 2022 Annual Report | Audited Financial Statements *SGVFS163860*
Furthermore, the Group builds the asset on the customer’s land (or property controlled by the customer), hence, the customer generally controls any work in progress arising from the Group’s performance. The Group also recognized as part of its construction revenue, the effects of variable considerations arising from various change orders and claims, to the extent that they reflect the amounts the Group expects to be entitled to and to be received from the customers, provided that it is highly probable that a significant reversal of the revenue recognized in connection with these variable considerations will not occur in the future. For unpriced change orders and claims, the Group uses the “most likely amount” method to predict the amounts the Group expects to be entitled to and to be received from the customers. The Group updates its estimate of the transaction price at the end of each reporting period to reflect any changes in circumstances that would result to changes in amount of variable consideration.
The Group elected to use the input method to measure the progress of the fulfilment of its performance obligation, which is based on the actual costs incurred to date relative to the total estimated cost to complete the construction projects because there is a direct relationship between the Group’s effort (i.e., costs incurred) and the transfer of service to the customer. The Group excludes the effect of any costs incurred that do not contribute to the Group’s performance in transferring control of goods or services to the customer (such as unexpected amounts of wasted materials, labor or other resources) and adjusts the input method for any costs incurred that are not proportionate to the Group’s progress in satisfying the performance obligation (such as uninstalled materials).
Revenue from real estate sales
Revenue from real estate sales pertains to sale of completed real estate properties. Revenue from real estate sales is recognized at point in time when the control over the real estate property is transferred to the customer which is when the transaction price of the real estate property is fully paid and the real estate property is turned over to the customer.
Revenue from power generation
The Group’s power supply agreement with its customer requires the Group to deliver certain units of electricity (in kWh) to the customer per month. As delivery of electricity constitutes a series of distinct good or services that are substantially the same and have the same pattern of transfer to the customer (i.e., the good or service would be recognized over time using the same measure of progress), this was treated by the Group as a single performance obligation. Because electricity is simultaneously provided and consumed, the Group’s performance obligation to deliver electricity qualifies for revenue recognition over time by applying par. 35(a) of PFRS 15. The Group recognizes revenue from power generation by applying the “right to invoice” practical expedient since the Group’s right to payment is for an amount that corresponds directly with the value to the customer of the Group’s performance to date.
Revenue from manpower services
Under the Group’s service agreements with its customers, the Group is required to provide manpower services (including but not limited to janitorial, messengerial and other allied services). As provision of these services constitutes a series of distinct good or services that are substantially the same and have the same pattern of transfer to the customer (i.e., the good or service would be recognized over time using the same measure of progress), this was treated by the Group as a single performance obligation. Because the services are simultaneously provided and consumed by the customer, the Group’s performance obligation to render such services qualifies for revenue recognition over time by applying par. 35(a) of PFRS 15. The Group recognizes revenue from manpower supply services by applying the “right to invoice” practical expedient since the Group’s right to payment is for an amount that corresponds directly with the value to the customer of the Group’s performance to date.
76
EEI 2022 Annual Report | Audited Financial Statements
Revenue from sale of merchandise
Revenue from sale of merchandise is recognized at a point in time when control of the asset is transferred to the customer, generally on delivery and acceptance of the inventory item.
Onerous contracts
If the Group has a contract that is onerous, the present obligation under the contract is recognized and measured as a provision. However, before a separate provision for an onerous contract is established, the Group recognizes any impairment loss that has occurred on assets dedicated to that contract. An onerous contract is a contract under which the unavoidable costs (i.e., the costs that the Group cannot avoid because it has the contract) of meeting the obligations under the contract exceed the economic benefits expected to be received under it. The unavoidable costs under a contract reflect the least net cost of exiting from the contract, which is the lower of the cost of fulfilling it and any compensation or penalties arising from failure to fulfil it. The cost of fulfilling a contract comprises the costs that relate directly to the contract (i.e., both incremental costs and an allocation of costs directly related to contract activities).
Dividend Income
Dividend income is recognized when the shareholders’ right to receive the payment is established.
Contract balances arising from revenue with customer contracts
Receivables
A receivable represents the Group’s right to an amount of consideration that is unconditional (i.e., only the passage of time is required before payment of the consideration is due).
Contract assets
A contract asset is the right to consideration in exchange for goods or services transferred to the customer. If the Group performs by transferring goods or services to a customer before the customer pays consideration or before payment is due, a contract asset is recognized for the earned consideration that is conditional.
Contract liabilities
A contract liability is the obligation to transfer goods or services to a customer for which the Group has received consideration (or an amount of consideration is due) from the customer. If a customer pays consideration before the Group transfers goods or services to the customer, a contract liability is recognized when the payment is made or the payment is due (whichever is earlier). Contract liabilities are recognized as revenue when the Group performs under the contract.
The Group presents each contract with customer in the consolidated statement of financial position either as a contract asset or a contract liability.
77 EEI 2022 Annual Report | Audited Financial Statements *SGVFS163860*
Expenses
Expenses are recognized in the consolidated statement of income when decrease in future economic benefits related to a decrease in an asset or an increase of a liability has arisen that can be measured reliably.
Cost of sales and services
Cost of sales is recognized as an expense when the related goods are sold. Cost of services include all direct materials and labor costs and those indirect costs related to contract performance which are recognized as incurred.
Cost of real estate sales is recognized consistent with the method of applied revenue recognition. The cost of inventory recognized in the statement of income is determined with reference to the specific costs incurred on the sold property, allocated based on the relative size of sold property over the real estate corresponding project.
Selling and administrative expenses
Selling expenses are costs incurred to sell goods and services. Administrative expenses constitute costs of administering the business. Selling and administrative expenses are expensed as incurred.
Current versus Non-current Classification
The Group presents assets and liabilities in statement of financial position based on current/non-current classification. An asset as current when it is:
• Expected to be realized or intended to be sold or consumed in normal operating cycle
• Held primarily for the purpose of trading
• Expected to be realized within twelve months after the reporting period or
• Cash and cash equivalent unless restricted from being exchanged or used to settle a liability for at least 12 months after the reporting period
All other assets are classified as non-current.
A liability is current when:
• It is expected to be settled in normal operating cycle
• It is held primarily for the purpose of trading
• It is due to be settled within twelve months after the reporting period or
• There is no unconditional right to defer the settlement of the liability for at least 12 months after the reporting period
The Group classifies all other liabilities as non-current. Deferred tax assets and deferred tax liabilities are classified as non-current assets and liabilities.
Cash and Cash Equivalents
Cash includes cash on hand and in bank and cash equivalents. Cash equivalents are short-term, highly liquid investments that are readily convertible to known amounts of cash with original maturities of three (3) months or less and that are subject to an insignificant risk of change in value.
78
EEI 2022 Annual Report | Audited Financial Statements
Fair Value Measurement
Fair value is the price that would be received to sell an asset or paid to transfer a liability in an orderly transaction between market participants at the measurement date. The fair value measurement is based on the presumption that the transaction to sell the asset or transfer the liability takes place either:
• In the principal market for the asset or liability, or
• In the absence of a principal market, in the most advantageous market for the asset or liability.
The principal or the most advantageous market must be accessible by the Group.
The fair value of an asset or a liability is measured using the assumptions that market participants would use when pricing the asset or liability, assuming that market participants act in their economic best interest.
A fair value measurement of a non-financial asset takes into account a market participant’s ability to generate economic benefits by using the asset in its highest and best use or by selling it to another market participant that would use the asset in its highest and best use.
The Group uses valuation techniques that are appropriate in the circumstances and for which sufficient data are available to measure fair value, maximizing the use of relevant observable inputs and minimizing the use of unobservable inputs.
All assets and liabilities for which fair value is measured or disclosed in the consolidated financial statements are categorized within the fair value hierarchy, described as follows, based on the lowest level input that is significant to the fair value measurement as a whole:
• Level 1 - Quoted (unadjusted) market prices in active markets for identical assets or liabilities
• Level 2 - Valuation techniques for which the lowest level input that is significant to the fair value measurement is directly or indirectly observable
• Level 3 - Valuation techniques for which the lowest level input that is significant to the fair value measurement is unobservable
For assets and liabilities that are recognized in the consolidated financial statements on a recurring basis, the Group determines whether transfers have occurred between levels in the hierarchy by re-assessing categorization (based on the lowest level input that is significant to the fair value measurement as a whole) at the end of each financial reporting period.
For the purpose of fair value disclosures, the Group has determined classes of assets and liabilities on the basis of the nature, characteristics and risks of the asset or liability and the level of the fair value hierarchy as explained above.
Financial Instruments
The Group recognizes a financial asset or a financial liability in the consolidated statement of financial position when it becomes a party to the contractual provisions of the instrument. Purchases or sales of financial assets that require delivery of assets within the time frame established by regulation or convention in the marketplace are recognized on the settlement date. The Group follows the settlement date accounting where an asset to be received and liability to be paid are recognized on the settlement date and derecognition of an asset that is sold and the recognition of a receivable from the buyer are recognized on the settlement date.
79 EEI 2022 Annual Report | Audited Financial Statements *SGVFS163860*
Financial Instruments - Initial Recognition and Subsequent Measurement
Initial recognition and measurement
Financial assets are classified, at initial recognition, as subsequently measured at amortized cost, fair value through other comprehensive income (OCI), and fair value through profit or loss.
The classification of financial assets at initial recognition depends on the financial asset’s contractual cash flow characteristics and the Group’s business model for managing them. With the exception of trade receivables that do not contain a significant financing component, the Group initially measures a financial asset at its fair value plus, in the case of a financial asset not at fair value through profit or loss, transaction costs. Trade receivables that do not contain a significant financing component are measured at the transaction price determined under PFRS 15.
In order for a financial asset to be classified and measured at amortized cost or fair value through OCI, it needs to give rise to cash flows that are ‘solely payments of principal and interest (SPPI)’ on the principal amount outstanding. This assessment is referred to as the SPPI test and is performed at an instrument level.
The Group’s business model for managing financial assets refers to how it manages its financial assets in order to generate cash flows. The business model determines whether cash flows will result from collecting contractual cash flows, selling the financial assets, or both.
Purchases or sales of financial assets that require delivery of assets within the time frame established by regulation or convention in the marketplace are recognized on the settlement date.
Subsequent measurement
For purposes of subsequent measurement, financial assets are classified in four categories:
• Financial assets at amortized cost (debt instruments)
• Financial assets at fair value through OCI with recycling of cumulative gains and losses (debt instruments)
• Financial assets designated at fair value through OCI with no recycling of cumulative gains and losses upon derecognition (equity instruments)
• Financial assets at fair value through profit or loss
Financial assets at amortized cost (debt instruments)
The Group measures financial assets at amortized cost if both of the following conditions are met:
• The financial asset is held within a business model with the objective to hold financial assets in order to collect contractual cash flows; and
• The contractual terms of the financial asset give rise on specified dates to cash flows that are solely payments of principal and interest on the principal amount outstanding
Financial assets at amortized cost are subsequently measured using the effective interest (EIR) method and are subject to impairment. Gains and losses are recognized in profit or loss when the asset is derecognized, modified or impaired.
The Group’s financial assets at amortized cost includes cash and cash equivalents, deposits, receivables, and due from related parties.
80
EEI 2022 Annual Report | Audited Financial Statements
Financial assets designated at fair value through OCI (equity instruments)
Upon initial recognition, the Group can elect to classify irrevocably its equity investments as equity instruments designated at fair value through OCI when they meet the definition of equity under PAS 32, Financial Instruments: Presentation, and are not held for trading. The classification is determined on an instrument-by-instrument basis.
Gains and losses on these financial assets are never recycled to profit or loss. Dividends are recognized as other income in the consolidated statement of income when the right of payment has been established, except when the Group benefits from such proceeds as a recovery of part of the cost of the financial asset, in which case, such gains are recorded in OCI. Equity instruments designated at fair value through OCI are not subject to impairment assessment.
The Group elected to classify irrevocably all its equity investments under this category.
The Group does not have any debt financial assets at fair value through OCI and financial assets at fair value through profit or loss as of December 31, 2022 and 2021.
Impairment of financial assets
The Group recognizes an allowance for expected credit losses (ECLs) for all debt instruments not held at fair value through profit or loss. ECLs are based on the difference between the contractual cash flows due in accordance with the contract and all the cash flows that the Group expects to receive, discounted at an approximation of the original effective interest rate. The expected cash flows will include cash flows from the sale of collateral held or other credit enhancements that are integral to the contractual terms.
ECLs are recognized in two stages. For credit exposures for which there has not been a significant increase in credit risk since initial recognition, ECLs are provided for credit losses that result from default events that are possible within the next 12-months (a 12-month ECL). For those credit exposures for which there has been a significant increase in credit risk since initial recognition, a loss allowance is required for credit losses expected over the remaining life of the exposure, irrespective of the timing of the default (a lifetime ECL).
For trade receivables and contract assets, the Group applies a simplified approach in calculating ECLs. Therefore, the Group does not track changes in credit risk, but instead recognizes a loss allowance based on lifetime ECLs at each reporting date. The loss allowance was adjusted for forward-looking factors specific to the debtors and the economic environment.
For other debt financial assets, the ECL is based on the 12-month ECL. The 12-month ECL is the portion of lifetime ECLs that results from default events on a financial instrument that are possible within 12 months after the reporting date. However, when there has been a significant increase in credit risk since origination, the allowance will be based on the lifetime ECL.
The Group generally considers a financial asset in default when contractual payments are 90 days past due. For a financial asset that arises from long-term construction contracts, the Group considers the asset to be in default if contractual payments are not settled within 30 days from the completion of the construction project. However, in certain cases, the Group may also consider a financial asset to be in default when internal or external information indicates that the Group is unlikely to receive the outstanding contractual amounts in full before taking into account any credit enhancements held by the Group. A financial asset is written off when there is no reasonable expectation of recovering the contractual cash flows.
81 EEI 2022 Annual Report | Audited Financial Statements *SGVFS163860*
Financial Liabilities
The accounting for the Group’s financial liabilities remains the same as it was under PAS 39. The Group initially measures a financial liability at its fair value plus, in the case of a financial liability not at fair value through profit or loss, transaction costs. The Group has no financial liabilities at FVPL.
Subsequent to initial recognition, the Group’s financial liabilities are carried at amortized cost. Amortized cost is calculated by taking into account any discount or premium on acquisition and fees or costs that are an integral part of the EIR. The EIR amortization is included as finance costs in the consolidated statement of income. Gains and losses are recognized in profit or loss when the liabilities are derecognized as well as through the EIR amortization process.
This category generally applies to the Group’s accounts payable and other current liabilities, bank loans, long-term debt, lease liabilities and due to related parties.
Derecognition of Financial Instruments
Financial assets
A financial asset (or, where applicable a part of a financial asset or part of a group of similar financial assets) is derecognized when: (a) the rights to receive cash flows from the asset have expired; or (b) the Group has transferred its rights to receive cash flows from the asset or has assumed an obligation to pay them in full without material delay to a third party under a “pass-through” arrangement; and either (i) has transferred substantially all the risks and rewards of the asset, or (ii) has neither transferred nor retained substantially all the risks and rewards of the asset, but has transferred control of the asset.
Where the Group has transferred its rights to receive cash flows from an asset and has neither transferred nor retained substantially all the risks and rewards of the asset nor transferred control of the asset, the asset is recognized to the extent of the Group’s continuing involvement in the asset. Continuing involvement that takes the form of a guarantee over the transferred asset is measured at the lower of the original carrying amount of the asset and the maximum amount of consideration that the Group could be required to repay.
Financial liabilities
A financial liability is derecognized when the obligation under the liability is discharged or cancelled or has expired. Where an existing financial liability is replaced by another from the same lender on substantially different terms, or the terms of an existing liability are substantially modified, such an exchange or modification is treated as a derecognition of the original liability and the recognition of a new liability, and the difference in the respective carrying amounts is recognized in the consolidated statement of income.
Offsetting of Financial Instruments
Financial assets and financial liabilities are offset and the net amount is reported in the consolidated statements of financial position if there is a currently enforceable legal right to set off the recognized amounts and there is intention to settle on a net basis, or to realize the asset and settle the liability simultaneously. The Group assesses that it has a currently enforceable right of offset if the right is not contingent on a future event, and is legally enforceable in the normal course of business, event of default, and event of insolvency or bankruptcy of the Group and all of the counterparties.
82
EEI 2022 Annual Report | Audited Financial Statements
Inventories
Inventories are stated at the lower of cost and net realizable value (NRV). Cost includes purchase price and other costs directly attributable to its acquisition such as non-refundable taxes, handling and transportation cost. The cost of real estate inventories includes (a) land cost; (b) freehold and leasehold rights for land; (c) amounts paid to contractors for construction; (d) planning and design cost, cost of site preparation, professional fees, property taxes, construction overheads and other related costs that are directly attributable in bringing the real estate inventories to its intended condition.
Cost of inventories is generally determined using the moving-average method, except for land inventory of EEI Realty which is accounted for using the specific identification method.
NRV is the estimated selling price in the ordinary course of the business less the estimated costs of completion and the estimated costs necessary to make the sale.
Materials issued but still uninstalled to construction projects are not considered as part of computation for percentage of completion of projects.
Prepaid Expenses
These are recorded as asset before they are utilized and apportioned over the period covered by the payment and charged to the appropriate account in the consolidated statement of income when incurred.
Advances to Suppliers and Subcontractors
Advances to suppliers and subcontractors represent advance payment for the purchase of various construction materials and down payment to subcontractors for the contract work to be performed.
Other Current Assets
Other current assets pertain to other resources controlled by the Group as a result of past events and from which future economic benefits are expected to flow to the Group within the financial reporting period.
Value-Added Tax (VAT)
Revenues, expenses, and assets are recognized net of the amount of VAT, if applicable.
When VAT from sales of goods and/or services (output VAT) exceeds VAT passed on from purchases of goods or services (input VAT), the excess is recognized as payable in the consolidated statement of financial position. When VAT passed on from purchases of goods or services (input VAT) exceeds VAT from sales of goods and/or services (output VAT), the excess is recognized as an asset in the consolidated statement of financial position up to the extent of the recoverable amount.
Investments in Associates and Joint Ventures
An associate is an entity in which the Group has significant influence. A joint venture is a joint arrangement whereby the parties that have joint control of the arrangement have rights to the net assets of the arrangement.
Investments in associates and joint venture are accounted for using the equity method of accounting. Under this method, the investment amount is increased or decreased to recognize the Group’s share in the profit or
83 EEI 2022 Annual Report | Audited Financial Statements *SGVFS163860*
loss of the investee after the date of acquisition. Dividends received from the investee reduces the carrying amount of the investment. Adjustments to the carrying amount may also be necessary for changes in the Group’s proportionate interest in the investee arising from changes in the investee’s other comprehensive income.
Gains and losses resulting from ‘upstream’ and ‘downstream’ transactions between the Group and its associate or joint venture are recognized in the consolidated financial statements only to the extent of unrelated investors’ interests in the associate or joint venture.
The reporting dates and the accounting policies of the associates and joint venture conform to those used by the Group for like transactions and events in similar circumstances.
Property and Equipment
Property and equipment, except for land, is stated at cost, less accumulated depreciation, amortization and impairment in value, if any. Land is carried at cost less any impairment in value. The initial cost of property and equipment consists of its purchase price, including import duties, taxes and any directly attributable costs of bringing the asset to its working condition and location for its intended use. Expenditures incurred after the assets have been put into operation, such as repairs and maintenance, are normally charged to operations in the year in which the costs are incurred. In situations where it can be clearly demonstrated that the expenditures have resulted in an increase in the future economic benefits expected to be obtained from the use of an item of property and equipment beyond its originally assessed standard of performance, the expenditures are capitalized as an additional cost of property and equipment.
Depreciation is computed using the straight-line method over the estimated useful lives of the assets. The estimated useful lives of property and equipment of the Group are as follows:
Amortization of leasehold improvements is computed over the estimated useful life of the improvement of 20 years or term of the lease, whichever is shorter.
The estimated useful lives and depreciation and amortization method are reviewed periodically to ensure that the periods and method of depreciation and amortization are consistent with the expected pattern of economic benefits from items of property and equipment.
Construction in progress represents property and equipment under construction and is stated at cost. This includes cost of construction and other direct costs. Construction in progress are reclassified to the appropriate class of property and equipment when construction of the asset is completed.
Property and equipment are written-off when either these are disposed of or when these are permanently withdrawn from use and there is no more future economic benefits expected from its use or disposal. Any gain or loss arising on derecognition of the asset (calculated as the difference between the net disposal proceeds and the carrying amount of the asset) is included in the consolidated statement of income in the year the asset is derecognized.
84
of Years Buildings and improvements 10 - 20 Machinery, tools and construction equipment 2 - 20 Furniture, fixtures and office equipment 3 - 5 Transportation and service equipment 5
Number
EEI 2022 Annual Report | Audited Financial Statements
Investment Properties
Investment properties include land that is carried at cost less any impairment in value, if any.
Investment properties are derecognized when either they have been disposed of or when the investment property is permanently withdrawn from use and no future economic benefit is expected from its disposal.
Transfers are made to or from investment property only when there is a change in use. For a transfer from investment property to owner-occupied property, the deemed cost for subsequent accounting is the carrying amount of the investment property transferred at the date of change in use. If owner-occupied property becomes an investment property, the group accounts for such property in accordance with the policy stated under property and equipment up to the date of change in use.
Software Costs
Software costs are stated at cost less accumulated amortization and any impairment in value. Costs related to software purchased by the Group for use in the operations are amortized on a straight-line basis over a period of three (3) years.
Impairment of Non-financial Assets
For Property and equipment, Right-Of-Use assets, Software costs, Investments in associates and joint venture and Investment properties, the Group assesses at each reporting date whether there is an indication that an asset may be impaired. If any such indication exists, the Group makes an estimate of the asset’s recoverable amount. An asset’s recoverable amount is the higher of an asset’s or cash-generating unit’s fair value less costs to sell and its value in use, and is determined for an individual asset, unless the asset does not generate cash inflows that are largely independent of those from other assets or groups of assets. Where the carrying amount of an asset exceeds its recoverable amount, the asset is considered impaired and is written down to its recoverable amount. In assessing value in use, the estimated future cash flows are discounted to their present value using pre-tax discount rate that reflects current market assessments of the time value of money and the risks specific to the asset. In determining fair value less cost to sell, recent market transactions are taken into account, if available. If no such transaction can be identified, an appropriate valuation model is used.
An assessment is made at each reporting date as to whether there is any indication that previously recognized impairment losses may no longer exist or may have decreased. If such indication exists, the recoverable amount is estimated. A previously recognized impairment loss is reversed only if there has been a change in the estimates used to determine the asset’s recoverable amount since the last impairment loss was recognized. If that is the case, the carrying amount of the asset is increased to its recoverable amount. That increased amount cannot exceed the carrying amount that would have been determined, net of depreciation and amortization, had no impairment loss been recognized for the asset in prior years. Such reversal is recognized in the consolidated statement of income.
Foreign Currency-denominated Transactions and Translation
Transactions denominated in foreign currencies are recorded using the applicable exchange rate at the date of the transaction. Outstanding monetary assets and monetary liabilities denominated in foreign currencies are retranslated using the applicable rate of exchange at the end of reporting period. Foreign exchange gains or losses are recognized in the Group’s consolidated statement of income.
Nonmonetary items that are measured in terms of historical cost in foreign currency are translated using the exchange rates as at the dates of initial transactions. Non-monetary items measured at fair value in a foreign currency are translated using the exchange rates at the date when the fair value was determined.
85
EEI 2022 Annual Report | Audited Financial Statements *SGVFS163860*
The functional currency of EEI Limited and Subsidiaries, the Group’s foreign subsidiaries, is United States Dollar. As at reporting date, the assets and liabilities of foreign subsidiaries are translated into the presentation currency of the Group (the Philippine Peso) at the closing rate as at the reporting date, and the consolidated statements of income accounts are translated at monthly weighted average exchange rate. The exchange differences arising on the translation of foreign subsidiaries are taken directly to a separate component of equity under “Cumulative translation adjustments” account.
Upon disposal of a foreign subsidiary, the deferred cumulative amount recognized in other comprehensive income relating to that particular foreign operation is recognized in the consolidated statement of income.
Retirement Benefits
The net defined benefit liability or asset is the aggregate of the present value of the defined benefit obligation at the end of the financial reporting period reduced by the fair value of plan assets (if any), adjusted for any effect of limiting a net defined pension asset to the asset ceiling. The asset ceiling is the present value of any economic benefits available in the form of refunds from the plan or reductions in future contributions to the plan.
The cost of providing benefits under the defined pension plans is actuarially determined using the projected unit credit method.
Retirement expenses comprise the following:
a) Service cost
b) Net interest on the net defined benefit liability or asset
c) Remeasurements of net defined benefit liability or asset
Service costs which include current service costs, past service costs and gains or losses on non-routine settlements are recognized as expense in profit or loss. Past service costs are recognized when plan amendment or curtailment occurs. These amounts are calculated periodically by independent qualified actuaries.
Net interest on the net defined benefit liability or asset is the change during the period in the net defined benefit liability or asset that arises from the passage of time which is determined by applying the discount rate based on government bonds to the net defined benefit liability or asset. Net interest on the net defined benefit liability or asset is recognized as expense or income in profit or loss.
Remeasurements comprising actuarial gains and losses, return on plan assets and any change in the effect of the asset ceiling (excluding net interest on defined benefit liability) are recognized immediately in other comprehensive income in the period in which they arise. Remeasurements are not reclassified to profit or loss in subsequent periods.
Fair value of plan assets is based on market price information. When no market price is available, the fair value of plan assets is estimated by discounting expected future cash flows using a discount rate that reflects both the risk associated with the plan assets and the maturity or expected disposal date of those assets (or, if they have no maturity, the expected period until the settlement of the related obligations). If the fair value of the plan assets is higher than the present value of the defined benefit obligation, the measurement of the resulting defined benefit asset is limited to the present value of economic benefits available in the form of refunds from the plan or reductions in future contributions to the plan.
Plan assets are not available to the creditors of the Group, nor can they be paid directly to the Group.
86
EEI 2022 Annual Report | Audited Financial Statements
Current tax
Current tax assets and liabilities for the current and prior periods are measured at the amount expected to be recovered from or paid to the taxation authorities. The tax rates and the tax laws used to compute the amount are those that are enacted or substantially enacted at reporting date.
Deferred tax
Deferred tax is provided using the liability method on temporary differences between the tax bases of assets and liabilities and their carrying amounts for financial reporting purposes at the financial reporting date. Deferred tax liabilities are recognized for all taxable temporary differences, except:
• When the deferred tax liability arises from the initial recognition of goodwill or an asset or liability in a transaction that is not a business combination and, at the time of the transaction, affects neither the accounting profit nor taxable profit or loss
• In respect of taxable temporary differences associated with investments in subsidiaries, associates and joint venture, when the timing of the reversal of the temporary differences can be controlled and it is probable that the temporary differences will not reverse in the foreseeable future
Deferred tax assets are recognized for all deductible temporary differences, the carry forward of unused tax credits and any unused tax losses. Deferred tax assets are recognized to the extent that it is probable that taxable profit will be available against which the deductible temporary differences, and the carry forward of unused tax credits and unused tax losses can be utilized, except:
• When the deferred tax asset relating to the deductible temporary difference arises from the initial recognition of an asset or liability in a transaction that is not a business combination and, at the time of the transaction, affects neither the accounting profit nor taxable profit or loss
• In respect of deductible temporary differences associated with investments in associates and interests in joint ventures, deferred tax assets are recognized only to the extent that it is probable that the temporary differences will reverse in the foreseeable future and taxable profit will be available against which the temporary differences can be utilized
The carrying amount of deferred tax assets is reviewed at each reporting date and reduced to the extent that it is no longer probable that sufficient taxable profit will be available to allow all or part of the deferred tax asset to be used. Unrecognized deferred tax assets are re-assessed at each financial reporting date and are recognized to the extent that it has become probable that future taxable profit will allow the deferred tax assets to be recovered.
Deferred tax assets and liabilities are measured at the tax rates that are expected to apply to the year when the asset is realized or the liability is settled, based on tax rates (and tax laws) that have been enacted or substantially enacted at the financial reporting date.
Deferred tax assets and deferred tax liabilities are offset if a legally enforceable right exists to offset current tax assets against current tax liabilities and the deferred taxes relate to the same entity and the same taxation authority.
Current tax and deferred tax shall be recognized outside profit or loss if the tax relates to items that are recognized outside profit or loss.
87 Income Tax
EEI 2022 Annual Report | Audited Financial Statements *SGVFS163860*
Provisions
Provisions are recognized when the Group has a present obligation (legal or constructive) as a result of a past event, it is probable that an outflow of resources embodying economic benefits will be required to settle the obligation and a reliable estimate can be made of the amount of the obligation. If the effect of the time value of money is material, provisions are determined by discounting the expected future cash flows at a pre-tax rate that reflects current market assessment of the time value of money and, where appropriate, the risks specific to the liability. Where discounting is used, the increase in the provision due to the passage of time is recognized as interest expense.
For contract with customer identified by the Group to be onerous (i.e., the unavoidable costs of meeting the obligations under the contract exceed the economic benefits expected to be received under it.), the Group records a provision for the loss it expects to make on such contract.
Contingencies
Contingent liabilities are not recognized in the consolidated financial statements but disclosed in the notes to consolidated financial statements unless the possibility of an outflow of resources embodying economic benefits is remote. Contingent assets are not recognized in the group financial statements but disclosed in the notes to group financial statements when an inflow of economic benefits is probable.
Stock Option Plan
No benefit expense is recognized relative to stock options granted. When the shares related to the stock options plan are subscribed, these are treated as capital stock issuances. The stock option plan is exempt from PFRS 2, Share-based Payment
Basic and Diluted Earnings per Share
Basic earnings per share is computed by dividing net income for the year attributable to equity holders of the Parent Company by the weighted average number of common shares outstanding during the year, after giving retroactive effect for any stock dividends, stock splits or reverse stock splits.
Diluted earnings per share is computed by adjusting the net income for the year attributable to equity holders of the Parent Company and the weighted average number of common shares outstanding during the year after giving retroactive effect for any stock dividends, stock splits or reverse stock splits and adjusted for the effects of all dilutive potential common shares.
Capital Stock
The Group records common stocks at par value and additional paid-in capital in excess of the total contributions received over the aggregate par values of the equity shares. Incremental costs incurred directly attributable to the issuance of new shares are shown in equity as a deduction from proceeds, net of tax.
Treasury Stock
When the Group purchases its own shares of capital stock (treasury shares), the consideration paid, including any attributable incremental costs, is deducted from equity until the shares are cancelled or reissued of. Where such shares are subsequently sold or reissued, any consideration received, net of any directly attributable incremental transaction costs and the related tax effects is included in equity.
88
EEI 2022 Annual Report | Audited Financial Statements
Retained Earnings
Retained earnings represent the cumulative balance of periodic net income or loss, prior period adjustments, effect of changes in accounting policy and other capital adjustments. Retained earnings are restricted for dividend declaration to the extent of the cost of treasury shares.
Appropriated retained earnings are set aside for specific purpose as approved by the Board of Directors.
Events After the Financial Reporting Date
Any post year-end events up to the date of auditor’s report that provide additional information about the Group’s position at the reporting date (adjusting events) are reflected in the consolidated financial statements. Post year-end events that are not adjusting events are disclosed when material, in notes the consolidated financial statements.
5. Significant Accounting Judgments and Estimates
The preparation of the Group’s consolidated financial statements requires management to make judgments, estimates and assumptions that affect the reported amounts of revenue, expenses, assets and liabilities, and the accompanying disclosures. Uncertainty about these assumptions and estimates could result in outcomes that require a material adjustment to the carrying amount of assets or liabilities affected in future periods. The effects of any changes in estimates will be reflected in the consolidated financial statements as they become reasonably determinable. Judgments and estimates are continually evaluated and are based on historical experience and other factors, including expectations of future events that are believed to be reasonable under the circumstances.
The following presents a summary of these significant accounting judgments and estimates:
Judgments
Determination of lease term of contracts with renewal and termination options – Group as a lessee
The Group has several lease contracts that include extension and termination options. The Group applies judgement in evaluating whether it is reasonably certain whether or not to exercise the option to renew or terminate the lease. That is, it considers all relevant factors that create an economic incentive for it to exercise either the renewal or termination. After the commencement date, the Group reassesses the lease term if there is a significant event or change in circumstances that is within its control and affects its ability to exercise or not to exercise the option to renew or to terminate (e.g., construction of significant leasehold improvements or significant customization to the leased asset).
The Group included the renewal period as part of the lease term for leases of land and office spaces with shorter non-cancellable period (i.e., three to ten years). The Group typically exercises its option to renew for these leases because there will be a significant negative effect on production if a replacement asset is not readily available. The renewal periods for leases of land and office spaces with longer noncancellable periods are not included as part of the lease term as these are not reasonably certain to be exercised (Note 14).
Recognition of revenue from construction contracts
Under PFRS 15, the Group assessed that there is only one performance obligation for each construction agreement that it has entered and that revenue arising from such agreements qualify for recognition over time. The Group elected to use the input method to measure the progress of the fulfilment of its
89 EEI 2022 Annual Report | Audited Financial Statements *SGVFS163860*
performance obligation, which is based on the actual costs incurred to date relative to the total estimated cost to complete the construction projects. The Group believes that this method faithfully depicts the Group’s performance towards satisfaction of its performance obligation because there is a direct relationship between the Group’s effort (i.e., costs incurred) and the transfer of service to the customer (Note 20).
Determination of sale and leaseback transaction as true sale or financing transaction - Group as lessee
The Group determines whether the transfer of assets qualifies as a sale by referring to the requirements for satisfying performance obligations under PFRS 15. The sale and leaseback transactions are considered as a true sale if there is a transfer of control over the related asset. If the transfer is not a sale under PFRS 15 requirements, the Group accounts for the sale and leaseback as a financing transaction in accordance with PFRS 9. The Group assessed that the sales and leaseback transactions in 2022 qualify as a true sale.
Provisions and contingencies
The Group is involved in various claims in the ordinary course of business. Management and its legal counsels believe that the Group has substantial legal and factual bases for its position. The Group’s management believes that the outcome of these claims will not have a material adverse effect on the Group’s financial position or operating results. It is possible, however, that future results of operations could be materially affected by changes in estimates or in the effectiveness of the strategies relating to these claims (Note 18).
Assessment of joint control
Judgment is required to determine when the Group has joint control over an arrangement, which requires an assessment of the relevant activities and when the decisions in relation to those activities require unanimous consent. The Group assesses their rights and obligations arising from the arrangement and specifically considers:
• the structure of the joint arrangement - whether it is structured through a separate vehicle
• when the arrangement is structured through a separate vehicle, the Group also considers the rights and obligations arising from:
• the legal form of the separate vehicle
• the terms of the contractual arrangement other facts and circumstances, considered on a case by case basis.
Refer to Note 11 for details of the Group’s investment in joint venture.
Impairment of nonfinancial assets
The Group performs annual impairment review of nonfinancial assets (e.g. property and equipment, right-of-use assets, investment properties and investment in associates and joint venture) when certain impairment indicators are present. Determining the fair value of assets, which requires the determination of future cash flows expected to be generated from the continued use and ultimate disposition of such assets, requires the Group to make estimates and assumptions that can materially affect the financial statements. Future events could cause the Group to conclude that the assets are impaired. Any resulting impairment loss could have a material adverse impact on the Group’s financial position and performance.
The aggregate carrying values of investments in associates and joint ventures, property and equipment, right-of-use assets, investment properties and other noncurrent assets (excluding time deposits) amounted to ₱8.4 billion and ₱8.3 billion as of December 31, 2022 and 2021, respectively (Notes 11, 13, 14 and 15).
90
EEI 2022 Annual Report | Audited Financial Statements
Estimates and Assumptions
The key assumptions concerning the future and other key sources of estimation uncertainty at the reporting date, that have a significant risk of causing a material adjustment to the carrying amounts of assets and liabilities within the next financial year, are described below. The Group based its assumptions and estimates on parameters available when the financial statements were prepared. Existing circumstances and assumptions about future developments, however, may change due to market changes or circumstances arising that are beyond the control of the Group. Such changes are reflected in the assumptions when they occur.
Estimating variable considerations arising from change orders and claims
The Group frequently agrees to change orders that modify the scope of its work previously agreed with customers and regularly submits claims to customers when unanticipated additional costs are incurred because of delays or changes in scope caused by the customers. PFRS 15 requires the Group to recognize, as part of its revenue from construction contracts, the estimated amounts the Group expects to be entitled to and to be received from customers due to these change orders and claims (otherwise known as variable considerations), provided that it is highly probable that a significant reversal of the revenue recognized in connection with these variable considerations will not occur in the future. For these unpriced change orders and claims, the Group uses the “most likely amount” method to predict the amount to which it will be entitled and expected to be received from the customers. The Group also updates its estimate of the transaction price to reflect any changes in circumstances that would result to changes in amount of variable considerations and corresponding increase or decrease in the contract assets.
The aggregate carrying values of receivables and contract assets arising from construction contracts amounted to ₱12.8 billion and ₱12.2 billion as of December 31, 2022 and 2021, respectively (Notes 7 and 8).
Fair value measurement of unquoted equity investments at FVOCI
The Group uses valuation techniques such as discounted cash flow approach and adjusted net asset method to estimate the fair value of investment in PetroGreen Energy Corporation (PGEC) and Hermosa Ecozone Development Corporation (HEDC), respectively. These valuation techniques require significant unobservable inputs to calculate the fair value of the Group’s unquoted equity investments at FVOCI. These inputs include forecast cash flows assumptions, discount rates, appraised value of real properties, among others. Changes in assumptions relating to these factors could affect the reported fair value of these unquoted equity financial instruments. For the investment in PGEC, the effects of COVID-19 were reflected in the discount rate used in the discounted cash flow and were not accounted for separately. For the investment in HEDC, the valuation made by the appraisers was based on sales comparison approach. The effects of COVID-19 were reflected in the selling price of comparable listings of real estate properties and were not accounted for separately.
The fair value of unquoted equity investments amounted to ₱1.2 billion as of December 31, 2022 and 2021 (Note 12).
Provision for expected credit losses of trade receivables and contract assets
The Group uses the simplified approach in calculating the ECL of its trade receivables and contract assets wherein the Group does not track changes in credit risk, but instead recognizes a loss allowance based on lifetime ECLs at each reporting date. The model is based on the Group’s historical observed default rates and adjusted to include forward looking information. At every reporting date, the historical observed default rates are updated and changes in the forward-looking estimates are analyzed.
The assessment of the correlation between historical observed default rates, forecast economic conditions and ECLs is a significant estimate. The amount of ECLs is sensitive to changes in circumstances and of
91 EEI 2022 Annual Report | Audited Financial Statements *SGVFS163860*
forecast economic conditions. The Group’s historical credit loss experience and forecast of economic conditions may also not be representative of customer’s actual default in the future.
As of December 31, 2022 and 2021, the aggregate carrying values of receivables and contract assets amounting to 12.8 billion and 12.2 billion as of December 31, 2022 and 2021, respectively, are disclosed in Notes 7 and 8 to the consolidated financial statements.
Estimation of retirement obligations
The determination of the obligation and retirement cost are dependent on certain assumptions used by actuaries in calculating such amounts. Those assumptions include, among others, discount rates and salary increase rates. While the Group believes that the assumptions are reasonable and appropriate, significant differences in the actual experience or significant changes in the assumptions may materially affect the retirement obligations.
Retirement assets amounted to 52.2 million as of December 31, 2022 while retirement liabilities amounted to 37.3 million as of December 31, 2021 (Note 27).
Fair values of properties under sale and operating leaseback transaction
The Group determines the fair values of Bauan properties that were subjected to sale and leaseback in 2022 by relying on a third party’s valuation. The judgment includes determination whether the difference between the fair value of the properties and its selling price should be accounted as immediate gain in the profit or loss or be deferred over the operating lease term (Note 14).
Realizability of deferred tax assets
The Group reviews the carrying amounts of deferred taxes of each entity in the Group at each reporting date and reduces deferred tax assets to the extent that it is no longer probable that sufficient taxable profit will be available to allow all or part of the deferred tax assets to be utilized.
Deferred tax assets recognized by the Group are disclosed in Note 25 to the consolidated financial statements.
Classification of creditable withholding tax
The Group classifies its creditable withholding tax (CWT) as current when it is expected to be realized (e.g., will be used as tax credit against income taxes due) for at least twelve months after the reporting period. The portion of CWT that is expected to be realized twelve months after the reporting period is classified as noncurrent. In 2021, the Group classified CWT as non-current as management assessed that it will not be used as tax credits within the next twelve months.
CWT recognized by the Group are disclosed in Notes 10 and 16 to the consolidated financial statements.
92
EEI 2022 Annual Report | Audited Financial Statements
6. Cash and Cash Equivalents
This account consists of:
Cash in banks earns interest at the respective bank deposit rates. Cash equivalents are made for varying periods of up to three (3) months depending on the immediate cash requirements of the Group and earn annual interest at the respective short-term investment rates.
Allowance for expected credit losses on cash in banks and cash equivalents amounted to 5,033 and 6,985 as of December 31, 2022 and 2021, respectively.
Interest income from cash in banks and cash equivalents amounted to 33.8 million, 5.4 million and 6.3 million in 2022, 2021 and 2020, respectively (Note 23).
7. Receivables
This account consists of:
Movements in the allowance for expected credit losses for the year ended December 31 follow:
93 EEI 2022 Annual Report | Audited Financial Statements *SGVFS163860*
2022 2021 Cash on hand 8,420,080 9,642,680 Cash in banks 1,380,536,133 2,281,602,470 Cash equivalents 1,182,418,538 4,832,977,227 2,571,374,751 7,124,222,377
2022 2021 Trade receivable Non-interest bearing Billed receivables 2,458,026,281 2,312,725,740 Unbilled receivables 59,413,064 60,082,926 Interest-bearing 11,530,924 16,061,796 Receivable from sale of investment properties 15,997,014 17,285,545 Other receivables 45,011,795 48,080,909 2,589,979,078 2,454,236,916 Less: Allowance for expected credit losses 90,968,543 87,367,855 2,499,010,535 2,366,869,061
2022 Non-interest bearing trade receivables Interestbearing trade receivables Other receivables Total Balances at beginning of year ₱ 76,241,674 ₱ 200,000 ₱10,926,181 ₱87,367,855 Reversal (Note 22) (12,771,964) - - (12,771,964) Reclassification (Note 8) 16,372,652 - 16,372,652 Balances at end of year ₱ 79,842,362 ₱ 200,000 ₱10,926,181 ₱ 90,968,543
Trade receivables mainly pertain to amounts arising from construction contracts and are generally on a 30-day credit term.
Receivable from sale of investment properties
Receivable from sale of investment properties relates to the Group’s sale of various properties. This includes receivable from ₱466.7 million sale of a parcel of land located in Batangas on December 11, 2017 to be collected in eight (8) semi-annual installments and shall bear annual interest rate of 2%. The related receivable was fully collected in 2nd quarter of 2021.
Interest-bearing trade receivables
In 2017, certain trade receivables were reclassified as interest-bearing trade receivables after the Parent Company and the customers agreed to extend the credit terms. These receivables bear interest of 5% per annum and will be repaid in five (5) years’ time. Interest income from trade receivables amounted to ₱1.3 million, ₱1.9 million and ₱2.3 million in 2022, 2021 and 2020, respectively (Note 23).
8. Contract Assets and Liabilities Contract Assets
The Group presents contract receivable and retentions withheld by customers as contract assets as the Group’s right for consideration is conditioned on the lapse of the defect and liability period and the receipt of customer certification that there are no defects on the constructed asset. These are reclassified as receivables upon the lapse of the defects liability period and final customer acceptance.
The Group’s contract assets amounted to ₱10.3 billion and ₱9.8 billion as of December 31, 2022 and 2021, respectively.
Details of the Group’s contract assets as of December 31, 2022 and 2021 are shown below:
94 2021 Non-interest bearing trade receivables Interest-bearing trade receivables Other receivables Total Balances at beginning of year ₱44,578,717 ₱200,000 ₱37,508,915 ₱82,287,632 Provision (Note 22) 31,662,957 31,662,957 Recovery (Note 22) (26,582,734) (26,582,734) Balances at end of year ₱ 76,241,674 ₱200,000 ₱10,926,181 ₱87,367,855
2022 Current Noncurrent Total Contract asset ₱5,201,785,067 5,199,970,342 ₱10,401,755,409 Less: Allowance for expected credit losses 19,510,785 9,443,812 28,954,597 ₱5,182,274,282 ₱5,190,526,530 ₱10,372,800,812 2021 Current Noncurrent Total Contract asset ₱8,788,954,323 ₱1,088,902,619 ₱9,877,856,942 Less: Allowance for expected credit losses 47,701,274 9,443,812 57,145,086 ₱8,741,253,049 ₱1,079,458,807 ₱9,820,711,856 EEI 2022 Annual Report | Audited Financial Statements
Movement in the allowance for expected credit losses for the years ended December 31, 2022 and 2021 follows:
Contract Liabilities
Contract liabilities mainly consist of down payments received in relation to construction contracts that will be recognized as revenue in the future as the Group satisfies its performance obligations. The Group’s contract liabilities amounted to ₱1.3 billion and ₱1.0 billion as of December 31, 2022 and 2021, respectively, after offsetting with related contract asset.
Revenue recognized in 2022, 2021 and 2020 that were included in the prior year balance of contract liabilities amounted to ₱2.2 billion, ₱1.4 billion and ₱1.6 billion, respectively.
9. Inventories
This account consists of:
95 EEI 2022 Annual Report | Audited Financial Statements *SGVFS163860*
2022 Current Noncurrent Total Balances as at January 1 ₱47,701,274 ₱ 9,443,812 ₱57,145,086 Reversals (11,817,837) - (11,817,837) Reclassification (Note 7) (16,372,652) - (16,372,652) Balances as at December 31 ₱19,510,785 ₱ 9,443,812 ₱ 28,954,597 2021 Current Noncurrent Total Balances as at January 1 ₱36,785,303 ₱15,154,047 ₱51,939,350 Provision (Note 22) 10,915,971 10,915,971 Reversals (5,710,235) (5,710,235) Balances as at December 31 ₱47,701,274 ₱9,443,812 ₱57,145,086
2022 2021 Total contract liabilities ₱1,261,106,817 ₱986,940,583 Less current portion 434,405,390 421,090,961 ₱826,701,427 ₱565,849,622
2022 2021 Construction materials ₱ 726,367,905 ₱828,563,511 Real estate: Land and land development 158,670,638 151,320,246 Subdivision lots and condominium units for sale 35,988,542 39,546,586 Raw land 42,398,913 45,073,466 Merchandise 87,727,551 94,026,848 Spare parts and supplies 84,002,233 77,248,841 ₱1,135,155,782 ₱1,235,779,498 Forward
Less: Allowance for inventory obsolescence
A summary of the movement in real estate inventories is set out below:
Merchandise inventories
Merchandise inventory with cost of ₱0.8 million and ₱18.6 million were fully provided with allowance for inventory obsolescence as of December 31, 2022 and 2021, respectively. In 2022, the Group wrote off allowance for inventory obsolescence amounting to ₱17.8 million (nil in 2021) for merchandise inventory assessed to be no longer utilizable.
Spare parts and supplies
This pertains to inventory items used in the repair and maintenance of the Group’s property and equipment.
Spare parts and supplies with cost of ₱7.6 million and ₱21.9 million were fully provided with allowance for inventory obsolescence as of December 31, 2022 and 2021. In 2022, the Group reversed allowance for inventory obsolescence amounting to ₱14.3 million (nil in 2021) after the spare parts and supplies inventory were found to be still serviceable. These were consumed and recorded as part of cost of services in 2022.
10. Other Current Assets
This account consists of:
96 2022 2021
Merchandise 769,378 18,589,068 Spare parts and supplies 7,572,331 21,874,203 8,341,709 40,463,271 ₱1,126,814,073 ₱1,195,316,227 Real estate
2022 2021 Balances at beginning of year ₱ 235,940,298 ₱230,771,009 Construction/development costs incurred 4,250,108 12,683,981 Cost of real estate sales (Note 21) (3,132,313) (7,514,692) Balances at end of year ₱ 237,058,093 ₱235,940,298
2022 2021 Advances to suppliers and subcontractors ₱677,201,222 ₱581,912,690 Creditable withholding taxes (CWTs) 181,253,741 Miscellaneous deposits 145,760,576 128,667,271 Deferred input tax 60,415,203 Bid deposit 59,822,400 59,822,400 Advances to officers and employees 52,753,886 50,822,589 Prepaid expenses 27,762,549 55,052,743 Others 44,264,478 23,116,133 1,249,234,055 899,393,826 Less: Allowance for impairment 55,395,197 16,458,668 ₱1,193,838,858 ₱882,935,158 EEI 2022 Annual Report | Audited Financial Statements
CWTs pertain to unutilized creditable withholding taxes which will be used as tax credit against income taxes due. The Group determines that taxes withheld can be recovered in future periods. In 2021, the Group classified a portion of the CWTs as non-current as management assessed that it will not be used as tax credits within the next twelve months (Note 16). This is accounted for as a noncash operating activity in the 2021 consolidated statement of cash flows. CWTs classified as current in 2022 are assessed to be utilized in 2023.
Miscellaneous deposits mainly represent the Group’s refundable rental, utilities and guarantee deposits on various machinery and equipment items.
Movements in allowance for impairment for the years ended December 31 are shown below:
11. Investments in Associates and Joint Ventures
The investments relate to the following investee companies:
97
2022 Miscellaneous deposits Advances to officers and employees Advances to suppliers and subcontractors Total Balances as at January 1 ₱ 3,335,193 ₱ 29,516 ₱13,093,959 ₱16,458,668 Provisions for ECL (Note 22) 37,930,232 1,006,297 ‒ 38,936,529 Balances as at December 31 ₱41,265,425 ₱1,035,813 ₱13,093,959 ₱ 55,395,197 2021 Miscellaneous deposits Advances to officers and employees Advances to suppliers and subcontractors Total Balances as at January 1 ₱3,335,193 ₱29,516 ₱13,093,959 ₱16,458,668 Provisions for ECL (Note 22) ‒ ‒ ‒ ‒Balances as at December 31 ₱3,335,193 ₱29,516 ₱13,093,959 ₱16,458,668
Place of incorporation Nature of business Percentage of ownership 2022 2021 Associates Al-Rushaid Construction Company Limited (ARCC) Kingdom of Saudi Arabia Construction 49 49 PetroSolar Corporation (PSOC) Philippines Renewable energy 44 44 Rice Integrated Commercial Enterprises, Inc. (RICEI) Philippines Agricultural 49 ‒Joint ventures PetroWind Energy, Inc. (PWEI) Philippines Renewable energy 20 20 Shinbayanihan Heavy Equipment Corporation (SHEC) Philippines Equipment rental 40 40 BEO Distribution and Marketing Corporation (BEO DMC) Philippines Distribution and Marketing 30 30 Shimizu-Fujita-Takenaka-EEI Joint Venture (SFTE) Philippines Construction 5 5 Acciona-EEI Joint Venture (AE) Philippines Construction 30 30 EEI 2022 Annual Report | Audited Financial Statements *SGVFS163860*
Details of the Group’s material investments in associates and joint ventures follow:
98
ARCC PSOC PWEI Acquisition cost: Balances as at January 1 ₱595,948,045 ₱690,553,362 ₱ 257,020,000 Additional investment ‒ 2,750,000 31,470,782 Balances as at December 31 595,948,045 693,303,362 288,490,782 Accumulated equity in net earnings (losses): Balances as at January 1 928,700,211 428,695,847 214,834,375 Equity in net earnings (losses) (387,052,676) 201,514,775 42,530,784 Dividends ‒ (118,800,000) ‒Balances as at December 31 541,647,535 511,410,622 257,365,159 Accumulated share in other comprehensive income (loss) Balances as at January 1 (57,048,497) (181,079) 107,379 Additions (54,668,109) ‒ ‒Balances as at December 31 (111,716,606) (181,079) 107,379 Equity in cumulative translation adjustments 315,556,315 ‒ ‒₱1,341,435,289 ₱ 1,204,532,905 ₱ 545,963,320 ARCC PSOC Acquisition cost: Balances as at January 1 ₱1,050,087,261 ₱690,553,362 Return of investment (454,139,216) ‒Balances as at December 31 595,948,045 690,553,362 Accumulated equity in net earnings (losses): Balances as at January 1 268,810,851 393,898,925 Equity in net earnings (losses) 659,889,360 191,700,922 Dividends ‒ (156,904,000) Balances as at December 31 928,700,211 428,695,847 Accumulated share in other comprehensive income (loss) Balances as at January 1 (21,943,225) (181,079) Additions (35,105,272) ‒Balances as at December 31 (57,048,497) (181,079) Equity in cumulative translation adjustments 153,681,683 ‒₱1,621,281,442 ₱1,119,068,130 EEI 2022 Annual Report | Audited Financial Statements
99 2022 RICEI SHEC BEO DMC SFTE AE Total ₱ ‒ ₱ 20,800,000 ₱450,000 ₱ ‒ ₱ ‒ ₱1,564,771,407 13,540,700 ‒ ‒ ‒ ‒ 47,761,482 13,540,700 20,800,000 450,000 ‒ ‒ 1,612,532,889 ‒ (1,456,318) (344,169) 7,053,091 20,798,985 1,598,282,022 (497,960) 1,769,607 (39,839) 2,304,343 33,619,320 (105,851,646) - ‒ ‒ ‒ ‒ (118,800,000) (497,960) 313,289 (384,008) 9,357,434 54,418,305 1,373,630,376 ‒ ‒ ‒ ‒ ‒ (57,122,197) ‒ ‒ ‒ ‒ ‒ (54,668,109) ‒ ‒ ‒ ‒ ‒ (111,790,306) ‒ ‒ ‒ ‒ ‒ 315,556,315 ₱13,042,740 ₱ 21,113,289 ₱65,992 ₱ 9,357,434 ₱54,418,305 ₱ 3,189,929,274 2021 PWEI SHEC BEO DMC SFTE AE Total ₱257,020,000 ₱20,800,000 ₱450,000 ₱‒ ₱‒ ₱2,018,910,623 ‒ ‒ ‒ ‒ ‒ (454,139,216) 257,020,000 20,800,000 450,000 ‒ ‒ 1,564,771,407 165,438,344 (2,048,155) (285,799) 4,198,492 ‒ 830,012,658 49,396,031 591,837 (58,370) 2,854,599 20,798,985 925,173,364 ‒ ‒ ‒ ‒ ‒ (156,904,000) 214,834,375 (1,456,318) (344,169) 7,053,091 20,798,985 1,598,282,022 107,379 ‒ ‒ ‒ ‒ (22,016,925) ‒ ‒ ‒ ‒ ‒ (35,105,272) 107,379 ‒ ‒ ‒ ‒ (57,122,197) ‒ ‒ ‒ ‒ ‒ 153,681,683 ₱471,961,754 19,343,682 ₱105,831 ₱ 7,053,091 ₱20,798,985 ₱3,259,612,915 EEI 2022 Annual Report | Audited Financial Statements *SGVFS163860*
ARCC
In 2017, the stockholders of ARCC extended advances amounting to ₱1,620.8 million (SAR121.75 million) to ARCC to refinance the associate’s maturing bank loan and other funding requirements. The amount of the extended loan is proportionate to the ownership interests of the stockholders. Subsequently, the stockholders agreed to treat the ₱1,591.5 million (SAR121.75 million) loan as nonrefundable shareholders’ funding in the statement of equity of ARCC. Consequently, the ₱794.2 million (SAR59.66 million) advances extended by the Group to ARCC was reclassified as additional investment in ARCC.
EEI Limited made additional investment of ₱294.9 million in ARCC in 2016.
In 2021 and 2020, ARCC repaid investment amounting to ₱454.1 million and ₱576.0 million, respectively. The transactions did not result to a change in the 49% ownership of EEI Limited over ARCC.
PSOC
In 2015, EPC purchased 3.7 million shares from PSOC amounting to ₱366.43 million which resulted to 44% ownership on the latter. PSOC was incorporated on June 17, 2015 primarily to carry out the general business of generating, transmitting, and/or distributing power derived from renewable energy resources. It has a 50-megawatt solar farm in Tarlac City.
In 2022, 2019 and 2018, EPC made additional investments of ₱2.75 million, ₱148.3 million and ₱175.80 million, respectively, in PSOC. These transactions did not result to a change in the 44% ownership of EPC over PSOC.
In 2022 and 2021, dividend received from PSOC amounted to ₱118.80 million and ₱156.90 million, respectively.
PWEI
In 2013, EPC acquired 20% stake in PWEI for ₱118.75 million. PWEI was incorporated on March 6, 2013, primarily to carry on the general business of generating, transmitting and/or distributing power derived from renewable energy sources such as, but not limited to wind, biomass, hydro, solar, geothermal, ocean, wave and such other renewable sources of power, and from conventional sources such as coal, fossil fuel, natural gas, nuclear, and other viable or hybrid sources of power corporation, public electric utilities, electric cooperative and markets. PWEI has a wind energy project in Nabas, Aklan and has started construction activities on April 29, 2013.
On November 21, 2013, PetroGreen Energy Corporation (PGEC), CapAsia ASEAN Wind Holdings Cooperative, U.A. (CapAsia) and EPC entered into a Shareholders’ Agreement (SA). The SA will govern their relationship as the shareholders of PWEI as well as containing their respective rights and obligations in relation to PWEI. Further, the SA contains provisions regarding voting requirements for relevant activities that require unanimous consent of all the parties. PGEC, CapAsia and EPC agree that their equity ownership ratio in PWEI is at 40%, 40% and 20%, respectively.
Although the Share Purchase Agreement (SPA) and the SA were executed on November 21, 2013, these did not result to PGEC’s loss of control over PWEI in 2013. The loss of control did not happen until the Closing Date. On February 14, 2014, the Closing Date, the payment has been received from sale of the shares as executed in the Deed of Assignment covering the transfer of shares from PGEC to CapAsia and all the conditions precedent have been satisfactory completed. Hence, the transaction made PWEI a joint venture among PGEC, CapAsia and EPC by virtue of the SA signed among the three parties governing the manner of managing PWEI. PGEC lost control over PWEI while CapAsia was given full voting and economic rights as a 40% shareholder.
100
EEI 2022 Annual Report | Audited Financial Statements
In 2022, EPC made an additional investment of ₱31.5 million. This did not result to a change in the 20% ownership of EPC over PWEI.
RICEI
In 2022, the Group acquired 49% stake in RICE Integrated Commercial Enterprises, Incorporation (RICEI) and was accounted for as an associate. RICEI was incorporated on February 23, 2019 primarily to engage in the production and trading of crops, orchards, groves, and all types of agricultural, fishery and farm products on wholesale basis.
SHEC
In 2019, the Group acquired 40% stake in Shinbayanihan Heavy Equipment Corporation (SHEC) and was accounted as joint venture. SHEC was incorporated on July 26, 2019 primarily to engage in the business of managing the operation of used and new construction equipment rental and used and new construction equipment wholesale business in the Philippines and import and export of used and new construction equipment without engaging in retail trading.
BEO DMC
In 2019, BiotechJP deposited ₱0.5 million with BEO Distribution and Marketing Corporation (BEO DMC) in exchange for 30% ownership in the latter. BEO DMC is in the business of distributing and marketing of goods. The deposit was recorded as “Deposit for Future Stock Subscription” pending receipt of the shares of capital stock of the investee.
In 2020, BiotechJP reclassified the deposit to investment in joint venture upon receipt of stock certificate of BEO DMC.
SFTE
On September 12, 2020, the Parent Company entered into a joint venture agreement with Shimizu Corporation, Fujita Corporation, Takenaka Civil Engineering & Construction Co. Ltd. (SFTE) to contract with the Department of Transportation (DOTr) of the Republic of the Philippines for the Metro Manila Subway Project (MMSP)-Phase 1, Contract Package 101. In the joint venture, the Parent Company acquired a proportionate share of 5% with regard to the assets, liabilities, costs, profits and losses arising out of the execution of the Works as identified in the contract with DOTr. The joint venture agreement also requires anonymous vote of all joint venture partners on the relevant activities of the joint venture.
AE
On October 13, 2020, the Parent Company entered into a joint venture agreement with Acciona Construction Philippines, Inc. to undertake the construction of the Malolos-Clark Railway Project-Package No. CP N-04. The Group’s participating interest in the joint venture is 30%. The Group has no initial capital investment on the joint venture as it is an unincorporated joint venture. The joint venture agreement also requires unanimous vote of all joint venture partners on the relevant activities of the joint venture.
The Parent Company also entered into joint venture agreements with certain contractors for the purpose of establishing unincorporated joint ventures, the object of which are to submit bids for certain projects, and if such bids are successful, execute the project and jointly deliver the works in accordance with the project documents. As of December 31, 2022, these projects are yet to be awarded. The Group has no initial capital investment on the joint ventures as these are unincorporated. The Group accounts for these joint ventures under equity method of accounting.
101 EEI 2022 Annual Report | Audited Financial Statements *SGVFS163860*
Below are the summarized financial information relating to the Group’s associates and joint venture:
Below are the summary of statements of comprehensive income (loss) of the Group’s associates and joint venture:
102
2022: ARCC PSOC PWEI Current assets ₱14,559,856,304 ₱633,730,099 ₱687,326,695 Noncurrent assets 2,440,981,814 3,504,092,211 3,676,649,757 Total assets 17,000,838,118 4,137,822,310 4,363,976,452 Current liabilities 10,819,813,541 291,556,250 321,034,031 Noncurrent liabilities 3,443,401,539 1,108,691,276 1,313,125,821 Total liabilities 14,263,215,080 1,400,247,526 1,634,159,852 Preferred stock ‒ ‒ ‒Net assets of the investee ₱2,737,623,038 ₱ 2,737,574,784 ₱2,729,816,600 2021: ARCC PSOC PWEI Current assets ₱7,695,391,086 ₱612,446,167 ₱601,542,457 Noncurrent assets 1,558,311,252 3,551,998,724 3,628,733,636 Total assets 9,253,702,338 4,164,444,891 4,230,276,093 Current liabilities 4,537,166,477 268,487,074 321,315,833 Noncurrent liabilities 1,407,798,224 1,352,621,158 1,549,151,490 Total liabilities 5,944,964,701 1,621,108,232 1,870,467,323 Preferred stock ‒ ‒ ‒Net assets of the investee ₱3,308,737,637 ₱2,543,336,659 ₱2,359,808,770
2022: ARCC PSOC PWEI Revenue ₱16,230,456,234 ₱872,585,868 ₱641,457,086 Cost 16,772,103,543 257,479,890 476,001,792 Gross margin (loss) (541,647,309) 615,105,978 165,455,294 Selling and administrative, and other expenses 444,391,375 137,703,720 57,046,015 Pre-tax income (loss) (986,038,684) 477,402,258 222,501,309 Income tax expense (benefit) (196,135,264) 19,414,133 9,847,389 Net income (loss) (₱789,903,420) ₱457,988,125 ₱212,653,920 2021: ARCC PSOC PWEI Revenue ₱12,867,243,426 ₱886,190,108 ₱762,297,941 Cost 10,839,623,929 251,170,919 350,970,211 Gross margin 2,027,619,497 635,019,189 411,327,730 Selling and administrative, and other expenses 381,580,758 159,831,655 164,347,574 Pre-tax income (loss) 1,646,038,739 475,187,534 246,980,156 Income tax expense (benefit) 299,325,759 39,503,620 ‒Net income (loss) ₱1,346,712,980 ₱435,683,914 ₱246,980,156 EEI 2022 Annual Report | Audited Financial Statements
103 RICE SHEC BEO DMC SFTE AE ₱27,493,310 ₱45,107,627 ₱2,078,394 ₱ 29,393,741,540 ₱2,689,710,700 274,441 73,405,977 ‒ ‒ 388,896,928 27,767,751 118,513,604 2,078,394 29,393,741,540 3,078,607,628 1,149,914 49,090,381 1,858,421 29,206,592,865 1,588,232,594 ‒ ‒ ‒ ‒ 1,308,980,683 1,149,914 49,090,381 1,858,421 29,206,592,865 2,897,213,277 ‒ 16,640,000 ‒ ‒ ‒₱26,617,837 ₱ 52,783,223 ₱219,973 ₱187,148,675 ₱181,394,351 SHEC BEO DMC SFTE AE ₱43,897,089 ₱1,541,219 ₱16,837,812,295 ₱2,765,091,514 23,730,551 ‒ ‒ 773,800,007 67,627,640 1,541,219 16,837,812,295 3,538,891,521 2,628,435 1,188,449 16,696,750,475 3,469,561,571 ‒ ‒ ‒ ‒2,628,435 1,188,449 16,696,750,475 3,469,561,571 16,640,000 ‒ ‒ ‒₱48,359,205 ₱352,770 ₱141,061,820 ₱69,329,950 RICE SHEC BEO DMC SFTE AE ₱3,518,803 ₱7,498,193 ₱2,238,279 ₱46,086,858 ₱2,142,951,267 4,173,081 4,370,913 2,271,076 1,438,020,517 (654,278) 3,127,280 (32,797) 46,086,858 704,930,750 361,967 (1,314,123) 100,000 ‒ 592,866,351 (1,016,245) 4,441,403 (132,797) 46,086,858 112,064,399 ‒ 17,385 ‒ ‒ ‒(₱1,016,245) ₱4,424,018 (₱132,797) ₱46,086,858 ₱112,064,399 SHEC BEO DMC SFTE AE ₱5,074,008 ₱1,349 ₱57,091,980 ₱1,663,629,388 1,964,528 ‒ 840,548,927 3,109,480 1,349 57,091,980 823,080,461 1,629,887 195,917 ‒ 753,750,511 1,479,593 (194,568) 57,091,980 69,329,950 ‒ ‒ ‒ ‒₱1,479,593 (₱194,568) ₱57,091,980 ₱69,329,950 EEI 2022 Annual Report | Audited Financial Statements *SGVFS163860*
The table below shows the Group’s share in net earnings (losses) of its associates and joint ventures:
2022:
31, 2022
The Group’s share in the net income of ARCC is subject to 20% income tax rate in Saudi Arabia.
Other relevant financial information of PWEI are as follows:
information of SHEC are as follows:
information of BEO are as follows:
104
December
ARCC PSOC PWEI RICE SHEC BEO DMC SFTE AE Total Net income (loss) (₱789,903,420) ₱457,988,125 ₱212,653,920 (₱1,016,245) ₱4,424,018 (₱132,797) ₱46,086,858 ₱112,064,399 ₱42,164,858 Proportionate ownership in the associates and joint venture 49% 44% 20% 49% 40% 30% 5% 30% Equity in net earnings (losses) (₱387,052,676) ₱201,514,775 ₱42,530,784 (₱497,960) ₱1,769,607 (₱39,839) ₱2,304,343 ₱33,619,320 (₱105,851,646) 2021: December 31, 2021 ARCC PSOC PWEI SHEC BEO DMC SFTE AE Total Net income (loss) ₱1,346,712,980 ₱435,683,914 ₱246,980,156 ₱1,479,593 (₱194,568) ₱57,091,980 ₱69,329,950 ₱2,157,084,005 Proportionate ownership in the associates and joint venture 49% 44% 20% 40% 30% 5% 30% Equity in net earnings (losses) ₱659,889,360 ₱191,700,922 ₱49,396,031 ₱591,837 (₱58,370) ₱2,854,599 ₱20,798,985 ₱925,173,364
2022 2021 Cash and cash equivalents ₱241,434,172 ₱210,926,150 Current financial liabilities * 293,945,601 290,734,202 Noncurrent financial liabilities * 1,321,286,339 1,512,560,580 Depreciation and amortization 196,284,720 194,393,893 Interest income 6,334,910 2,391,881 Interest expense 122,621,186 139,993,428
Other
2022 2021 Cash and cash equivalents ₱31,503,060 ₱34,253,747 Current financial liabilities * 7,164,732 5,435,145 Depreciation and amortization 4,301,670 1,813,800 Interest income 36,135 43,322
trade and other
and provisions Other
financial
2022 2021 Cash and cash equivalents ₱1,686,802 ₱1,502,203 Current financial liabilities * 970,183 870,183 Interest income 1,002 1,349
other
and provisions EEI 2022 Annual Report | Audited Financial Statements
*Excluding trade and other payables and provisions
relevant financial
*Excluding
payables
relevant
*Excluding trade and
payables
Other relevant financial information of SFTE are as follows:
The reconciliation of the net assets of the investees to the carrying amounts of the investments recognized in the consolidated financial statements follows:
105
2022 2021 Cash and cash equivalents ₱12,488,879,930 ₱9,800,712,506 Interest income 46,086,858 57,091,980 Other relevant financial information of AE are as follows: 2022 2021 Cash and cash equivalents ₱1,000,462,212 ₱268,799,174 Current financial liabilities * 1,588,232,594 421,140,200 Interest income 4,420,740 1,948 Depreciation and amortization 44,385,972 216,823,727
trade and other payables and provisions
*Excluding
2022 ARCC PSOC PWEI RICE SHEC BEO DMC SFTE AE Net assets of the investee 2,737,623,038 2,737,574,784 2,729,816,600 26,617,837 52,783,223 219,973 187,148,675 181,394,351 Proportionate ownership in the associate 49% 44% 20% 49% 40% 30% 5% 30% Carrying value of investment 1,341,435,289 1,204,532,905 545,963,320 13,042,740 21,113,289 65,992 ₱9,357,434 54,418,305 2021 ARCC PSOC PWEI SHEC BEO DMC SFTE AE Net assets of the investee 3,308,737,637 2,543,336,659 2,359,808,770 48,359,205 352,770 141,061,820 69,329,950 Proportionate ownership in the associate 49% 44% 20% 40% 30% 5% 30% Carrying value of investment 1,621,281,442 1,119,068,130 471,961,754 19,343,682 105,831 7,053,091 20,798,985
12. Equity Investments at FVOCI
consists
2022 2021 Quoted equity investments ₱27,044,752 ₱27,687,694 Unquoted equity investments 1,249,175,359 1,245,289,590 ₱1,276,220,111 ₱1,272,977,284 EEI 2022 Annual Report | Audited Financial Statements *SGVFS163860*
This account
of:
The rollforward analyses of equity investments at FVOCI as of December 31 follow:
In 2021, the Group invested additional ₱8.3 million in PGEC, an unquoted equity investment. This transaction did not result to a change in the Group’s 10% equity interest in PGEC.
In 2022, Kyuden International Corporation (KIC) invested in PGEC, resulting into a change in the Group’s equity interest in PGEC to 8.55%.
The unquoted equity investments consist of shares of the following companies:
The Group elected to present the fair value changes of all its equity investments in other comprehensive income because it does not intend to hold these investments for trading.
PGEC
The fair value of the Group’s investment in PGEC is determined by an independent third-party professional services firm using the discounted cash flow model. The valuation requires certain assumptions to be made, such as forecast cash flows, the discount rate, among others.
HEDC
The fair value of the Group’s investment in HEDC is determined using the adjusted net asset approach wherein the assets of HEDC consisting mainly of parcels of land are adjusted from cost to their fair value. The valuation was performed by an independent SEC-accredited appraiser as of December 31, 2022.
Dividends earned from equity investments at FVOCI amounted to ₱4.0 million, ₱51.0 million, and ₱37.1 million in 2022, 2021 and 2020, respectively (see Note 24).
106
2022 2021 At January 1 ₱1,272,977,284 ₱1,031,570,234 Additions 8,300,000 Fair value changes 3,242,827 233,107,050 At December 31 ₱1,276,220,111 ₱1,272,977,284
2022 2021 PetroGreen Energy Corporation ₱735,037,040 ₱835,276,405 Hermosa Ecozone Development Corporation 508,507,014 404,381,880 YGC Corporate Services, Inc. 3,305,447 3,305,447 Brightnote Assets Corporation 1,656,327 1,656,327 Others 669,531 669,531 At December 31 ₱1,249,175,359 ₱1,245,289,590
EEI 2022 Annual Report | Audited Financial Statements
Presented below are the movements in fair value reserve of equity investments at FVOCI (net of tax effect) for the years ended December 31:
13. Property and Equipment
The rollforward analyses of this account follow:
Machinery, tools and construction equipment are directly used in various construction projects of the Group.
As of December 31, 2022 and 2021, construction in progress mainly pertains to on-going improvement projects at the Parent Company’s head office.
107 EEI 2022 Annual Report | Audited Financial Statements *SGVFS163860*
2022 2021 At January 1 ₱723,802,224 ₱525,034,702 Fair value changes 2,659,962 198,767,522 At December 31 ₱726,462,186 ₱723,802,224
2022 Land, Buildings and Improvements Machinery, Tools and Construction Equipment Transportation and Service Equipment Furniture, Fixtures, and Office Equipment Construction In Progress Total Cost At beginning of year ₱1,319,341,992 ₱5,256,688,886 ₱1,015,730,081 ₱499,072,446 ₱31,421,261 ₱8,122,254,666 Additions 4,347,703 94,113,847 35,834,698 42,704,174 19,668,166 196,668,588 Retirements/disposals (see Note 24) (730,968,788) (212,879,736) (28,594,271) (2,846,196) ‒ (975,288,991) At end of year 592,720,907 5,137,922,997 1,022,970,508 538,930,424 51,089,427 7,343,634,263 Accumulated depreciation and amortization At beginning of year 300,463,283 3,406,784,773 686,234,361 420,753,110 ‒ 4,814,235,527 Depreciation and amortization 38,058,134 296,379,102 89,493,278 42,825,598 ‒ 466,756,112 Retirements/disposals (see Note 24) (149,916,718) (190,878,819) (24,140,182) (1,994,916) ‒ (366,930,635) At end of year 188,604,699 3,512,285,056 751,587,457 461,583,792 ‒ 4,914,061,004 Net book value ₱404,116,208 ₱1,625,637,941 ₱271,383,051 ₱77,346,632 ₱51,089,427 ₱2,429,573,259 2021 Land, Buildings and Improvements Machinery, Tools and Construction Equipment Transportation and Service Equipment Furniture, Fixtures, and Office Equipment Construction In Progress Total Cost At beginning of year ₱1,261,587,670 ₱5,440,461,635 ₱1,059,135,087 ₱466,558,150 ₱50,616,279 ₱8,278,358,821 Additions 14,951,532 79,186,056 12,987,016 35,639,893 27,292,564 170,057,061 Retirements/disposals (see Note 24) ‒ (266,643,597) (56,392,022) (3,125,597) ‒ (326,161,216) Reclassifications 42,802,790 3,684,792 ‒ ‒ (46,487,582) ‒At end of year 1,319,341,992 5,256,688,886 1,015,730,081 499,072,446 31,421,261 8,122,254,666 Accumulated depreciation and amortization At beginning of year 264,140,154 3,274,743,896 646,762,949 373,822,917 ‒ 4,559,469,916 Depreciation and amortization 36,323,129 309,071,449 91,297,386 49,366,829 ‒ 486,058,793 Retirements/disposals (see Note 24) ‒ (177,030,572) (51,825,974) (2,436,636) ‒ (231,293,182) At end of year 300,463,283 3,406,784,773 686,234,361 420,753,110 ‒ 4,814,235,527 Net book value ₱1,018,878,709 ₱1,849,904,113 ₱329,495,720 ₱78,319,336 ₱31,421,261 ₱3,308,019,139
The distribution of the depreciation and amortization expense of the Group’s property and equipment follows:
In 2022, the Parent Company entered into a sale and leaseback transaction with EEI Retirement Fund, Inc. (EEI-RFI) for properties composed of land, building and improvements located in Bauan, Batangas for ₱1.2 billion. This transaction resulted to a gain on sale of ₱341 million and the recognition of right-of-use asset and lease liability amounting to ₱56.7 million and ₱206.1 million, respectively.
As at December 31, 2022 and 2021, no property and equipment items were pledged as security while there are fully depreciated property and equipment with acquisition cost amounting to ₱1.7 billion still in use as at December 31, 2022 and 2021.
14. Leases Group as a lessee
The Group has lease contracts for various items of land and improvements, buildings and office spaces used in its operations. Leases of land and office spaces generally have lease terms between 10 and 66 years, while other equipment generally have lease terms between 1 and 3 years. The Group’s obligations under its leases are secured by the lessor’s title to the leased assets. There are several lease contracts that include extension and termination options and variable lease payments, which are further discussed below.
The Group also has certain leases with lease terms of 12 months or less and leases of office equipment with low value. The Group applies the ‘short-term lease’ and ‘lease of low-value assets’ recognition exemptions for these leases.
a. Starting January 2007, the Parent Company and EEI-RFI entered into a lease agreement for the lease of land and improvements. The lease terms are for one year and renewable every year with 5% increase effective January 1, 2014.
b. The Parent Company entered into a sublease agreement for lease of 2,459.22 square meters land in Clark City, Pampanga. Lease term is until 2085.
c. The Group leases a staff house which it occupies for its operations for a period of two years, both parties has the option to renew as per agreement.
d. The Group leases a lot and offices which it occupies for its operations for its projects with option to renew as per agreement. In October 2011, the Group entered into a lease contract covering the period of October 16, 2011 to October 15, 2014. The contract has a rate of ₱450 per square meter for the first two years and ₱460 per square meter for the third year.
e. In May 2016, the Group entered into a lease agreement for a period of five (5) years commencing on July 7, 2016 and expiring on July 6, 2021. The lease is subject to escalation of 10% starting the second year of lease. This was renewed for a period of five (5) years covering July 7, 2021 to July 6, 2026.
f. In April 2016, the Group renewed the lease for a period of three (3) years commencing from April 16, 2014 to April 15, 2019. The lease contract has a rate of ₱630 per square meter for the first year and subject to 5% yearly increase thereafter.
108
2022 2021 2020 Cost of sales and services (Note 21) ₱346,923,945 ₱370,528,908 ₱483,808,837 Selling and administrative expenses (Note 22) 119,832,167 115,529,885 148,772,611 ₱466,756,112 ₱486,058,793 ₱632,581,448
EEI 2022 Annual Report | Audited Financial Statements
g. In June 2020, the Group entered into a lease of parcel of land for a period of fourteen (14) months commencing on July 1, 2020 and expiring on August 31, 2021.
h. In December 2022, the Parent Company entered into a lease contract with EEI-RFI for the lease of land and improvements where its fabrication shop is located. The lease is for a term of 5 years with annual escalation of 5%.
The carrying amount of right-of-use assets and the movement during the years are as follows:
In 2022 and 2021, the carrying amounts of leased land and improvements and office space are 644.9 million and 13.6 million and 581.7 million and 12.4 million, respectively.
The distribution of the amortization of the Group’s right-of-use assets follow:
The carrying amount of lease liability and the movement during the period are as follows:
The following are the amounts recognized in consolidated statement of income:
in
109 EEI 2022 Annual Report | Audited Financial Statements *SGVFS163860*
2022 2021 Balances at beginning of the year ₱594,107,160 ₱695,475,235 Additions during the year 144,321,648 10,870,738 Amortization of right-of-use assets (79,919,917) (112,238,813) Balances at end of the year ₱658,508,891 ₱594,107,160
2022 2021 Cost of sales (Note 21) ₱1,362,268 ₱1,073,588 Cost of services (Note 21) 22,071,035 53,825,306 Selling and administrative expenses (Note 22) 56,486,614 57,339,919 ₱79,919,917 ₱112,238,813
2022 2021 Balances at beginning of the year ₱487,588,756 ₱569,565,423 Additions during the year 293,778,577 10,870,738 Interest expense 39,236,392 40,867,111 Payments (100,213,436) (133,714,516) Balances at end of the year 720,390,289 487,588,756 Less: current portion 102,592,918 52,319,204 Noncurrent portion ₱617,797,371 ₱435,269,552
2022 2021 2020 Amortization of right-of-use assets ₱79,919,917 ₱112,238,813 ₱133,517,549 Interest expense on lease liabilities 39,236,292 40,867,111 50,991,135 Expenses relating to short-term leases (included
cost of services) 385,289,848 598,074,448 500,768,669 Expenses relating to leases of low-value assets (included in general and administrative expenses) 12,528,360 8,440,238 13,144,311 ₱516,974,417 ₱759,620,610 ₱698,421,664
Shown below is the maturity analysis of the undiscounted lease payments for years ended December 31 as follow:
15. Investment Properties
The rollforward analyses of this account follow:
Land classified as investment properties include parcels of land located in Benguet, Cavite, Nueva Ecija, and Bulacan with carrying values of ₱6.6 million, ₱0.5 million, ₱0.2 million and ₱7.0 million, respectively, as of December 31, 2022. Carrying values of parcels of land located in Benguet, Cavite, Nueva Ecija, Bulacan and memorial lots in Las Piñas were ₱6.6 million, ₱0.5 million, ₱0.2 million, ₱7.0 million and ₱0.2 million, respectively, as of December 31, 2021.
As of December 31, 2022, the fair value of the land in Benguet amounted to ₱20.8 million, which was determined based on valuation performed by an independent SEC accredited appraiser whose report was dated December 31, 2022. The fair value of the land was determined using the market approach which is a valuation technique that uses prices and other relevant information generated by market transactions involving identical or comparable assets and adjusted to reflect differences on size, and shape (Level 3 –Significant unobservable inputs).
As of December 31, 2022, the fair value of the land in Cavite amounted to ₱2.5 million, which was determined using the market approach (Level 3 – Significant unobservable inputs).
Rental income derived from the investment properties amounted to nil, ₱0.3 million and ₱1.2 million in 2022, 2021 and 2020, respectively (Note 24). Total direct operating expenses incurred in relation to these investment properties amounted to ₱0.4 million in 2020.
In 2022 and 2021, the Group sold parcels of land located in Las Pinas City for ₱0.2 million and ₱0.08 million, respectively. The Group recognized gain of ₱0.03 million and ₱0.01 million, respectively, in relation to the sale.
110
2022 2021 1 year ₱129,675,676 ₱85,417,970 more than 1 years to 2 years 127,872,244 87,168,196 more than 2 years to 3 years 134,225,699 90,569,092 more than 3 years to 4 years 140,787,158 95,097,547 more than 5 years 276,608,116 341,048,238 Total ₱809,168,893 ₱699,301,043
2022 2021 Cost Balances at beginning of year ₱14,496,211 ₱14,562,211 Disposals (200,500) (66,000) Net book value at end of year ₱14,295,711 ₱14,496,211
EEI 2022 Annual Report | Audited Financial Statements
16. Other Noncurrent Assets
This account consists of:
In December 2022, the Parent Company entered into an agreement with EEI-RFI granting a loan amounting to ₱1.2 billion to the latter. The loan is to be paid in 10 annual installments commencing in 2025 with annual interest rate of 5%.
Deferred input VAT pertains to unamortized input VAT on the purchase of capital goods exceeding ₱1.0 million.
Movement in allowance for expected credit loss on interest-bearing trade receivables for the year ended December 31:
17. Bank Loans
The Group availed of several unsecured short-term bank loans with a number of local banks. These loans will mature within one year with annual interest rates ranging from 4.625% - 6.5% and 3.50% - 5.50% in 2022 and 2021, respectively.
Movements in this account during the years ended December 31 follow:
Interest expense incurred on these loans amounted to ₱85.9 million, ₱193.3 million and ₱347.1 million in 2022, 2021 and 2020, respectively.
111 EEI 2022 Annual Report | Audited Financial Statements *SGVFS163860*
2022 2021 Loans receivable (Note 5,13,14 and 26) ₱1,200,000,000 ₱‒Creditable withholding taxes (Note 10) 857,168,029 924,336,073 Deferred input VAT 15,185,271 122,863,374 Software 4,670,000 ‒Receivable from DANECO ‒ 54,570,275 Others 28,597,629 8,926,920 2,105,620,929 1,110,696,642 Allowance for expected credit loss (1,637,755) (1,637,755) ₱2,103,983,174 ₱1,109,058,887
2022 2021 Balances at beginning of year ₱1,637,755 ₱7,406,020 Recoveries ‒ (5,768,265) Balances at end of year ₱1,637,755 ₱1,637,755
2022 2021 Balances at the beginning of year ₱3,250,000,000 ₱5,015,000,000 Availment 12,462,676,041 10,000,000,000 Payments (12,312,676,041) (11,765,000,000) Balances at the end of year ₱3,400,000,000 ₱3,250,000,000
18. Accounts Payable and Other Liabilities
This account consists of:
Accrued expenses consist of:
Accounts payable are non-interest bearing and generally settled on 30 to 90 days terms.
Deferred output taxes pertain to VAT on sale of services on credit. Once collected, the amount will be transferred to output VAT payable.
Retention payable are amounts that the Group deducts from its subcontractors’ billings and are usually paid within 12 months.
Other accrued expenses mainly consist of provisions, accrual for professional fees, outside services, utilities and other expenses that are expected to be settled within one year. Provisions were provided for claims by third parties in the ordinary course of business. As allowed by PAS 37, Provisions, Contingent Liabilities and Contingent Assets, only a general description is provided as the disclosure as additional details beyond the present disclosures may prejudice the Group’s position and negotiation strategies with respect to these matters.
Other noncurrent liabilities
Other noncurrent liabilities pertain to noncurrent portion of retention payables that are expected to be settled beyond one year from the end of reporting period. As of December 31, 2022 and 2021, other noncurrent liabilities amounted to ₱128.2 million and ₱242.9 million, respectively.
19. Long-term Debt
This account consists of:
112
2022 2021 Accounts payable ₱3,692,597,950 ₱4,280,614,961 Deferred output taxes 429,715,967 320,604,220 Retention payable 417,645,450 420,465,848 Accrued expenses 322,590,471 232,613,718 Withholding taxes and other statutory liabilities 124,353,647 53,459,825 Advances from joint venture partners 32,381,854 32,381,854 Others 125,193,123 119,932,159 ₱5,144,478,462 ₱5,460,072,585
2022 2021 Accrued salaries and wages ₱28,493,175 ₱23,702,410 Accrued interest 34,732,382 42,185,746 Other accrued expenses 259,364,914 166,725,562 ₱322,590,471 ₱232,613,718
2022 2021 Fixed-rate corporate promissory notes ₱4,607,632,882 ₱8,078,421,328 Fixed-rate term loan 158,552,929 184,795,447 4,766,185,811 8,263,216,775 Less current portion 3,193,317,241 3,526,205,077 ₱1,572,868,570 ₱4,737,011,698 EEI 2022 Annual Report | Audited Financial Statements
Fixed-rate corporate promissory notes
In 2014, the Parent Company received ₱500.0 million proceeds from the issuance of unsecured fixedrate corporate promissory notes to a local bank that bear annual interest of 5.2%. Subsequently, the bank reduced the interest rate to 4.8% effective May 26, 2015 until maturity. The promissory notes mature within seven (7) years from the date of issuance. The loan was fully paid in 2021.
On June 15, 2015, the Parent Company received ₱1,000 million proceeds from the issuance of an unsecured fixed-rate corporate promissory note to a local bank that bears annual interest of 4.8%. The promissory note matures within seven (7) years from the date of issuance. The loan was fully paid in March 31, 2021.
On May 23, 2018, the Parent Company received ₱2,000 million proceeds from the issuance of an unsecured fixed-rate corporate promissory note to a local bank that bears annual interest of 4.8%. The promissory note matures within five (5) years from the date of issuance.
On November 11, 2019, the Parent Company received ₱909 million proceeds from the issuance of an unsecured fixed-rate corporate promissory note to a local bank that bears annual interest of 3.9%. The promissory note matures within three (3) years from the date of issuance. The loan was fully paid in November 11, 2022.
On October 15, 2020, the Parent Company received ₱3,000 million proceeds from the issuance of an unsecured fixed-rate corporate promissory note to a local bank that bears annual interest of 3.5%. The promissory note matures within three (3) years from the date of issuance.
On November 23, 2020, the Parent Company received ₱1,000 million proceeds from the issuance of an unsecured fixed-rate corporate promissory note to a local bank that bears annual interest of 3.3%. The promissory note matures within three (3) years from the date of issuance.
On March 22, 2021, the Parent Company received ₱1,500 million proceeds from the issuance of an unsecured fixed-rate corporate promissory note to a local bank that bears annual interest of 4.5%. The promissory note matures within three (3) years from the date of issuance.
On October 7, 2021, the Parent Company received ₱2,500 million proceeds from the issuance of an unsecured fixed-rate corporate promissory note to a local bank that bears annual interest of 4.8%. The promissory note matures within three (3) years from the date of issuance.
On December 3, 2021, the Parent Company received ₱1,500 million proceeds from the issuance of an unsecured fixed-rate corporate promissory note to a local bank that bears annual interest of 3.4%. The promissory note matures within three (3) years from the date of issuance.
The proceeds from the promissory notes were used for general corporate requirements.
Interest expense incurred on these corporate notes amounted to ₱268.5 million, ₱229.0 million and ₱58.5 million in 2022, 2021 and 2020, respectively.
Term loan
On August 28, 2015, EEI Power availed an unsecured ₱500.0 million long-term loan from a local bank that bears an annual interest of 4.8%. The loan is payable in equal quarterly installments and will mature on August 27, 2022. The loan was fully paid in 2021.
On August 12, 2016, BiotechJP obtained an unsecured five-year long-term loan from Biotech Japan Corporation that bears an annual interest rate of 0.05%. The loan is payable at maturity date, including accrued interest.
113 EEI 2022 Annual Report | Audited Financial Statements *SGVFS163860*
On October 1, 2018, the BiotechJP obtained an unsecured 4.5 year long-term loan from Biotech Japan Corporation that bears an annual interest rate of 0.30%. The loan is payable in five equal annual installments and will mature on March 31, 2021.
In 2019, BiotechJP availed an unsecured ₱47.60 million long-term loan from Biotech Japan Corporation that bears an annual interest of 0.30%. The loan is payable in equal semi-annual installments and will mature on September 13, 2030.
On April 24, 2020, BiotechJP availed an unsecured ₱21.8 million long-term loan from a foreign bank that bears an annual interest based from floating rate. In absence of quotations, if the then-current Floating Rate is USD LIBOR and no rate is quoted pursuant to the definition of USD LIBOR on any Quotation Date, the applicable Floating Rate shall be the average (rounded upwards, if necessary, to the nearest one-sixteenth of one per cent (1/16%) of the rates per annum. The loan is payable in 18 equal semi-annual installments and will mature on September 13, 2030.
On September 25, 2020, BiotechJP availed an unsecured ₱92.3 million long-term loan from Biotech Japan Corporation that bears an annual interest of 3.0%. The loan is payable in equal semi-annual installments and will mature on March 31, 2030.
Interest expense incurred on these corporate notes amounted to ₱4.5 million, ₱6.3 million and ₱9.6 million in 2022, 2021 and 2020, respectively.
Movements in the account follow:
The aforementioned loans require the Group to maintain certain financial ratios such as debt to equity ratio and current ratio calculated based on stipulation with the lender banks. As of December 31, 2022 and 2021, the Group was in compliance with the loan covenants.
114
December 31, 2022 December 31, 2021 Promissory Note Term Loan Total Promissory Note Term Loan Total Balance at beginning of period ₱8,125,106,164 ₱184,689,283 ₱8,309,795,447 ₱5,257,724,097 ₱318,063,237 ₱5,575,787,334 Proceeds – – – 5,500,000,000 – 5,500,000,000 Payments (3,500,106,164) (26,136,354) (3,526,242,518) (2,632,724,097) (133,267,790) (2,765,991,887) 4,625,000,000 158,552,929 4,783,552,929 8,125,000,000 184,795,447 8,309,795,447 Less: Transaction costs Balance at beginning of period 46,578,672 – 46,578,672 27,760,009 – 27,760,009 Additions – – – 42,315,755 – 42,315,755 Amortization (29,211,554) – (29,211,554) (23,497,092) – (23,497,092) Balance at end of period 17,367,118 – 17,367,118 46,578,672 – 46,578,672 Balance at end of period 4,607,632,882 158,552,929 4,766,185,811 8,078,421,328 184,795,447 8,263,216,775 Less current portion 3,153,445,912 39,871,329 3,193,317,241 3,466,857,730 59,347,347 3,526,205,077 ₱1,454,186,970 ₱118,681,600 ₱1,572,868,570 ₱4,611,563,598 ₱125,448,100 ₱4,737,011,698
EEI 2022 Annual Report | Audited Financial Statements
20. Revenue from Contracts with Customers
Set out below is the disaggregation of the Group’s revenue from contracts with customers for the years ended December 31:
The Group recognized revenue amounting to ₱9.2 billion, ₱12.4 billion and ₱12.2 billion in 2022, 2021 and 2020, respectively, from performance obligations partially satisfied in the previous periods.
Performance obligations
Information about the Group’s performance obligations are summarized below:
The transaction price allocated to the remaining performance obligations of the Group (unsatisfied or partially unsatisfied) in connection with the construction contracts that have an original expected duration of more than one year (otherwise known as backlogs) as at December 31 are as follows:
115 EEI 2022 Annual Report | Audited Financial Statements *SGVFS163860*
2022 2021 2020 Construction contracts ₱12,528,768,650 ₱14,942,556,591 ₱12,940,916,871 Power sales 882,809,647 97,052,592 –Manpower services 624,787,528 568,014,461 595,986,180 Merchandise sales 271,515,791 385,868,524 187,975,881 Real estate sales 3,980,246 14,029,663 32,735,487 Power generation – – 13,991,023 Others 340,325,203 142,183,412 109,713,580 ₱14,652,187,065 ₱16,149,705,243 ₱13,881,319,022 Construction contracts 2022 2021 2020 Building ₱5,751,318,973 ₱6,825,132,430 ₱3,988,256,546 Infrastructure 2,239,205,309 5,048,584,055 6,378,382,769 Electro-mechanical 1,195,224,661 642,042,623 1,990,184,632 Industrial 3,343,019,707 2,426,797,483 584,092,924 ₱12,528,768,650 ₱14,942,556,591 ₱12,940,916,871
2022 2021 2020 Within one year ₱12,454,978,158 ₱12,448,951,193 ₱12,653,212,583 More than one year 19,547,810,287 18,517,252,543 30,942,788,536 ₱32,002,788,445 ₱30,966,203,736 ₱43,596,001,119
21. Costs of Sales and Services
This account consists of:
In a move to contain the COVID-19 outbreak, the Philippine Government has placed the entire island of Luzon under enhanced community quarantine until May 15, 2020. Effective May 16, 2020, some provinces in Luzon were placed under general community quarantine while the National Capital Region (NCR) was placed under modified enhanced community quarantine. During the period of enhanced community quarantine, all construction activities, whether related to private and government projects, were suspended. During the period of suspension of construction activities, the Group continued to incur costs of 1.03 billion which includes continued payment of salaries and wages of its construction workers at project sites. These costs were presented as part of “Personnel Expenses” under “Cost of Sales and Services” in the 2020 consolidated statement of income.
116
2022 2021 2020 Cost of sales ₱252,725,096 ₱340,531,890 ₱191,262,219 Cost of services 12,417,054,064 14,053,756,433 15,902,404,596 ₱12,669,779,160 ₱14,394,288,323 ₱16,093,666,815 Cost of Sales 2022 2021 2020 Merchandise sales Inventories ₱248,230,515 ₱318,257,368 ₱159,529,808 Personnel expenses – 9,506,042 5,957,078 Amortization (Note 14) 1,362,268 1,073,588 1,325,134 Others – 4,180,200 1,984,949 Real estate sales (Note 9) 3,132,313 7,514,692 22,465,250 ₱252,725,096 ₱340,531,890 ₱191,262,219 Cost of Services 2022 2021 2020 Personnel expenses ₱5,855,125,808 ₱7,115,840,514 ₱7,312,953,617 Equipment costs and others 2,393,037,221 3,079,255,910 3,182,242,114 Materials 2,891,914,985 3,338,692,265 4,837,320,506 Power sales 801,248,304 87,100,486 –Depreciation and amortization (Notes 13 and 14) 368,994,980 424,354,214 555,538,533 Others 106,732,766 8,513,044 14,349,826 ₱12,417,054,064 ₱14,053,756,433 ₱15,902,404,596
EEI 2022 Annual Report | Audited Financial Statements
22. Selling and Administrative Expenses
This account consists of:
Others pertain to the various administrative expenses that the Group incurs in support of its day-to-day operations including technical support, postage, office upkeep, and other charges.
The distribution of the depreciation and amortization expense follows:
117 EEI 2022 Annual Report | Audited Financial Statements *SGVFS163860*
2022 2021 2020 Personnel expenses ₱831,079,427 ₱778,325,391 ₱765,341,411 Depreciation and amortization (Notes 13 and 14) 176,318,781 172,869,804 209,235,330 Repairs and maintenance 95,735,184 74,672,541 52,396,105 Travel and transportation 86,842,216 57,462,797 52,156,489 Professional fees 60,640,435 46,853,311 56,188,239 Utilities 52,706,638 39,227,172 41,231,261 Outside services 51,328,580 51,768,749 40,065,087 Taxes and licenses 47,365,909 72,286,059 166,994,059 Training 42,412,551 18,650,105 15,969,836 Bid expenses 14,980,963 9,761,018 5,850,962 Provision for (recovery of) allowance for expected credit loss - net (Notes 6, 7, 8, 10 and 16) 14,344,776 4,519,824 89,338,264 Rent (Note 14) 12,528,360 8,440,238 13,144,311 Insurance 10,404,084 12,493,854 12,835,753 Advertising 5,852,309 3,914,675 8,588,733 Supplies 5,079,848 6,611,467 3,740,593 Management fee 4,614,336 6,190,452 3,342,857 Entertainment, amusement and recreation 3,236,418 1,659,638 2,641,137 Food, meals and others 2,821,251 3,035,011 7,378,967 Donations 2,119,451 22,511,546 7,568,695 Research and development 354,186 386,160 461,887 Provision for (recovery of) inventory obsolescence (Note 9) (14,301,872) – 13,220,101 Others 132,422,046 128,927,528 128,921,433 ₱1,638,885,877 ₱1,520,567,340 ₱1,696,611,510
2022 2021 2020 Property and equipment (Note 13) ₱119,832,167 ₱115,529,885 ₱148,772,611 Right-of-use asset (Note 14) 56,486,614 57,339,919 60,462,719 ₱176,318,781 ₱172,869,804 ₱209,235,330
The distribution of the provision for (recovery of) allowance for expected credit loss - net follows:
Other Income - Net
In 2022, the Group sold parcels of land located in Bauan, Batangas for ₱1.2 billion. The Group recognized gain on disposal amounting to ₱341.3 million.
In 2022 and 2021, the Group sold parcels of land located in Las Pinas City for ₱0.2 million and ₱0.08 million, respectively. The Group recognized gain of ₱0.03 million and ₱0.01 million in relation to the sale in 2022 and 2021, respectively.
118
2022 2021 2020 Cash and cash equivalents (Note 6) (₱1,952) ₱2,130 ₱3,007 Receivables (Note 7) (12,771,964) 5,080,223 37,436,624 Contract assets (Note 8) (11,817,837) 5,205,736 42,639,672 Other current assets (Note 10) 38,936,529 ‒ 11,548,630 Other noncurrent assets (Note 16) ‒ (5,768,265) (2,289,669) ₱14,344,776 ₱4,519,824 ₱89,338,264 23. Interest Income This account consists of: 2022 2021 2020 Cash in banks and cash equivalents (Note 6) ₱33,849,869 ₱5,455,892 ₱6,276,562 Interest-bearing trade receivables (Note 7) 1,311,765 1,923,369 2,288,438 Receivable from EEI-RFI (Notes 26) ‒ 342,262 3,237,599 Receivable from related parties (Note 26) ‒ ‒ 5,152,791 ₱35,161,634 ₱7,721,523 ₱16,955,390
This account consists of: 2022 2021 2020 Gains (Losses) on disposal of: Property and equipment ₱343,765,609 ₱4,248,583 ₱7,316,671 Investment properties (Note 15) 32,300 14,750 204,500 Scrap 770,989 774,123 1,786,719 Dividend income (Note 12) 4,004,599 50,987,679 37,058,954 Rent income 442,544 1,053,123 1,152,085 Tax refund/discount 374,470 815,329 249,490 Others 26,285,856 20,434,518 18,636,961 ₱375,676,367 ₱78,328,105 ₱66,405,380
24.
EEI 2022 Annual Report | Audited Financial Statements
In 2022 and 2021, the Group also sold various property and equipment for total proceeds of ₱221.0 million and ₱99.1 million, respectively. The Group recognized gain of ₱2.5 million and ₱4.2 million in relation to the sale in 2022 and 2021, respectively.
25. Income Taxes
The components of the Group’s deferred tax assets and liabilities follow:
119 EEI 2022 Annual Report | Audited Financial Statements *SGVFS163860*
2022 2021 Deferred tax assets recognized in profit or loss: Contract deposits ₱1,176,647,512 ₱– Allowance for expected credit losses 49,100,192 40,654,087 NOLCO 33,467,111 1,059,762,672 Excess of right-of-use assets over lease liability – net 20,033,113 –Unamortized past service cost 17,953,344 22,296,264 Excess MCIT 5,052,529 17,811,754 Unrealized foreign exchange losses 3,533,605 – Allowance for inventory obsolescence 1,893,083 5,461,493 ₱1,307,680,489 ₱1,145,986,270 Deferred liabilities recognized in profit or loss: Excess of lease liability over right-of-use assets – net ₱– (₱26,629,601) Unrealized foreign exchange gains – (385,847) Capitalized borrowing cost (58,691) (81,351) Net retirement liabilities (1,797,055) (26,134,003) Deferred transaction costs (4,341,779) (11,644,668) Others (679,050) (5,302,692) (₱6,876,575) (₱70,178,162) ₱1,300,803,914 ₱1,075,808,108 Deferred tax assets recognized in other comprehensive income: Remeasurement loss (gain) on defined benefit plans (11,325,061) 36,586,493 Deferred tax assets – net ₱1,289,478,853 ₱1,112,394,601 2022 2021 Reconciliation of net deferred tax assets follows: Balance at beginning of year ₱1,112,394,601 ₱1,471,146,110 Tax income (expense) recognized in: Profit and loss 224,995,806 (240,938,396) Other comprehensive income (47,911,554) (117,813,113) Balance at end of year ₱1,289,478,853 ₱1,112,394,601
The Group did not recognize deferred tax assets on the following future deductible differences as management assessed that it is not probable that sufficient taxable profit will be available to allow all or part of the deferred tax assets to be utilized.
On September 30, 2020, the Bureau of Internal Revenue (BIR) issued Revenue Regulations (RR) No. 252020 implementing Section 4 (bbbb) of “Bayanihan to Recover As One Act” which states that the NOLCO incurred for taxable years 2020 and 2021 can be carried over and claimed as a deduction from gross income for the next five (5) consecutive taxable years immediately following the year of such loss.
As of December 31, 2022, the Group has NOLCO and excess MCIT which are deferred tax assets that can be claimed as deductions against future taxable income and tax payable, respectively, as follows:
MCIT:
The Group did not recognize any deferred tax asset in relation to unexpired share options as this has negative intrinsic value.
The Group recognized deferred tax liability of ₱128.5 million and ₱127.9 million pertaining to the accumulated fair value gain on equity investments at FVOCI as of December 31, 2022 and 2021, respectively.
120
2022 2021 NOLCO ₱ 55,398,841 ₱ 89,022,926 Allowance for inventory obsolescence 192,344 4,654,325 MCIT 115 2,354,618 Others ₱ 296,905 ‒
NOLCO: Year Incurred Available Until Amount Applied Expired Balance Tax Effect 2019 2022 ₱193,545 ₱‒ ₱193,545 ₱‒ ₱‒2020 2025 4,308,154,633 (4,225,727,847) ‒ 82,426,786 20,606,696 2021 2026 322,502,359 (267,935,856) ‒ 54,566,503 13,641,626 2022 2025 52,273,996 ‒ ‒ 52,273,996 13,068,499 ₱4,683,124,533 (₱4,493,663,703) ₱193,545 ₱189,267,285 ₱47,316,821
Year Incurred Available Until Amount Applied Expired Balance 2019 2022 ₱2,553,503 ₱‒ ₱2,553,503 ₱‒2020 2023 1,583,938 ‒ ‒ 1,583,938 2021 2024 16,395,032 14,764,695 ‒ 1,630,337 2022 2025 1,838,369 ‒ ‒ 1,838,369 ₱22,370,842 ₱14,764,695 ₱2,553,503 ₱5,052,644
EEI 2022 Annual Report | Audited Financial Statements
The reconciliation between the statutory and effective income tax rates follows:
Republic Act No. 11534 otherwise known as the Corporate Recovery and Tax Incentives for Enterprises Act or CREATE
President Rodrigo Duterte signed into law on March 26, 2021 the Corporate Recovery and Tax Incentives for Enterprises (CREATE) Act to attract more investments and maintain fiscal prudence and stability in the Philippines. Republic Act (RA) 11534 or the CREATE Act introduces reforms to the corporate income tax and incentives systems. It takes effect 15 days after its complete publication in the Official Gazette or in a newspaper of general circulation or April 11, 2021.
The following are the key changes to the Philippine tax law pursuant to the CREATE Act which have an impact on the Group
• Effective July 1, 2020, regular corporate income tax (RCIT) rate is reduced from 30% to 25% for domestic and resident foreign corporations. For domestic corporations with net taxable income not exceeding Php5 million and with total assets not exceeding Php100 million (excluding land on which the business entity’s office, plant and equipment are situated) during the taxable year, the RCIT rate is reduced to 20%.
• Minimum corporate income tax (MCIT) rate reduced from 2% to 1% of gross income effective July 1, 2020 to June 30, 2023.
• Imposition of improperly accumulated earnings tax (IAET) is repealed.
As clarified by the Philippine Financial Reporting Standards Council in its Philippine Interpretations Committee Q&A No. 2020-07, the CREATE Act was not considered substantively enacted as of December 31, 2020 even though some of the provisions have retroactive effect to July 1, 2020. The passage of the CREATE Act into law on March 26, 2021 is considered as a non-adjusting subsequent event. Accordingly, current and deferred taxes as of and for the year ended December 31, 2020 continued to be computed and measured using the applicable income tax rates as of December 31, 2020 (i.e., 30% RCIT / 2% MCIT) for financial reporting purposes. Current and deferred taxes as of and for the year ended December 31, 2021 were computed and measured using the new tax rates in 2021.
The effect of CREATE Act in 2020 of a lower provision for current income tax for the year ended December 31, 2020 and lower income tax payable as of December 31, 2020, which was reflected in the Group’s 2020 annual income tax return was only recognized for financial reporting purposes in the 2021 consolidated financial statements. Also, the effect in 2020 of lower deferred tax assets and liabilities as of December 31, 2020 and provision for deferred tax for the year then ended of ₱245.2 million were recognized for financial reporting purposes only in the 2021 consolidated financial statements.
121 EEI 2022 Annual Report | Audited Financial Statements *SGVFS163860*
2022 2021 2020 Statutory income tax rate 25.0% 25.0% 30.0% Add (deduct) reconciling items: Equity in net earnings (losses) of associates and joint ventures 9.8 (8.5) 1.68 Income subjected to final taxes at lower rates (3.1) (0.2) 0.12 Impact of CREATE – 28.0 –Others (5.9) (5.4) 6.50 Effective income tax rate 25.8% 38.9% (38.3%)
26. Related Party Transactions
122
(In Thousands of Philippine Peso) 2022 Related party Transaction Amount / Volume Outstanding Receivable/ (Payable) Terms Conditions Parent company Rendering of janitorial services ₱22,039 ₱8,493 Non-interest bearing Unsecured, no impairment Purchase of management services (8,186) (1,746) Non-interest bearing Unsecured Associate Rendering of services ‒ 125,258 Non-interest bearing Unsecured, no impairment Extension of advances ‒ (676) Non-interest bearing Unsecured Availment of advances ‒ (1,562) Non-interest bearing Unsecured Entities under the common control Bank deposits 12,887 1,088,213 Interest bearing; 0.15% -0.45% per annum Unsecured, no impairment Revenue from construction services 225,581 22,432 Non-interest bearing Unsecured, no impairment Revenue from service contract ‒ 19,556 ‒Unsecured, no impairment Rendering of janitorial services 381,887 61,635 ‒Unsecured, no impairment Sale of supplies 2 ‒ ‒ ‒Other related parties Lease of property ‒ (971) Non-interest bearing Unsecured Rendering of construction services ‒ 1,387 Non-interest bearing Unsecured, no impairment Sale of property 22,039 8,493 Non-interest bearing Unsecured, no impairment Extension of advances (8,186) (1,746) Non-interest bearing Unsecured Extension of advances ‒ 125,258 Non-interest bearing Unsecured, no impairment Sale of property 343,077 ‒ Non-interest bearing Unsecured Loan 1,200,000 1,200,000 Interest bearing, 5% per annum Unsecured, no impairment Due from related parties ‒ ₱196,097 Due to related parties ₱2,533 Loans receivable ₱1,200,000 (In Thousands of Philippine Peso) 2021 Related party Transaction Amount / Volume Outstanding Receivable/ (Payable) Terms Conditions Parent company Rendering of janitorial services ₱16,167 ₱9,709 Non-interest bearing Unsecured, no impairment Purchase of management services (4,286) (2,400) Non-interest bearing Unsecured Associate Rendering of services ‒ 30,070 Non-interest bearing Unsecured, no impairment Extension of advances ‒ 66,345 Non-interest bearing Unsecured, no impairment Availment of advances ‒ (1,151) Non-interest bearing Unsecured Entities under the common control Bank deposits 4,820 1,922,895 Interest bearing; 0.20% -0.25% per annum Unsecured, no impairment Revenue from construction services 44,842 63,149 Non-interest bearing Unsecured, no impairment Revenue from service contract 13,966 6,042 ‒ Unsecured, no impairment Extension of advances Non-interest bearing Unsecured, no impairment Rendering of janitorial services 350,970 46,012 ‒ Unsecured, no impairment Forward EEI 2022 Annual Report | Audited Financial Statements
a. In 2021, the Parent Company was contracted by San Lorenzo Ruiz Investment Holdings and Services, Inc. for the Demolition and Excavation of The Yuchengco Centre Phase with contract price amounted to ₱168.75 million. The outstanding receivables amounted to ₱12.3 million as of December 31, 2022.
b. In 2019, EPC was contracted by RCBC Realty Corporation, for the Supply of Labor, Tools and Materials and Installation of the Additional Low Voltage Switchgear and Busway System for Phase 2 Electrical System Upgrade which commence in April 2019 with contract price amounted to ₱260.39 million. The outstanding trade receivables amounted to ₱19.6 million as of December 31, 2022 (nil in 2021).
c. In 2018, the Parent Company was contracted by Malayan Education Systems, Inc. for the General Construction Works, Excavation, Structural, Civil, Architectural, MEPF Works and Attendance of Mapua Makati Building with contract price amounted to ₱891.0 million. The project is 100% and 98.9% completed as of December 31, 2021 and 2020, respectively. The outstanding receivables amounted to ₱10.1 million and ₱63.1 million, including retention receivables of nil and ₱56.4 million as of December 31, 2022 and December 31, 2021, respectively.
d. In January 2007, the Parent Company and EEI-RFI entered into operating lease agreements for land and improvements located in Bagumbayan, Quezon City. The lease terms are for one year and renewable every year with 5% increase effective January 1, 2014.
e. In December 2022, the Parent Company entered into a sale and leaseback transaction with EEI-RFI, a trustee of the Parent Company employees retirement fund (the Fund) for parcels of land located in Bauan, Batangas. The related lease is for a term of 5 years, with an annual escalation rate of 5%.
f. In December 2022, the Parent Company extended a loan to EEI-RFI amounting to ₱1.2 billion payable in 10 annual installments commencing in 2025. The loan bears an annual interest of 5%.
g. The Group’s retirement plan assets include investments in equity securities of the following entities:
Loss arising from investments in the shares of stocks of the aforementioned companies amounted to ₱0.03 million and ₱3.7 million in 2022 and 2021, respectively. Meanwhile, gain arising from investments in the shares of stocks of the aforementioned companies amounted to ₱3.8 million in 2022.
123 Sale of supplies 10 ‒ ‒‒Other related parties Lease of property (74,464) ‒ Non-interest bearing Unsecured Rendering of construction services 144 Interest bearing, 5% per annum Unsecured Sale of property 342 ‒ Interest bearing, 5% per annum Unsecured Extension of advances ‒ (971) Non-interest bearing Unsecured Extension of advances ‒ 2,217 Non-interest bearing Unsecured, no impairment Due from related parties ₱154,352 Due to related parties ₱2,121 Loans receivable ₱‒
2022 2021 Rizal Commercial Banking Corporation ₱24,350,565 ₱20,051,560 House of Investments, Inc. 143,200 120,700 EEI Corporation 20,583 40,619 ₱24,514,348 ₱20,212,879
EEI 2022 Annual Report | Audited Financial Statements *SGVFS163860*
h. The remuneration of members of key management personnel are as follows:
Outstanding balances at year-end are unsecured and settlement occurs in cash. There have been no guarantees provided or received for any related party receivables or payables. These mainly consist of advances and reimbursement of expenses. The Group has not recognized any impairment on amounts due from related parties for the years ended December 31, 2022 and 2021.
This assessment is undertaken each financial year through a review of the financial position of the related party and the market in which the related party operates.
Identification, review and approval of related party transactions
Material related party transactions (MRPT) refers to any related party transactions, either individually, or in aggregate over a twelve (12)–month period with the same related party, amounting to ten percent (10%) or higher of the Group’s total consolidated assets based on its latest audited financial statements.
All material related party transactions shall be reviewed by the Group’s Corporate Governance Committee and approved by the BOD with at least 2/3 votes of BOD, with at least a majority vote of the independent directors. In case that the vote of a majority of the independent directors is not secured, the material related party transactions may be ratified by the vote of the stockholders representing at least 2/3 of the outstanding capital stock.
27. Retirement Benefits
The Group has a funded, noncontributory plan covering substantially all of its employees. The retirement funds are being administered and managed through EEI Corporation and Subsidiaries Retirement fund, with Rizal Commercial Banking Corporation (RCBC) as Trustee. The Group, however, reserves the right to discontinue, suspend or change the rates and amounts of its contributions at any time on account of business necessity or adverse economic conditions. The latest actuarial valuation report for the retirement plan was issued on February 20, 2023.
Under the existing regulatory framework, Republic Act 7641 requires a provision for retirement pay to qualified private sector employees in the absence of any retirement plan in the entity, provided however that the employee retirement benefits under any collective bargaining and other agreements shall not be less than those provided under law. The Law does not require minimum funding of plan.
The following table summarizes the components of retirement expense recognized in the Group’s consolidated statements of income and the amounts recognized in the Group’s consolidated statements of financial position for the plan:
The components of retirement expense follow:
124
2022 2021 2020 Short-term benefits ₱219,261,441 ₱291,710,419 ₱281,897,880 Post-employment benefits 18,176,707 36,290,371 26,237,470 ₱237,438,148 ₱328,000,790 ₱308,135,350
2022 2021 Current service cost ₱107,858,510 ₱149,055,885 Net interest cost 1,870,819 14,042,645 Retirement expense ₱109,729,329 ₱163,098,530 EEI 2022 Annual Report | Audited Financial Statements
Movements in the present value of defined benefit obligations follow:
Movements in the fair value of the plan assets follow:
The Group expects to contribute ₱50.0 million to the Fund in 2023.
The retirement assets and liabilities recognized in the consolidated statements of financial position as of December 31 follow:
125
2022 2021 Balance at beginning of year ₱1,245,743,079 ₱1,521,590,657 Current service cost 107,858,510 149,055,885 Interest cost 61,697,280 57,167,322 Benefits paid (111,516,525) (80,627,815) Remeasurement (gains)/losses arising from: Experience adjustments (14,227,910) (94,817,886) Changes in financial assumptions (243,325,201) (306,625,084) Balance at end of year ₱1,046,229,233 ₱1,245,743,079
2022 2021 Balance at beginning of year ₱1,208,464,784 ₱1,147,833,169 Interest income included in net interest cost 59,826,461 43,124,677 Remeasurement loss (70,000,258) (28,591,929) Contributions 13,935,062 126,726,682 Benefits paid (113,805,251) (80,627,815) Balance at end of year ₱1,098,420,798 ₱1,208,464,784
2022 2021 Present value of defined benefit obligations ₱1,046,229,233 ₱1,245,743,079 Fair value of plan assets (1,098,420,798) (1,208,464,784) (₱52,191,565) ₱37,278,295
2022 2021 At January 1 ₱37,278,295 ₱373,757,488 Retirement expense 109,729,329 163,098,530 Remeasurement gain (187,552,853) (372,851,041) Contributions (13,935,062) (126,726,682) Benefit paid to employee already excluded in the valuation 2,288,726 –At December 31 (₱52,191,565) ₱37,278,295 EEI 2022 Annual Report | Audited Financial Statements *SGVFS163860*
Movements in the net retirement liabilities (assets) follow:
The major categories and fair value of the plan assets are as follows:
The plan assets are being held by the RCBC Trust and Investment Division. The investing decisions of the plan assets are made by the authorized officers of the Parent Company.
The plan assets consist of the following:
• Investment in government securities - includes investment in Philippine Retail Treasury Bonds (RTBs) and Fixed Rate Treasury Notes (FXTNs).
• Investment in equity securities - includes investment in common and preferred shares traded in the Philippine Stock Exchange.
• Investment in debt and other securities - includes investment in long-term debt notes and retail bonds.
• Cash and cash equivalents - include savings and time deposit.
• Interest and other receivables - pertain to interest and dividends receivable on the investments in the fund.
The management performs an Asset-Liability Matching Study (ALM) annually. The overall investment policy and strategy of the Group’s defined benefit plan is guided by the objective of achieving an investment return which, together with contributions, ensures that there will be sufficient assets to pay retirement benefits as they fall due while also mitigating the various risks of the plans.
Principal actuarial assumptions used to determine defined benefit obligations follow:
126
2022 2021 Investments in: Government securities 720,287,156 728,964,491 Equity securities 216,386,969 216,572,706 Debt and other securities 10,333,919 10,219,821 Cash and cash equivalents 143,020,326 250,926,751 Interest and other receivables 9,884,810 10,994,179 Accrued trust fees and other payables (1,492,382) (9,213,164) 1,098,420,798 1,208,464,784
2022 2021 2020 Discount rate Beginning of year 4.93%-4.99% 3.69%-3.78% 5.02%-5.02% End of year 7.04%-7.12% 4.93%-4.99% 3.69%-3.78% Salary increases Beginning of year 5.60% 6.50% 6.61% End of year 5.00% 5.60% 6.50% EEI 2022 Annual Report | Audited Financial Statements
The sensitivity analysis below has been determined based on reasonably possible changes of each significant assumption on the defined benefit obligation as at the reporting period, assuming all other assumptions were held constant:
Shown below is the maturity analysis of the undiscounted benefit payments:
The average duration of the defined benefit obligation ranges from 17-21 years and 18-23 years as of December 31, 2022 and 2021, respectively.
28. Stock Option Plan
The Parent Company’s stock option plan, as amended (Amended Plan), had set aside 35 million common shares for stock options available to regular employees, officers and directors of the Parent Company and its subsidiaries.
Under the Amended Plan, the option or subscription price must be equal to the book value of the Parent Company’s common stock but not less than 80% of the average market price quoted in PSE for five trading days immediately preceding the grant, but in no case less than the par value. The option or subscription price should be paid over a period of five years in 120 equal semi-monthly installments. Shares acquired under the Amended Plan are subject to a holding period of one year.
127 EEI 2022 Annual Report | Audited Financial Statements *SGVFS163860*
2022 2021 Increase (decrease) Effect on defined benefit obligation (in millions) Increase (decrease) Effect on defined benefit obligation (in millions) Discount rates +0.5% (32.60) +0.5% (4.26) -0.5% 35.82 -0.5% 4.72 Salary increase rates +1.0% 73.72 +1.0% 9.59 -1.0% (61.96) -1.0% (7.97)
2022 2021 Less than one year ₱189,825,705 ₱210,753,240 More than one to five years 354,714,896 328,543,661 More than five to ten years 599,439,287 580,237,044 More than 10 to 15 years 737,801,856 788,651,959 More than 15 to 20 years 865,675,934 886,081,765 More than 20 years 5,214,669,156 6,127,208,490
A summary of the plan availments is shown below.
The Parent Company opted to avail the exemption in PFRS 1, First-time Adoption of Philippine Financial Reporting Standards, from applying PFRS 2 upon adoption on January 1, 2005 as it allows non-adoption of PFRS 2 for equity instruments that were granted on or before November 7, 2002. Since 2000, there were no shares under the stock option plan that were granted, forfeited, exercised and expired.
No benefit expense is recognized relative to the shares issued under the stock option plan. When options are exercised, these are treated as capital stock issuances.
29. Capital Stock
The Group’s capital stock as at December 31 consists of the following:
Common shares
The Group’s common shares were registered with the Securities and Exchange Commission (SEC) on August 28, 1997. The total number of shares registered with SEC at that time was ₱2 billion with original issue price amounting to ₱1.0 per share. As of December 31, 2022 and 2021, the Group had 3,121 and 3,120 shareholders on record, respectively.
128
Number of Shares Shares allocated under the Original Stock Option Plan 19,262,500 Shares allocated under the Amended Stock Option Plan 15,737,500 Total shares allocated 35,000,000 Shares subscribed under the Original Stock Option Plan 19,365,815 Shares subscribed under the Amended Stock Option Plan 10,886,188 Total shares subscribed 30,252,003 Shares allocated at end of year ₱4,747,997
2022 Preferred Common Series A Series B Par value ₱1 ₱0.5 ₱0.5 Authorized 2,000,000,000 240,000,000 Issued and outstanding 1,036,281,485 15,000,000 45,000,000 2021 Preferred Common Series A Series B Par value ₱1 ₱0.5 ₱0.5 Authorized 2,000,000,000 240,000,000 Issued and outstanding 1,036,281,485 15,000,000 45,000,000
EEI 2022 Annual Report | Audited Financial Statements
Preferred shares
On July 15, 2021, the BOD of the Parent Company approved the following:
a) Offer of up to four billion pesos of preferred shares of EEI, with over-subscription option of up to two billion pesos of preferred shares, at an offer price of up to Php100 per share.
b) Amendment in 2nd paragraph of Article 7 of the Articles of Incorporation to reflect that all stockholders shall have no pre-emptive rights with respect to any shares of any other class or series of the present capital or on future or subsequent increases in capital.
c) Amendment in 4th paragraph of Article 7 of the Articles of Incorporation changing the characteristic of preferred shares of the Company from non-cumulative to cumulative.
d) Amendment in Article 6 of the Articles of Incorporation increasing the number of board of directors to eleven (11).
The above were approved by the shareholders through written assent on August 26, 2021.
On December 23, 2021, the Group issued and listed in PSE the non-convertible preferred shares generating net proceeds of ₱5.95 billion.
Cumulative dividends on preferred shares as at December 31, 2022 and 2021 amounted to ₱8.7 million.
The movement in capital stock and additional paid-in capital account as at December 31 follows:
Capital Management
The primary objective of the Group’s capital management is to ensure that it maintains healthy capital ratios in order to support its business and maximize shareholder value.
The Group manages its capital structure and makes adjustments to it, in light of changes in economic conditions. To maintain or adjust the capital structure, the Group may adjust the dividend payment to shareholders or issue new shares. No changes were made in the objectives, policies or processes for the years ended December 31, 2022 and 2021.
The Group considers total equity as its capital.
129 EEI 2022 Annual Report | Audited Financial Statements *SGVFS163860*
2022 Capital stock Additional paid-in capital Preferred Preferred Common Series A Series B Subtotal Common Series A Series B Subtotal Balance as at January 1 and December 31 ₱1,036,401,386 ₱7,500,000 ₱22,500,000 ₱1,066,401,386 ₱477,037,443 ₱1,481,252,389 ₱4,443,757,166 ₱6,402,046,998 2021 Capital stock Additional paid-in capital Preferred Preferred Common Series A Series B Subtotal Common Series A Series B Subtotal Balance as at January 1 ₱1,036,401,386 ₱‒ ₱‒ ₱1,036,401,386 ₱477,037,443 ₱‒ ₱‒ ₱477,037,443 Issuance ‒ 7,500,000 22,500,000 30,000,000 ‒ 1,492,500,000 4,477,500,000 5,970,000,000 Share issuance cost ‒ ‒ ‒ ‒ ‒ (11,247,611) (33,742,834) (44,990,445) Balance as at December 31 ₱1,036,401,386 ₱7,500,000 ₱22,500,000 ₱1,066,401,386 ₱477,037,443 ₱1,481,252,389 ₱4,443,757,166 ₱6,402,046,998
The Group monitors capital using a debt-to-equity ratio, which is total liabilities divided by total equity attributable to equity holders of Parent Company. The Group’s policy is to maintain a debt-to-equity ratio lower than 4:1 as at December 31, 2022 and 2021.
Equity attributable to the equity holders of Parent Company
30. Retained Earnings
On March 13, 2020, the Board of Directors of the Parent Company approved the declaration of cash dividends amounting of ₱0.40 per share or for a total of ₱414.51 million. On April 23, 2020, to ensure the Parent Company’s liquidity which will enable it to deal with the difficulties of the anticipated recession due to COVID-19 pandemic and also ultimately protect the best interest of the stockholders and the Parent Company’s employees, the Board of Directors cancelled the declaration of the said cash dividend.
Under the Tax Code of the Philippines, publicly listed companies are allowed to accumulate retained earnings in excess of capital stock and are exempt from improperly accumulated earnings tax.
The accumulated earnings of subsidiaries, associates and joint venture which are included in the Group’s retained earnings amounted to ₱2.8 billion and ₱2.9 billion as of December 31, 2022 and 2021, respectively, are not available for dividend declaration. Retained earnings are further restricted for payment of dividends to the extent of cost of treasury shares and deferred tax assets amounting to ₱1,311.4 and ₱1,149.7 million as of December 31, 2022 and 2021, respectively.
On June 22, 2018, the BOD of the Parent Company approved the appropriation of retained earnings of ₱4.0 billion for purchase of property and equipment as business expansion and manpower training program for the next three to five years. On December 4, 2020, the BOD of the Parent Company approved the reversal of the said appropriation to make funds available for the Parent Company’s ongoing projects, particularly in infrastructure.
In 2022, the BOD approved the declaration of dividends to Series A and B preferred shareholders of Php1.441025 and Php1.73485 per share, respectively, or totalling to Php398.7 million. The dividends were paid in 2022.
Retained earnings available for dividend declaration amounted to ₱0.7 billion and ₱0.6 billion as of December 31, 2022 and 2021, respectively.
The Group takes into consideration the financing requirements of its construction projects when deciding the amount to be declared as dividends.
31. Segment Information
For management purposes, the Group is organized into business units based on geographical location, which comprises of two main groupings as follows:
1. Domestic - all transactions and contracts entered in the Philippines
2. Foreign - all transactions and contracts entered outside the Philippines
● EEI Limited - incorporated in British Virgin Islands
● Clear Jewel Investments, Ltd. - incorporated in British Virgin Islands
● Nimaridge Investments, Limited - incorporated in British Virgin Islands
● EEI Corporation (Guam) - incorporated in the United States of America
● Al Rushaid Construction Company Limited - incorporated in the Kingdom of Saudi Arabia
130
2022 2021 Current liabilities ₱12,283,319,615 ₱12,728,110,384 Noncurrent liabilities 3,274,030,039 6,146,268,157 Total liabilities (a) 15,557,349,654 18,874,378,541
(b) 13,413,521,661 13,336,944,035 Debt to Equity Ratio (a/b) 1.16:1 1.42:1
EEI 2022 Annual Report | Audited Financial Statements
Management monitors construction revenue and segment net income for the purpose of making decision about resources allocation.
Segment reporting is consistent in all periods presented as there are no changes in the structure of the Group’s internal organization that will cause the composition of its reportable segment to change.
131 EEI 2022 Annual Report | Audited Financial Statements *SGVFS163860*
2022 Domestic Foreign Combined Elimination Consolidated Assets Current assets ₱13,823,768 ₱12,808,561 ₱26,632,329 (₱13,862,919) ₱12,769,410 Noncurrent assets 17,418,598 2,771,520 20,190,118 (3,985,411) 16,204,707 Total Assets ₱31,242,366 ₱15,580,081 ₱46,822,447 (₱17,848,330) ₱28,974,117 Liabilities Current liabilities ₱13,377,422 ₱10,070,427 ₱ 23,447,849 (₱11,164,529) ₱12,283,320 Noncurrent liabilities 3,344,236 2,197,730 5,541,966 (2,267,936) 3,274,030 Total Liabilities ₱16,721,658 ₱12,268,157 ₱28,989,815 (₱13,432,465) ₱15,557,350 Revenue ₱14,991,758 ₱16,013,263 ₱31,005,021 (16,352,834) ₱14,652,187 Direct cost (12,947,612) (16,772,104) (29,719,716) 17,049,937 (12,669,779) Selling and administrative expense (1,684,929) (276,474) (1,961,403) 322,517 (1,638,886) Interest expense (415,264) (177,570) (592,834) 194,712 (398,122) Foreign exchange gain 31,583 - 31,583 (11,850) 19,733 Share in equity in net earnings (losses) of associates and joint ventures 281,201 - 281,201 (387,053) (105,852) Interest and other income – net 996,117 217,195 1,213,312 (802,474) 410,838 Income (loss) before tax 1,252,854 (995,690) 257,164 12,955 270,119 (Provision for) benefit from income tax (66,286) 196,135 129,849 (199,661) (69,812) Net income (loss) ₱ 1,186,568 (₱799,555) ₱387,013 (₱186,706) ₱200,307 Other disclosures: Depreciation and amortization ₱546,676 ₱- ₱546,676 ₱- ₱546,676 Capital expenditure 196,669 - 196,669 - 196,669 Interest income 49,643 1 49,644 (14,482) 35,162 Investments in associates and joint ventures 1,848,494 1,341,435 3,189,929 - 3,189,929
Thousands of Philippine Peso) 2021 Domestic Foreign Combined Elimination Consolidated Assets Current assets ₱21,012,276 ₱7,829,630 ₱28,841,906 (₱8,376,958) ₱20,464,948 Noncurrent assets 12,697,973 3,179,593 15,877,566 (4,127,441) 11,750,125 Total Assets ₱33,710,249 ₱11,009,223 ₱44,719,472 (₱12,504,399) ₱32,215,073 Liabilities Current liabilities ₱13,471,662 ₱4,552,028 ₱18,023,690 (₱5,295,580) ₱12,728,110 Noncurrent liabilities 6,251,128 1,407,798 7,658,926 (1,512,658) 6,146,268 Total Liabilities 19,722,790 5,959,826 25,682,616 (6,808,238) 18,874,378 Forward
(In Thousands of Philippine Peso)
(In
132 2021 Domestic Foreign Combined Elimination Consolidated Revenue ₱16,380,153 ₱12,867,243 ₱29,247,396 (₱13,097,691) ₱16,149,705 Direct cost (14,596,707) (10,839,624) (25,436,331) 11,042,043 (14,394,288) Selling and administrative expense (1,590,838) (311,699) (1,902,537) 381,970 (1,520,567) Interest expense (444,455) (63,892) (508,347) 38,865 (469,482) Foreign exchange gain (loss) 7,069 ‒ 7,069 ‒ 7,069 Share in equity in net earnings (losses) of associates and joint ventures 265,284 ‒ 265,284 659,889 925,173 Interest and other income – net 129,365 75,328 204,693 (118,643) 86,050 Income before tax 149,871 1,727,356 1,877,227 (1,093,567) 783,660 Provision for income tax (291,121) (389,323) (680,444) 375,681 (304,763) Net income (loss) (₱141,250) ₱1,338,033 ₱1,196,783 (₱717,886) ₱478,897 Other disclosures: Depreciation and amortization ₱598,298 ₱‒ ₱598,298 ₱‒ ₱598,298 Capital expenditure 170,057 ‒ 170,057 ‒ 170,057 Interest income 25,481 1 25,482 (17,760) 7,722 Investments in associates and joint ventures 1,636,834 1,622,779 3,259,613 ‒ 3,259,613 2020 Domestic Foreign Combined Elimination Consolidated Assets Current assets ₱15,361,422 ₱5,215,041 ₱20,576,474 (₱4,638,640) ₱15,937,834 Noncurrent assets 14,606,181 1,238,386 15,844,567 (4,889,861) 10,954,706 Total Assets ₱29,967,603 ₱6,453,427 ₱36,421,041 (₱9,528,501) ₱26,892,540 Liabilities Current liabilities ₱14,332,584 ₱2,912,335 ₱17,244,919 (₱2,871,271) ₱14,373,648 Noncurrent liabilities 6,129,312 1,198,303 7,327,615 (1,216,177) 6,111,438 Total Liabilities 20,461,896 4,110,638 24,572,534 (4,087,448) 20,485,086 Revenue ₱14,416,682 ₱11,093,477 ₱25,510,159 (₱11,628,840) ₱13,881,319 Direct cost (16,574,587) (8,969,819) (25,544,406) 9,450,739 (16,093,667) Selling and administrative expense (1,750,003) (252,016) (2,002,019) 305,407 (1,696,612) Interest expense (482,745) (74,663) (557,408) 91,165 (466,243) Foreign exchange gain (loss) (46,584) ‒ (46,584) ‒ (46,584) Share in equity in net earnings (losses) of associates and joint ventures 966,226 14,641 980,867 ‒980,867 Interest and other income – net 136,627 34,730 171,357 (87,994) 83,363 Income before tax (3,334,384) 1,846,350 (1,488,034) (1,869,523) (3,357,557) Provision for income tax 1,093,397 (201,256) 892,141 393,250 1,285,391 Net income (loss) (₱2,240,987) 1,645,094 (₱595,893) (₱1,476,273) (₱2,072,166) Other disclosures: Depreciation and amortization ₱766,099 ₱‒ ₱766,099 ₱‒ ₱766,099 Capital expenditure 489,515 ‒ 489,515 ‒ 489,515 Interest income 28,392 ‒ 28,392 (11,437) 16,955 Investments in associates and joint ventures 1,529,787 1,360,288 2,890,075 ‒ 2,890,075 EEI 2022 Annual Report | Audited Financial Statements
Notes to operating segments:
a. Intersegment revenue, cost and expenses, assets and liabilities are eliminated on consolidation. These are accounted for under PFRSs.
b. Other income consists of:
c. The foreign segment above includes the equity in net earnings (losses) from ARCC.
d. In 2022, each of the two customers from the domestic segment contributed revenue that exceeded 10% of the Group’s revenue. Following are the revenue contributed by each of these customers: ₱2,616 million and ₱3,144 million.
In 2021, each of the two customers from the domestic segment contributed revenue that exceeded 10% of the Group’s revenue. Following are the revenue contributed by each of these customers: ₱4,485 million and ₱3,821 million.
In 2020, each of the two customers from the domestic segment contributed revenue that exceeded 10% of the Group’s revenue. Following are the revenue contributed by each of these customers: ₱2,668 million and ₱2,384 million.
32. Earnings per Share
The following table presents information necessary to calculate earnings per share:
The exercise price of unexercised stock options is still higher than the average market price during the year making the options anti-dilutive, hence, no diluted earnings per share is calculated.
The weighted average number of common shares is computed as follows:
133 EEI 2022 Annual Report | Audited Financial Statements *SGVFS163860*
2022 2021 2020 Interest income ₱35,161,634 ₱7,721,523 ₱16,955,390 Other income 375,676,367 78,328,105 66,405,380 ₱410,838,001 ₱86,049,628 ₱83,360,770
2022 2021 2020 Net income (loss) attributable to equity holders of the Parent Company ₱209,211,183 ₱489,699,853 (₱2,046,059,914) Dividends on preferred shares (299,050,876) (6,554,540) ‒Net income (loss) attributable to common equity holders of the Parent Company (89,839,693) 483,145,313 (2,046,059,914) Weighted average number of common shares 1,036,281,485 1,036,281,485 1,036,281,485 Earnings (loss) per share - basic/diluted (₱0.0867) ₱0.4662 (₱1.9744)
2022 2021 2020 Number of common shares issued 1,036,401,386 1,036,401,386 1,036,401,386 Less treasury shares 119,901 119,901 119,901 1,036,281,485 1,036,281,485 1,036,281,485
33. Changes in Liabilities Arising from Financing Activities
Changes in the Group’s liabilities arising from financing activities follows:
34. Financial Instruments
Fair Value Information
Cash and cash equivalents, receivables, deposits, advances to officers and employees, bank loans, accounts payable and other current liabilities and due to related parties
The carrying amounts of these instruments approximate fair values due to their short-term maturities and demand feature.
Loan Receivable from EEI RFI
The fair values of the receivable amounting to ₱1.09 billion from sale of Bauan Batangas Property was estimated as the present value of all future cash flows discounted using the applicable rates for similar types of loans (Level 2 - significant observable inputs). Discount rates used in 2022 were 5.21% to 7.03%.
Interest-bearing trade receivables
The fair value of interest-bearing trade receivables amounting to ₱11.5 million and ₱16.1 million as of December 31, 2022 and 2021, respectively, was estimated as the present value of all future cash flows discounted using the applicable rates for similar types of loans (Level 2 - significant observable inputs). Discount rate used in 2022 and 2021 was 5.21% and 1.66%, respectively.
Receivable from sale of investment properties
The fair value of the receivable from sale of investment property amounting to ₱16.0 million and ₱17.3 million as of December 31, 2022 and 2021, respectively, was estimated as the present value of all future cash flows discounted using the applicable rates for similar types of loans (Level 2 - significant observable inputs). Discount rate used in 2022 and 2021 was 5.21% and 1.66%, respectively.
134
2022: January 1, 2022 Net cash flows Non-cash movement December 31, 2022 Bank loans (Note 17) ₱3,250,000,000 ₱150,000,000 ₱ ₱3,400,000,000 Long-term debt (Note 19) 8,263,216,775 (3,526,242,518) 29,211,554 4,766,185,811 Lease liabilities (Note 14) 487,588,756 (60,977,044) 293,778,577 720,390,289 ₱12,000,805,531 (₱3,437,219,562) ₱322,990,131 ₱8,886,576,100 2021: January 1, 2021 Net cash flows Non-cash movement December 31, 2021 0Bank loans (Note 17) ₱5,015,000,000 (₱1,765,000,000) ₱ ₱3,250,000,000 Long-term debt (Note 19) 5,548,027,325 2,691,692,358 23,497,092 8,263,216,775 Lease liabilities (Note 14) 569,565,423 (92,847,405) 10,870,738 487,588,756 ₱11,132,592,748 ₱833,844,953 ₱34,367,830 ₱12,000,805,531
EEI 2022 Annual Report | Audited Financial Statements
Quoted equity investments
Fair values of investments in equity shares listed with Philippine Stock Exchange amounting to ₱6.4 million and ₱8.7 million as of December 31, 2022 and 2021, respectively, were determined by reference to the quoted price in the stock exchange at the end of the reporting period (Level 1 - quoted prices in active market).
Fair values of investments in club/golf shares amounting to ₱20.6 million and ₱19.0 million as of December 31, 2022 and 2021, respectively, were determined by reference to the price of the most recent transaction at the end of the reporting period (Level 2 - significant observable inputs).
Unquoted equity investments at FVOCI PGEC
The fair value of the Group’s investment in PGEC is determined by an independent third party professional services firm using the discounted cash flow model. PGEC is a holding company and has investments in the following subsidiaries, namely, Maibarara Geothermal, Inc. and PetroSolar Corporation and PetroWind Energy, a joint venture, Inc. as of December 31, 2022. All investees are engaged in the business of generating power through renewable sources of energy.
The significant unobservable inputs (Level 3) used in the fair value measurement of PGEC are as follows:
● Discount rate: 5.99% - 7.91% (1% decrease in the discount rates could increase the fair value of the Group’s investment in PGEC by P48.8 million.)
● Electricity prices used in calculating revenue:
o Maibarara Geothemal, Inc.: Electricity price based on electricity supply agreement with a customer
o PetroSolar Corporation: Feed-in tariff rate of ₱9.82 per kWH
o PetroWind Energy, Inc.: Feed-in tariff rate of ₱8.59 per kWH
HEDC
The fair value of the Group’s investment in HEDC is determined using the adjusted net asset approach wherein the assets of HEDC consisting mainly of parcels of land are adjusted from cost to their fair value. The valuation was performed by an independent SEC-accredited appraiser as of December 31, 2022.
The significant unobservable inputs (Level 3) used in the fair value measurement of PGEC are as follows:
The fair values of the land were determined using the market approach which is a valuation technique that uses prices and other relevant information generated by market transactions involving identical or comparable assets and adjusted to reflect differences on size (20%), location (20%) and facilities and utilities (10%). Significant favorable (unfavorable) adjustments to the aforementioned factors based on the professional judgment of the independent appraisers would increase (decrease) the fair value of land. Depending on the status of the development, the value of the land per sqm ranges from ₱650 to ₱7,500.
A 5% increase (decrease) in the appraised value of the land per sqm could increase (decrease) the Group’s investment by ₱20.0 million.
135 EEI 2022 Annual Report | Audited Financial Statements *SGVFS163860*
Long-term debt
The fair values of the interest-bearing long-term loans amounting to ₱4.77 billion and ₱8.26 billion as of December 31, 2022 and 2021, respectively, were estimated as the present value of all future cash flows discounted using the applicable rates for similar types of loans (Level 2 - significant observable inputs). Discount rates used in 2022 and 2021 were 5.97% and 3.25%, respectively.
Long-term retention payable
The fair values of the retention payable (Note 18) amounting to ₱128.2 million and ₱242.9 million as of December 31, 2022 and 2020, respectively were estimated as the present value of all future cash flows discounted using the applicable rates for similar types of loans (Level 2 - significant observable inputs). Discount rates used in 2022 and 2021 were 5.97% and 1.66%, respectively.
35. Financial Risk Management Objectives and Policies
The main purpose of the Group’s financial instruments is to raise finances for the Group’s operations.
The main risks arising from the Group’s financial instruments are credit risk, liquidity risk and foreign currency risk. The policies for managing these risks are summarized as follows:
Credit Risk
The exposure to credit risk on its receivables relates primarily to the inability of project owners to fully settle the unpaid balance of receivables and other claims owed to the Group. Credit risk is managed in accordance with the Group’s credit risk policy which requires the evaluation of the creditworthiness of the project owners by engaging the service of an accredited third-party credit analyst. The credit risk for receivables from construction projects is mitigated by the fact that the Group can resort to carry out its contractor’s lien over the project with varying degrees of effectiveness depending on the jurisprudence applicable to the project.
The Group’s gross maximum exposure to credit risk is equal to the carrying amounts of its financial assets as of December 31, 2022 and 2021.
The Group generally considers a financial asset in default when contractual payments are 90 days past due.
For a financial asset that arises from long-term construction contracts, the Group considers the asset to be in default if contractual payments are not settled within 90 days from the completion of the construction project. The Group’s normal credit terms for construction projects is within 90 days based on its historical experience. However, in certain cases, the Group may also consider a financial asset to be in default when internal or external information indicates that the Group is unlikely to receive the outstanding contractual amounts in full. A financial asset is written off when there is no reasonable expectation of recovering the contractual cash flows.
In 2022, the Group has no significant concentration of credit risk from any customer.
Its gross maximum exposure to credit risk is equivalent to the carrying value of its financial assets as presented in the consolidated statements of financial position.
136
EEI 2022 Annual Report | Audited Financial Statements
Credit risk is managed since the titles of the properties sold by the Group from its real estate operations are retained until receivables are fully collected and the fair values of these properties held as collateral are sufficient to cover the carrying values of the receivables.
As of December 31, 2022 and 2021, the credit quality per class of financial assets at amortized cost are as follows:
The Group sets financial assets as ‘high grade’ based on the Group’s positive collection experience. The counterparties have a very remote likelihood of default and have consistently exhibited good paying habits. On the other hand, ‘standard grade’ are those which have credit history of default in payments.
Impairment is performed at each reporting date using a provision matrix to measure expected credit losses. The provision rates are based on days past due for groupings of customer segments with similar loss patterns (i.e., type of customers). The calculation reflects the probability-weighted outcome and reasonable and supportable information that is available at the reporting date about past events, current conditions and forecasts of future economic conditions. The Group applies a general approach in calculating the ECL on receivable from ERFI and due from related parties. In 2022 and 2021, no provision for expected credit losses were recognized using this approach.
137 EEI 2022 Annual Report | Audited Financial Statements *SGVFS163860*
2022 High Grade Standard Grade Past Due or Impaired Total Cash and cash equivalents ₱2,562,954,671 ₱ ₱ ₱2,562,954,671 Trade receivables 1,469,013,706 909,170,213 79,842,362 2,458,026,281 Receivable from sale of investment properties 15,997,014 15,997,014 Other receivables 375,972 33,709,642 10,926,181 45,011,795 Interest-bearing trade receivables 11,330,924 200,000 11,530,924 Due from related parties 196,097,127 196,097,127 Miscellaneous deposits 2,802,180 101,692,971 41,265,425 145,760,576 Receivable from ERFI 1,200,000,000 − − 1,200,000,000 ₱5,458,571,594 ₱1,044,572,826 ₱132,233,968 ₱6,635,378,388 2021 High Grade Standard Grade Past Due or Impaired Total Cash and cash equivalents ₱7,114,579,697 ₱ ₱ ₱7,114,579,697 Trade receivables 979,444,582 1,257,039,484 76,241,674 2,312,725,740 Receivable from sale of investment properties 17,285,545 ‒ ‒ 17,285,545 Other receivables 570,300 36,584,428 10,926,181 48,080,909 Due from related parties 154,351,686 ‒ ‒ 154,351,686 Interest-bearing trade receivables 15,861,796 ‒ 200,000 16,061,796 Miscellaneous deposits 125,332,078 ‒ 3,335,193 128,667,271 ₱8,407,425,684 ₱1,293,623,912 ₱90,703,048 ₱9,791,752,644
The Company has the following financial assets that are subject to the expected credit loss model under PFRS 9:
● Cash and cash equivalents;
● Trade receivables;
● Contract assets;
● Advances to officers and employees;
● Due from related parties;
● Receivable from ERFI;
A summary of Group exposure to credit risk under general and simplified approach as of December 31, 2022 and 2021, are as follow:
138
2022 General Approach Simplified Approach Stage 1 Stage 2 Stage 3 Amortized cost Cash and cash equivalents ₱2,562,954,671 ₱ ₱ ₱ Receivables 61,008,809 2,528,970,269 Loans receivable 1,200,000,000 Contract assets 10,352,283,159 Due from related parties 196,097,127 Bid deposit 59,822,400 − − − Miscellaneous deposit 145,760,576 − − − Advances to officers and employees 52,753,886 Total gross carrying amounts 4.278,397,469 ‒ ‒ 12,881,253,428 Less allowance (53,232,452) ‒ ‒ (110,621,933) ₱4,225,165,017 ₱‒ ₱‒ ₱12,770,631,495 2021 General Approach Simplified Approach Stage 1 Stage 2 Stage 3 Amortized cost Cash and cash equivalents ₱7,114,579,697 ₱ ₱ ₱ Receivables 65,366,454 2,388,870,462 Contract assets 54,570,275 Advances to officers and employees 9,877,856,941 Due from related parties 154,351,686 Bid deposit 59,822,400 Miscellaneous deposit 128,667,271 Advances to officers and employees 50,822,589 Total gross carrying amounts 7,628,180,372 12,266,727,403 Less allowance (14,297,875) (128,381,024) ₱7,613,882,497 ₱ ₱ ₱12,138,346,379 EEI 2022 Annual Report | Audited Financial Statements
Liquidity Risk
Liquidity risk is the risk that the Group will be unable to meet its payment obligations as they fall due. The Group seeks to manage its liquidity risk to be able to meet its operating cash flow requirements, finance capital expenditures and service maturing debts. To cover its short-term and long-term funding requirements, the Group intends to use internally generated funds and available short-term and long-term credit facilities. Credit lines are obtained from BOD-designated banks at amounts based on financial forecasts approved by BOD.
The maturity groupings are based on the remaining period from the end of the reporting period to the contractual maturity date. The tables below summarize the maturity profile of the Group’s financial assets.
139 EEI 2022 Annual Report | Audited Financial Statements *SGVFS163860*
2022 On demand < 1 year 1 to < 2 years > 2 years Total Financial Liabilities Accounts payable and other current liabilities* ₱986,578,444 ₱3,124,270,674 ₱73,697,447 ₱321,453,648 ₱4,506,000,213 Bank loans Peso loan 3,400,000,000 3,400,000,000 Interest 85,919,895 85,919,895 Long-term debt Peso loan 3,220,729,595 1,473,661,333 89,162,000 4,783,552,928 Interest 1,066,507 148,922,844 39,410,065 5,266,198 194,665,614 Lease liabilities ‒ 129,675,676 127,872,244 551,620,973 809,168,893 Due to related parties 2,532,536 2,532,536 990,177,487 10,109,518,684 1,714,641,089 967,502,819 13,781,840,079 Financial Assets Cash and cash equivalents ₱2,571,374,751 ₱ ₱ ₱ ₱2,571,374,751 Receivables Billed receivables 1,251,509,530 1,206,516,751 ‒ ‒ 2,458,026,281 Unbilled receivables ‒ 59,413,064 ‒ ‒ 59,413,064 Interest-bearing receivables ‒ 11,530,924 ‒ ‒ 11,530,924 Other receivables 44,428,733 583,061 ‒ ‒ 45,011,794 Due from related parties 196,097,127 196,097,127 4,063,410,141 1,278,043,800 5,341,453,941 Liquidity gap (position) (₱3,073,232,654) ₱8,831,474,884 ₱1,714,641,089 ₱967,502,819 ₱8,440,386,138 *Excludes statutory liabilities 2021 On demand < 1 year 1 to < 2 years > 2 years Total Financial Liabilities Accounts payable and other current liabilities* ₱667,461,995 ₱4,136,361,794 ₱54,255,653 ₱227,929,098 ₱5,086,008,540 Bank loans Peso loan ‒ 3,250,000,000 ‒ ‒ 3,250,000,000 Interest ‒ 199,260,791 ‒ ‒ 199,260,791 Long-term debt Peso loan ‒ 3,559,347,350 3,184,209,567 1,566,238,533 8,309,795,450 Forward
*Excludes statutory liabilities
As of December 31, 2022 and 2021, the Group has available undrawn committed borrowing facilities with local banks totaling to ₱10.5 billion and ₱21.2 billion, respectively.
Foreign currency risk
Currency risk is the risk that the fair value or future cash flows of a financial instrument will fluctuate because of changes in foreign exchange rates. The Group’s currency risk arise mainly from cash and receivables which are denominated in a currency other than the Group’s functional currency or will be denominated in such a currency.
The following tables demonstrate the sensitivity to a reasonably possible change in the US dollar (USD), Singapore dollar (SGD), Euro (EUR), Japan yen (YEN) and UK Pound (GBP) currency rates, with all variables held constant, of the Group’s profit before tax (due to changes in the fair value of monetary assets and liabilities):
December 31, 2022
December 31, 2021
140 2021 On demand < 1 year 1 to < 2 years > 2 years Total Interest ‒ 173,927,038 66,866,814 19,607,590 260,401,442 Lease liabilities ‒ 85,417,970 87,168,196 526,714,877 699,301,043 Due to related parties 2,121,398 ‒ ‒ ‒ 2,121,398 669,583,393 11,404,314,943 3,392,500,230 2,340,490,098 17,806,888,664 Financial Assets Cash and cash equivalents ₱7,124,222,377 ₱‒ ₱‒ ₱‒ ₱7,124,222,377 Receivables Trade receivables 1,110,405,129 1,202,320,611 ‒ ‒ 2,312,725,740 Unbilled receivables ‒ 60,082,926 ‒ ‒ 60,082,926 Interest-bearing receivables ‒ 16,061,796 ‒ ‒ 16,061,796 Other receivables 33,370,480 14,710,426 ‒ ‒ 48,080,906 Due from related parties 154,351,686 ‒ ‒ ‒ 154,351,686 8,422,349,672 1,293,175,759 ‒ ‒ 9,715,525,431 Liquidity gap (position) (₱7,752,766,279) ₱10,111,139,184 ₱3,392,500,230 ₱2,340,490,098 ₱8,091,363,233
Percentage increase/decrease in foreign currency Effect on profit before tax (in PHP) Percentage increase/ decrease in foreign currency Effect on profit before tax (in PHP) USD +2.2% ₱32,810,102 +4.4% ₱12,772,442 SGD +1.4% 10,248 +2.7% 17,886 EUR +3.3% 15,402 +1.0% 4,373 YEN +5.2% 222,919 +1.3% 83,553 GBP +4.5% ‒ +0.6% ‒EEI 2022 Annual Report | Audited Financial Statements
31, 2022
31, 2021
The foreign currency denominated financial assets and financial liabilities in original currencies and equivalents to the functional and presentation currency are as follows:
141 EEI 2022 Annual Report | Audited Financial Statements *SGVFS163860*
December
Percentage increase/decrease in foreign currency Effect on profit before tax (in PHP) Percentage increase/ decrease in foreign currency Effect on profit before tax (in PHP) USD -2.2% (₱32,810,102) -4.4% (₱12,772,442) SGD -1.4% (10,248) -2.7% (17,886) EUR -3.3% (15,402) -1.0% (4,373) YEN -5.2% (222,919) -1.3% (83,553) GBP -4.5% ‒ -0.6% ‒
December
2022 USD1 SGD2 EUR3 YEN4 GBP5 Equivalents in PHP Financial assets Cash and cash equivalents $26,601,434 $17,680 €7,722 ¥8,682,102 £ ₱1,497,691,393 Receivables 153,130 ‒ ‒ 1,621,004 ‒ 9,194,399 26,754,564 17,680 7,722 10,303,106 ‒ ₱1,506,885,792 Financial liabilities Accounts payable and other current liabilities 187,680 ‒ ‒ ‒ ‒ 10,532,602 $26,566,884 $17,680 €7,722 ¥10,303,106 £‒ ₱1,496,353,190 1 Exchange rate used - 55.76 to $1 2 Exchange rate used - 41.58 to S$1 3 Exchange rate used - 59.56 to €1 4 Exchange rate used - 0.42 to ¥1 5 Exchange rate used - 67.44 to £1 2021 USD1 SGD2 EUR3 YEN4 GBP5 Equivalents in PHP Financial assets Cash and cash equivalents $5,657,415 $17,680 €7,722 ¥12,657,997 £ ₱293,943,666 Receivables 388,067 ‒ ‒ 1,439,193 ‒ 20,338,812 6,045,482 17,680 7,722 14,097,190 ‒ 314,282,478 Financial liabilities Accounts payable and other current liabilities 294,720 ‒ ‒ ‒ ‒ 14,964,113 $5,750,762 $17,680 €7,722 ¥14,097,190 £‒ ₱299,318,365 1 Exchange rate used - 50.99 to $1 2 Exchange rate used - 37.55 to S$1 3 Exchange rate used - 57.51 to €1 4 Exchange rate used - 0.44 to ¥1 5 Exchange rate used - 68.53 to £1
a. The COVID-19 pandemic has continuously impacted the Group’s operation and financial performance in 2022.
On April 28, 2021, the Philippine Government extended the MECQ until May 14, 2021. On May 13, 2021, the Office of the President announced that Metro Manila and 4 adjacent provinces will shift to general community quarantine (GCQ) with heightened restrictions until May 31, 2021 and then eventually extended until June 15, 2021. On June 29, 2021, the President of the Philippines approved the recommendation of the Inter-Agency Task Force on emerging Infectious Diseases (IATF) to extend the general community quarantine in “NCR Plus” until July 15, 2021 and subsequently extended until July 31, 2021. NCR stayed under GCQ until August 5, 2021. Beginning August 6, 2021, the classification of the NCR was escalated to Enhanced Community Quarantine until August 20, 2021. The IATF decided to ease the strict lockdown in NCR beginning August 21, lowering the status in both areas to a modified enhanced community quarantine (MECQ) until September 7, 2021. The risk level classification of NCR as MECQ was maintained until September 15, 2021.
IATF imposed new classification framework which focuses on the imposition of granular lockdown measures. Community quarantines were reduced to either ECQ or GCQ with the latter having an Alert Level System (Alert level 1 to 4) with each Alert Level limiting restrictions to identified risk activities. The pilot area for this policy shall be the NCR which started from September 16, 2021 until September 30, 2021 wherein NCR was placed under the GCQ Alert Level 4 which was subsequently extended until October 15, 2021. IATF placed NCR under Alert Level 3 starting October 16, 2021 until November 4, 2021. IATF placed NCR under Alert Level 2 starting November 5, 2021 until January 2, 2022. Furthermore, Alert Level classification of NCR was escalated to Alert Level 3 starting January 3, 2022 until January 15, 2022 and subsequently extended until January 31, 2022. Subsequently, NCR was placed to Alert Level 2 starting February 1, 2022 until February 28, 2022. On February 27, 2022, IATF placed NCR under Alert level 1 starting March 1, 2022. These measures have caused disruptions to the businesses and economic activities, and its impact on businesses continue to evolve.
At the end of 2022, EEI Corporation’s unworked portion of existing contracts stood at ₱57.9 billion, including ARCC’s backlog of ₱26.4 billion. The Company considers this backlog of projects as healthy and sustainable. EEI expects an overall strong performance in its domestic operations driven by the current buildings, infrastructure, electromechanical, and industrial projects in its pipeline as production continues to pick-up. Despite the delays in operations caused by the COVID-19 pandemic, the backlog was preserved and will be realized as construction works resume.
EEI CORPORATION AND SUBSIDIARIES
SUPPLEMENTARY INFORMATION AND DISCLOSURES REQUIRED ON REVISED
SRC RULE NO. 68 | DECEMBER 31, 2022
Philippine Securities and Exchange Commission (SEC) issued the Revised Securities Regulation Code Rule No. 68 (Revised SRC Rule No. 68) which consolidates the two separate rules and labeled in the amendment as “Part I” and “Part II”, respectively. It also prescribed the additional information and schedule requirements for issuers of securities to the public.
Below are the additional information and schedules required by Revised SRC Rule No. 68, that are relevant to
142 36. Other Matters
EEI 2022 Annual Report | Audited Financial Statements
the Group. This information is presented for purposes of filing with the SEC and is not required part of the basic financial statements.
Schedule A. Financial Assets
The following is the detailed schedule of equity in investments at FVOCI as at December 31, 2022.
Income earned and accrued from the financial assets amounted to ₱4.0 million in 2022.
143 EEI 2022 Annual Report | Audited Financial Statements *SGVFS163860*
Number of Shares Amount Shown in the Statement of Financial Position Movement Valuation Name of Issuing Entities Quoted: Sta. Elena Golf Club Inc. 2 ₱13,000,000 ₱Philippine Long Distance Telephone Co. 38,867 6,454,752 (2,282,941) Manila Southwood Golf & Country Club 2 3,000,000Valle Verde Country Club 2 1,000,000 300,000 The Orchard Golf and Country Club 1 2,000,000 1,300,000 Canyon Woods 1 70,000Royale Tagaytay Country Club 1 100,000 40,000 The Orchard Golf 1 500,000Sherwoods Hills Golf Club 1 250,000Fairways & Blue Water Resort Golf 1 250,000Club Filipino 1 180,000Forest Hill golf share 1 180,000Royale NorthWoods 1 121,856Eagle Ridge Golf & Country Club 1 60,000Unquoted: Hermosa Ecozone Development Corp (HEDC) 1,000,000 508,507,014 104,125,133 Brightnote Assets Corporation 11,000,000 1,656,327Tower Club (Philam Properties Corp.) 1 500,000Architectural Center Club, Inc. (ACCI) 1 32,000Philippine Contractors Association 10,000 10,000Philippine Exporters Trading Corp. 5,000 5,000Pilipino Telephone Company 150 675Related Party: Petro Green Energy Corporation 258,144,888 735,037,040 (100,239,365) YGC Corporate Services, Inc. 13,389 3,305,447 Total ₱270,212,312 ₱1,276,220,111 ₱ 3,242,827
Schedule B. Amounts Receivable from Directors, Officers, Employees, Related Parties and Principal Stockholders (Other than Related Parties)
Below is the schedule of advances to employees of the Group with balances above 1,000,000 as at December 31, 2022:
*recovered through salary deduction
The amounts of advances to employees as shown above are classified under current assets. There were no amounts written off during the year.
Schedule C. Amounts Receivable from Related Parties which are Eliminated during the Consolidation of Financial Statements
The following is the schedule of receivables from related parties, which are eliminated in the consolidated financial statements as at December 31, 2022:
144
Name and designation Balance at beginning of year Additions Collections/ Liquidations Balance at end of year Manalad, Janine Ann Bernadette Capistrano* ₱2,514,163 ₱- ₱194,769 ₱2,319,394 ₱2,514,163 ₱- ₱194,769 ₱2,319,394
Name and Designation of Debtor Balance at beginning of year Additions Amounts Collected Balance at end of year EEI Realty Corp ₱216,318 ₱2,453,623 (₱2,365,490) ₱304,451 EEI Power Corp. 428,951 3,186,784 (3,335,696) 280,039 Gulf Asia International Corp. ‒ 41,554,029 (41,543,086) 10,943 GAIC Manpower Services Inc. ‒ 3,283,748 (3,237,943) 45,805 Philrock Construction & Services, Inc. 41,864,355 ‒ ‒ 41,864,355 Philmark, Inc. 33,704,595 ‒ ‒ 33,704,595 EEI Business Solutions, Inc. 15,652,768 34,370,957 (16,253,819) 33,769,906 EEI Construction & Marine, Inc. 978 5,384,673 (5,171,196) 214,455 Learn JP 379,666 885,503 (895,960) 369,209 JPSAI 58,580,285 135,605,635 (20,887,866) 173,298,054 Biotech 14,971,857 893,401 (6,500,000) 9,365,258 EEI Energy 46,361 234,196 ‒ 280,557 EEI Carga 193,579 1,270,982 ‒ 1,464,561 EEI Limited ‒ 6,291,675 (5,886,781) 404,894 ₱166,039,713 ₱235,415,206 (₱106,077,837) ₱295,377,082 EEI 2022 Annual Report | Audited Financial Statements
The amounts of receivables from related parties as shown above are classified under current assets. There were no amounts written off during the year.
The following is the schedule of payable to related parties, which are eliminated in the consolidated financial statements as at December 31, 2022:
The amounts of payables to related parties as shown above are classified under current liabilities. There were no amounts written off during the year.
Schedule D. Long-term Debt
Below is the schedule of long-term debt of the Group:
145
Name and Designation of Creditor Balance at beginning of year Additions Amounts Paid Balance at end of year EEI Construction & Marine, Inc. ₱58,038,201 ₱65,972,519 (₱103,253,380) ₱20,757,340 EEI Business Solutions, Inc. 9,986,226 85,817,936 (91,152,021) 4,652,141 EEI Subic Corporation 89,079,662 ‒ ‒ 89,079,662 Gulf Asia International Corp. ‒ 35,932,321 (35,740,943) 191,378 GAIC Manpower Services Inc. 10,205,747 14,867,345 (22,166,840) 2,906,252 Bagumbayan Equipment Industrial Products, Inc. 1,643,054 ‒ ‒ 1,643,054 JP Asia 1,650,377 82,596,612 (67,385,659) 16,861,330 EEI Realty Corp. 42,540,073 21,181,755 (15,022,851) 48,698,977 EEI Limited 57,156,641 86,955,252 (144,111,893) ‒EEI Carga ‒ 1,868,107 ‒ 1,868,107 EEI Power Corp 95,594,248 95,007,155 (156,703,315) 33,898,088 ₱365,894,229 ₱490,199,002 (₱635,536,902) ₱220,556,329
Type of Obligation Amount Current Noncurrent Collateral Parent Company Floating-rate corporate promissory notes with effective interest of 3.5000% per annum for three (3) years. ₱1,661,886,023 ₱831,252,079 ₱830,633,944 Clean/No Collateral Floating-rate corporate promissory notes with effective interest of 3.5000% per annum for three (3) years. 995,345,941 995,345,941 Clean/No Collateral Floating-rate corporate promissory notes with effective interest of 3.25000% per annum for three (3) years. 332,512,339 332,512,339 Clean/No Collateral Floating-rate corporate promissory notes with effective interest of 3.42000% per annum for three (3) years. 622,792,721 497,941,585 124,851,136 Clean/No Collateral Floating-rate corporate promissory notes with effective interest of 3.42000% per annum for three (3) years. 995,095,858 496,393,968 498,701,890 Clean/No Collateral Forward EEI 2022 Annual Report | Audited Financial Statements *SGVFS163860*
Schedule E. Indebtedness to Related Parties (Long Term Loans from Related Companies)
As at December 31, 2022, the Group has no long-term loans from its associates and entities under common control.
Schedule F. Guarantees of Securities of Other Issuers
The Group did not issue any guarantees of securities of other issuing entities by the Group as at December 31, 2022.
Schedule G. Capital Stock
146 Type of Obligation Amount Current Noncurrent Collateral Parent Company
annum
₱1,661,886,023 ₱831,252,079 ₱830,633,944 Clean/No Collateral BiotechJP Yen-denominated five (5) year term loan, with interest of 0.05% per annum. 29,334 29,334 No Collateral Yen-denominated
year term loan, with interest of 0.98% per annum 6,261,000 6,261,000 No Collateral Yen-denominated
year term loan,
0.30% per annum. 7,400,595 5,730,995 1,669,600.00 No Collateral USD-denominated, APR 2020 – NOV 2029, with interest of floating rate plus margin (0.075%) 19,642,000 2,806,000 16,836,000 No Collateral Yen-denominated ten (10) year term loan, with interest of 0.30% per annum 41,740,000 8,348,000 33,392,000 No Collateral Yen-denominated ten (10) year term loan, with interest of 2.975% per annum 83,480,000 16,696,000 66,784,000 No Collateral ₱4,766,185,811 ₱3,193,317,241 ₱1,572,868,570
Floating-rate corporate promissory notes with effective interest of 3.5000% per
for three (3) years.
four and half (4.5)
four and half (5)
with interest of
Title of issue Number of shares authorized Number of shares issued and outstanding as shown under related balance sheet caption Number of shares reserved for options, warrants, conversion and other rights Number of shares held by related parties Directors, Officers and Employees Others Common Shares 2,000,000,000 1,036,281,485 35,000,000 573,463,646 3,542,388 459,275,451 Preferred Shares 240,000,000 60,000,000 – – – –EEI 2022 Annual Report | Audited Financial Statements
EEI CORPORATION
RECONCILIATION OF RETAINED EARNINGS AVAILABLE FOR DIVIDEND DECLARATION
As
147 EEI 2022 Annual Report | Audited Financial Statements *SGVFS163860*
of December
Unappropriated retained earnings, January 1, 2022, as adjusted ₱641,410,182 Add: Net income actually earned/realized during the period Add: Net income during the period closed to Retained Earnings 741,892,956 Equity share in net loss of joint venture - net of tax ‒Unrealized foreign exchange loss - net 14,829,814 Depreciation on revaluation increment (after tax) ‒Adjustment due to deviation from PFRS/GAAP - loss ‒Loss on fair value adjustment of investment property (after tax) ‒Less: Net loss during the period closed to Retained Earnings ‒Equity share in net earnings of joint venture - net of tax (37,693,270) Non-actual/ unrealized income net of tax ‒Unrealized foreign exchange gain - net Unrealized actuarial gain - net Fair value adjustment Adjustment due to deviation from PFRS/GAAP gain Other unrealized gain or adjustments to the retained earnings as a result of certain transactions accounted under the PFRS Movement in deferred tax asset (210,284,237) Net income actually earned during the period 508,745,263 Add (Less): Dividend declarations during the period (398,734,500) Appropriations of retained earnings during the year ‒Reversals of appropriations ‒Effects of prior period adjustments ‒(398,734,500) Unappropriated retained earnings available for dividend distribution, December 31, 2022 ₱751,420,945
31, 2022
CORPORATION
AND SUBSIDIARIES
MAP OF RELATIONSHIPS OF THE COMPANIES WITHIN THE GROUP
Group Structure
Below is a map showing the relationship between and among the Group and its ultimate parent company, subsidiaries, and associates as at December 31, 2022:
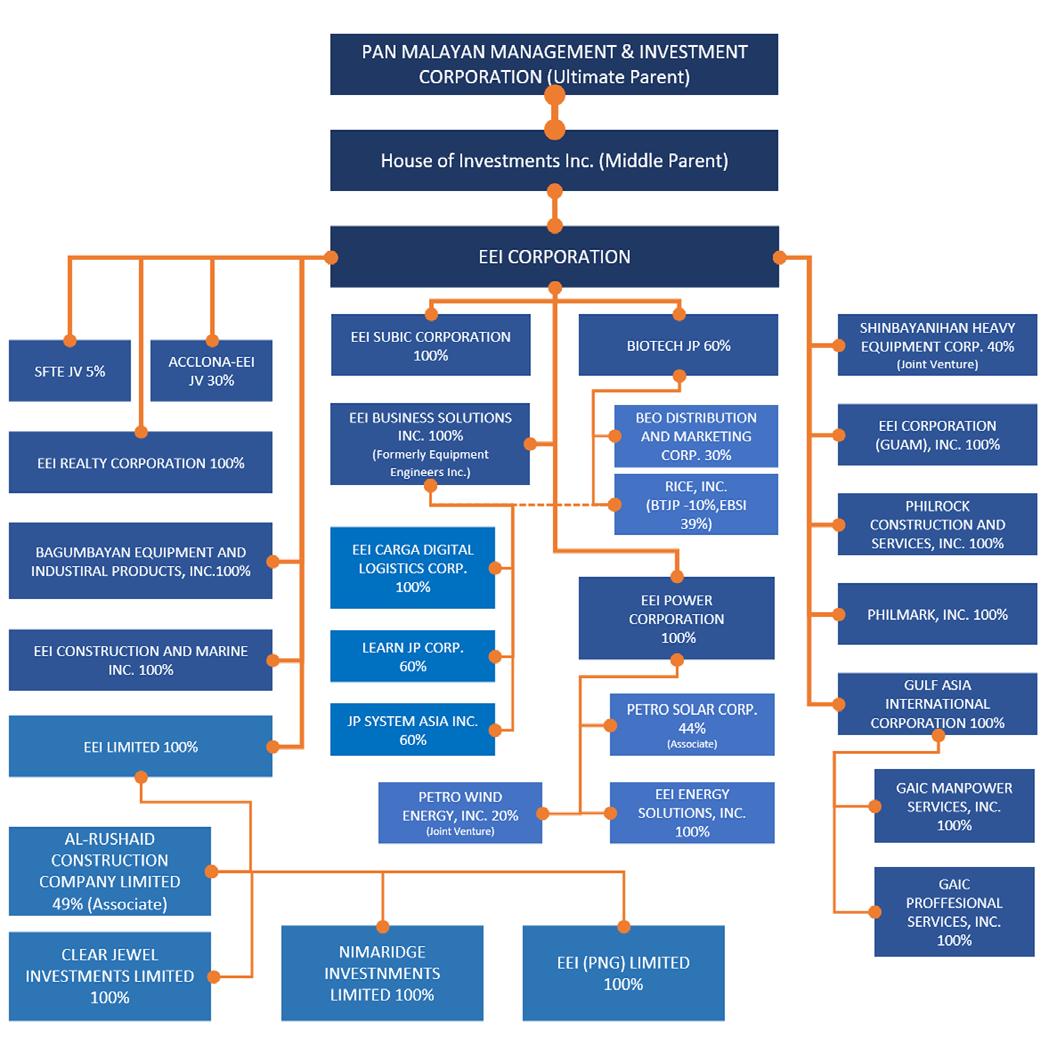
148 EEI
EEI 2022 Annual Report | Audited Financial Statements
EEI CORPORATION AND SUBSIDIARIES
SCHEDULE OF FINANCIAL SOUNDNESS INDICATORS
As At December 31, 2022 and 2021 and for the years then ended
Financial Soundness Indicator
Below are the financial ratios that are relevant to the Group as at December 31, 2022 and 2021 and for the years then ended.
*Earnings before interest and taxes (EBIT)
149 EEI 2022 Annual Report | Audited Financial Statements *SGVFS163860*
Ratios Formula 2022 2021 Current ratio Current assets 1.04:1 1.61:1 Current liabilities Solvency ratio Net income plus depreciation 0.05:1 0.06:1 Total liabilities Debt - equity ratio Total liabilities 1.16:1 1.42:1 Total equity Asset-to-equity ratio Total assets 2.16:1 2.42:1 Total equity Interest rate coverage ratio EBIT* 1.68:1 2.67:1 Interest expense Return on assets Net income 1% 2% Average total assets Return on equity Net income 1% 5% Average total equity
EEI CORPORATION AND SUBSIDIARIES
SCHEDULE FOR LISTED COMPANIES WITH A RECENT OFFERING OF SECURITIES TO THE PUBLIC FOR THE YEAR ENDED DECEMBER 31, 2022
The information below is in connection with the preferred shares issued by EEI Corporation and listed at the PSE on December 23, 2021.
1.
3.
4.
150
Base Offer Oversubscription Option Gross proceeds ₱4,000,000,000 ₱6,000,000,000 Net proceeds ₱3,959,077,720 ₱5,948,461,920
Gross and net proceeds as discussed in the final prospectus
Gross proceeds ₱6,000,000,000 Net proceeds ₱5,945,800,028
2. Actual gross and net proceeds
Offer-Related Expenses Sole Issue Manager, Joint Lead Underwriters and Bookrunners ₱31,969,574 Receiving Agent 550,000 Stock Transfer Agent 380,000 Legal and audit fees 11,086,253 Additional - Listing and other expense 10,214,145 54,199,972 Use of net proceeds General, corporate and working capital for existing and future projects 4,160,713,460 Repayment of bank loans 1,785,086,568 Total ₱-
Each expenditure item where the proceeds were used
EEI 2022 Annual Report | Audited Financial Statements
Balance of the proceeds as of end of reporting period is nil.
EEI CORPORATION AND SUBSIDIARIES
INDEX TO CONSOLIDATED FINANCIAL STATEMENTS
AND SUPPLEMENTARY SCHEDULES
SEC FORM 17-A
CONSOLIDATED FINANCIAL STATEMENTS
Statement of Management’s Responsibility for Consolidated Financial Statements
Report of Independent Auditor’s Report
Consolidated Statements of Financial Position as at December 31, 2022 and 2021
Consolidated Statements of Income for the years ended December 31, 2022, 2021 and 2020
Consolidated Statements of Comprehensive Income for the years ended December 31, 2022, 2021 and 2020
Consolidated Statements of Changes in Equity for the years ended December 31, 2022, 2021 and 2020
Consolidated Statements of Cash Flows for the years ended December 31, 2022, 2021 and 2020
Notes to Consolidated Financial Statements
SUPPLEMENTARY SCHEDULES
Report of Independent Auditor’s on Supplementary Schedules
Schedules Required under Revised SRC Rule No. 68
A. Financial Assets
B. Amounts Receivable from Directors, Officers, Employees, Related Parties, and Principal Stockholders (Other than Related Parties)
C. Amounts Receivable from Related Parties which are Eliminated during the Consolidation of Financial Statements
D. Long-term Debt
E. Indebtedness to Related Parties
F. Guarantees of Securities of Other Issuers
G. Capital Stock
Additional Components
I. Schedule of Reconciliation of Retained Earnings Available for Dividend Declaration
II. Map of the relationships of the Companies within the Group
III. Schedule of Financial Soundness Indicators
IV. Schedule for Listed Companies with a Recent Offering of Securities to the Public
151 EEI 2022 Annual Report | Audited Financial Statements *SGVFS163860*