No part of this publication may be reproduced or transmitted in any form or by any means, electronic or mechanical, including photocopying, recording, or any information storage and retrieval system, without permission in writing from the publisher. Details on how to seek permission, further information about the Publisher’s permissions policies and our arrangements with organizations such as the Copyright Clearance Center and the Copyright Licensing Agency, can be found at our website: www.elsevier.com/permissions
This book and the individual contributions contained in it are protected under copyright by the Publisher (other than as may be noted herein).
Notices
Knowledge and best practice in this field are constantly changing. As new research and experience broaden our understanding, changes in research methods, professional practices, or medical treatment may become necessary.
Practitioners and researchers must always rely on their own experience and knowledge in evaluating and using any information, methods, compounds, or experiments described herein. In using such information or methods they should be mindful of their own safety and the safety of others, including parties for whom they have a professional responsibility.
With respect to any drug or pharmaceutical products identified, readers are advised to check the most current information provided (i) on procedures featured or (ii) by the manufacturer of each product to be administered, to verify the recommended dose or formula, the method and duration of administration, and contraindications. It is the responsibility of practitioners, relying on their own experience and knowledge of their patients, to make diagnoses, to determine dosages and the best treatment for each individual patient, and to take all appropriate safety precautions.
To the fullest extent of the law, neither the Publisher nor the authors, contributors, or editors, assume any liability for any injury and/or damage to persons or property as a matter of products liability, negligence or otherwise, or from any use or operation of any methods, products, instructions, or ideas contained in the material herein.
Library of Congress Control Number: 2018945279
Publisher: Russell Gabbedy
Senior Content Development Specialist: Ann Anderson
Publishing Services Manager: Catherine Jackson
Senior Project Manager: Amanda Mincher
Design Direction: Ryan Cook
To Kirstin, Nathan, and Sean. You are the light, the joy, and the love in my life.
—Juan E. Small
I dedicate this book to my wife and three wonderful children for their love and support and also to my father who has inspired my professional curiosity.
—Daniel L. Noujaim
To my parents, Roselyne and Jonathan.
—Daniel T. Ginat
To my husband and best friend, Jason, and my children, Quinn and Jude, for their endless love, understanding, and happiness. To my colleagues at Massachusetts General Hospital and Massachusetts Eye and Ear. Thank you for the teaching, support, and unwavering commitment to patient care. To the residents and fellows who have taught me more than I could ever teach them. Thank you for challenging me to never stop learning.
—Hillary
R. Kelly
To Doug and Sarah, who always give me unconditional love, support, and encouragement; and to the residents, fellows, and attendings at MGH, who make me a better neuroradiologist on a daily basis.
—Pamela W. Schaefer
Contributors
Sama Alshora, MD
Assistant Professor of Radiology
Lahey Hospital and Medical Center Burlington, Massachusetts
Assistant Professor of Radiology
King Saud University Medical City Riyadh, Saudi Arabia
Arwa O. Badeeb, MBBS
Chief Resident, Diagnostic Radiology
Lahey Clinic Burlington, Massachusetts
Lawrence Bahoura, MD
Oakland University William Beaumont School of Medicine
Royal Oak, Michigan
Girish Bathla, MBBS, FRCR, DMRD, MMeD
Resident
Department of Radiology University of Iowa Hospitals and Clinics
Iowa City, Iowa
Adam P. Bryant, MD
Resident Department of Radiology
University of Iowa Hospitals and Clinics
Iowa City, Iowa
Paul M. Bunch, MD
Assistant Professor of Radiology
Wake Forest School of Medicine
Wake Forest Baptist Health Winston-Salem, North Carolina
Walter L. Champion, MD
Lahey Hospital and Medical Center Burlington, Massachusetts
Pauley Chea, MD
Chief Resident Department of Radiology
Lahey Hospital and Medical Center Burlington, Massachusetts
Lindsay A.N. Duy, MD
Assistant Professor of Radiology
Wake Forest Baptist Medical Center
Winston-Salem, North Carolina
Suzanne K. Freitag, MD
Director, Ophthalmic Plastic Surgery
Department of Ophthalmology
Massachusetts Eye and Ear Infirmary
Associate Professor of Ophthalmology
Harvard Medical School
Boston, Massachusetts
Merav Galper, MD
Radiologist
Kaiser Permanente Mid-Atlantic Permanente Medical Group (MAPMG) Rockville, Maryland
Daniel T. Ginat, MD, MS
Department of Radiology
Pritzker School of Medicine
The University of Chicago Chicago, Illinois
Louis Golden, MD
Neuroradiology Section
Stanford University Stanford, California
Jason Handwerker, MD
Associate Clinical Professor of Radiology
University of California, San Diego San Diego, California
Jeffrey A. Hashim, MD
Assistant Professor of Radiology
Diagnostic Radiology
Lahey Hospital and Medical Center Burlington, Massachusetts
Doreen T. Ho, MD
Staff Neurologist
Lahey Hospital and Medical Center Burlington, Massachusetts
Dean T. Jeffery, MD
Radiology and Diagnostic Imaging
University of Alberta Edmonton, Alberta, Canada
Hillary R. Kelly, MD
Radiologist
Massachusetts Eye and Ear Infirmary Neuroradiologist
Massachusetts General Hospital
Assistant Professor of Radiology
Harvard Medical School Boston, Massachusetts
DaeHee Kim, MD
Chief Resident Department of Radiology
Lahey Hospital and Medical Center Burlington, Massachusetts
Philip D. Kousoubris, MD
Neuroradiology
Lahey Clinic
Burlington, Massachusetts
Mara Kunst, MD
Assistant Professor of Radiology
Tufts University School of Medicine
Section Head of Neuroradiology
Department of Radiology
Lahey Hospital and Medical Center
Burlington, Massachusetts
Daniel Lam, MD
Pritzker School of Medicine
University of Chicago Chicago, Illinois
Dann Martin, MD
Radiology
Lahey Hospital and Medical Center
Burlington, Massachusetts
William A. Mehan Jr., MD
Attending Neuroradiologist
Massachusetts General Hospital Boston, Massachusetts
Toshio Moritani, MD, PhD
Clinical Professor of Radiology
University of Michigan Medicine
Ann Arbor, Michigan
Daniel L. Noujaim, MD
Neuroradiologist
Department of Radiology
Beaumont Hospital
Dearborn, Michigan
Samir Noujaim, MD
Professor of Radiology
Division of Neuroradiology
Oakland University William Beaumont School of Medicine
Royal Oak, Michigan
Omar Parvez, MD
Neuroradiology Clinical and Research Fellow
Massachusetts General Hospital Boston, Massachusetts
Aaron B. Paul, MD
Staff Neuroradiologist
Lahey Hospital and Medical Center
Burlington, Massachusetts
Victor Hugo Perez Perez, MD
Neurosurgeon
UMAE Centro Médico Nacional
Mexico City, Mexico
Bruno Policeni, MD
Clinical Professor of Radiology
University of Iowa Hospital and Clinics
Iowa City, Iowa
Otto Rapalino, MD
Instructor in Radiology
Harvard Medical School
Assistant Radiologist
Massachusetts General Hospital Boston, Massachusetts
Katherine L. Reinshagen, MD
Instructor in Radiology
Harvard Medical School
Massachusetts Eye and Ear Boston, Massachusetts
Seyed Rezapour, MD
Hospital Medicine/Internal Medicine
Lahey Hospital and Medical Center Burlington, Massachusetts
Emily Rutan, BS
Department of Radiology
Lahey Hospital and Medical Center Burlington, Massachusetts
Juan E. Small, MD, MSc
Section Chief, Neuroradiology
Lahey Hospital and Medical Center
Burlington, Massachusetts
Nathaniel Temin, MD
Radiologist
South Shore Radiology Associates
South Weymouth, Massachusetts
Jaclyn A. Therrien, DO
Department of Diagnostic Radiology
Lahey Hospital and Medical Center Burlington, Massachusetts
Marie Tominna, DO
Oakland University William Beaumont School of Medicine
Royal Oak, Michigan
Pankaj Watal, MD
Department of Radiology
University of Iowa Hospitals and Clinics
Iowa City, Iowa
Gene M. Weinstein, MD
Clinical Fellow
Department of Radiology
Massachusetts General Hospital Boston, Massachusetts
Yun Sean Xie, MD Neuroradiologist
Department of Radiology
Baptist M&S Imaging
San Antonio, Texas
Fang Frank Yu, MD Neuroradiology Fellow
Massachusetts General Hospital Boston, Massachusetts
Preface
One of the few guarantees in life is that things will change. Disease is dynamic. The human body’s interaction with disease is adaptive. Our management of disease results in alterations. Therefore, it is important to consider that our most utilized imaging modalities take only a snapshot of the current state of a disease process. As such, they provide us with a static depiction of a disease entity. Inevitably, there will be gaps when we base our understanding of
disease on a static visual database. These gaps lead to a partial and inadequate conceptualization of disease. It follows that when a disease presentation varies from what we have seen before, we are naturally confused. Doesn’t it make sense to learn about a disease process not as a static entity with a classic appearance, but instead as a dynamic process which evolves? This book is meant to bridge the gaps.
Acknowledgments
The editors would like to gratefully acknowledge the wonderful team at Elsevier including Robin Carter and Russell Gabbedy (Content Strategists), Ann R. Anderson (Content Development Specialist), Mandy Mincher (Production Manager), and Ryan Cook (Designer) for their help, support, and guidance throughout the making of this book. It has been a privilege and a pleasure to work with you. In addition, we are indebted to the talented team
at Amirsys including Laura C. Wissler, MA, for her beautiful and inspired illustrations, as well as Richard Coombs, MS, and Lane R. Bennion, MS (contributing illustrators). Lastly, the completion of this book would not have been possible without the help of Carol Spencer, the Medical Library Director at Lahey Hospital and Medical Center.
1 Brain Parenchymal Hematoma Evolution
Juan E. Small
INTRODUCTION
Magnetic resonance imaging (MRI) can differentiate between acute, subacute, and chronic hemorrhage because of its sensitivity and specificity to hemoglobin degradation products. Therefore the imaging interpreter is, with proper knowledge, able to estimate the age of a brain parenchymal hematoma. The blood products in a hematoma evolve through a predictable variation in hemoglobin oxygenation states and hemoglobin byproducts. This predictable pattern of hematoma evolution over time leads to a specific pattern of changing signal intensities on conventional MRI. There are limitations to the accuracy of hematoma age interpretation. Several direct and indirect factors, including the operating field strength of the magnet, the mode of image acquisition, and a wide range of biologic factors particular to the patient, may affect the imaging evolution of a parenchymal hematoma. Despite substantial variability, it is generally accepted that five stages of parenchymal hemorrhage can be distinguished by MRI. A basic understanding of the biochemical evolution of brain parenchymal hemorrhage and magnetic properties that affect MRI signal are essential for interpretation.
TEMPORAL EVOLUTION: OVERVIEW
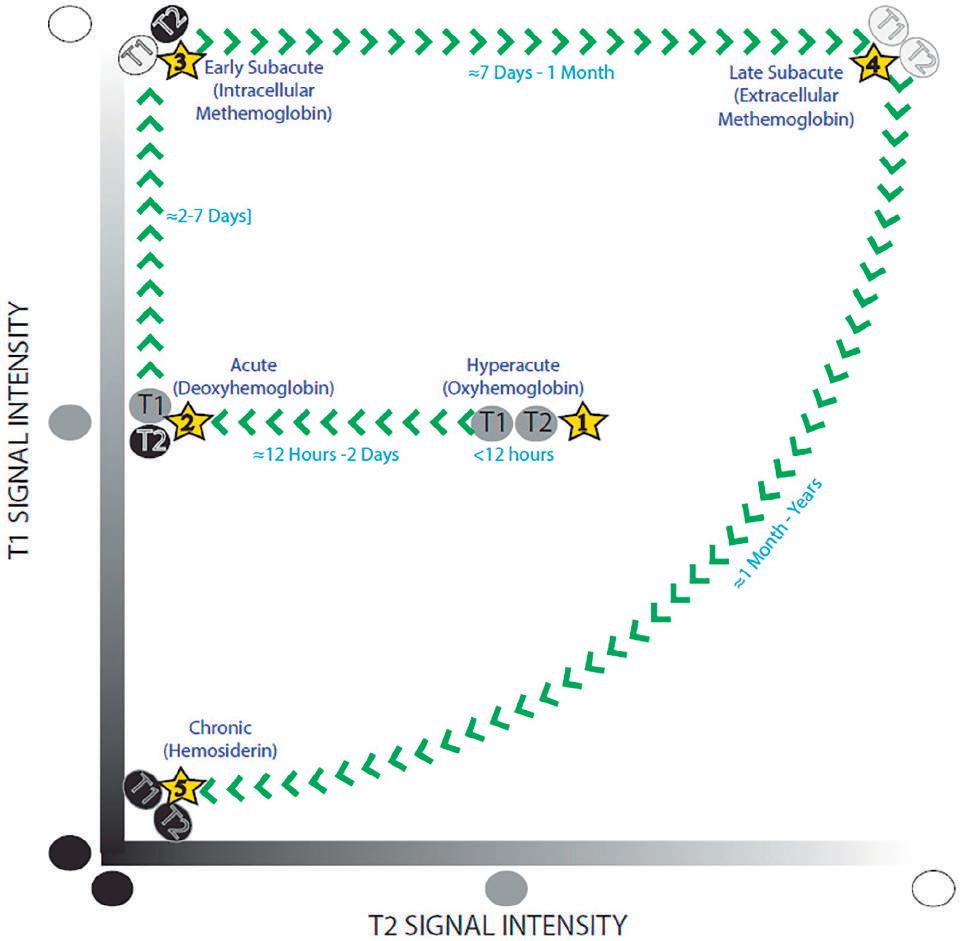
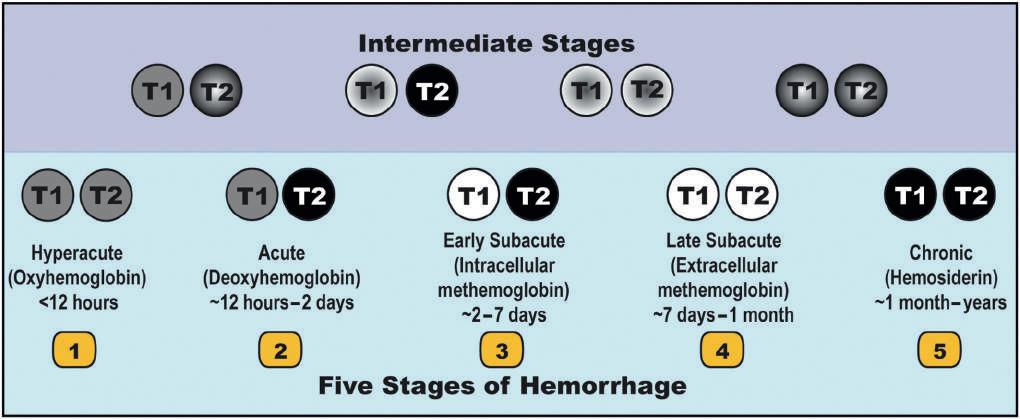
A well-described pathophysiologic process of evolution and resorption for parenchymal hemorrhage involves five distinct phases (Fig. 1.1).
With this knowledge, the imaging interpreter can often identify the relative age of a brain parenchymal hematoma based on the T1 and T2 characteristics of the collection. However, it is important to realize that hematoma evolution is a fluid process (without static or punctuated steps). Therefore, stages of hemorrhage commonly coexist within the same hematoma because hemoglobin degradation proceeds at variable rates in the center versus the periphery of a single hematoma cavity. By convention, the most mature form of hemoglobin present defines the stage of hematoma evolution (Fig. 1.2).
TEMPORAL EVOLUTION: IN GREATER DEPTH
Extravascular blood in a hemorrhagic collection remains as oxyhemoglobin for 2 to 3 hours. The immediate activation of the clotting cascade begins the process of clot formation. Deoxyhemoglobin begins to form at the periphery of the hematoma. Eventually, the failure of metabolic pathways preventing oxidation of heme iron results in conversion of hemoglobin to methemoglobin. In the hyperacute stage, parenchymal hemorrhage is a liquid almost completely composed of intracellular oxygenated hemoglobin.
Over the course of a few hours, a heterogeneous blood clot forms within the hematoma cavity, composed of red blood cells, platelets, and serum. In the acute phase, intracellular hemoglobin becomes deoxygenated. Vasogenic edema develops in the surrounding brain parenchyma. In the early subacute phase, deoxyhemoglobin is gradually converted to intracellular methemoglobin. Then, in the late subacute phase, lysis of red blood cells leads to the release of methemoglobin into the extracellular space. During this time, the surrounding vasogenic edema slowly begins to decrease and the clot slowly retracts. In the chronic stage, macrophages and glial cells phagocytose the hematoma, leading to intracellular ferritin and hemosiderin. Eventually, the hematoma resolves and leaves a posthemorrhagic cavity with hemosiderin-stained walls.
It is critical to realize that Fig. 1.1 represents a simplified version of events designed to aid in memory. As noted previously, hematoma evolution is a fluid process (without static or punctuated steps). Stages of hemorrhage commonly coexist within the same hematoma because hemoglobin degradation proceeds at variable rates in the center versus the periphery of a single hematoma cavity (Figs. 1.3 and 1.4).
Of note, chronic posthemorrhagic parenchymal cavities may collapse nearly completely and appear as thin, relatively linear cavities with associated chronic blood products (Fig. 1.5).
Other sources of confusion include the presence of superimposed blood products of differing ages (acute or subacute hemorrhage in an area of subacute to chronic blood) or the presence of a hemorrhagic fluid level (Fig. 1.6). The presence of a blood-fluid level is moderately sensitive and highly specific for hemorrhage resulting from an underlying coagulopathy.
A NOTE ON GRADIENT ECHO SEQUENCES
Gradient echo (GRE) sequences are extremely sensitive to the paramagnetic and superparamagnetic effects of some hemoglobin breakdown products (deoxyhemoglobin, intracellular methemoglobin, ferritin, and hemosiderin). Hyperacute hemorrhage on GRE demonstrates a hypointense rim (deoxyhemoglobin) surrounding the isointense core (oxyhemoglobin). Acute and early subacute hemorrhage demonstrates diffuse hypointensity (due to deoxyhemoglobin and intracellular methemoglobin respectively). Late subacute hemorrhage demonstrates a hypointense rim (ferritin and/or hemosiderin) surrounding the hyperintense core (extracellular methemoglobin). Large areas of chronic hemorrhage demonstrate a heterogeneous/irregular hypointense rim (due to ferritin and/or hemosiderin) surrounding a posthemorrhagic encephalomalacic cavity. GRE images are not very helpful in estimating the age of small hemorrhagic foci because these appear hypointense throughout.
Figure 1.1. Five stages of parenchymal hematoma evolution on magnetic resonance imaging. One can easily remember the T1 and T2 characteristics of an evolving hematoma by memorizing this figure. Start from the center of the figure and move according to the direction of the arrows to remember the signal characteristics of the five distinct phases of hematoma evolution.
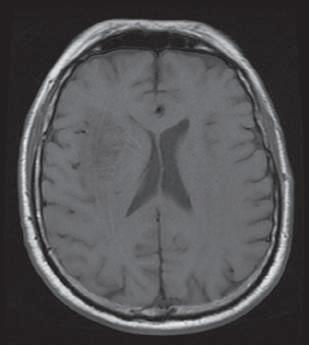
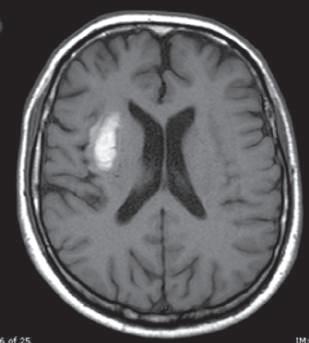
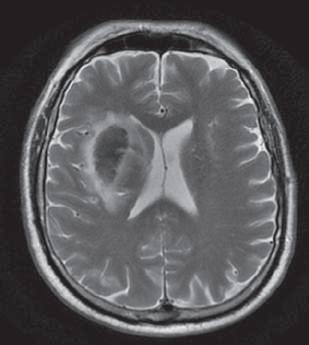
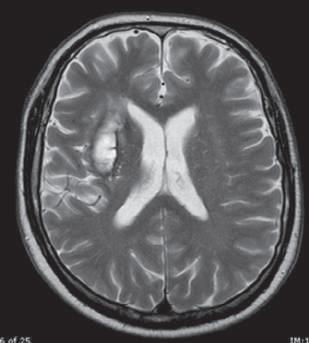
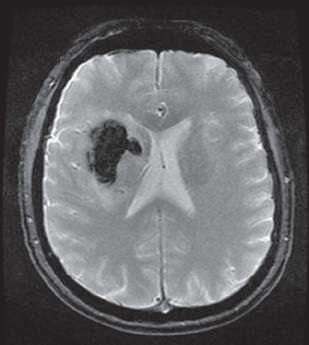
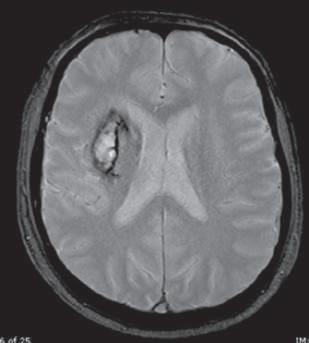
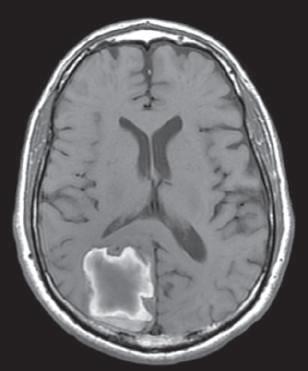
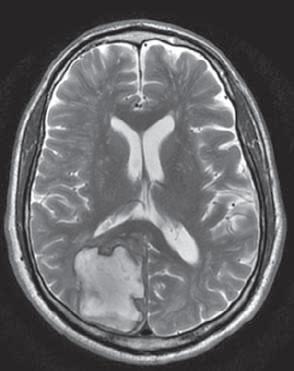
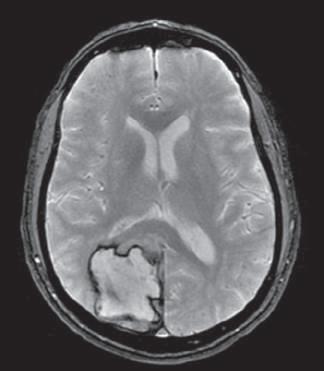
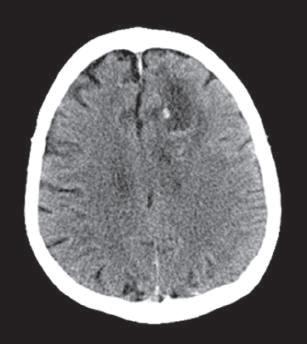
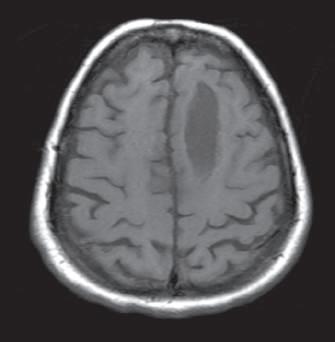
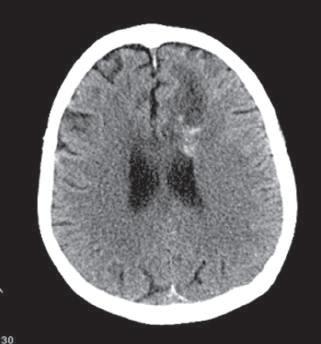
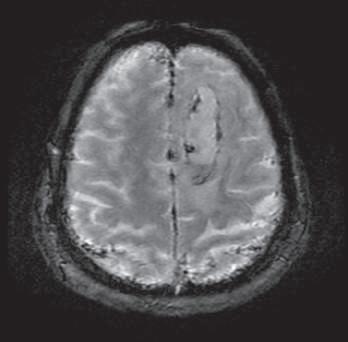
Figure 1.2. Parenchymal hemorrhage at 36 hours and at 1 month after initial presentation. At 36 hours (acute phase), T2 signal is low and T1 signal remains intermediate consistent with intracellular deoxyhemoglobin. There is diffuse hypointensity on the gradient echo (GRE) image due to the paramagnetic effects of deoxyhemoglobin. At 1 month (end of late subacute phase), central T1 and T2 hyperintensity is consistent with extracellular methemoglobin, while peripheral T1 and T2 low signal is consistent with hemosiderin. The rim is hypointense on the GRE image due to the superparamagnetic effects of hemosiderin. The hematoma is smaller due to retraction.
Figure 1.3. By convention, the most mature form of hemoglobin present defines the stage of hematoma evolution. The five stages of hemorrhage depicted in Fig. 1.1 are seen in the bottom row of Fig. 1.3. Each stage depicts the most mature form of hemoglobin present in the hematoma. They are not meant to imply homogeneity. The top row depicts intermediate stages of hematoma evolution between each step. In the intermediate stages, the most mature form of hemorrhage is seen at the periphery.
25days
6months
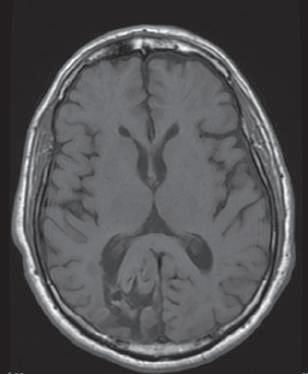
1.4. Parenchymal hemorrhage 25 days and 6 months after initial presentation. At 25 days (between early subacute to late subacute phase), there is a T1 hyperintense rim and central hypointensity consistent with methemoglobin surrounding deoxyhemoglobin. T2 signal intensity has evolved more rapidly, with near complete T2 hyperintensity, consistent with extracellular methemoglobin throughout the hematoma. At 6 months (between late subacute and chronic phases), hypointensity surrounds the encephalomalacic collapsing cavity on both T1 and T2 images consistent with hemosiderin as the most mature form of hemoglobin. The hematoma is much smaller due to retraction.
Figure
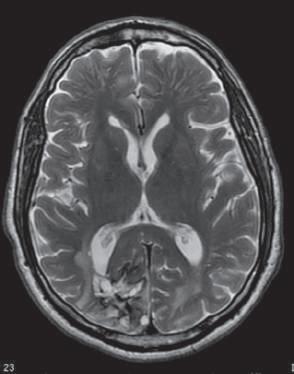
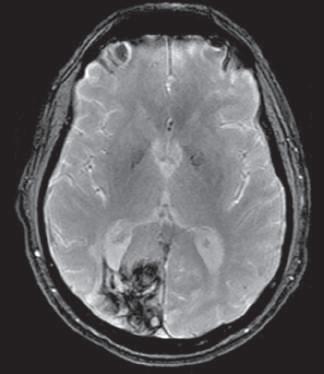
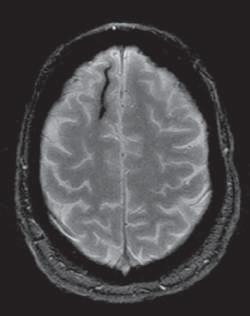
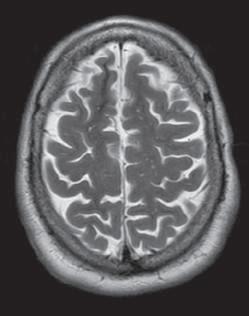
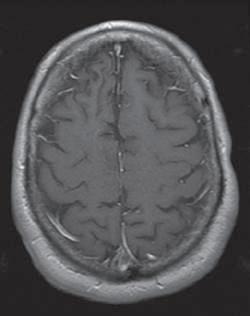
Figure 1.5. Chronic collapsed posthemorrhagic cavity. Axial magnetic resonance images (A–C) and computed tomography (CT) image (D) of the brain demonstrate hemosiderin within a thin collapsed T2 and T1 hypointense posthemorrhagic cavity barely visible on the CT image. GRE, Gradient echo.
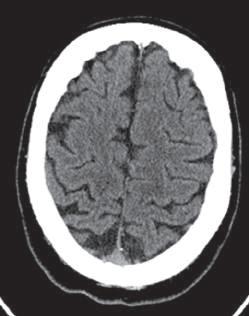
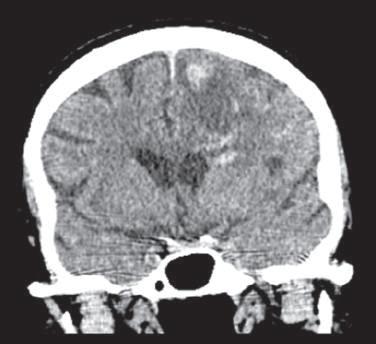
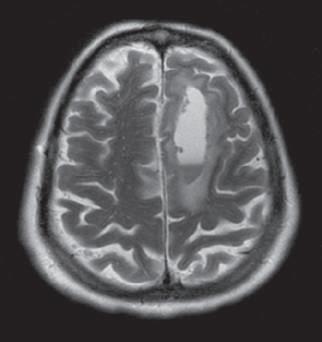
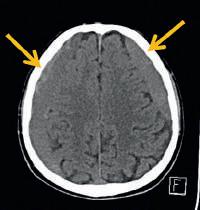
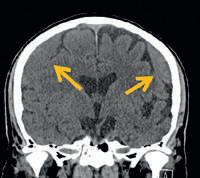
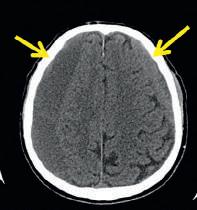
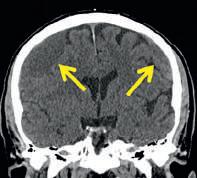
Figure 1.6. Sources of confusion—superimposed blood products of differing ages and hemorrhagic fluid levels. A patient on anticoagulation with a prior left frontal parenchymal hematoma and known subacute left frontal hemorrhagic cavity presents after an acute exacerbation. Coronal (A) and axial (B and C) computed tomography images at the time of the acute exacerbation demonstrate a hypodense left frontal hemorrhagic cavity with peripheral areas of hyperdense acute hemorrhage (arrows). There are also foci of acute subarachnoid hemorrhage (arrowheads). Axial T2 (D), axial T1 (E), and axial gradient echo (F) magnetic resonance imaging (MRI) images of the brain performed on the same day demonstrate a hemorrhagic fluid level within the subacute hemorrhagic cavity. Without the presence of an appropriate history, and considering the presence of multiple confounding factors, it would be difficult to predict the age of this hemorrhage based on the MRI signal characteristics alone.
SUGGESTED READING
Allkemper T, Tombach B, Schwindt W, et al. Acute and subacute intracerebral hemorrhages: comparison of MR imaging at 1.5 and 3.0 T–initial experience. Radiology. 2004;232(3):874–881.
Aygun N, Masaryk TJ. Diagnostic imaging for intracerebral hemorrhage. Neurosurg Clin N Am. 2002;13(3):313–334, vi.
Gomori JM, Grossman RI. Mechanisms responsible for the MR appearance and evolution of intracranial hemorrhage. Radiographics 1988;8(3):427–440.
Kidwell CS, Wintermark M. Imaging of intracranial haemorrhage. Lancet Neurol. 2008;7(3):256–267.
Parizel PM, Makkat S, Van Miert E, et al. Intracranial hemorrhage: principles of CT and MRI interpretation. Eur Radiol. 2001;11(9):1770–1783.
Pfleger MJ, Hardee EP, Contant CF Jr, et al. Sensitivity and specificity of fluid-blood levels for coagulopathy in acute intracerebral hematomas. AJNR Am J Neuroradiol. 1994;15(2):217–223.
2 Subdural Hemorrhage and Posttraumatic Hygroma
Lindsay A.N. Duy, Juan E. Small
INTRODUCTION
The accurate age determination of a subdural hemorrhage is one of the most common and basic assessments in the setting of head trauma. On computed tomography (CT), the classic descriptions of blood products within the subdural space relate to density changes which evolve over time. These changes reflect the evolution from acute blood to clot formation, clot retraction, clot lysis, and eventual resorption. Based on the density of the subdural collection, subdural hematomas (SDHs) are classically
Periostealdura
Meningealdura
Bordercells
Arachnoidbarrier
Subarachnoidspace
Piamater Brain
subdivided into acute, subacute, and chronic SDHs. Although the process of estimation is generally straightforward in everyday clinical practice, several variations must be taken into account to avoid confusion. This confusion may be ameliorated by focusing first on the relevant anatomy and then on the different types of subdural collections, including both SDHs and subdural hygromas.
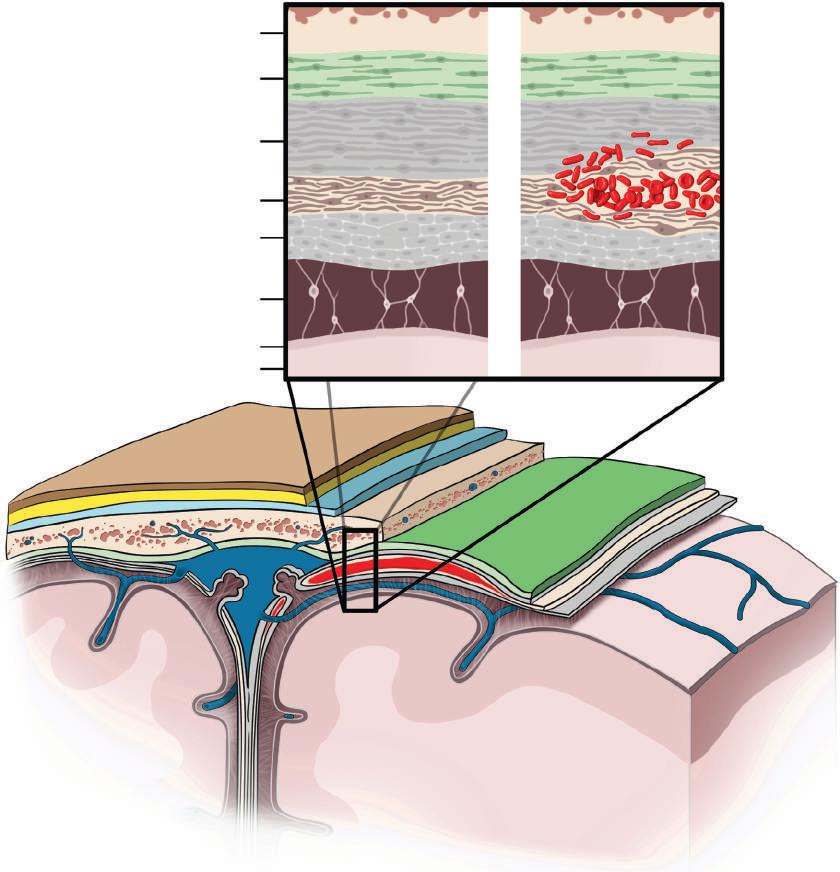
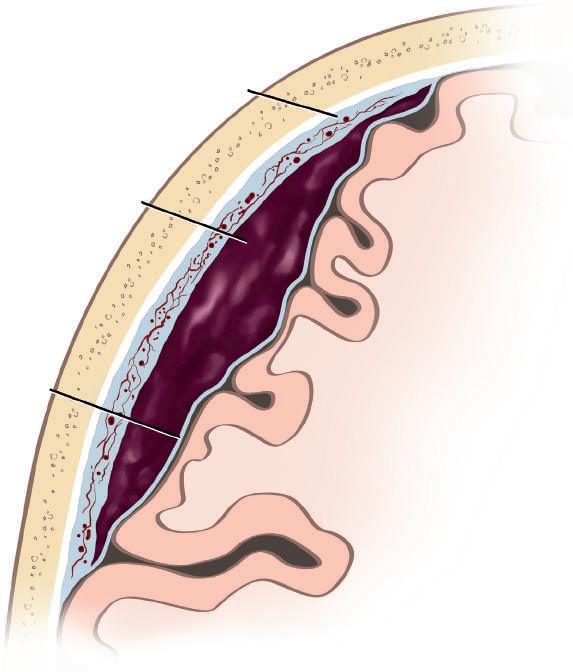
An SDH is a typically crescent shaped extraaxial collection of blood within the innermost layer of the dura, designated the dural border cell layer (Fig. 2.1).
Figure 2.1. A subdural hematoma is a crescent-shaped extraaxial collection of blood within the innermost layer of the dura, as depicted in red at the bottom of the illustration. A magnified view of the meningeal layers between the inner table of the skull and the cerebral cortex is presented in the top of the illustration. The dura consists of several different layers of adherent cells. The innermost layer is the dural border cell layer. It is within this layer that subdural hematomas form.
Bone
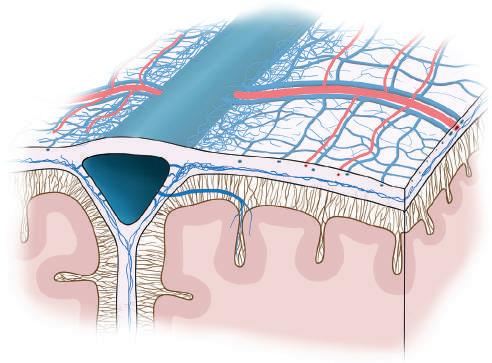
Figure 2.2. Dural vasculature. Both dural arteries and veins exist along the superior and inferior aspects of the dura. Although superficial meningeal arteries (MA) and veins (MV) are superficially located, a rich dural venous plexus (DP) likely involved in cerebrospinal fluid resorption is located within the inner portion of the dura. This dural plexus is most dense parasagittally. BV, Bridging vein; PA, penetrating arteriole extending to inner dural plexus; SS, superior sagittal sinus. (Modified from Mack J, Squier W, Eastman JT. Anatomy and development of the meninges: implications for subdural collections and CSF circulation. Pediatr Radiol. 2009;39:200–210.)
The fact that SDHs form within the innermost layer of the dura is of crucial importance for a conceptual understanding of the different types of subdural collections. This is because there is a rich venous plexus within this layer (Fig. 2.2). The small caliber of these vascular structures is beyond the resolution of our current imaging. Although there is still much that is unknown about its function, this venous plexus is thought to play a role in cerebrospinal fluid (CSF) resorption into the venous system.
SUBDURAL HEMATOMA EVOLUTION: OVERVIEW
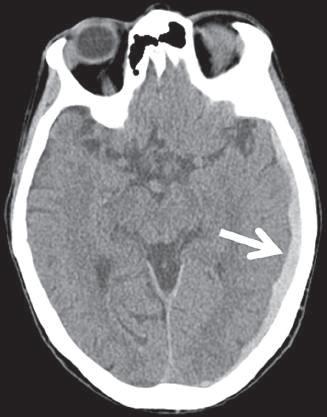
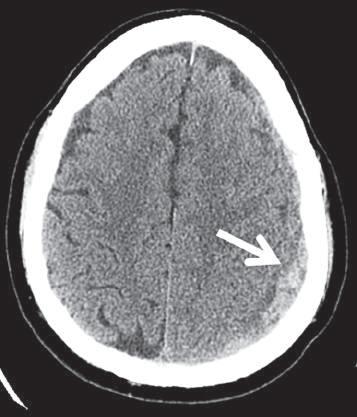
At its most basic, there are two types of traumatic subdural collections: SDH and subdural hygroma. An acute SDH represents acute blood products with or without clot formation. On CT imaging, an acute SDH often presents as a hyperdense subdural collection (Fig. 2.3).
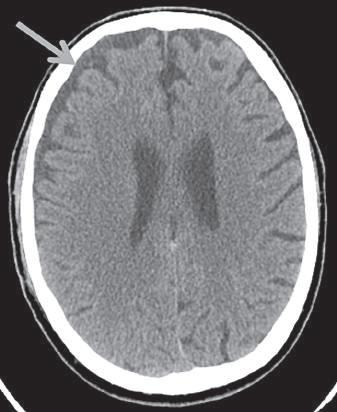
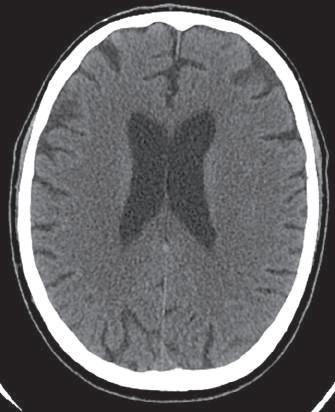
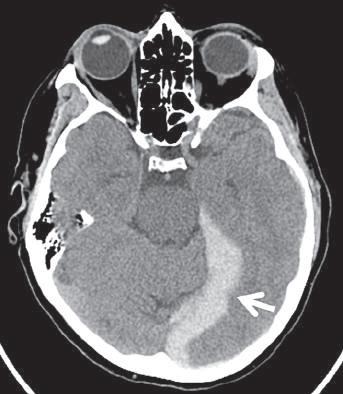
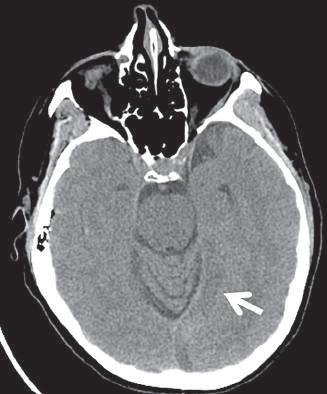
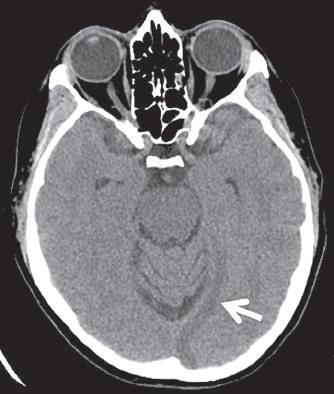
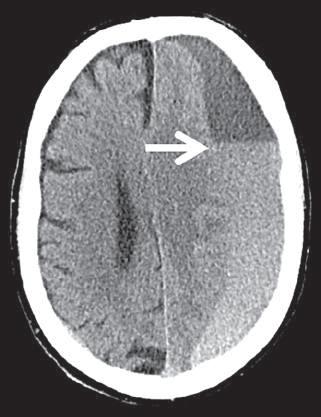
A subdural hygroma is the accumulation of clear or xanthochromic CSF within the subdural space. An acute subdural hygroma results from the acute accumulation of CSF within the dural border cell layer. This can result from an acute tear in both the arachnoid and the dural border cell layer, resulting in communication of these two spaces. Alternatively, this can also result from the acute impairment of CSF resorption (as often seen in the setting of subarachnoid hemorrhage), affecting the intradural venous plexus along the inner layer of the dura. On CT imaging, an acute subdural hygroma exists when a CSF isodense or nearly isodense subdural collection accumulates acutely (Fig. 2.4).
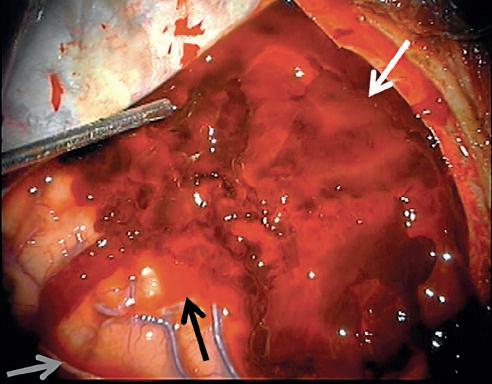
Of course, the presence of a subdural hygroma and an SDH is not mutually exclusive. Varying degrees and combinations of clotted blood, unclotted blood, bloody CSF, and clear CSF can therefore be present within an acute subdural collection (Fig. 2.5).
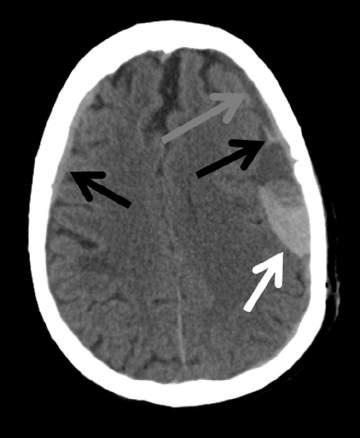
These varying degrees and combinations of clot, blood, and bloody CSF are what lead to the marked heterogeneity of patient imaging presentations (Fig. 2.6).
The variable concentrations of either blood or CSF within a specific area of the acute subdural collection lead to different fluid properties and therefore different fluid behavior as time elapses. In
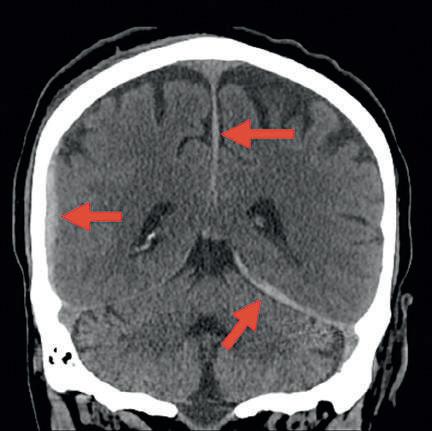
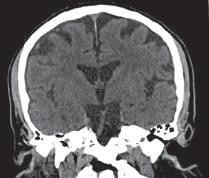
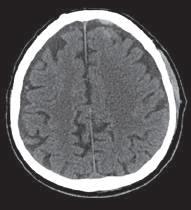
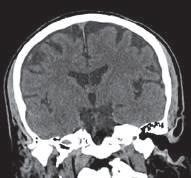
Figure 2.3. Acute subdural hematoma. A coronal image, performed after an acute fall several hours prior, demonstrates left tentorial, parafalcine, and right hemispheric hyperdense acute subdural hematomas (red arrows)
other words, many portions of these subdural collections are not simply “blood” or “hematoma.” It should be now readily apparent why the imaging characteristics of these collections generally do not conform to the magnetic resonance imaging (MRI) stages of hematoma evolution so firmly established for parenchymal hematomas (Fig. 2.7).
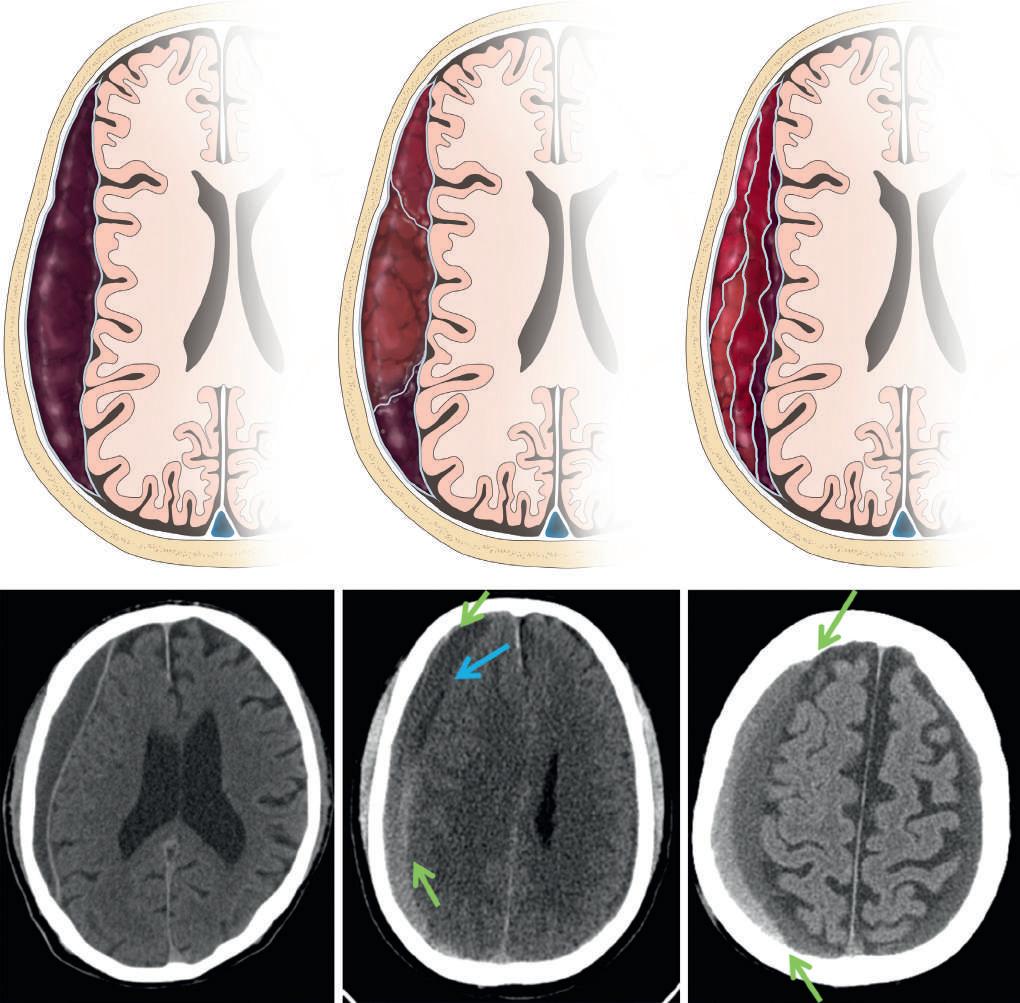
Both SDHs and subdural hygromas can be either acute or chronic. SDHs are classified into acute, subacute, or chronic categories, depending on the amount of time elapsed since the time of injury. As previously noted, this determination is classically based on the density of the collection. At its most basic, the CT density of a simple SDH depends on the time interval between the bleeding episode and imaging (Fig. 2.8).
Unfortunately, no uniformity exists as to the terminology and determination of these categories. For instance, categorization of an acute SDH may be considered for a collection less than a week old, the subacute category reserved for collections ranging in age from 1 to 3 weeks, and the chronic category reserved for a collection older than 3 weeks. A prerequisite for dating by this method is knowledge of the exact time of onset, which is frequently absent in routine clinical practice. Alternatively, acute SDH may be defined by blood products that are still clotted, subacute SDH reserved for collections in which the clot has lysed (generally 2 days to several days), and chronic SDH for collections older than 3 weeks. This method also leads to difficulties because the degree of clot formation can vary markedly, based on our previous discussion. Lastly, various patterns of subdural hemorrhage may be seen other than simply a collection of uniform density (Fig. 2.9).
Perhaps the most important differentiating feature between acute and chronic SDHs is the formation of neomembranes encapsulating the hemorrhage. Intracranial reparative processes begin immediately after the acute separation of the dural border cell layer and formation of an SDH. There is proliferation of the dural border cell layer shortly after injury, fibroblast appearance within a day, formation of an outer membrane within a week, and formation of an inner membrane in approximately 3 weeks (Fig. 2.10).
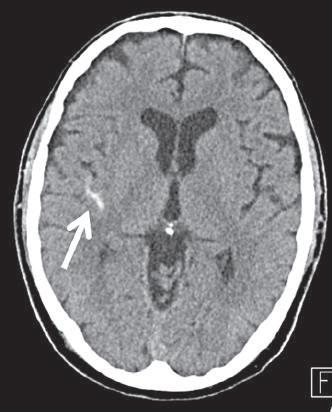
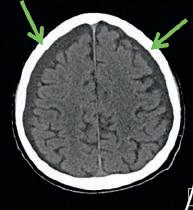
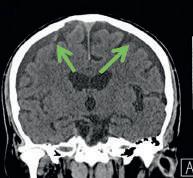
Figure 2.4. Acute subdural hygroma. Axial computed tomography image conducted shortly after a motor vehicle accident (A) demonstrates hyperdense subarachnoid hemorrhage within the right sylvian fissure (white arrow). One day later (B), a hypodense collection consistent with an acute subdural hygroma is seen overlying the right frontal lobe (gray arrow). Complete resolution of the collection is evident 1 month later (C)
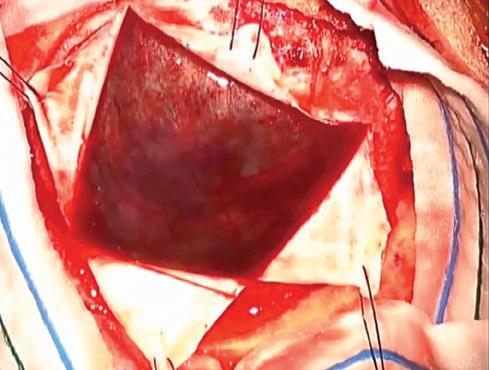
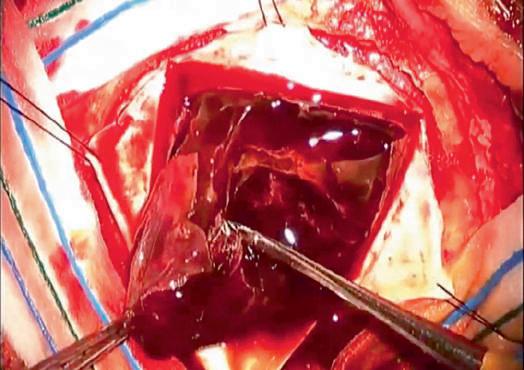
Figure 2.5. Intraoperative photograph of craniotomy for evacuation of an acute subdural hematoma. Notice the large semisolid heterogeneous dark-red subdural blood clot (white arrow) between the overlying folded dura and the underlying brain. The semisolid gelatinous consistency of the acute subdural clot differs from that of the viscous fluid of the unclotted acute blood (black arrow) and from that of the less viscous bloody cerebrospinal fluid evident at the edge of the picture (gray arrow) (Courtesy Dr. Kavian Shahi.)
Figure 2.6. Axial noncontrast computed tomography image of acute subdural collections. Notice the space-occupying, masslike subdural blood clot (white arrow). The morphology and density of the clot differs from that of the more fluid-like morphology of acute only partially clotted hyperdense blood (black arrows) and even that of the bloody cerebrospinal fluid (CSF) (gray arrow). Notice the bloody CSF is intermediate in density between the hyperdense blood products and the fluid density CSF evident anteriorly between the hemispheres.
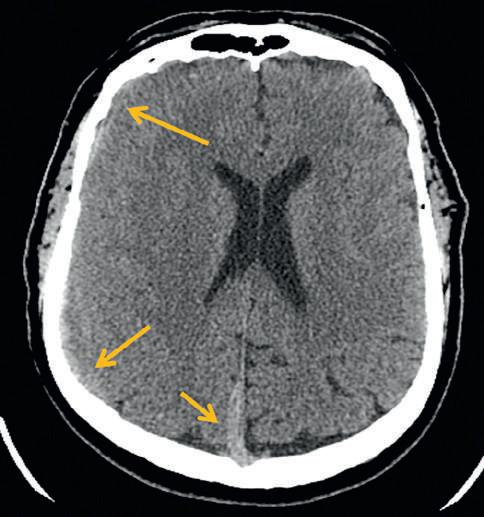
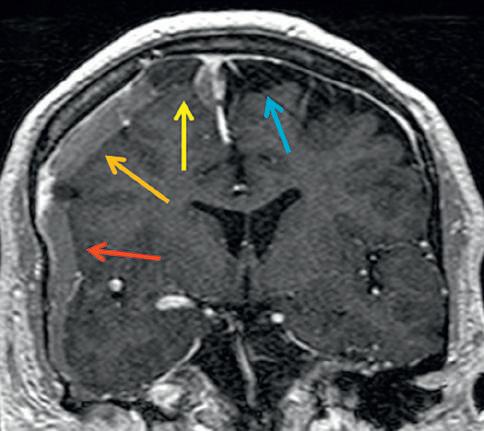
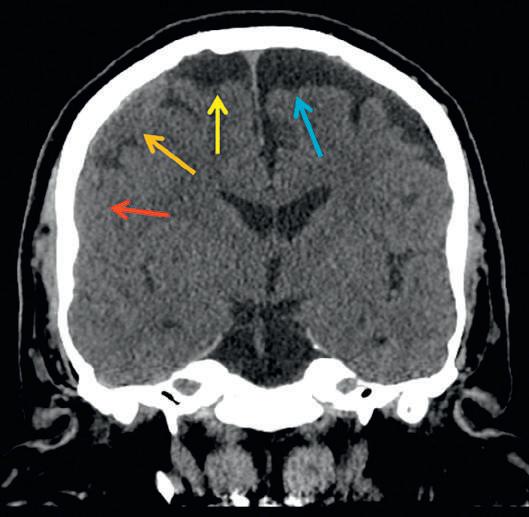
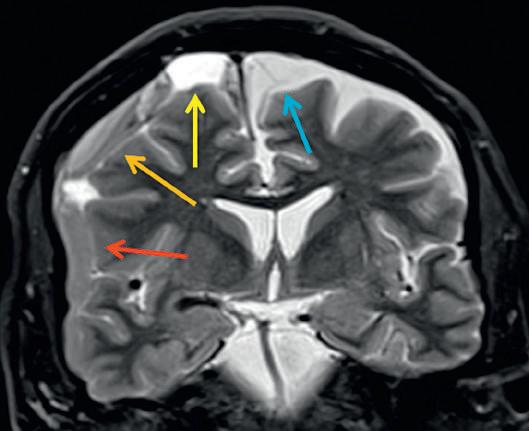
Figure 2.7. Variable concentrations of blood and cerebrospinal fluid (CSF) in a subdural collection lead to differentiating imaging features of subdural hematoma and subdural CSF. Axial noncontrast computed tomography (CT) image of the brain (A) demonstrates right hemispheric and parafalcine subdural collections (orange arrows). Comparing coronal noncontrast CT (B) to coronal post contrast T1 (C) and coronal T2 magnetic resonance (D) images of the brain demonstrates to better advantage the differences between various portions of the right hemispheric subdural collection. In particular, on the coronal T2 image, the differences between the normal left-sided subarachnoid space (blue arrow), right-sided subdural hematoma (red arrow), right-sided subdural clot (orange arrow), and subdural CSF (yellow arrow) are readily evident.
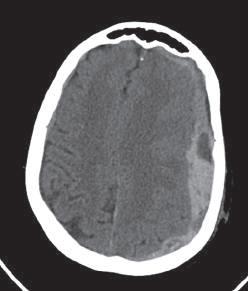
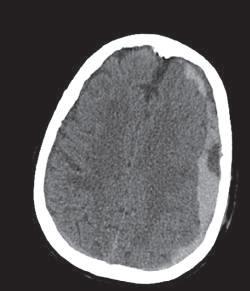
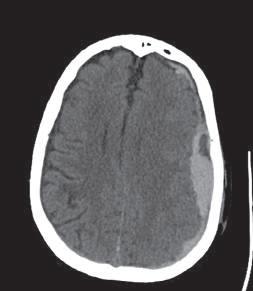
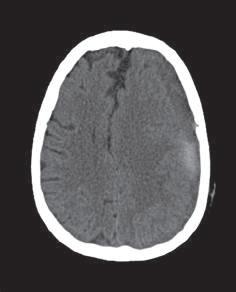
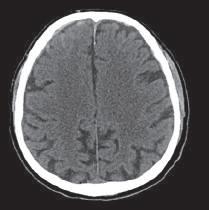
Figure 2.8. Classic descriptions of acute, subacute, and chronic subdural hematoma density. A left tentorial hyperdense subdural hematoma is evident on an axial computed tomography image a few hours after head trauma (A, white arrow). At 2.5 weeks, heterogeneously isodense blood products are evident (B, white arrow). By 4 weeks, the hematoma is entirely hypodense as compared with the brain parenchyma (C, white arrow).
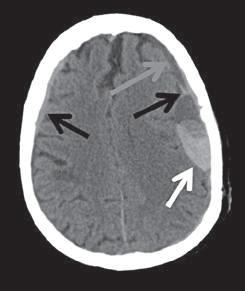
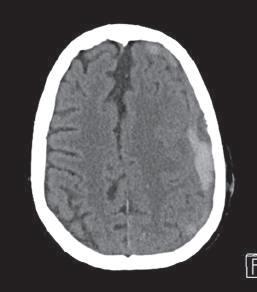
Figure 2.9. Different patterns of subdural density may be seen. An acute homogeneously hyperdense subdural hematoma (A, arrow) easily lends itself to a word description of its density. Other patterns of hemorrhage, including heterogeneous (B, arrow) and layering (C, arrow) collections, do not as easily conform to simply hyperdense, isodense, or hypodense categories. Estimating age based on density is therefore more challenging for complex collections.
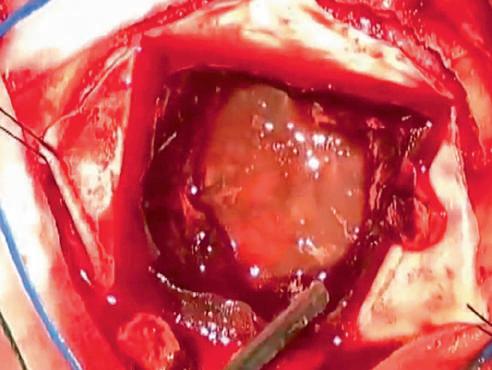
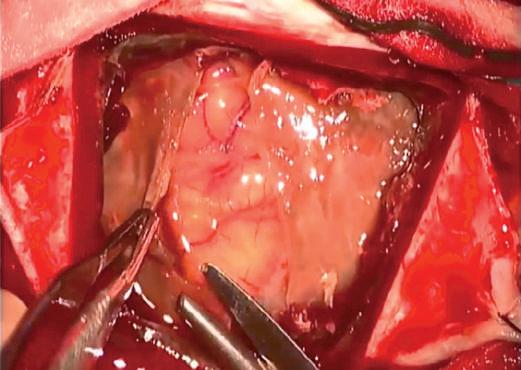
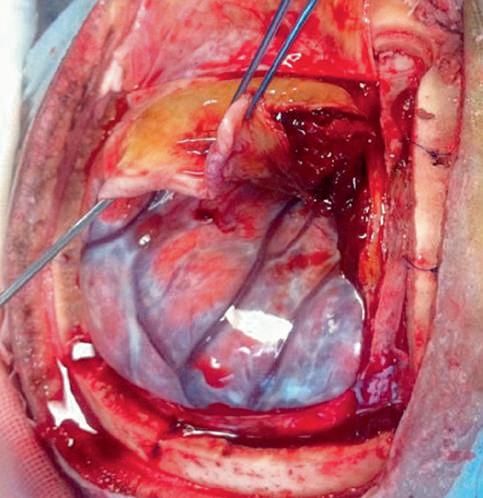
Figure 2.10. Neomembranes encapsulate a chronic subdural hematoma. Operative photographs during craniotomy for chronic subdural hematoma evacuation demonstrate an outer membrane (OM) immediately under the reflected dura (A). After partial removal of the OM, the chronic subdural hematoma (CSDH) can be seen as heterogeneous old blood products (B) After removal of the chronic blood products, the inner membrane (IM) is evident (C) Only after incision of the IM can the brain be seen (D) (Courtesy Dr. Khalid Al-Kharazi.)
Outermembrane
Chronicsubduralhematoma
Innermembrane
Figure 2.11. Chronic subdural hematoma neomembrane neovascularization. Chronic subdural blood products are encapsulated within thick outer and thin inner neomembranes (blue area). Neovascularization (serpigionus red channels) predominantly involving the outer membrane accompanies neomembrane formation.
Neovascularization accompanies the formation of neomembranes and predominantly involves the outer membrane. Recurrent bleeding from these fragile vessels leads to acute on chronic hematoma expansion (Fig. 2.11).
As the neomembrane matures in the context of multiple rebleeding episodes, various layers and septations may form (Fig. 2.12). Initially, the neomembranes are thin, although they occasionally may become quite thick over time or even calcify (Fig. 2.13). The risk of rebleeding diminishes markedly with a longstanding chronic subdural collection with this advanced degree of organization.
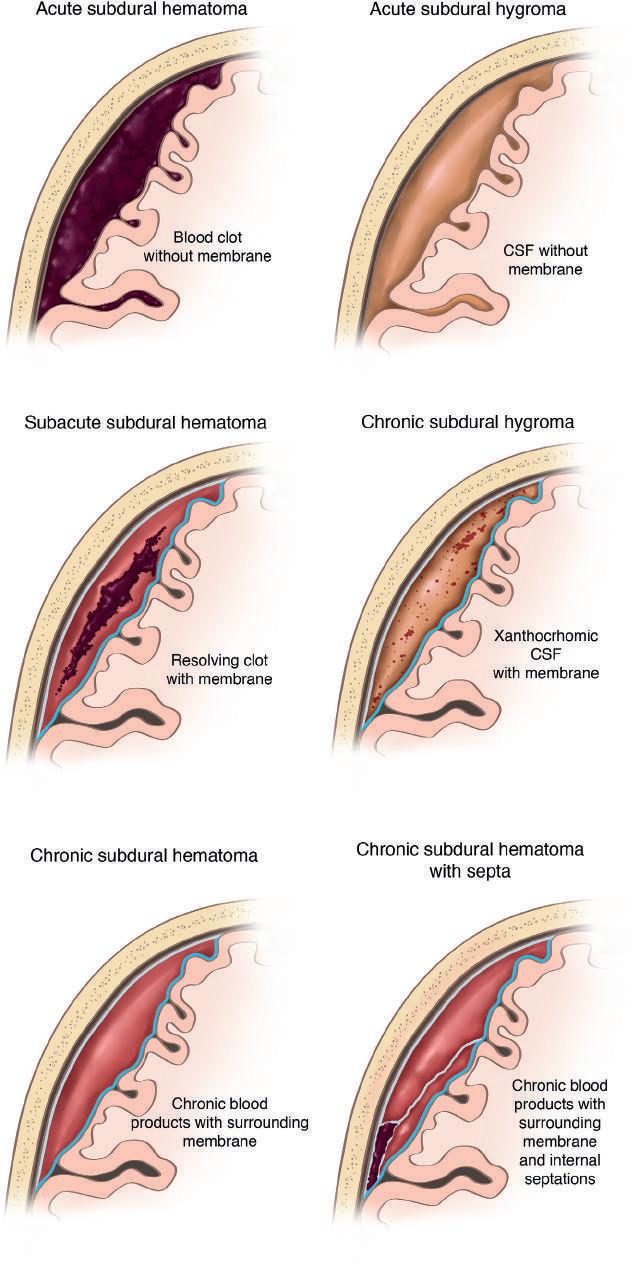
In summary, multiple patterns of SDH may be encountered by the imaging interpreter. The patterns range from acute (acute SDH and acute subdural hygroma), to subacute (subacute SDH with resolving clot, as well as subacute subdural hygroma with xanthochromic CSF), to chronic (chronic SDH with or without septations) collections (Fig. 2.14).
SUBDURAL HEMATOMA EVOLUTION: IN GREATER DEPTH
After one is equipped with the previously mentioned knowledge, the variations in the natural history of subdural collections are easier
to interpret. As noted previously, the variable concentrations of blood and/or CSF within a specific area of the acute hematoma lead to different fluid properties and therefore different fluid behavior over time (Fig. 2.15).
In addition, the knowledge of the friable nature of the neovascularity along the outer neomembrane of a chronic SDH enables the imaging interpreter to more accurately identify the presence of an acute on chronic or subacute on chronic SDH (Fig. 2.16).
DIFFERENTIAL DIAGNOSIS
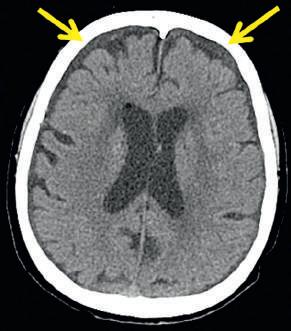
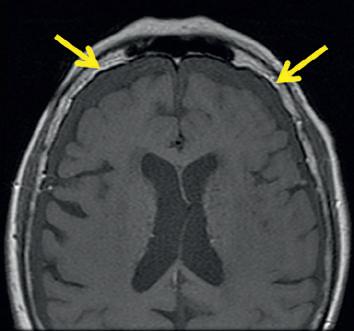
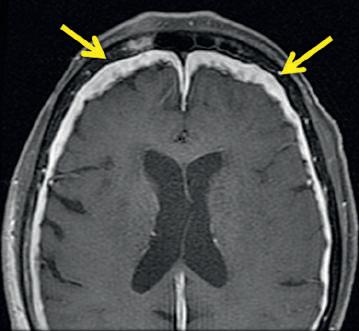
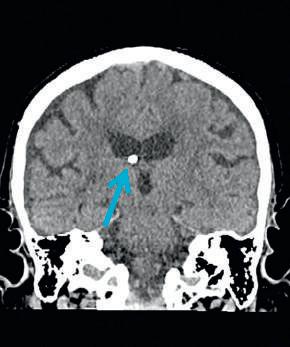
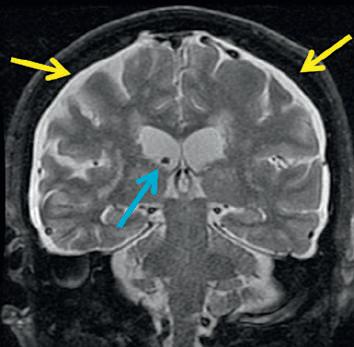
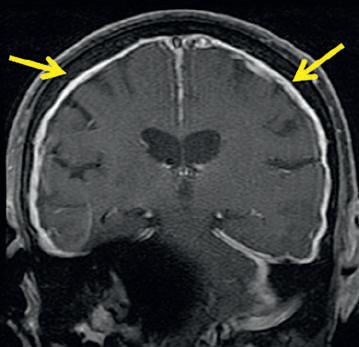
Subdural hemorrhagic and CSF collections are common and therefore by far the most reasonable diagnostic consideration of an enlarged extraaxial space. However, other more rare diagnostic considerations mimicking an SDH should at times be entertained. These include prominent dural thickening which may appear alone as a hypodense extraaxial structure on CT (Fig. 2.17) or in combination with subdural hemorrhage (Fig. 2.18) and usually due to intracranial hypotension, subdural empyema (Fig. 2.19), and impaired CSF resorption related to metastatic disease (Fig. 2.20).
Text continued on p 19
Figure 2.12. Multiple patterns of septations may be seen within chronic subdural hematomas. (A–C) Schematics and (D–F) cases. A relatively simple chronic subdural hematoma has only inner and outer membranes (A) However, radial septation (B) and/or concentric septation (C) patterns can be encountered. Case D demonstrates a simple, homogeneous, chronic hypodense right-sided subdural collection with a single membrane delineating its inner border. Case E demonstrates a complex right hemispheric subdural collection with concurrent presence of concentric (green arrows) and radial septations (blue arrow). Case F demonstrates an acute on chronic right hemispheric subdural hemorrhage collection with clear delineation of a concentric septation (green arrows) ([A–C], Modified from Abecassis IJ, Kim LJ. Craniotomy for treatment of chronic subdural hematoma. Neurosurg Clin N Am. 2017;28[2]:229-237.)
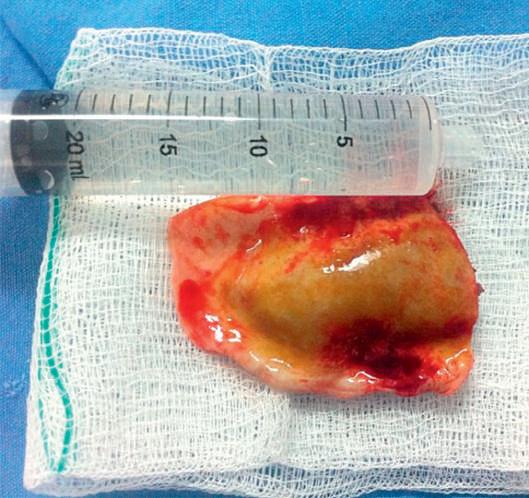
2.13. Craniotomy for resection of a chronic subdural hematoma (CSDH) with thick membranes. Directly underlying the dura, an operative photograph (A) demonstrates chronic blood clot (CSDH) enveloped by thick outer (OM) and inner membranes (IM). A photograph of the specimen resected en bloc (B) further demonstrates the marked thickness of the membranes. (Courtesy Dr. Victor Hugo Perez-Perez.)
Figure
Figure 2.14. Multiple patterns of subdural collections may be encountered on imaging. (Modified from Lee K-S. History of chronic subdural hematoma. Korean J Neurotrauma. 2015;11[2]:27–34.)
Figure 2.15. Serial axial computed tomography images performed on the same patient in Fig. 2.6 at presentation (A), 6-hour (B), 12-hour (C), 1-day (D), 1-week (E), and 2-week (F) intervals demonstrate different evolution patterns for different areas of variable blood and cerebrospinal fluid (CSF) concentrations within a subdural collection. The changes in morphology and density over time differ for the subdural blood clot (white arrow), the partially clotted acute hyperdense blood (black arrows), and the bloody CSF (gray arrow)
Presentation
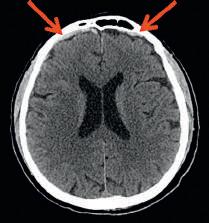
Figure 2.16. Natural history of acute/subacute on chronic subdural hematoma. Axial and coronal CT images of the brain conducted at presentation (A1–A3), 12 hours (B1–B2), 1 month (C1–C2), 2 1 2 months (D1–D2), and 3 months (E1–E2) demonstrate enlarging subdural collections. At presentation, small bilateral hyperdense subdural hematomas are evident overlying the frontal lobes (red arrows). Periodic interval increases in size are noted associated with different bouts of acute/subacute on chronic subdural hemorrhage evident at 1 month (green arrows), 2 1 2 months (orange arrows), and 3 months (yellow arrows)
12hours1month2½months3months
A1
A2
Figure 2.17. Dural thickening in a patient presenting with postural headaches. Axial computed tomography (CT) (A) and coronal CT (B) images demonstrate bilateral hemispheric extraaxial hypodensities (yellow arrows) mimicking subdural collections in a patient with a ventricular catheter in place (blue arrow). On axial T1 (C) and coronal T2 (D) images the bilateral extraaxial CT finding correlates with T1 hypointensity and T2 hyperintensity, again mimicking subdural collections (yellow arrows). However, this finding correlates with marked dural thickening and enhancement on postcontrast axial T1 (E) and coronal T1 (F) images, due to chronic intracranial hypotension. When a ventricular catheter is in place, dural thickening related to chronic overshunting should be considered.