Comparing different management options of urban forests in terms of impact and removal capacity of CO2eq,
PM2.5 and SO2 in a Mediterranean context
Antenucci E.¹, Di Pirro E.¹², di Cristofaro M.¹, Garfì V.¹², Marchetti M.²³, Lasserre B.¹²
¹ Department of Biosciences and Territory, University of Molise, Pesche (Is), Italy ² NBFC, National Biodiversity Future Center, Palermo 90133, Italy
³ Department of Architecture and Design, Sapienza University of Rome (RM) Email address of the lead presenter: e.antenucci2@studenti.unimol.it
INTRODUCTION & AIMS


Trees are recognized for their ability to provide multiple ecosystem services (ES) that can improve human health and well-being (1) Therefore, extensive tree-planting initiatives have been undertaken worldwide to address social and environmental challenges in urban areas (2) However, new trees involve planting and management activities over time (3) that cause economic and/or environmental costs and undergo to lack of space availability (4) and seedlings due to the large number of trees to be planted within these initiatives The environmental costs are often measured in terms of greenhouse gas emissions (5, 6) This study aims to identify a win- win strategy between the intensity of management activities and the maximization of ES supply. The main assumption of this study is that increased tree cover is correlated with increased ES supply (7), particularly in terms of removal of air pollutants and atmospheric carbon sequestration (8)
MATERIALS & METHODS
An urban forest implementation and growth was simulated in 1 hectare, proposing the planting of three Mediterranean oak species (Quercus ilex L , Quercus petrea (Matt ) Liebl and Quercus robur L ) adapted to different Italian climates and urban contexts The variation over time of Tree Canopy Cover (TCC) was estimated by investigating the ratio between breast and crown diameters (9) according to dendrometric models Three alternative planting density and management scenarios (i e , MAX, INT and MIN) were depicted and compared across three different target periods (i e , 2030, 2050, 2100) Scenarios reflect three different strategies to project the achievement of 100% of TCC in the short-, medium-, and long-term, all maintained through different management activities until 2100 (Figure 1)
RESULTS
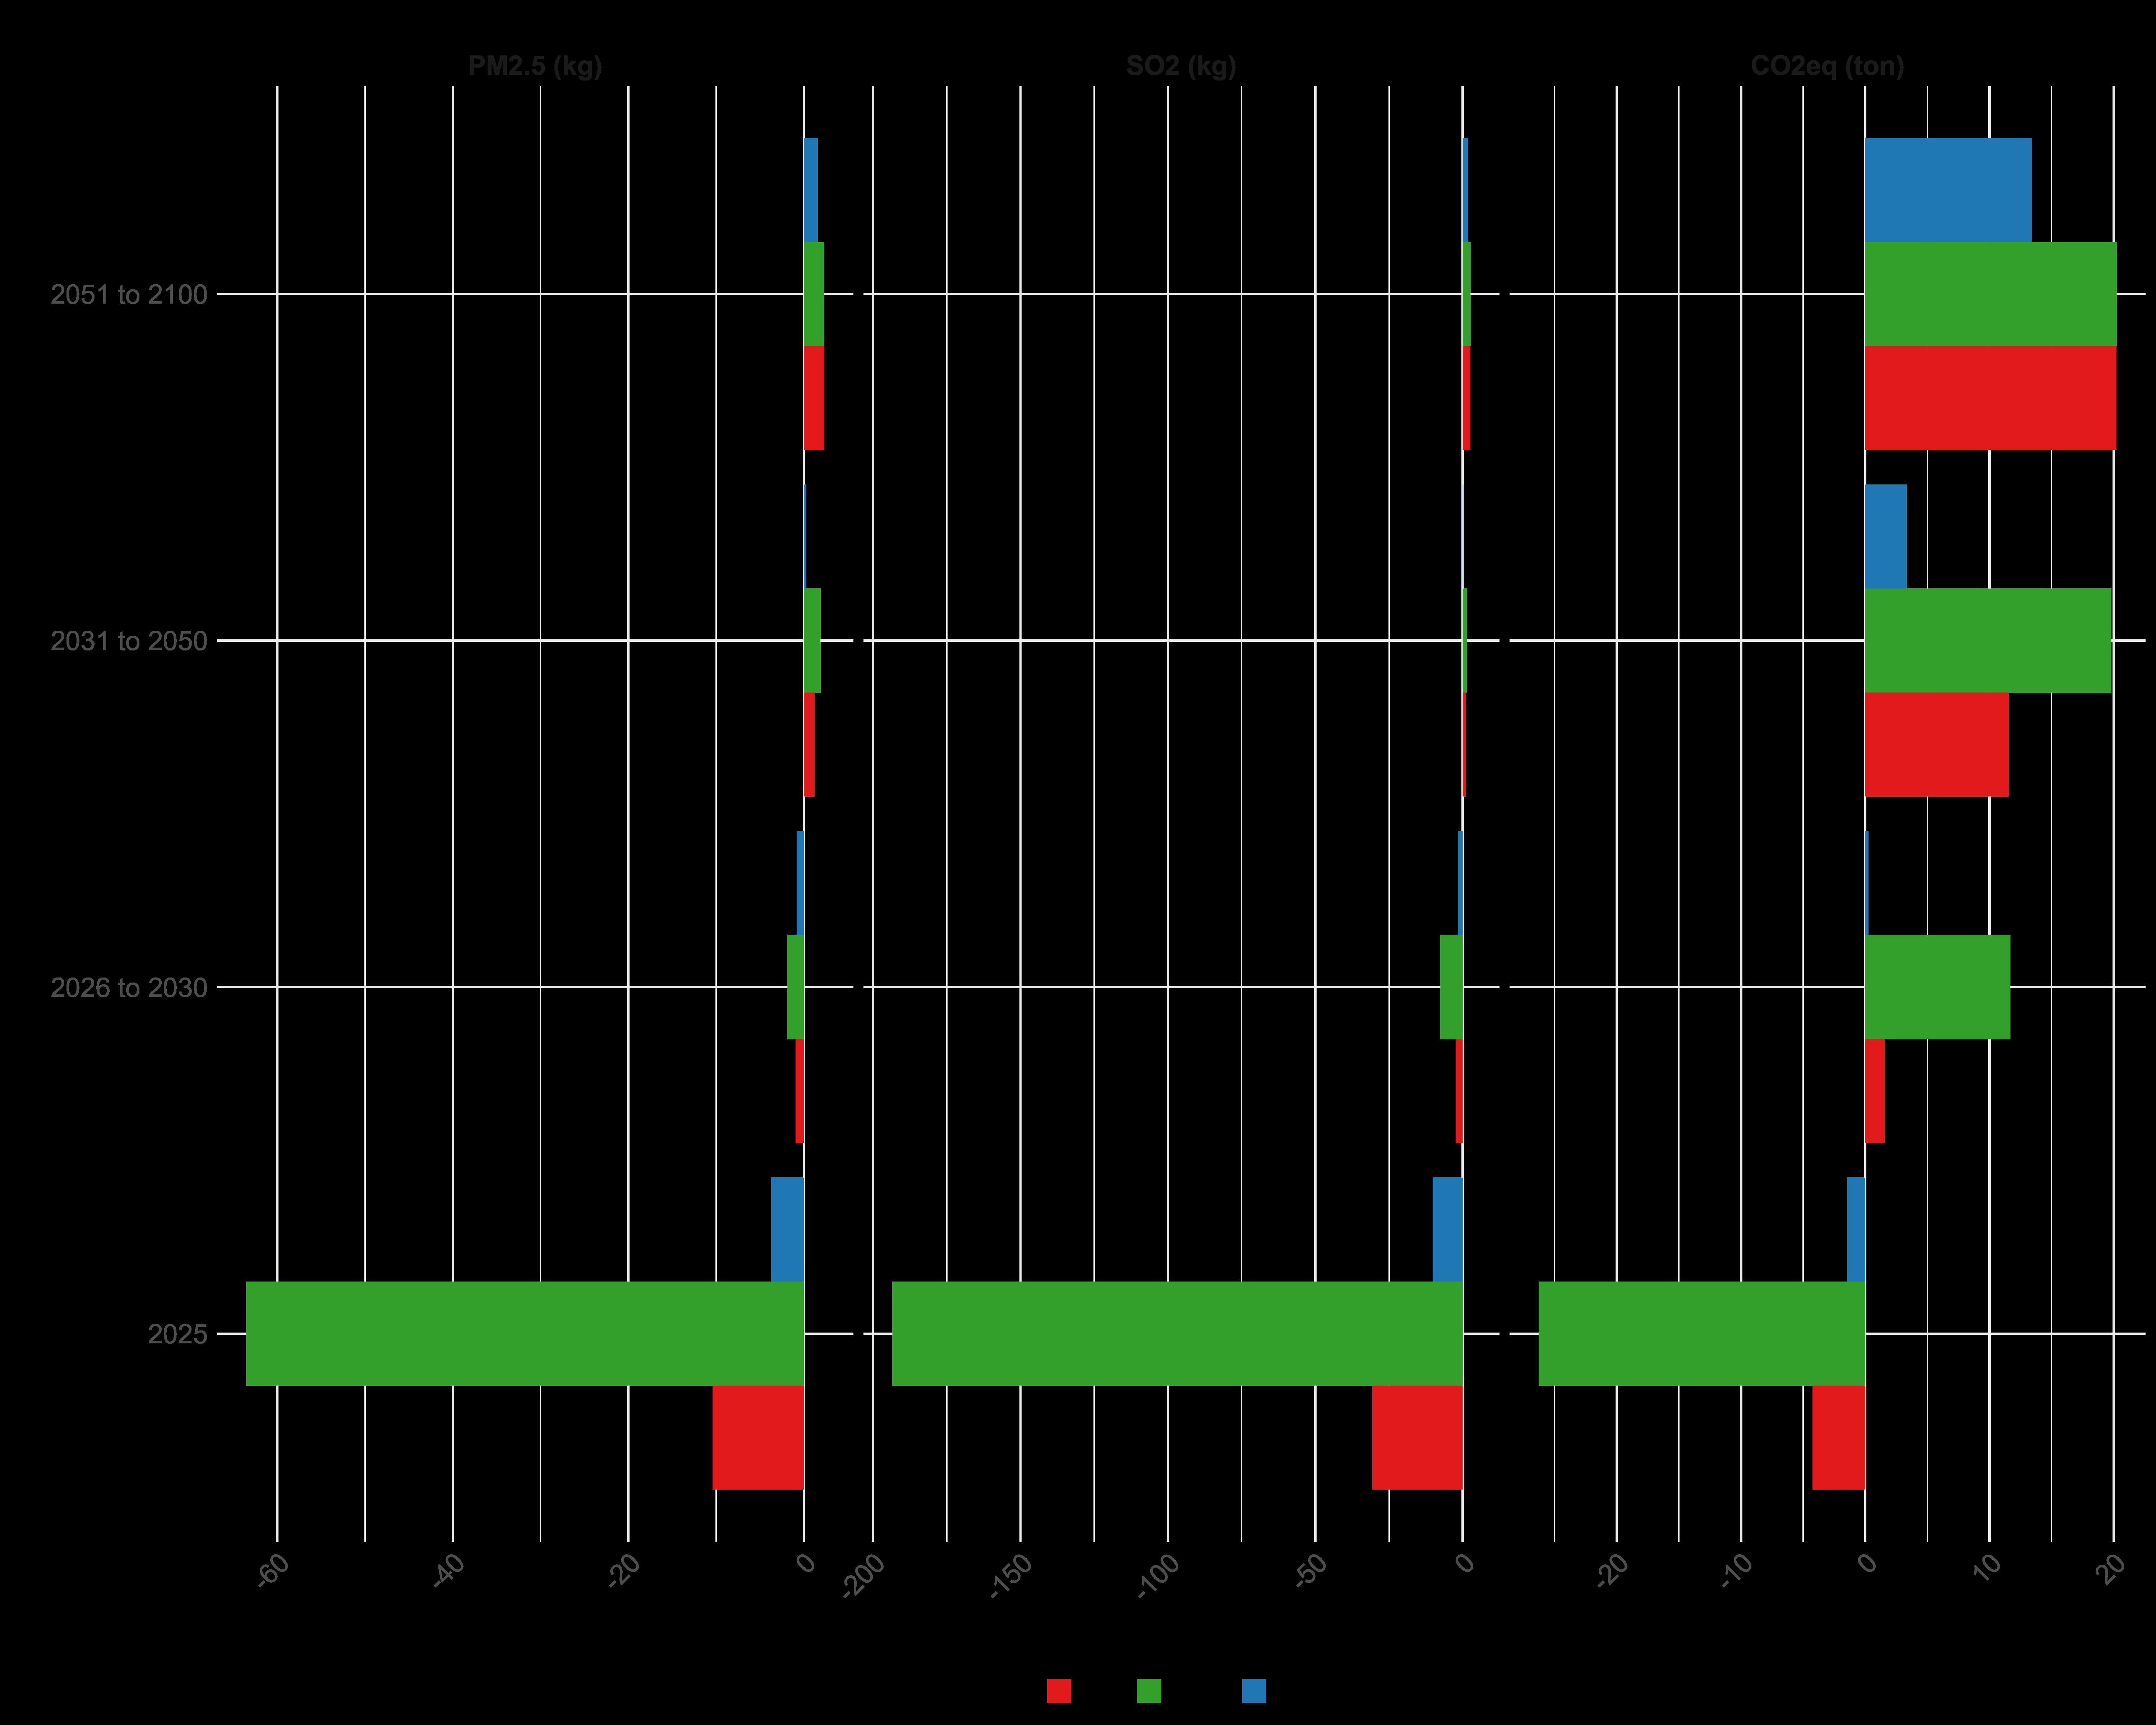
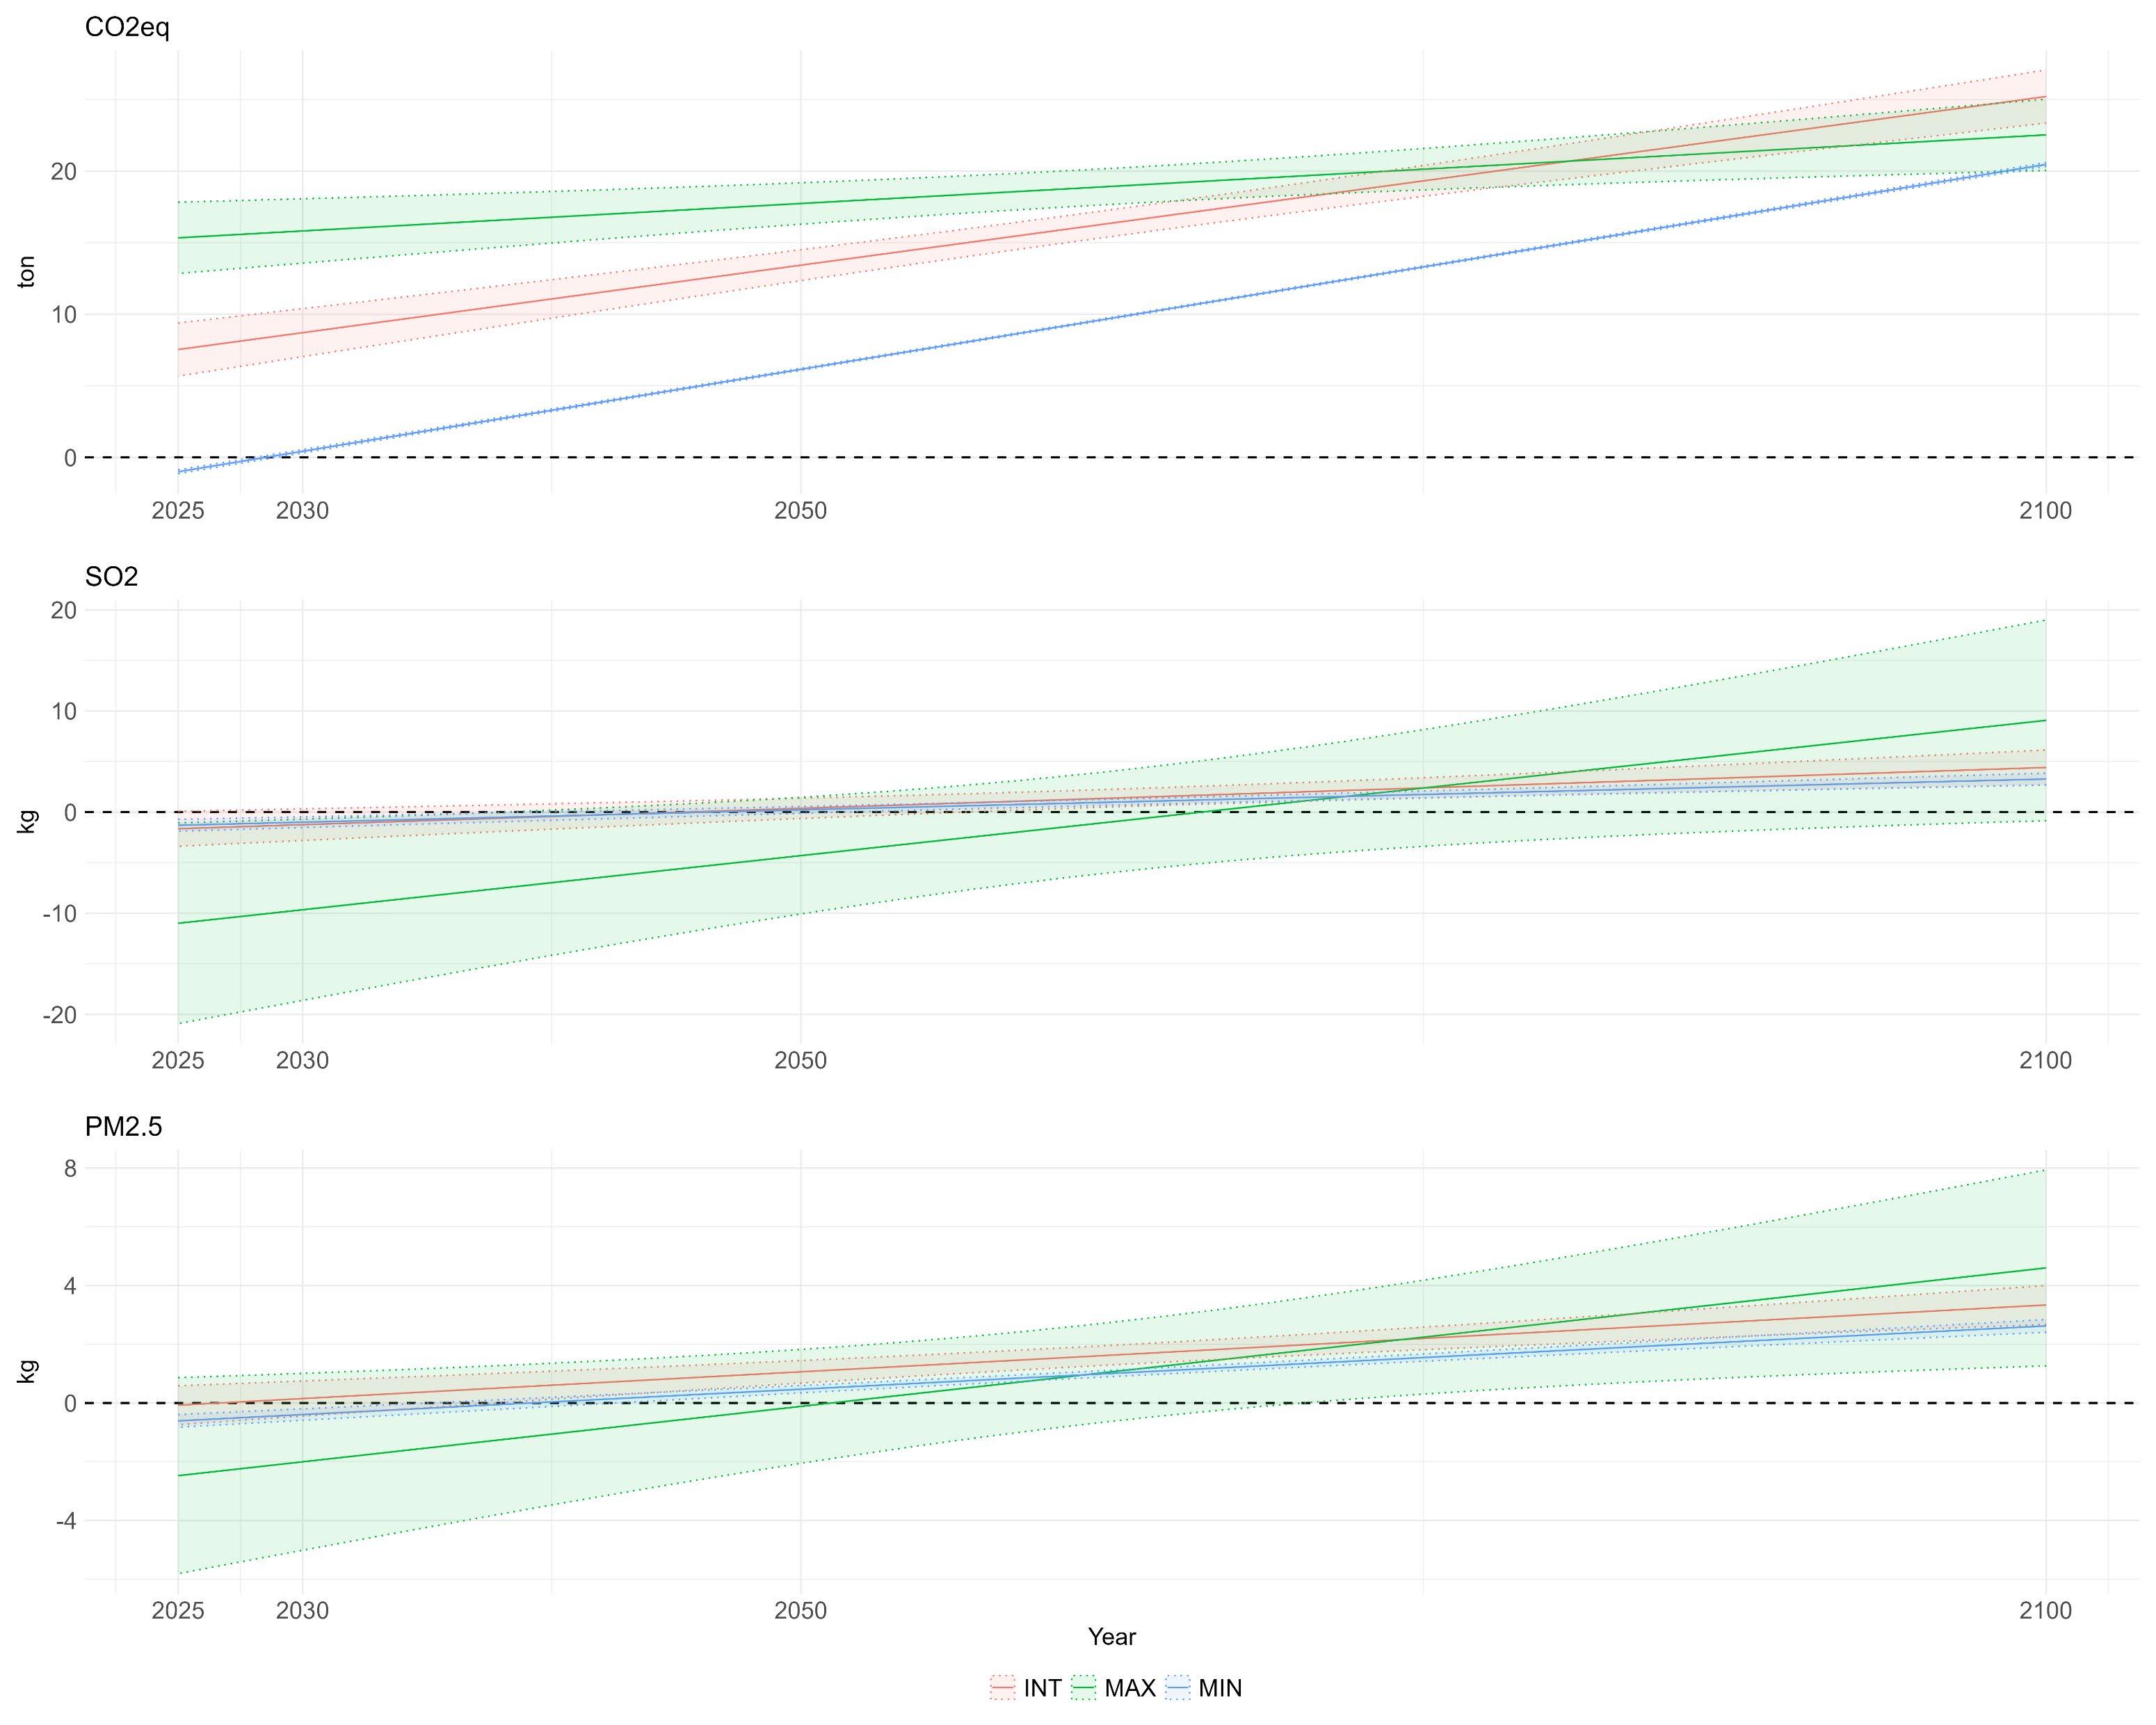


CONCLUSIONS The combined approach here proposed holds promise in identifying synergies between the intensity of management and net removal capacity Furthermore, this approach potentially offers the chance to save costs, reduce the need for seedlings, and optimize efforts and job opportunities within the forestry industry References 1. Gaglio M, Pace R, Muresan AN, Grote R, Castaldelli G, Calfapietra C, et al Species-specific efficiency in PM2 5 removal by urban trees From leaf measurements to improved modeling estimates Sci Total Environ 2022;844(March) 2. FAO Forests and Sustainable Cities Vol 69 Unasylva 2018 88 p 3. Vogt J, Hauer RJ, Fischer BC The costs of maintaining and not maintaining the urban forest: A review of the urban forestry and arboriculture literature Arboric Urban For 2015;41(6) 293–323 4. Di Pirro E, Roebeling P, Sallustio L, Marchetti M, Lasserre B Cost-Effectiveness of Nature-Based Solutions under Different Implementation Scenarios A National Perspective for Italian Urban Areas Vol 12 Land 2023 5. Strohbach MW, Arnold E, Haase D The carbon footprint of urban green space A life cycle approach Landsc Urban Plan 2012 Feb 1 104(2 :220–9 6. Lin X, Ren J, Xu J, Zheng T, Cheng W, Qiao J, et al Prediction of Life Cycle Carbon Emissions of Sponge City Projects A Case Study in Shanghai, China Vol 10 Sustainability 2018 7. Nowak DJ Understanding -Tree 2021 summary of programs and methods Gen Tech Rep NRS-200-2021 Madison, WI US Dep Agric For Serv North Res Station 100 p [Internet] 2021 200–2021(December) 1–100 Available from https //www fs fed us/pubs/ 8. Mänttäri MM, Lindén L, Tuhkanen EM Change in urban forest age structure affects the value of ecosystem services provided Front Sustain Cities 2023;5(November) 9. Hemery GE, Savill PS, Pryor SN Applications of the diameter–stem diameter relationship for different species of broadleaved trees For Ecol Manage [Internet] 2005 Aug 25 [cited 2023 Nov 21 215(1–3 285–94 Available from https://linkinghub elsevier com/retrieve/pii/S0378112705003373 QRCODE versione digitale del poster Figures 2 and 3 show that all three scenarios yield favorable outcomes regarding the net CO2eq balance However, a detailed examination of air pollutants, specifically PM2 5 and SO2, reveals that the INT scenario can achieve better results in terms of net air pollution mitigation The highest values of annual average net rate (from 2025 to 2100) are 18 94 of CO2eq for MAX scenario, 1 63 kg of PM2 5 for INT scenario and 1 38 kg of SO2 for INT scenario The lowest values of annual average net rate are 9 68 of CO2eq for MIN, 1 00 kg of PM2 5 for MIN and -0 96 kg of SO2 for MAX Thank you for your attention I would like to receive some feedback from you Scan the QR code and fill out the form It only takes a few seconds MAX INT MIN 2100 2050 2030 2025 3600 tr/ha 544 tr/ha 160 tr/ha 3600 tr/ha 544 tr/ha 160 tr/ha 544 tr/ha 544 tr/ha 160 tr/ha 160 tr/ha 160 tr/ha 160 tr/ha 1 ha TCC = 100% 1 ha TCC < 100% Thinnings Thinnings Phase Practice Planting Soil preparation Tree placing Irrigation lay Primary care Soil and weed control Water management Tree shaping Dead tree replacement Secondary care Lawn maintenance Tree pruning Thinning Tree cutting (DBH 10cm) Tree cutting (DBH 20cm) Tree cutting (DBH 30cm) Tree cutting (DBH 40cm) Timber loading Landfill delivery Timber disposal Table Planting and management phases and activities envisaged in the three scenarios employed in the Life Cycle Assessment Approach Figure 2. The NETs for each time-period and for each scenario Figure 3. Linear regression models for the NETs for each scenario over time For each scenario i) the estimation of potential pollutants removal (i e , SO2, PM2 5) and carbon sequestration capacity (i e , CO2eq) were calculated through the online tool i-Tree Canopy, while ii) the potential impacts on Global Warming and Air Pollution of the planting and management activities were calculated by Life Cycle Assessment (Table) Finally, the annual net balance between potential benefits and impacts in terms of CO2eq, PM2 5, and SO2 were compared in the three target periods for the three scenarios Figure 1. The three different scenarios (maximum density=MAX, intermediate density=INT and minimum density=MIN) and their respective management strategies to reach and maintain 100% of Tree Canopy Cover (TCC) over time.
Thinnings