APPENDIX A A
122 | Comprehensive Downtown Strategic Plan
MARKET ANALYSIS
Comprehensive Downtown Strategic Plan | 123
Table of Contents
Ho u s i n g a n d Re a l E s ta te Ma r ke t A n a lys i s
I n t ro d u c t i o n A - 4
S t u d y A re a C o n tex t A - 5
D e m o g ra p h i c A s s e s s m e n t A - 1 0
Lo ca l a n d Re g i o n a l E c o n o m i c A s s e s s m e n t A - 1 7
Re a l E s ta te A s s e s s m e n t : Re s i d e n t i a l A - 2 6
Re a l E s ta te A s s e s s m e n t : C o m m e rc i a l A - 3 6
Re a l E s ta te D e m a n d Fo re ca s t A - 4 5
124 | Comprehensive Downtown Strategic Plan MARKET ANALYSIS
A-2
Study Area Context
Comprehensive Downtown Strategic Plan | 125 A-3
Introduction
KB Advisory Group is partnering with TSW to complete this analysis for the Dawsonville Downtown Master Plan.
This report will provide a demographic, economic, and real estate inventory and trend analysis for several nested geographic areas:
• Dawsonville Downtown Development Area
• City of Dawsonville
• Dawson County
• Local Retail Trade Area
• Regional Retail Trade Area
The study will examine the state of the market, forecast future demand potential, and identify strategies that can bolster the economic development potential of downtown Dawsonville
126 | Comprehensive Downtown Strategic Plan
A-4
K B A d v i s o r y G r o u p , I n c 725 Ponce De Leon Avenue NE Suite 200 Atlanta, GA 30306 404.845.3550 www.kbagroup.com
Study Area Context
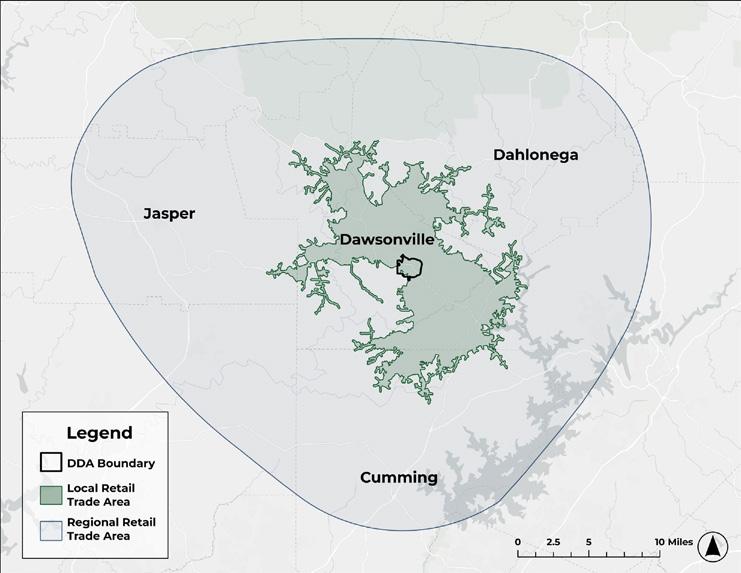
The Downtown Development Area lays in the heart of Dawsonville and at the center of Dawson County.

Comprehensive Downtown Strategic Plan | 127 A-5
Study Area Context
The Local Retail Study Area is the primary geography of interest for demographic, economic, and real estate analysis purposes. The boundary was determined by calculating areas within a 15minute drive time of downtown Dawsonville.
The Regional Retail Trade Area is another geography of interest and encompasses Jasper, Dahlonega, and Cumming.
128 | Comprehensive Downtown Strategic Plan A-6
Study Area Context
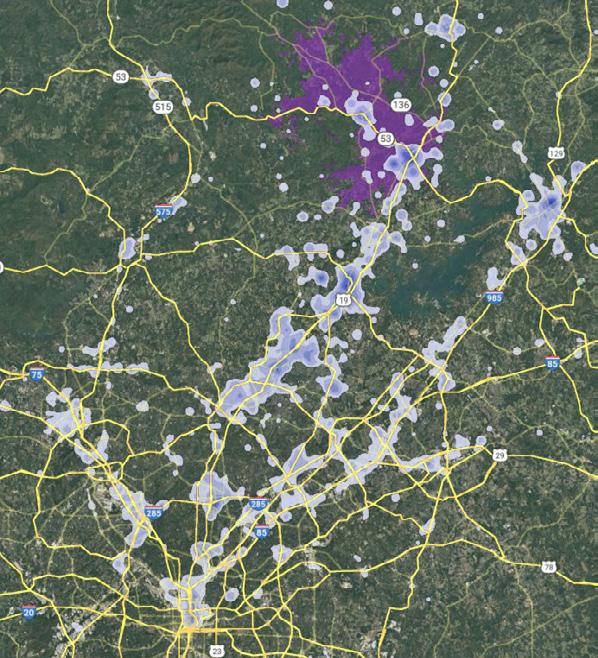
Development in the Local Retail Trade Area (LRTA) is concentrated along the Highway 53 and Highway 9 corridors. There is a mi x of hospitality, multifamily, and retail.
The Downtown Development Area has a mix of multifamily and retail predominately.


Source:KBAdvisorybasedondatafromCoStar
Comprehensive Downtown Strategic Plan | 129 A-7
Study Area Context

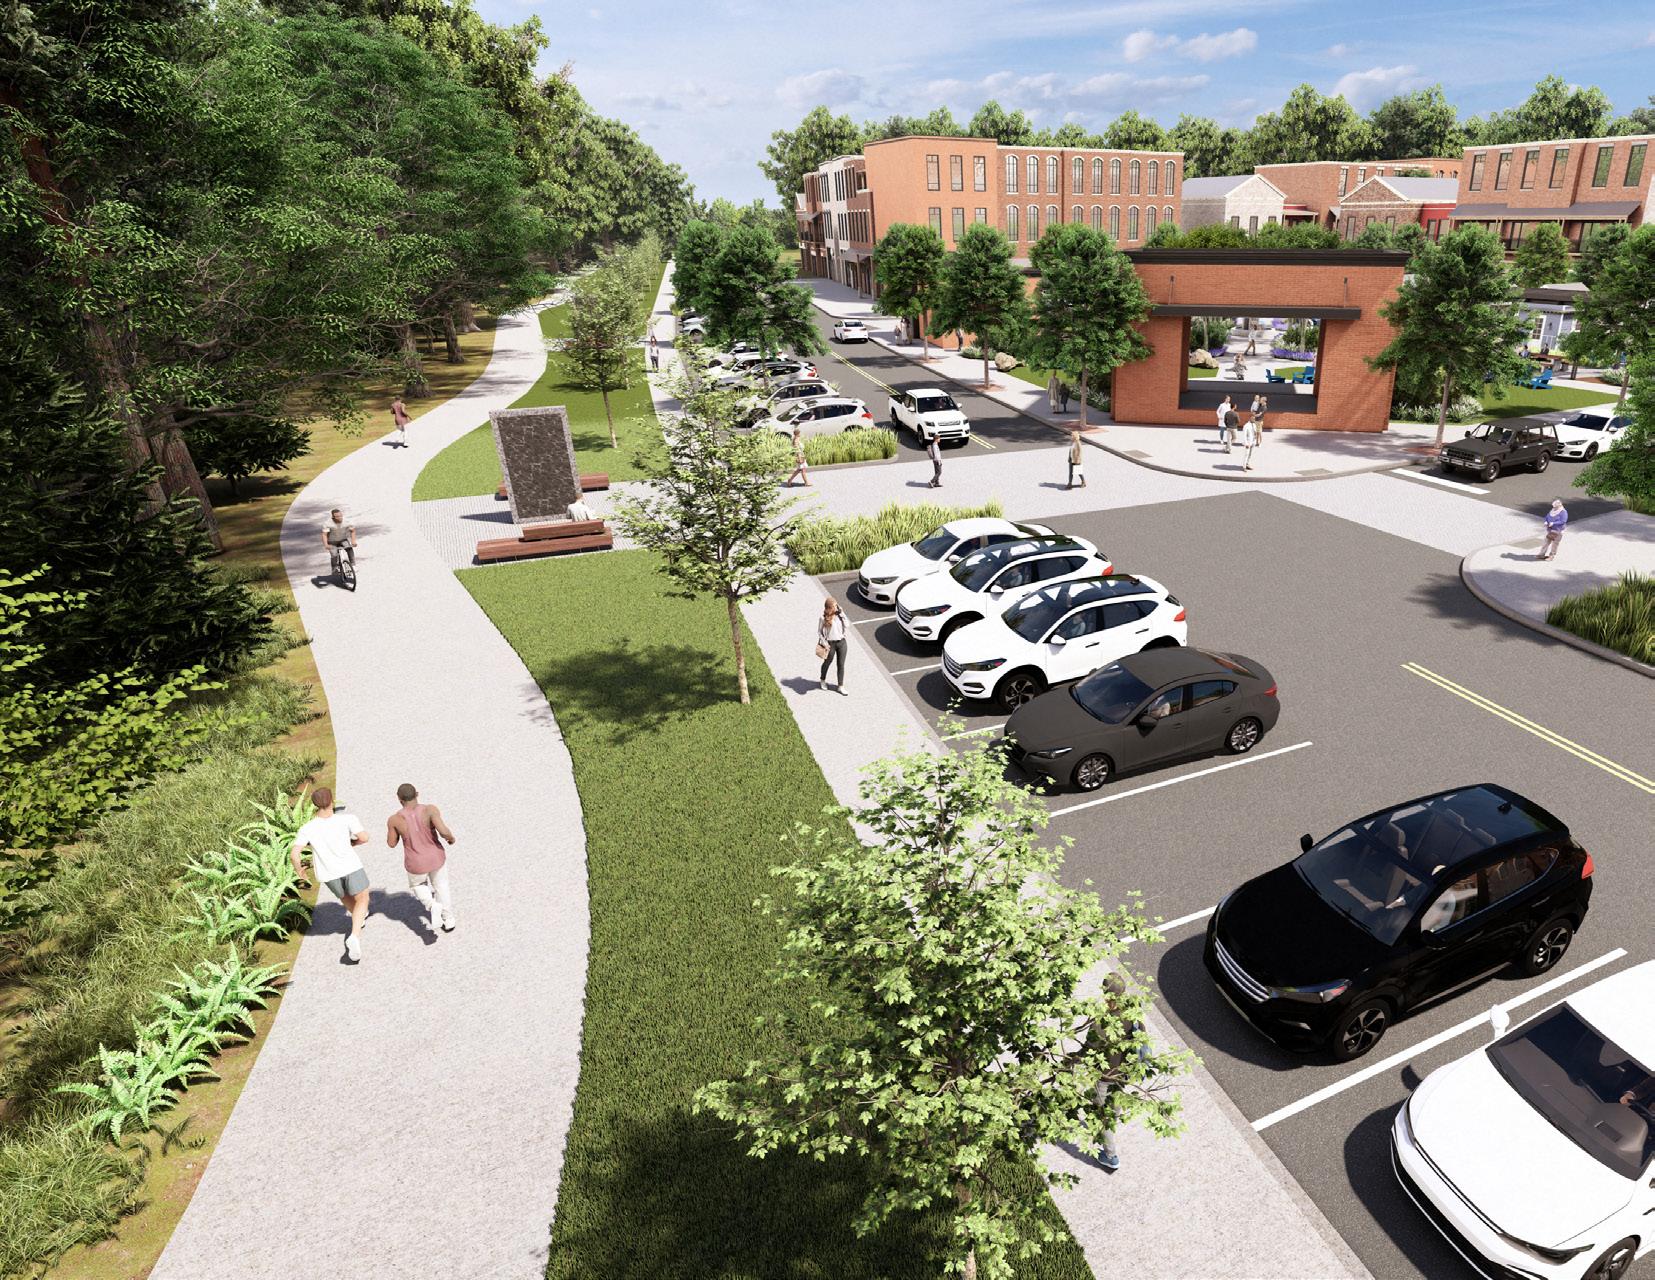
The Downtown Development Area in Dawsonville is home to many assets, including governmental facilities, historical assets, and creative and cultural resources.
130 | Comprehensive Downtown Strategic Plan A-8
Market Analysis Approach
D e m o g ra p h i c
A s s e s s m e n t
Identify existing demographic trends of the Dawsonville, Dawson County, and larger trade areas.

I m p le m e n ta t i o n S t ra te g i e s
Lo ca l E c o n o m i c
A s s e s s m e n t
Identify relevant employment and workforce trends, including workforce composition, job locations, commuting destinations, and spending patterns.
Re s i d e n t i a l : Re a l
E s ta te A s s e s s m e n t
Analyze and describe housing market conditions and trends in Dawsonville and Dawson County.

C o m m e rc i a l : Re a l
E s ta te A s s e s s m e n t
Analyze and inventory commercial real estate conditions and trends in the local and regional trade areas.
Re a l E s ta te
D e m a n d
Fo re ca s t
Synthesize assessments to predict real estate demand for the Downtown Dawsonville.
A-9
Comprehensive Downtown Strategic Plan | 131
Demographic Assessment
132 | Comprehensive Downtown Strategic Plan A-10
Population
T h e c u r re n t e s t i m a te d p o p u la t i o n of t h e Lo ca l Re ta i l Tra d e A re a i s 2 6 , 9 7 3
• The City of Dawsonville has seen the greatest population growth of these geographies, followed by the Local Retail Trade Area.
• The estimated growth rates for all geographies from 2023 to 2028 are lower than the growth rates from previous years with Dawsonville expected to grow over 2% through 2028.
Source:KBAdvisorybasedondatafromClaritas
Comprehensive Downtown Strategic Plan | 133 A-11 100% 130% 145% 120% 131% 129% 140% 124% 132% 90% 100% 110% 120% 130% 140% 150% 2010 2020 2023 Re la t i ve G r ow t h , 2 0 1 0 - 2 0 2 3 Dawsonville Dawson County LRTA RRTA D e m o g ra p h i c A s s e s s m e n t
Po p u la t i o n G r ow t h , 2 0 2 3 - 2 0 2 8 Dawsonville Dawson County LRTA RRTA 2010 Census 2,860 22,330 19,220 236,716 2020 Census 3,720 26,798 24,796 294,442 2023 Estimate 4,135 29,222 26,973 313,342 2028 Forecast 4,602 31,853 29,576 338,941 Growth Rate 20102020 2.7% 1.8% 2.6% 2.2% Growth Rate 20102023 2.9% 2.1% 2.6% 2.2% Est. Growth Rate 20232028 2.2% 1.7% 1.9% 1.6%
• Nearly 10% of households within the RRTA earn more than $250K, representing an opportunity to attract higher-earning households to future retail destinations Downtown Dawsonville.
Source:KBAdvisorybasedondatafromClaritas
134 | Comprehensive Downtown Strategic Plan A-12 30% 40% 29% 1% 0% 5% 10% 15% 20% 25% 30% 35% 40% 45% <$50K $50K-$100K $100K-$$250K $250K+ Ho u s e h o ld I n co m e D i s t r i b u t i o n , 2 0 2 3
RRTA D e m o g ra p h i c A s s e s s m e n t Household Income T h e m e d i a n h o u s e h o ld i n co m e i
Dawsonville Dawson County LRTA
n Da w s o nv i l le i s ro u g h ly $ 7 2 , 3 3 4 a n n u a l ly T h i s i s le s s t h a n t h a t of t h e co u n t y a n d b o t h t ra d e a re a s
Ho u s e h o ld I n c o m e Dawsonville Dawson County LRTA RRTA <35K 19% 15% 18% 16% $35K - $50K 11% 11% 10% 9% $50K - $100K 40% 29% 29% 27% $100K - $250K 29% 37% 38% 38% $250K - $500K 1% 5% 4% 6% $500K+ 0% 2% 1% 3%
D e m o g ra p h i c A s s e s s m e n t
Age Cohorts
T h e m e d i a n a g e of re s i d e n t s i n t h e Da w s o nv i l le i s a b o u t 4 1 ye a r s o ld , t h e yo u n g e s t o u t of a l l co m p a ra t i ve g e o g ra p h i e s
• Considering the share of population by generation, the distribution is generally cohesive throughout the region.
• Dawson County has the largest share of (22%) of seniors contributing to an older median age. Conversely, Dawsonville has the largest share of children under 17 at nearly a quarter of the population.
• While we cannot depend entirely on generational characteristics forecasting behaviors, understanding these difference can help inform market segmentation both in commercial and residential offerings in Downtown Dawsonville.
Source:KBAdvisorybasedondatafrom Claritas
Comprehensive Downtown Strategic Plan | 135 A-13 21% 23% 0% 5% 10% 15% 20% 25% Generation Alpha (0-10) Generation Z (11-26) Millennials (27-42) Generation X (43-58) Boomers (59-77) Silent (78+) E s t Po p u la t i o n by Ag e & G e n e ra t i o n a l C o h o r t 2 0 2 3
Dawsonville Dawson County LRTA RRTA
Ag e & G e n e ra t i o n a l C o h o r t s , 2 0 2 3 Dawsonville Dawson County LRTA RRTA Est. Population by Age & Generational Cohort 2023 Generation Alpha (0-10) 12% 12% 13% 12% Generation Z (11-26) 20% 18% 20% 22% Millennials (27-42) 21% 19% 20% 19% Generation X (43-58) 21% 21% 21% 22% Boomers (59-77) 18% 23% 19% 18% Silent (78+) 8% 8% 7% 7% Children and Senior Population, 2023 Children (0-17) 24.4% 20% 21.6% 21.5% Seniors (65+) 18.5% 22% 18.1% 17.6% Median Age 40.6 44.3 41.2 41.3
Race and Ethnicity
Over 80% of residents in Dawsonville, Dawson County, and the local trade area identify as White alone, and roughly 10% identify as two or more races.
• The regional trade area has a larger proportion of Asian residents than in the city, count, or local trade area overall.
Source:KBAdvisorybasedondatafromClaritas
White Alone
Black/African American Alone
American Indian/Alaskan Native Alone Asian Alone
Native Hawaiian/Pacific Islander Alone
Some Other Race Alone
136 | Comprehensive Downtown Strategic Plan A-14 D e m o g ra p h i c A s s e s s m e n t
2023 Est. Population by Race Dawsonville Dawson County LRTA RRTA White Alone 88% 88% 86% 77% Black/African American Alone 1% 1% 2% 3% American Indian/Alaskan Native Alone 0% 0% 0% 0% Asian Alone 1% 1% 1% 7% Native Hawaiian/Pacific Islander Alone 0% 0% 0% 0% Some Other Race Alone 3% 3% 3% 4% Two or More Races 6% 7% 7% 9% 88% 88% 86% 77% 7 % 0% 20% 40% 60% 80% 100% D aw s on vi ll e D aw s on C o u nt y L R T A R R T A 2 0 2 3 E s t Po p u la t i o n by R a c e by S i n g le - C la s s i f i ca t i o n R a c e
D e m o g ra p h i c A s s e s s m e n t
Educational Attainment
Mo re t h a n 9 0 % of Da w s o nv i l le re s i d e n t s a g e d ove r 2 5 h a ve a h i g h s c h o o l d i p lo m a o r m o re , i n te r m s of e d u ca t i o n a l a t ta i n m e n t
• Dawsonville lags slightly behind the county and especially the regional area in terms of advanced degrees educational attainment. 40% of residents within the regional trade area have a college degree of more, compared to about 24% in the City of Dawsonville.
4 Year Degree or more
High School Diploma and Some College
Less than High School Diploma
Comprehensive Downtown Strategic Plan | 137 A-15
10% 12% 13% 10% 66.3% 54.7% 56% 51% 24% 33% 31% 40% 0% 10% 20% 30% 40% 50% 60% 70% 80% 90% 100%
Source:KBAdvisorybasedondatafrom Claritas
2 0 2 3 E s t Po p Ag e 2 5 + by E d u ca t i o n a l At ta i n m e n t
Dawsonville Dawson County LRTA RRTA
D e m o g ra p h i c A s s e s s m e n t
Household Size
Ho u s e h o ld s i n Da w s o nv i l le a n d t h e re g i o n te n d to b e s m a l l , w i t h ove r h a lf b e i n g 2 p e o p le o r le s s
Ad d i t i o n a l ly, m o s t h o u s e h o ld s i n Da w s o nv i l le ( 6 6 % ) d o n o t h a ve c h i ld re n p re s e n t , a n d a l m o s t a t h i rd a re n o n - fa m i ly h o u s e h o ld s ( l i ke ly u n re la te d ro o m m a te s )
• Generally, household type and size is consistent at all geographies with slight differences in the presence of children.
Small Households (1 or 2 people)
Medium Households (3-4 people)
Large Households (5+ people)
138 | Comprehensive Downtown Strategic Plan A-16
Ho u s e h o ld C h a ra c te r i s t i c s Dawsonville Dawson County LRTA RRTA Small Households (1 or 2 people) 56% 56% 52% 55% Medium Households (3-4 people) 33% 33% 36% 34% Large Households (5+ people) 11% 11% 12% 11% Households with Children 34% 33% 37% 39% Households without Children 66% 67% 63% 61% Non-Family Households 28% 24% 24% 23% 56% 56% 52% 55% 33% 33% 36% 34% 11% 11% 12% 11% 0% 20% 40% 60% 80% 100% Dawsonville Dawson County LRTA RRTA S h a re of Ho u s e h o ld s by S i ze
Source:KBAdvisorybasedondatafromClaritas
Local & Regional Economic Assessment
Comprehensive Downtown Strategic Plan | 139 A-17
Employment & Workforce
More workers commute out of the Local Retail Trade Area than commute in, and just 1,445 both work and live within the area.
Retail represents the largest industry of those employed in or living within the LRTA, though retail trade represents a significantly larger proportion of jobs (30%) than there are residents employed in retail (12%).
Real
Arts,


140 | Comprehensive Downtown Strategic Plan A-18
E m p loy m e n t E s t i m a te by S e c to r : L R TA
6 , 5 9 1 1 1 , 2 9 7 1 , 4 4 5 0 500 1,000 1,500 2,000 2,500 3,000 Retail Trade Manufacturing Accommodation and Food Services Public Administration Educational Services Health Care and Social Assistance Construction
Services
Professional, Scientific, and Technical Services
Source:KBAdvisorybasedondatafromCensus,2020
Other
(excluding Public Administration)
Management… Wholesale
Warehousing
Administration & Support, Waste
Trade Transportation and
Entertainment, and Recreation
Insurance Information
Finance and
Estate
Utilities Mining, Quarrying, and Oil and Gas Extraction Management of Companies and Enterprises To ta l Jo b s by I n d u s t r y by Ho m e a n d Wo r k Lo ca t i o n , L R TA , 2 0 2 0 All Jobs by industry of those working in the LRTA All Jobs by Industry of those living in the LRTA
and Rental and Leasing Agriculture, Forestry, Fishing and Hunting
Employment & Workforce
E m p loy m e n t E s t i m a te by S e c to r : R R TA
Nearly twice as many workers commute out of the region for work than commute into the RRTA. In comparison to the local trade area, Health Care in the leading employment industry with retail trailing closely behind.
At the regional level, Educational Services also represents a larger employment industry, slightly exceeding Manufacturing.


Management of Companies and Enterprises
Agriculture, Forestry, Fishing and Hunting
Mining, Quarrying, and Oil and Gas Extraction
Utilities
Real Estate and Rental and Leasing Information
Transportation and Warehousing
Finance and Insurance
Arts, Entertainment, and Recreation
Other Services (excluding Public…
Wholesale Trade
Professional, Scientific, and Technical…
Administration & Support, Waste…
Public Administration
Construction
Accommodation and Food Services
Manufacturing
Comprehensive Downtown Strategic Plan | 141 A-19
4 3 , 8 6 8 9 6 , 5 2 0 3 1 , 1 7 4 0 4,000 8,000 12,000 16,000 Health Care and Social Assistance
Source:KBAdvisorybasedondatafromCensus,2020
Retail Trade Educational Services
To
b s by I n d u s t r y by Ho m e a n d Wo r k Lo ca t i o n , R R TA ,
0
ta l Jo
2 0 2
Employment & Workforce
E m p loy m e n t E s t i m a te by I n co m e
From 2010 to 2020, 2,300 jobs were added within the local trade area, averaging over 200 new jobs per year. Proportionally, jobs which paid less than $1,250 per month have dipped only slightly from 40% of all jobs in 2010 to just 38% of jobs in 2020. At the same time, higher paying jobs, more than $3,333, increased from 20% in 2010 to 28% in 2020.
Source:KBAdvisorybasedondatafromCensus(2020),Claritas
142 | Comprehensive Downtown Strategic Plan A-20
8 , 0 3 6 T o t a l J o b s 2020, Local Retail Trade Area $ 8 6 , 7 4 1 M e d i a n Ho u s e h o ld I n c o m e 2023, Local Retail Trade Area 3 0 6 0 2 9 3 5 2 9 4 3 3 0 1 4 3 0 1 9 2 9 3 6 2 7 4 7 2 8 1 0 2 6 3 8 2 7 1 7 2 2 5 3 2 7 2 3 3 0 1 3 2 6 5 7 2 8 4 3 2 7 1 8 2 5 3 2 2 5 1 5 2 7 5 9 2 9 0 6 2 6 8 2 2 2 7 7 2 2 5 3 2 2 2 1 1 9 1 1 1 7 2 7 1 6 9 0 1 5 5 2 1 4 3 7 1 2 6 9 1 2 6 3 1 1 6 6 1 1 3 9 0 1,000 2,000 3,000 4,000 5,000 6,000 7,000 8,000 9,000 2020 2019 2018 2017 2016 2015 2014 2013 2012 2011 2010 Jo b s by E a r n i n g s , L R TA , 2 0 2 0 $1,250 per month or less $1,251 to $3,333 per month More than $3,333 per month
Employment & Workforce
• A fifth, the largest share, of working Dawsonville residents commute to Forsyth County, mainly within Cumming South Forsyth along GA-400.
• Another 18% work in Fulton County primarily in Downtown Atlanta, Buckhead, and Perimeter.
• Nearly 13% work within Dawson County, either Downtown or surrounding the North Georgia Premium Outlets.
• The remainder are working in Gainesville and various core throughout the northern Atlanta MSA.
Source:KBAdvisorybasedondatafromCensusOntheMap

Work Destinations of those Living within Dawsonville
Comprehensive Downtown Strategic Plan | 143 A-21 15% 34% 40% 11% C o m m u t i n g D i s ta n c e of t h o s e L i v i n g w i t h i n Da w s o n v i l le Less than 10 miles 10 to 24 miles 25 to 50 miles Greater than 50 miles
Da w s o n v i l le C o m m u t i n g Pa t te r n s A m o n g t h e wo r k i n g re s i d e n t s of Da w s o nv i l le , t h e re a re a va r i e t y of co m m u t i n g d e s t i n a t i o n s a lo n g G A - 4 0 0
Employment & Workforce
• As with Dawsonville residents, a fifth of residents work within Forsyth County more broadly along GA-400. Additionally, 18% work within Fulton County with a larger share than Dawsonville working within Alpharetta/North Fulton area.
• Gwinnett and Dawson County are each work destinations for 10% of residents of the LRTA.
144 | Comprehensive Downtown Strategic Plan A-22
L R TA C o m m u t i n g Pa t te r n s T h e c o m m u t i n g p a t t e r n s o f L R T A r e s i d e n t s g e n e r a l l y m i m i c s t h o s e of Da w s o nv i l le re s i d e n t s
16% 37% 37% 10% C o m m u t i n g D i s ta n c e of t h o s e L i v i n g w i t h i n t h e L R TA Less than 10 miles 10 to 24 miles 25 to 50 miles Greater than 50 miles
Source:KBAdvisorybasedondatafromCensusOntheMap Work Destinations of those Living within the LRTA
D e m o g ra p h i c A s s e s s m e n t
Resident Spending: Dawsonville
T h e to ta l a m o u n t of re ta i l s u p p ly i n
Da w s o nv i l le ex c e e d s lo ca l a re a d e m a n d by ove r o n e a n d a h a lf t i m e s
• Overall, Dawsonville’s largest retail surplus (where supply exceeds local demand) is in furniture and home furnishing stores. It’s largest retail leakage (where there is unmet local demand) is in food service and drinking places.
Da w s o n v i l le
Annual Retail Spending (demand):
$ 7 5 , 2 8 8 , 9 8 6
Annual Retail Sales (supply):
$ 1 1 9 , 5 9 7 , 5 0 8
Da w s o n v i l le Re ta i l G a p A n a lys i s 2 0 2 3 e s t
( $ m i l l i o n s )
F oo d S e r vi c e s an d D r i n k i n g P l ac e s
B u i l d i ng M at e r i a l a nd G a r d e n E q u i p m e nt a nd S u p p l i e s
D e a le r s
F oo d a nd B e v e r ag e S t o r e s
M ot o r Ve hi c l e a nd Pa r t s D e a l e r s
H e al t h an d P e r s o na l C ar e S t or e s
E l e c t r on i c s an d A p p l i a nc e S t o r e s
M i s c e l l an e o u s S t or e R e t ai l e r s
G e n e r a l M e r c h a nd i s e S t or e s
G a s ol i n e S t at i on s
S p o r t i ng G oo d s H ob by Mu s i c a l I ns t r u m e n t , an d B oo k S t o r e s
r e s
Source:KBAdvisorybasedondatafromClaritas
Comprehensive Downtown Strategic Plan | 145 A-23
Retail
ka g
Retail
p lu s $(70) $(60) $(50) $(40) $(30)
$- $10 $20 F u r n i t u r e a n d H o me F u r n i s h i n g s S t or e s C l ot h i n g a n d C lo t h i n g A c c e s s o r i e s S t o
L e a
e
S u r
$(20) $(10)
• The largest retail surpluses (where supply exceeds local demand) are in clothing-related stores as well as in food and beverage (such as a grocery or specialty food store). It’s largest retail leakage (where there is unmet local demand) is in autorelated retail.
L R TA Re ta i l G a p A n a lys i s 2 0 2 3 e s t
( $ m i l l i o n s )
M ot o r Ve hi c l e a nd Pa r t s D e a l e r s
E l e c t r on i c s an d A p p l i a nc e S t o r e s
F oo d S e r vi c e s an d D r i n k i n g P l ac e s
S p o r t i ng G oo d s H ob by Mu s i c a l I ns t r u m e n t , an d B oo k S t o r e s
M i s c e l l an e o u s S t or e R e t ai l e r s
G a s ol i n e S t at i on s
F u r n i t u r e a n d H o me F u r n i s h i n g s S t or e s
H e al t h an d P e r s o na l C ar e S t or e s
G e n e r a l M e r c h a nd i s e S t or e s
u i p m e nt a nd S u p p l i e s
D e a le r s
146 | Comprehensive Downtown Strategic Plan A-24 D e m o g ra p h i c A s s e s s m e n t
T h e L R TA h a s a re ta i l s u r p lu s i n m o s t m a j o r re ta i l ca te g o r i e s
Resident Spending: LRTA
L R TA Annual Retail Spending (demand): $ 5 3 9 , 8 5 7 , 9 6 9 Annual Retail Sales (supply): $ 8 2 5 , 7 2 4 , 0 8 4
Retail L e a ka g e Retail S u r p lu s $(160)$(140)$(120)$(100) $(80) $(60) $(40) $(20) $- $20 C l ot h i n g a n d C lo t h i n g A c c e s s o r i e s S t or e s F oo d a nd B e v e r ag e S t o r e s B u i l d i ng M at e r i a l a nd G a r d e n E q
Source:KBAdvisorybasedondatafromClaritas
• The only major retail categories where there is a retail surplus (where supply exceeds local demand) is in food and beverage stores (such as a grocery or specialty food store) and in recreational/hobby retailers.
R R TA Re ta i l G a p A n a lys i s 2 0 2 3 e s t . ( $ m i l l i o n s )
M ot o r Ve hi c l e a nd Pa r t s D e a l e r s
F oo d S e r vi c e s an d D r i n k i n g P l ac e s
G a s ol i n e S t at i on s
H e al t h an d P e r s o na l C ar e S t or e s
G e n e r a l M e r c h a nd i s e S t or e s
E l e c t r on i c s an d A p p l i a nc e S t o r e s
M i s c e l l an e o u s S t or e R e t ai l e r s
B u i l d i ng M at e r i a l a nd G a r d e n E q u i p m e nt a nd S u p p l i e s
D e a le r s
s S t or e s
Comprehensive Downtown Strategic Plan | 147 A-25 D e m o g ra p h i c A s s e s s m e n t Resident Spending: RRTA U n l i ke Da w s o nv i l le a n d t h e L R TA , t h e R R TA h a s a n ove ra l l re ta i l o p p o r t u n i t y g a p
R R TA Annual Retail Spending (demand): $ 6 , 8 8 0 , 5 7 5 , 7 3 8 Annual Retail Sales (supply): $ 5 , 0 5 0 , 1 6 4 , 1 9 1 Source:KBAdvisorybasedondatafrom Claritas Retail L e a ka g e Retail S u r p lu s $(100) $- $100 $200 $300 $400 $500 $600 $700 F oo d a nd B e v e r ag e S t o r e s S p o r t i ng G oo d s H ob by Mu s i c a l I ns t r u m e n t , an d B oo k S t o r e s F u r n i t u r e a n d H o me F u r n i s h i n g
Real Estate Assessment: Residential
148 | Comprehensive Downtown Strategic Plan A-26
Re a l E s ta te A s s e s s m e n t
Household Tenure Preferences
B o t h Da w s o nv i l le a n d Da w s o n C o u n t y h o m e s a re m a j o r i t y ow n e r - o c c u p i e d
• Owner households represent a higher share within the city, though only by 8%.
Dawsonville Housing Tenure Percent
Dawson County Housing Tenure
19%
Source:KBAdvisorybasedondatafromClaritas
Comprehensive Downtown Strategic Plan | 149
A-27
2 0 2 3 E s t i m a t e d H o u s i n g T e n u r e , V a l u e , & A g e Dawsonville Dawson County Owner-Occupied 1,135 9,179 Renter-Occupied 423 2,093 Percent Owner-Occupied 73% 81% Percent Renter-Occupied 27% 19% Median Age of Housing (Years) 22 25 73% 27%
Owner-Occupied Percent Renter-Occupied 81%
Real Estate Assessment: Residential
Single-family detached homes comprise 80% of the city’s current housing inventory. By share of housing type, small multifamily and townhomes represents the second largest housing type within the city at 10%.
Large multifamily represent the remaining housing stock at 6%.
There is an opportunity to expand housing options, particularly for attached housing types necessary to attract and support new retail and create a connected, walkable Downtown area.
150 | Comprehensive Downtown Strategic Plan A-28
Ho u s i n g I n ve n to r y
Type of Housing Units Share by Housing Type 1 Unit Detached (SF) 1,313 80% 1 Unit Attached (TH) 83 5% Small Multi-Family (2-4 Units/Bldg.) 84 5% Lg Multi-Family (5+ Units/Bldg.) 96 6% Trailer, RV & Boat 61 4% 1,637 Da w s o n v i l le H o u s i n g I n ve n to r y
Source:KBAdvisorybasedondatafromClaritas
Real Estate Assessment: Residential
• Considering only the value of owner-occupied homes, the share of homes within Dawson County values over $500,000 is nearly 30% compared to 15% within the City of Dawsonville.
• The majority of owner-occupied homes are valued between $200,000 to $500,000.
Comprehensive Downtown Strategic Plan | 151 A-29
Ho m e Va lu e – O w n e r O c c u p i e d Ho m e va lu e s w i t h i n t h e C i t y a re 2 3 % lowe r t h a n t h o s e of t h e C o u n t y ove ra l l
4% 7% 20% 13% 60% 50% 15% 29% 0% 20% 40% 60% 80% 100% Dawsonville Dawson County O w n e r U n i t s by Va lu e , 2 0 2 3 Owner Units Valued < $100K Owner Units Val $100K-$200K Owner Units Val $200K-$500K Owner Units Val > $500K $275,078 Dawsonville $338,147 Dawson County Source:KBAdvisorybasedondatafromClaritas
Real Estate Assessment: Residential
• Dawson County reached a similar peak in 2021 at 581 permits.
• Total permits issued after the Great Recession in 2008 dropped severely in both the city and county , but recovery began in 2012.
• Compared to before 2008, issued permits increased 41% when comparing 2003-2007 and 20172021. At the county level, this increase was 15%.
152 | Comprehensive Downtown Strategic Plan A-30 0 20 40 60 80 100 120 140 160 180 200 Da w s o n v i l le Re s i d e n t i a l B u i ld i n g Pe r m i t s by Ty p e , 2 0 0 1 - 2 0 2 3 Y T D Units in Single-Family Structures Units in All Multi-Family Structures 0 100 200 300 400 500 600 700 Da w s o n C o u n t y Re s i d e n t i a l B u i ld i n g Pe m i t s by t y p e , 2 0 0 1 - 2 0 2 3 Y T D
B u i ld i n g Pe r m i t s T h e n u m b e r of re s i d e n t i a l b u i ld i n g p e r m i t s i s s u e d i n Da w s o nv i l le h i t a t we n t y - ye a r p e a k i n 2 0 2 0 a t 1 4 6 u n i t s , a l l of w h i c h we re w i t h i n s i n g le - fa m i ly s t r u c t u re s
64 Avg. Permits/year 103 Avg. Permits/year 382 Avg. Permits/year 437 Avg. Permits/year Source:KBAdvisorybasedondatafrom HUD
City & County
New Home Sales
Ne w h o m e s a le s i n Da w s o nv i l le a n d t h e c o u n t y p e a ke d i n 2 0 2 0 , a n d s a le s w i t h i n t h e c i t y re p re s e n te d a 4 2 % s h a re o f t h e c o u n t y S i n c e 2 0 1 7 , t h e c i t y h a s a ve ra g e d 2 9 n e w h o m e s s a le s a n n u a l ly c o m p a re d to 1 0 0 n e w h o m e s w i t h i n t h e C o u n t y Da w s o nv i l le h a s h i s to r i ca l ly ca p t u re d a t h i rd o f t h e c o u n t i e s n e w, fo r - s a le h o m e s
• Since 2017, no new attached homes have been sold within the city. Since 2021, 41 new townhome sales have occurred in the county.
• The sales price of all homes in Dawson County has steadily increased since 2017 with the County sales demonstrating an 80% increase compared to a 110% increase within the City of Dawsonville.
• Of note, annualized 2023 data represent estimates based on data through June 2023 and may not reflect current trends. Source:KBAdvisoryGroup,basedondatafromsmartRE
Dawson County
Dawsonville
Comprehensive Downtown Strategic Plan | 153 A-31
Re a l E s ta te A s s e s s m e n t : Re s i d e n t i a l $204,586 $264,737 $429,835 $258,314 $306,498 $463,858 $$50,000 $100,000 $150,000 $200,000 $250,000 $300,000 $350,000 $400,000 $450,000 $500,000 2017 2018 2019 2020 2021 2022 2023 Annualized Da w s o n v i l le a n d Da w s o n C o u n t y N e w Ho m e S a le s Dawsonville Dawson County 28 21 36 59 40 12 8 8 44 74 144 141 104 108 81 81 0 50 100 150 200 250 2017 2018 2019 2020 2021 2022 2023 Annualized Da w s o n v i l le a n d Da w s o n C o u n t y N e w Ho m e S a le s
City & County
Resale Home Sales
• Since 2017, the average price of resale homes increased 113% within the city compared to 93% within the County.
154 | Comprehensive Downtown Strategic Plan A-32
Re s a le h o m e s w i t h i n t h e c i t y co m p r i s e d a n a ve ra g e of 1 4 % of a l l re s a le s w i t h i n t h e co u n t y s i n c e 2 0 1 7 w i t h m o s t s a le s b e i n g d e ta c h e d h o m e s
Source:KBAdvisoryGroup,basedondatafromsmartRE Re a l E s ta te A s s e s s m e n t : Re s i d e n t i a l 43 50 48 63 65 58 22 9 6 9 8 7 9 3 0 100 200 300 400 500 600 700 2017 2018 2019 2020 2021 2022 2023 YTD Da w s o n v i l le a n d Da w s o n C o u n t y Re s a le Ho m e s Dawson County - Detached Dawsonville - Detached Dawson County - Attached Dawsonville - Attached $298,814 $574,298 $211,701 $440,450 $138,832 $278,110 $117,161 $242,500 $$100,000 $200,000 $300,000 $400,000 $500,000 $600,000 $700,000 2017 2018 2019 2020 2021 2022 2023 YTD Da w s o n v i l le a n d Da w s o n C o u n t y Re s a le Ho m e s Dawsonville - Detached Dawsonville - Detached Dawson County - Attached Dawsonville - Attached
Apartment Market
Pricing and Vacancy Trends
To
a p a r t m e n t i nve n to r y i n Da w s o nv i l le h a s b e e n s ta g n a n t a t 1 7 5
• Spikes in vacancy occurred following the delivery of Farmington Woods, but quickly returned to a healthy 5% by 2015.
• Similar to home sale prices, rents began to increase more rapidly after 2020. Low vacancy and limited new rental supply contributed to an annual rent growth of 15% and 10% in 2021 and 2022.
• Since 2017, rents grew 40%.
Comprehensive Downtown Strategic Plan | 155 A-33
ta l
s i n c e 2 0 1 3
Re a l E s ta te A s s e s s m e n t : Re s i d e n t i a l Source:KBAdvisoryGroup,basedondatafromCoStar. $ 7 8 1 $ 1 , 1 1 3 1 6 % 1 5 % 5 % 0.0% 5.0% 10.0% 15.0% 20.0% 25.0% 30.0% 35.0% $0 $200 $400 $600 $800 $1,000 $1,200 Vacancy (%) Avg. Asking Rent($) Da w s o n v i l le Re n t a n d Va ca n c y 0 20 40 60 80 100 120 140 160 180 200 Da w s o n v i l le Re n ta l , M u lt i fa m i ly I n ve n to r y
Re
Apartment Market
Pricing and Vacancy Trends
To ta l a p a r t m e n t i nve n to r y w i t h i n Da w s o n C o u n t y h a s b e e n s te a d i ly i n c re a s i n g s i n c e 2 0 1 7 , a d d a n a n n u a l a ve ra g e of 2 7 0 n e w u n i t s / ye a r
• Vacancy has mirrored new deliveries, with healthy absorption within the market along with
• Since 2019, annual rent growth averaged 5.4% with rents growing 33% since 2017.
• New deliveries in 2023 prompted another uptick in vacancy. Historically, Dawson County averaged 4.6% vacancy ahead of a surge of deliveries.
Source:KBAdvisoryGroup,basedondatafromCoStar.
156 | Comprehensive Downtown Strategic Plan
A-34
a l E s ta te A s s e s s m e n t : Re s i d e n t i a l
$ 1 , 2 0 2 $ 1 , 6 3 9 2 9 % 1 1 % 1 7 % 0.0% 5.0% 10.0% 15.0% 20.0% 25.0% 30.0% 35.0% $0 $200 $400 $600 $800 $1,000 $1,200 $1,400 $1,600 $1,800 Vacancy (%) Avg. Asking Rent ($) Da w s o n C o u n t y Re n t a n d Va ca n c y 0 200 400 600 800 1,000 1,200 1,400 1,600 1,800 Da w s o n C o u n t y Re n ta l , M u lt i fa m i ly I n ve n to r y
City of Dawsonville
Residential Pipeline
• 8% of the total residential pipeline has been permitted.
• 3% of the total pipeline is under construction.
• 14% of the total pipeline is platted.
• The current lending market coupled with persistently elevated construction and labor costs make it unlikely that the current pipeline would be delivered within ten years.

Comprehensive Downtown Strategic Plan | 157 A-35 W i t h i n t h e C i t y, t h e re a re 1 , 5 4 1 p ro p o s e d re s i d e n t i a l lo t s
Re a l E s ta te A s s e s s m e n t : Re s i d e n t i a l
T o t a l L o t s P e r m i t t e d U n d e r C o n s t r u c t i on P l a t t e d T o t a l 1 , 5 4 1 T o t a l b y S t a g e 1 2 3 4 3 2 1 3
Source:KBAdvisoryGroup,basedondatafromCoStar&CityofDawsonville.
158 | Comprehensive Downtown Strategic Plan A-36
Commercial
Real Estate Assessment:
Real Estate Assessment: Commercial
Re a l E s ta te I n ve n to r y C o m p a ra t i ve O ve r v i e w
Re ta i l w i t h i n t h e D ow n tow n D eve lo p m e n t A u t h o r i t y ( D DA )
a re a fo l low s s i m i la r t re n d s to re ta i l i n t h e re g i o n a t la rg e
• Retail vacancy rates within the DDA area are relatively lower and average rent/sf are marginally higher than the region.
• On a square foot basis, retail space within the DDA boundary represents only 8% of retail in the Local Retail trade Area.
• Hospitality occupancy, on the other hand, is higher than the regional average however the average daily room rate within the DDA area is half the regional average.
Comprehensive Downtown Strategic Plan | 159 A-37
DDA LRTA RRTA Multifamily Existing Buildings 7 20 101 Existing Units 63 1,596 6,469 Vacancy % 6% 11% 9% Avg. Asking Rent/Unit - $1,463 $1,355 Retail Existing Buildings 39 234 1,254 Existing SF 268,387 3,207,190 13,793,896 Vacancy % 1% 2% 2% Avg. Rent / SF $18.86 $20.21 $18.78 Hospitality Existing Buildings 1 6 40 Existing Rooms 18 485 2,152 Occupancy % 67% 62% 62% Avg. Daily Room Rate (ADR) $65 $128 $135
Source:KBAdvisorybasedondatafromCoStar
Real Estate Assessment: Commercial
• Inclusive of the current pipeline, over 60% of new commercial real estate square footage has been dedicated to multifamily.
• Despite representing 50% of the region’s delivery of new multifamily square footage in the 2000s, the DDA area has had little to no new deliveries since then. Source:KBAdvisorybasedondatafromCoStar
North Georgia Premium Outlets opened in 1996
Multifamily
Retail
160 | Comprehensive Downtown Strategic Plan A-38 0 1 2 3 4 5 P r e 1 9 5 0s 1 9 5 0 s 1 9 6 0 s 1 9 7 0 s 1 9 8 0 s 1 9 9 0 s 2 00 0 s 2 01 0s 2 02 0 s Millions of SF N e w C o m m e r c i a l D eve lo p m e n t w i t h i n t h e R R TA by D e ca d e
Hospitality
Re ta i l I n ve n to r y O ve r t h e p a s t t wo d e ca d e s , m u lt i fa m i ly h a s d o m i n a te d n e w co m m e rc i a l s q u a re fo o ta g e d e l i ve r i e s i n t h e re g i o n
Real Estate Assessment: Commercial
• The existing retail inventory is clustered along major transportation routes
• The highest concentration and more varied retail exists around the intersection of Interstate 400 and Highway 20 south of Cumming and the North Georgia Premium Outlets.
• The existing retail inventory within the DDA tends to be smaller and stay along Highway 53.

Comprehensive Downtown Strategic Plan | 161 A-39
Re ta i l I n ve n to r y A l m o s t h a lf of t h e co m m e rc i a l i nve n to r y w i t h i n t h e re g i o n i s d e d i ca te d to re ta i l s p a c e
R e t a i l D D A L R T A R R T A Existing Buildings 39 234 1,254 Existing SF 268,387 3,207,190 13,793,896 Vacancy % 1% 2% 2% Avg. Rent / SF $18.86 $20.21 $18.78 Source:KBAdvisorybasedondatafromCoStar
Real Estate Assessment: Commercial
• Although there have been fluctuations since 2010, the average regional retail vacancy has been declining.
• Over this same time period, the average region retail rent has grown by over a third.
• This combination highlights a resilient retail market.
162 | Comprehensive Downtown Strategic Plan A-40
Re ta i l Pe r fo r m a n c e D e s p i te le s s co n s i s te n t h i s to r i ca l re ta i l va ca n c i e s w i
n
h e re g i o n , re ta i l re n t s h a ve s e e n a g ra d u a l i n c re a s e s i n c e 2
t h i
t
0 1 0
*2023YTDisthroughAugust2023 Source:KBAdvisorybasedondatafromCoStar 0% 2% 4% 6% 8% 2 0 2 3 Y T D 2 0 2 2 2 0 2 1 2 0 2 0 2 0 1 9 2 0 1 8 2 0 1 7 2 0 1 6 2 0 1 5 2 0 1 4 2 0 1 3 2 0 1 2 2 0 1 1 2 0 1 0 Ave ra g e Re g i o n a l Re ta i l Va ca n c y, 2 0 1 0 - 2 0 2 3 $0.00 $5.00 $10.00 $15.00 $20.00 $25.00 2 0 2 3 Y T D 2 0 2 2 2 0 2 1 2 0 2 0 2 0 1 9 2 0 1 8 2 0 1 7 2 0 1 6 2 0 1 5 2 0 1 4 2 0 1 3 2 0 1 2 2 0 1 1 2 0 1 0 Ave ra g e Re g i o n a l Re ta i l Re n t p e r S q u a re Fo o t , 2 0 1 0 - 2 0 2 3
Real Estate Assessment: Commercial
• The majority of hotels within the region have 150 rooms or less.
• Similar to existing retail, the larger hotels are concentrated south of Cumming and near the North Georgia Premium Outlets.

Comprehensive Downtown Strategic Plan | 163 A-41
Ho te l I n ve n to r y L e s s t h a n 5 % of t h e c u r re n t co m m e rc i a l i nve n to r y i s d e d i ca te d to h o s p i ta l i t y s p a c e
R e t a i l D D A L R T A R R T A Existing Buildings 1 6 4 0 Existing Rooms 1 8 4 8 5 2 , 1 5 2 Occupancy % 6 7 % 6 2 % 6 2 % Average Daily Room Rate (ADR) $ 6 5 $ 1 2 8 $ 1 3 5 Source:KBAdvisorybasedondatafromCoStar
Real Estate Assessment: Commercial
• Excluding 2020, hotels within the region have maintained average annual occupancy levels above 60% since 2014.
• The region’s average daily room rate has grown by over 50% since 2010 and is currently higher than pre-pandemic.
164 | Comprehensive Downtown Strategic Plan A-42
Ho te l Pe r fo r m a n c e E x c e p t fo r d u r i n g t h e m i d d le of t h e p a n d e m i c , h o te l s w i t h i n t h e re g i o n h a ve m a i n ta i n e d a s te a d y p e r fo r m a n c e
*2023YTDisthroughAugust2023 Source:KBAdvisorybasedondatafromCoStar 0% 20% 40% 60% 80% 2 0 2 3 Y T D 2 0 2 2 2 0 2 1 2 0 2 0 2 0 1 9 2 0 1 8 2 0 1 7 2 0 1 6 2 0 1 5 2 0 1 4 2 0 1 3 2 0 1 2 2 0 1 1 2 0 1 0 Ave ra g e Re g i o n a l Ho te l O c c u p a n c y, 2 0 1 0 - 2 0 2 3 * $$40 $80 $120 $160 2 0 2 3 Y T D 2 0 2 2 2 0 2 1 2 0 2 0 2 0 1 9 2 0 1 8 2 0 1 7 2 0 1 6 2 0 1 5 2 0 1 4 2 0 1 3 2 0 1 2 2 0 1 1 2 0 1 0 Ave ra g e Re g i o n a l Da i ly Ro o m Ra te , 2 0 1 0 - 2 0 2 3 *
Real Estate Assessment: Commercial
• Occupancy levels have grown the most for economy hotels since 2010, peaking above midscale to upper luxury hotels in 2021.
• While average daily room rates for economy hotels within the region have remained relatively stable, the price premium for upper luxury hotel rooms has grown.
• Since 2010, the average room rate for an upper luxury hotel room has grown by 68%.
• The current price premium of one of these rooms is over $100 compared to upper midscale or midscale rooms and over $150 compared to economy rooms.
• Although the region is less diverse in hotel size, there is diversity in range of hotels by class, with none of the major classes exceeding 37% of the existing hotel inventory.
Comprehensive Downtown Strategic Plan | 165 A-43
Ho te l Pe r fo r m a n c e C o m p a r i n g by h o te l c la s s , e co n o my h o te l s h a ve h a d t h e m o s t co n s i s te n t h i s to r i ca l p e r fo r m a n c e
0% 20% 40% 60% 80% 2 02 3 Y T D 2 02 2 2 02 1 2 02 0 2 01 9 2 01 8 2 01 7 2 01 6 2 01 5 2 01 4 2 01 3 2 01 2 2 01 1 2 01 0 Re g i o n a l Ho te l O c c u p a n c y by Ho te l C la s s , 2 0 1 0 - 2 0 2 3 * Upper Luxury Upper Midscale-Midscale Economy $$50 $100 $150 $200 $250 2 02 3 Y T D 2 02 2 2 02 1 2 02 0 2 01 9 2 01 8 2 01 7 2 01 6 2 01 5 2 01 4 2 01 3 2 01 2 2 01 1 2 01 0 Ave ra g e Re g i o n a l Da i ly Ro o m Ra te by Ho te l C la s s , 2 0 1 0 - 2 0 2 3 * Upper Luxury Upper Midscale-Midscale Economy
*2023YTDisthroughAugust2023 Source:KBAdvisorybasedondatafromCoStar
Real Estate Assessment: Commercial
• The multifamily and hospitality pipeline is currently clustered near 400 and Highway 53.
• Over 80% of the current pipeline is expected to deliver before 2025.

166 | Comprehensive Downtown Strategic Plan A-44
P i p e l i n e T h e c u r re n t co m m e rc i a l re a l e s ta te p i p e l i n e co n s i s t s of m o s t ly la rg e r m u lt i fa m i ly d eve lo p m e n t s
P i p e l i n e D D A L R T A R R T A Retail (SF) 0 2 , 9 0 0 1 4 0 , 0 1 3 Hospitality (Rooms) 0 1 8 5 3 2 8 Multifamily (Units) 0 1 9 3 1 , 4 4 7 Source:KBAdvisorybasedondatafromCoStar
Real Estate Demand Forecast
Comprehensive Downtown Strategic Plan | 167 A-45
Demand Potential
The chart below assesses the market opportunity for each use based on a series of m a r ke t c o n d i t i o n s including: development pipeline for each use, rents, vacancy rates, and future potential.
Market Opportunity Assessment
Re ta i l
Lowest Highest
168 | Comprehensive Downtown Strategic Plan A-46
n
l
Re s i d e
t i a
o s p i ta l i t y
H
Conclusions
Residential within Downtown Dawsonville represents the highest market-driven potential. The success of residential development is vital to the activating Downtown as additional residents will be a key demand driver for retail. Within the next 10 years, the city could reasonably absorb 700-800 new residential units, or about 77 units annually.
There is a strong residential pipeline within the City of Dawsonville, with the majority surrounding the Downtown area and proposed as single-family forsale. Without improve connectivity and walkability, the delivery of currently proposed residential is not likely to drive foot-traffic in Downtown.
Denser housing within Downtown will offer diversity, especially for those looking to downsize, retirees or empty nesters, as well as younger professionals and families seeking access to walkable amenities. Given the lack of new, attached product within the city, development interest may be dampened by a lack of demonstrated market performance.
Within Dawson County, however, new rental multifamily and for-sale townhomes have performed well.
There is existing retail leakage within the Local Regional Trade Area which could support up to 13,000 SF of new retail, particularly Food & Beverage. Within the next ten years, the city could support an additional 20,000 SF of retail- this is dependent on supportable household growth and well executed Downtown revitalization efforts.
Attracting a new hotel to the City of Dawsonville will be the most challenging as the current hotel market has yet to recover to prepandemic occupancy rates. While ADRs have consistently grown, the local market has not achieved occupancy over 70%. Without additional entertainment, retail, or public incentive, investors and developers may be wary to enter the market.
Large, single tenant office space will be difficult to attract to Dawsonville in the next 5 to 8 years. There is an opportunity to attract coworking space (less the 4,000 SF), likely a feature of a mixed-use Downtown core. Additional households, retail, and improved civic amenities within the Downtown will improve the city’s ability to attract new office product in the coming decades, however, demand is still limited.
Comprehensive Downtown Strategic Plan | 169 A-47
Us e 1 0 - y e a r D e m a n d ( S F / U n i t s / R o o m s ) Residential 700 – 800 units Retail 22,000 – 36,000 SF Hospitality 80-120 Rooms Re s i d e n t i a l :
O f f i c e :
R Re ta i l :
Ho te l :
Demand Overview and Summary
Residential and commercial demand are expected to see a slight increase in the next 10 years.
Future residential demand by age, income, and tenure were utilized to best understand market segmentation for future residential demand. This data represents household trends for the City of Dawsonville. Downtown Dawsonville will need to capture a larger share of new residential.
Existing demand for new retail is moderate. Future demand potential within the next ten years assumes demand momentum supported by new household growth and Downtown revitalization efforts.
170 | Comprehensive Downtown Strategic Plan A-48
Estate Demand Forecast
Real
Re ta i l D e m a n d , 2 0 2 4 - 2 0 3 3 E x i s t i n g D e m a n d 1 0 - y e a r F u t u re Po te n t i a l To ta l Po te n t i a l Demand 13,000 sf 22,000 sf 35,500 SF M a r ke t R a te Fo r - S a le a n d Re n ta l D e m a n d , C i t y o f D a w s o n v i l le , 2 0 2 42 0 3 3 Detached Attached Total 10-year Annual 10-year Annual 10-year Annual Demand 530 53 230 23 770 77
10-year Residential Demand by Income
Growth in high-earning households is expected within the next ten years.
• Within owner households, 47% of households are expected to make more than $100,000 annually by 2033. By contrast, just 10% of renter households are expected to earn more than $100,000 annually.
• New construction residential product, particularly vertical mixed-use, will likely target households earning more than $75,000.
• Renter households earning $50,000$150,000 are expected to grow 4% by 2023, supporting new construction rents.
• High-earning ($150,000+) homeowners are expected to grow 7%, representing the largest segment of the market in terms off new growth.
2033 Demand by Income, Owner & Renter
2024-2033 Change in Households by Income & Tenure
Source:KBAdvisorybasedondatafromCoStar,SmartRE , CensusACS5-yearestimates,Claritas
Comprehensive Downtown Strategic Plan | 171 A-49
Real Estate Demand Forecast
50% 40% 9% 1% 0% 16% 36% 25% 13% 9% 0% 10% 20% 30% 40% 50% 60% Less than $50,000 $50k - $100k $100k - $150k $150k - $200k $200k +
Renter Households Owner Households -4.2% 1.6% 2.2% 0.3% 0.2% -3.9% -4.2% 0.8% 2.9% 4.4% -6.0% -4.0% -2.0% 0.0% 2.0% 4.0% 6.0% Less than $50,000 $50k - $100k $100k - $150k $150k - $200k $200k +
Real Estate Demand Forecast 10-year Residential Demand by Age
Based on a forecast of historical trends, Dawsonville’s household growth is almost exclusively within those aged 65+.
• Given the demographic trends of the past 10 years, over a third of renters and owners are expected to be 65+ in ten years, having a significant influence on future housing needs.
• Over half of renter households are expected to be younger than 44, a mix of young professional singles, couples, and families.
2033 Demand by Age, Owner & Renter
2024-2033 Growth in Households by Age & Tenure
• The successful implementation of Dawsonville’s Downtown revitalization could attract both renters and owners not currently in the market. Dawsonville’s ability to capture more of the growing North Atlanta metro is dependent on the execution of improved lifestyle amenities catering to both 65+ retirees and empty nesters as well as young families and working professionals. Source:KBAdvisorybasedondatafromCoStar,SmartRE
172 | Comprehensive Downtown Strategic Plan A-50
1.1% -2.0% -1.3% -1.1% -0.6% 3.8% 0.0% -0.6% -0.2% -0.7% -0.5% 2.1% -3.0% -2.0% -1.0% 0.0% 1.0% 2.0% 3.0% 4.0% 5.0% Younger than 25 25 - 34 35 - 44 45 - 54 55 - 64 65+
, CensusACS5-yearestimates,Claritas
0% 5% 10% 15% 20% 25% 30% 35% 40% Younger than 25 25 - 34 35 - 44 45 - 54 55 - 64 65+
Real Estate Demand Forecast
Considering those households which will be attracted to and able to afford new housing product in Dawsonville, the following target audience were identified.
Future homeowners in Dawsonville will likely be:
• Households earning more than $100k
• Households aged 35+, however around half of target market within ownership positions will be 55+
• Retirees or Empty Nesters
• Young to mature singles and couples, some with school-aged or adult children
Future renters in Dawsonville will likely be:
• Households earning $50-$100K (41% of rental target audience)
• Young to middle-aged professionals seeking regional access within an activated core
• Seniors earning between $50,000 - $150,000
New market-rate housing is unlikely to meet demand for over half of future potential renter households earning less than $50,000. It will be difficult to achieve housing affordability (households paying less than 30% of their income on housing) for this segment without subsidy, public participation, or low-cost land.
Given the concentration of older households, there is a strong opportunity for a 55+ active adult community which could attract current homeowners in the market who would find a curated rental home appealing. This market segment is additional potential demand to the existing 55+ renters (17% of the rental target audience).
2 0 3 3 D e m a n d by Ag e & I n co m e , Re n te r
( Ta rg e t A u d i e n c e re p re s e n t 7 6 % of a l l p r o s p e c t i ve re n te r s )
Source:KBAdvisorybasedondatafromCoStar,CensusACS5-yearestimates,Claritas
Comprehensive Downtown Strategic Plan | 173 A-51
Ta rg e t A u d i e n c e s by Te n u re , Ag e , a n d I n co m e
2 0 3 3 D e m a n d by Ag e & I n co m e , O w n e r ( Ta rg e t A u d i e n c e re p re s e n t 4 3 % of a l l p r o s p e c t i ve ow n e r s ) Younger than 25 25 - 34 35 - 44 45 - 54 55 - 64 65+ >$50,000 0% 1% 1% 2% 2% 9% 16% $50k - $100k 0% 4% 6% 6% 6% 14% 36% $100k - $150k 0% 3% 6% 6% 5% 5% 25% $150k - $200k 0% 1% 2% 4% 3% 3% 13% $200k + 0% 0% 1% 3% 3% 2% 9% Total 1% 9% 17% 21% 19% 34% 100%
25
35
64 65+ >$50,000 1% 8% 8% 4% 5% 23% 50% $50k - $100k 8% 8% 9% 3% 3% 8% 40% $100k - $150k 3% 2% 2% 1% 1% 1% 9% $150k - $200k 0% 0% 0% 0% 0% 0% 1% $200k + 0% 0% 0% 0% 0% 0% 0% Total 13% 19% 20% 8% 9% 32% 100%
Younger than 25
- 34
- 44 45 - 54 55 -
Real Estate Demand Forecast
Demand for for-sale homes is concentrated primarily in detached product (86%) whereas rental demand is more evenly split across attached (52%) and detached product (45%).
Demand for for-sale homes represents nearly 70% of future housing demand.
174 | Comprehensive Downtown Strategic Plan A-52
At ta c h e d a n d D e ta c h e d Re n ta l Ho u s i n g D e m a n d Source:KBAdvisorybasedondatafromCoStar,Claritas 7 8 2 0 7 7 2 0 2 4 6 8 10 12 14 16 Demand for Rental Housing by Income Range Attached Detached M a r k e t R a t e F o r - S a l e D e m a n d , 2 0 2 3 - 2 0 3 3 Detached Attached Total 10-year Annual 10-year Annual 10-year Annual For-sale 380 38 60 6 440 44 Rental 150 15 170 17 330 33 6 14 10 5 4 1 2 2 1 0 2 4 6 8 10 12 14 16 18 Demand for For-Sale Housing by Income Range Attached Detached
Real Estate Demand Forecast
Re ta i l D e m a n d
Demand for new retail within Downtown Dawsonville will be largely reliant on new households and visitors. Currently, over half on existing and future retail demand is for food and beverage. Health and Wellness comprise the second largest share by store type demanded at 20% of the total 10-year demand.
• Considering the draw of the North Georgia Premium Outlets, retail within Downtown Dawsonville should be focused on diversifying local and regional retail. New format retail should amplify the retail offering in Dawsonville while avoiding the cannibalization of existing retail. Distinguishing Downtown retail from retail along 400 will be necessary.
• There exist opportunities, especially within the historic core, for redevelopment of existing retail or commercial space. Redevelopment efforts are strengthened by high traffic counts along Main Street, but walkability features should be in step with new construction to increase visitors dwelltime within Downtown.
• Without proper activation of the 17-acre, city owned land, retailers may find spaces set farther back from major corridors (Hwy 53) unappealing.
Retail projections assume Downtown Dawsonville is able to capture 90% of the existing LRTA retail leakage and 50% of RRTA demand within the next ten years.
Comprehensive Downtown Strategic Plan | 175 A-53
Retail Category LRTA Spending Leakage Additional RRTA Spending Leakage 10-year Retail Demand Growth Potential Downtown Sales per SF Existing SF Supported by Leakage Downtown Capture of Existing Demand Future SF (10-year) Downtown Capture of Future Demand Total 10-year Demand Furniture Store $3,698,580 $2,312,894 $450 8,219 740 5,140 2,570 3,310 Health and Wellness $995,012 $10,790,389 $5,599,011 $550 21,428 1,929 10,180 5,090 7,019 Book Store $886,170 $181,954 $450 1,969 985 404 202 1,187 Food & Beverage $8,078,797 $43,098,008 $15,934,820 $600 85,295 7,677 26,558 13,279 20,956 Lawn & Garden Center $12,631,623 $701,623 $500 25,263 2,274 1,403 702 2,975 T o t a l 1 3 , 6 0 3 2 1 , 8 4 3 3 5 , 4 4 6
Source:KBAdvisorybasedondatafromCoStar,Claritas
Real Estate Demand Forecast
Estimated Construction Costs
Estimated construction costs for the 17acre, city-owned property are outlined in the table to the right. This considers build –out as proposed in the Comprehensive Downtown Master Plan.
Cost estimate, including parking and infrastructure assumptions, project the total costs to be between $130 and $160 million.
*Estimates utilize current construction costs estimates per square feet. Additional site work and engineering will provide more accurate infrastructure cost estimates. Source:
176 | Comprehensive Downtown Strategic Plan 1
KB Advisory Estimated Construction Costs Total SF Minimum Maximum Hotel (100 key) 57,400 $27,638,100 - $33,779,900 Conference & Cultural Arts Center 25,000 $11,250,000 - $13,750,000 City Hall & Multi-Use Community Center 26,500 $11,925,000 - $14,575,000 Commercial Building ‘A’ 7,200 $2,268,000 - $2,772,000 Multi-Use Building ‘A’ (60 Units) 57,500 $15,997,500 - $19,552,500 Multi-Use Building ‘B’ (20 Units) 41,800 $12,069,000 - $14,751,000 Multi-Use Building ‘C’ (24 Units) 47,200 $13,284,000 - $16,236,000 Cannery 12,000 $5,825,250 - $7,119,750 Tiny Homes (7) 1,575 $425,250 - $519,750 TOTAL CONSTRUCTION COST $100,682,100 - $123,055,900 Total Spaces Residential Parking 80 $504,000 - $616,000 Commercial Parking (surface) 481 $3,028,200 - $3,701,133 Commercial Parking (structured) 344 $6,192,000 - $7,568,000 TOTAL PARKING COST 905 $9,724,200 - $11,885,133 Infrastructure $18,000,000
$22,000,000 Total Hard Costs $128,406,300 - $156,941,033 Total Soft Costs $2,812,175 - $3,437,102 GRAND TOTAL $131,218,475 - $160,378,136
-

TERMS and LIMITING CONDITIONS
Accuracy of Report: Every reasonable effort has been made to ensure that the data developed in this assignment reflect the most accurate and timely information possible and is believed to be reliable. This consulting assignment was based on estimates, assumptions, and other information developed by KB Advisory Group (“KB”) from its independent research efforts, general industry knowledge, and consultations with the client for this assignment and its representatives. No responsibility is assumed for inaccuracies in reporting by the client, its agents or representatives, or any other data source used in preparing or presenting this study The research and reports are based on information that is current as of the date of this report KB assumes no responsibility for updating the information after the date of this report The research may contain prospective financial information, estimates, or opinions that represent our view of reasonable expectations at a particular point in time. However, such information, estimates, or opinions are not offered as predictions or assurances that a specific outcome will occur Actual results achieved during the period covered by our prospective analysis may vary from those described in our research and report, and variations may be material Therefore, no warranty or representation is made by KB that any of the projected values or results contained in the work product from this assignment will be achieved.
Usage of Report: The research product may not be used, in whole or in part, in any public or private offering of securities or other similar purposes by the client without first obtaining the prior written consent of KB Advisory Group.
Comprehensive Downtown Strategic Plan | 177 A-54
404.845.3550 w w w. k b a g r o u p . c o m