International Journal of Scientific Research and Engineering Development-– Volume 2 Issue 1, Jan-Feb 2019 Available at www.ijsred.com RESEARCH ARTICLE
OPEN ACCESS
Effect Of Company Financial Performance On Investment Ratings In Companies Listed In Indonesia Stock Exchange Ramdan Rossy Faculty of Economics, Sriwijaya University, Palembang, Indonesia ----------------------------------------******************-------------------------------------
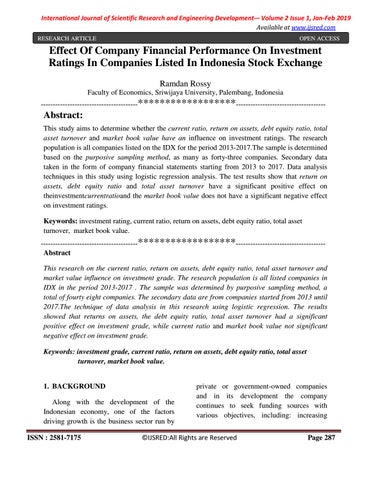
Abstract: This study aims to determine whether the current ratio, return on assets, debt equity ratio, total asset turnover and market book value have an influence on investment ratings. The research population is all companies listed on the IDX for the period 2013-2017.The sample is determined based on the purposive sampling method, as many as forty-three companies. Secondary data taken in the form of company financial statements starting from 2013 to 2017. Data analysis techniques in this study using logistic regression analysis. The test results show that return on assets, debt equity ratio and total asset turnover have a significant positive effect on theinvestmentcurrentratioand the market book value does not have a significant negative effect on investment ratings. Keywords: investment rating, current ratio, return on assets, debt equity ratio, total asset turnover, market book value. ----------------------------------------******************------------------------------------Abstract This research on the current ratio, return on assets, debt equity ratio, total asset turnover and market value influence on investment grade. The research population is all listed companies in IDX in the period 2013-2017 . The sample was determined by purposive sampling method, a total of fourty eight companies. The secondary data are from companies started from 2013 until 2017.The technique of data analysis in this research using logistic regression. The results showed that returns on assets, the debt equity ratio, total asset turnover had a significant positive effect on investment grade, while current ratio and market book value not significant negative effect on investment grade. Keywords: investment grade, current ratio, return on assets, debt equity ratio, total asset turnover, market book value.
1. BACKGROUND Along with the development of the Indonesian economy, one of the factors driving growth is the business sector run by ISSN : 2581-7175
private or government-owned companies and in its development the company continues to seek funding sources with various objectives, including: increasing
ŠIJSRED:All Rights are Reserved
Page 287
International Journal of Scientific Research and Engineering Development-– Volume 2 Issue 1, Jan-Feb 2019 Available at www.ijsred.com
working capital, business expansion, debt payments and goals others. One source of corporate funding is through the capital market. Various efforts made in finding the funding source are called corporate action. Corporate action generally refers to thepolicyright issue, stock split, stock/ cash dividend, IPO, private placement, warrant or bond issuance. Bonds are securities or certificates that contain contractual agreements between lenders (investors) and those given loans (issuers), which means that the issuer recognizes debt to bondholders (Susilowati and Sumarto, 2010). In the development of corporate bond trade in Indonesia, it continues to increase both nominal and volume. Based on capital market statistics on corporate bonds issued by the Financial Services Authority (OJK) in the period 2013 - 2017, there has been an increase. Keown (2005), bonds are the most preferred securities because the cost of issuing them is quite cheap compared to issuing shares, besides that bonds also have aeffecttax shield for the company. Although bonds have many advantages as investment instruments, bonds are also a type of investment that has risks for investors. The risk of investment in bonds is in the possibility of not fulfilling the promise for the payment of the coupon and the principal debt madeby the issuer, therefore investors must understand and be aware of the risk of investment in bonds. ISSN : 2581-7175
The risk of investment in bonds is described on a level based on the ability to pay the obligations of the issuing company. These levels are often referred to as bond ratings. There are several rating agencies recognized by Bank Indonesia listed in the Attachment of Bank Indonesia Circular Letter Number 7 13/31 / DPNP dated 22 December 2011, including: 1. Standard and Poor's Ratings 2. Moody's IndonesiaIndonesian 3. Fitch 4. Credit Rating Credit Rating Indonesia 5. Securities Rating (Pefindo) 6. ICRA Indonesia PemeringkatEfek Indonesia (Pefindo) is used as the main rating agent in this research because until now Pefindo has been actively ranking more than 400 companies from various industrial sectors. Bond rating (credit ratings) is the scale of the risk of all bonds traded. This scale shows how secure a bond is for investors. Bond ratings are divided into two groups based on previous research (Septyawanti, 2013), namely: Investment Grade and NonInvestment Grade.investment gradeAnrated bonds (highgrade), which reflects a low credit risk (highcreditworthiness). NonInvestment Grade is abondlow grade that reflects high creditworthiness. Rating agencies use various factors to rank bonds and one of the dominant factors used in the valuation is based on the company's financial performance. The results of the
ŠIJSRED:All Rights are Reserved
Page 288
International Journal of Scientific Research and Engineering Development-– Volume 2 Issue 1, Jan-Feb 2019 Available at www.ijsred.com
study (KS Kim, 2005) show that bond ratings can be assessed from published financial statements and in this study the financial performance used is company liquidity proxied by current ratio(CR) company profitability that is proxied by return on assets (ROA) , solvency that is proxied by a debt to equity ratio (DER), company activity that is proxied with total asset turnover (TATO) and company growth which is influenced by market book value (MBV) . Almilia (2007), states that the current ratio (CR) has a significant effect on bond ratingsthis is in line with research conducted by (KS Kim, 2005; Ma'arij, Zulbahridar, &Azhar, 2014) but different results were obtained by (Damayanti, 2013; Magreta&Nurmayanti, 2009; Sejati, 2010) which stated that ROA does not significantly affect bond ratings. H. Kim &Gu (2004) states that return on assets (ROA) has a significant effect on bond ratings, this is in line with research conducted by (de Souza Murcia, Murcia, Rover, &Borba, 2014; Gonis, Paul, &Wilson , 2012; Hung, Cheng, Chen, & Huang, 2013; KS Kim, 2005; Rizal Syamsu and WindaSutanti, 2015) but the opposite was found (Luciana Spica Almilia, 2007; Ma'arij et al., 2014; Sejati, 2010) which states that ROA does not significantly influence bond ratings. Purwaningsih (2008) in his study explained that total asset turnover (TATO) tended to significantly influence the temporary bond ratings of different results obtained by (H. Kim &Gu, 2004; Widiastuti, ISSN : 2581-7175
2016) stating that total asset turnover (TATO) had no effect significant to bond ratings. Septyawanti (2013) in his study explained that the debt to equity ratio (DER) significantly affected bond ratings, which is in line with the research conducted by (Gray, Mirkovic, &Ragunathan, 2006; Hung et al., 2013) while different results were obtained by (Damayanti, 2013) the debt to equity ratio (DER) does not significantly influence bond ratings. Almilia (2007) in his study explained that market book value (MBV) significantly affected bond ratings, which is in line with research conducted by (Gonis et al., 2012) while different results were obtained by (Widiastuti, 2016) market book value ( MBV) does not significantly influence bond ratings. 2. LITERATURE STUDY 2.1. Rating of Bonds Bond rating (credit ratings) is the scale of the risk of all bonds traded. This scale shows how secure a bond is for investors. This security is indicated by its ability to pay interest and repay the loan price in a timely manner. The corporate bond rating is expected to provide investorsinstructions on the quality of bond investments they are interested in. The higher the bond rating, the more it shows that the bond avoids the risk of default. Based on the evaluation of the issuance of these bonds, the rating agency gave their opinion in the form of letter rank, which was published to be used by investors.
ŠIJSRED:All Rights are Reserved
Page 289
International Journal of Scientific Research and Engineering Development-– Volume 2 Issue 1, Jan-Feb 2019 Available at www.ijsred.com Information AAA, AA +, AA, AA-, A +, A, A-
1
BBB +, BBB, BBB-BB +, BB, BB-, B +, B, B-, CCC, D
0
Investment Grade Non Investment Grade
Source: ProcessedData
liabilities and shareholder capital that funds the investment. Debt to equity ratio (DER), this ratio shows the provision of funds by shareholders to lenders. The lower corporate funding provided by shareholders. From the perspective of the ability to pay long-term obligations.
2.2. Liquidity According to Sartono (2002) in Almilia and Devi (2007), liquidity is the company's ability to pay short-term financial obligations on time. Companies that have healthy liquidity, at least have a current ratio of 100%. Current ratio is the ability of the company's current assets to meet short-term liabilities with current assets. 100%
=
2.3. Profitability
Return on assets is a measure of profit generated for each company asset. ROA is also a comparison of net income compared to the total assets of the company. !
100%
2.4. Solvability Solvability is the ability of a company to fulfill all its obligations. The solvency ratio measures the relationship between ISSN : 2581-7175
#$ %&'(% (&( ( ") ( *+$&, $-.ℎ%
2.5. Activities Activities company is defined as a company's ability to manage its assets. Total Assets Turn Over according to Syamsudin (2011), is a ratio that describes asset turnover measured from sales volume. So the greater the ratio, the better that means that assets can rotate faster and earn profits and show more efficient use of overall assets in generating sales. # #0 =
Profitability is a measure used to measure how efficiently a company uses its assets and manages its operations.
ROA =
" =
.%& $ #$ %&
2.6. Growth of a growing company requires a lot of funds for investment. These funds can be sourced from internal companies or external companies both in the form of shares and debt. Market To Book Value Ratio (MBV) shows how much the company value of what has been planted by the owner of the company, the higher the ratio, the greater the wealth enjoyed by the owner of the company.
©IJSRED:All Rights are Reserved
Page 290
International Journal of Scientific Research and Engineering Development-– Volume 2 Issue 1, Jan-Feb 2019 Available at www.ijsred.com 123 =
1% 4 5 (6 5 .ℎ 2$$43%& 5 .ℎ% .ℎ
β4TATO + β5MBV + ε Description:
2.7. Hypothesis Viewed from the formulation of the problem and supported by the results of previous studies, the provisional estimates in this study are:
PO: Investment Rating (Dummy) α: Constant β1- β5:Regression Coefficient CR: Liquidity ( CR)
H1: CR affects the
ROA: Profitability (ROA)
investment rating.
DER: Solvability (DER)
H2: ROA affects the
TATO: Activity (TATO)
investment rating.
MBV: Growth (MBV)
H3: DER affects
ε: Residual
investment rating.
Sampling used in determining samples or companies as research objects is purposive sampling,The criteria used in selecting samples are:
H4: TATO affects the investment rating. H5: MBV influences investment rating 3. RESEARCH METHODS The scope and object of research are liquidity (Current Ratio), profitability (Return On Assets), solvency (Debt to Equity Ratio),activity (Total Asset Turnover) and growth (Market Book Value) on investment rankings with an observation period from 2013 to 2017 at companies listed on the Indonesia Stock Exchange and investment ratings issued by PEFINDO in the study period.The logistic regression model used to test the research hypothesis is as follows:
1. All companies listed on the Indonesia Stock Exchange. 2. The bonds are ranked by PT. Pefindo. 3. The company issued bonds, and is still outstanding from 2013 to 2017. 4. It has published financial statements from 2013 to 2017. 5. Having complete data for research purposes Based on these criteria the following results are obtained: Source: Processed Data
PO = α + β1CR + β2ROA + β3DER + ISSN : 2581-7175
©IJSRED:All Rights are Reserved
Page 291
International Journal of Scientific Research and Engineering Development-– Volume 2 Issue 1, Jan-Feb 2019 Available at www.ijsred.com Criteria
4. RESULTS AND DISCUSSION Hypothesis testing is done by usinganalysislogistic regression because the dependent variable is a dummy variable. The results of the logistic regression test used 0.05 as the level of significance.
Number
of Companies Registered on the 2016 Indonesia Stock Exchange
596 (512)
Number of Companies that did not issue bonds in the period 2013- 2017 Bonds Not Rated ByPefindo 2014-2019
(23)
Companies that do not have complete financial statements of
(18)
Total Samples
43
N
Minimum
Maximum
Mean
Std. Deviation
Current Ratio (X1)
215
26.00
600.00
145.0326
72.66601
Return on Assets (X2)
215
-24.00
38.00
4.3107
5.77935
Debt Equity Ratio (X3)
215,
30,
14, 74
3,6088
3,20802
Total Assets Turnover (X4)
215
, 02
3,32
, 5649
, 61426
Market Book Value(X5)
215
, 24
7.30
1.7812
1.18674
Valid N (listwise)
215
Source: SPSS 23 (processed data)
Current Ratio (CR), ie current assets divided by current debt have an average of 145.03% , the standard deviation is 72.66%, the minimum value is 26% and the maximum value is 600%. Thevalue or CRlowestlowestin this study was obtained by PT WehaTransportasi Indonesia Tbk. in 2015 and themaximum value or CRhighestwas obtained by PT Tiphone Mobile Indonesia Tbk in 2016. Return on Assets (ROA), which is net income after tax divided by total assets has an average of 4.31%, standard deviation of ISSN : 2581-7175
5.77 %, the minimum value is -24% and the maximum value is 38%. The minimum value or ROA lowestin this study was obtained by PT Express TransindoUtamaTbk in 2017 and the maximum value or ROAhighestwas obtained by PT SelamatSempurnaTbk in 2014. Debt Equity Ratio (DER), ie total debt divided by total equity has an average of 3.60 times, standard deviation of 3.20 times, minimum value of 0.30 times and maximum value of 14.74 times the minimum value or DERlowestin this study obtained by PT
ŠIJSRED:All Rights are Reserved
Page 292
International Journal of Scientific Research and Engineering Development-– Volume 2 Issue 1, Jan-Feb 2019 Available at www.ijsred.com
BumiSerpongDamaiTbk in 2017 and maximum value or DER the highest was obtained by PT Bank BukpoinTbk in 2017. Total Asset Turnover (TATO), namely sales divided by total assets has an average of 0.56 times, standard deviation of 0.61 times, minimum value of 0.02 times and maximum value amounting to 3.32 times theminimum value or TATOlowestin this study obtained by PT Bank Capital Indonesia Tbk in 2014 and themaximum value or TATOhighestobtained by PT Tiphone Mobile Indonesia Tbk for 2016. There were 188 observations (87.4%) of companies that were ratedbondsinvestment grade while the number of observations of the company obtained abond rating of noninvestment grade 27 observations (12.6%). Classical assumption testing carried out in this study only includes multicollinearity tests. The following istable of multicollinearity test results: Model Current Ratio (X1) Return On Assets (X2) Debt Equity Ratio (X3) Total Assets Turnover (X4) Market Book Value(X5)
further analysis if the results of the Hosmer and Lemeshow test Goodness of Fit Testhave a significance value> 0.05. The following is a table of Hosmer and Lemeshow Goodness of Fit Test testresults : Chi-square
df
Sig.
14,343
8
, 073
Collinearity Statistics Tolerance , 739
VIF 1,352
, 631 , 689 , 604 , 644
1,584 1,452 1,655 1,552
Source: SPSS 23 (data processed) Multicollinearity test shows tolerance value> 0.1 and VIF value <10 which means that there is no multicollinearity between independent variables so that it is suitable to be used in regression testing. Assessing the feasibility of a regression model is done by assessing significantly on thetablesHosmer and Lemeshow Goodness of Fit Test. A regression model is declared feasible for ISSN : 2581-7175
Market Book Value (MBV), which is the stock market value divided by stock book value has an average of 1.78 times, standard deviation of 1.18 times, minimum value of 0.24 times and maximum value of 7.30 times the minimum value or MBVlowestin this study was obtained by PT Express TransindoUtamaTbk in 2015 and the maximum value or MBVhighestwas obtained by PT Nippon IndosariCorpindoTbk in 2014.
Source: SPSS 23 (processed data) Based on the value of goodness of fit measured by the value of Chi-Square at the bottom of the Hosmer and Lemeshow test of 14,343 with a probability of significance 0,073> 0.05. The results of this test show that the hypothesized model is in accordance with existing data so that the model and data can be further tested. Assessing the overall model by comparing the value of thevalueLog Likelihood -2(block 0) with thevalueLog Likelihood -2(block 1) found that there was a decrease in value. If there is a decrease in
ŠIJSRED:All Rights are Reserved
Page 293
International Journal of Scientific Research and Engineering Development-– Volume 2 Issue 1, Jan-Feb 2019 Available at www.ijsred.com
the number -2 Likelihood Log (block number = 0 - block number = 1) shows a good regression model (Ghozali, 2013). Here is a table of test results Overall Fit Test:
equal to 36,560 which means that the model by entering the variables CR, ROA, DER, TATOand MBV is better than the model only intercept. So it can be concluded that this decreasing value shows that the good regression model and the model hypothesized are fit with the data.
Iteration History -2 Log Likelihood (block 0)
162.497
-2 Log Likelihood (block 1)
125.937
Source: SPSS 23 (data processing) test results overallfit test shows that the value of the block 0 compared block
Current Ratio (X1)
Sig.
Exp (B)
1
001
847,99 9 1,285
4.310
1
038
1,207
1,379
6,654
1
, 010 , 632 , 723
35,038
B
SE
Wald
df
-,
001,0 04, 075
037
1,
11.064
090
Total Assets Turnover (X4)
(X2),2 50, (X3),1 88, 3,556
Market Book Value(X5)
-, 144
, 301
, 229
1
Constant
-, 348
, 981
, 126
1
Return on Assets Debt to Equity Ratio
, 866 , 706
Source: SPSS 23 (data processed)
Significant value of current ratio of 0.873> 0.05 then there is no influence significant between liquidity and investment rating so the hypothesisrejected.The test results show that liquidity has not been successfully supported because the current ratio (CR) does not have a significant effect on investment ratings. The findings obtained are not consistent with the proposed hypothesis, this can be interpreted that the size of the current ratio (CR) will not significantly affect the investment rating issued by the investment rating. The results ISSN : 2581-7175
of this study are also reinforced by the change in the value of the average noncurrent ratio fluctuatingwhere during the observation period the changes were less than 10% per year. PEFINDO assesses the company's liquidity based on capital expenditure, cash, estimates of cash receipts from operations and loans that are temporarily unused. The current ratio (CR) assesses liquidity based on current assets and current liabilities of the company. There are limitations in the current ratio (CR) as stated by
ŠIJSRED:All Rights are Reserved
Page 294
International Journal of Scientific Research and Engineering Development-– Volume 2 Issue 1, Jan-Feb 2019 Available at www.ijsred.com
Subramanyam and Wild (2010) that the current ratio (CR) is a static measure of the resources available at one time to meet current liabilities. Significant value of Return On Assets of 0.001 <0.05 indicates that there is a significant effect on investment ranking so the hypothesis is accepted.The results of this test show that the level of company profitability on assets has a significant effect on investment ratings. This is because the level of profitability measured using return on assets (ROA) is one indicator that reflects the level of financial health of the company, the higher the level of profitability the company has on the level of assets it manages, will reflect a good level of financial health. Measurements using return on assets (ROA) aresuitableapplied to assess management effectiveness in managing investments or measuring investment return. A good level of asset management reflected in return on assets (ROA) can provide a good investment rating. The greater the level of return on assets (ROA) can reduce the level of risk the company has. Companies that operate effectively and efficiently trigger investors' view that the company's financial condition is good and have a low risk of default, a decrease in the level of risk can improve its investment rating . The significance value of the Debt Equity Ratio of 0.038 <0.05 indicates that there is a significant influence on investment rank so that the hypothesis is accepted. The results of this test show that the level of corporate debt on own capital has a significant effect on investment ratings. The results of this study mean that an increase in ISSN : 2581-7175
the amount of debt increasing the investment rating caused by effective use of debt for the expansion of the company's operations provides an opportunity for the company to obtain greater profits. A positive relationship between the Debt Equity Ratio (DER) to investment ratings can be caused by the composition of debt that is still not optimal against the level of equity for which the company is still possible to add debt to maximize the principle of exchange between risks and the benefits of using debt. Debt ownership is basically allowed insofar as it has a positive impact on the company's operations and the company is able to carry out its obligations when due. Debt obtained affects the amount of capital owned by the company. Companies that are able to manage these debts well will generate profits. The profits generated will of course have an impact on increasing the company's capital. The significance value of Total Asset Turnover (TATO) of 0.01 <0.05 indicates that there is a significant effect on investment rank so that the hypothesis is accepted. The results of this study mean that the effectiveness of the use of assets reflected in the turnover of assets against net sales can improve investment ratings. The greater the level of effectiveness of the use of assets in increasing net sales shows the greater profits obtained by the company so that investors assess that the company's financial condition is good and has a low risk. The influence of significant activity ratios on investment rankings shows that if the company is able to maximize its assets, the ratio of the company operates better, meaning that the company uses its
ŠIJSRED:All Rights are Reserved
Page 295
International Journal of Scientific Research and Engineering Development-– Volume 2 Issue 1, Jan-Feb 2019 Available at www.ijsred.com
assets efficiently compared to other companies, so the company can increase net sales again. The significance of Market Book Value (MBV) of 0.632 <0.05 indicates that there is no significant effect on investment ranking so the hypothesis is rejected. The results of this study mean that the company's growth is not illustrated based on the company's investment capabilities related to asset management. Investment rating uses industrial competition factors, industry prospects & market share in assessing company growth (Widiastuti, 2016). PEFINDO assesses the company's growth based on industry competition, industry prospects and market share, while in this study the measurement tool used is Market Book Value (MBV) which evaluates based on market prices and company book value. This difference in measurement causes the proposed hypothesis to be rejected, this means that changes in the Market Book Value (MBV) will not change the investment rating provided by PEFINDO.
2.
3.
4.
5. CONCLUSIONAND SUGGESTION Based on the results of data analysis and discussion that have been conducted, the following conclusions are obtained: The 1.
company's liquidity which is proxied by Current Ratio (CR) does not have a statistically significant effect on investment ratings. The results showed that the proposed hypothesis was rejected. This is because PEFINDO further assesses the company's liquidity capability on the basis
ISSN : 2581-7175
5.
of a cash flow statement, which provides more detailed information and is strengthened by the results of the research that the change in average current ratio is not fluctuating, where the change period is less than 10% per year. The profitability of the company that is proxied by Return On Assets (ROA) has a statistically significant effect on investment ratings. The results of the study show that the proposed hypothesis is accepted. This is because the effectiveness of the use of assets reflected in the company's returns shows that the company is able to optimize the company's assets to record profits. The company's solvency proxied by the Debt Equity Ratio (DER) has a statistically significant effect on investment ratings. A positive direction shows that the company under study is still possible to add debt to optimize the benefits of debt. The results of the study show that the Debt Equity Ratio (DER) can be one indicator that reflects the level of risk of the company. The company activities that are proxied by Total Asset Turnover (TATO) have a statistically significant effect on investment ratings. The results of this study indicate that the company is able to optimize the company's assets to increase sales. The research results also show that Total Asset Turnover (TATO) can be one indicator that reflects the level of financial health of the company. The growth of the company that is proxied by Market Book Value (MBV) does not have a statistically significant effect on investment ratings. The results of this study indicate that the company's growth is
ŠIJSRED:All Rights are Reserved
Page 296
International Journal of Scientific Research and Engineering Development-– Volume 2 Issue 1, Jan-Feb 2019 Available at www.ijsred.com
not illustrated based on the company's investment capabilities related to asset management. Based on the conclusions and limitations of the research above, here are some suggestions in this study that might be useful in making investment decisions. For investors, they can use financial performance indicators, Return On Assets (ROA), Debt Equity Ratio (DER) and Total Asset Turnover (TATO) as indicators of the company's financial health to predict bond ratings before investing in bonds. For further research, other independent variables see their effects on bond ratings so that they will enrich the research topics such as earnings management or other financial ratios. REFERENCES Block, S.B. dan Geoffrey, A. Hirt. (2005.) Foundation of Financial Management;New York. The McGraw Hill. Damayanti, A. dan J. M. V. M. (2013). Profitabilitas, Likuiditas, Leverage, Ukuran Perusahaan danPrediksiPeringkatObligasipada Perusahaan Sektor Non Keuangan di Bursa Efek Indonesia. JurnalRisetAkuntansi Dan Perpajakan, 1(2), 238–249. de Souza Murcia, F. C., Murcia, F. D. R., Rover, S., &Borba, J. A. (2014). The determinants of credit rating: Brazilian evidence. BAR - Brazilian Administration Review, 11(2), 188–209.
ISSN : 2581-7175
https://doi.org/10.1590/S18077692201400020005 Ghozali, Imam. (2013). AplikasiAnalisis Multivariate dengan Program IBM SPSS 21 Update PLS Regresi. Semarang: BadanPenerbitUniversitasDiponegoro. Gonis, E., Paul, S., & Wilson, N. (2012). The rating decision and the determinants of credit ratings: A UK empirical investigation. Gray, S., Mirkovic, A., &Ragunathan, V. (2006). The Determinants of Credit Ratings: Australian Evidence. Australian Journal of Management, 31(2), 333–354. https://doi.org/10.1177/03128962060310020 8 Hung, K., Cheng, H. W., Chen, S., & Huang, Y.-C. (2013). Factors That Affect Credit Rating: an Application of Ordered Probit Models. Romanian Journal of Economic Forecasting, 26(4), 94–108. Jensen, &Meckling. (1976). Theory of the Firm : Managerial Behavior , Agency Costs and Ownership Structure. Journal of Financial Economics, 3, 305–360. https://doi.org/10.1016/0304405X(76)90026 Kieso, D. E., Weygandt, J. J., & Warfield, T. D. (2015). Intermediate Accounting: IFRS Edition, Volume 1. JurnalAkuntansi& Auditing Indonesia, (Bissessar 2010), 800. https://doi.org/10.20885/jaai.vol19.iss1.art3 Kim, H., &Gu, Z. (2004). Financial Determinants of Corporate Bond Ratings: An Examination of Hotel and Casino Firms. Journal of Hospitality and Tourism
©IJSRED:All Rights are Reserved
Page 297
International Journal of Scientific Research and Engineering Development-– Volume 2 Issue 1, Jan-Feb 2019 Available at www.ijsred.com
Research, 28(1), 95–108. https://doi.org/10.1177/1096348003261217 Kim, K. S. (2005). Predicting bond ratings using publicly available information. Expert Systems with Applications, 29(1), 75–81. https://doi.org/10.1016/j.eswa.2005.01.007 Luciana Spica Almilia, V. D. (2007). Faktor-Faktor Yang MempengaruhPrediksiPeringkatObligasiPad a Perusahaan Manufaktur Yang Terdaftar Di Bursa Efek Jakarta. Proceeding Seminar Nasional Manajemen SMART, (November), 1–23.
Ma’arij, A., Zulbahridar, &Azhar, A. (2014). “AnalisisFaktorAkuntansi, NonAkuntansi yang MempengaruhPrediksiPeringkatObligasipad a Perusahaan Non-Keuangan yang Terdaftar di BEI, danDiperingkatOleh PEFINDO Periode 2009-2013,” 1(2), 1–13. Magreta, &Nurmayanti, P. (2009). Faktorfaktor yang MempengaruhiPrediksiPeringkatObligasiDit injaudariFaktorAkuntansidan Non Akuntansi. JurnalBisnis Dan Akuntansi, 11(3), 143–154.
Sejati, G. P. (2010). AnalisisFaktorAkuntansidan Non AkuntansidalamMemprediksiPeringkatOblig asi Perusahaan Manufaktur. JurnalIlmuAdministrasi Dan Organisasi, Bisnis&Birokrasi, 17(1), 70–78. Septyawanti, H. I. (2013). Faktor-Faktor Yang MempengaruhiPeringkatObligasi Perusahaan. Accounting Analysis Journal, 2(2), 139–147. https://doi.org/ISSN 22526765 Syamsudin, L. (2011). ManajemenKeuangan Perusahaan. Jakarta: Raja GrafindoPersada. Waleed, D., Alrabadi, H., &Hamarneh, R. S. (2016). Determinants of Banks ’ Credit Ratings : Evidence from Jordan, 12(4), 919– 934. Widiastuti, N. P. T. dan H. R. (2016). PengaruhPertumbuhanPerusahaan ,RasioLikuiditas, Maturity, Dan RasioAktivitasTerhadapPeringkatObligasiPa da Perusahaan Jasa. EJurnalManajemenUnud, 5(11), 6964–6993.
Rizal Syamsu and WindaSutanti. (2015). The Effect Of Growth, Profitability And Liquidity To Bond Rating Of The Banking Firms Listed On The Indonesian Stock Exchange (Period 2009-2013). The Third International Multidisciplinary Conference on Social Sciences, II(June), 34–41.
ISSN : 2581-7175
©IJSRED:All Rights are Reserved
Page 298