Chapter 2 Graphs, Lines, and Inequalities


Section 2.1 Graphs, Lines, and Inequalities
1. (1, –2) lies in quadrant IV
(–2, 1)lies in quadrant II
(3, 4) lies in quadrant I
(–5, –6) lies in quadrant III
2. (,2) lies in quadrant I
3,2 lies in quadrant IV
(4,0) lies in no quadrant (3,3) lies in quadrant II
3. (1, –3) is a solution to 3x – y – 6 = 0 because 3(1) – (–3) – 6 = 0 is a true statement.
4. (2, –1) is a solution to 22 6815xyxy because 22 (2)(–1)6(2)8(1)15 is a true statement.
5. (3, 4) is not a solution to 22 226xy because 22 (32)(42)37, not 6.
6. (1, –1) is not a solution to 22 4 23 xy because 22 1(1)5 236 , not 4 .
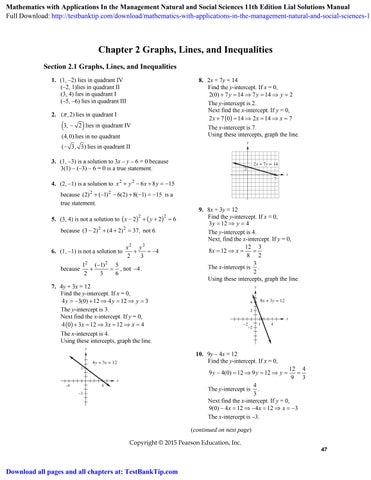
7. 4y + 3x = 12
Find the y-intercept. If x = 0, 43(0)124123 yyy
The y-intercept is 3. Next find the x-intercept. If y = 0, 403123124 xxx
The x-intercept is 4. Using these intercepts, graph the line.
8. 2x + 7y = 14
Find the y-intercept. If x = 0, 2(0)7147142 yyy
The y-intercept is 2. Next find the x-intercept. If y = 0,
270142147 xxx
The x-intercept is 7. Using these intercepts, graph the line.
9. 8x + 3y = 12
Find the y-intercept. If x = 0, 3124 yy
The y-intercept is 4.
Next, find the x-intercept. If y = 0, 123 812 82 xx
The x-intercept is 3 2
Using these intercepts, graph the line.
10. 9y – 4x = 12
Find the y-intercept. If x = 0, 124 94(0)12912 93 yyy
The y-intercept is 4 3
Next find the x-intercept. If y = 0, 9(0)4124123 xxx
The x-intercept is –3.
(continuedonnextpage)
Using these intercepts, graph the line.
15. The x-intercepts are –1 and 2. The y-intercept is –2.
16. The x-intercept is 1. There is no y-intercept.
17. 3x + 4y = 12
To find the x-intercept, let y = 0: 34(0)123124 xxx
The x-intercept is 4.
11. x = 2y + 3
Find the y-intercept. If x = 0, 3 02323 2 yyy
The y-intercept is 3 2
Next, find the x-intercept. If y = 0, 2(0)33xx
The x-intercept is 3. Using these intercepts, graph the line.
To find the y-intercept, let x = 0: 304124123 yyy
The y-intercept is 3.
18. x – 2y = 5
To find the x-intercept, let y = 0: 2(0)55xx
The x-intercept is 5.
To find the y-intercept, let x = 0. 5 02525 2 yyy
The y-intercept is 5 2
19. 2x – 3y = 24
To find the x-intercept, let y = 0: 23(0)2422412 xxx
The x-intercept is 12.
To find the y-intercept, let x = 0: 2(0)3243248 yyy
12. x – 3y = 0
Find the y-intercept. If x = 0, 300 y
The y-intercept is 0. Since the line passes through the origin, the x-intercept is also 0. Find another point on the line by arbitrarily choosing a value for x. Let x = 3. Then, 331 yy
The point with coordinates (3, 1) is on the line. Using this point and the origin, graph the line.


The y-intercept is –8.
20. 3x + y = 4
To find the x-intercept, let y = 0: 4 30434 3 xxx
The x-intercept is 4 3
To find the y-intercept, let x = 0: 3(0)44 yy
The y-intercept is 4.
21. 2 9 yx
To find the x-intercepts, let y = 0: 22 09993 xxx
The x-intercepts are 3 and –3.
To find the y-intercept, let x = 0: 099 y
The y-intercept is –9.
13. The x-intercepts are where the rays cross the x-axis, –2.5 and 3. The y-intercept is where the ray crosses the y-axis, 3.
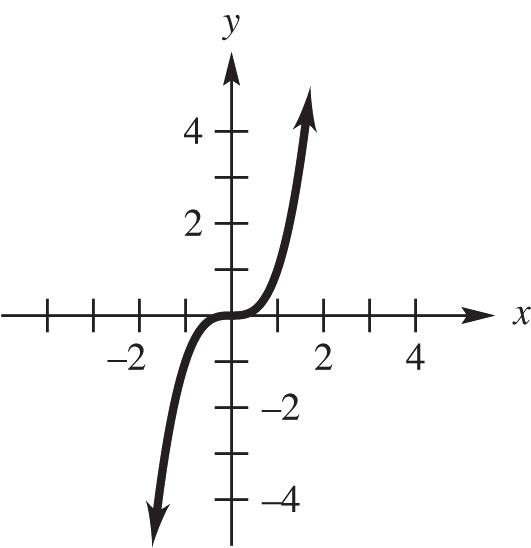
14. The x-intercept is 3; the y-intercept is 1.
Copyright © 2015 Pearson Education, Inc.
22. 2 4 yx
To find the x-intercepts, let y = 0:
To find the y-intercept, let x = 0: 2 3(0)4(0)44 y

The y-intercept is –4.
22 044 4 not a real number xx x
There is no x-intercept.
To find the y-intercept, let x = 0:
2 044 y
The y-intercept is 4.
23. 2 20 yxx
To find the x-intercepts, let y = 0:
2 0200(5)(4) 505 or 404 xxxx xxxx
The x-intercepts are –5 and 4.
To find the y-intercept, let x = 0:
2 002020 y
The y-intercept is –20.
24. 2 561yxx
To find the x-intercepts, let y = 0:
2 05610(51)(1)
xxxx xxxx
27. 2 yx
x-intercept: 2 00 xx
-intercept: y = 0
1 510 or 101 5
The x-intercepts are 1 5 and –1.
To find the y-intercept, let x = 0:
2 5(0)6(0)11 y
The y-intercept is 1.
25. 2 257yxx
To find the x-intercepts, let y = 0:
2 0257 xx
This equation does not have real solutions, so there are no x-intercepts.
To find the y-intercept, let x = 0:
2 2(0)5(0)77 y
The y-intercept is 7.
26. 2 344yxx
To find the x-intercepts, let y = 0:


2 033 y
xxxx xxxx
2 03440(32)(2) 2 320 or 202 3
The x-intercepts are 2 and 2 3
Copyright © 2015 Pearson Education, Inc.
30. 2 2 yx
x-intercept: 2 020 xx
-intercept: 2(0)0 y
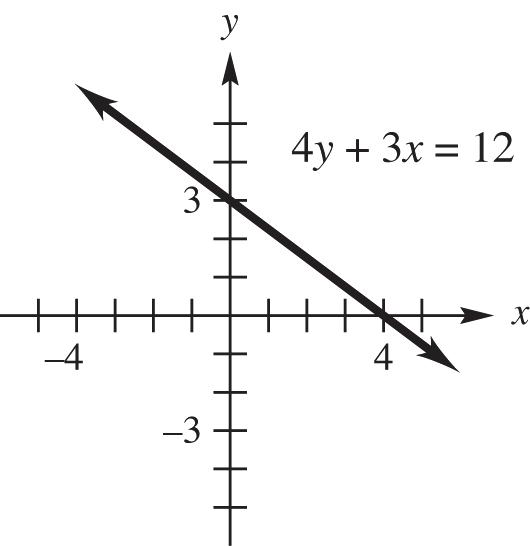
33. 3 yx
x-intercept: 3 00 xx
y-intercept: 3 00yy
34. 3 3 yx
x-intercept: 33 3 0333 xxx
y-intercept: 3 033yy
32. 2 23yxx
-intercept: 2 0230(3)(1) 303 or 101 xxxx xxxx
-intercept: 2 (0)2(0)33 y
35. 3 1 yx
x-intercept: 33 3 01111 xxx
y-intercept: 3 011 y xy –2 –7


Copyright © 2015 Pearson Education, Inc.

x-intercept:
y-intercept:


41. 2008; 20 million pounds
42. 2009; approximately 11 million pounds

43. 2011
44. No years
45. (a) about $1,250,000
(b) $1,750,000
(c) about $4,250,000
46. (a) about $1,000,000
(b) about $2,250,000.
(c) about $3,250,000.
47. (a) about $500,000
(b) about $1,000,000.
(c) about $1,500,000.
Copyright © 2015 Pearson Education, Inc.
48. (a) about $250,000
(b) about $1,250,000
(c) about $1,500,000.
49. beef, about 59 pounds; chicken, about 83 pounds; pork, about 47.5 pounds
50. 2002
51. 2001


52. In 2001, annual per person beef consumption was about 66 pounds, while in 2010, annual per person beef consumption was about 59 pounds, so beef consumption decreased about 7 pounds between 2001 and 2010.
53. about $512 billion
54. in 2005–2010
55. in 2008–2015
56. In 2015, sales are projected to be about $590 billion, while in 2010, sales were about $523 billion, so sales are projected to increase about $67 billion.
57. H–P, about $16.50; Intel, about $21
58. H–P, about $17.00; Intel, about $22
59. About $17.25 on Day 14
60. About $22.60 on Day 12
61. No
62. On day 1, the H–P share price was about $15.00, while the H–P share price was about $16.50 on day 21. So, the H–P share price increased by about $1.50 for the month.
Copyright © 2015 Pearson Education, Inc.
69. 4322 yxxx
The “flat” part of the graph near 1 x looks like a horizontal line segment, but it is not. The y values increase slightly as you trace along the segment from left to right.

70. (a) 4322 yxxx
74. x ≈ .7555
[–3, 3] by [–5, 5]
75. x ≈ –1.7521
[–3, 3] by [–2, 12]
76. x ≈ 2.7693

(b) The lowest point on the graph is approximately at (–.5, –.6875). Answers vary.
71. 1.1038 x
[–3, 3] by [–2, 6]
72. .6823 x
[–1, 53] by [–5, 5]
77. 32 .05561.2869.7617.4yxxx
[4, 9] by [0, 10]
The maximum value of the total assets between 2005 and 2008 was approximately $6.99 trillion.
78. 32 .05561.2869.7617.4yxxx
[–3, 3] by [–3, 3]
73. 2.1017 x
[7, 12] by [0, 10]
The minimum value of the total assets between 2008 and 2011 was approximately $6.79 trillion.
[–3, 3] by [–5, 5]
Copyright © 2015 Pearson Education, Inc.
79. Plot 32 y.3287.7559.0397.1 xxx on [6, 12] by [40, 50], then find the minimum of the curve.
6. Through the origin, (0, 0), and (8, –2) slope 2021 8084
7. Through (–1, 4) and (–1, 6) 642 slope ,not defined 1(1)0
The slope is undefined.
The minimum value of the household assets between 2007 and 2011 was approximately $45.41 trillion.
80. Plot 32 y.3287.7559.0397.1 xxx on [4, 9] by [45, 55], then find the maximum of the curve.
8. Through (–3, 5) and (2, 5) slope 550 0 2(3)5
9. b = 5, m = 4 y = mx + b y = 4x + 5
10. b = –3, m = –7 y = mx + b
y = –7x – 3
11. b = 1.5, m = –2.3
y = mx + b
y = –2.3x + 1.5
12. b = –4.5, m =2.5
The maximum value of the household assets between 2005 and 2008 was approximately $49.24 trillion.
Section 2.2 Equations of Lines
1. Through (2, 5) and (0, 8) 8533 slope 0222
2. Through (9, 0) and (12, 12) slope 12012 4 1293
3. Through (–4, 14) and (3, 0) slope 14014 2 437
4. Through (–5, –2) and (–4, 11) slope 21113 13 5(4)1
5. Through the origin and (–4, 10); the origin has coordinate (0, 0). 100105 slope 4042
Copyright © 2015 Pearson Education, Inc.
16. x + 2y = 7
Rewrite in slope-intercept form.
17. 6x = 2y + 4
Rewrite in slope-intercept form.
24. There are many correct answers, including:
Rewrite in slope-intercept form.
25. (a) Largest value of slope is at C.
(b) Smallest value of slope is at B.
(c) Largest absolute value is at B
(d) Closest to 0 is at D
26. (a) y = 3x + 2
The slope is positive, and the y-intercept is positive. This is line D.
(b) y = –3x + 2
The slope is negative, and the y-intercept is positive. This is line B.
(c) y = 3x – 2
The slope is positive, and the y-intercept is negative. This is line A.
(d) y = –3x – 2
The slope is negative, and the y-intercept is negative. This is line C.
Rewrite in slope-intercept form.
21. 2x – 3y = 0
Rewrite in slope-intercept form.
22. y = 7 can be written as

23. x = y – 5

Rewrite in slope-intercept form.
27. 2x – y = –2
Find the x-intercept by setting y = 0 and solving for x: 202221 xxx
Find the y-intercept by setting x = 0 and solving for y: 2(0)222 yyy
Use the points (–1, 0) and (0, 2) to sketch the graph:
Copyright © 2015 Pearson Education, Inc.
28. 2y + x = 4
Find the x-intercept by setting y = 0 and solving for x: 2(0)44 xx
Find the y-intercept by setting x = 0 and solving for y: 204242 yyy
Use the points (4, 0) and (0, 2) to sketch the graph:
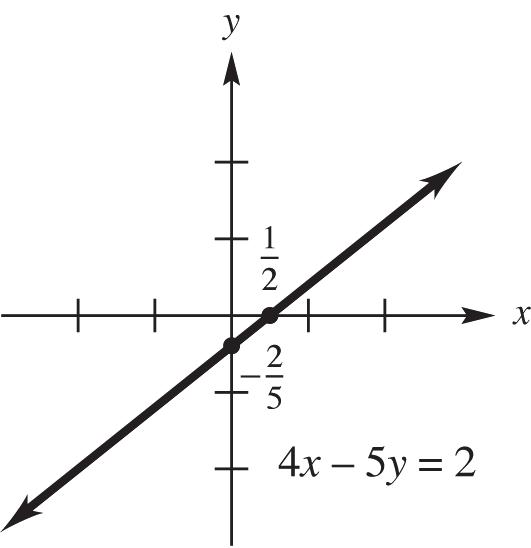
31. 4x – 5y = 2
Find the x-intercept, by setting y = 0 and solving for x: 1
45(0)242 2 xxx
Find the y-intercept by setting x = 0 and solving for y:
29. 2x + 3y = 4
Find the x-intercept by setting y = 0 and solving for x: 23(0)4242 xxx
Find the y-intercept by setting x = 0 and solving for y: 4 2(0)3434 3 yyy
Use the points (2, 0) and 4 0, 3
to sketch the graph:
Use the points 1 ,0 2
and 2 0, 5
to sketch the graph:
30. –5x + 4y = 3
Find the x-intercept by setting y = 0 and solving for x: 3
54(0)353 5 xxx
Find the y-intercept by setting x = 0 and solving for y: 3 5(0)4343 4 yyy
Use the points 3 ,0 5 and 3 0, 4 to sketch the graph:
32. 3x + 2y = 8
Find the x-intercept by setting y = 0 and solving for x:


Find the y-intercept by setting x = 0 and solving for y:
Use the points 8 ,0 3 and (0, 4) to sketch the graph:
Copyright © 2015 Pearson Education, Inc.
33. For 4x – 3y = 6, solve for y
For 3x + 4y = 8, solve for y.
38. 2x – y = 6 and x – 2y = 4
Solve each equation for y to find the slope.
The two slopes are 4 3 and 3 4 . Since
, the lines are perpendicular.
34. 2x – 5y = 7 and 15y – 5 = 6x Solve each equation for y to find the slope.
The slopes are not equal, and their product is
, not –1, so the lines are neither parallel nor perpendicular.
39. Triangle with vertices (9, 6), (–1, 2) and (1, –3).
a. Slope of side between vertices (9, 6) and (–1, 2):
Slope of side between vertices (–1, 2) and (1, –3):
The slope of each line is 2 , 5 so the lines are parallel.
35. For 3x + 2y = 8, solve for y.
For 6y = 5 – 9x, solve for y
Since the slopes are both 3 2 , the lines are parallel.
36. x – 3y = 4 and y = 1 – 3x Solve each equation for y to find the slope.
Slope of side between vertices (1, –3) and (9, 6):
b. The sides with slopes 2 5 and 5 2 are perpendicular, because 25 1 52
. Thus, the triangle is a right triangle.
40. Quadrilateral with vertices (–5, –2), (–3, 1), (3, 0), and (1, –3):
a. Slope of side between vertices (–5, –2) and (–3, 1):
The product of the slopes is 1 (3)1 3
, so the lines are perpendicular.
37. For 4x = 2y + 3, solve for y
2y = 2x + 3, solve for y.
Since the two slopes are 2 and 1, the lines are neither parallel nor perpendicular.
Slope of side between vertices (–3, 1) and (3, 0):
Slope of side between vertices (3, 0) and (1, –3):
Slope of side between vertices (1, –3) and (–5, –2):
Copyright © 2015 Pearson Education, Inc.
b. Yes, the quadrilateral is a parallelogram because opposite sides have the same slope and are therefore parallel.
41. Use point-slope form with 11 2 (,)(3,2), 3 xym
45. 11 (,)(10,1),0 xym
46. 11 (,)(3,9),0 xym
47. Since the slope is undefined, the equation is that of a vertical line through (–2, 12).
48. Since the slope is undefined, the equation is that of a vertical line through (1, 1).
49. Through (–1, 1) and (2, 7) Find
50. Through (2, 5) and (0, 6)
11 (,)(2,3),3
Copyright © 2015 Pearson Education, Inc.
51. Through (1, 2) and (3, 9) Find the slope.
yymxx yx yy
11 90(7) 909
11,(3,4)xy
52. Through (–1, –2) and (2, –1) Find the
425 245 5 22 2
53. Through the origin with slope 5.
11,(6,8)xy
54. Through the origin and horizontal. A horizontal line has slope 0.
1 606
55. Through (6, 8) and vertical. A vertical line has undefined slope.
Copyright © 2015 Pearson Education, Inc.
60. Through (–5, 2) and parallel to the line through (1, 2) and (4, 3).
The slope of the given line is
so the slope of a line
parallel to the line is also 1 . 3
61. Through (–1, 3) and perpendicular to the line through (0, 1) and (2, 3).
The slope of the given line is 1 132 1, 022 m
so the slope of a line
perpendicular to the line is 2 1 1. 1 m
62. y-intercept 3 and perpendicular to 2x – y + 6 = 0.
The slope of this line is 2, so the slope of a line
perpendicular to the line is 1 . 2
63. Let cost x = 15,965 and life: 12 years. Find D
11 15,9651330.42 12
The depreciation is $1330.42 per year.
64. Cost: $41,762; life: 15 years
11 41,7622784.13 15
The depreciation is $2784.13 per year.
65. Let cost x = $201,457; life: 30 years 11 201,4576715.23
The depreciation is $6715.23 per year.
66. Let x = the amount of the bonus. The manager received as a bonus .10(165,000 – x),so x = .10(165,000 – x). Solve this equation. 16,500.10 1.1016,500 16,500
The bonus amounted to $15,000, so the correct choice is (b).
67. a. x = 5
13.695133.6202.05
There were about $202.05 billion or $202,050,000,000 in sales from drug prescriptions in 2005.
b. x = 10. 13.6910133.6270.5 y
There were about $270.5 billion or $270,500,000,000 in sales from drug prescriptions in 2010.
x
x x
68. a. x = 10 40.89(10)405.3814.2 y
The total revenue generated from hospital care will be $1 trillion in the year 2014.
Copyright © 2015 Pearson Education, Inc.
69. a. x = 0
1.8(0)384.6384.6 y
There were approximately 384.6 thousand or 384,600 employees working in the motion picture and sound industries in 2000.
b. x = 10
1.8(10)384.6366.6 y
There were approximately 366.6 thousand or 366,600 employees working in the motion picture and sound industries in 2010.
c. y = 350 3501.8384.6 34.61.819.2 x xx
This corresponds to the year 2019. There will be approximately 350,000 employees working in the motion picture and sound industries in 2019.
70. a. x = 10. 42.1(10)16,28815,867 y
There were 15,687 golf facilities in 2010.
b. y = 15,500. 15,50042.116,288 78842.118.7 x xx
This corresponds to the year 2018. There will be 15,500 golf facilities in 2018.
71. a. The given data is represented by the points (5, 35.1) and (11, 29.7).
b. Find the slope.
72. a. 11 , 0,16.3 xy and 22 , 10,14.9 xy
Find the slope. 14.916.31.4 .14 10010 m
Use the slope-intercept form with (0, 16.3). .1416.3yx
b. Let x = 15. .141516.314.2 y
According to the model, there will be 14.2 million union workers in 2015.
73. a. 11 , 0,.4 xy and 22 , 10,.75 xy
Find the slope. .75.4.35 0.035 10010
The y-intercept is .4, so the equation of the line is y = 0.035x + 0.4.
b. The year 2014 corresponds to x = 2014 – 2002 = 14. 0.035(12)0.40.82 y
In 2014, the price for chicken legs will be about $0.82 per pound.
a.
11 , 0,.6 xy and
22 , 10,1.25 xy
Find the slope. 1.25.6.65 0.065
The y-intercept is .6, so the equation of the line is y = 0.065x + 0.6.
b. The year 2010 corresponds to x = 2010 – 2002 = 8. 0.065(8)0.61.12 y
In 2010, the price for chicken thighs was about $1.12 per pound
c. The year 2009 corresponds to x = 9. 0.9(9)39.631.5 y
Total sales associated with lawn care were about $31.5 billion in 2009.
d. y = 25. 250.939.6 14.60.916.2 x xx
This corresponds to the year 2016. Total sales associated with lawn care will reach $25 billion in 2016.
75. a. 11 , 0,36845 xy and 22 , 10,27200 xy
Find the slope. 27,20036845 964.5 100 m
The y-intercept is 36,845, so the equation is 964.536,845.yx
Copyright © 2015 Pearson Education, Inc.
b. The year 2006 corresponds to x = 2006 – 2000 = 6. 964.5(6)36,84531058 y
In 2006, there were about 31,058 federal drug arrests.
76. a. 11 , 0,1.5 xy and 22 , 10,4.5 xy Find the slope. 4.51.5 .3 100 m
The y-intercept is 1.5, so the equation is .31.5.yx
b. The year 2007 corresponds to x = 2007 – 2000 = 7. .3(7)1.53.6 y
In 2007, the total amount of drugs seized was about 3.6 million pounds.
c. 5.7.31.54.2.314 xxx This corresponds to the year 2014. There will be 5.7 million pounds of drugs seized in 2014.
77. a. The slope of –.01723 indicates that on average, the 5000-meter run is being run .01723 seconds faster every year. It is negative because the times are generally decreasing as time progresses.
b. .01723(2012)47.6112.94 y
The model predicts that the time for the 5000-m run will be about 12.94 minutes in the 2012 Olympics.
78. a. Using data points (1980, 106.9) and (2010, 153.9), the slope is:
153.9106.9 1.57 20101980 m
Each year there is an average increase of about 1.57 million civilians.
Section 2.3 Linear Models
1. a. Let (,11 ) xy be (32, 0) and (,22 ) xy be (68, 20). Find the slope. 200205 6832369 m
Use the point-slope form with (32, 0). 55 0(32)(32) 99 yxyx
b. Let x = 50. 55(5032)(18)10C 99 y
Let x = 75. 55(7532)(43)23.89C 99 y
2. 55 3232 99 yxCF
a. F = 58°F 55(5832)(26)14.4 99 CC
b. C = 50°C
b.
153.91.572010
153.91.5720152010
153.97.85161.75
There will be about 161.75 million civilians in the labor force in 2015.
5 1032 9 905160 70514
F F
FF
55(86732)(835)463.89 99 CC
5 3295160 9 416040
Copyright © 2015 Pearson Education, Inc.
5. Let 11 , 6,201.6 xy and 22 , 11,224.9. xy Find the slope.
224.9201.6 4.66 116
201.64.66(6)
201.64.6627.96
4.66173.64.
To estimate the CPI in 2008, let x = 8.
4.668173.64210.92 y
To estimate the CPI in 2015, let x = 15.
4.6615173.64243.54 y
6. Let 11 , 1,127.1 xy and
8. Let 11 , 0,14.1 xy and 22 , 8,17.2. xy
Find the slope. 17.214.1 0.3875 80 m
The y-intercept is 14.1, so the equation is 0.387514.1.yx
To estimate the number of employees working in the health care and social assistance industries in 2014, let x = 2014 – 2000 = 14.
0.38751414.119.525 y
The number of employees will be about 19.525 million in 2014.
22 , 11,140.8. xy Find the slope.
140.8127.113.7 1.37 11110
127.11.37(1)
127.11.371.37
1.37125.73.
To estimate the number of filed returns in 2005, let x = 2005 – 2000 = 5. 1.375125.73132.58 y
There were about 132.58 million examined returns in 2005.
To estimate the examined returns in 2012, let x = 2012 – 2000 = 12 1.3712125.73142.17 y
There were about 142.17 million examined returns in 2012
7. Let 11 , 0,6.0 xy and 22 , 8,6.5. xy
Find the slope. 6.56.0 0.0625 80 m
The y-intercept is 6.0, so the equation is 0.06256.0.yx
To estimate the number of employees working in the finance and insurance industries in 2010, let x = 2010 – 2000 = 10.
0.0625106.06.625 y
The number of employees was estimated to be 6.625 million in 2010.
11 22 21 21
xy
,(50,320) 440320120 4 805030 yy m xx
Each mile per hour increase in the speed of the bat will make the ball travel 4 more feet.
806,400
minhrday yxx
Data Point (x, y) Model Point ˆ , xy Residu al ˆ yy Squared Residual 2 ˆ yy (7, 5036) (7,5013.8) 22.2 492.84 (8, 4847) (8, 4870.2) –23.2 538.24 (9, 4714) (9, 4726.6) –12.6 158.76 (10,4589)(10, 4583) 6 36 (11,4447)(11,4439.4) 7.6 57.76
Copyright © 2015 Pearson Education, Inc.
Sum of the residuals for model 1 = 0
Sum of the residuals for model 2 = 42
b. Sum of the squares of the residuals for model 1 = 1283.6
Sum of the squares of the residuals for model 2 = 8712
c. Model 1 is the better fit.
b. Sum of the squares of the residuals for model 1= 40.55.
Sum of the squares of the residuals for model 2= 241.6.
c. Model 1 is the better fit.
13. Plot the points. [5, 12] by [150, 220]
Visually, a straight line looks to be a good model for the data.
The coefficient of correlation is r ≈ .956, which indicates that the regression line is a good fit for the data.
14. Plot the points.
[0, 15] by [400, 2000]
Visually, a straight line looks to be a poor model for the data because it shows a great deal of curvature.
The coefficient of correlation is r ≈ –.906, which indicates that the regression line is a good fit for the data, but the plot shows otherwise.
Copyright © 2015 Pearson Education, Inc.
15. a. Using a graphing calculator, the regressionline model is 5.90146.59.yx
b. The year 2015 corresponds to x = 15. Using the regression-line model generated by a graphing calculator, we have 5.9015146.59235.09, y or about $235 billion in sales.
16. a. Using a graphing calculator, we find that the linear model is 7.72407.94yx
b. The year 2015 corresponds to x = 35. Using the regression-line model generated by a graphing calculator, we have 7.7235407.94137.74, y or about 137 deaths per 100,000 people from heart disease.
17. a. Using a graphing calculator, the regressionline model is y = –3.96x + 73.98.
b. The year 2016 corresponds to x = 16. Using the regression-line model generated by a graphing calculator, we have 3.961673.9810.62, y or about $10.62 billion in revenue.
18. a. Using a graphing calculator, the regressionline model is
y = 14.9x + 2822.
b. Using the regression-line model:
Let x = 150 feet squared.
y = 14.9(150) + 2822 = 5057
Let x = 280 feet squared.
y = 14.9(280) + 2822 = 6994
Let x = 420 feet squared.
y = 14.9(420) + 2822 = 9080
The predicted values are very close to the actual data values.
c. Using the regression-line model:
Let x = 235 feet squared.
y = 14.9(235) + 2822 = 6323.5
Adam should choose the closest value above the requirement. therefore, Adam should choose the 6500 BTU air conditioner.
19. a. Using a graphing calculator, the regression line model for estimated operating revenue (in billions of dollars) from internet publishing and broadcasting is given by 2.372.02.
b. Let x = 12 (2012).
2.37122.0226.42 billion
Let x = 14 (2014).
2.37142.0231.16 billion y
The operating revenue was about $26.42 billion in 2012 and will be about $31.16 billion in 2014.
20. a. Using a graphing calculator, the regression-line model is 0.6268.28.
b. 0.62(9)68.2862.7. y There were about 62.7 million subscribers in 2009.
c. Let y = 55. 550.6268.28
13.280.62
x x x
There will be 55 million subscribers in the year 2021.
d. Using a graphing calculator, the coefficient of correlation is about –.915.
yx
b. 2.318(6)55.8841.972. y There were about 41,972 traffic fatalities in 2006.
c. Let y = 28. 282.31855.88
27.882.318
12.03
There were 28,000 traffic fatalities in the year 2012.
22. a. Using a graphing calculator, the regression-line model for men is .21552.6.
yx
b. Using a graphing calculator, the regression-line model for women is .14465.4.
Copyright © 2015 Pearson Education, Inc.
xx xx x
c. .21552.6.14465.4 .07112.8 180.3
According to the models, the life expectancy of men will be the same as women in the year 2080.
Section 2.4 Linear Inequalities
1. Use brackets if you want to include the endpoint, and parentheses if you want to exclude it.

2. (c). –7 > –10
3. –8k ≤ 32
Multiply both sides of the inequality by 1 8 Since this is a negative number, change the direction of the inequality symbol.


11
88(8)(32)4 kk
The solution is [–4, ∞).
4. –4a ≤ 36
Multiply both sides by 1 4 Change the direction of the inequality symbol.

11
44(4)(36)9 aa
The solution is [– 9, ∞).
5. 20 b
Multiply both sides by 1 2
11
20(2)(0)0 22 bbb
The solution is (–∞, 0). To graph this solution, put a parenthesis at 0 and draw an arrow extending to the left.


6. 6 – 6z < 0 Add 6z to both sides. 6660666 zzzz
Multiply both sides by 1 6
11 (6)(6)1 or 1 66 zzz
The solution is (1, ∞).
7. 3414 x Subtract 4 from both sides. 344144310
Multiply each side by 1 3
The solution is 10 , 3
8. 2y – 7 < 9 Add 7 to both sides. 27797216 yy
Multiply both sides by 1 2
For exercises 9–26, we give the solutions without additional explanation.
9. 53 5535 8 (1)()(1)(8)
The
Copyright © 2015 Pearson Education, Inc.