SPECIAL TOPIC

SPECIAL TOPIC
EAGE NEWS Get ready for Aberdeen
INDUSTRY NEWS Renewables dominate rise in global energy capacity
TECHNICAL ARTICLE Modelling to understand 4D seismic response

1,900+ Abstract Submissions 200+ Exhibitors


1,300+ Technical Presentations

12+ Strategic and Plenary Sessions
82 Topics Covered 4 Exhibition Theatres
Click here to check it out
FIRST BREAK ® An EAGE Publication www.firstbreak.org
ISSN 1365-2397 (online)
CHAIR EDITORIAL BOARD
Clément Kostov (cvkostov@icloud.com)
EDITOR
Damian Arnold (arnolddamian@googlemail.com)
MEMBERS, EDITORIAL BOARD
• Philippe Caprioli, SLB (caprioli0@slb.com) Satinder Chopra, SamiGeo (satinder.chopra@samigeo.com) Anthony Day, NORSAR (anthony.day@norsar.no)
• Kara English, University College Dublin (kara.english@ucd.ie)
• Hamidreza Hamdi, University of Calgary (hhamdi@ucalgary.ca)
• Fabio Marco Miotti, Baker Hughes (fabiomarco.miotti@bakerhughes.com)
• Roderick Perez Altamar, OMV (roderick.perezaltamar@omv.com)
• Susanne Rentsch-Smith, Shearwater (srentsch@shearwatergeo.com)
• Martin Riviere, Retired Geophysicist (martinriviere@btinternet.com) Angelika-Maria Wulff, Consultant (gp.awulff@gmail.com)
• Dong Zhang, Fugro (dongzhang1991@gmail.com)
EAGE EDITOR EMERITUS Andrew McBarnet (andrew@andrewmcbarnet.com)
PUBLICATIONS MANAGER
Hang Pham (publications@eage.org)
MEDIA PRODUCTION
Saskia Nota (firstbreakproduction@eage.org) Ivana Geurts (firstbreakproduction@eage.org)
ADVERTISING INQUIRIES corporaterelations@eage.org
EAGE EUROPE OFFICE
Kosterijland 48
3981 AJ Bunnik
The Netherlands
• +31 88 995 5055 eage@eage.org
• www.eage.org
EAGE MIDDLE EAST OFFICE
EAGE Middle East FZ-LLC
Dubai Knowledge Village PO Box 501711 Dubai, United Arab Emirates
• +971 4 369 3897
• middle_east@eage.org
• www.eage.org
EAGE ASIA PACIFIC OFFICE
EAGE Asia Pacific Sdn. Bhd. UOA Centre Office Suite 19-15-3A No. 19, Jalan Pinang 50450 Kuala Lumpur
Malaysia
• +60 3 272 201 40
• asiapacific@eage.org www.eage.org
EAGE LATIN AMERICA OFFICE
EAGE Americas SAS Av Cra 19 #114-65 - Office 205 Bogotá, Colombia
• +57 310 8610709 americas@eage.org
• www.eage.org
EAGE MEMBERS’ CHANGE OF ADDRESS
Update via your MyEAGE account, or contact the EAGE Membership Dept at membership@eage.org
COPYRIGHT & PHOTOCOPYING © 2026 EAGE
All rights reserved. First Break or any part thereof may not be reproduced, stored in a retrieval system, or transcribed in any form or by any means, electronically or mechanically, including photocopying and recording, without the prior written permission of the publisher.
PAPER
The publisher’s policy is to use acid-free permanent paper (TCF), to the draft standard ISO/DIS/9706, made from sustainable forests using chlorine-free pulp (Nordic-Swan standard).
29 Seismic modelling as a key to understanding 4D seismic response in the Azeri-Chirag-Gunashli field
Kamran Abbasov and Gabrielle Jones
Special Topic: Global Exploration
41 Derisking exploration through an integrated interpretation workflow from legacy seismic to reliable AVO: Lessons from West African basins
Felicia Winter, Thomas Hansen, Robert Ruiz and Jon Rogers
51 Exploration – are we about to see a shift?
Bob Fryklund, Clare Barker-White and Keith King
55 The NOROG digital cuttings project. Calibrating wireline log interpretation and redefining formation tops
Carl Fredrik Gyllenhammar and Fredrik Gyllenhammar Jr
63 There is no deepwater hotspot. As a matter of fact it’s all hot.
Neil Hodgson, Karyna Rodriguez and Lauren Found
67 Cretaceous play potential along the Equatorial Margin of West Africa and Brazil
Callie Bradley
75 New global exploration opportunity hotspots capable of filling the energy transition gap
Mike Lakin
81 Application of mud gas analysis in derisking the petroleum systems of the Demerara Plateau
Stephen Wood, Genevieve Hirschfeld, Miguel Sabiran and Dheeraj Biharie
86 Calendar
cover: An oil platform offshore Rio de Janeiro. This month offshore Brazil features prominently in our Special Topic papers on global exlploration hotspots.


Environment, Minerals & Infrastructure Circle
Andreas Aspmo Pfaffhuber Chair
Florina Tuluca Vice-Chair
Esther Bloem Immediate Past Chair
Micki Allen Liaison EEGS
Martin Brook Liaison Asia Pacific
Ruth Chigbo Liaison Young Professionals Community
Deyan Draganov Technical Programme Representative
Madeline Lee Liaison Women in Geoscience and Engineering Community
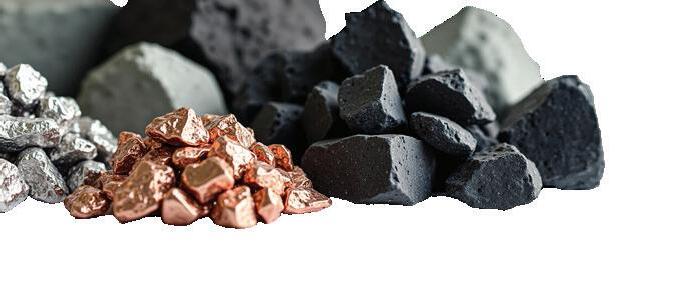
Gaud Pouliquen Liaison Industry and Critical Minerals Community
Eduardo Rodrigues Liaison First Break
Mark Vardy Editor-in-Chief Near Surface Geophysics
Oil & Gas Geoscience Circle
Johannes Wendebourg Chair
Timothy Tylor-Jones Vice-Chair
Yohaney Gomez Galarza Immediate Past Chair
Alireza Malehmir Editor-in-Chief Geophysical Prospecting
Adeline Parent Member
Jonathan Redfern Editor-in-Chief Petroleum Geoscience
Robert Tugume Member
Anke Wendt Member
Martin Widmaier Technical Programme Officer
Sustainable Energy Circle
Giovanni Sosio Chair
Benjamin Bellwald Vice-Chair
Carla Martín-Clavé Immediate Past Chair
Emer Caslin Liaison Technical Communities
Sebastian Geiger Editor-in-Chief Geoenergy
Maximilian Haas Publications Assistant
Dan Hemingway Technical Programme Representative
Carrie Holloway Liaison Young Professionals Community
Adeline Parent Liaison Education Committee
Longying Xiao Liaison Women in Geoscience and Engineering Community
Martin Widmaier Technical Programme Officer
SUBSCRIPTIONS
First Break is published monthly online. It is free to EAGE members. The membership fee of EAGE is € 90.00 a year including First Break, EarthDoc (EAGE’s geoscience database), Learning Geoscience (EAGE’s Education platform) and online access to a scientific journal.
Companies can subscribe to First Break via an institutional subscription. Every subscription includes online access to the full First Break archive for the requested number of online users.
Orders for current subscriptions and back issues should be sent to First Break B.V., Journal Subscriptions, Kosterijland 48, 3981 AJ Bunnik, The Netherlands. Tel: +31 (0)88 9955055, E-mail: corporaterelations@eage.org, www.firstbreak.org.
First Break is published by First Break B.V., The Netherlands. However, responsibility for the opinions given and the statements made rests with the authors.


The 87th EAGE Annual Conference & Exhibition is set to make its highly anticipated debut in Aberdeen, Scotland on 8–11 June at the city’s state-of-the-art P&J Live venue.
In our Association’s 75th Anniversary year, this will be the first time that the Annual has visited the ‘Granite City’, now transitioning from a storied legacy in oil and gas towards a future as Europe’s Net Zero Capital. Supported by energy major bp as the official host and main sponsor, the 2026 edition centres on the theme of ‘Maximising recovery: Unlocking value through technology and partnerships’.
Here is a look at what to expect.
EAGE Annual 2026 will begin with a high-level Opening Session featuring leading voices from across the energy industry, alongside the recognition of excellence in geoscience and engineering through our prestigious awards.
On Monday 8 June, the Opening Ceremony will include a Leadership Interview with Ariel Flores, SVP Subsurface, bp. This will be followed by the opening debate on ‘Meeting energy demand in a fractured world’. At a time when geopolitical uncertainty continues to reshape the global energy agenda, the session will examine how major energy suppliers are approaching investment decisions to meet

future demand in an unpredictable market, while keeping the implications for the energy transition firmly in view.
At the core of EAGE Annual 2026 is its rich and diverse Technical Programme, built on high-calibre submissions from around the world and shaped by leading experts across the field. The programme reflects the breadth of today’s geoscience and engineering landscape, offering delegates the opportunity to engage with the latest research, case studies and technical developments.
The EAGE Exhibition is always a major feature of the event, with more than 200 exhibitors participating, from established industry leaders to emerging innovators. It will be a place to discover the latest
tools, technologies and research driving progress across the industry.
New this year is the Engineering Theatre providing delegates the opportunity to check out discussions on key topics, with dedicated sessions on Digital Transformation and Energy Transition likely to generate most interest.
Before and after the main conference, delegates can experience a wide range of hands-on learning opportunities, including Workshops, Field Trips, Short Courses, and the popular Hackathon, running on Sunday, Monday, and Friday.
These activities are designed for those who want to build expertise, explore new topics and learn directly from specialists in their field. Whether you are looking to strengthen your technical knowledge or gain practical insight into emerging areas, these sessions offer an excellent opportunity to develop skills, exchange ideas and connect with peers.
We offer plenty of opportunities for the community to come together outside the
formal programme. The event is an important meeting point for established professionals and students, creating space for discussion, networking and inspiration.
The Community Hub will host meetups, conversations and activities aimed at supporting learning, career development and stronger connections across the EAGE network.
Social Programme
Networking is always one of the most valued parts of the EAGE Annual, and in 2026 the Social Programme promises to be particularly memorable with Aberdeen as the backdrop.
From the Icebreaker Reception to the Conference Evening at Crathes Castle, Aberdeenshire, delegates will have plenty of opportunities to connect in relaxed and memorable settings. Sur-
rounded by the landscapes and heritage of northeast Scotland, this year’s programme offers more than just networking, it offers a chance to experience one of the UK’s most distinctive destinations.
Registered guests, including partners and family members, can also take part in the Social Programme and join a special tour through Royal Deeside. Travelling
along the lush Dee Valley, the tour will arrive in Ballater, the charming village often described as the place where the Royals do their shopping. There will be time to stroll, explore or enjoy coffee and a treat ahead of visiting the world-famous Balmoral Castle. It is a unique opportunity to experience the scenery, character and history that make this part of Scotland so special.
Don’t miss the opportunity to be part of Europe’s largest multi-disciplinary geoscience event. Visit eageannual.org for full details and registration. Delegates can register for the full week, on a day basis, or choose between Conference only and Exhibition only access. To get the most from the event, consider the All Access package, which includes workshops, field trips, short courses, the hackathon, as well as access to the Conference, Exhibition, Icebreaker Reception, and Conference Evening. Register before 15 May 2026 to take advantage of discounted fees.
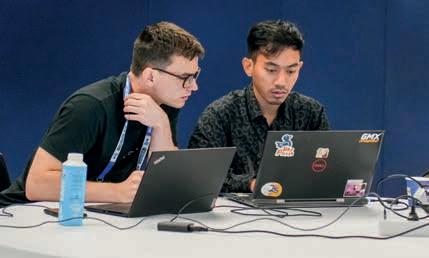
The Artificial Intelligence Technical Community is once again bringing an intriguing hands-on programme to the Annual in Aberdeen.
For those curious about how artificial intelligence and energy systems interact, the upcoming hackathon The Energy–AI Nexus: Build, Optimise, and Automate a Grid for AI offers the perfect opportunity to explore this intersection in a dynamic and collaborative setting.
On 7 and 8 June, teams will find themselves in a continuous simulation where they must build and manage a thriving virtual city. Their task is far from simple. Participants must identify strategic renewable and non-renewable energy assets while balancing a limited budget and maintaining real-time grid stability, all without relying on battery storage.
Hackathon convenor Roderick Perez (OMV) explains that this simulation was designed ‘to promote the efficient and conscious use of energy while highlighting the immense complexity of providing a sustained and reliable global energy supply. The hackathon provides a hands-
on simulation to demonstrate how difficult achieving a balanced energy mix truly is.’
As the competition evolves, participants will move beyond manual gameplay to developing custom Python-based machine learning solutions and training autonomous AI agents capable of taking over operations, optimising the infrastructure, and managing the city’s long-term energy transition. ‘Participants will gain hands-on experience coding and training modern AI agents while, at the same time, developing a deeper understanding of the role different energy sources play in the global energy mix,’ Perez says.
It is seen as an opportunity to interact with and receive mentorship from industry leaders representing some of the sector’s
leading companies, creating valuable moments for exchange and networking. Winning teams will receive great prizes, as well as the chance to present their solutions to a broader audience during the conference week.
In addition, at the workshop ‘AI Agents,’ scheduled on Sunday 7 June, the AI Community will unite experts to share insights, assess risks and develop best practices for responsible, scalable adoption of agentic AI across domains. Agentic AI systems (autonomous, goal-driven agents integrating perception, reasoning, memory, and action) are reshaping AI deployment. They enable automation, adaptive decision-making, and continuous problem-solving but raise governance, security and alignment challenges.
Sign up for these activities at eageannual.org and spread the word!
Connect with the EAGE Technical Community on AI
COMPLETELY REPLACING TRADITIONAL WORKFLOWS


DUG Elastic MP-FWI Imaging enables simultaneous inversion of reflectivity (3-component, directional, horizontal), P-wave velocity, S-wave velocity, density, P-impedance, S-impedance, and Vp/Vs ratio, providing quantitativeinterpretation-ready outputs of the highest resolution and amplitude fidelity — using field-data input. In this example we can readily identify the reservoir location — a beautiful flat spot!
No more jumping through hoops — DUG Elastic MP-FWI Imaging gives you everything you need with one powerful leap. info@dug.com | dug.com/fwi


The Student Programme for our Annual in Aberdeen this coming June goes beyond traditional learning. It is intended to be an occasion when students can showcase their ideas, challenge themselves, and engage directly with industry professionals.
By integrating the student technical programme into the broader EAGE Annual technical sessions, students are provided with a unique platform to present their work to a global professional audience, bridging the gap between academia and industry in a truly meaningful way.
The week begins with one of the most anticipated highlights: the Laurie Dake Challenge Final Round on Sunday 7 June. The competition celebrates inter-disciplinary collaboration, bringing together university teams from around the world to present innovative field development plans. In front of an expert jury, students have to distinguish their project from their competitors’, demonstrating the power of teamwork, creativity and technical excellence to win the top prize.
On Monday morning (8 June), students will step outside the conference halls and into the field with a unique field trip to Dunnottar Castle. Combining science and creativity, this experience
invites participants to interpret geological formations through watercolour sketching. Guided by expert instructor Phoebe Sleath, students will explore the interbedded mudstones and sandstones of the Dunnottar Castle Conglomerate, discovering geology through both observation and artistic expression.
Tuesday is Global GeoQuiz day. This is the fast-paced and competitive event that matches students from across the world against each other in a test of knowledge across multiple geoscience disciplines.
Midweek, the EAGE Student Chapters Meeting offers a valuable opportunity for representatives from chapters worldwide to connect, exchange ideas and share best practices. The session fosters a sense of global community, strengthening the network that defines EAGE’s student engagement.
Beyond these key events, the programme is enriched by a wide range of career-focused activities designed to support students’ professional and personal development. At the Career Advice Centre, participants will have the opportunity to engage in trial interviews, have a professional portrait photo taken, and

join the Networking Café to connect with industry representatives in an informal setting. Activities such as the Education Hunt & Exhibition Tour, Brain Match, and the Mentoring Meet-Up provide further opportunities to explore career paths, build confidence and expand professional networks.
This programme is made possible thanks to the generous support of our sponsors: bp, Serica Energy, Viridien, Equinor, the EAGE Student Fund, and LabStrat, all of whose commitment to developing the next generation of geoscientists and engineers continues to create meaningful opportunities for students worldwide.
You will find more information about the full programme and how to participate at eageannual.org/student-programme.
For the first time EAGE is to host Geoscience Outreach Day on 11 June 2026 during the Annual in Aberdeen. The initiative is designed to promote geoscience and engineering and its professionals to over 250 secondary school students from across Aberdeen and the wider Northeast region.
Throughout the day, students will immerse themselves in a series of interactive activities to spark their interest. From handson workshops and STEM activities to a fun and competitive GeoQuiz with prizes, students will have the opportunity to engage directly with geoscience in an accessible and exciting way. The day will also include a guided tour of the exhibiting companies
for students to let them have a firsthand experience with the work that companies and businesses do in the energy industry.
More than just an educational event, the Outreach Day aims to bridge the gap between classroom learning and real-world application. Students will have the chance to discover how geosciences have shaped Aberdeen’s rich oil and gas heritage and how the same knowledge and skills are now driving the transition toward renewable energy and sustainable solutions. By interacting with energy professionals and university professors, they will gain firsthand insight into the diverse and global career opportunities within the sector.

Securing the world’s energy starts beneath the ocean floor. We’re there, as a full end-to-end seismic partner, exploring, analysing and delivering the insights that help energy companies plan for a stable future.
There’s more to explore.
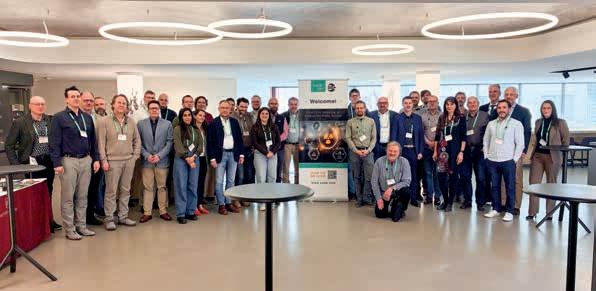
At the sixth EAGE Digitalization Conference and Exhibition, the strong technical and businessfocused atmosphere proved to be one of the factors that distinguishes this flagship event. Many delegates remarked that this year’s conference was the best edition yet, with energy driven by valuable industry conversations.


A major driver of engagement was the rapid growth of artificial intelligence, particularly the increasing focus on AI agents and software development. These topics carry significant importance for companies, and delegates were eager to better understand the rapid growth, including the opportunities they present and the risks they introduce. As a result, participants were engaged, openly exchanging ideas and discussing shared challenges and solutions.
Another highlight of the event was its lineup of distinguished speakers. Paula Doyle, chief digital officer at Aker BP, was especially well received, with her presentation becoming a frequent topic of discussion throughout the week. She spoke about the rise of agentic AI, offering insights into future projections and what these developments could mean for the oil and gas industry. Drawing on real-world examples from Aker BP projects, she illustrated how the company is actively navigating these changes.
Additional key topics included governance in software development, high-performance computing, OSDU, and data management. All were widely discussed among delegates.
Another highlight was the short course presented by Thomas Bartholomew Grant,


domain expert at Cegal. His session was particularly well received, further contributing to the strong technical focus of the event.
Another standout feature of the event was the introduction of EarthDoc AI, an artificial intelligence assistant built on the EarthDoc database, designed to help geoscientists work more efficiently and effectively. EAGE Digital 2026 delegates were among the first to experience the application firsthand, and it was met with very positive feedback.
The conference concluded on a memorable note with an evening dinner hosted at the Norsk Oljemuseum. Set with the backdrop of Norway’s rich energy history, the dinner offered delegates an opportunity to explore the history of petroleum in the country while enjoying local Norwegian cuisine. It was a fitting close to an event focused on the future, while remaining grounded in the legacy that continues to shape it.
Overall, attendees were very pleased with the programme, noting how current and relevant it was in light of the rapid transformation taking place across the oil, gas and energy sectors. Many found the content highly practical and valuable to take back and implement within their own organisations.


‘Great to see where the industry is heading and the latest digitalization initiatives. A focused conference bringing together professionals with diverse perspectives, united by shared needs, passion, and a common vision. Well-organised event with thoughtfully curated sessions and strong execution.’
Theresia M Citraningtyas, Earth Science Analytics
‘The event highlighted how agentic AI is rising in the subsurface domain. This transformative wave invites geoscientists to revisit every aspect of their work: processes, software, organisations.’
Antoine Bouziat, IFPEN
‘Agentic AI dominated the conversation, with the community figuring out what it means for their organisations. OSDU is moving from talk to execution. Well organised, great networking, and a real sense the industry is ready to move.’
Lukas Mosser, Aker BP
Short courses, workshops and field trips are all part of the mix that make the 7th EAGE Global Energy Transition Conference & Exhibition (GET) on 2-6 November so special.
The side programme reflects the breadth of today’s energy transition landscape. Topics range across offshore wind, hydrogen, CCS, geothermal, nuclear waste storage, and critical raw materials, showing how geoscience and engineering continue to play a central role in delivering lower-carbon energy solutions.
The short courses will provide focused learning opportunities, from offshore wind development for geoscientists and the commercial potential of natural hydrogen to digital twins for CCS and the energy transition. Other sessions will look at geothermal resource assessment, radioactive waste management and the role of critical raw materials in future energy systems.
Alongside these courses, the workshop programme will create space for more detailed technical exchange and cross-disciplinary discussion. Participants will be able to explore topics
such as decoupling energy from carbon, the use of surface logging in emerging energy systems, risk and uncertainty in geothermal projects, and new approaches to low-carbon reservoirs and CO2 storage. Workshops will also address topics such as satellite InSAR for monitoring and risk mitigation, as well as uncertainty in offshore ground models, highlighting
the practical and research challenges involved in scaling up energy transition technologies.
There is also a field trip focused on large-scale testing of offshore structures at the TTH, giving attendees a valuable opportunity to connect conference discussions with real-world applications.
Learn more at eageget.org.
To mark an outstanding programme at NSG 2025 in Naples, it is a pleasure to announce the winners of the best presentations and best papers, reflecting the interests of the Association’s Environment, Minerals, and Infrastructure Circle (formerly NSG Circle).
Congratulations to Best Environment presentation – Christian Armstrong and Daphnie Galvez (Aventa): Caught in the drift: laying a submarine cable in a moving sand bank; Best Minerals presentation –Michael Westage (University of the Witwatersrand): Pre-stack migration imaging of mineral-hosting supracrustals in the
Kaapvaal Craton, with complementary teleseismic and travel-time analysis; Best Infrastructure presentation – Lilas Vivin (Sercel): Continuous geophysical monitoring in a railway setting: a four-year case study; Best student presentation – Sepideh Harajchi (TU Delft): Impact of reinforced concrete sleeper on ground penetrating radar signal behavior in railway ballast monitoring; and Best paper – Michael Noel (Kraken Robotics): 3D acoustic imaging in defining offshore UXO risk
The combined reviewer and attendee feedback process is a valuable tool for
highlighting excellence within the Near Surface programme and the selection of the awarded presentations. Looking ahead to NSG 2026 in Thessaloniki, we encourage everyone to take part in the evaluation process and help select the next ‘Best of NSG’.
Winners receive a number of opportunities such as, presenting at SAGEEP as part of the ‘Best of NSG’, the possibility to be considered for the EAGE Distinguished Lecturer Programme, a featured article in First Break, and recognition across EAGE’s website and social media channels.
In March 2026, the EAGE Online GeoQuiz brought together student chapters from around the world for our annual virtual competition. The event was organised regionally, with students participating from the Americas, Asia, Africa, Europe, and the Middle East. Each chapter competed in real time, answering challenging geoscience questions designed to test knowledge and teamwork skills.
And the worthy winning regional chapters are: Universidade Federal Fluminense (Rio de Janeiro, Brazil), representing the Americas; Delft University of Technology (Netherlands), repre-
senting Europe; and University of Lagos (Nigeria), representing Africa. The winning teams receive three complimentary registrations to attend the Annual in Aberdeen.
Thanks to the generous support of Serica Energy, 20 students will go to Aberdeen to participate in the Global GeoQuiz, where they will compete with other students from various countries. The Online GeoQuiz continues to be a key activity in EAGE’s commitment to supporting student chapters, encouraging learning in a fun and interactive format, and providing real-world opportunities to connect with the global geoscience community.
Through several initiatives, EAGE continues to consolidate its presence across the Americas by strengthening its position in strategic markets and key growth sectors in oil & gas geoscience, sustainable energy, and environment, minerals & infrastructure. Following active participation in key industry events and the signing of new associated societies agreements, EAGE has expanded its cooperation network across Colombia, Mexico, Peru, Bolivia, Argentina, Paraguay, Brazil, and Canada, while also strengthening relationships with European embassies, trade offices, chambers of commerce, and professional societies.
EAGE was present at the 2nd ACGGP Energy Exploration Convention in Cartagena, Colombia and the AAPG Rockies & Andes Workshop in Lima, Peru. There, we engaged in interesting conversations with representatives of public and private institutions to address the relevance of knowledge sharing and networking in advancing exploration strategies in frontier and complex basins.
At the 12th Geothermal Congress for Latin America and the Caribbean (GEOLAC 2026) in Mexico City, where EAGE was represented, discussion around energy transition opened the doors for the signa-
ture of a collaboration agreement with the Mexican Geothermal Association (AGM).
Juan Ignacio Martínez, AGM president, explained that this new partnership aims ‘to strengthen international collaboration and provide greater value to our members. We believe it is important to connect the Mexican geothermal community with global expertise and innovation opportunities that are present in EAGE’s work’.
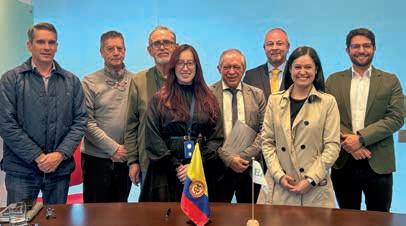
The energy transition conversation continued in Bogotá at the 2nd Colombian Offshore Wind Networking event, co-hosted with the Colombian Offshore Wind Association (EEMa). The event further strengthened offshore wind as a growing sector in Colombia, Brazil, Mexico, Chile, Uruguay, Costa Rica, and Canada. During this visit, and in the presence of CEO Marcel van Loon, EAGE formalised its partnership with EEMa at the Embassy of the Kingdom of The Netherlands in Bogotá.
Margarita Nieves-Zarate, EMMa president, said: ‘We see great value in connecting the geoscience expertise represented by EAGE with offshore wind initiatives in Latin America. This partnership can facilitate workshops, technical discussions and
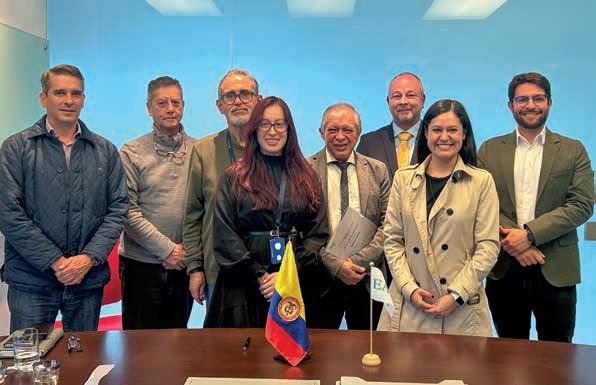
collaborative events, ultimately contributing to capacity building and supporting the development of sustainable offshore energy projects in the region’.
Also in Bogotá, and coinciding with the visit of CFO Remco Bax, EAGE signed an agreement with the Colombian Association of Hydrogeologists (ACH), strengthening collaboration in groundwater, water security and environmental management. Omar Vargas, ACH president, noted that ‘for Colombia, this partnership is essential because we need people in different industries, as well as in the public and private sectors, to acquire knowledge and spread the importance of water as a resource for our existence’.
Every month we highlight some of the key upcoming conferences, workshops, etc. in the EAGE’s calendar of events. We cover separately our four flagship events – the EAGE Annual, Digitalization, Near Surface Geoscience (NSG), and Global Energy Transition (GET).

EAGE Workshop on Advances in Carbonate Reservoirs: From Prospects to Development 12-14 October 2026 – Kuwait City, Kuwait
The workshop will bring together industry experts, researchers and practitioners to discuss the latest developments in carbonate reservoir characterisation, exploration and field development. Through technical presentations and interactive discussions, participants will explore innovative approaches, share practical experiences and address key challenges across the full lifecycle of carbonate reservoirs. The event offers a valuable platform for networking, knowledge exchange and collaboration among professionals working in this critical domain. Register now to secure your place and engage with leading experts shaping the future of carbonate reservoir development.
Early Bird Deadline: 8 September 2026

1-2 December 2026 – Daejeon, South Korea
For the very first time, this workshop is bringing together geoscientists, engineers and researchers from across the globe for two days of focused technical exchange in Daejeon, South Korea, proudly hosted by KIGAM (Korea Institute of Geoscience and Mineral Resources). As AI and ML continue to redefine how we explore and understand the subsurface, the workshop serves as the platform where cutting-edge research meets real-world application. Topics span ML for seismic interpretation and inversion, big data analytics, ML-enhanced resolution techniques, LLMs for subsurface workflow automation, velocity model building, and more.
Abstract Submission Deadline: 10 July 2026


Second EAGE Workshop on Techniques for Monitoring CO2 Storage 1-2 December 2026 – Calgary, Canada
Following our inaugural session, the EAGE community recognises a need to transition from theoretical CO2 monitoring toward practical, site-specific applications. Feedback underscores that meeting regulatory goals requires integrated, multi-physics workflows that prioritise realistic failure-mode modelling and cross-disciplinary validation. This second edition shifts focus toward implementable, robust strategies that bridge the gap between geophysical innovation and commercial reality through collaborative problem-solving. By integrating reservoir engineering, well integrity and economic perspectives, the workshop aims to advance monitoring strategies tailored to the needs of commercial carbon storage projects worldwide.
Abstract Submission Deadline: 15 July 2026

Second EAGE/AAPG Carbonates and Mixed Carbonate Systems Symposium 19-21 January 2027 – Riyadh, Saudi Arabia
This symposium builds on over 70 years of geoscience knowledge in carbonate and mixed carbonate systems, bringing together experts and emerging talent from both academia and industry. Participants will explore recent advancements in technology, applications and geoscientific research, fostering collaboration and knowledge transfer. The event offers a unique platform to showcase your work, engage with leading professionals, and contribute to the continuity and future development of the field. Don’t miss the opportunity to share your insights and shape the next generation of carbonate geoscientists.
Abstract Submission Deadline: 10 September 2026
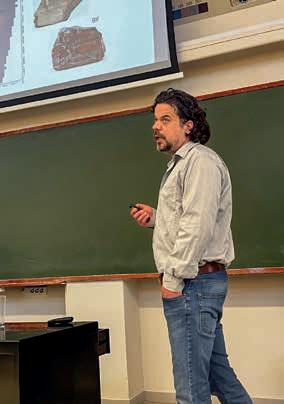
Dirk Orlowski (DMT) and Carlo Dietl (BASE), members of the EAGE Technical Community on Radioactive Waste Disposal, reflect on the recent EAGE/DGG workshop hosted in Münster.
The Workshop on Radioactive Waste Storage was held by EAGE together with the German Geophysical Society (DGG) following the DGG Annual in Münster on 6 March. The workshop was organised by Dirk Orlowsky (DMT), Andreas Schuck (GGL), Frank Meier (BGE) and Stefan Buske (TUBAF), supported by EAGE’s newly established Technical Community on Radioactive Waste Disposal and DGG’s Repository Geophysics group. Seventeen speakers from seven countries informed the workshop audience of roughly 50 participants about the status of site selection process in various European countries, geophysical exploration tools for nuclear waste repositories and the role of numerical and practical modelling in the search process.
A key theme was the challenge of developing reliable geological models to ensure the long-term safety of repositories, with particular emphasis on preventing
radionuclide migration over timescales of up to one million years. Participants shared case studies, national strategies, and research developments, with some discussions pointing to the need to reassess current exploration approaches in certain regions.
The Münster event will be followed by a Workshop on Radioactive Waste Management to be held during the EAGE Annual in Aberdeen on 8 June. The organisers Christian Strand (Shearwater UK), Ján Klištinec (SURAO), Christian Derer (BGE) and Carlo Dietl (BASE) are proud to present a very interesting group of speakers and panellists from the industry as well as from European regulators, implementers, municipalities and geological surveys. The goal of the Aberdeen Radioactive Waste Management workshop is starting up networking of regulators, implementers and contractors in the search process for nuclear waste
disposal sites worldwide. The workshop results will be summarised in the Energy Transition Theatre on 11 June at 14:00 in the community session ‘Stakeholders in Radioactive Waste Management’. For details about the workshop, please have a look at eageannual.org/workshop-14.
Join the community
Our Technical Communities are taking the webinar approach to allow the EAGE members and the community at large to learn about key issues in geoscience and engineering directly from leading experts. The webinar programme is free and open to anyone interested, reinforcing EAGE’s commitment to knowledge sharing.
The upcoming programme reflects the breadth of topics covered across the communities, so save the date and participate. In the Energy Transition and CCS section, look forward to Enhanced oil recovery in the energy transition: A review of Brazilian technical evolution – Patricia Gusmão, 14 May, 16:00 CEST.
In Subsurface & Rock Physics, look out for The combined effects of confining pressure, temperature, and mineralogical composition on the elastic constants of rock – Hem Motra, 6 May, 15:00 CEST; and Hydraulic fracture stimulation in tight rocks – Ding Zhu, Garrett Fowle and Liu Hai, 20 May, 16:00 CEST.
In Emerging Technologies & Systems, we have Applications of machine learning in soil carbon management – Prof Sina Rezaei Gomari, 26 May, 16:00 CEST.
For Basin Analysis & Regional Studies, there is Terrestrial heat flow on the Arabian Plate: Insights from new thermal
data and modelling – Harald R. Karg, 4 June, 15:00 CEST.
In addition to these online events, the Technical Communities will play an active role during the EAGE Annual Conference and Exhibition in Aberdeen, offering a variety of sessions and networking opportunities. To explore all the Technical Communities and their activities, visit eage.org/eage_news/communities.
Stay engaged with EAGE by updating your affiliations
EAGE is presenting its first Masterclass on Land Seismic 2026 in Pau, France on 22-26 June. We asked Claudio Strobbia, one of the five instructors, what it was all about.
What are the main changes in recent years?
The main challenge in the field today is adapting to rapid technological advancements, which have transformed seismic acquisition through fully autonomous nodal systems and high-productivity shooting. Modern processing allows flexibility in survey geometries, which now enables operations in areas with complex access or stringent permitting constraints, with variable and highly irregular, but optimal, schemes. However, the industry must contend with the shift to single source and single sensor strategies. This presents new difficulties in managing coherent and incoherent noise, especially in urban and peri-urban environments, for example, across Europe where subsurface exploration is vital for the energy transition.
What does the masterclass offer?
The masterclass has been structured to encompass every step of the seismic workflow, offering a multi-faceted perspective on land-based seismic programmes. This ambitious approach demands the deployment of considerable resources, including mobilising real seismic vibrators, nodal
harvesting systems and GPS positioning devices. Training ranges from theoretical survey design, through to rigorous testing and auditing of field equipment, to quality control of operations and performance.
How is this a comprehensive training?
The masterclass is comprehensive because it covers the full lifecycle of land seismic acquisition, from conceptual planning to final imaging, and connects all the technical, operational, and environmental aspects that modern land surveys involve so participants understand not just what to do, but why. It is designed to give participants a complete, end-to-end understanding of land seismic: the concepts, the tools, the
now

technologies, and the practical decisions needed to design and execute successful surveys. Participants will learn how to navigate today’s more demanding land-acquisition environment (tighter permitting, limited access, and rising noise) so they can plan surveys that are both more realistic and more effective.
The invitation is open to participate in the Masterclass on Land Seismic 2026 in France. This programme is ideal for professionals seeking to deepen knowledge of modern acquisition technologies, survey design, and land imaging, young geophysicists, engineers, and field supervisors entering operational or technical roles and project managers, QC specialists, and contractor/client representatives involved in planning or oversight of seismic projects.
Find more information here
7 JUN • INTRODUCTION TO MODERN MARINE SEISMIC SURVEYS: SCOPE, DESIGN AND IMPLEMENTATION – BY XANDER CAMPMAN
• LANGUAGE MODELS FOR GEOSCIENCE APPLICATIONS – BY THOMAS B. GRANT
8 JUN • CLASTIC SEQUENCE STRATIGRAPHY: CONCEPTS, METHODS AND WORKFLOWS –BY RENE JONK
• DATA VISUALIZATION PRINCIPLES FOR SCIENTISTS – BY STEVE HORNE
12 JUN • AI ACROSS RESERVOIR MODELLING WORKFLOW: A HANDS-ON INTRODUCTION –BY VASILY DEMYANOV & FARAH RABIE
• SEISMIC DATA PROCESSING FOR OFFSHORE WIND FARM DEVELOPMENT – BY SHAJI MATHEW
22-26 JUN EAGE
LAND
DURING EAGE ANNUAL 2026 ABERDEEN, UK
DURING EAGE ANNUAL 2026 ABERDEEN, UK
DURING EAGE ANNUAL 2026 ABERDEEN, UK

The annual EAGE Board elections are taking place, with voting online running between 16 April and 16 May 2026.
The Board is responsible for developing appropriate policies to achieve the objectives of EAGE in the interests of its members. We therefore invite all members to participate in the upcoming ballot, as this is an important opportunity for you to have a say in how the Association is run on your behalf.
This year you will vote for candidates in the positions of Vice President, Secretary-Treasurer, Education Officer,
Technical Programme Officer, Vice-Chair Environment, Minerals & Infrastructure Circle, and Membership and Cooperation Officer, to be filled from June 2026. On eage.org/ about_eage/ballot you will find short biographies and motivational words from all the candidates to help with your voting decisions.
A personalised invitation has been sent directly to your email with instructions on how to vote. We are looking forward to having your vote in this year’s ballot.
EAGE Stavanger Local Chapter was recently updated on Norway’s emerging power deficit and the potential role of nuclear power, particularly small modular reactors (SMRs) by guest speaker.
Susanne Møgster Sperrevik.
Norway is often seen as a renewable energy success story, with hydropower providing the vast majority of electricity and resulting in low carbon emissions. However, demand is increasing rapidly. Electrification of transport, decarbonisation of offshore petroleum operations, expansion of hydrogen and synthetic fuel production, and growth in data centres are all driving higher consumption. Population growth and digitalisation add further pressure.
To meet climate targets by 2050, Norway must both replace fossil fuels and supply additional electricity to new sectors. Estimates suggest the country may need an extra 100-150 TWh of electricity in the long term. While energy efficiency, hydropower upgrades and solar power can help, they are unlikely to fully close this gap.
Wind power – both onshore and offshore – has been proposed as a major contributor to new capacity. However, large-scale wind projects have faced increasing local opposition due to their impact on landscapes and ecosystems.

Expanding transmission infrastructure has also proven controversial. These challenges illustrate the difficulty of developing new large-scale energy projects in Norway, where environmental concerns and local acceptance are central.
Against this backdrop, nuclear energy is re-emerging as a potential complement to renewable sources. Globally, the energy transition faces the dual challenge of reducing fossil fuel use while meeting growing demand. Nuclear energy currently provides about 11% of global electricity, with over 400 reactors in operation. Unlike weather-dependent renewables, nuclear power delivers stable, continuous generation. Nuclear
plants produce electricity without direct CO2 emissions and are widely recognised as a low-carbon technology with a relatively small lifecycle environmental footprint. In Norway, nuclear energy is increasingly viewed not as a replacement for renewables, but as a stable baseload complement.
Much of the current interest focuses on SMRs, which are smaller and more flexible than traditional nuclear plants. A typical SMR produces around 300 MW, equivalent to roughly 2.5 TWh annually. Their modular design may reduce construction time and project risk, with estimated build times of three to five years once approved. SMRs can be deployed incrementally, allowing capacity to grow with demand. They also have a relative-
ly small land footprint: a multi-reactor facility producing several terawatt-hours annually may occupy less than 0.5 km².
A notable development in Norway’s nuclear debate is the level of local interest. More than 90 municipalities have expressed support for exploring nuclear energy. Many are part of Norske kjernekraftkommuner, an organisation that facilitates cooperation and information sharing.
Several municipalities and industrial partners have established project companies to assess SMR feasibility. Around ten potential sites have already been submitted to authorities for initial environmental and regulatory review. For local communities, potential benefits include jobs, stable electricity supply and opportunities for industrial growth.
Although Norway has never operated commercial nuclear plants, it does have a legal framework for regulating nuclear activities. Multiple ministries and agencies would oversee licensing, construction, and operation.
Recent developments include public consultations and proposed impact assessment programmes for SMR projects. Government decisions on further evaluation may begin in the near future. However, the future of nuclear energy in Norway remains closely tied to political priorities and regulatory clarity.
Norway has relevant technical expertise despite lacking commercial nuclear

research reactors between 1951 and 2019 and maintains nuclear education programmes.
In addition, the oil and gas sector has built strong capabilities in large-scale industrial projects. Many components used in nuclear plants – such as pumps, valves, and heat exchangers - are similar to those already used in existing industries. This suggests that Norway’s supply chain could contribute to future nuclear development.
Safety and radioactive waste remain central concerns in public debate. Modern reactors incorporate passive safety systems designed to shut down automatically under abnormal conditions. Lifecycle assessments indicate that nuclear energy has among the lowest environmental impacts of major energy sources.
Radioactive waste volumes are relatively small, and long-term storage solutions exist. Facilities such as Finland’s Onkalo repository demonstrate how spent fuel can be safely stored deep underground in stable geological formations. Nevertheless, public trust remains

A survey conducted before the presentation showed moderate familiarity with nuclear energy among geoscience professionals, with an average knowledge rating of 4.5 out of 10. When asked about supporting an SMR in their municipality, 43% were positive, while the rest were either neutral or sceptical. This reflects a broader mix of curiosity and caution in the Norwegian debate. Norway’s energy transition presents a complex challenge. Hydropower will remain central, and renewables will continue to expand. However, the scale of future demand may require additional sources of stable, low-carbon power.
SMRs represent one possible solution. Whether they become part of Norway’s energy mix will depend on regulatory decisions, economic viability, technological progress, and public acceptance. What is clear is that nuclear energy has re-entered the national conversation, shifting the question from whether it should be considered to how it might fit into Norway’s future energy strategy.

Mineral exploration was the latest thematic event hosted by Local Chapter Greece. The hybrid session Mining exploration stories – the role of applied geosciences and geophysics was held in March at the Meteoroskopeio (Observatory), Aristotle University of Thessaloniki, attended by 53 participants and followed remotely by a further 30.
Supported by PACE funding, the event featured a three-and-a-half-hour programme comprising four invited talks and a closing panel discussion. The speaker lineup included contributions from academia, mining companies and service providers, creating a multi-disciplinary and experience-driven forum.
The talks presented a combination of case-based insights and enabling technologies in mineral exploration.
Case studies from Greece and Finland illustrated the practical challenges of

exploration across different geological settings, highlighting how data integration is central to reducing uncertainty in target definition.
Particular emphasis was placed on how modern data-driven approaches and digital platforms support the tran-
sition from raw data to actionable exploration insights, demonstrating the increasing role of technology in enhancing prospectivity mapping and decision-making.
During the panel discussion, the conversation focused on the role of artificial intelligence in mining exploration, addressing both its potential and its limitations. Participants discussed how AI can accelerate data interpretation and pattern recognition, while also noting the risks associated with reliance on data-driven models without sufficient geological understanding and ground truthing. This all highlighted that the effective use of AI depends on data quality, domain expertise and careful integration within established exploration workflows.
The EAGE Student Fund supports student activities that help students bridge the gap between university and professional environments. This is only possible with the support from the EAGE community. If you want to support the next generation of geoscientists and engineers, go to donate.eagestudentfund.org or simply scan the QR code. Many thanks for your donation in advance!

Laura Mozga ’s life has taken some surprising turns. She left Latvia for university in Aberdeen and stayed on, establishing herself as an engineer working offshore for Halliburton. Then, she took time out for an MSc in renewable engineering and ended up in Paris working on offshore wind projects and also serving for the last three years as chair of the EAGE Paris Local Chapter.
I was born in Riga, the vibrant capital of Latvia, located near the shores of the Baltic Sea. At the time, the country was adjusting to its of renewed independence; growing up during this era in a middle-class family, I felt a responsibility to build a better future for both my country and my family. As a child, I spent much of my time in the countryside, where my curiosity about the natural world first took foot. From early years of school, this transitioned into a strong academic interest in science subjects, especially mathematics, geography and biology. During my final schoolyears, I got to volunteer with a community in Taizé, France, my first real exposure to different cultures and nationalities.
Inspired by that time in France and encouraged by my cousin, I applied for an undergraduate scholarship in Scotland. Within the first minutes of landing in Aberdeen, I realised that the ‘English’ I spent 15 years mastering is about as useful here as a solar-powered torch in a coal mine. Little by little, I managed to pick up different Scottish accents and completed a bachelor’s degree in chemistry with mathematics at the University of Aberdeen.
I was selected for a summer internship at Aalto University’s Electrochemistry Department in Espoo, Finland. My work involved characterising electrocatalysts
and membranes for PEMFCs (polymer electrolyte fuel cells) intended for hydrogen-powered vehicles. I envisioned seeing hydrogen cars reach the mass market – a goal that has now become a reality. I also had a placement as an analytical scientist at a Dalkia bioenergy plant in 2013. Among other things, they were developing innovative solutions to turn whisky production waste, such as ‘pot ale’ (liquid residue) and ‘draff’ (spent grains), into renewable energy!
In 2014, I joined Halliburton as a laboratory technician in the cementing department and was soon combining that role with offshore operations support. While being the only woman on the offshore cementing team in the North Sea had its challenges, I felt consistently supported by management and found it to be a rewarding experience. I learnt that technical competence is the ultimate equaliser when navigating high-pressure situations, such as equipment failures or tight time constraints. Later, as a project operations engineer, I was involved in delivering a challenging project in the central North Sea where we completed three appraisal wells within a demanding 2.5-month deadline, something I am proud of.
Every career has its pivot point. For me, it was the Covid-19 pandemic. Drilling projects were put on hold or cancelled,
so it gave me a rare opportunity to think about my future. In 2020, I went back to my Aberdeen alma mater to obtain an MSc in renewable energy engineering. My studies introduced me to the worlds of marine, wind, solar, and geothermal energy, as well as energy integration to the grid.
Family considerations took me to the city of Paris, where I joined an offshore wind project, a really novel experience for me compared with oil and gas. Recently, I joined the tendering team as an estimation engineer.
As chair of EAGE’s Local Chapter Paris, I am very proud of winning Best LC Award in 2024. We have managed to triple the size of our LC by focusing on generating a collaborative environment among our geoscientists and engineers.
In my free time, I strike a balance between adrenaline-fueled adventures and the vibrant arts and culture that are so accessible in Paris. My adventures range from Alpine skiing and diving with basking sharks to skydiving and go-karting. I also enjoy exploring untouched wilderness. Most recently, I was trekking through Madagascar’s Marojejy National Park to observe the habitat of the silky sifaka.
BY ANDREW M c BARNET

In March an extraordinary episode in the energy business slipped by largely unnoticed. This is hardly surprising. The world was focused on the ongoing US/Israeli war on Iran, started in February; on its implications for the global energy landscape; and for most of us, helpless to affect the outcome, on a selfish concern over the likely cost of gas and the cost of living generally. Yet, the recent deal made between the US government and TotalEnergies speaks not just to the weird, well-documented personal hangups of President Trump and the pro-fossil fuel direction of the country’s energy strategy, but to some current disenchantment with wind power investment extending beyond the US.
In a surprise move on 23 March, TotalEnergies announced the signing of settlement agreements with the US Department of the Interior (DOI) to relinquish its Carolina Long Bay and New York Bight offshore wind leases awarded in 2022. In doing so, the company ended its nascent involvement in wind power in the US.
In what must be a unique arrangement, in return for giving up its leases, TotalEnergies will be reimbursed for its investment of nearly $1 billion, with the funds being redirected to help finance the next decade Rio Grande LNG plant in South Texas. The company explained that its studies had shown that offshore wind developments in the US, unlike those in Europe, are costly and might have a negative impact on power affordability for US consumers. Since other technologies are available to meet the growing demand for electricity in the US in a more affordable way, TotalEnergies considered there was no need to allocate capital to this technology.
of capital in the US.’ The company threw in to its announcement, news of a recent letter of intent with Glenfarne, lead developer of an Alaskan LNG export project, doubtless favourably viewed in the White House as part of the American ‘energy dominance’ strategy.
Some cynics have wondered about the technicalities of the ‘deal,’ i.e., where exactly in the US Administration will the money come from? Most surprising, perhaps, is the abruptness of TotalEnergies’ withdrawal from the wind power market so soon after making the investment. Of the oil majors, it is the most aggressive in pursuing the renewable path.
‘No need to allocate capital to this technology’
In Europe particularly, where the regulatory framework is favourable, TotalEnergies has a substantial wind portfolio. It operates the Seagreen wind farm offshore Scotland, one of the world’s largest, and is piloting floating wind technology near the North Sea Culzean platform. In Germany, it is partnering with RWE to develop two high-capacity offshore wind farms scheduled for 2031/2032. Also with RWE, it is working on the offshore OranjeWind project in the Netherlands, integrating wind power with green hydrogen production. In France, TotalEnergies is making its biggest investment in the country in 30 years, spending an estimated €4.5 billion on the 1.5 GW Centre Manche 2 project, offshore Normandy, due for completion in 2033. In addition, it is invested in pioneering the use of barge-float technology in the Mediterranean Eolmed project, led by the French renewable energy developer Qair.
CEO Patrick Pouyanné said, ‘We will reinvest the refunded lease fees to finance the construction of the 29 Mt Rio Grande LNG plant and the development of our oil and gas activities … allows us to support the development of US gas production and export. These investments will contribute to supplying Europe with much-needed LNG from the US and provide gas for US data centre development. We believe this is a more efficient use
More globally, as part of its multi-energy strategy, TotalEnergies in 2023 signed an investment agreement with the government of Kazakhstan for the giant Mirny onshore wind project in response to the dual challenge of reducing carbon emissions and electrifying isolated rural areas. The idea is to harness the winds that sweep across the region’s semi-arid expanses and transform them into low-carbon electricity to supply a reliable and sustainable power supply for one million people. In the Far
East the company is engaged in further offshore wind projects in Yunlin (Taiwan) and Bada (South Korea).
TotalEnergies’ sudden re-evaluation of the economics of wind power offshore the US East Coast requires some further context. For a start, the two leases were acquired during the Biden Administration. But on day one in 2025, the incoming Trump Administration ordered a withdrawal of all federal waters from future offshore wind leasing; a blanket pause on all federal approvals for both onshore and offshore wind projects; and a review of all active leases. Simultaneously, the first orders to boost traditional oil and gas exploration and production were announced.
Then in December last year the Department of the Interior paused the leases for all large-scale offshore wind projects under construction due to national security risks identified by the Department of War.
This pause, allegedly to enable leaseholders and state partners to assess the possibility of mitigating the national security risks would impact the estimated $25 billion in investment in five wind farms: Vineyard Wind 1 off Massachusetts, Revolution Wind off Rhode Island, Sunrise Wind and Empire Wind off New York, and Coastal Virginia Offshore Wind off Virginia. Together, those projects had been expected to create 10,000 jobs and power more than 2.5 million homes and businesses. The official statement said unclassified reports from the US government had long found that the movement of massive turbine blades and the highly reflective towers create radar interference called ‘clutter’. An MIT Technology Review report does confirm that ‘There are real challenges that wind farms introduce for radar systems, which are used in everything from air traffic control to weather forecasting to national defense operations. A wind turbine’s spinning can create complex signatures on radar, resulting in so-called clutter.’ This of course begs the question of why this issue was not raised earlier.
mainly down to China, which agrees with the 6% decline predicted by Wood Mackenzie. Both estimates were offered before the turmoil in the energy market created by the Middle East War.
The wind energy market now looks bifurcated. In the short term, the spike in gas price for electricity generation benefits wind operators with uncontracted capacity, which can be sold at significantly higher margins. More fundamentally, all renewable energy options have received a boost from the planning perspective. The current crisis has provided another example of the dangers of exposure to geopolitical shocks when a country is dependent on oil, gas or LNG from specific suppliers, be they Russia, the US, or the Middle East nations. EU countries are working on a solution with its ‘sovereign energy’ strategy, in the case of wind power targeting 425 GW of wind capacity by 2030. In early 2026, wind and solar combined for the first time to produce more electricity than fossil fuels in the EU. Germany, with 77.7 GW at the end of 2025, has the largest installed capacity, while Denmark now generates 50% of its daily power needs from wind.
‘No prizes for the real winner’
Not everything is blowing in the right direction. The very factors that give existing wind power a cost advantage will rebound and impact future investment confidence. A year or so ago, the World Economic Forum, among others, was already warning that accelerating adoption of wind energy, especially offshore, was being endangered by soaring costs, project supply chain problems, and increasing raw material and labour costs. In the wind power sector globally, other obstacles often cited are slow or tortuous permitting procedures, the need to replace existing ageing turbine units, and the difficulty encountered with integration into electricity grids lacking the capacity to absorb the challenge of intermittent supply.
At the time of writing, the operators of the five offshore wind projects have successfully sued the US government through the Federal Courts and had the stop orders rescinded, but major political uncertainty persists. All this is very ironic because the US is easily the second largest generator of wind power in the world, with a cumulative capacity of 161 GW, according to various sources, admittedly dwarfed by China’s 692 GW. Something like 10-11% of US electricity is generated from wind, virtually all from onshore sites.
It is not difficult to see why TotalEnergies took the exit door on offer. Yet its decision chimes with at least a marginal dip in enthusiasm for wind power worldwide. 2025 was actually record-breaking; 169 GW of wind power was added, a 38% increase over the previous year. According to a BloomberNEF analysis, this was largely driven by China, which alone installed 130 GW. But the analyst suggests a slowing in growth in 2026,
Wind power is also competing with solar energy for investment dollars, a competition that solar will continue to lead. Solar power is outperforming wind globally by nearly every growth metric, primarily because it is easier to build, cheaper to manufacture, and more versatile for different users. That is the verdict of the International Energy Agency and other sources. In terms of capacity additions in 2025, the world added nearly 4 GW of solar for every 1 GW of wind. Solar installations reached nearly 600 GW in 2024 (a 33% increase), while wind additions, though record-breaking, were significantly lower in volume. Solar is ‘winning’ because it is highly modular and can be installed on a single residential roof or a massive desert tract. Huge Chinese-manufactured solar panel over-capacity has pushed component prices to historic lows, making solar the cheapest form of electricity in most of the world. Wind scores on higher capacity factor, 20-50%, compared with 15-20% for solar, and of course can operate at night.
But no prizes for guessing the real winner in all this: oil and gas companies, thanks to windfall unearned profits.
Views expressed in Crosstalk are solely those of the author, who can be contacted at andrew@andrewmcbarnet.com.


Through the Volunteering Recognition Programme, EAGE aims to honor the commitment of volunteers who support the Association across all activities, regions and disciplines. Serving in a wide range of roles and capacities these individuals play a vital part in advancing EAGE’s mission and strengthening its service to members, today and tomorrow.


Committee members I Journal editors I Session chairs


TIERS WITH INCREASING 3 BENEFITS


Workshop convenors I Community leaders I Judges
Faculty advisors I Mentors I Speakers at student or


community meetings I DLP Lecturers I E-lecturers


Technical programme reviewers


20+ VOLUNTEERING ROLES


UNLOCK OPPORTUNITIES FOR GROWTH


STUDENTS CAN APPLY FOR THEIR FIRST YEAR OF MEMBERSHIP FOR FREE (RE)ACTIVATE YOUR MEMBERSHIP TODAY!


In 2025 total renewable power capacity reached 5149 gigawatts (GW) after the addition of 692 GW, or a 15.5% of annual increase, according to a report by the International Renewable Energy Agency (IRENA). The report Renewable Capacity Statistics 2026 also finds renewable energy dominates the total capacity expansion with an 85.6% share.
IRENA director-general, Francesco La Camera said, ‘In the midst of an uncertain time, renewable energy remains consistent and steadfast in its expansion. This not only indicates market preference but also makes a strong case for renewable energy resilience with brutal clarity. A more decentralised energy system, with a growing share of renewables and more market players, is structurally more resilient.’
In line with the previous year, solar energy led the increase, accounting for 511 GW or approximately 75% share in the total renewables capacity addition. Wind energy followed suit, adding 159 GW. Together, solar and wind accounted for 96.8% of all net renewable additions last year, reflecting the biggest cost decrease among all renewable technologies. Bioenergy took the third place with 2.3% annual growth, adding 3.4 GW to total renewable energy expansion.
The report also confirms, however, the persistent and significant disparities among countries and regions. Asia con-

tinued to lead with a 74.2% contribution to all new renewable capacity; the 513.3 GW additions represent a growth rate of 21.6%. Africa recorded its highest capacity increase, rising by 15.9% or adding 11.3GW, driven by Ethiopia, South Africa, and Egypt. Another region that experienced its largest annual growth is the Middle East, which increased by 28.9%, led by Saudi Arabia.
In terms of total global capacity, Asia keeps its top position with 2891GW of total renewables capacity, followed by Europe which recorded 934GW in total. Central America and the Caribbean had the lowest renewables capacity with a total of 21GW in 2025.
Solar photovoltaics accounted for 510.3 GW out of 511.2 GW of total solar power additions in 2025.
Some 18.4 GW of renewable hydropower (excluding pumped hydro) was
added in 2025, with 96% of the increase coming from China. Ethiopia, India, Tanzania, Bhutan, Viet Nam, Canada, Austria, Indonesia and Nepal, respectively added more than 0.5GW.
Wind energy capacity grew by 14% from 2024, with record additions of 158.7GW in 2025. China accounted for nearly three-quarters of the expansion, adding 119.4GW, while India added 6.3GW.
Bioenergy capacity increased by 3.4GW, led by Japan, which more than doubled its bioenergy capacity expansion from 2024, adding 1.1GW in 2025. China followed with capacity additions of 0.8GW and Brazil with 0.6GW additions.
Geothermal energy capacity grew at a similar rate to the previous year at 1.7%, adding 0.3GW in 2025. The Philippines and Indonesia each contributed 0.1GW of the additions, followed by Germany, Türkiye and Japan.
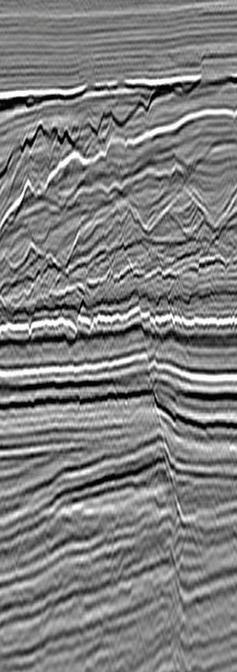
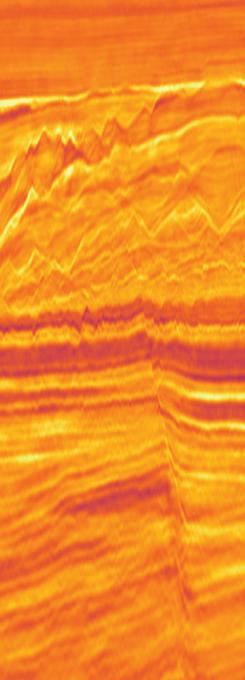
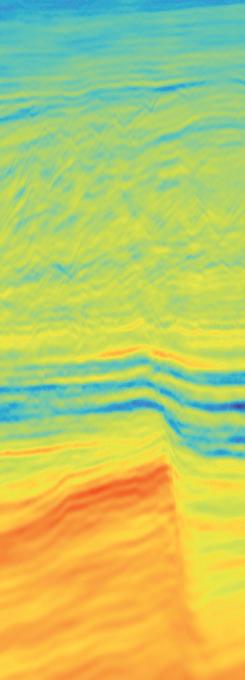
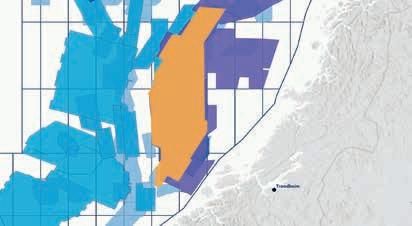
TGS has completed its three-year GSX (GeoStreamer X) acquisition and processing campaign in the Norwegian Sea, culminating in the delivery of the final Dual Azimuth products to clients.
TGS now offers more than 21,500 km2 of GSX multi-client seismic data, which provides a modern, high-resolution foundation for development, ILX and TLX exploration activities across one of Norway’s most prospective offshore regions.
The GSX program delivers a high-density dual azimuth solution that complements existing GeoStreamer coverage, said TGS. Designed to resolve long-standing imaging challenges on the Halten Terrace, the dataset enables clear-
er interpretation of complex structures and identification of remaining prospectivity, the company added.
The Halten Terrace features high-quality hydrocarbon reservoirs within a structurally intricate setting shaped by Late Jurassic rifting, said TGS. Resulting horsts, tilted fault blocks and Cretaceous basin floor fans represent diverse play types that benefit from enhanced illumination and broadband fidelity, the company added.
To achieve this uplift, the GSX campaign applied multi-sensor broadband technology, dual azimuth illumination, wide tow sources, dense streamer spacing and long streamers for robust velocity model-building. The result is a dataset that significantly improves fault definition, structural imaging and reservoir characterisation, said TGS.
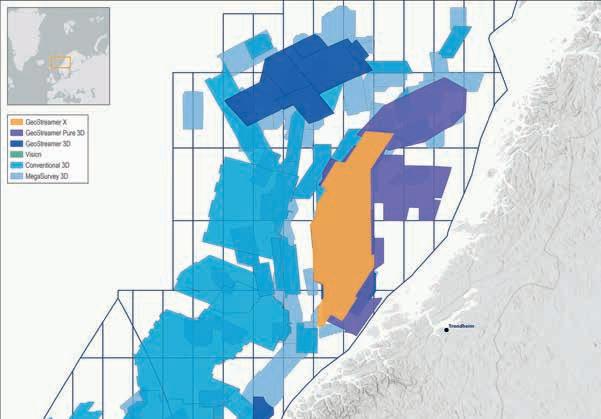
Courtesy of TGS
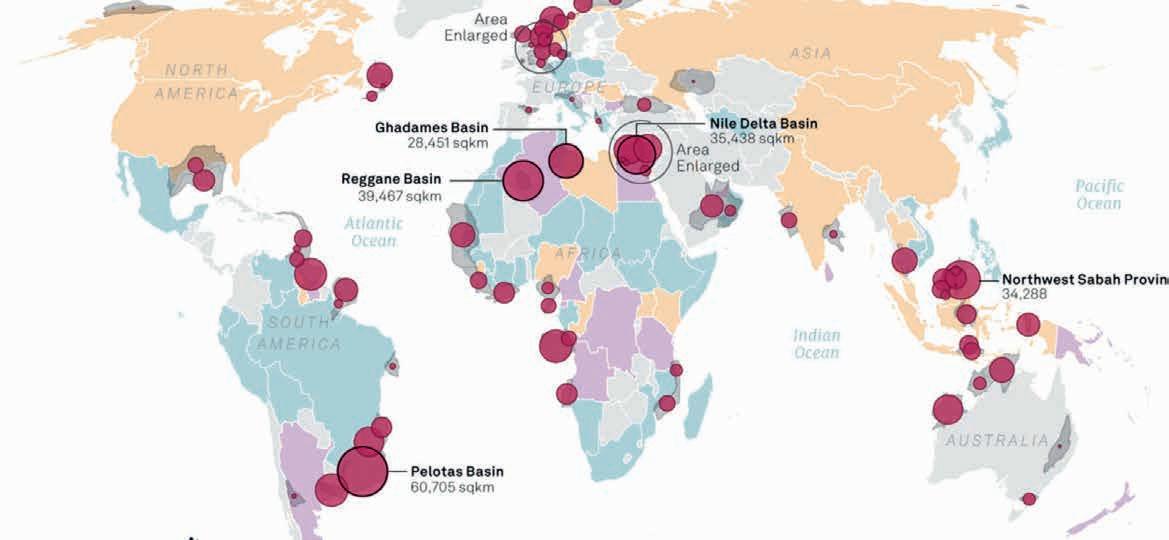
Searcher Seismic and Shearwater GeoServices haVE completed Phase 3 of its multi-client 3D seismic acquisition in the Pelotas Basin, offshore Brazil.
The latest phase acquired an additional 7500 km2 of 3D seismic data, bringing the total coverage in the basin to more than 17,000 km2. This milestone delivers explorers an extensive,
continuous dataset in one of the world’s most promising frontier basins. The Pelotas Basin shares a conjugate margin with the prolific Orange Basin of Africa, said Searcher.
Final data from Phase 1 is now available, with fast-track data for Phase 2 also released. Fast-track data for Phase 3 is expected by the end of Q2 2026, ahead of upcoming licensing rounds.
Viridien has launched a remote automated mine asset monitoring tool.
The Global Tailings Monitoring Service (GTMS) is designed to enable more comprehensive and consistent monitoring of tailings storage facilities (TSFs) at mines.
‘GTMS will deliver actionable intelligence to mine operators and engineers responsible for the safety of multiple or single assets, helping them to detect early warning precursor signals to prevent failures that can have significant economic, environmental, social and reputational consequences,’ said Viridien.
‘Developed with ESA Space Solutions, GTMS offers a more cost-effective TSF monitoring solution than more bespoke approaches,’ said Viridien. ‘With the option of being fully scalable across a portfolio of sites, it integrates a wide-ranging suite of Earth Observation and environmental data sets on a single online platform to address numerous potential failure mechanisms. This increases efficiency, streamlining data collation, comparison and analysis to aid early identification of precursors to failure’.
Results are generated across entire portfolios using Viridien’s high-perfor-
mance computing capacity. Results are delivered with every new satellite data acquisition, which is ‘a much higher frequency compared to approaches that provide updates monthly, quarterly or annually,’ said Viridien.
Peter Whiting, head of geoscience, Viridien, said the company deveoped the tool in consultation with mining companies: ‘The safety of mine site TSFs is a high priority for the mining industry. Through consultation with several multinational mining companies, GTMS will be a step-change service designed to minimise potential failure risks and advance ESG performance.’
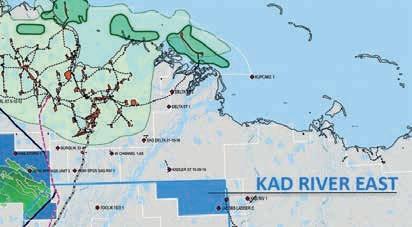
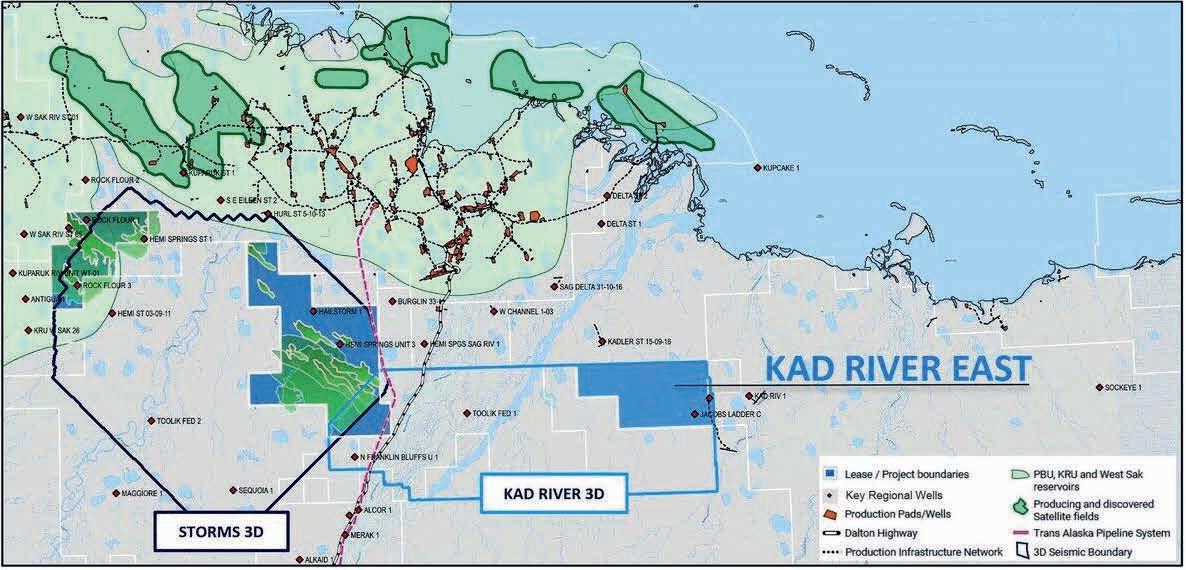
88 Energy has acquired access to the Kad River 3D seismic dataset, recently released by the Alaska Department of Natural Resources.
The Kad River 3D survey covers the newly secured Kad River East leases, comprising 17,920 acres east of the Trans Alaska Pipeline System (TAPS).
Interpretation of the 3D dataset will support the maturation of prospects within the Kad River East leases and enable the calculation of an internal maiden Prospective Resource estimate, expected to be released later in the year.
Recently completed regional mapping by 88 Energy highlights the development of turbidite fairways analogous to the productive Sockeye fields to the east.
Initial analysis of existing 2D seismic and historical well data identified an active, multi-reservoir petroleum system across the Kad River East acreage. These include Jacobs Ladder C and Lake Fed 79-1 across Ivishak, Seabee and Canning intervals; and the Kadler St 15-09-11 and Toolik Fed 1 with oil shows recorded in Mikkelsen, Lower Sag, USB, Kuparuk equivalent and Ivishak / Lisburne reservoirs.
The newly acquired Kad River 3D dataset will refine structural and stratigraphic models, identify primary prospects and assess future resource potential.
The nearby Sockeye-2 well provides a compelling analogue supporting the
resource potential of the broader Kad River East area. Sockeye-2 was drilled to approximately 10,500 ft, encountering a high-quality Palaeocene-aged clastic reservoir with an average porosity of 20%.
This result demonstrates the productivity of distal turbidite systems and provides strong evidence for a laterally extensive, high-quality reservoir framework across this region of the North Slope, said 88 Energy.
Regionally, Palaeocene reservoirs, characterised by ‘favourable porosity’, permeability and fluid mobility, are present along the eastern North Slope.
‘Advanced interpretation techniques, including AI-based tools, have enabled the company to perform more insightful
interpretation work enabling the precise targeting of potential prospects. Subtle stratigraphic traps and complex depositional systems require high-resolution imaging to delineate them effectively,’ said 88 Energy.
88 Energy has access to six 3D seismic surveys across its North Slope portfolio that will enable the team to integrate regional trends, legacy discoveries and newly acquired acreage. ‘Access to 3D data represents a significant step change in the company’s exploration strategy and re-risks future drilling,’ said 88 Energy. Importantly, these datasets have been acquired at substantially reduced cost through the State of Alaska’s seismic incentive programmes.’
TotalEnergies has signed a deal with the US Department of Interior to invest approximately $1 billion – the value of its renounced offshore wind leases – in oil and natural gas and LNG production in the US After the new investment, the US will reimburse the company for the amount they paid in lease purchases for offshore wind.
‘ These investments will contribute to supplying Europe with much-needed LNG from the US and provide gas for US data centre development.,’ said Patrick Pouyanné, TotalEnergies CEO.
TotalEnergies will invest $928 million in the development of Train 1 to 4 of Rio Grande LNG plant in Texas; and upstream conventional oil in Gulf of America and of shale gas production.
The US will terminate Lease No. OCS-A 0535 in the Carolina Long Bay area. This lease was fully executed by TotalEnergies on 1 June 2022, after payment of $133 million. It will also terminate Lease No. OCS-A 0538 in the New York Bight area. The lease was fully executed by Attentive Energy, LLC on 1 May 2022, after payment of $795 million. For more analysis go to the Crosstalk column on page 18-19.
The US Bureau of Land Management has leased 136 parcels totaling 131,121 acres in Colorado, Nevada, and Utah for $64.8 million in its latest quarterly oil and gas lease sales. The sales include 68 parcels in Colorado, totalling 42,532 acres, generating $8.1 million in revenue. In Nevada 11 parcels have been sold, totalling 19,957 acres, generating $294,405 in revenue. In Utah, 57 parcels have been sold, totalling 68,632 acres, generating $56.4 million in revenue.
NEO NEXT and TotalEnergies’ UK Upstream oil and gas business have merged to form NEO NEXT+ with TotalEnergies holding a 47.5% shareholding. NEO NEXT+ claimed it would become the largest independent oil and gas producer on the UK Continental Shelf with an expected 2026 production of more than 250,000 barrels of oil equivalent per day.
bp has appointed Carol Howle as deputy chief executive officer, effective immediately. Howle will continue to lead supply, trading and shipping (ST&S) and in her new role will also oversee the company’s ongoing portfolio review and strategy development. To support these changes, bp’s strategy and sustainability team will now report to her.
Geo-software provider Ikon Science has acquired roundLAB Inc., an independent wellbore positioning and survey management specialist. The acquisition strengthens Ikon Science’s Wellbore Solutions offering by adding proven survey correction services and algorithms designed to improve wellbore position certainty, reduce collision risk, and increase confidence in target delivery during drilling operations.
The US has unveiled plans to merge the Bureau of Ocean Energy Management and the Bureau of Safety and Environmental Enforcement to establish the Marine Minerals Administration to improve coordination and increase efficiencies across offshore leasing, permitting, inspections and environmental oversight.
TGS has signed a multi-year agreement with Amazon Web Services (AWS) for cloud services, leveraging AWS’ high-performance computing (HPC) and Generative AI to build solutions.
‘This collaboration is designed to accelerate time-to-insight and reduce exploration uncertainty for TGS’ customers,’ said TGS.
TGS is accelerating its AI/ML-driven seismic imaging and analytics by building solutions on AWS to surpass current industry performance. It will modernise TGS Imaging AnyWare on AWS and leverage cloud elasticity to further optimise processing workflows. TGS uses Amazon Elastic Compute Cloud (EC2) to execute highly parallelised workloads, scaling quickly to millions of CPUs to achieve rapid turnaround times. By leveraging the latest NVIDIA instances and selectively adopting specialised AWS hardware accelerators will enable high-definition seismic imaging, including compute-intensive Elastic Full Waveform Inversion (eFWI), and deliver petabyte-scale multi-client data to customers on demand, said TGS. These solutions are built on a multi-region architecture, leveraging the AWS Nitro System to isolate and protect sensitive customer workloads.
Kristian Johansen, CEO of TGS, said: ‘By moving TGS Data Verse, the largest subsurface seismic library, and the TGS
Imaging AnyWare platform to AWS, we are co-innovating to deliver an exploration-ready atlas of the subsurface. This collaboration translates subsurface data into strategic intelligence with unprecedented scale and speed, marking a fundamental shift that will accelerate prospect generation.’
TGS is deploying a multi-modal Subsurface Foundation Model (SFM) built on Amazon Bedrock and powered by Amazon SageMaker HyperPods. This model will simultaneously process diverse data types, to achieve a comprehensive subsurface understanding that has been previously unattainable.
Uwem Ukpong, vice president, AWS Industries, said: ‘Through Open Subsurface Data Universe (OSDU) Energy Data Integration with TGS, companies across the energy sector can seamlessly integrate data, optimise exploration workflows, reduce risk, and make more confident decisions through intelligent analysis of complex subsurface data.’
TGS has already migrated petabytes of data to the AWS cloud. Leveraging AWS global infrastructure, TGS has delivered advanced projects including eFWI in Brazil using in-country GPU capability, ensuring data sovereignty and low-latency processing for regional operations.
Searcher has completed a seismic reprocessing project in Equatorial Guinea, delivering 7337 km of high-resolution data off the coast of West Africa. The project transforms legacy datasets using broadband Pre-Stack Depth Migration (PSDM) and Full Waveform Inversion (FWI) technologies. ‘The result is exceptional clarity and detail in imaging complex geological structures, allowing companies clearer insights into hydrocarbon systems and potential reservoirs,’ said Searcher in a statement.
The enhanced imaging will help to reduce exploration uncertainty, support strategic planning, and pinpoint the most promising prospects ahead of the EG Ronda 2026 licensing round, scheduled to open in April 2026, the company added.
‘As the first project of its kind in this region, the clarity and resolution now available will fundamentally change how companies approach Equatorial Guinea’s offshore exploration,’ said Alan Hopping, Searcher’s managing director.
The US Bureau of Land Management generated a record $592.7 million in total receipts from oil and gas sales in the first quarter of 2026 – in line with the Trump administration’s Energy Dominance initiative.
From January through March, the BLM sold 246 parcels for lease on 225,277 acres in Arkansas, Colorado, Louisiana, Michigan, Mississippi, Montana, North Dakota, Nevada, New Mexico, Utah and Wyoming, generating just over $415 million in receipts.
In addition, last month the BLM held an oil and gas sale for the National Petroleum Reserve in Alaska, resulting in 187 tracts sold and an additional $177.6 million in total receipts.
The Alaska sale was the first for the reserve since 2019 and the first under the One Big Beautiful Bill Act under which, the BLM must hold at least five lease sales in the reserve by 2035, each offering at least four million acres.
Meanwhile, the US Bureau of Ocean Energy Lease Sale Big Beautiful Gulf 2 (BBG2) in March generated has generated nearly $47 million in high bids.
The sale included 25 blocks covering approximately 141,000 acres in federal waters of the Gulf of America. Thirteen companies submitted 38 bids totaling $69,838,782.
BOEM offered approximately 15,000 unleased blocks across the Western, Central, and portions of the Eastern Gulf Planning Areas. The agency applied a 12.5% royalty rate for both shallow and deepwater leases, the lowest deepwater rate since the George W Bush administration.
In Fiscal Year 2025, oil production on the Outer Continental Shelf comprised 677.2 million barrels, representing 14% of all domestic production. This equates to an average of approximately 1.86 million barrels of oil per day.
TotalEnergies and Masdar have signed a binding agreement to establish a $2.2 billion 50/50 joint venture that will merge their onshore renewable activities in nine countries across Asia.
The JV will develop, build, own and operate onshore solar, wind and battery storage projects in Azerbaijan, Indonesia, Japan, Kazakhstan, Malaysia, the Philippines, Singapore, South Korea and Uzbekistan.
The JV will have a portfolio capacity of 3 GW of operational assets and 6 GW of assets in advanced development that are expected to be operational by 2030. Each partner will contribute assets of comparable value.
‘Asia will be the main driver of global electricity demand growth this decade, and this collaboration with TotalEnergies will accelerate our progress across the continent, unlocking new opportunities
to deliver the competitive, reliable energy solutions that our partners and customers need,’ said Dr Sultan Al Jaber, UAE minister of industry and advanced technology and chairman of Masdar.
The JV, which will be headquartered in Abu Dhabi Global Market (ADGM), will be staffed by around 200 employees from both TotalEnergies and Masdar. The management team for the JV will be announced at a future date.
The UK Crown Estate has announced plans for Offshore Wind Leasing Round 6 in the first half of 2027.
The seabed manager believes it could lease around 6GW or more, predominantly in the North East of England and in water depths suitable for fixed-bottom wind.
‘The UK’s offshore wind pipeline is one of the largest in the world, with a current capacity of nearly 17GW and a further 12GW under construction,’ said the Crown Estate in a statement. ‘Further areas of seabed opportunity have been
identified across the south west of the UK, Wales and other regions which may form the basis of subsequent leasing rounds through the Crown Estate’s new seabed management tool, the Marine Delivery Routemap.’
This will be the first leasing round brought to market using The Crown Estate’s Marine Delivery Routemap, which considers spatial data from a number of sectors dependent on the sea space, providing greater long-term visibility on how the seabed can be developed.
While developers will be able to choose the technology to best suit individual projects, most of the seabed areas are likely to favour the use of traditional fixed bottom wind which benefits from established supply chains and should help provide greater certainty over project costs, said the Crown Estate.
The Crown Estate said it also seeking market views on a range of commercial approaches. The fifth licensing round awarded seabed rights to Equinor, Gwynt Glas and Ocean Winds.
Fugro has won a contract from Petrobras to deliver a geotechnical site investigation for the 18MW Rio de Janeiro Offshore Wind Pilot Project. Working off São João da Barra, Fugro will acquire the geo-data and undertake soil sampling, in situ testing and laboratory analysis across four coastal and shallow-water locations, along with onshore investigations to support cable landfall and routing.
XGS Energy and Baker Hughes have announced a strategic collaboration to advance XGS’s planned 150MW geothermal project in New Mexico to support the delivery of clean power to the Public Service Company of New Mexico’s (PNM) grid in support of Meta’s data centre operations in the state.
Norway and Belgium have signed a bilateral agreement aimed at facilitating infrastructure for the transport of CO2 by pipeline from Belgium to the NCS.
TotalEnergies’ Sustainability & Climate –2026 Progress Report shows that methane emissions have been reduced in 2025 by 65% compared to 2020. Operated Scope 1+2 emissions totalled 33.1Mt in 2025, vs 46Mt in 2015. Greenhouse gas emissions from oil and gas facilities decreased by 38% versus 2015. New projects in Brazil and the US in 2025 helped to cut average emissions intensity (Scope 1+2) to below 16 kg CO2e/boe.
Low Carbon Contracts Company (LCCC) has signed more than 200 Contracts for Difference (CfDs) across the UK’s Allocation Round 7 (AR7) and Allocation Round 7a (AR7a), enabling 14.7GW of renewable electricity generation across fixed bottom and floating offshore wind, onshore wind, solar, and tidal stream power.
The European Commission has approved a $5.8 billion Danish scheme to build and operate two offshore windfarms and support construction and operation of two offshore wind farms. The 0.8MW Hesselø wind farm will generate around 3.2TWh per year. The 1MW North Sea I Mid wind farm will generate around 4.6TWh per year.
The UK’s second carbon storage licensing round has received bids for more than 2 million acres of seabed.
The round was launched in December 2025 after close consultation with The Crown Estate and Crown Estate Scotland, and other seabed users.
Four storage permits have already been awarded in two locations in the UK. Track 1 project Endurance was granted a storage permit allowing it to move towards a possible first injection date in 2028 while the second Track 1 project, HyNet, was awarded three storage permits, which will also allow it to target first injection in 2028.
Endurance, off the coast of Teesside, also recently started drilling an appraisal well, which follows the one spudded in the Hewett field in the Southern North Sea by the Bacton CCS project.
The NSTA has published maps highlighting areas of future carbon storage appraisal potential, and issuing a set of stewardship expectations to help licensees.
Andy Brooks, NSTA director of new ventures, said: ‘As we transition, we benefit from decades of experience in the North Sea, commercial know-how, optimal
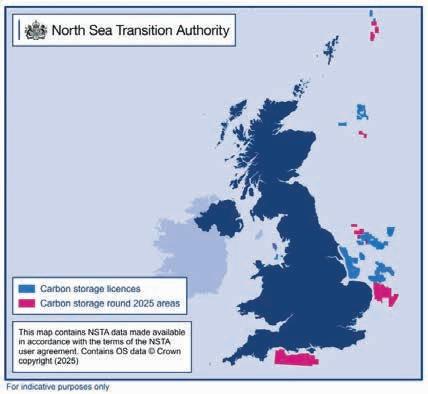
geological conditions, and spatial co-ordination.’
Meanwhile, the UK has shortlisted its biggest field of bidders since 2019 for offshore electricity transmission links for three major North Sea wind farms off Great Britain’s east coast. Five bidders are vying to own and operate the transmission links which connect offshore wind farms East Anglia THREE, Inch Cape and Dogger Bank C into Great Britain’s power grid. With a combined estimated value of £3.5 billion, the pre-built connections consist of onshore and offshore cables, converter stations and substations.
TGS has awarded a contract to Tape Ark to migrate approximately 40 petabytes of seismic and subsurface data into a cloud environment.
Tape Ark will migrate approximately 40 PB of data into a cloud environment; deliver cloud-native data formats compatible with TGS platforms; enable faster data availability for internal teams and customers and support reduced data-delivery timelines.
Tape Ark’s ingest platform supports parallel, high-throughput processing across multiple facilities, allowing petabyte-scale datasets to be migrated efficiently and aligned with TGS’ internal processing and delivery workflows.
The migration will enable on-demand access to TGS’ global data library; scalable high-performance computing for imaging and advanced analytics; improved collaboration across subsurface and digital teams; and faster turnaround times for project delivery and customer workflows.
‘The program represents one of the largest cloud-migration initiatives of its kind within the energy sector,’ said TGS. ‘By transitioning tens of petabytes of data into a hyperscale cloud environment, TGS is strengthening the digital foundation that underpins its imaging, analytics, and data-delivery workflows,’ said TGS.
Petrobras has found ‘excellent quality oil’ in the pre-salt layer of the Campos Basin, offshore Brazil in the Marlim Sul field. Well 3-BRSA-1397-RJS is 113 km off the coast in the city of Campos dos Goytacazes-RJ, at a water depth of 1178 m. The oil-bearing interval was confirmed through electrical logs, gas indications, and fluid sampling.
Operator OKEA has revealed that the recoverable resource estimation at the Talisker Statfjord formation in the Norwegian North Sea has increased from 19 to 28 million barrels of oil equivalents (mmboe). Production is expected in 2027. Total recoverable volume estimates from the Statfjord and Cook formations combined have increased from 16-33 to 23-44 mmboe. The Talisker West discovery is located in the Brage field, 10 km east of the Oseberg field and about 120 km west of Bergen. The wellbore was drilled to measured depth of 10,223 m.
Equinor has started drilling the Raia project in the pre-salt of the Campos Basin, Brazil. The campaign includes six wells in the Raia area, around 200 km offshore Brazil in water depths of around 2900 m. Estimated recoverable reserves exceed one billion barrels of oil equiva-
lent. The project will have the capacity to export up to 16 million m3 of natural gas per day, which could represent 15% of Brazil’s natural gas demand.
Petrobras has discovered gas in the Copoazu-1 exploratory well, in Block GUA-OFF-0, located in deep waters off Colombia. The Copoazu-1 well is 36 km from the coast, at a water depth of 964 m and at a distance of 8 km from the Sirius-1 (discovery) and Sirius-2 (evaluation) wells. Gas-bearing intervals were confirmed through electrical logs and fluid sampling.
Eni has made two gas discoveries in Libya. Two adjacent geological structures, Bahr Essalam South 2 (BESS 2) and Bahr Essalam South 3 (BESS 3), were drilled by the B2-16/4 and C1-16/4 wells, 85 km off the coast in about 650 ft of water, and 16 km south of the Bahr Essalam gas field. Gas-bearing intervals were encountered in both wells within the Metlaoui Formation, the main productive reservoir of the area. The acquired data indicate the presence of a high-quality reservoir. BESS 2 and BESS 3 structures are estimates to jointly contain more than 1 Tcf of gas in place.
Equinor has made an oil discovery that will be tied into the Johan Castberg
field in the Barents Sea. The discovery was made in the ‘Polynya Tubåen’ prospect (7220/7-5). The preliminary volume estimate is between 14 and 24 million barrels of recoverable oil equivalents.
Eni has made a significant gas and condensate discovery in Egypt, with the drilling of the Denise W 1 exploration well in the Temsah Concession in the Eastern Mediterranean. Preliminary estimates indicate about 2 trillion cubic feet (Tcf) of gas initially in place and 130 Mbbl of associated condensates. The Denise W discovery lies 70 km offshore in 95 m of water depth and less than 10 km from existing infrastructure. It features a gas-bearing sandstone reservoir of excellent quality with about 50 m of net pay.
Libya’s National Oil Corporation (NOC) and Sonatrach, operator of Contract Area 95/96 in Libya’s Ghadames Basin, have made an oil and gas discovery. The find follows the drilling of the A1-69/02 exploration well, located 70 km from the Wafa field. The well was completed to a final depth of 8440 ft and is delivering production rates of 13 million cubic feet of gas and 327 barrels of condensate per day from the Awynat Wanin and Awyn Kaza formations.
RenwableUK’s latest EnergyPulse Insights offshore wind report predicts that the global offshore wind industry will reach 100GW of operational capacity this year.
According to the report, 374 offshore wind farms are operating around the world, up from 347 twelve months ago. Global offshore wind capacity has increased by 8% over the past 12 months, from 82.5GW to 89.2GW fully operational (an increase of 6.7GW).
2025 was the fourth biggest year of delivery of offshore wind capacity on record (8.8GW) and the report forecasts that 18.8GW could be delivered in 2026 with projects completing in China, UK, Germany, USA, Taiwan, Poland and elsewhere.
The global offshore wind pipeline now stands at 1565 projects at every stage of development, with a capacity of 1157GW in 49 markets. Looking ahead, the report forecasts that 236GW could be operational worldwide by the end of 2030 – more than two and a half times as much global capacity as we have today. 671 offshore wind projects are expected to be fully operational by 2030.
In the UK, operational capacity has risen from 14.8GW to 16.1GW (an increase of 1.3GW) over the last 12 months, with the number of completed wind farms rising from 43 to 45. A further 11.5GW are under construction. In total, the UK has 127 UK projects at any stage of development (91.9GW).
Eighty four per cent of offshore wind capacity that went operational over the last 12 months was in China and the UK.
Worldwide £39 billion of capital investment was committed across 16.8GW of financial investment decisions in offshore wind projects over the last year, according to the report. It also notes that capital investment in UK offshore wind awarded contracts in the government’s latest auction (Allocation Round 7) could reach £31.5 billion.
RenewableUK’s chief executive Tara Singh said: ‘A significant level of private investment has gone into new offshore wind projects worldwide over the last 12 months, with final investment decisions worth nearly £40 billion across 38 offshore wind farms.’
Petrobras will invest $450 million in the world’s most extensive Permanent Reservoir Monitoring (PRM) project to map the behaviour of the Mero field reservoir in the Santos Basin, offshore Brazil.
Mero is one of Brazil’s main oil-producing fields and is expanding. In January 2026, it surpassed 680,000 barrels per day on average each month.
This project, unprecedented in deep waters, will provide data that will allow for a deeper understanding of reservoir behaviour and its dynamics over time. This will enable better management, ensuring maximum oil recovery from the reservoirs.
By optimising field management, the technology maximises oil production without a significant increase in emissions, thus contributing to a reduction in the carbon footprint.
The first phase of the project, involving the installation of more than 460 km of cables with optical sensors, covering an area of 222 km², was completed in March. The system will be responsible for monitoring oil and gas production activities on the FPSOs Guanabara (Mero 1) and Sepetiba (Mero 2).
The second phase is also underway with the construction of an additional 316 km of seismographic cables, which will cover another 140 km² of the production areas of the FPSOs Duque de Caxias (Mero 3) and Alexandre de Gusmão (Mero 4). This stage will be completed next year.
For now, computers on board the platforms will receive the data collected from the seabed, but in the future, the data will be sent, via fibre optics, to the company’s headquarters.
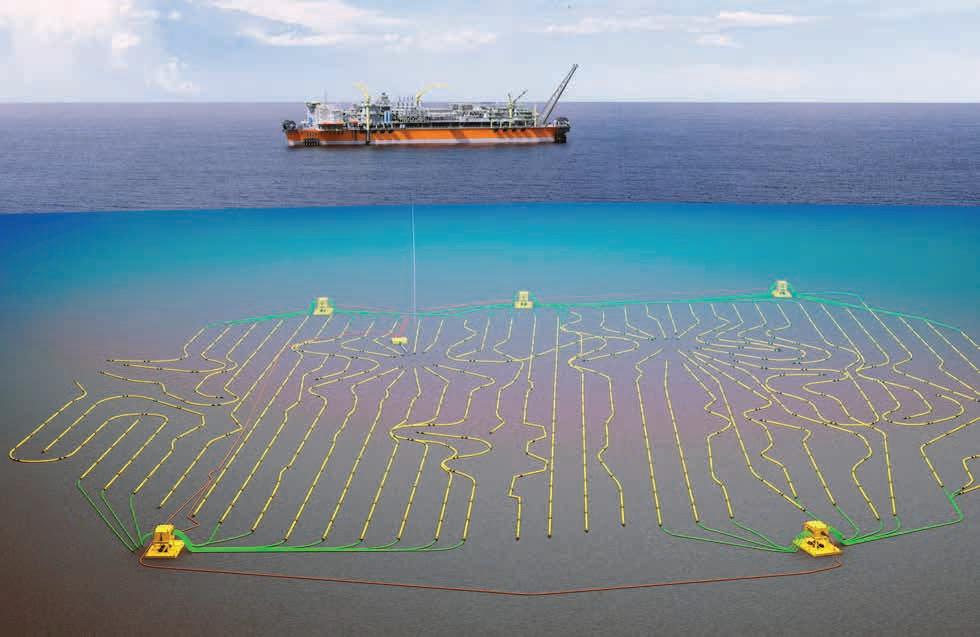
Furthermore, Petrobras, in partnership with UFRJ (Federal University of Rio de Janeiro), will use Artificial Intelligence to continuously capture information from the PRM system in the Mero area, contributing to scientific research and operational safety in the field.
The Mero field is located in the Libra Block, belonging to the consortium of the same name, and is operated by Petrobras in partnership with Shell, TotalEnergies, CNPC, CNOOC, and Pré-Sal Petróleo SA – PPSA, which acts as manager of the production sharing contract and represents the Union in the area adjacent to the field.
Market conditions for offshore wind are improving, according to TGS | 4C’s Global Market Overview report.
‘Geopolitical developments, including the Iran conflict, could have a significant impact on the longer-term prospects for offshore wind as energy security is pushed to the top of political agendas,’ said the report.
It shows that the global offshore wind forecast for installed capacity in 2030 has fallen by 17% year-on-year, with expected capacity outside China reduced from 145GW to 120GW. Forecasts for 2030 have not changed since last quarter though, due to increased optimism following the UK’s Allocation Round 7.
This analysis finds a 16% drop in 2040 expectations from Q1 2025 and a 25% drop from Q1 2024 expectations. Meanwhile, 2026 shows signs of improvement, with many projects progressing to later stages of the pipeline.
Offtake awards have been boosted by a globally record-breaking Allocation Round 7 in the UK, which yielded 8.4 GW of contracts. This alone makes 2026 the fifth-largest year on record in Q1 and it could become the biggest year for offtake, with 19.6GW, compared to 2024’s 19.1GW.
Site awards in Q1 2026 have been slow, with only Norway’s Utsira Nord
(1 GW) awarding so far this year. Activity is expected to increase significantly over the remainder of the year, with up to another 1.7GW of floating projects and 17.4GW of bottom-fixed projects expected. This is, however, down 79% from the peak in 2022.
With only 280MW of projects reaching Commercial Operation Date (COD) so far this year, it has been a slow start, said TGS. Despite this, TGS said it is expecting the second-largest volume of CODs on record at 17GW, with 10.3GW outside of China, taking globally installed capacity up to 103.4GW by the end of 2026.
Kamran Abbasov1* and Gabrielle Jones2
Abstract
This paper presents three case studies from the Azeri-Chirag-Gunashli (ACG) field, focusing on the modelling of 4D amplitude anomalies caused by dynamic reservoir changes. The first case study examines the evolution of softening in the Fasila B reservoir, highlighting the impact of gas saturation on seismic attributes and the importance of 4D modelling in understanding these changes. The second case study addresses the hardening observed in the Balakhany reservoir, visualising the impact of sweep thickness on amplitude response and the resolution capabilities of 4D seismic data. The third case study shows how 4D modelling helps during the processing campaign, by validating observed 4D anomalies. These studies underscore the critical role of 4D seismic modelling in interpreting anomalies observed in actual 4D seismic data, improving dynamic reservoir characterisation, and guiding decision-making during seismic data processing. The findings also highlight the need for realistic expectations about how dynamic reservoir processes impact noise-free seismic data, particularly in the context of identifying fluid movements.
Introduction
This paper presents three case studies from the giant, 50-km-long Azeri-Chirag-Gunashli (ACG) field located in the South Caspian Basin (Figure 1). These studies focus on modelling 4D amplitude anomalies caused by fluid and pressure changes in the reservoir.
Seismic acquisition at ACG has focused on improving static and dynamic reservoir imaging, advancing structural understanding through higher-resolution data, and enhancing dynamic insights with field-wide 3D and 4D surveys over 30 years (Howie et al., 2005).
The ACG field is an elongated anticlinal structure with steeply dipping limbs and three structural peaks: Azeri, Chirag, and Gunashli. Production began in 1980 at the shallow-water northwestern end of Gunashli. The remainder of the field, operated by bp on behalf of the Azerbaijan International Operating Company (AIOC), commenced production in late 1997.
The main production intervals stratigraphically correspond to the Productive Series shown on the generic type-log in Figure 2. The Productive Series is a set of multiple stacked reservoirs of fluvio-deltaic origins, located at depths of 1800-3400 m. The series was deposited during a time of lowered basin levels, leading to large sediment deposits from the paleo-Volga River into the northern region of the isolated, lacustrine South Caspian Basin (Reynolds et al., 1998; Green et al., 2009).
The middle section of the Productive Series comprises the NKG mudstones (not shown on the figure) and the sand-rich Fasila and Balakhany intervals. The series is bound by a major flooding event at the top and an unconformity surface at the base.
1 BP AGT | 2 BP Technology-Integrated Characterization
* Corresponding author, E-mail: kamran.abbasov@bp.com DOI: 10.3997/1365-2397.fb2026029
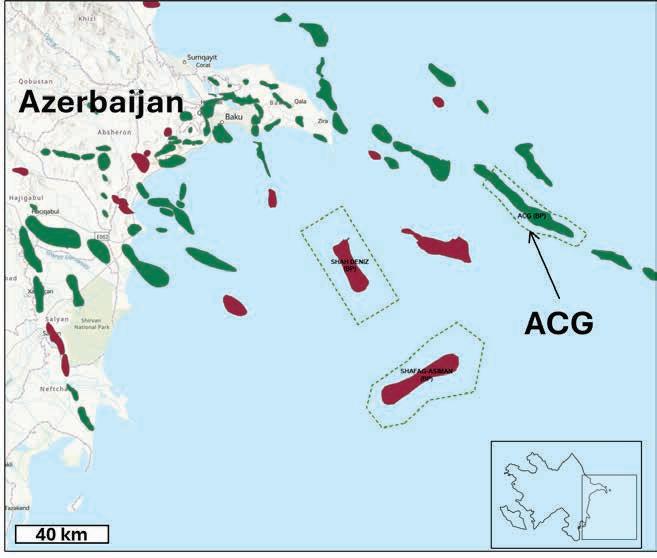
During times of high relative lake levels, sedimentation was dominated by low net-to-gross (NTG) distal delta front and lacustrine deposits such as those found in the Balakhany Formation. In contrast, during periods of low relative lake levels, sedimentation was dominated by laterally continuous, higher NTG proximal delta front and delta plain deposits as found in the Fasila Formation, also known as the Pereriv Formation (Choi et al., 2007).
4D seismic data has been instrumental in tracking fluid contacts movement within the Fasila reservoirs of ACG (Robinson
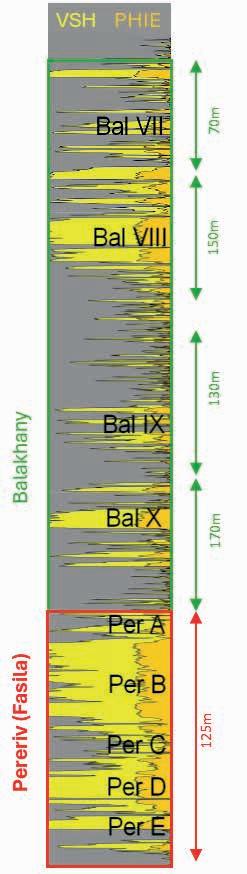
et al., 2005 and Manley et al., 2005), leading to a more accurate definition of geological contacts, which are defined solely from well data and the reservoir model (Riviere et al., 2010). This has allowed optimisation of at least twelve production wells, including seven wells on the Azeri sector which benefited from increased rate or resource addition due to the 1995-2016 4D program. Figure 3 shows one of the 4D seismic attribute maps used for contacts updates, which later fed into the refinement of reservoir model and well placement optimisation (Lawrence et al., 2018). Additionally, 4D data has historically had a significant impact on the history matching in ACG field (Ibrahimov T., 2015)
After 2015, the focus of development in the ACG field shifted from the Fasila reservoirs towards the more complex Balakhany VIII and X reservoirs. The complexity of these reservoirs arises from the heterogeneous nature of the depositional environment. This complexity has a huge impact on production with challenges including irregular development patterns, difficulty assessing
connected volumes and optimising the depletion plan and poor sweep conformance.
If successful, 4D seismic data offers the potential to provide insight into fluid and pressure changes in the reservoir and ultimately help to manage production. To fully understand the 4D seismic response in the Fasila and Balakhany reservoirs, along with the limitations and uncertainties, 4D forward modelling is essential.
Dynamic fluid or pressure changes because of production, significantly impact seismic velocities and attenuation (Carcione, Helbig & Helle, 2003). Previous studies demonstrated the effects of hydrocarbon saturation changes on the elastic properties, forming the basis of 4D seismic interpretation (Castagna et al., 1999). In a mature field, such as ACG, the dominant 4D signals arise from the interaction between water and gas (both injected and ex-solved gas).. Competing saturation effects shape the 4D seismic signal. The 4D modelling toolkit used at ACG, illustrated in Figure 4, follows a standard seismic rock-properties workflow based on fluid-saturation substitution principles (Gassmann, 1951) and field-specific pressure sensitivity models.
Case study 1: Evolution of softening in Fasila B reservoir
The Fasila reservoir has been in production for more than 25 years, leading to significant reservoir pressure depletion. When reservoir pressure drops below bubble point, gas begins
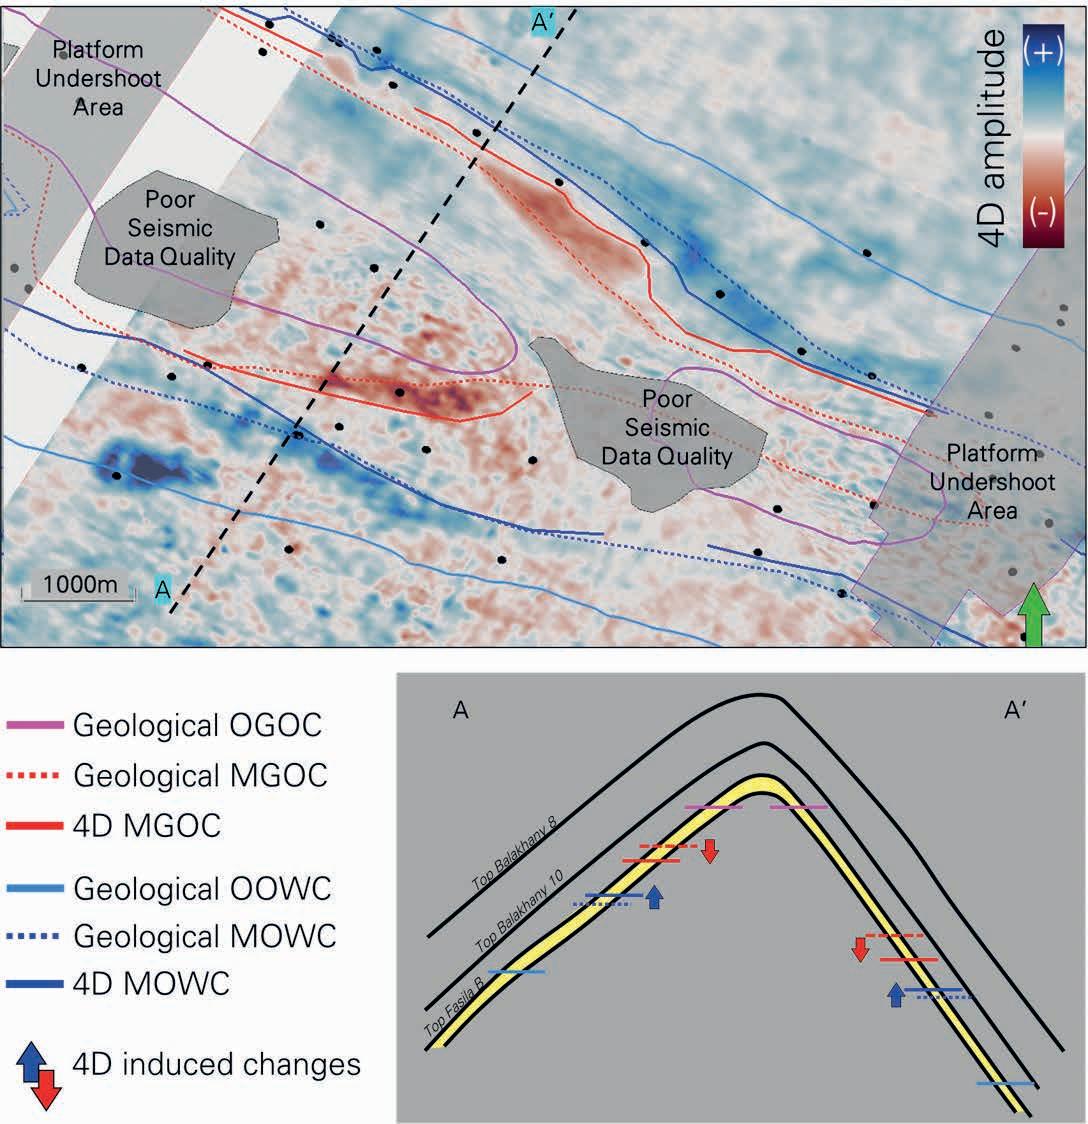
Figure 3 The 4D map from ACG shows the difference in the sum of negative amplitude attributes between 2016 and 2012 for the Fasila B lower reservoir. Updates to the positions of the moved oil-water contact (MOWC) and moved gas-oil contact (MGOC), based on 4D data, are illustrated.
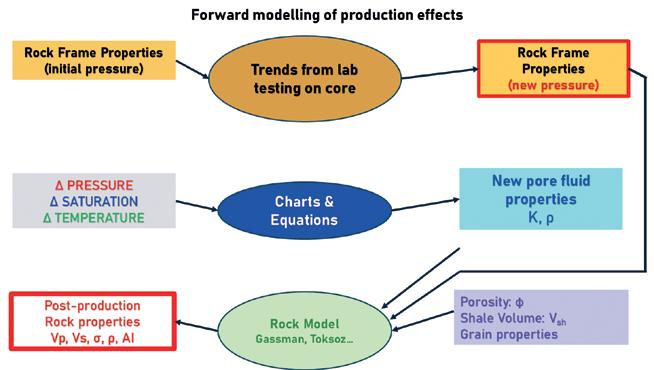
to ex-solve from oil. There are multiple direct and indirect sources across ACG confirming increased gas saturation (Sg) through various surveillance methods (Atakishiyev, et al., 2020). Although reservoir pressure in Fasila has declined over the years, Figure 5 shows that associated rock-frame changes are smaller than the effect of evolving gas and water saturations (Sw) (e.g., frame-related impedance changes due to depletion of 1-2% versus saturation-driven changes of ~5-10%); thus, the 4D response in this study is dominated by saturation changes rather than pressure-induced frame alteration.
Figure 6 shows the increase in gas-oil ratio (GOR) linked to the sharp pressure decline in Central Azeri (CA) wells between 2005 and 2013. Pressure later stabilised as the Voidage Replacement Ratio (VRR) was maintained at approximately 100-120%. From around 2020 onward, pressure began to rise, driven by VRR exceeding 150% and reduced offtake, while injection rates
remained largely unchanged. The accelerated GOR increase after 2020 is primarily due to gas cycling, reflecting the ratio of produced to injected volumes within the reservoir.
Figure 7 shows the evolution of Fasila B 4D difference amplitudes, extracted across the whole Fasila B interval, over time. From 2008 to 2020 (maps 1-5), softening (red) dominates the crestal response, whereas hardening prevails from 2020 to 2024 (map 6). Softening suggests increased gas saturation (Sg) (Falahat et al., 2014), while hardening indicates higher water saturation (Sw). Given that the solution GOR in ACG is ~800 scf/stb, any GOR above this represents liberated gas, which increases Sg once the critical gas saturation (~2-5%) is exceeded. Once mobile, the ex-solved gas mixes with injected gas in the upper part of the reservoir. However, once a certain Sg threshold is reached, the incremental impedance reduction from additional gas becomes small (discussed later in the paper).
When the panels are viewed in order of their baseline vintage (1, 3, 4, 5, 2, and 6), the overall trend becomes clearer: softening progressively decreases, with the 2016-2012 intra-monitor pair (panel 2) already showing a reduced response. Mixed acquisition geometries across vintages limit which 4D pairs can be compared, but this baseline-ordered progression helps to reconcile the 2024 response with the broader time-lapse evolution. To better understand the drivers of this change, we next model the expected saturation impacts on the 4D signal.
Two noise-free scenarios were modelled to understand the gas response: the first simulates increased Sg in a typical Fasila B section, and the second introduces a water-swept zone in the lower Fasila B interval to evaluate seismic tuning effects (Francis, A., 2015). In both scenarios, baseline conditions are
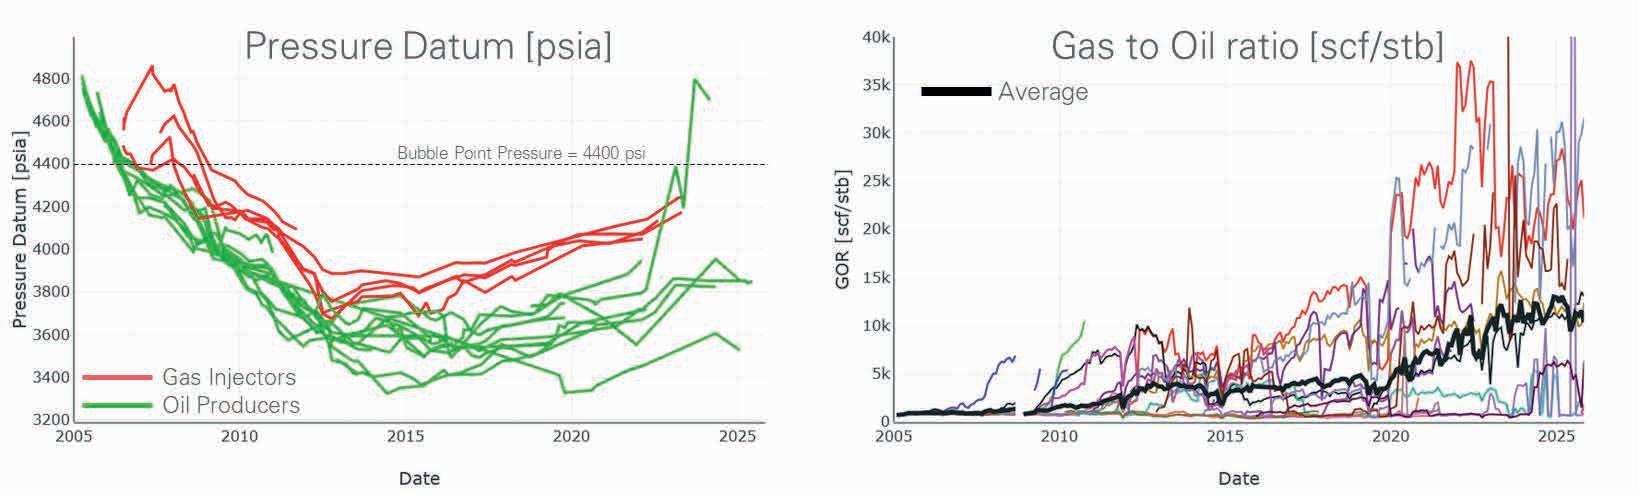
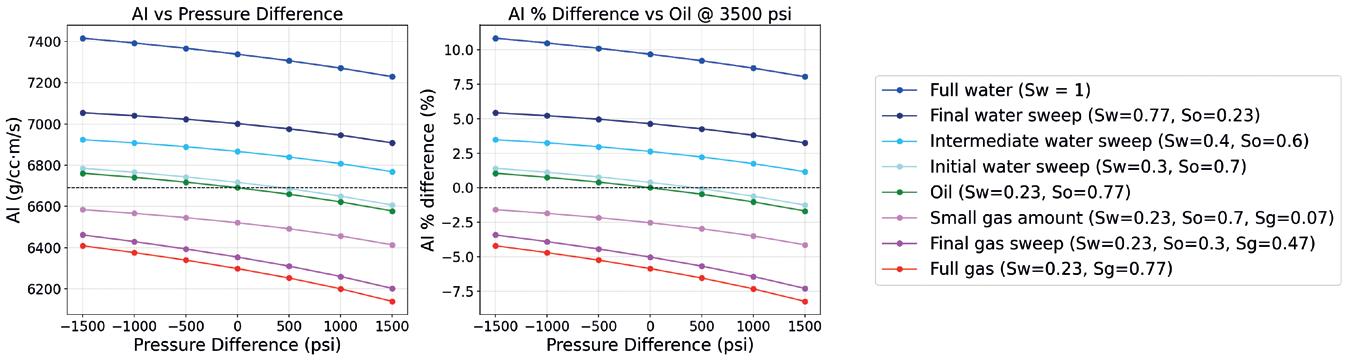
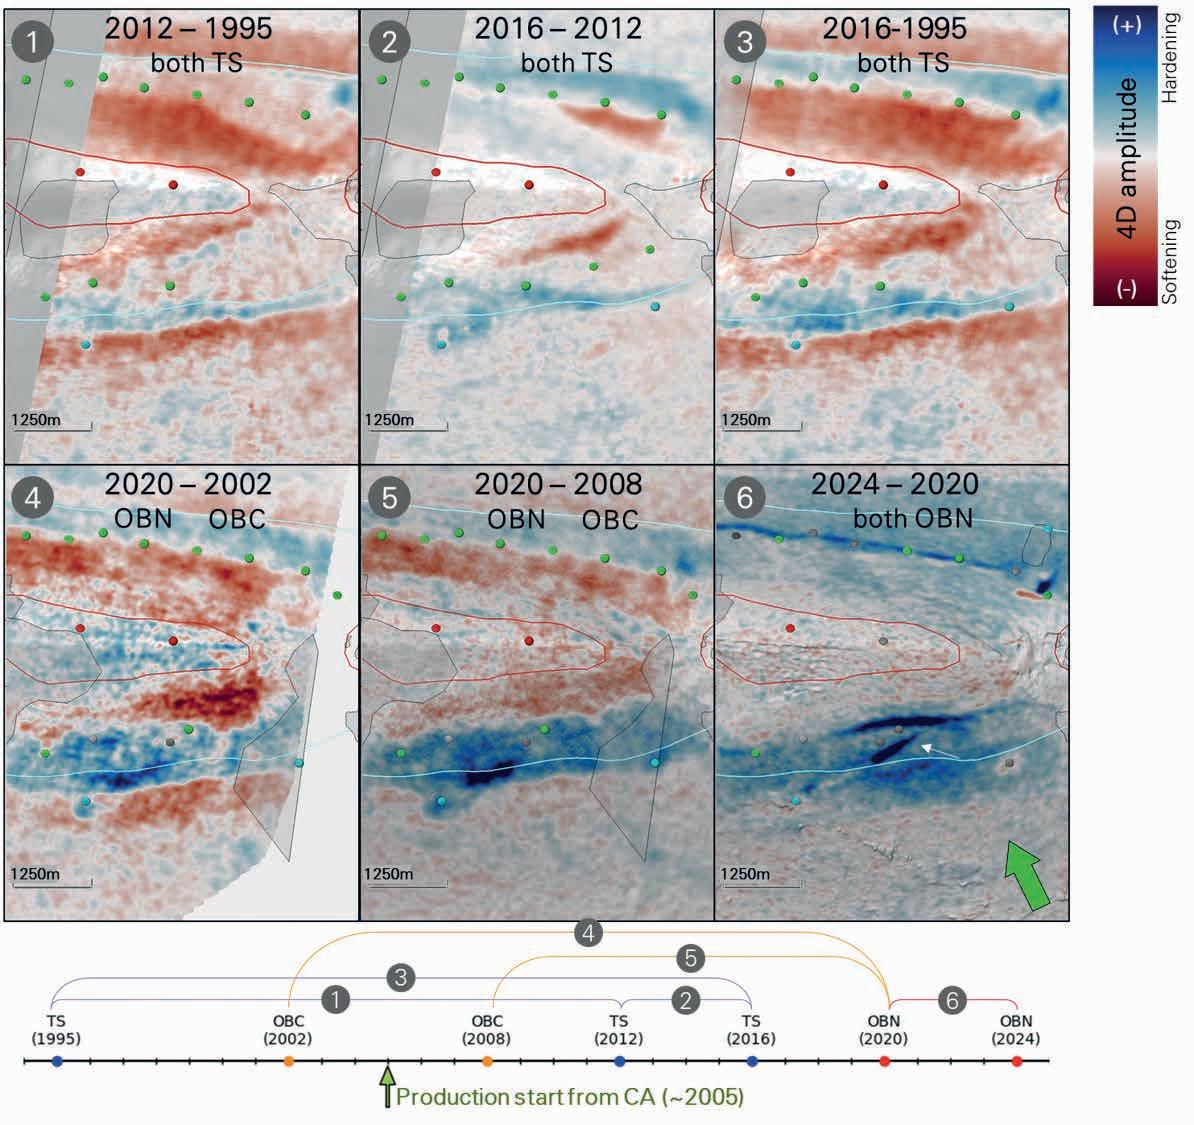
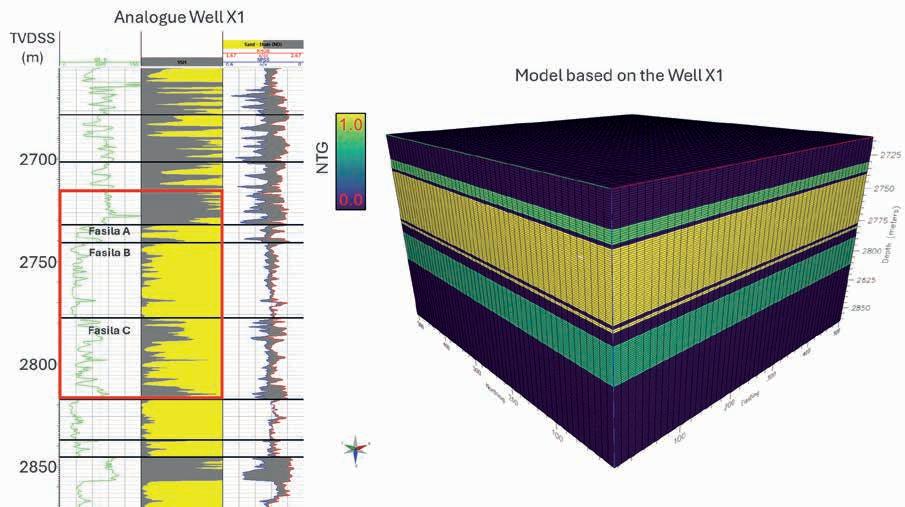
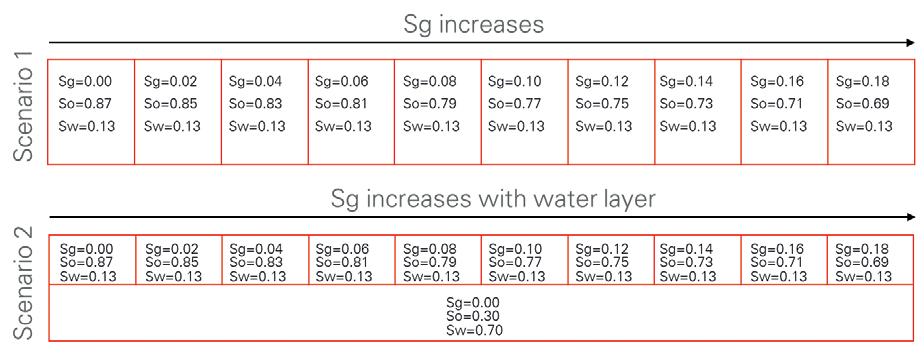
Figure 7 Fasila B 4D maps across CA through history (panels 1-6) and a timeline of seismic acquisition over CA (bottom). TS – Towed Streamer, OBC – Ocean Bottom Cables, OBN – Ocean Bottom Nodes. Maps show the difference between monitor and baseline sum of negative amplitudes. Green dots = producers, red dots = gas injectors, blue dots = water injectors.
Figure 8 Stacking pattern of the layers based on the analogue well. The red outline on the well log shows the coverage of the model on the right.
Figure 9 Two scenarios: Scenario 1 – only Sg increase, Scenario 2 – Sg increasing above swept layer. Sg = gas saturation, So = oil saturation and Sw = water saturation.
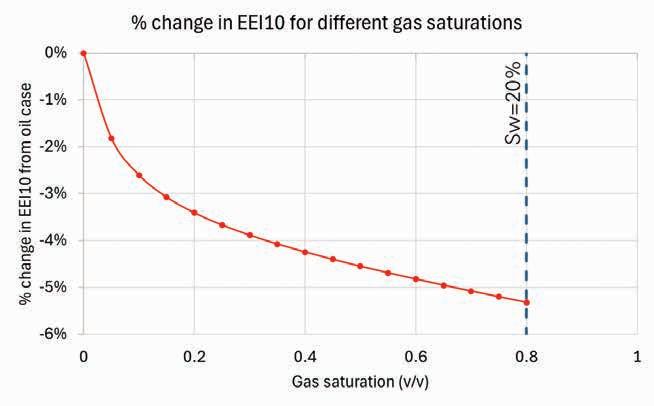
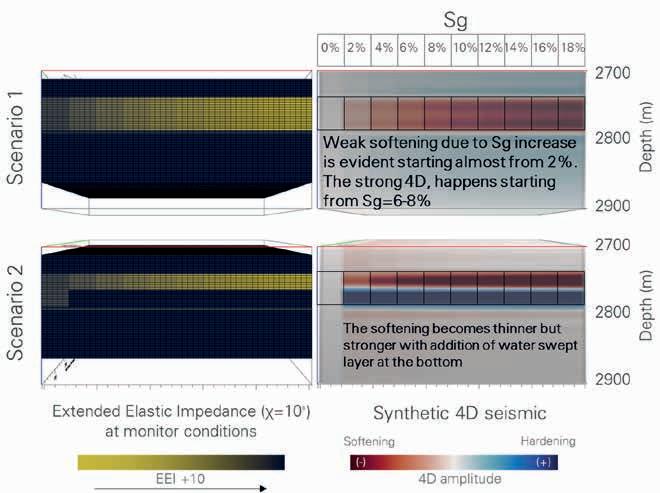
assumed to be fully oil saturated, while monitor simulates the Sg increase due to the gas cycling, mixed with earlier ex-solved gas. The Sw values are based on the study of residual oil saturations during water and gas flooding by Davenport et al., (2021). Representative stacking patterns and fluid saturation cases were generated using analogue well data (Figures 8-10).
Figure 10 shows two scenarios and the corresponding modelled 4D responses. The left panels show the Extended Elastic Impedance (EEI) (Whitcombe et al., 2002) at 10 degrees of χ (approximating full-stack seismic data) with the oil-filled sandy intervals of Fasila B in the shades of yellow. The increase of Sg moving to the right softens the rock, decreasing the impedance (EEI10) which shows an increase in yellow shading. In scenario 2, the bottom half of the model is dark-blue representing higher EEI10 associated with the Sw (simulating the swept zone). Note, that the EEI10 property cubes depict the monitor conditions, while the baseline would be entirely oil-filled throughout.
Scenario 1: Moderate change of Sg in the whole Fasila B section
Scenario 2: Moderate change of Sg in the upper portion of Fasila B, swept layer in lower portion
The noise-free synthetic 4D seismic panel shown on the right of Figure 10 was generated by convolving the EEI10 property with the Ormsby wavelet (2-6-50-80 Hz). This wavelet was carefully selected to represent a relatively good quality area of seismic data (Ryan, 1994). The synthetic 4D panel represents the absolute difference between monitor and baseline seismic EEI10, convolved with the seismic wavelet.
A summary of observations from these two scenarios is presented in Table 1.
The modelling confirms that 4D seismic softening can result from increased Sg (Scenario 1) and may be further enhanced by water sweep in the bottom layer, which generates a negative side-lobe that constructively interferes with the main trough (Scenario 2). While the modelled scenarios confirm the overall softening effect from gas until 2020, its absence, even after continued gas injection into the formation, after 2020 can be explained by Figure 11. This plot shows the percentage change in EEI10 relative to the initial oil-filled conditions with the addition of Sg. An initial increase in Sg sharply reduces impedance, but the rate of change slows at around 20% Sg. The difference in EEI10 change between 80% gas and 50% gas is only about 1%. In ACG, visible 4D signals generally require more than 5% impedance change for towed-streamer or hybrid vintages, while 2-3% is sufficient for OBN-on-OBN acquisitions due to their superior repeatability (Davies et al., 2019).
Additional modelling was performed to evaluate the 4D seismic response to increasing gas saturation (Sg) in an oil reservoir that was already gas-saturated. Figure 12 shows three scenarios with varying baseline fluid conditions. The top scenario represents a saturated oil reservoir with minimal amount of gas (5%) at baseline conditions. The middle scenario represents oil plus 10% gas at baseline conditions, and the lower scenario represents oil plus 20% gas at baseline conditions. All cases show the same stacking pattern (net to gross, NtG) and Sw at monitor in panel 1. Panel 2 shows Sg at the baseline, while panel 3 shows the modelled increase (from left to right) in Sg to a maximum of 45% gas.
The resulting noise-free 4D difference between the monitor and base conditions is shown in Panel 4. When compared with the 4D difference resulting from no gas at baseline (top scenario), it is clear that the presence of up to 20% Sg at baseline (middle and bottom scenarios), significantly reduces the 4D response from the additional increase in Sg. In addition, very weak softening may arise purely as a side-lobe effect of the hardening induced by the bottom water layer. Consequently, difference-amplitude maps extracted from the upper model would likely show only weak softening, or even a largely cancelled (white) response. By contrast, the lower two models typically exhibit hardening that strengthens from the upper to
Even minimal Sg creates a visible response on the synthetic seismic, including a doublet trough. This double trough is influenced by wavelet choice and may be absent with lower-frequency wavelets.
Increased Sg enhances softening which is amplified by seismic tuning from a thinner oil layer. If a 4D amplitude map were extracted from these models, it would show a pronounced softening, as the baseline doesn’t have any gas saturation.
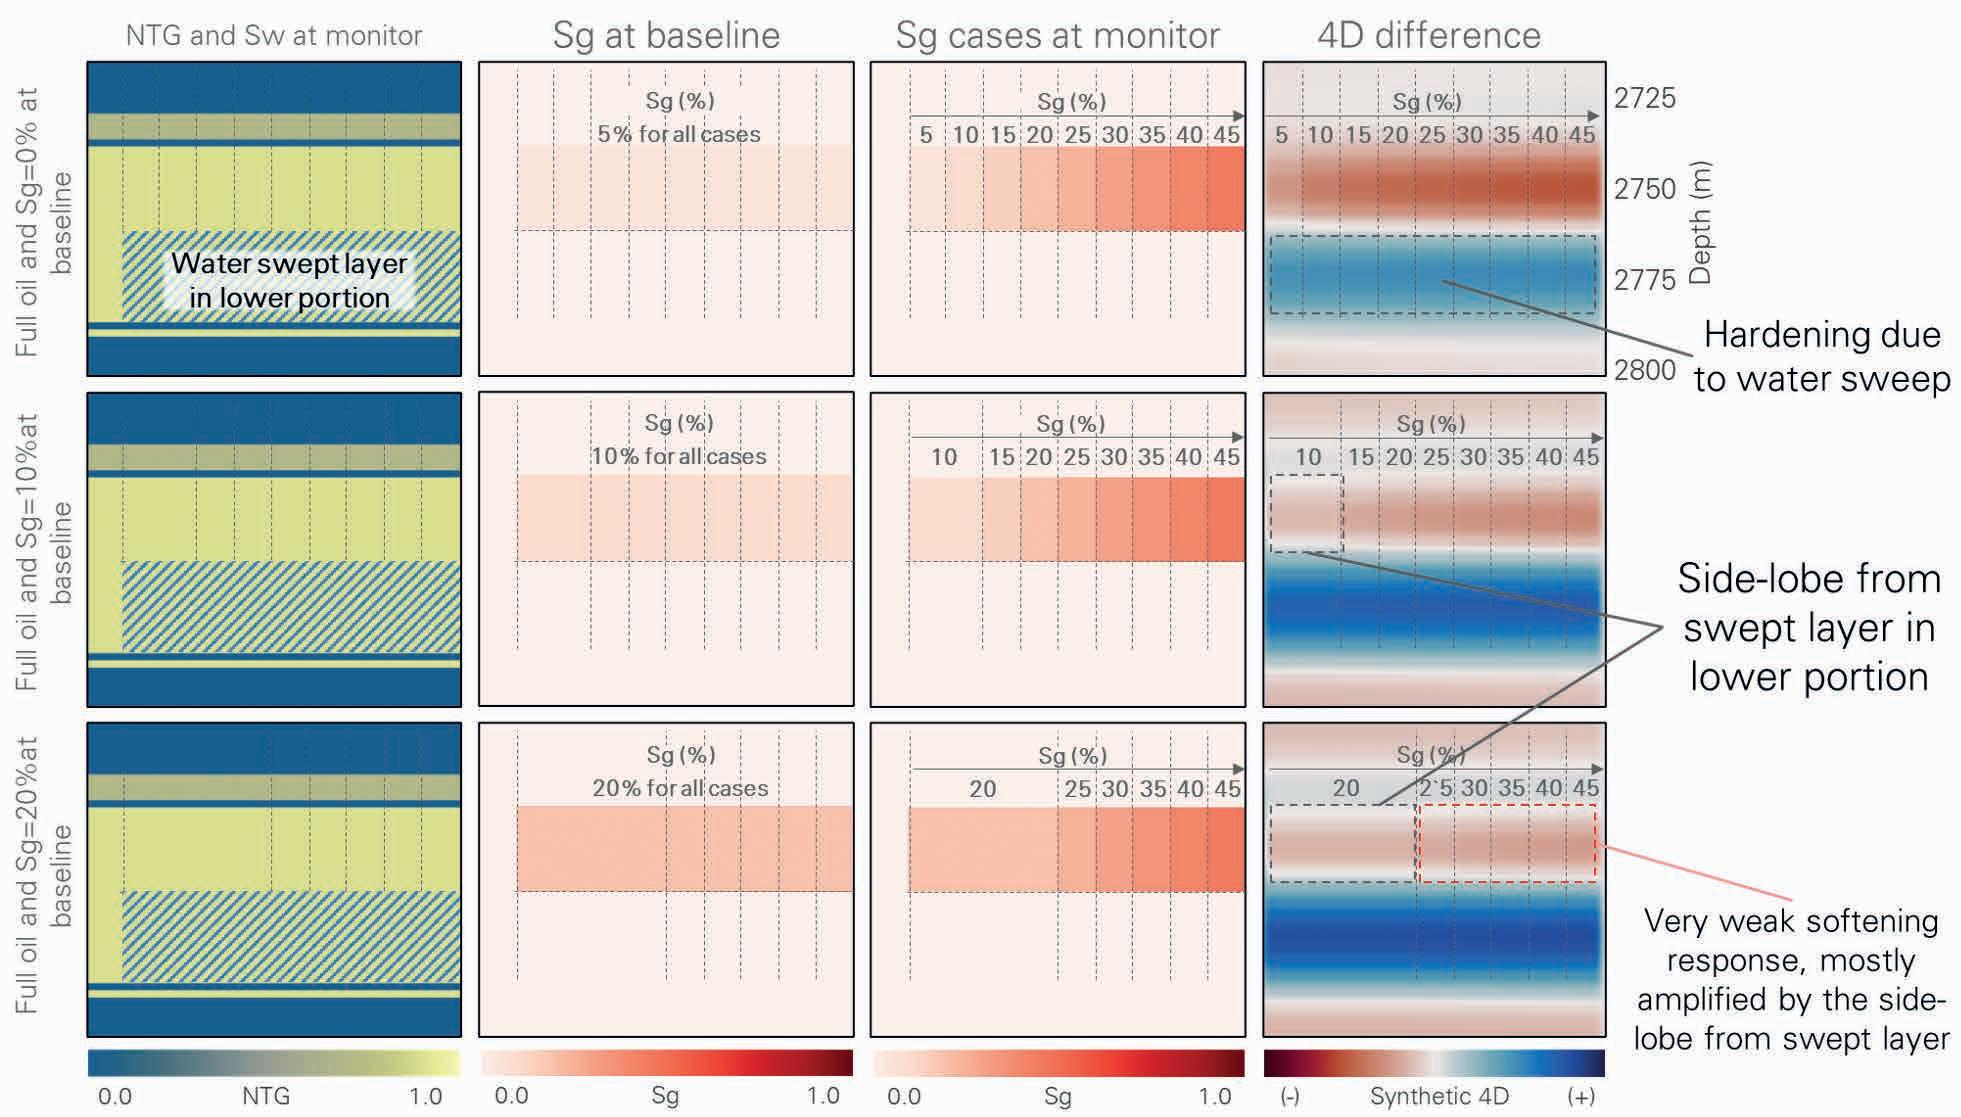
Figure 12 Three modelling cases with increasing Sg at the baseline. 1st panel – stacking pattern defined by NTG and Sw at monitor, 2nd panel – Sg at baseline, 3rd panel –Sg at monitor, 4th panel – synthetic 4D difference between monitor and baseline conditions.
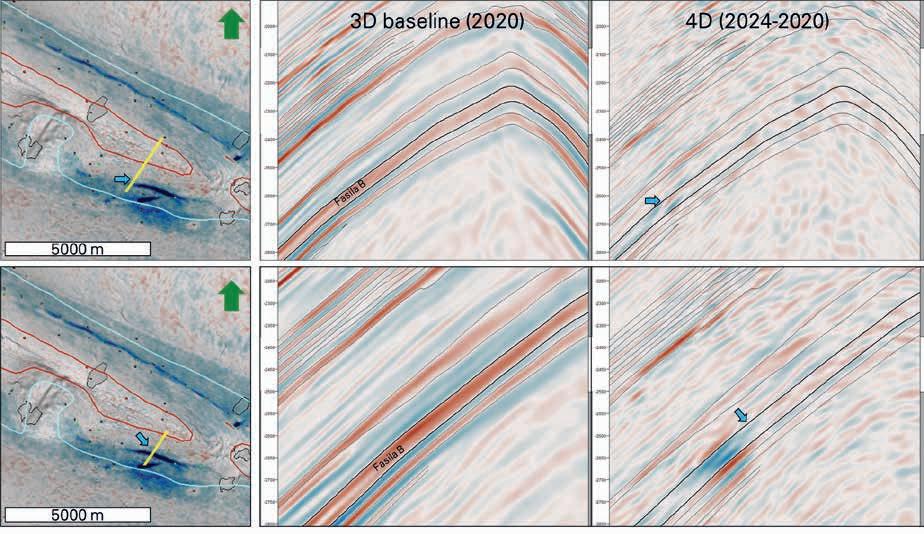
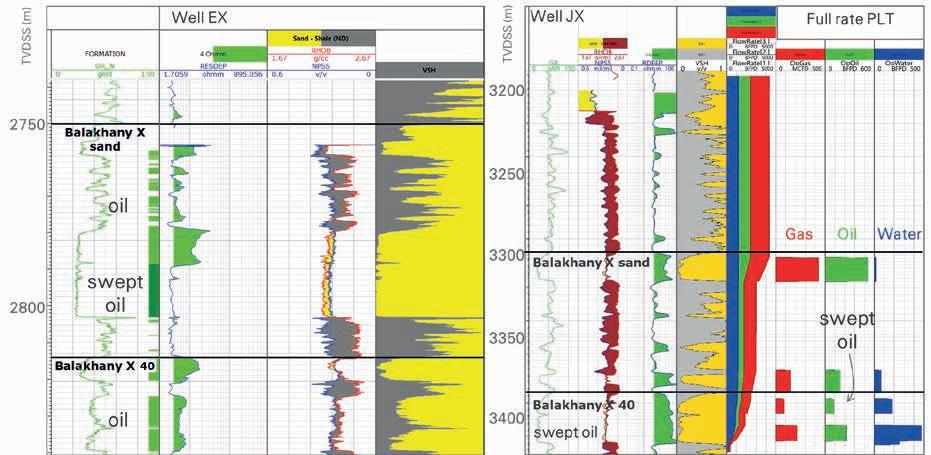
13 Examples of real 4D data.
Figure 14 FE log (left) and PLT (right) from two wells showing uneven sweep in Balakhany X. The X sand is swept in well EX, whilst it is the X 40 sub-zone that is swept in well JX.
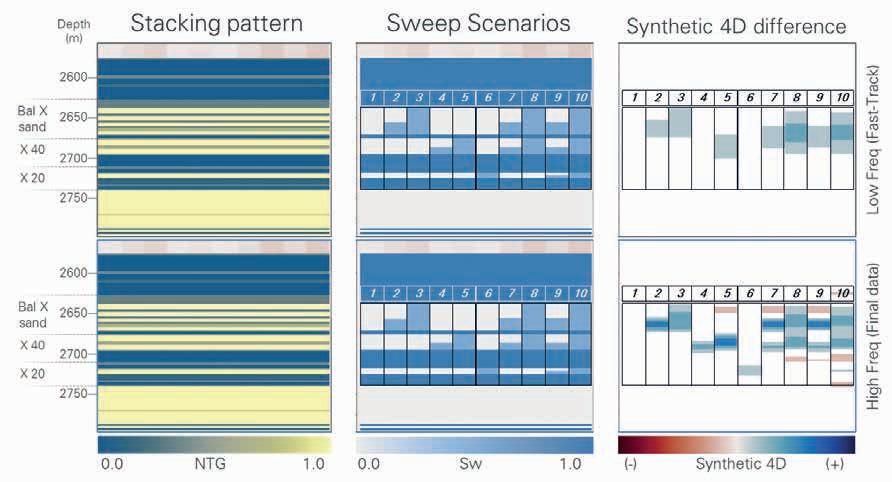
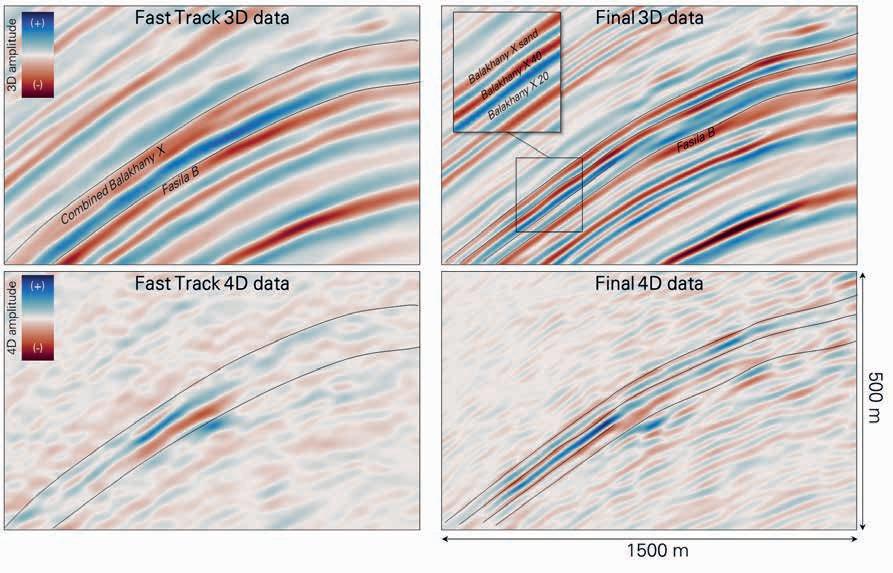
the lower model, even though neither the Sw percentage nor the sweep thickness changes. This largely occurs because of an increased impedance contrast across the upper interface of the water layer.
This modelling can explain the observed absence of 4D softening in the Fasila B between 2024 and 2020, despite the increase in GOR.
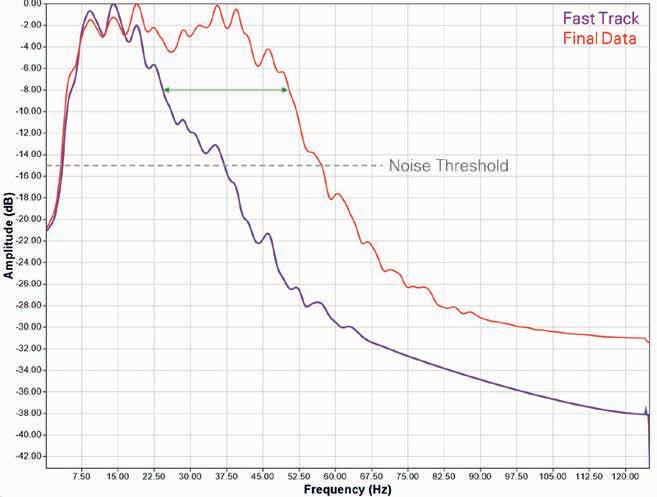
Figure 15 Modelling cases with varying water sweep. 1st panel – stacking pattern defined by NTG, 2nd panel – 10 water sweep scenarios at monitor, 3rd panel –synthetic 4D difference between monitor and baseline conditions.
16
Overall, the reduced softening response enhances the visibility of the moved oil-water contact (MOWC), shown in Figure 13, and more distinctly highlights the Matrix Bypass Event (MBE), expressed as a linear hardening aligned with the in situ stress orientation in Figure 7 (panel 6, white arrow). An MBE is an event in which injected or mobile fluids preferentially flow through high-permeability pathways (e.g., fractures), bypassing the lower-permeability rock matrix and leaving a substantial fraction of matrix hydrocarbons unswept. Notably, 4D seismic has already been successfully applied in ACG to characterise subsurface stress and associated reservoir behaviour (Majidi et al., 2021). These improvements make the latest 4D survey an invaluable input for well planning and reservoir model calibration, even in a mature reservoir such as Fasila.
Case study 2: Resolving hardening in Balakhany X reservoir
The recent OBN 4D survey aims to identify water-swept zones in the complex Balakhany VIII and X reservoirs. With seismic data still in fast-track processing, managing expectations about the resolution and capabilities of 4D seismic before final data becomes available is crucial. Formation Evaluation (FE) and Production Logging Tools (PLT) often reveal uneven sweep in
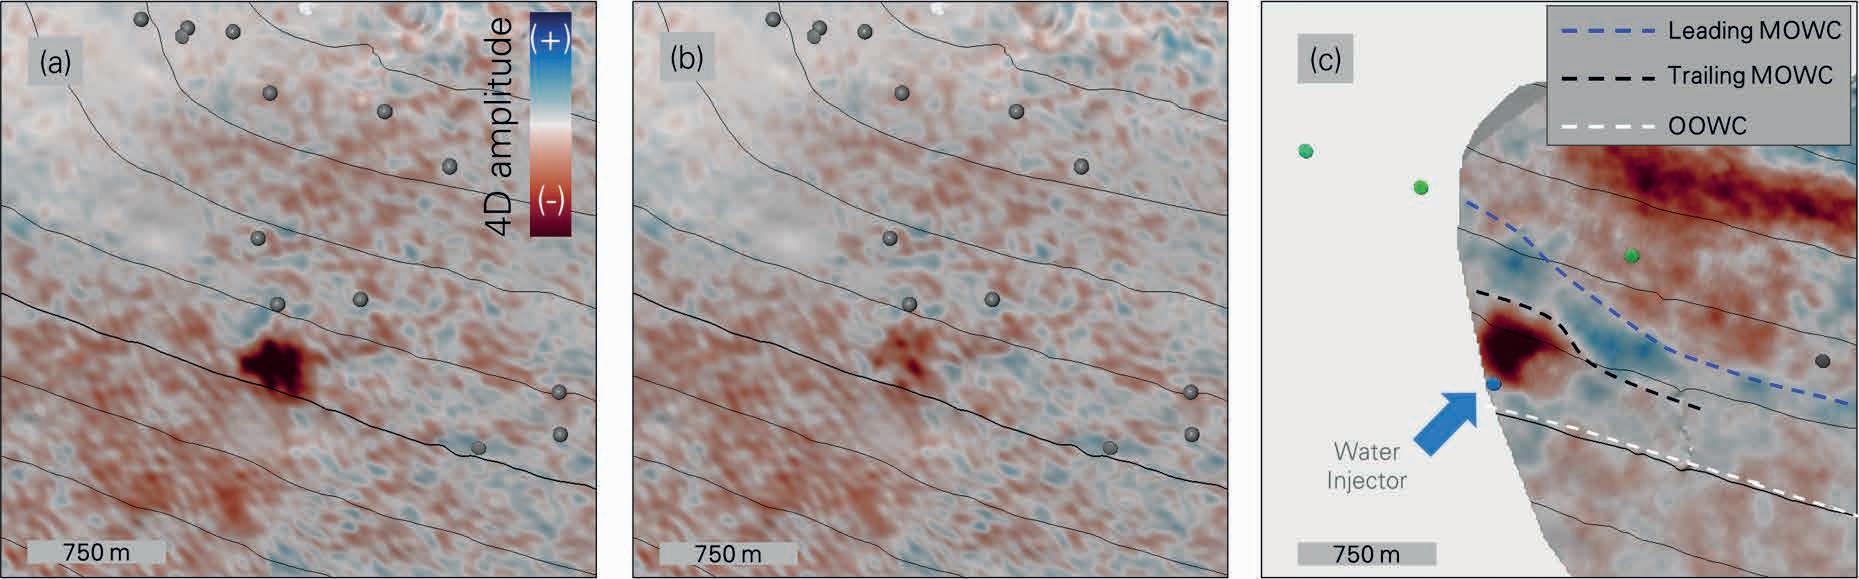
the Balakhany X reservoir, occurring in either the upper or lower sub-zone (Figure 14).
To understand the sweep response in the Balakhany X reservoir, 10 sweep scenarios were modelled. The stacking patterns, sweep scenarios and corresponding 4D difference are shown in Figure 15. The modelled stacking patterns were based on representative Balakhany X well with yellow representing good-quality sand, grey representing silt, and blue representing mudstone. The sweep scenarios (numbered 1-10) represent various combinations of swept (dark-blue) and unswept (white) sands. The noise-free 4D results are based on the synthetic 4D curves generated using low and high frequency wavelets to represent the resolution of the fast track and final datasets. The upper panels represent the results when using a low-frequency wavelet (representing the fast-track 4D data) and the lower panels represent a higher-frequency wavelet (representing the final processed 4D data). It should also be noted that scaling has been applied to the synthetic panel, such that confidently visible signals are those exceeding a 2% change in EEI, whereas 1-2% changes are considered marginally detectable and likely visible only in areas with the best seismic data quality.
Key observations from the modelling suggest that the thin sweep zones in cases 4 and 6 (~7 m thick) fall below the seismic resolution limit defined by Widess (1973) when using a low-frequency synthetic but may be detectable at higher frequencies.
When using a low-frequency synthetic, most 4D changes merge into a single peak response (cases 7-10), while a high-frequency synthetic distinguishes individual swept layers.
The modelling also shows that the high-frequency synthetic can be misleading in its hardening strength. Case 7 shows a stronger hardening response than case 8, suggesting more sweep, but this is due to a tuning effect amplifying hardening in thin sweep zones.
Figure 16 shows a line comparison between the Fast Track and Final data. The modelling in Figure 15 guided the processing contractor toward achieving the desired data quality and resolution in the final product, enhancing both 3D and 4D resolution as illustrated in Figure 16. Figure 17 highlights the step change in frequency content from Fast Track to Final data, which was achieved primarily due to Final time processing, QKDM, and post-migration processing stages.
This study introduced several incremental improvements to the processing workflow. In particular, the modelling confirmed that the softening anomalies observed around high-pressure injectors were genuine reservoir effects rather than processing artefacts such as time misalignment. These insights influenced how injector-proximal areas were handled in the final processing sequence. Special post-processing time-alignment technique, called Non-Rigid Matching (Nickel and Sønneland, 1999) was tested to reduce these artifacts. Figure 18 illustrates this: panel (a) shows a typical 4D misalignment artifact at Balakhany IX level, where no injectors are present; panel (b) displays a 4D map extracted from 4D, where monitor was aligned with baseline; and panel (c) shows the true 4D softening response associated with a high-pressure water injector in the Balakhany VIII interval on the south flank of the CA area of the field. Of note, the anomaly is offset up-dip of the injector location. This
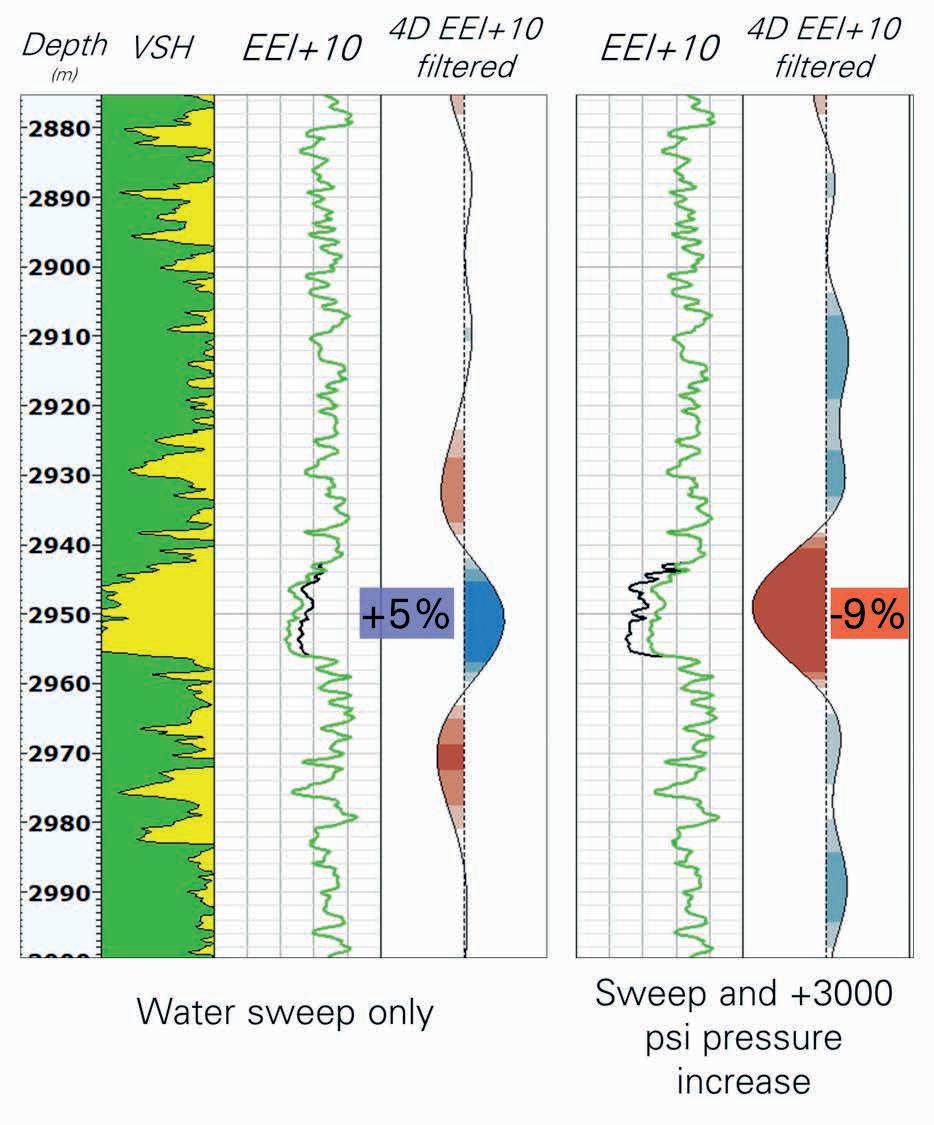
is interpreted to be the consequence of stratigraphic effects / facies variability, with improved rock quality up-dip of the well leading to a stronger observed 4D signal. Alternatively, a downdip increase in effective stress, could potentially reduce the rock frame’s sensitivity to pore-pressure increase and thereby mute the elastic response.
Figure 19 shows a noise-free 1D modelling on an analogue well indicating that a pressure increase greater than 3000 psi relative to initial conditions is sufficient to outweigh the expected hardening due to Sw changes, resulting instead in a pronounced softening response.
This paper demonstrates, through three field-based case studies from the ACG field, the significance of 4D forward modelling for interpreting time-lapse amplitude anomalies and establishing realistic expectations of 4D seismic detection and resolution.
In the first case study, modelling shows that early 4D softening is dominated by increasing gas saturation, but seismic sensitivity to gas diminishes once moderate gas saturation is reached. As a result, continued gas cycling after 2020 produces weak or absent 4D softening despite increasing GOR. Additional scenarios demonstrate how pre-existing gas at the baseline, together with tuning effects, can further suppress 4D response, explaining the observed evolution of the Fasila B signal in this mature reservoir.
In the second case study, forward modelling of multiple sweep scenarios illustrates resolution limits of 4D seismic for thin, unevenly swept intervals. The results show that some sweep patterns may fall below detectability in the initial lower-frequency processing products, while becoming resolvable in higher-frequency final deliverables. The modelling also highlights how tuning effects can distort the apparent hardening strength, cautioning against direct quantitative interpretation of 4D amplitudes.
The third case study reveals how modelling can distinguish true reservoir-driven anomalies from processing artefacts. By confirming that softening near injectors can be caused by large pressure increases, the modelling directly informed post-processing decisions and improved confidence in the final 4D interpretation.
Overall, these case studies show that seismic modelling is a critical part of the integrated interpretation of 4D data. Forward modelling helps to define what can realistically be extracted from 4D seismic data, reducing the risk of over-interpretation and maximising the value of time-lapse seismic for the reservoir development.
The authors are grateful to the Azerbaijan International Operating Company (bp, SOCAR, MOL, INPEX, ExxonMobil, TPAO, ITOCHU, ONGC Videsh Limited) for providing the data and for permission to publish the results. The authors would also like to thank bp colleagues for their input and recommendations.
References
Atakishiyev, F., Sheydayev, A., Zett, A., Zavyalov, D. and Murray, L. [2020]. Integration of the temperature data for control of water injec-
tion conformance. SPE Annual Technical Conference and Exhibition, Expanded Abstracts. doi:10.2118/202522-MS.
Carcione, J.M., Helbig, K. and Helle, H.B. [2003]. Effects of pressure and saturating fluid on wave velocity and attenuation in anisotropic rocks. Geophysics, 68, 963–973. doi: https://doi.org/10.1016/S13651609(03)00016-9
Castagna, J., O’Meara, D., Cranganu, C., Ucan, S. and Batzle, M. [1999]. Rock physics basis for time-lapse seismic monitoring. 69th Annual International Meeting, SEG, Expanded Abstracts. doi: https://doi.org/10.1190/1.1820955
Choi, K., Jackson, M., Hampson, G., Jones, A. and Reynolds, T. [2007]. Impact of heterogeneity on flow in fluvial-deltaic reservoirs: Implications for the giant ACG field, South Caspian Basin. EUROPEC/EAGE Conference and Exhibition, Proceedings doi:10.2118/107137-MS.
Davenport, M., Guliyev, R., Sadikoglu, K., Gramin, P. and Adrian, Z. [2021]. Determination of residual oil saturation in a water and gas-flooded giant oil reservoir using core, conventional, and pulsed neutron logs. SPWLA 62nd Annual Logging Symposium, Proceedings. doi:10.30632/SPWLA-2021-0097.
Davies, D., Smith, P., Brown, A. and Wang, Y. [2019]. Transitioning from towed streamer to ocean-bottom seismic. 81st EAGE Annual Conference and Exhibition, Extended Abstracts. doi: https://doi. org/10.3997/2214-4609.201901586
Falahat, R., Obidegwu, D., Shams, A. and MacBeth, C. [2014]. The interpretation of amplitude changes in 4D seismic data arising from gas exsolution and dissolution. Petroleum Geoscience, 20(3), 303–320. doi: 10.1144/petgeo2014-008.
Francis, A. [2015]. Geophysics: A Simple Guide to Seismic Amplitudes and Detuning. Geo ExPro, 12(5), 68–72. https://geoexpro.com/ geophysics-a-simple-guide-to-seismic-amplitudes-and-detuning/ Gassmann, F. [1951]. Über die Elastizität poröser Medien. Vierteljahrsschrift der Naturforschenden Gesellschaft in Zürich, 96, 1–23. https://books.google.az/books?id=kkxg0AEACAAJ
Green, T., Abdullayev, N., Hossack, J., Riley, G. and Roberts, A.M. [2009]. Sedimentation and subsidence in the South Caspian Basin, Azerbaijan. Geological Society, London, Special Publications, 312, 241–260. doi:10.1144/SP312.12.
Howie, J.M., Robinson, N., Riviere, M., Lyon, T. and Manley, D. [2005]. Developing the long-term seismic strategy for Azeri-Chirag-Gunashli, South Caspian Sea, Azerbaijan. The Leading Edge, 24, 934–939. doi: https://doi.org/10.1190/1.2056406
Ibrahimov, T. [2015]. History of history match in Azeri Field. SPE Annual Caspian Technical Conference and Exhibition, Expanded Abstracts. doi:10.2118/177395-MS.
Lawrance, D., Tillotson, P., Ibrahimzade, T., Alakbarova, T., Ismayilov, N. and Cook, P. [2018]. Significant new value from 4D towed streamer monitoring at ACG. doi: https://doi.org/10.3997/22144609.201800982
Majidi, R., Abbasov, A., Aliyev, E.M., Akhundova, F. and McKidd, J. [2021]. State of Stress in Azeri-Chirag-Gunashli Anticline Structure, South Caspian Sea. SPE Annual Caspian Technical Conference, SPE-207043-MS. doi: https://doi.org/10.1190/1.2056396
Manley, D.M., Mohammed, S.F., Robinson, N.D. and Thomas, R.W. [2005]. Structural interpretation of the Deepwater Gunashli Field facilitated by 4-C OBS seismic data. The Leading Edge, 24, 922–926.
Nickel, M. and Sønneland, L. [1999]. Non-rigid matching of migrated time-lapse seismic. SEG Technical Program, Expanded Abstracts, 872–875. doi: 10.1190/1.1821191.
Reynolds, A.D., Simmons, M.D., Bowman, M.B.J., Henton, J., King, C., Rollins, J., Serebryakova, N., Sokolov, A. and Suleymanov, A. [1998]. Implications of outcrop geology for reservoirs in the Neogene Productive Series: Apsheron Peninsula, Azerbaijan. AAPG Bulletin, 82(1), 25–49. doi: 10.1306/1d9bc38b-172d-11d78645000102c1865d
Riviere, M.C., Robinson, N.D., Tough, K. and Watson, P.A. [2010]. 4D seismic surveillance over the Azeri–Chirag–Gunashli Field, South Caspian Sea, Azerbaijan. 72nd EAGE Annual Conference & Exhibition incorporating SPE EUROPEC 2010, Extended Abstracts doi:10.3997/2214-4609.201400916.

Robinson, N., Ford, A., Howie, J., Manley, D., Riviere, M., Stewart, S. and Thomas, R. [2005]. 4D time-lapse monitoring of the Chirag Field. The Leading Edge, 24, 928-932. https://doi.org/ doi:10.1190/1.2056402
Ryan, H. [1994]. Ricker, Ormsby, Klander, Butterworth – A Choice of Wavelets. Hi-Res Geoconsulting, 19(07). https://csegrecorder. com/articles/view/ricker-ormsby-klander-butterworth-a-choice-ofwavelets
Whitcombe, D.N., Connolly, P., Reagan, R. and Redshaw, T. [2002]. Extended elastic impedance for fluid and lithology prediction. Geophysics, 67(1), 63–67. doi: https://doi.org/10.1190/1.1451337
Widess, M.B. [1973]. How thin is a thin bed? Geophysics, 38, 11761180. doi: https://doi.org/10.1190/1.1440403


Exploiting the world’s remaining hotspots for oil and gas has become an even greater imperative in the current geopolitical climate. It will require all the ingenuity of geoscientists to unlock the insights required to drill in deeper waters and areas with complex geology for the hydrocarbons the world still needs during the energy transition.
Felicia Winter et al examines how integrated and iterative workflows combining modern reprocessing, rigorous AVO quality control, rock physics analysis, and seismic attribute screening can be used to assess whether amplitude fidelity improvements are both real and fit for purpose.
With discovered volumes continuing to decrease and a shrinking number of companies drilling Bob Fryklund et al explain how the global industry is adapting to the doing ‘more with less’ doctrine.
Carl Fredrik Gyllenhammar presents the results of an industry collaboration project that has analysed cuttings from all released exploration wellbores on the Norwegian Continental Shelf.
Neil Hodgson et al characterise the proven but so-far little-explored deepwater ‘Counter Regional-dip Early Drift’ (CRED) play of the South Atlantic.
Callie Bradley reviews the Cretaceous evolution of the margin and evaluates hydrocarbon prospectivity using a conjugate, segment-by-segment framework, demonstrating that although plays are regionally extensive, prospectivity is highly segmented and strongly controlled by inherited structure, sediment routing, and thermal maturity.
Mike Lakin explains why exploration of oil and gas will be needed for years to come and where to find it.
Stephen Wood et al demonstrate that mud gas analysis, when integrated with other datasets, represents a valuable tool for charge de-risking.
First Break Special Topics are covered by a mix of original articles dealing with case studies and the latest technology. Contributions to a Special Topic in First Break can be sent directly to the editorial office (firstbreak@eage.org). Submissions will be considered for publication by the editor.
It is also possible to submit a Technical Article to First Break. Technical Articles are subject to a peer review process and should be submitted via EAGE’s ScholarOne website: http://mc.manuscriptcentral.com/fb
You can find on www.firstbreak.org/guidelines the First Break author guidelines.
January Land Seismic
February Digitalization / Machine Learning
March Reservoir Monitoring
April Underground Storage and Passive Seismic
May Global Exploration
Further Special Topics may be added over the course of the year.
Felicia Winter1*, Thomas Hansen1, Robert Ruiz1 and Jon Rogers1 examines how integrated and iterative workflows combining modern reprocessing, rigorous AVO quality control, rock physics analysis, and seismic attribute screening can be used to assess whether amplitude fidelity improvements are both real and fit for purpose.
Abstract
Reprocessing legacy 3D seismic data with modern broadband imaging workflows has become a powerful tool for improving structural resolution and amplitude fidelity in frontier and mature basins alike. However, enhanced seismic detail does not automatically translate into improved exploration decisions, particularly when evaluating amplitude versus offset (AVO) and amplitude versus angle (AVA) responses calibrated to borehole data. This article examines how integrated and iterative workflows combining modern reprocessing, rigorous AVO quality control, rock physics analysis, and seismic attribute screening can be used to assess whether amplitude fidelity improvements are both real and fit for purpose.
Using case studies from offshore the Republic of Ghana, the Republic of Guinea, Sierra Leone, and Côte d’Ivoire, we demonstrate how modern broadband reprocessing, including deghosting and full waveform inversion, stabilises pre-stack seismic responses and improves well to seismic ties. We show that higher fidelity data often reveal geological complexity previously unresolved in legacy volumes, providing robust calibration using rock-physics-based AVO modelling, and that relative elastic impedance attributes enable confident discrimination between lithological and fluid-related anomalies. The results highlight that improved imaging shifts exploration uncertainty away from data quality and toward genuine geological risk, enabling more reliable AVO-driven prospect evaluation across regional seismic datasets.
Introduction
Advances in seismic processing over the past decade have fundamentally changed the value of legacy marine seismic datasets. Modern workflows incorporating full deghosting, advanced demultiple techniques and the growing suite of Full Waveform Inversion (FWI) techniques deliver seismic volumes with improved resolution, enhanced low and high frequency content and more stable amplitude behaviour across offset and angle (Araman and Paternoster, 2014; Wei et al., 2023). These
1 TGS
* Corresponding author, E-mail: Felicia.Winter@tgs.com
DOI: 10.3997/1365-2397.fb2026030
developments are particularly significant in deepwater settings, where historical acquisition geometries, streamer depths and processing limitations often compromised AVO compliance and quantitative interpretation (QI) (Rutherford and Williams, 1989; Simm and Bacon, 2014).
As a result, there is a growing expectation within exploration teams that reprocessed seismic data automatically leads to improved AVO reliability and reduced exploration risk. In practice, however, enhanced imaging and amplitude fidelity do not guarantee clearer interpretation. Revisiting exploration wells using modern reprocessing often reveals geological complexity that was previously unresolved in legacy datasets. This is valid for successful exploration wells and for dry wells, whilst for the former, situations of full basin reimagning is less often the case and, hence, this may be less apparent until further tests or developments are conducted. When seismic attributes begin to approach the level of variability observed in borehole measurements, amplitude-based interpretation can become more ambiguous rather than more straightforward.
A fundamental challenge, therefore, remains: how to distinguish genuine fluid-related amplitude responses from lithology and pore space-driven effects once data quality is no longer the dominant source of uncertainty? Without rigorous calibration, improved seismic amplitudes may simply provide a more detailed pore space-related view of subsurface variability. Whilst high resolution and high-fidelity seismic attribute analysis will be more reliable and confident regarding mapping anomalies, without calibration of these anomalies against background and brine trends or the absolute rock physics calibration at the reservoir from borehole data, ambiguity is still an inherent part of their interpretation as being fluid-related. The interpretation of such high-fidelity datasets becomes more precise, whereas the accuracy of any conclusions may have become more ambiguous and requires more context. This risk is particularly acute in settings affected by cementation, calcification or volcanic influence, where elastic contrasts between brine and hydrocarbon-filled reservoirs can be significantly reduced by calibration.
This paper addresses the above-mentioned challenge by demonstrating that improvements in seismic imaging must be accompanied by equally robust AVO quality control to be fit for purpose for exploration decision making, along with any rock physics calibration having been improved, still being required for absolute conclusions from any interpretation. We present an integrated and iterative workflow that combines modern broadband reprocessing, systematic AVO QC, rock-physicsbased AVO modelling at well locations, and impedance domain seismic attribute screening at the survey and prospect scale. Rather than treating processing, calibration and interpretation as sequential steps, the workflow emphasises continuous feedback between these elements.
Using case studies from offshore the Republic of Ghana, the Republic of Guinea, Sierra Leone and Cote d’Ivoire, spanning both mature and frontier exploration settings, we show that modern reprocessing workflows consistently stabilise pre-stack seismic amplitudes and improve well to seismic ties. However, once amplitude fidelity is assured, the dominant source of uncertainty shifts from data quality to genuine geological and rock physics variability. Through calibrated AVO analysis and relative elastic impedance attributes, we demonstrate how this complexity can be understood and leveraged, enabling more reliable discrimination between lithological and fluid-related anomalies and supporting confident, AVO-driven prospect evaluation across vast coverage seismic datasets.
The methodology applied in this study integrates four complementary elements: (1) rock-physics-driven AVO analysis at well locations, (2), modern broadband reprocessing, (3) with systematic AVO QC, and (4) seismic attribute screening using relative elastic reflectivity and impedance techniques. These elements are applied iteratively rather than sequentially, allowing insights gained at each stage to inform both processing and interpretation decisions. Figure 1 shows a schematic of such an integrated interpretation workflow.
Rock-physics-based AVO analysis at wells
Rock-physics-driven AVO analysis begins with detailed conditioning and quality control of well log data, including compressional and shear velocities, density and petrophysical interpretations. Borehole and acquisition conditions corrections
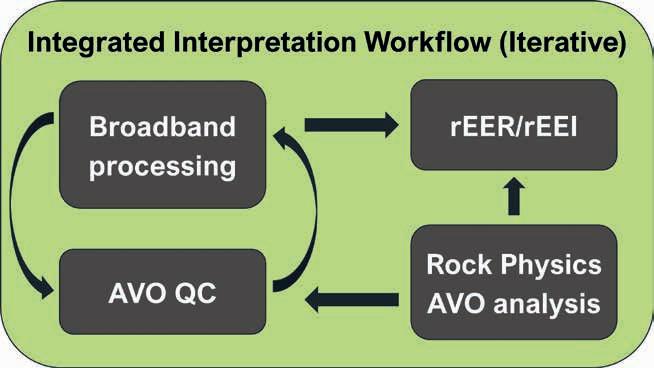
and log editing are performed prior to integrating available core, cuttings and mineralogical information. This step is essential, as AVO responses are highly sensitive to subtle variations in elastic properties and pore space characteristics (Avseth et al., 2010; Simm and Bacon, 2014).
Petrophysical models are constructed to estimate mineral volumes, porosity and fluid saturation, which are then translated into calibrated rock physics models. These models allow elastic properties to be perturbed systematically, enabling the simulation of geological scenarios and the evaluation of their impact on AVO response. Forward modelling of brine, oil and gas cases provides critical insight into the expected separation of fluid effects from lithological variations in intercept-gradient space for the presented reservoir properties (Rutherford and Williams, 1989; Went, 2021).
This approach highlights situations where nonfluid effects, such as cementation, calcification or volcanic influence, significantly reduce Vp/Vs contrast and narrow the separation between brine and hydrocarbon responses. Seismic AVO anomalies in these settings can be ambiguous and to avoid misinterpretation, such calibration provides awareness of these special cases.
Broadband reprocessing and full waveform inversion
Broadband signal recovery is a prime objective of modern seismic reprocessing, as improved bandwidth directly impacts both vertical resolution and amplitude stability across offset and angle. Deghosting removes spectral notches caused by interference between primary and ghost reflections at the source and receiver, enabling recovery of both low and high frequency energy (Rickett et al., 2014). This broader effective bandwidth improves wavelet stability and enhances the interpretability of amplitude versus offset behaviour, particularly at higher angles where legacy data often suffer from bandwidth loss and phase instability.
Equally critical to amplitude fidelity is the treatment of multiple energy. Surface-related and interbed multiples can interfere constructively or destructively with primary reflections, leading to artificial amplitude dimming, brightening or apparent AVO effects that are unrelated to lithology or fluid content. In the context of AVO and AVA analysis, incomplete multiple attenuation is particularly problematic, as residual multiple energy tends to increase with offset and can bias intercept-gradient relationships. Modern demultiple workflows, including high-resolution radon-based techniques, convolutional and wave-equation multiple modelling approaches, are therefore applied prior to imaging to ensure that amplitude variations observed in prestack data are dominated by primary reflections. The effectiveness of demultiple is assessed as part of the AVO quality control workflow through near, mid and far angle spectral consistency, near-far correlation analysis and inspection of amplitude decay with offset. By reducing multiple contamination prior to migration, demultiple processing contributes directly to improved AVO stability and more reliable calibration between seismic and well-based AVO models.
FWI further enhances amplitude fidelity by improving the subsurface velocity model using the full recorded wavefield. Compared to conventional tomography, FWI provides a more
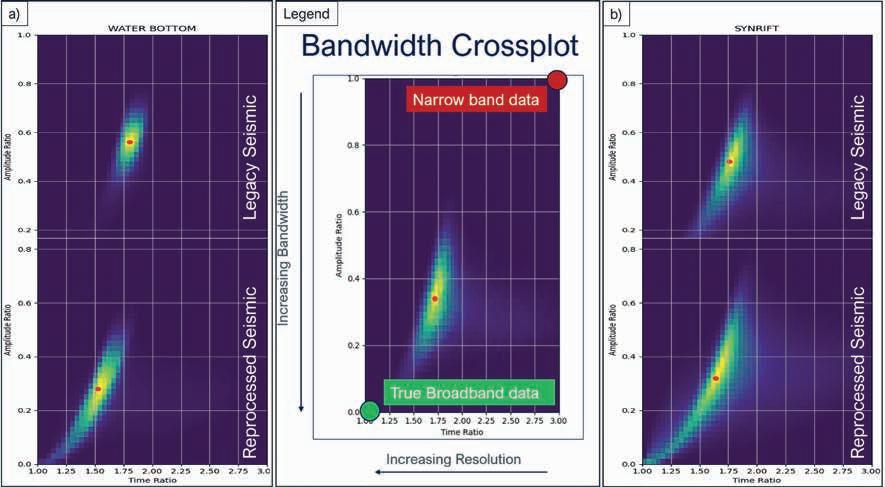
accurate description of lateral and vertical velocity variations, resulting in improved imaging, better event focusing and more consistent amplitude behaviour across offsets (Sirgue et al., 2011; Warner et al., 2013; Wei et al., 2023).
The combined application of demultiple, deghosting and FWI produces seismic gathers with stabilised moveout and phase, forming a robust foundation for subsequent AVO analysis and impedance domain attribute generation. The resulting improvement in amplitude consistency is observed not only at well locations but across the entire survey, supporting reliable screening for AVO anomalies. The impact of broadband recovery is illustrated by bandwidth cross-plots and spectral comparisons at key stratigraphic levels, which demonstrate significant uplift relative to legacy processed data in an example from offshore Sierra Leone (Figure 2).
AVO quality control
Figure 2 Bandwidth crossplot example of deghosted and FWI reprocessed data bandwidth recovery by comparing to the legacy 3D full-stack offshore Sierra Leone. The uplift is demonstrated at different stratigraphic levels, such as seabed (a) and top synrift (b).
Systematic AVO QC is essential to demonstrate that amplitude fidelity improvements are real and robust. QC metrics include spectral analysis on near, mid and far stacks; instantaneous phase stability; near-far correlation and time shifts; signal-to-noise estimates; and bandwidth evaluation at multiple stratigraphic levels (Araman and Paternoster, 2014). When multiple legacy surveys are combined, these metrics provide quantitative indicators of how acquisition differences have been reconciled during reprocessing.
Additional QC steps include well-to-seismic tie analysis, amplitude decay studies, and stability testing of AVO responses through successive processing and velocity model building iterations. These QC measures are critical to demonstrating that the seismic dataset is fit for purpose for quantitative interpretation.
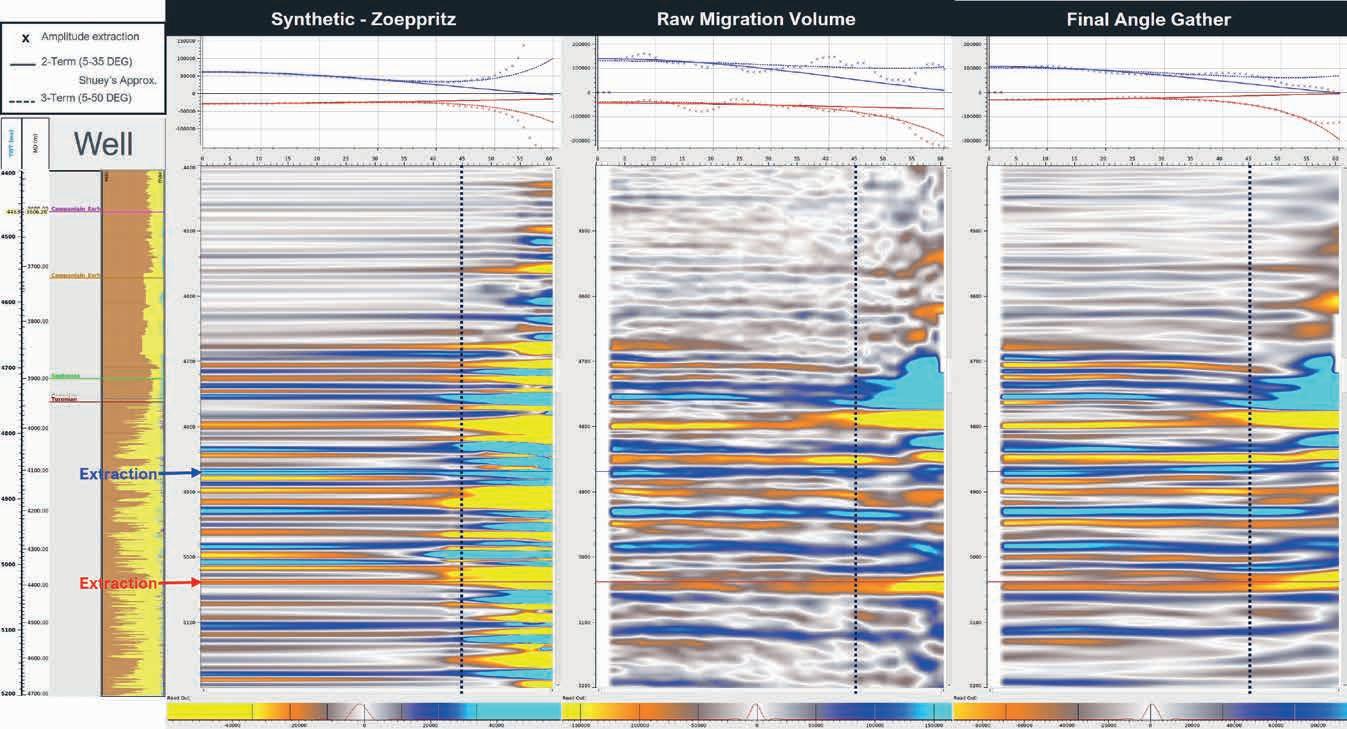
Figure 3 shows the AVO stability between the raw and final migrated volumes offshore Sierra Leone.
Relative elastic reflectivity and impedance (rEER / rEEI)
Direct comparison between forward-modelled AVO responses and pre-stack seismic data is often hindered by noise, imperfect wavelet estimation and residual moveout errors, particularly at far offsets. To mitigate these effects, reflectivity angle stacks are transformed into impedance domain using relative extended elastic reflectivity (rEER) and relative extended elastic impedance (rEEI) techniques (Went and Hedley, 2023; Harris and Young, 2024).
By inverting reflectivity into impedance using a flat background model, wavelet effects are minimised and stability is improved. This allows anomalies to be evaluated without reliance on low-frequency models derived from wells and enables efficient screening of 3D seismic volumes across large areas. Figure 4a illustrates the transformation of angle-dependent reflectivity into impedance domain and the corresponding intercept-gradient representation used to compare seismic responses with rock-physics-based forward models. Figure 4b shows impedance anomalies evaluated on a cross-plot, illustrating how lithological effects can overlap fluid responses using an example from the Gulf of America.
The geophysical validity of using the rEER and rEEI methodology in clastic basins globally away from borehole control has been successfully tested in the past and proven. In the case of the Isabella field, anomalous seismic amplitudes may have had indications on the full stack response, whilst on the inverted rEEI at 45ºθ or 27ºχ attribute cube, the anomaly is prominent and correlates to the 35-m oil column of the Isabella discovery (Went and Hedley, 2023).
To demonstrate the benefit of the integrated AVO analysis workflow we showcase the different stages across several studies from offshore West Africa. The first part focuses on studies from offshore the Republic of Ghana and the Republic of Guinea, to illustrate how amplitude-based interpretation is non-unique when faced with geological complexities such as anomalous mineralogical effects in the clastic pore space, even when modern seismic data are available. Whilst the mapping of the seismic amplitudes is valid and correct on fit-for-purpose data sets, the conclusions drawn from that interpretation can be ambiguous, and these first examples motivate the need for an integrated workflow that
combines rock physics calibration, AVO quality control and impedance domain attribute analysis. The second part of the section establishes how such an integrated approach, when applied after successful AVO QC of the input data sets, can confirm and validate interpretation from seismic attributes by correlating with rock-physics-based AVO analysis from available borehole data, using examples from Sierra Leone and Côte d’Ivoire.
Geological complexity in a mature basin: Republic of Ghana
The Tano Basin offshore the Republic of Ghana, a well-known world-class prolific basin, provides an abundance of large- and small-scale geophysical data sets and, therefore, good control on the subsurface evaluation. The case study, however, provides a contrasting example from this mature deepwater siliciclastic province with extensive well control and established AVO calibration. In clean, well-sorted reservoir sands, well-based rock physics modelling and synthetic-to-seismic ties demonstrate predictable AVO behaviour. Brine-filled sands exhibit hard fullstack responses, while oil and gas-filled equivalents are expected to appear progressively softer in Vp/Vs space (Figure 5a). In partially calcified sands, fluid substitution modelling still enables separation between wet and oil-filled reservoirs, and corresponding seismic anomalies can be confidently mapped (Figure 5b).
Despite this strong calibration framework, the Ghana case also illustrates the limits of amplitude-based interpretation once geological complexity increases. In proximity to volcanic extrusives and associated diagenetic alteration, pore space modification due to calcification, dolomitisation and pyrite enrichment significantly reduces elastic contrasts. Rock physics modelling shows that brine, oil and gas-filled sands cluster tightly in intercept–gradient space, producing class III or class IIp behaviour with limited fluid discrimination (Figure 5c and Figure 5d). Although seismic anomalies remain visible on full-stack and partial angle data, their diagnostic value may well be out of context when the reservoir quality and mineralisation change significantly. This example demonstrates that even in a mature basin, improved seismic fidelity can expose geological controls that complicate AVO interpretation rather than simplifying it. In which case, the additional step of calibrating the seismic AVO responses to reservoir mineralogy and pore space characteristics places the mapped anomalies into the specific geological context of their reservoir provenance and depositional setting.
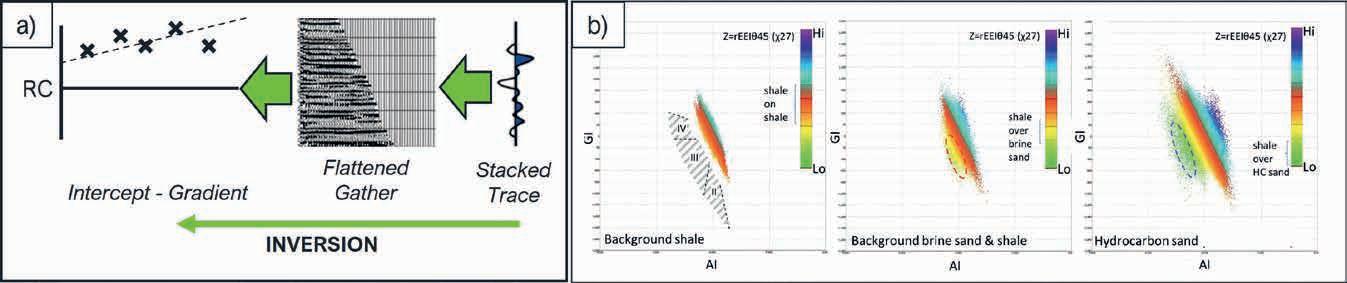
Figure 4 Went and Hedley (2023) have previously showcased a) the workflow of inverting from reflectivity post-stack data back to impedance domain, which can be visualised as relative extended elastic volume in rotated impedance domain, or in intercept and gradient cross-plots, and b) impedance anomalies from the seismic attribute volumes and how to evaluate them in the cross-plot space (modified from Went and Hedley, 2023).
The offshore Republic of Guinea represents a frontier exploration setting characterised by sparse well control and elevated geological uncertainty. Counterintuitively, this case study shows how the localised and great detail of borehole data and its analysis does pose a valuable benefit in an underexplored
basin for drawing the right conclusions on fairway mapping early. Historical wells drilled in 1977 and 2011 confirm the presence of reservoir sandstones at several stratigraphic levels, encouraging interpretation of fanlike seismic features as potential additional hydrocarbon targets (Figure 6a). On seismic data, these features exhibit soft amplitude responses
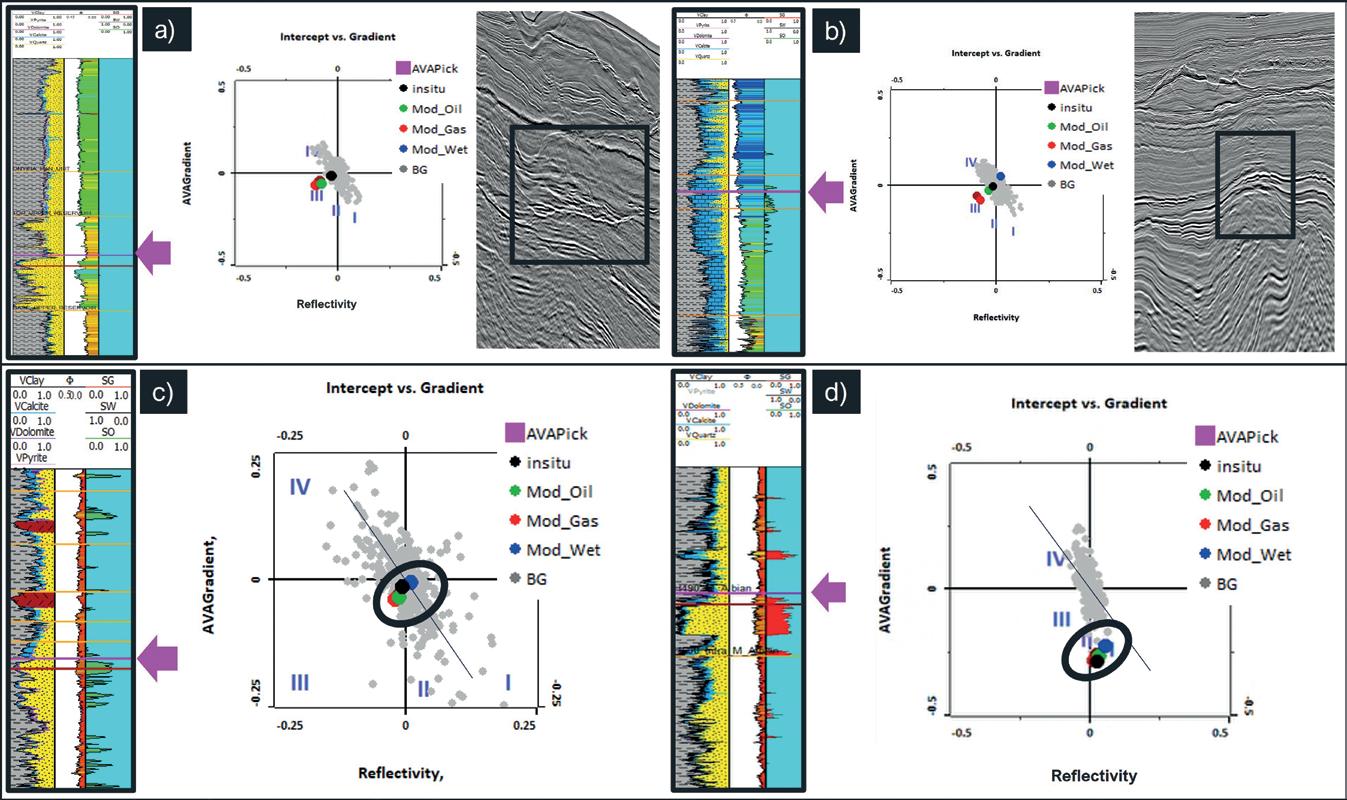
Figure 5 In the Ghana Tano Basin the AVO at wells shows hydrocarbon and brine responses separating nicely as shown in the following examples. a) A dry well with good reservoir quality: the in situ brine anomaly from the well Vp/Vs as expected does not display an additional anomaly over the hard top fairway on the seismic full stack. b) An oil show in a calcareus sequence plots as oil anomaly on the well and has a potential soft anomaly on seismic over the trap. But even in this well-understood basin, when looking at wells in the vicinity of the transform ridge, pore space alterations due to pyrite and dolomite associated with extrusives in the system reduce the spread between modelled brine, oil and gas anomalies on the cross-plot like in well c) where due to the lower reservoir porosities, compared with the previous examples, the amplitude difference become so narrow that any anomaly on the seismic data will be hard to differentiate from the background lithological response, whether it corresponds to a class III or class IIP as in well d).
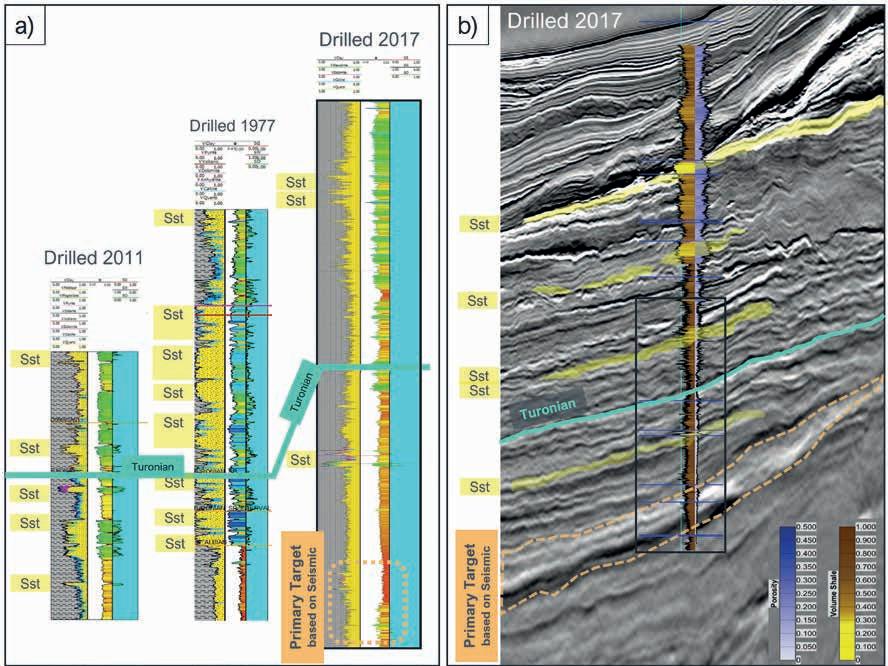
Figure 6 Wells offshore the Republic of Guinea show reservoir sandstones deposited at several stratigraphic levels. Despite the pre-drill model of the 2017 well with a primary target interpreted on seismic 3D as soft response sands, indicating possible hydrocarbon charge, this sequence did not drill sandstone. a) Wells from 1977 and 2011 justified interpreting sands in the Ceno-Turonian sequence. b) Porosity and volume of clay interpreted on the 2017 well clearly show that the soft fan response of the primary target corresponds to a low-compaction silty clay.
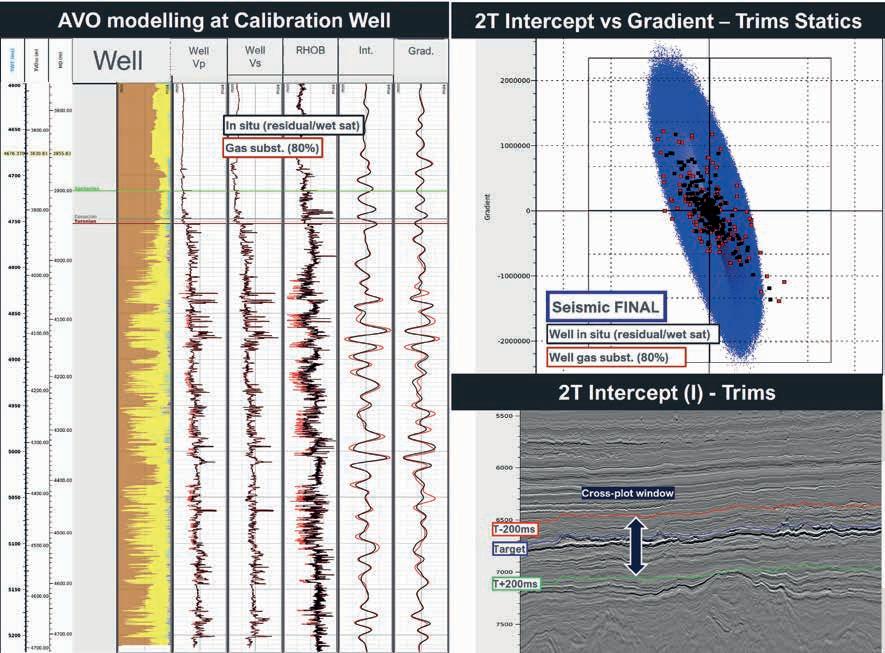
Figure 7 Offshore Sierra Leone, the quality control of Vp/Vs consistency across angles by AVO analysis at calibration well location. With the 2-term Shuey’s intercept gradient cross-plot of the final seismic 3D full stack plotted against the calibration well synthetics, in situ Vp/Vs, and fluid substitution for a gas-filled reservoir at that location with these rock properties in the sequences shows a stable response. The well sits at around 2.1 km of water depth with the target sequence around 2 km TVD bml. The undrilled prospect on the same reprocessed volume sits at around 1.6 km bml. Synthetic modelling shows limited discrimination between the wet and gas saturated case, although the intercept attribute is relatively more sensitive to fluid effects.
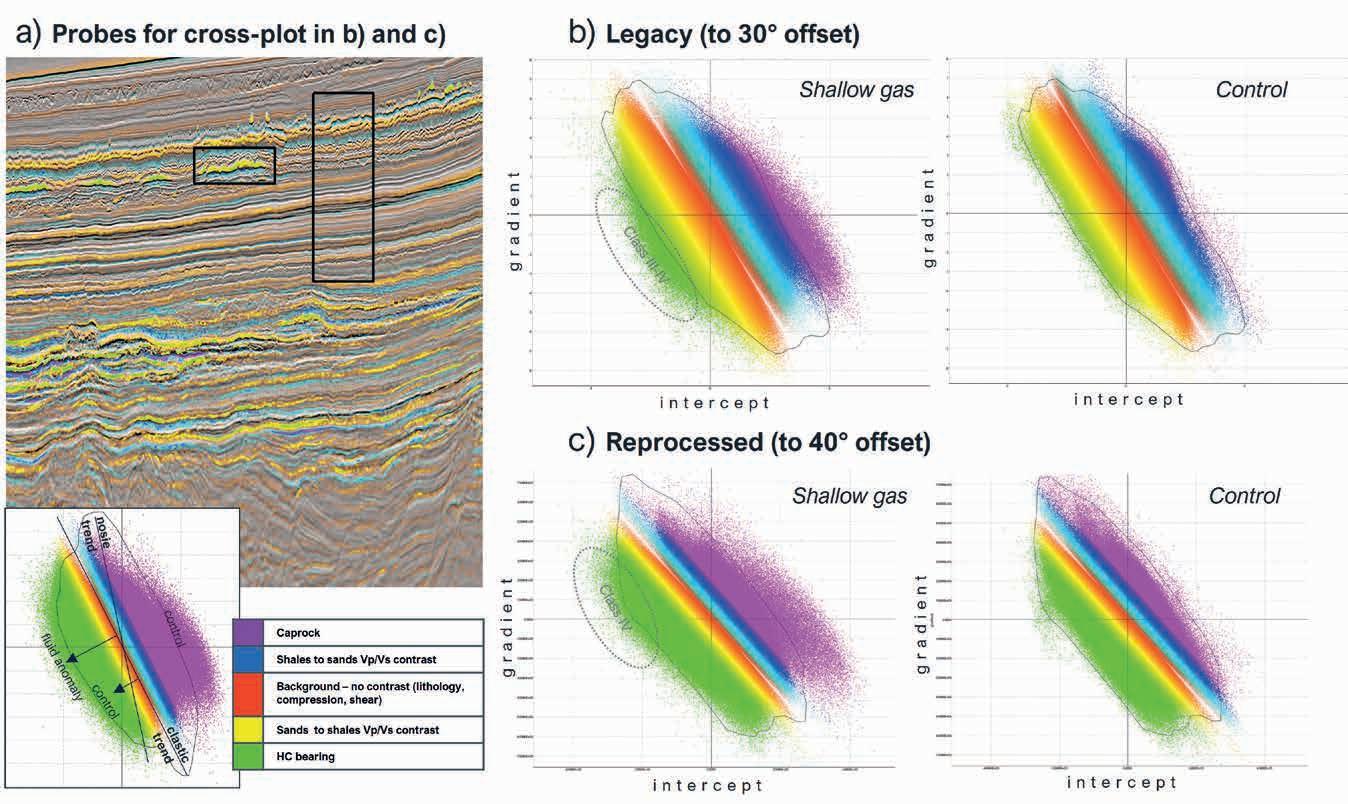
Figure 8 a) Shallow gas offshore Sierra Leone as marked on the seismic section with the rEER overlay on reprocessed full-stack depth to time domain has been evaluated alongside a control probe over shale/clastics. The cross-plot of intercept vs. gradient over both those probes does show an anomaly, on the legacy data set (b) as an indiscernible class III-IV, whereas on the reprocessed depth to time ultrafar angle stacks the anomaly seems to clearly move to a class IV anomaly (c).
that are consistent with predrill expectations for charged turbidite sands.
However, detailed post-drill analysis of the 2017 well shows that such amplitude responses are not uniquely diagnostic of hydrocarbon presence. Rock physics and petrophysical evaluation show that cementation, low compaction and elevated clay content can generate elastic responses that closely mimic those expected from hydrocarbon-filled sands. In the key example shown in
Figure 6b, a prominent pre-drill seismic anomaly corresponds to a silty clay interval rather than a reservoir sand. This case highlights the risk of interpreting amplitude anomalies in frontier basins without robust understanding of the rock physics. Be it on the rEEI reliably calibrating a suspected fluid anomaly with a brine and background response probe, or the robust borehole rock physics calibration of the reservoir level of interest. This demonstrates that improved seismic imaging alone is insufficient
to resolve lithology-fluid ambiguity if not put into the context of the basin-specific mineralogical and depositional processes. This case highlights the critical role of rock-physics-based calibration in frontier basins, and how beneficial it is when being able to differentiate clastic systems and how AVO anomalies like this are key to derisking the prospectivity in this underexplored area.
Together, the Ghana and Guinea examples establish the central motivation for this study: once amplitude fidelity improves, the dominant source of uncertainty shifts from data quality to geological and rock physics variability, requiring an integrated interpretation approach.
Integrated workflow validation during reprocessing: Sierra Leone
Offshore Sierra Leone provides a clear example of how an integrated workflow can be used to establish amplitude fidelity and support reliable AVO interpretation. Legacy 3D seismic data were reprocessed in 2025 using modern broadband workflows incorporating deghosting, advanced demultiple and FWI-based velocity model-building. Systematic AVO quality control demonstrates stabilised pre-stack amplitudes across offset and angle, with consistent Vp/Vs behaviour observed once reprocessing was complete (Figure 7).
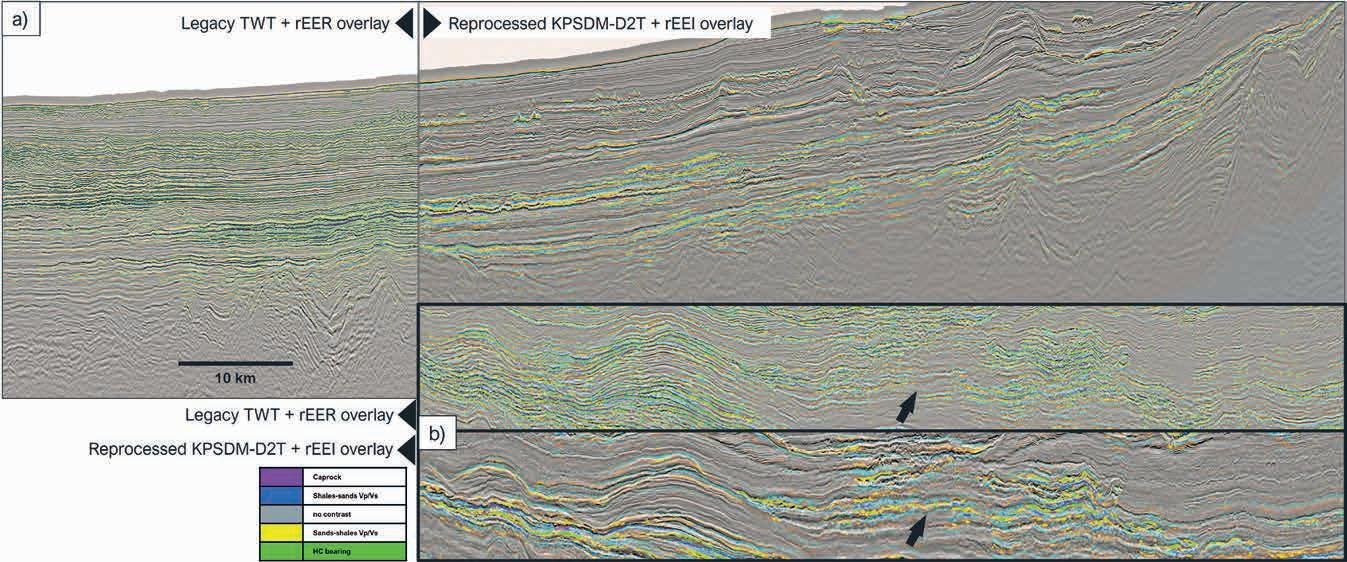
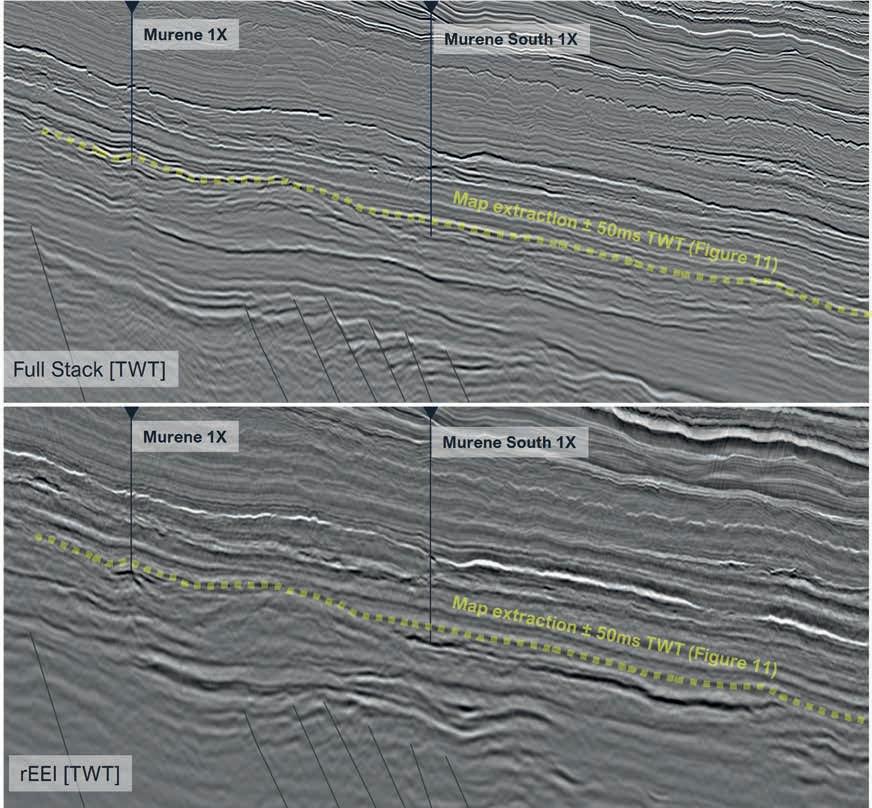
Offshore Cote d’Ivoire, comparing the full stack section
with the rEEI attribute (bottom) over the 2025 and 2026 discoveries shows that the target can confidently be mapped in the relative impedance space.
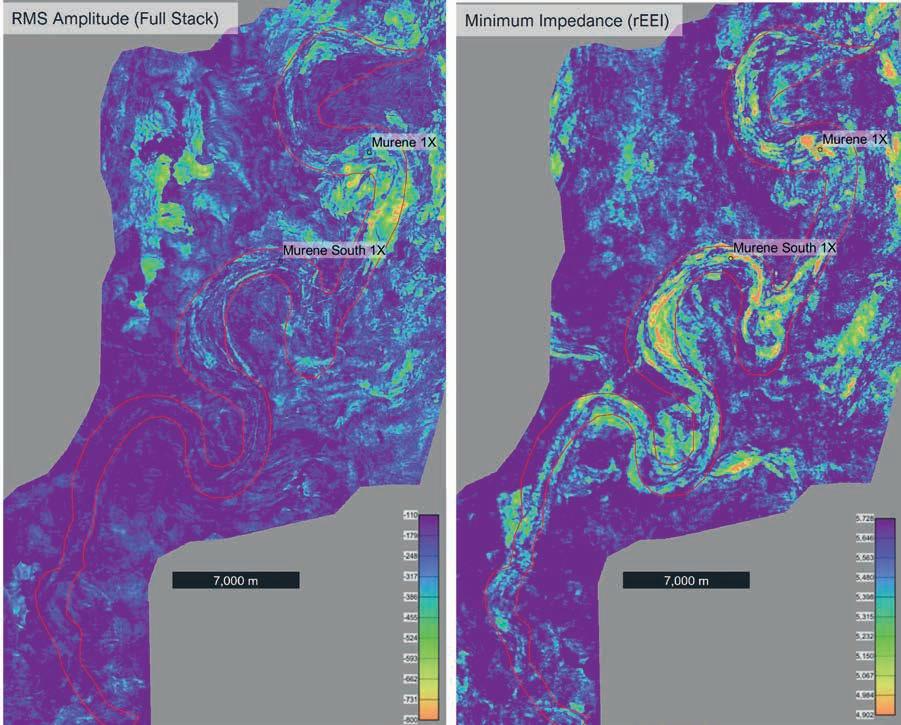
Shallow gas accumulations provide an independent validation case. On legacy seismic data, these anomalies are ambiguous and difficult to classify in intercept-gradient space. After reprocessing, the same events display consistent class IV behaviour on partial angle stacks and impedance domain attributes (Figure 8). Near-far correlation, spectral consistency and intercept-gradient stability confirm that the observed amplitude behaviour is controlled by subsurface elastic contrasts rather than processing artefacts. Importantly, the improvement is not restricted to well locations: enhanced continuity and consistency of seismic facies and impedance attributes are observed across the survey (Figure 9), demonstrating that the dataset is fit for purpose for regional AVO analysis.
Basin-wide application and scouting: Côte d’Ivoire
The Côte d’Ivoire example illustrates how the integrated workflow can be applied predictively across multi-sensor 2018 seismic data set as a regional scouting tool once amplitude fidelity and calibration principles are established. In this setting, in some sequences the channelised clastic reservoirs exhibit a low impedance contrast relative to surrounding mudstones, resulting in a subtle or absent expression on full-stack seismic data (Figure 10). After confirming AVO stability across offsets, the seismic data was transformed into impedance space using relative extended elastic impedance (rEEI) attributes.
The impedance domain reveals the fairway geometry, depositional architecture and internal heterogeneity of the channel complex clearly in comparison to conventional amplitude extractions (Figure 11). Fluid-related anomalies and reservoir continuity that are not discernible on full-stack data become evident in rEEI space, enabling confident mapping of the Calao channel complex and identification of additional leads in the Cenomanian and Turonian intervals. This case study not only demonstrates how rEEI attributes provide a practical bridge between well-scale
Figure 11 Offshore Côte d’Ivoire, comparing the RMS amplitude extraction from the full stack (left) with the absolute minimum extraction of the inversion (right) demonstrates the successful mapping of the Calao channel complex on the latter, which is not possible on the full stack.
rock physics understanding and regional exploration screening in areas of limited well control, but also how targets can be feasibly mapped once the AVO robustness on the seismic volumes is established. Specifically, to further calibrate targets in the Turonian and Cenomanian for reservoir-specific geophysical responses, further traps within this particular reservoir fairway can be identified in addition to the borehole locations.
The West African case studies demonstrate that modern broadband seismic reprocessing fundamentally changes the nature of AVO and AVA interpretation. While advances such as deghosting, demultiple and full waveform inversion (FWI) consistently improve pre-stack amplitude stability and bandwidth, enhanced data quality does not automatically lead to simpler or less ambiguous interpretation. Instead, improved imaging often reveals geological complexity that was previously unresolved in legacy datasets, shifting the primary source of uncertainty from data quality to subsurface geology and rock physics variability.
Across all basins examined, systematic AVO quality control is shown to be essential for establishing whether reprocessed seismic data are fit for purpose for quantitative interpretation. Metrics such as spectral consistency, near-far correlation and intercept-gradient stability provide objective evidence that the assumptions underlying AVO theory are satisfied. Once this compliance is demonstrated, residual ambiguity in amplitude behaviour can no longer be attributed primarily to processing artefacts and must instead be interpreted in terms of lithology, reservoir quality, diagenesis and pore space evolution.
The examples from offshore the Republic of Guinea and the Republic of Ghana illustrate why this distinction is critical. Most clearly shown in the mature Tano Basin offshore Ghana, which is well calibrated, are the textbook AVO responses in
clean sands with high contrast, where increasingly ambiguous behaviour observed near volcanic extrusives points to pore space modification significantly reducing elastic contrasts between brine, oil and gas-filled reservoirs. In the frontier basins of the Guinea Plateau, detailed rock-physics is providing crucial input for early fairway understanding. Post-drill analysis reveals that cementation and clay-rich lithologies can produce synthetic reflectivity responses that closely mimic those of porous or hydrocarbon-charged sands. In this context, modern imaging does not ‘fail’ but instead provides the opportunity to correctly reclassify seismic facies once borehole data are integrated. In both cases, modern seismic imaging does not ‘fail’; rather, it exposes geological controls that must be explicitly accounted for to avoid misinterpretation of amplitude anomalies.
The Sierra Leone and Côte d’Ivoire case studies demonstrate how an integrated interpretation workflow successfully manages increased subsurface complexity and translates improved data fidelity into exploration value. In Sierra Leone, modern reprocessing combined with rigorous AVO QC establishes a robust foundation for interpretation, validated by shallow gas accumulations in relative elastic reflectivity (rEER) that evolve from ambiguous responses on legacy data to consistent class IV behaviour on reprocessed partial angle attributes. Importantly, these improvements extend beyond individual well locations, supporting reliable regional screening with confidence in amplitude fidelity.
In Côte d’Ivoire, impedance domain attributes such as relative extended elastic impedance (rEEI) provide an effective bridge between well-scale rock physics understanding and regional exploration scouting. By reducing sensitivity to wavelet effects and evaluating seismic responses in a domain closely linked to intercept-gradient behaviour, these attributes enable subtle reservoirs and fluid effects to be mapped where conventional full-stack amplitudes are insufficient. This demonstrates the practical value of integrated workflows in areas of limited well control and subtle impedance contrast.
Taken together, the case studies show that modern imaging workflows fundamentally shift the focus of exploration uncertainty. Legacy seismic data often masked geological complexity through limited bandwidth, unstable amplitudes and incomplete offset coverage, resulting in seemingly cleaner data but ultimately masking key risks associated with reservoir quality, diagenesis and pore space evolution, potentially leading to misinterpretations. Modern broadband reprocessing removes many of these limitations, producing datasets that are demonstrably fit for purpose from a geophysical perspective but more sensitive to geological variability. Integrated and iterative interpretation workflows provide a structured and scalable approach to recognising this shift and to derisking exploration decisions. Ultimately, modern imaging does not simplify the subsurface; it reveals it more accurately. Where borehole and modern seismic data may independently provide a more precise interpretation, interpreting with renewed accuracy is only feasible
by adopting integrated workflows early and iteratively, rather than treating them as a post-processing validation step. Exploration teams can leverage improved seismic fidelity to better understand geological complexity, place amplitude anomalies in their correct context, and make more informed, risk-aware exploration decisions.
We would like to thank our clients, partners and governments, namely Ghana National Petroleum Company (GNPC), Société Nationale des Pétroles de Guinée (SONAP), Petroleum Directorate Sierra Leone (PDSL), and Nationale d’Opérations Pétrolières de Côte d’Ivoire (PETROCI), for permission to publish these data and workflows.
Araman, A. and Paternoster, B. [2014]. Seismic quality monitoring during processing. First Break, 32, 69-78.
Avseth, P., Mukerji, T., Mavko, G. and Dvorkin, J. [2010] Rock Physics Diagnostics of Depositional Texture, Diagenetic Alterations, and Reservoir Heterogeneity in High porosity Siliciclastic Sediments and Rocks — A Review of Selected Models and Suggested Workflows. Geophysics, 75, A31-A47.
Harris, P. and Young, K. [2024]. Relative inversion for extended elastic impedances. Fourth International Meeting for Applied Geoscience & Energy, Paper No: image2024-4094168.1, pp. 31-35.
Rickett, J.E., Manen, D.J., van Loganathan, P. and Seymour, N. [2014]. Slanted-streamer Data-adaptive Deghosting with Local Plane Waves. 76th EAGE Annual Conference and Exhibition, Extended Abstracts
Rutherford, S. and Williams, R. [1989]. Amplitude-versus-Offset Variations in Gas sands. Journal of Geophysics, 54, 680-688.
Simm, R. and Bacon, M. [2014]. Seismic Amplitude: An Interpreter’s Handbook. Cambridge University Press.
Sirgue, L., Barkved, O.I., Dellinger, J., Etgen, J., Albertin, U. and Kommedal, J.H. [2010]. Full waveform inversion: the next leap forward in imaging at Valhall. First Break, 28, 65-70.
Warner, M., Ratcliffe, A., Nangoo, T., Morgan, J., Umpleby, A., Shah, N., Vinje, V., Štekl, I., Guasch, Ll. Win, C., Conroy, G. and Bertrand, A. [2013]. Anisotropic 3D full-waveform inversion. Geophysics, 78(2), 59-80.
Wei, Z., Mei, J., Wu, Z., Zhang, Z., Huang, R. and Wang, P. [2023]. Pushing seismic resolution to the limit with FWI imaging. The Leading Edge, 42(1), 24-32.
Went, D. [2021]. Interpreter‘s Corner: Practical application of global siliciclastic rock-property trends to AVA interpretation in frontier basins. The Leading Edge, 40(6), 454-459.
Went, D., Hedley, R. and Rogers, J. [2023]. Screening for AVA Anomalies in Siliciclastic Basins: Testing a Seismic Inversion Method in the Mississippi Canyon, Gulf of Mexico. First Break, 41(9), 75-81.
Went, D., Rogers, J. and Winter, F. [2024]. Seismic rock properties and their significance for the interpretation of seismic amplitude variation with angle (AVA), offshore Liberia and Sierra Leone. First Break, 42(11), 43-48.


the QR code


With discovered volumes continuing to decrease and a shrinking number of companies drilling Bob Fryklund1*, Clare Barker-White1 and Keith King1 explain how the global industry is adapting to the doing ‘more with less’ doctrine.
Since 2019, the industry has re-entered a new lower plateau in exploration drilling, with around 400 new field wildcats spudded in 2025. Moreover, the number of companies doing the drilling continues to shrink, with less than 100 companies responsible for these 400 new field wildcats. And perhaps more importantly, the industry has lost the small to mid-sized independents who drove frontier exploration. The results have been annually discovered volumes of 10 billion boe. All the while companies, both international oil companies (IOC’s) and national oil companies (NOC’s), face declining reserves and inadequate reserve replacement. Additionally, the industry continues to face a declining number of professionals in exploration. It all adds up to companies having to do more with less.
New exploration strategies
The ‘more with less’ doctrine has resulted in companies revising their exploration strategies with new exploration strategies focusing on compressing the exploration cycle (prospect generation to block award to discovery and first production). The race is on for faster workflows, greater cost efficiency, and reduced risk. Along the road to success, a series of different strategies are evolving, split between those that focus on proven basins and those who choose frontier basins. This is leading to a set of breakaway companies, challengers, and laggards. The breakaway companies, typically global integrated companies (GIOC’s), are best at not just capturing significant resources but also best at converting them into dollars. They leverage a concept of planning
for success based on deliverability, commerciality, and scale. The breakaway companies also are leveraging massive computing power and AI. Challengers, mainly national oil companies, are rapidly enhancing their capabilities and competing directly with breakaway companies for acreage, assets, and market share. Laggards are companies undergoing an upstream or exploration reset, often because of shifting their expertise towards low-carbon businesses. Many are now building new portfolios through a mix of field redevelopment and exploration, but in exploration they frequently are late entrants to emerging and frontier basins. As a result, we expect exploration spending and wildcat wells will recover only modestly, remaining well below the highs of the last super-cycle.
Leasing activity for the last two years has begun to ramp up, particularly by the global integrated majors. But the increase so far has resulted only in a small pick-up in 3D seismic and no pick-up in drilling (Figures 2 and 3).
The battleground for resources is dominantly offshore and ranges across the globe as shown on the map below (Figure 4). Broadly speaking, the companies focus on gas from Asia, North Africa and the Eastern Mediterranean and liquids from the Western hemisphere, S. Atlantic, Norway and the Middle East.
Basins are selected by above ground and below ground criteria – scale of the potential and the ability to convert discoveries quickly to production; presence of multiple play/ prospect types;
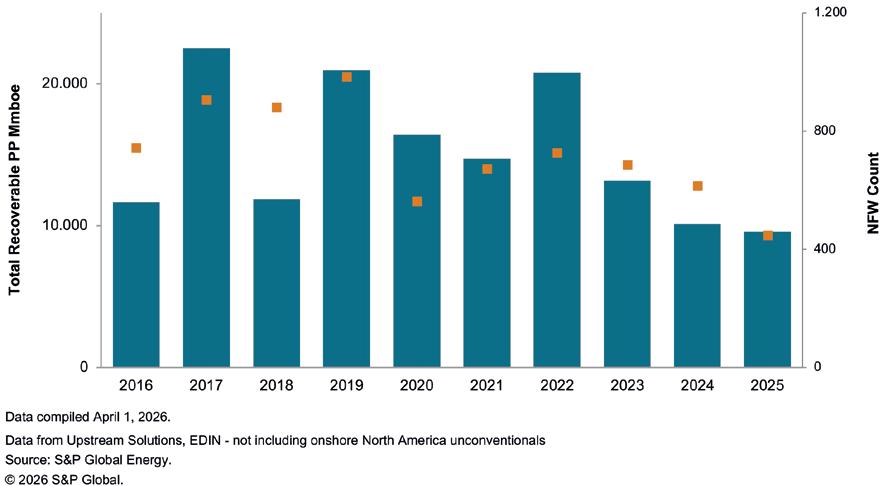
1 S&P Global Energy
* Corresponding author, E-mail: bob.fryklund@spglobal.com
DOI: 10.3997/1365-2397.fb2026031
Figure 1 Global annual discovered volumes and NFW count (2016-2025).
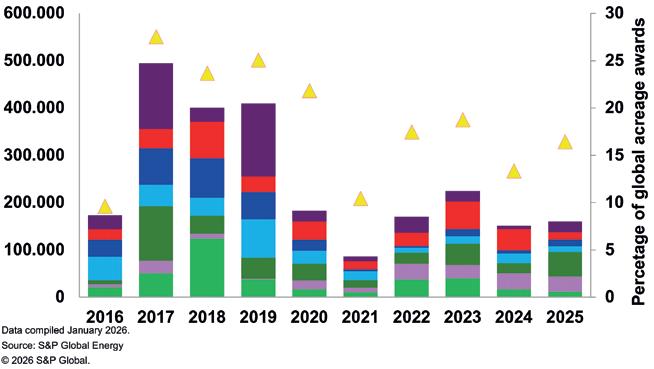
competitive fiscal terms with clear, stability clauses protecting investors; and proximity to markets.
This more selective approach will make it difficult for many countries – especially those without a proven petroleum system – to attract investment. In response, contractual terms offered by many governments have been shifting in favour of explorers. This is particularly true in older petrostates which face diminishing revenue from declining production. More than 40 countries are offering opportunities this year. Given the lacklustre results in some bid rounds, further concessions are likely necessary as countries compete for scarce capital. In addition to bid rounds, there is an increasing use of Memorandum of Understanding (MOUs) and technical study agreements by several of the majors to stretch their exploration dollars and get an exclusive look at prospective areas. This allows operators to quickly make go/ no-go decisions and concentrate on areas of greatest prospectivity. This is a model for wider industry adoption.
The global hunt for hydrocarbons is entering a new phase, with discoveries increasingly concentrated in a handful of basins. Despite a broader slowdown in exploration activity, the industry’s
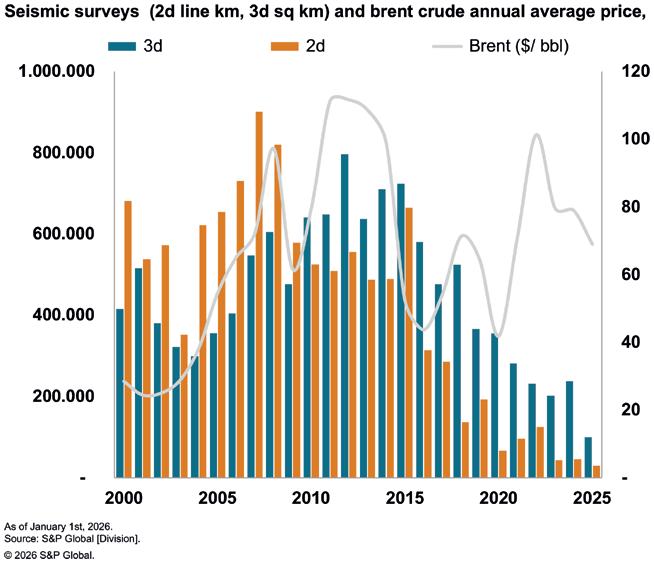
appetite for high-quality acreage and frontier basins remains strong. Over the past five years, just five basins have accounted for more than 40% of total global volumes, and the top three have delivered resource replenishment largely from deepwater and ultra-deepwater plays. This marks a decisive shift toward focused and often technically demanding, high-reward frontier environments — where innovation and precision are redefining exploration success.
The stage is set for another standout year in 2026, with more than 40 high-impact wells (HIWs) planned across 37 basins worldwide, building on 2025 when just 12 HIWs delivered, nearly half of all discovered volumes. Most of these planned wells will be spudded offshore, with two-thirds targeting deepwater and ultra-deepwater terrains. The spotlight shines on regional hotspots such as the South Atlantic basins, the emerging Eastern Mediterranean, and the untapped potential of the Asia-Pacific.
While fewer than a quarter of HIWs will aim to open new basins and plays, many are set to build on the success of proven frontiers and unlock large resource potential. In the South Atlantic, the focus remains firmly on Cretaceous play delivery and basin-scale developments, marking a shift from isolated discoveries to integrated, multi-field growth. In basins like Orange, operators are moving from proof-of-concept to basin expansion, continuing their pursuit of large-scale resource delivery.
Additionally, a select group of wells will venture into dormant and recently stagnant basins, where fresh licensing rounds and cutting-edge technology are poised to breathe new life into overlooked areas — rekindling proven potential and jump-starting progress where activity has long been on hold. Regionally important wells (RIWs) will also play a pivotal role, with key appraisal and new pool exploration set to unlock resources across major basins worldwide.
Deepwater exploration has set the pace, and this has been accompanied by another game changer with the industry’s pivot to mapping Cretaceous reservoirs — especially across the South Atlantic conjugate basins — where high technical success rates are driving a surge in transformative discoveries. Sub-Saharan Africa’s Cretaceous plays, for example, boast success rates above 52%, far outstripping equivalent Tertiary and Quaternary plays at 33%. The South Atlantic’s Cretaceous successions — featuring thick basinal-marine clastic deposits and high-quality pre-salt carbonate formations — have repeatedly delivered multi-billion-barrel systems across conjugate margin basins. This region stands out as one of the world’s most reliable sources of large, advantaged discoveries, and it’s a focal point for both recent and upcoming HIW drilling.
Recently tested frontier regions like Namibia, Brazil, and Guyana are proving their mettle, with cross-border play continuity and prospectivity now being tested across national boundaries. Meanwhile, mature basins are revealing untapped, deeper play
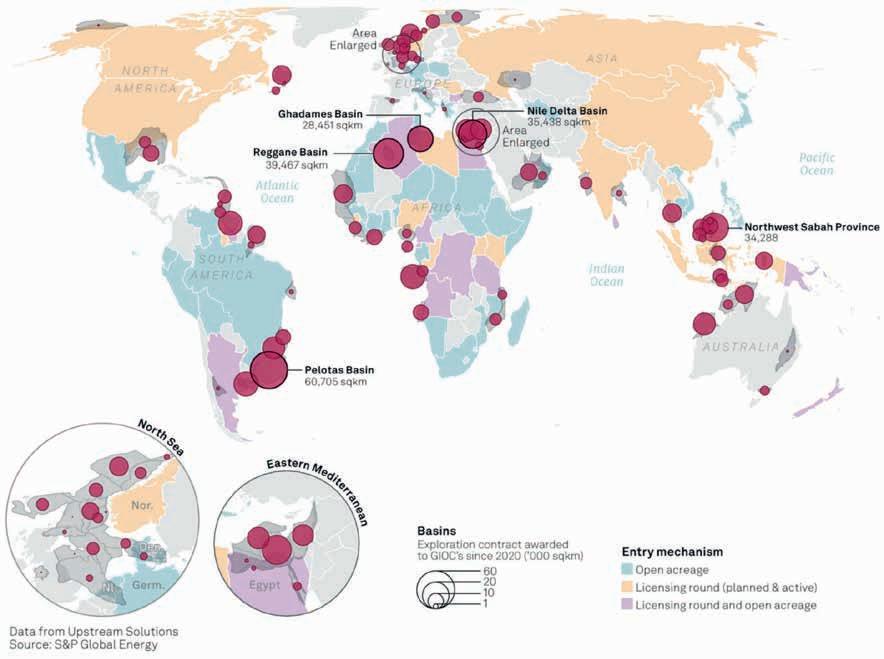
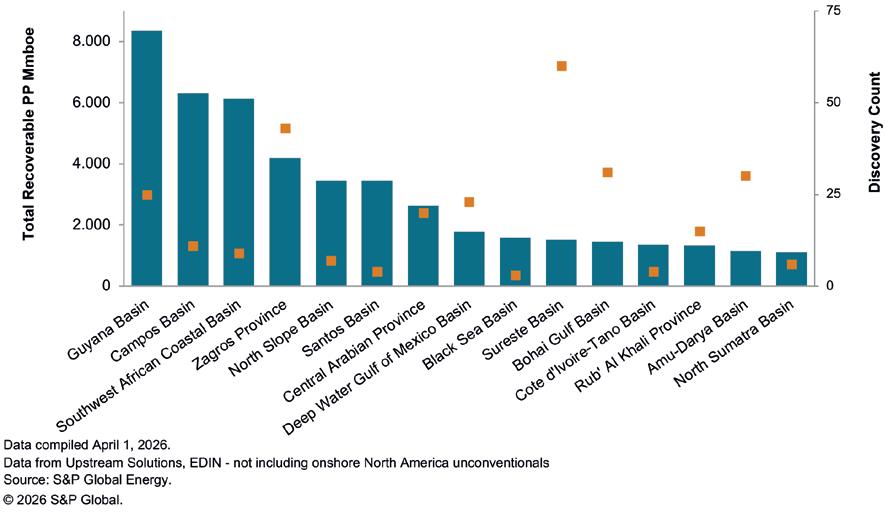
potential that the next wave of exploration will be as much about depth as it is about reach.
Global exploration is entering a new era — one defined by precision, innovation, and bold ambition. As companies pivot from quantity to quality, they’re harnessing cutting-edge technologies and zeroing in on high-impact targets, both in frontier territories and exploiting the boundaries of basins and established plays, often deeper beneath established basins. The surge of high-impact drilling slated for 2026, especially in ultra-deepwater environments, signals a fresh wave of momentum that’s set to reshape the industry’s future.
In this ‘more with less’ landscape, the playbook is changing. The days of blanket wildcat drilling may be fading, but a smarter, more selective approach is taking centre stage. Success will
hinge on striking the right balance between risk and reward, navigating shifting fiscal and regulatory currents, and driving innovation at every turn. Basin selection and locale within basins will be critical to avoid the right basin wrong address problem. For frontier basins, this means being first and locking up large areas to hunt for the sweet spot. Those that chose to wait until basins are derisked need to be more selective on entry or pay up for sweet spots and discoveries. In mature or maturing basins, data and interpretation are the key. Success in these basins will be dictated by who is best at thinking differently about the plays and basin evolution along with data integration and supercomputing.
Ultimately, the future of exploration will be shaped by those who innovate, adapt, and invest with vision — ensuring that exploration remains the driving force behind global energy supply.


As New Zealand reimagines its upstream potential − across hydrocarbons, geothermal, and CCUS − this workshop is where the critical conversations happen. Connect with leading experts, share your insights, and help drive the next chapter of New Zealand’s energy future.


NEWFOUNDLAND AND LABRADOR I CANADA
Carl Fredrik Gyllenhammar1* and Fredrik Gyllenhammar Jr present the results of an industry collaboration project that has analysed cuttings from all released exploration wellbores on the Norwegian Continental Shelf.
Introduction
In 2018 27 oil and gas companies organised by the Norwegian Oil and Gas association started an industry collaboration project to analyse all cuttings from all released exploration wellbores on the Norwegian Continental Shelf (NCS). The project ran from 2019 to 2022 and covers all exploration wellbores from 1969 to 2019. The original project title was ‘Released Wells Initiative’.
All drill cuttings samples from 1900 exploration and appraisal wells were washed to remove the drilling fluid chemicals and photographed in white and UV light by RockWash. The deliverables are high-resolution photographs (white light and UV light). STRATUM Reservoir ran XRF analysis on all cuttings’ samples provided by RockWash.
Of the 1900 wells, 80 were selected to run XRD, QEMSCAN, SpecCam and total organic content (TOC).
In 2024 the dataset became publicly available and was loaded into Diskos. There are approx. 3.8 million files available from this project in Diskos.
QEMSCAN,
The cuttings samples are collected in all oil and gas wells, in general only described visually in a microscope at the wellsite. Combining the RockWash washing/cleaning technique with mineral analysis methods could generate a new dataset to calibrate wireline log response and redefine formation tops.
A patented cleaning method has been developed in RockWash. The motivation is that oil and gas companies for years have invested in collecting and storing drill cuttings from all wells drilled, but the data is stored away, representing a phenomenal underused/unused data set that can reduce exploration uncertainty. At the moment, the best method to remove as much as possible of the drilling fluid contamination.
Three laboratory techniques used to determine mineral composition: X-ray diffraction (XRD), QemScan (automated SEM-EDS), and SpecCam (near-infrared spectroscopy), named
1 Camageo
* Corresponding author, E-mail: cfg@camageo.no
DOI: 10.3997/1365-2397.fb2026032
trusted methods, were run on 80 wells. XRF (X-ray fluorescence) only give the elements that were run on all 1900 wells.
Quantitative Evaluation of Minerals by Scanning electron microscopy is a registered trademark owned by FEI Company (now part of Thermo Fisher Scientific) since 2009. Prior to 2009, QEMSCAN was sold by LEO, a company jointly owned by Leica and ZEISS.
The integrated system comprises a Scanning Electron Microscope (SEM) with a large specimen chamber, up to four light-element energy-dispersive X-ray spectroscopy (EDS) detectors, and proprietary software controlling automated data acquisition. It gives a picture of the sample and the elements like XRF. The minerals are calculated using proprietary software with a mineral library. The mineral composition it gives is the real present composition including fluids in the pore space and water bound in the clay minerals.
X-ray Diffraction (XRD) is a non-destructive analytical technique used to identify crystalline phases, determine structural properties, and analyse materials’ atomic structure. By measuring the diffraction pattern of X-rays scattered by a sample, it provides information on phase composition, crystallinity, lattice parameters, and crystallite size. In short, the output is the mineral composition. Impotently, as dry fraction and different from QemScan.
X-ray fluorescence (XRF) analysis is a non-destructive, rapid analytical technique used to determine the elemental composition of materials. It identifies elements (from sodium to uranium, generally) by measuring the characteristic fluorescent X-rays emitted from a sample when irradiated by a primary X-ray source, widely used for elemental analysis and chemical analysis. The mineral distribution is calculated in a similar manner as QemScan.
Group XRD QEMSCAN SPECCAM
Total clay Total Clay (single column)
Calcite Calcite + Aragonite
Dolomite Dolomite + Kutnohorite
Total carbonates Calcite + Dolomite + Siderite
Sulfates Barite + Anhydrite + Gypsum + Bassanite + Celestine + Jarosite
Quartz Quartz + Opaline silica
Feldspars K-Feldspar + Plagioclase
Pyrite/sulfides Pyrite + Marcasite + Other Sulphides
Calcite
Dolomite + FeDolomite
Calcite + Dolomite + Siderite
Barite + Celestine + Anhydrite
Quartz
K-Feldspar + Albite + Oligoclase + Andesine + Labradorite + Bytownite + Anorthite + Anorthoclase
Pyrite + Chalcopyrite + Cu-sulphides + Sphalerite + Galena + Pentlandite
Iron oxides Hematite + Goethite + Magnetite Fe-oxides + Fe-Ti-oxides + Goethite
Ti oxides Anatase + Rutile + Titanite
Ilmenite + Ulvospinel + Rutile/Anatase + Titanite
Table 1 How the XRD, QemScan and SpecCam respond to different mineral groups.
SPECCAM is a non-destructive imaging infrared spectroscopy technique used in the petroleum and mining industries to map the distribution of minerals and hydrocarbons on rock surfaces (cores, cuttings) at sub-millimetre scales. It offers real-time, automated analysis of mineralogy (e.g., clays, carbonates) and hydrocarbon presence. The only requirement is that it is water-dry and the surface is moderately clean. No other sample preparation is required.
If these trusted methods disagree with one another, then the disagreement between them places a practical floor on how accurately any method can be expected to perform. The purpose of this study is to quantify how well the three methods agree, and to put the accuracy of the mineral inversion into that context.
78 wells on the Norwegian Continental Shelf have cuttings data from all three methods at matching depths, giving 24,059 common depth samples.
Each method has inherent limitations. XRD struggles with amorphous phases and poor crystalline clays. QemScan classifies
Calcite
Dolomite
species (16 columns)
Calcite + Dolomite + Fe-Carbonate
Bassanite + Gypsum
pixels by composition, so fine-grained mixtures may be misassigned. SpecCam can only see minerals with diagnostic NIR absorption features, and is blind to quartz, feldspars, pyrite, and metal oxides.
Each method reports different raw columns, so we aggregate them into canonical groups before comparing them. The table below shows how each group is built from the source columns (Table 1).
Key points about the grouping:
• XRD reports total clay as a single number (XRD_WP_ TCLAY), so we cannot compare individual clay species between XRD and the other methods. For QemScan and SpecCam, total clay is the sum of all clay species (illite, kaolinite, chlorite, smectite, muscovite/mica).
• SPECCAM is blind to quartz, feldspars, sulphides, and oxides because these minerals lack diagnostic near-infrared absorption features. The last five groups in the table are therefore XRD vs QemScan only.
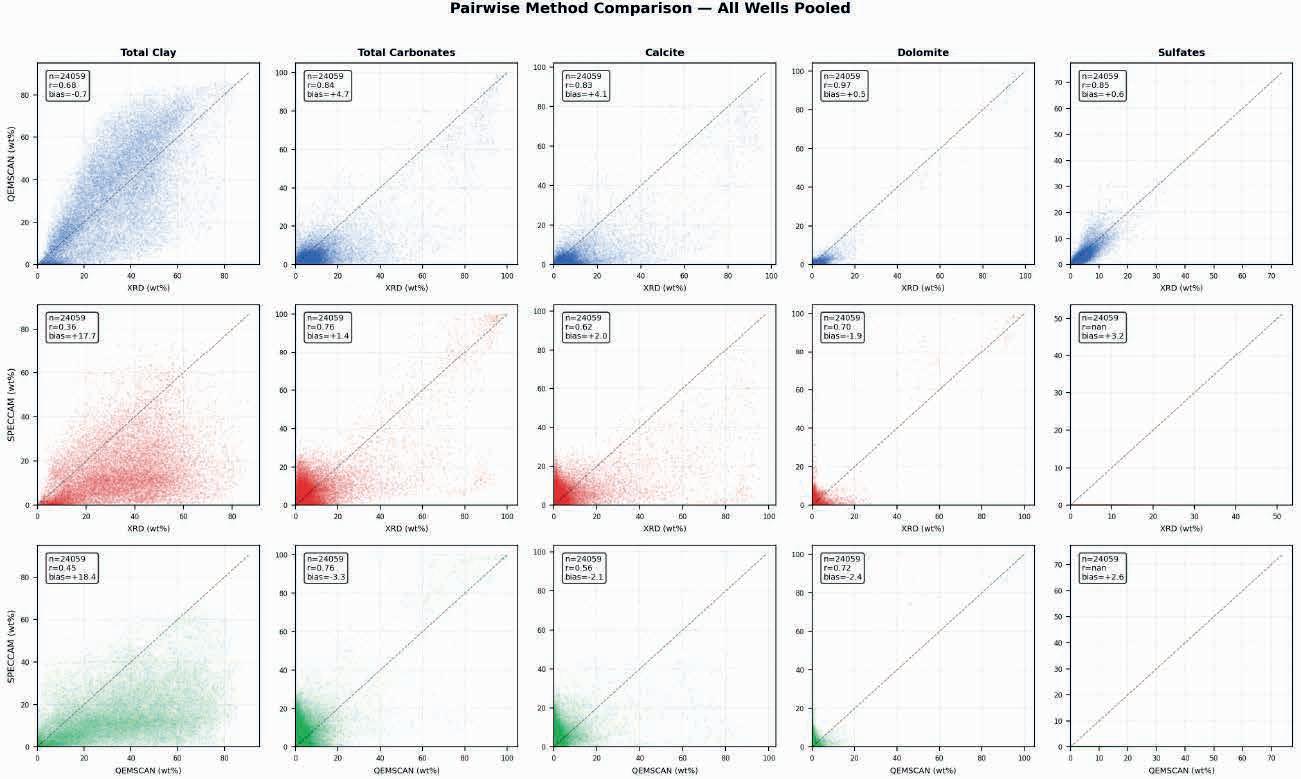
Figure 1 Pairwise method comparison across 78 wells (24,059 depths). Each dot is a one-depth sample. r is the correlation and bias is the mean difference between the two methods in wt%. The best agreement is between XRD and QemScan for carbonates (r = 0.84). The worst is for clay between any pair involving SpecCam.
• Siderite group includes magnesite and rhodochrosite (XRD) and Fe-carbonate (SpecCam), because these are grouped together in the source data.
• QEMSCAN has two file formats: RAW (with 60 mineral columns) and STD (pre-aggregated, 20 columns). We prefer RAW when available, falling back to STD. The column names differ between formats but map to the same canonical groups.
The figure 1 below shows each depth sample as a dot. Three rows correspond to the three method pairs (top: XRD vs QemScan, middle: XRD vs SpecCam, bottom: QemScan vs SpecCam); five columns to the mineral groups. Points on the dashed diagonal indicate perfect agreement.
MAE (mean absolute error) measures the average absolute difference between two methods at the same depth. For total clay, even the best pair (XRD vs QemScan) disagrees by nearly 13 wt% on average. For carbonates and sulphates, the agreement is tighter, but still several weight per cent (Table 2).
SpecCam shows the largest disagreement (Table 2). It systematically under-reports total clay relative to XRD and QEMSCAN. For carbonate species, SpecCam tends to assign carbonate signal to dolomite even in intervals where XRD and QemScan N agree the rock is dominated by calcite — a known ambiguity in NIR spectroscopy where the carbonate absorption features calcite and dolomite overlap.
One can conclude based on this analysis that the SpecCam method is not applicable to drill-cuttings.
The following is therefore an analysis of QEMSCAN, XRD and minerals calculated from XRF analysis.
Results: Well log comparisons.
The well log plots below (Figures 2 and 3) show how each mineral group varies with depth. Blue is the inversion result, red is XRD, and green is QemScan. Where the curves track each other closely, the inversion is capturing the real mineralogy.
The cross-plots (Figures 4 and 5) below show inversion (horizontal axis) against the reference measurement (vertical axis) for each mineral group. Each dot is one depth sample. Points on the diagonal line indicate perfect agreement. Points consistently above or below the line indicate a systematic over- or under-estimate.
Top row compares against XRD, bottom row against QEMSCAN.
What works: Quartz, sulphates, and carbonates are well-recovered. The inversion picks up the right depth trends and absolute magnitudes (fig 6 and table 3).
What needs work: Clay is systematically underestimated by 8-0 wt%. This is expected: clay minerals contain 3–14% bound
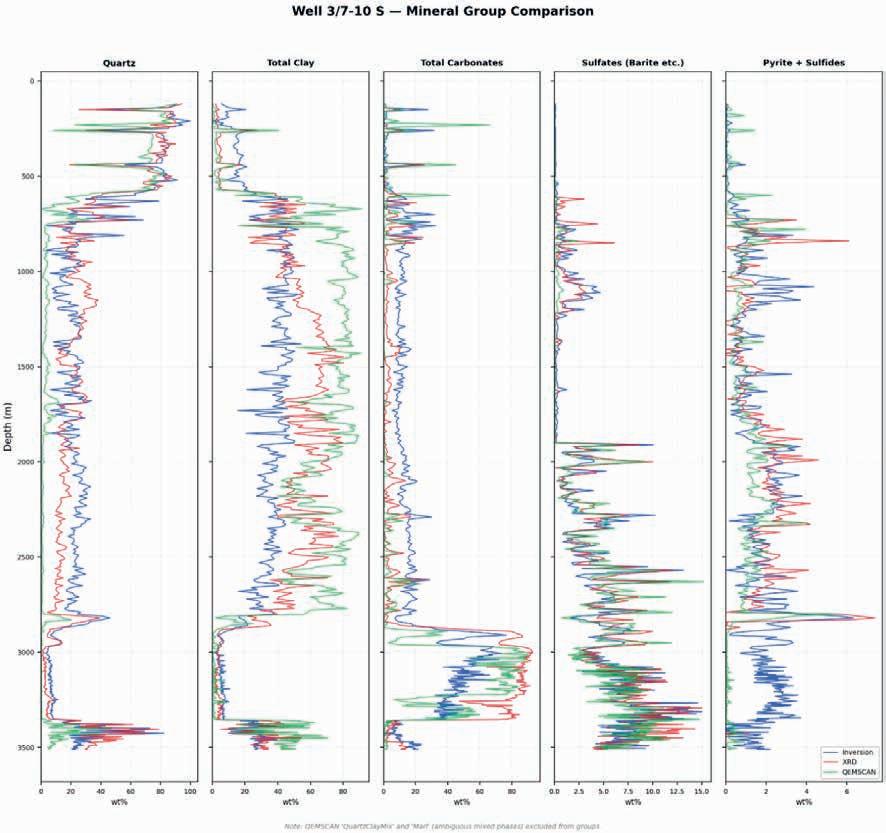
2 Well 3/7-10 S. The inversion (blue) tracks XRD (red) well for quartz, carbonates, and sulphates. Clay is underestimated — the blue curve sits below the red and green — mainly because clay minerals contain bound water that is not measured by XRF.
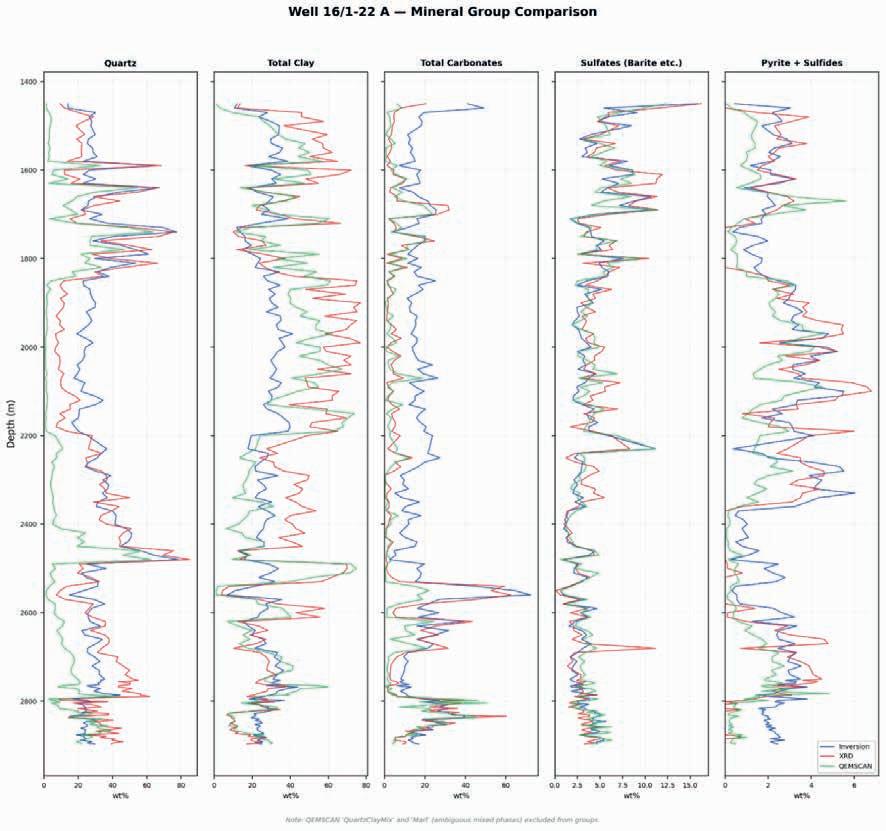
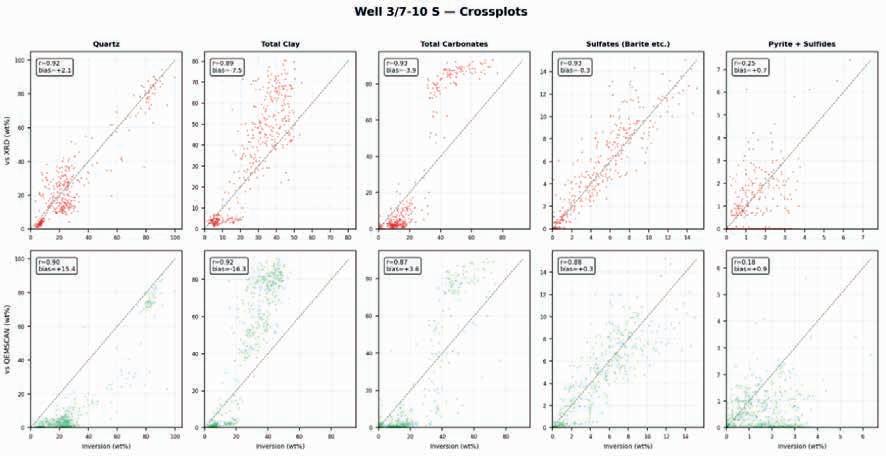
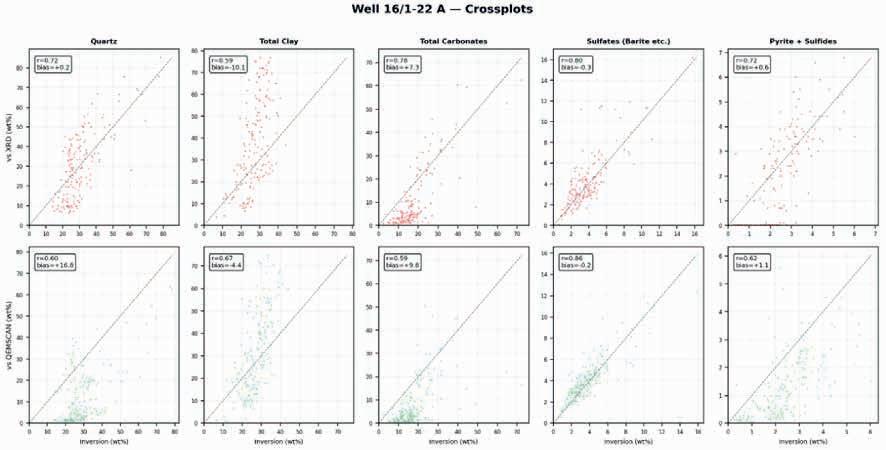
Figure 3 Well 16/1-22 A. Similar pattern: good agreement on quartz and sulphates, with clay underestimated and carbonates somewhat overestimated. The inversion captures the major depth trends in all groups.
Figure 4 Well 3/7-10 S cross-plots. Quartz and sulphates cluster tightly around the 1:1 line. Total clay shows scatter below the line (inversion underestimates). The carbonate scatter is wider but centred. Numbers in each panel: r is the correlation (1.0 = perfec perfect tracking), bias is the average over- or under-estimate in wt%.
Figure 5 Well 16/1-22 A cross-plots. Quartz tracks well against XRD (top left). The QEMSCAN quartz comparison (bottom left) shows a +17 wt% bias because QEMSCAN’s ‘QuartzClayMix’ phase is not included in the quartz total.
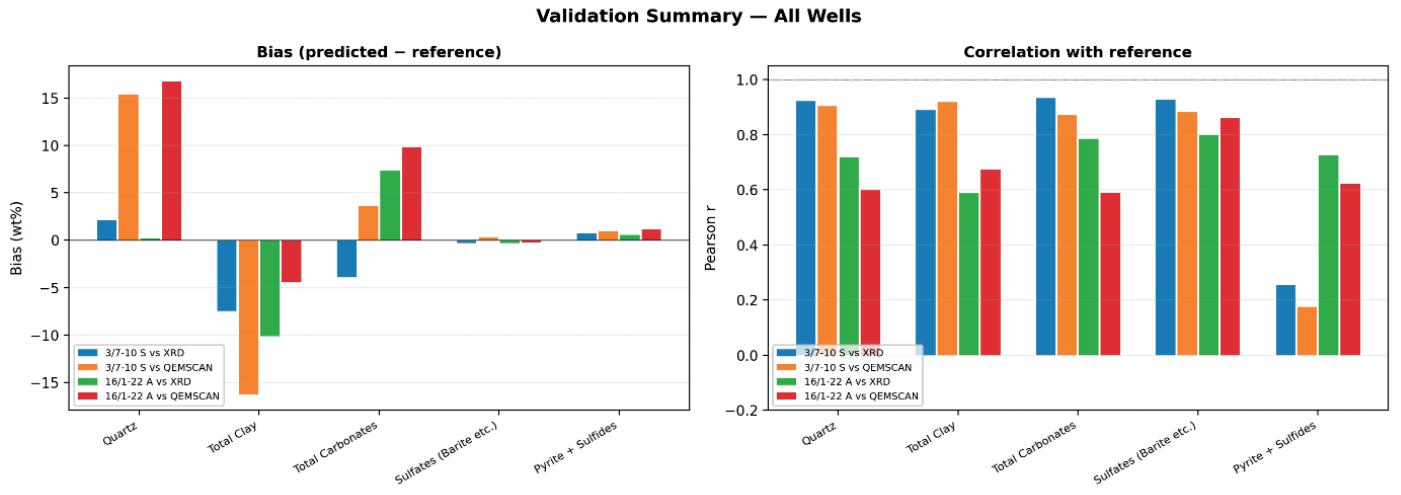
fication, the most meaningful baseline is the spread between XRD and QEMSCAN — two methods that can see the full mineral suite. The histograms below show the absolute difference between XRD and QEMSCAN at each depth, excluding depths where both methods report zero (i.e. the mineral is absent in both).
The top row shows the five groups that all three methods can measure (clays, carbonates, sulphates). The bottom row adds five groups that only XRD and QemScan can compare: quartz, feldspars, pyrite/sulphides, iron oxides, and Ti oxides.
Context: Inversion error vs method disagreement
water (OH groups) by mass, and this water is invisible to XRF. The inversion cannot ‘see’ that mass, so it assigns less clay than is actually present. The remaining oxide balance goes partly to carbonates, explaining their slight overestimate.
XRD vs QEMSCAN: The two reference methods don’t perfectly agree either — XRD reports 13-17 wt% more quartz than QEMSCAN, largely because QEMSCAN classifies boundary pixels as ‘QuartzClayMix’ rather than pure quartz. This means some apparent errors in the inversion vs QEMSCAN comparison are really artefacts of the QEMSCAN method.
XRD vs QEMSCAN disagreement
Because SpecCam has known blind spots (no quartz, sulphides or oxides) and systematic biases in carbonate species identi-
The figure 8 below compares the XRD vs QemScan disagreement with the error of our XRF-based mineral inversion (measured as MAE against XRD across 80 wells). It’s important to remember that XRD gives minerals in dry weight only, while QemScan includes porosity and water contant.
Summary
The ‘Ratio’ column shows inversion error divided by XRD-QemScan spread. A ratio near 1 means the inversion is about as close to XRD as QemScan is.
Key findings (Table 4):
• XRD and QEMSCAN do not agree with each other. Even these two well-established techniques differ by a median of 10 wt% on clay content. This is the baseline: it represents the practical limit of how well any method can match XRD.
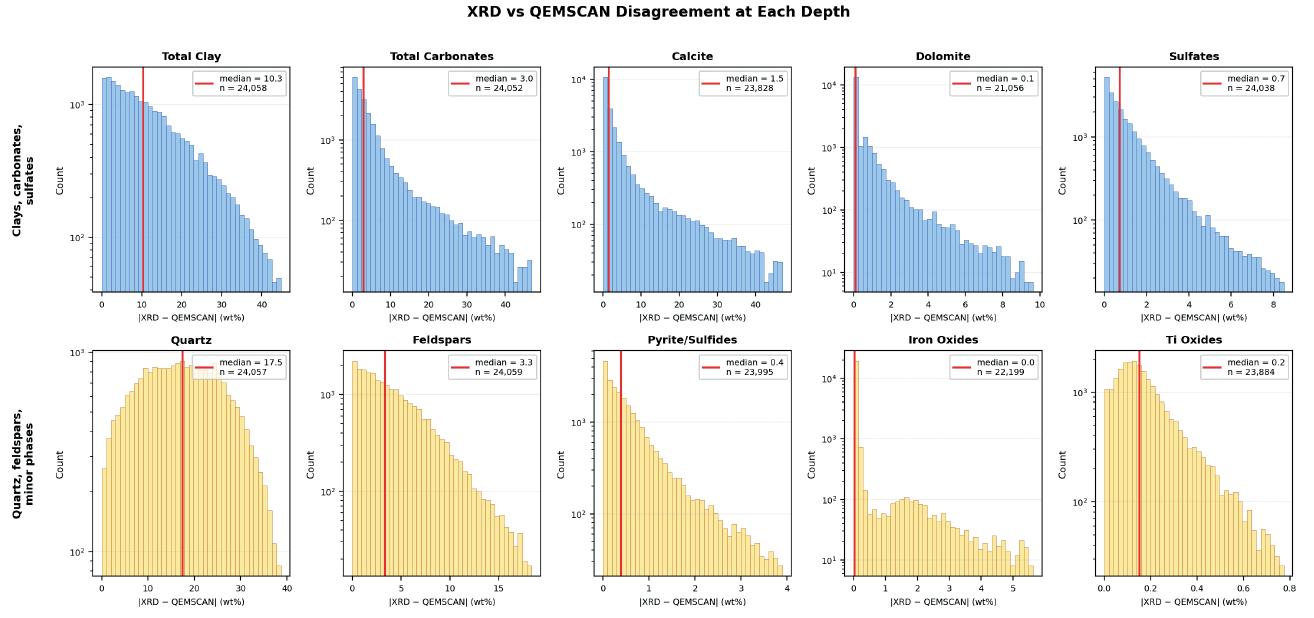
Figure 7 Distribution of |XRD − QemScan | at each depth (log scale, zeros excluded). Top row: clays, carbonates, and sulphates. Bottom row: quartz, feldspars, and minor phases. Quartz shows the largest disagreement (median 13.1 wt%), comparable to total clay. Feldspars disagree with a median of 3.3 wt%. Minor phases (pyrite, iron oxides, Ti oxides) agree well, with medians below 1 wt%.
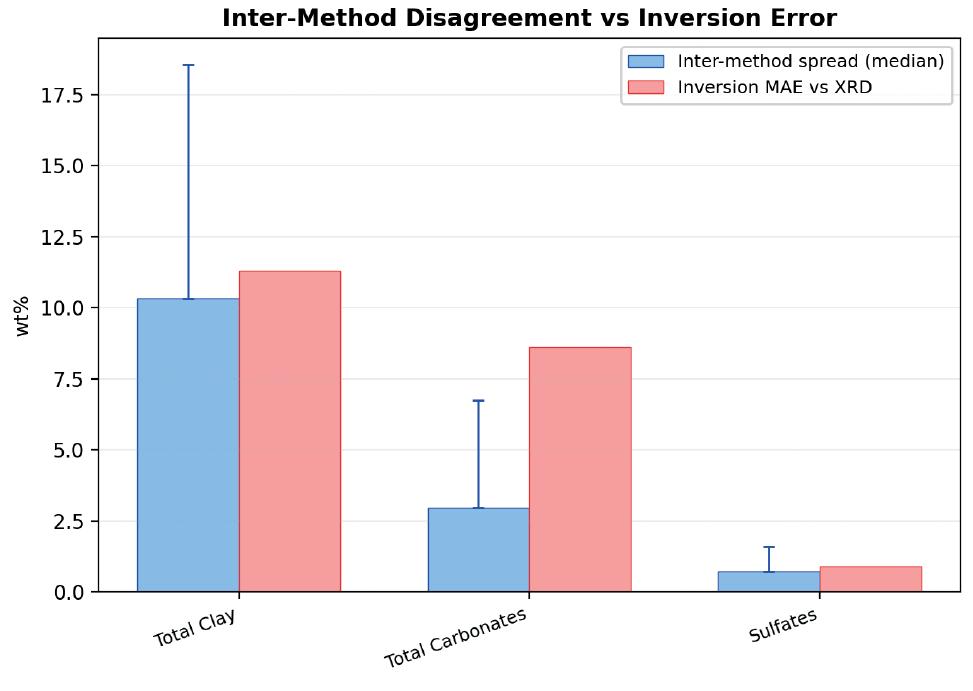
Figure 8 Blue: median |XRD − QemScan | spread. The error bar shows 75th percentile. Red: MAE of the XRF mineral inversion vs XRD. For total clay (the hardest group), the inversion MAE (11.3 wt%) is comparable to how much XRD and QemScan disagree with each other (10.3 wt%). For sulphates, both the method spread and the inversion error are below 1 wt%.
6.5 wt% (driven by missing CO2 in the XRF oxide balance), while XRD and QEMSCAN agree on carbonates to within 3 wt%.
• SPECCAM is the least consistent with the other methods. It systematically under-reports clay and misassigns carbonate species. Adding SPECCAM roughly doubles the apparent method-spread for every mineral group.
• Clay is hard for everyone. The three laboratory methods disagree most on clay, and the inversion’s largest error is also on clay. This reflects genuine measurement difficulty, not a flaw in any single technique.
QEMSCAN mineral analysis includes a synthetic generated Gamma Ray (GR) curve, volume of clay (Vcl) and porosity. The calculated porosity is only interesting for analysing core chips.
Table 4 Comparing XRD versus QemScan. Using raw output data from DISKOS.
• The XRF inversion is comparable to QEMSCAN in its agreement with XRD. For total clay, the inversion MAE (11.3 wt%) is only slightly larger than the XRD-QEMSCAN disagreement (10.3 wt%). For sulphates, the inversion is nearly as precise as the lab methods.
• Carbonates are the inversion’s weakest point relative to the baseline. The inversion overestimates carbonates by about
Figure x show exploration well 3/7-10 S, a dry well in the Søgne Basin, North Sea. The GR track to the left shows the wireline GR curve in green. The green triangles are the QEMSCAN generated GR curve. Track 15 is the wireline calculated lithology (CPI). The black triangles are the QEMSCAN-calculated Vcl, which is also a very good match. It illustrates that running QEMSCAN mineral analysis on the drill cuttings generates a valuable dataset. In addition, the synthetic generated GR curve gives a quick quality check of how representative the drill cuttings are. More than 40 of the wells have been analysed by the Elemental Capture Spectropy (ECS) log by Schlumberger ran. And yet, there have been no publications showing analytical work done. All these data have now been publicly available for two years.
Well correlations based on mineralogy distribution
Figure 10 is a long well correlation using the cuttings mineral data calculated from the XRD data. The software used is IC provided by GeoActive in Aberdeen. The Gina Krog field is in the centre of the well correlation. The well number is deliberately
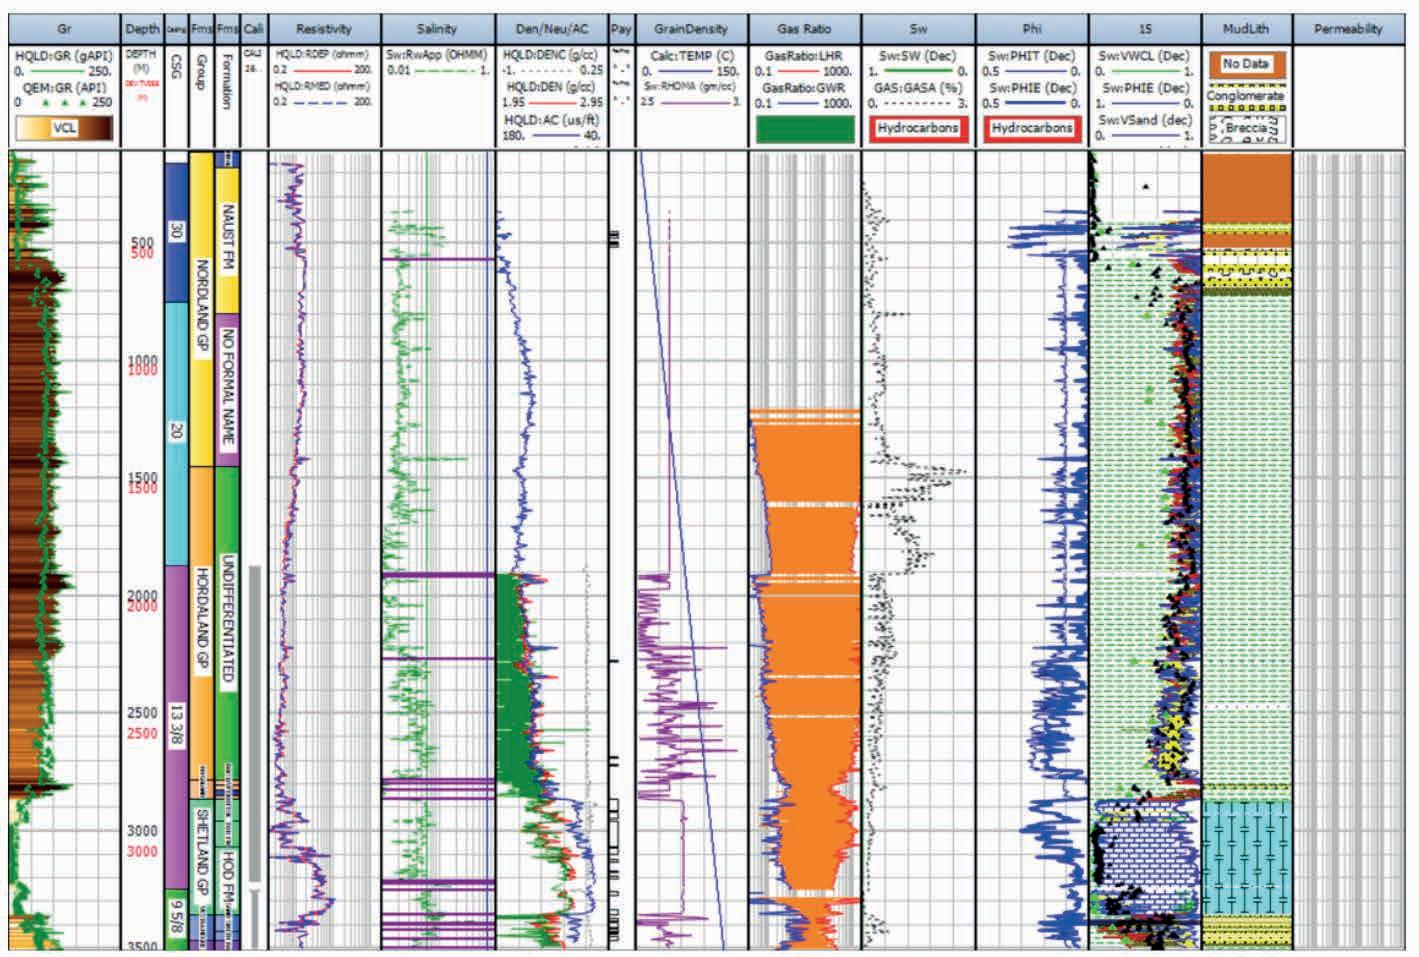
Figure 9 CPI of exploration well 3/7-10 S operated by Premier Oil Norway in 2015.
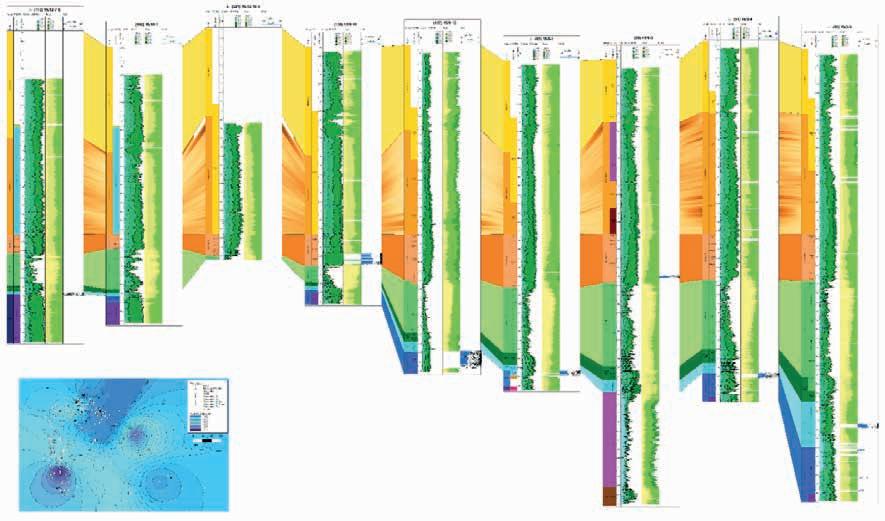
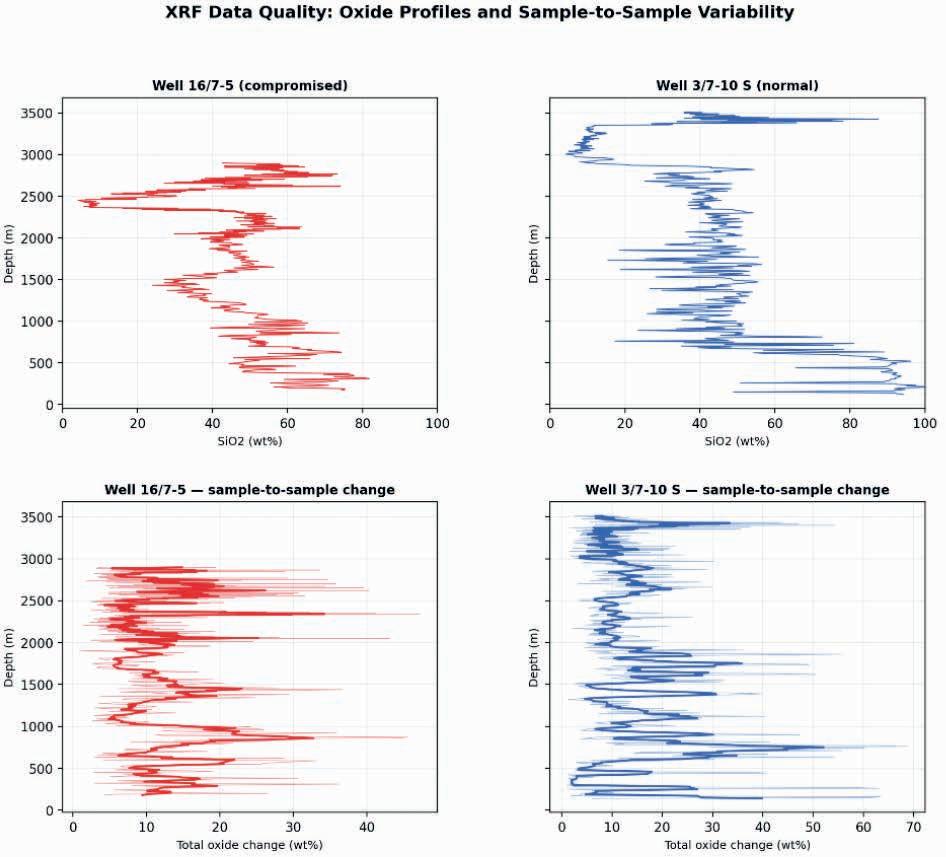
too small to read due to confidentiality. It shows that the cuttings mineral data correlates and in places challenges the old formation tops picks.
This test brings me to my last important comment/message. The drill cuttings are not always representative of the formation drilled.
Can we trust the drill cuttings? Note on well 16/7-5 — XRF verification of possible compromised sampling
Back in 1984, I was the first Norwegian geology-educated (University of Oslo) mudlogger. Hired by Gearhart Geodata in Aberdeen. My first offshore assignment was being sample catcher at Zapata Ugland, exploration well 16/7-5 operated by Exxon. For reasons I never understood we were not allowed to store the drill cuttings boxes outside the mudlogging unite, but down the nearby shaft. I complained to the Exxon wellsite geologist, who referred me to the Exxon drilling manager. I went personally to him and explained the problem; to be able to catch all samples we needed to store the cuttings bags closer to
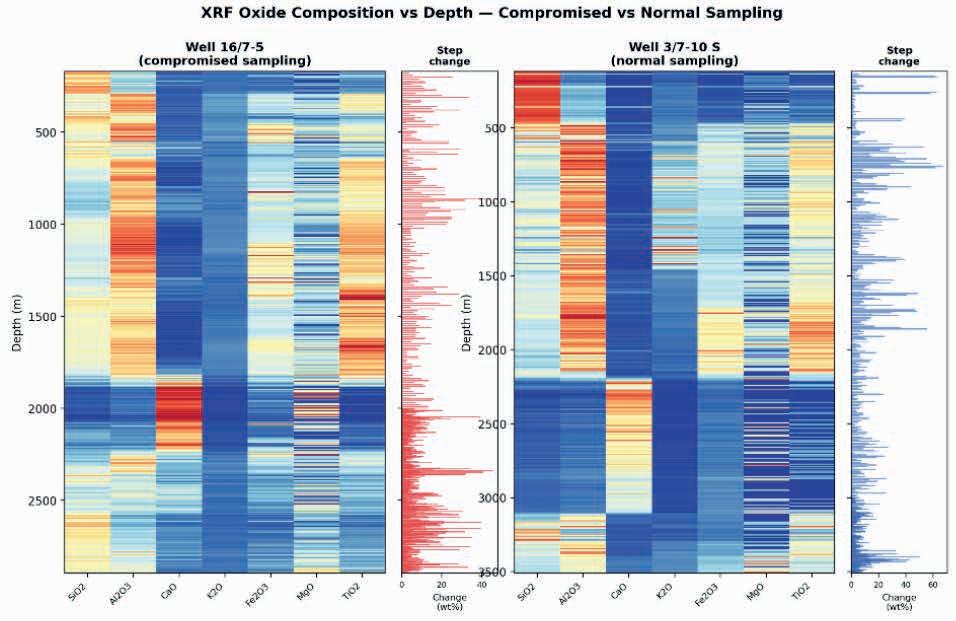
where we bagged them. He got very upset and demanded that the cuttings samples be stored in the shaft, on the opposite side of the rig! He was very offensive. I reported the incident to the NPD lawyer.
We have now tested the XRF data from that well. The only way we could fulfil Exxon’s demand, was to fill big buckets with drill cuttings about every 30-50 m, carry them down to the drill shafts and fill samples bags from the same bucket at different depths from top to bottom as best we could. The Exxon wellsite geologist was happy getting all his cuttings bags.
We analysed the XRF oxide data for well 16/7-5 (480 samples, 170–2897 m) and compared it against well 3/7-10 S (a normally sampled well) and the full population of ~1900 wells. If samples from many depths had been filled from the same bucket, we would expect to see blocks of near-identical oxide compositions spanning long depth intervals, abnormally low sample-to-sample variability, and smeared or absent formation boundaries.
The XRF data for well 16/7-5 show that not a single pair of consecutive samples is identical, even at 0.1 wt% precision across all nine oxides. The median sample-to-sample oxide change is 9.4 wt%, placing this well at the 45th percentile across
all 1928 wells — squarely in the middle of the population. The longest interval of low SiO2 variability is ~300 m (1670-1970 m), which ranks 375th out of 1917 wells. Comparable or longer flat stretches occur routinely in wells that penetrate thick homogeneous formations (chalk, shale). The autocorrelation decay with depth lag is also unremarkable.
Well 16/7-5 is a valuable first-hand account of how sampling practices in theory could have compromised data quality. The XRF data alone cannot verify or quantify the extent of the problem. A stronger test would be to correlate the XRF-derived mineral inversion with wireline log response (e.g. gamma ray): in a properly sampled well the mineral composition should track the wireline, while in a compromised well the correlation would break down. This was not attempted in the current revision.
In many ways this test suggests that mudloggers, despite the conditions we worked under during the 1980s in the North Sea, were very dedicated and did an extraordinarily good job. Drilling offshore exploration wells are very expensive. Catching
the drill cuttings do not increase rig time. Done correctly, they represent a valuable tool to do post-well evaluation. In particular, searching for missed-pay.
There are more operators today that use more than one sample catcher on each shift to insure, all the samples are taken at correct depth interval.
The XRF mineral inversion produces results that are comparable in accuracy to QEMSCAN when benchmarked against XRD. Given that XRF data is available for 1900 wells (vs 80 for XRD and 90 for QEMSCAN/SPECCAM), the inversion offers a practical way to extend mineral composition estimates across the full well inventory at a quality level consistent with established laboratory methods.
All data was downloaded from publicly released wells from the Diskos database. The mineral inversion and the statistical analysis used are all standard and published equations that have been programed in Python by the authors.


Neil Hodgson1*, Karyna Rodriguez1 and Lauren Found1 characterise the proven but so-far littleexplored deepwater ‘Counter Regional-dip Early Drift’ (CRED) play of the South Atlantic.
An industry truism is that deepwater exploration for the Earth’s last-remaining truly colossal oil and gas resources is higher risk and harder to commercialise than the business of mopping up the remaining reserves on the world’s well-explored shelves and upper slopes. Certainly, deepwater drilling cost is high, and so in-order to be commercial, any discovery must be big, sedimentologically simple and permeable, to reduce appraisal and development well count. Fortuitously, these qualities exactly characterise the proven but so-far little-explored deepwater ‘Counter Regional-dip Early Drift’ (CRED) play of the South Atlantic, which, perhaps counter-intuitively, can also offer lower-risk opportunities than the diminutive competing shelfal alternatives.
The future is ‘Counter Regional-dip Early Drift’ (CRED)
The CRED play has been discussed previously (Rodriguez et al., 2016, Hodgson et al., 2017, Hodgson et al., 2024, Hodgson et al., 2025) in the context of the South American passive margin and its ‘conjugate’ West African passive margin. Of course, it is much more famously celebrated in the TotalEnergies’ 2022
Venus Field discovery in Namibia’s Orange Basin. The concept of this play is relatively simple, not new by any means and whilst it is apparent on some legacy TWT seismic data, it has been more ubiquitously recognised since the use of long regional seismic data displayed in depth over the last 10-15 years. This play has gained attention with the industry’s embracing of deepwater drilling to chase base of slope rather than upper slope targets over the last 5-6 years.
We define the Counter Regional-dip Early Drift (CRED) play with respect to the key exploration risk elements: Charge, Reservoir and Trap. Charge (C): Source rock is provided in the South Atlantic by a widespread thick Aptian source rock deposited in the transition zone between Drift SDR’s (seaward Dipping Reflectors) and Oceanic Crust, often at the ‘depth to crystalline basement nadir’. In the later Transform Margin, the equivalent early drift Source rock is Albian-aged. In this play, source rocks are matured by burial under approximately 2.5-3 km of clastic sediments. Heatflow from the mantle below the source rock is higher than previously thought and retention of heat is assisted by rapid burial. Reservoir (R) is provided by overlying base of slope and basin floor clastic turbidite fans, deposited onto the restricted marine source rock, probably in
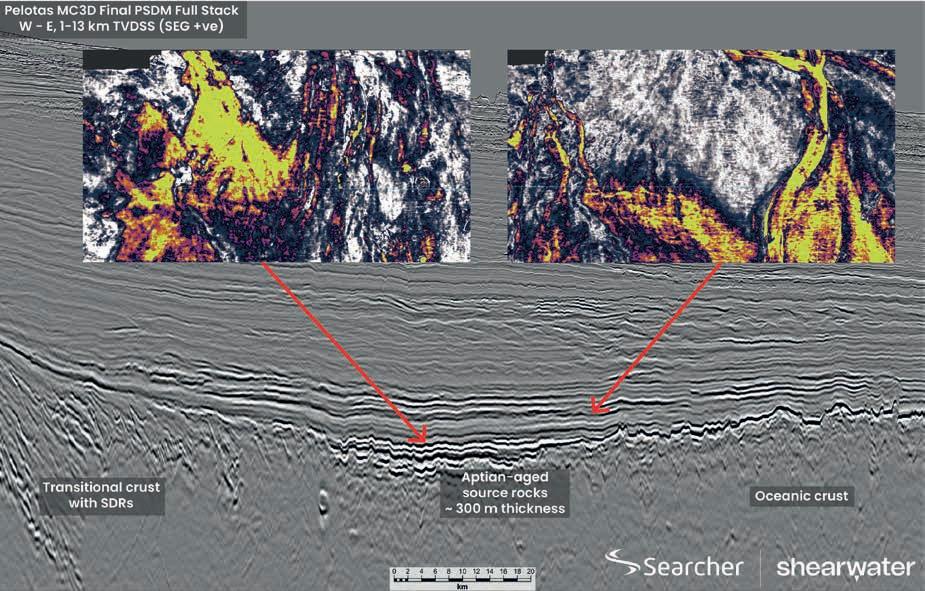
1 Searcher
* Corresponding author, E-mail: n.hodgson@searcherseismic.com
DOI: 10.3997/1365-2397.fb2026033
Figure 1 Example 1: Pelotas Basin Southern Brazil. At the base of the section SDR’s, left-hand side (LHS) transition through a basement Nadir to rising Penrose Crust, right-hand side. (RHS) Above that, earliest Aptian marine inundation synchronous with Orange Basin Aptian source. Above that, bright events as basin floor fans deposited onlapping/down-lapping and now rotated into counter regional dip.
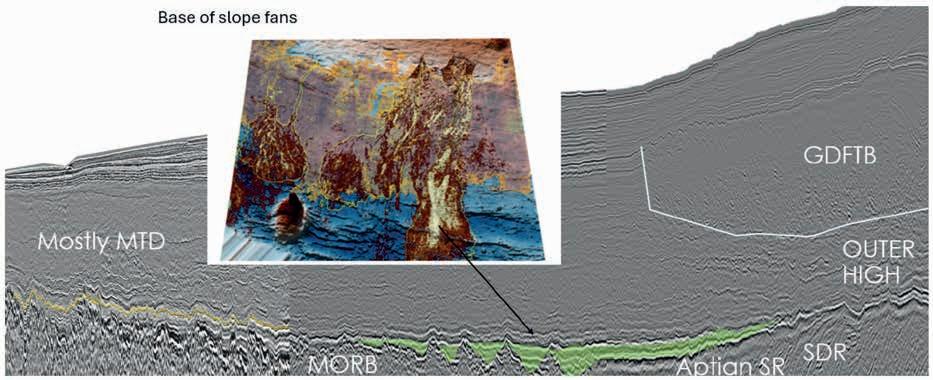
modest water depths. Trap (T) one-way stratigraphic, three-way structural trapping where dip is upward away from the coast, obviating the need for sediment bypass to create a trap. This counter-regional dip is generated by sediment loading of the oceanic crust, its slow cooling, and the isostatic subsidence of thinned lithosphere at the crustal nadir usually sitting above the thinnest lithosphere. The section is top sealed by comprehensive deepwater mudstones.
Apart from the Venus discovery in 2022, there is a lack of exploration on this play globally and indeed in the Atlantic. This might indicate that the Venus CRED style of trapping is in some way unique or restricted in its distribution here or indeed on any passive margin. However, using public domain data it is quick and simple to define where Oceanic crust is in counter regional configuration. Adding a sediment isopach map (such as that made available by NOAA) to an ocean bathymetry map, yields the geometry of the Oceanic Crust (Figure 3).
Some additional criteria can be readily applied to screen margins for prospectivity on this play (Figure 4). Our putative source rock in the South Atlantic is Aptian, deposited by the first marine transgression in the transition from sub areal drift
Figure 2 Example 2: Namibia’s Orange Basin. At the base of the section, SDR’s (RHS) transition through a basement Nadir to rising Penrose Crust (LHS). Above that, earliest Aptian marine inundation synchronous with Pelotas basin Aptian source (shaded Green). Above that, bright events as basin floor fans deposited onlapping/ down-lapping and now rotated into counter regional dip mappable on 3D seismic.
volcanism to sub marine drift volcanism. We can constrain the distribution of this play with two further criteria, firstly by defining the Continental Oceanic Boundary (COB) and secondly by defining the Aptian-Albian oceanic crust age. Again, public domain data is available to allow us to do this easily, although user discretion is required in the detail. This typically defines a wide swathe out board of continental crust where Aptian source rock could have been deposited. Whilst this is useful for the South Atlantic – the ‘transform margins’ offer a different story as the basins on this margin did not start to drift until the Albian. On this margin then, the zone of interest is the COB to Albian Oceanic crust.
Secondly, we can apply a 3 km sediment isopach criteria as a gross ‘source rock maturity’ cutoff. This is perhaps the most terrible of the assumptions to make. However, we need to screen areas where the Aptian source rock is likely to be thermally immature for hydrocarbon generation. The geothermal gradient from seabed to oceanic crust in the South Atlantic is rather poorly known. Before, about 15 years ago, the assumption had been that heat flow from Oceanic Crust was lower than Continental Crust as MORB or Penrose basalts lose most of their
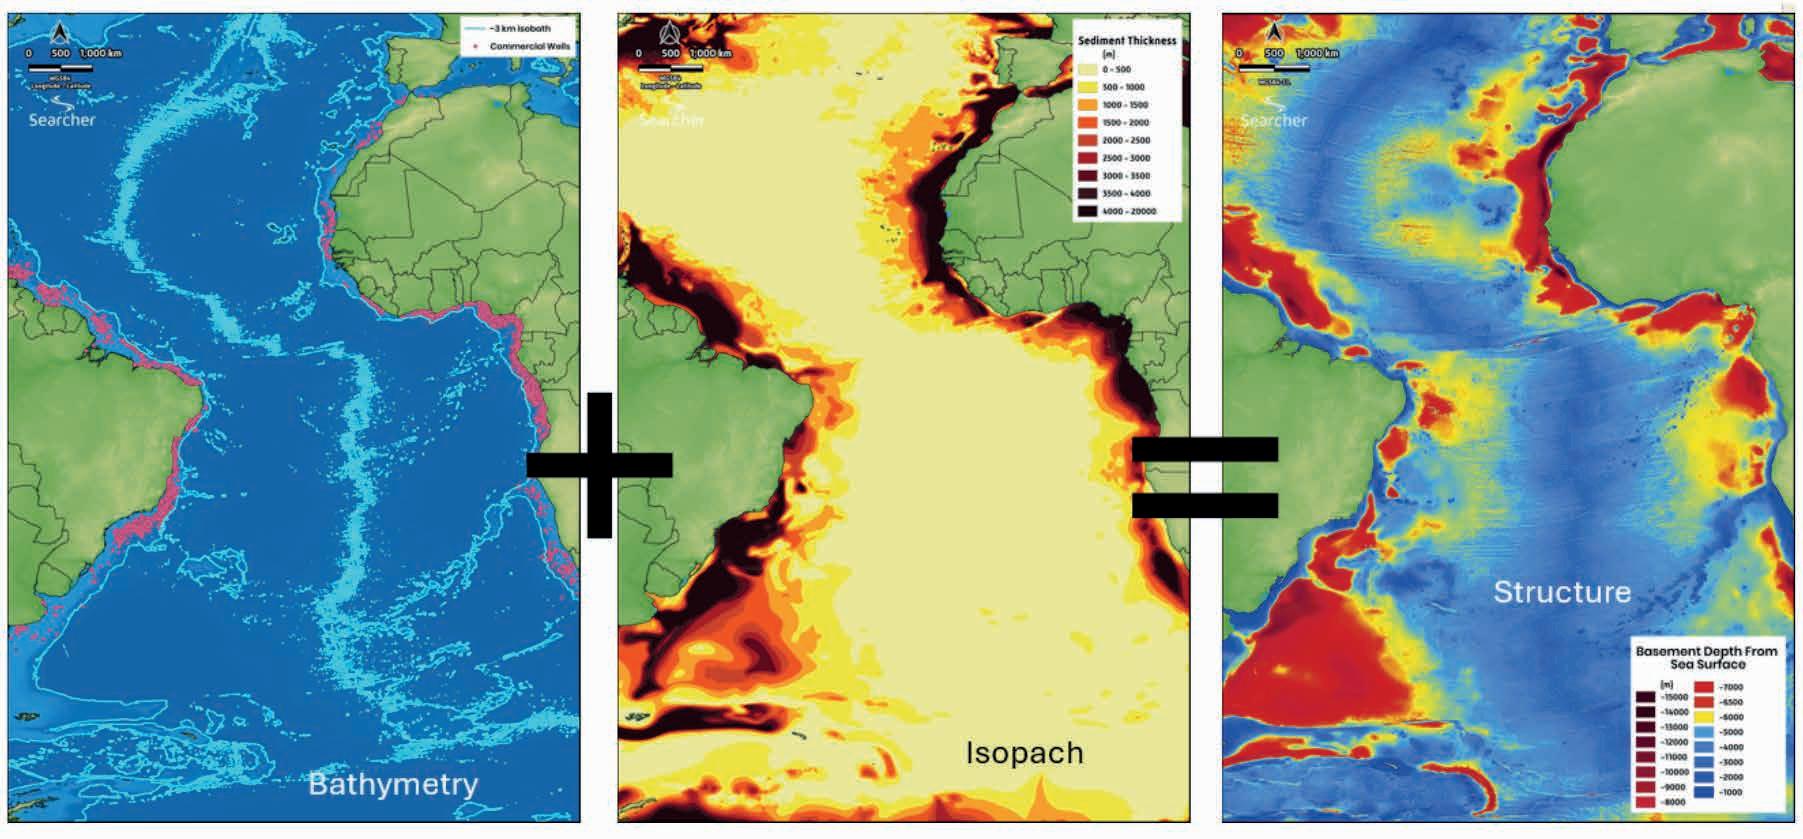
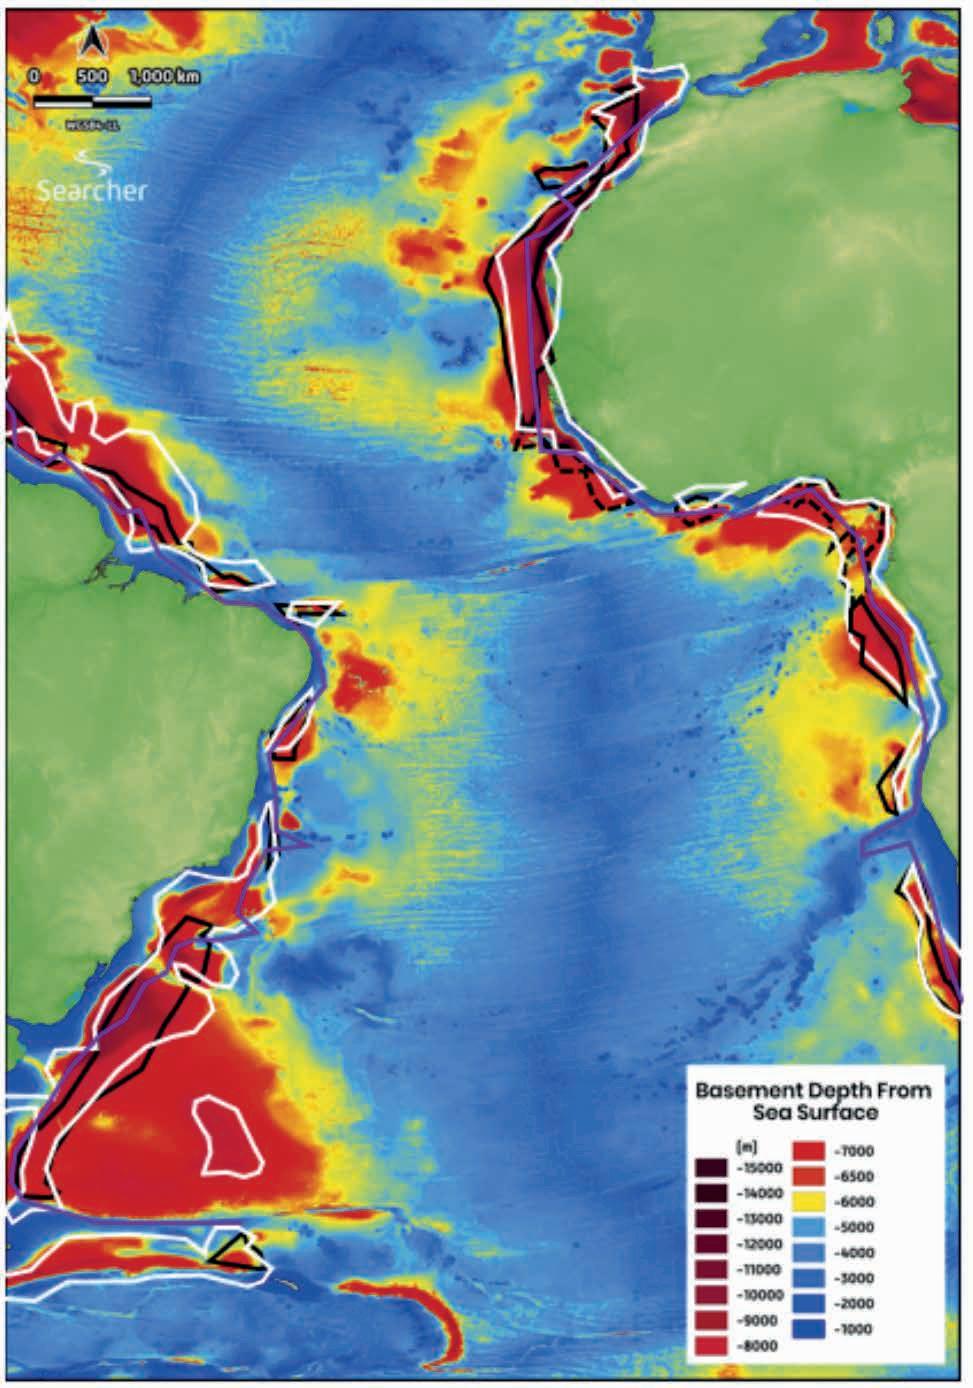
heat rapidly following drift and are depleted in potassium and uranium – so do not generate much heat themselves. Gradients of 20-25oC/km have been proposed. However, heat transfer from the mantle is easier for oceanic basalts (thin lithosphere), and their cooling is retarded by early sediment burial. Hence, most wells drilled in this setting over the last 15 years have found geothermal gradients from seabed to source rock of 30-40oC/km. As the oil generation window opens somewhere between 80 and 90oC, 3km of sediment burial in these simple stratigraphies of the Abyssal Plain would appear a reasonable start for limited gross definition of areas to focus activity. To be sure, one should use a 2.2 km upper range to frame this and this definition does not allow for long-distance migration or late volcanism or indeed any of the ‘devil in the detail’ of local geology that will play into this.
By this stage we have piled up the gross assumptions on geometry and source maturity and it’s fair to apply George Box’s expression here; ‘all models are wrong, but some are useful’. This Phrase can be misunderstood, as what was meant is that ‘all models are incomplete, but some are close enough’. Dialling into the local detail and thinking about local geological history will resolve this, but we are still working at a high level of screening, which requires one more criterion to be applied to identify the counter regional plays future hot spots. And that is the application of bathymetry.
Whilst drilling in 2000 m of water was a reality in the 1980s there is still a certain amount of reluctance to explore in >3000 m of water and >4000 m is still today’s sci-fi dream. It’s not clear if any science is required to be un-fictionalised to make such drilling a reality but it’s a reasonable assumption that such drilling today will not be cheap. An eye-ball deconvolution of the ‘water depth drilling record vs time curve’ suggests that 4000 m might be achieved by 2030 especially if the oil price stays above $100/bbl, but we shall see. Mantle dynamic topography has perched some South Atlantic passive margin ‘crystalline basement nadirs’ in the 2000-2500 m depth range. ‘Deepwater’ to us is >2500 m of water, and ‘Too-Deepwater’ to us is >4000 m. I hope someone reading this in 2030 is smiling at the un-ambitiousness of this assumption right now.
With this last curve on the regional screening maps, we are set to start to thinking about focusing in on detail. A good starting place is the overlay of reservoir. To some extent the ‘gross isopach thicks’ used to define where source is mature is a good guide. Large clastic prisms are rarely devoid of coarse clastics, in ultra deepwater these will be base of slope or abyssal plain turbidite fan or basin floor channel deposits. However, for our play we are looking primarily at the Cretaceous section above the Aptian source rock. Just looking at well data on the shelf does not necessarily tell you about the distribution or quality of sands in the deep basin. These wells are habitual liars and a shelf and upper slope that is muddy can mean that the sands have just bypassed the shelf and upper slope, most importantly a Tertiary muddy section inboard does not preclude a sand-rich Cretaceous section outboard.
Of all the play key risk elements, reservoir is hardest to tackle and the best weapon you have to address distribution in your arsenal is seismic The water depth of sand deposition is still a moot point, yet where the sands are deposited on the basin floor some appear to be reworked by contourites to develop elongated sand bodies that are extended in the axis of the initial basin. In Orange, the Venus sands are reworked from south to north and in Pelotas a similar orientation running north-south shaped by currents and or basin geometry. 3D seismic is essential to map these sands in CRED geometry and Searcher’s, and its partner Shearwater’s, 2022-2026 3D datasets in the Orange and Pelotas Basins are particularly good at illustrating this point (Figures 1 and 2).
Our CRED definition seeks to charge a Cretaceous (preferably Lower Cretaceous) sand reservoir. One exciting outcome from the CRED screening mapping of Figures 3 and 4, is that there is Aptian Oceanic Crust outboard of Angola and Gabon’s Aptian salt basin, and likewise, Aptian Oceanic Crust outboard of the Brazilian Espirito Santo and Santos /Campos Salt basins. If a late-Aptian Source rock were deposited there (and seismically both Aptian sequences look very similar to that in Namibia, Argentina, Brazil Pelotas, Gabon, Angola), this would create an additional opportunity for exploration. However, after the Aptian salt is deposited this creates a sand-trap of mini-basins that prevent sand from crossing from coast to the outer high and the deep ‘beyond the salt canopy’ play. Even where the Congo fan is flooding sands into the salt basin, they are caught by halokinetic ponding, and it takes until the Tertiary before any significant volume of sand gets out beyond the salt canopy.
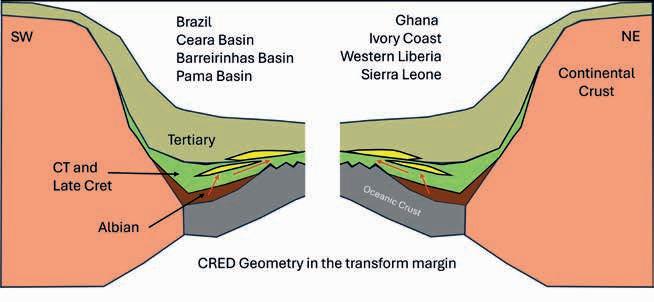
Therefore, outside of the salt basin and its projecting canopy, there is a play where Aptian source rock in CRED geometry is overlain by Tertiary channels and deepwater clastics – a modified CRED geometry. Published data suggests that the basin has a thick hydrate layer at seabed – an indication that geothermal gradient is low, allowing biogenic generation of gas from these Miocene clastics. This low geothermal gradient is probable as the long delay before a thick sedimentary cover develops over the Aptian and Oceanic crust below it allows the system to cool down more quickly, and this is useful as despite the Congo Fans’ immense thickness, the underlying Aptian may be in the oil window anyway. The presence of the salt basin – an extended lacustrine syn-rift of continental crust or hyper-extended crust – implies rifting over downward-convecting ‘cold’ mantle, so it had a reduced thermal input anyway. It is likely that this low geothermal gradient may affect the section outboard of the salt canopy and outer high in the Espirito Santo basin. However, no thick hydrate is observed, and the oceanic crust is some 2 km shallower, implying a higher mantle thermal contribution from upwelling convection cell. This dynamic topography effect uplifting the target actually makes this a very interesting CRED play variant to investigate.
North of the Outer Espirito Santo salt basin is the Sergipe Basin. Here, significant success was achieved by Petrobras in slope channel sequences. However, at base of slope, beyond the mappable inflection point on this magma-rich margin, the play has not been chased. Likewise, in the near conjugate of Equatorial Guinea and Cameroon, the basin floor play is undrilled despite strong indications on seismic seen in Searcher’s recent EG98 reprocessing of the data west of the Ceiba channel system on the basin floor. Here, the counter-regional dip has been extenuated by the Tertiary volcanics in the Cameroon Volcanic line, and Sand input from Rio Muni and Duala is controlled by parallel fracture zone topology.
As discussed, on the transform margin the youngest Oceanic crust is Albian, and the first marine transgression will have allowed restricted marine Albian source rock to have deposited. The CRED play is still relevant, and the counter-regional dip is still very clear (Figure 5), and the Albian is Early Drift in age. Here, and in particular in Western Liberia where Searcher is planning a multi-client 3D to chase sand distribution in the CRED play, there also a Cenomanian / Turonian source rock to chase, and it is inconceivable that oil will not be being generated and migrating out board into huge basin floor fans. The same
may be true in Sierra Leone and Ivory Coast, yet the water depth (potentially another dynamic topography effect, may make this play harder to chase than Western Liberia).
Of course, having identified this play on the African margin of the transform, we can look for conjugate examples along the northern margins of Brazil. This play is certainly visible on data from Ceara and Barreirinhas Basins although it is entirely unexplored and provides the main driver for future exploration in the Para-Maranhao (PAMA) Basin as revealed by Zalan et al in 2019, and Zalan et al 2023.
Every major deepwater discovery of the past decade was derisked by modern 3D seismic data. Yet large parts of the western Atlantic margin still rely on sparse 2D for the deliniation of the CRED play. To unlock this frontier, the industry is now prioritising the use of intelligent wide tow multi-client 3D seismic data, designed specifically to image depositional sedimentology and stratigraphy. Such datasets illuminate both sourcetoreservoir connectivity and subtle stratigraphic amplitude variations, allowing precise identification of traps before a single well is drilled. The prizes to be found are the biggest remaining on Earth, with simple internal structure, high connectivity and permeability. These are then not only the most likely targets to be commercial, but the simple geological premise behind the hydrocarbon play, is not only highly interrogable with modern 3D but open to DHI identification and derisking making the CRED play the most rewarding and lowest risk play we have left. The good news is that this play is so well distributed on Africa’s Southern Atlantic margin – that there is not just one deepwater hot-spot on this margin. Taking inspiration from Pink Floyd’s description of the Moon – ‘there is no hot-spot, as a matter of fact it’s all hot’.
The title of this Article is dedicated to the astronauts of Artemis 2, and with gratitude to the meme-smiths Pink Floyd.
Hodgson, N., Devito, S., Rodriguez, K. and Saunders M. [2017]. Argentine Basin: The new search for oil in one of the least explored basins on planet Earth. First Break, 35(11), 97-101.
Hodgson, N., Found, L. and Rodriguez, K. [2024]. Delivering Sands to Venus and all the Traps between: Orange Basin, Namibia. First Break, 42(7), 55-57. https://doi.org/10.3997/1365-2397.fb2024057
Hodgson, N., Rodriguez, K. and Found, L. [2025]. Ultra-Deepwater: The Lowest Risk Exploration. First Break, 43(5), 57-60. https://doi. org/10.3997/1365-2397.fb2025036
Rodriguez, K., Hodgson, N. and Hewitt, A. [2016]. The Future of Oil Exploration. First Break, 34(2). https://doi.org/10.3997/13652397.34.2.83913
Zalan, P.V., Hodgson, N. and Saunders, M. [2019]. Foz do Amazonas and Pará-Maranhão Basins Ready to Replicate Guyana Success. Search and Discovery, Article #30624. DOI: 10.1306/30624Zalan2019.
Zalan, P.V., Cvetkovic, M., Etherington, R. and Reuber, K. [2023]. The “Golden Lane” of the Pará-Maranhão Basin. First EAGE Conference on Deepwater Equatorial Margin: New Energy Frontier for South America, Extended Abstracts. https://doi.org/10.3997/22144609.202380006
Callie Bradley1* reviews the Cretaceous evolution of the margin and evaluates hydrocarbon prospectivity using a conjugate, segment-by-segment framework, demonstrating that although plays are regionally extensive, prospectivity is highly segmented and strongly controlled by inherited structure, sediment routing, and thermal maturity.
The Equatorial Margins of West Africa and South America are experiencing renewed exploration interest after recent discoveries offshore Côte d’Ivoire (Baleine, Calao, and Calao South) and Brazil (Anhangá, Pitu Oeste), alongside continued success in Guyana–Suriname. Despite a long exploration history and several producing basins, much of the deep and ultradeep water remains underexplored and are considered frontier.
The basins share a common rift-to-breakup geological evolution, and recent discoveries provide important analogues for exploration across the wider margin. However, while geological similarities exist, significant margin- and basin-specific differences must be considered when assessing play potential. This article, making use of the Neftex® solution from Halliburton, reviews the Cretaceous evolution of the margin and evaluates hydrocarbon prospectivity using a conjugate, segment-by-segment framework, demonstrating that although plays are regionally extensive, prospectivity is highly segmented and strongly controlled by inherited structure, sediment routing, and thermal maturity.
The Baleine discovery offshore Côte d’Ivoire in 2021, the largest to date, encountered two key reservoir intervals: an Albian/ Cenomanian shallow-marine carbonate buildup that introduced a new carbonate play to the Ivorian Basin and wider margin, and an overlying Santonian clastic unit. Subsequent discoveries, Calao (2024) and Calao South (2026), intersected multiple Cenomanian deep-marine clastic reservoirs, extending the established Cenomanian deep-water play in the central Ivorian Basin. However, several recent well failures (e.g. Civette and Caracal) highlight persistent exploration risk. Activity continues in the basin with the Bubale Prospect (Figure 1).
In Brazil, the 2024 Anhangá discovery in the ultradeep Potiguar Basin proved Albian deep-marine turbidites, opening a new play type, while the Pitu Oeste discovery extended the deepwater syn-rift faultblock play of Pitu and Pitu North. Exploration continues in the basin, with additional wells planned for 2026, and drilling is ongoing with the Morpho Prospect in the Foz do Amazonas Basin, potentially targeting Upper Cretaceous-Palaeogene Limoeiro Formation turbidites (Figure 1).
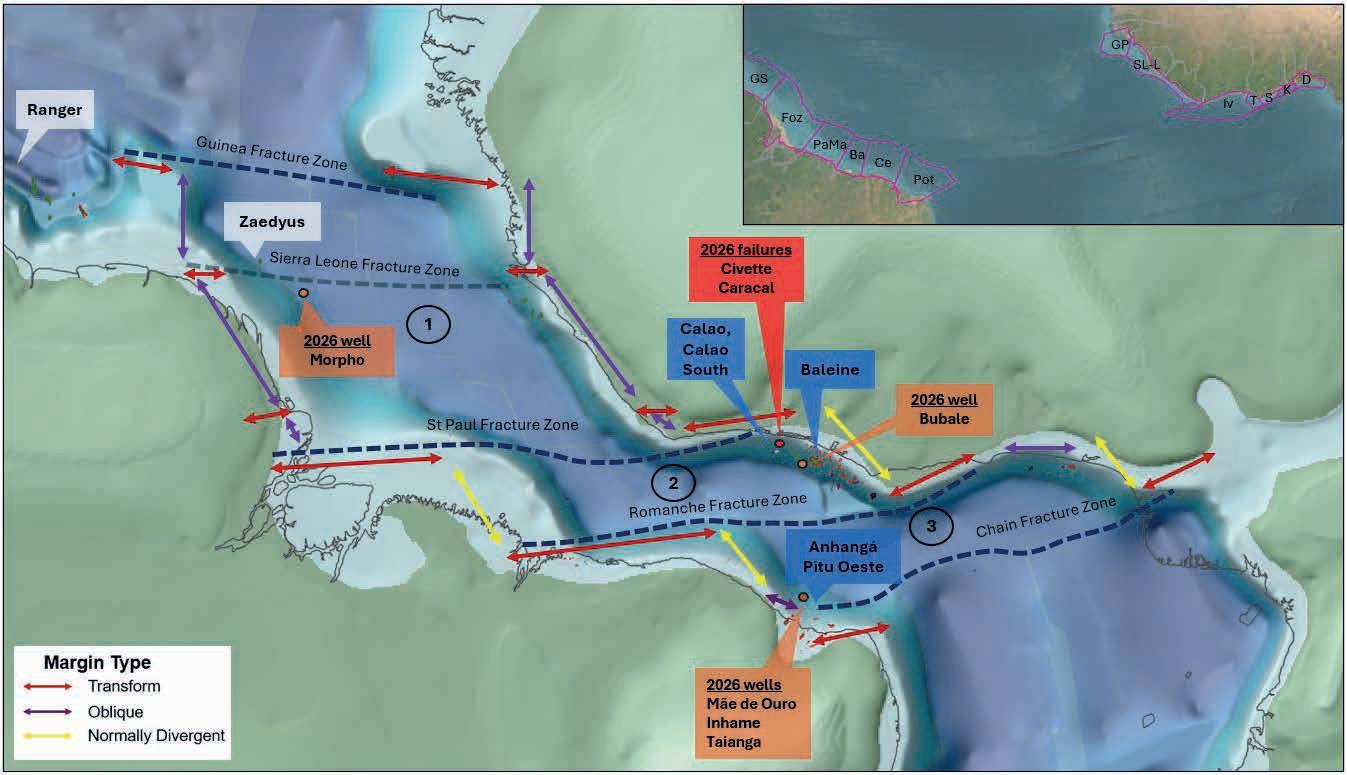
1 Halliburton
* Corresponding author, E-mail: Callie.Bradley@halliburton.com
DOI: 10.3997/1365-2397.fb2026034
Figure 1 Neftex® Paleo Digital Elevation Model (PDEM) of the CenomanianTuronian with oil and gas field locations, key discoveries (blue), planned wells (orange), recent failures (red), analogues (white) and main fracture zones along the Equatorial Margins with numbered segments relating to study comparisons. Margin segments are modified from Ye et al., 2019. Insert: Basins (GS – Guyana-Suriname, Foz – Foz do Amazonas, PaMa –Pará–Maranhão, Ba – Barrerinhas, Ce – Ceará, Pot – Potiguar, GP – Guinea Plateau, Sl-L – Sierra Leone-Liberia, Iv –Ivorian, T – Tano, S – Saltpond, K – Keta, D – Dahomey).
Play Type Age Range
Fault block
Subcrop
Drape anticlines
Rollover anticlines
Early and Late Cretaceous
Early and Late Cretaceous
Early and Late Cretaceous
Early and Late Cretaceous
Updip pinchout Albian
Updip pinchout
Carbonate buildup
Albian-Maastrichtian
Albian/Cenomanian
Table 1 Table highlighting proven Cretaceous play types along the Equatorial Margin.
This article evaluates three key plays: (1) late Albian-early Cenomanian shallow-marine carbonates, (2) Albian-Cenomanian deep-marine clastics, and (3) Santonian-Maastrichtian deep-marine clastics. To assess regional prospectivity, Gross Depositional Environment maps for the Aptian to Campanian have been generated and integrated with Neftex® depth and thermal maturity screening, enabling a broad evaluation of play potential across the margin.
Tectonostratigraphic overview
The Cretaceous represents a critical interval along the Equatorial Margin, linked to the opening of the South Atlantic and marked by numerous discoveries relating to Cretaceous plays (Table 1). The plays addressed in this study are associated with the syntransform and post-rift phases. After widespread Aptian-Albian rifting, which formed pull-apart basins filled with continental to shallow-marine sediments and included periods of organic enrichment, the margin entered a fully transform regime in the late Albian-Cenomanian. Dextral strike-slip motion along major fracture zones persisted until the Santonian when the margin experienced passive margin conditions.
This tectonic evolution generated transpressional ridges of varying scale, particularly near the St Paul and Romanche fracture zones, creating palaeotopography that strongly influenced reservoir and trap development. Global Albian-Turonian oceanic anoxic events promoted the accumulation of organic-rich source rocks that provide the primary charge to these plays, while uplift events supplied sediment to offshore basins, driving reservoir development. Late Cretaceous marine transgressions and the deposition of deep-marine shales ultimately provided regional sealing units.
Understanding drainage and hinterland evolution through sourceto-sink analysis is critical for predicting reservoir distribution and quality in offshore stratigraphy, and for de-risking new play concepts. Integrating Neftex® PaleoDEMs with Earth Systems Science (ESS) products, including palaeodrainage, palaeoclimate, and hinterland quality predictions, improves the representation of petroleum system elements within GDE maps, particularly in data-poor areas. This approach provides predictive insight into Cretaceous drainage evolution, sediment routing, and the quality of sediments delivered to Equatorial Margin basins.
Reservoir Facies
Mixed clastics/carbonates (fluvial/lacustrine/ shallow-marine/deep-marine)
Mixed clastics (fluvial/shallow-marine)
Mixed clastics (shallow/deep-marine)
Mixed clastics/carbonates (fluvial/lacustrine/ shallow-marine)
Shallow-marine clastics
Deep-marine clastics
Shallow-marine carbonates
Present-day hinterland topography differs markedly from Cretaceous palaeogeography. During the Cretaceous period, both margins experienced uplift linked to Early Cretaceous rifting and later Late Cretaceous rift-shoulder uplift (Rouby et al., 2023a, 2023b). These phases enhanced siliciclastic supply, increased sediment flux to offshore basins, and promoted turbidite deposition, while strongly influencing drainage network evolution and reorganisation.
Along the West African margin, short, steep coastal drainage systems sourced sediment from the uplifting Leo-Man Shield into the rift-margin basins, draining small, mineralogically distinct catchments. Through the Late Cretaceous, progressive hinterland erosion drove inland migration of the continental divide, river lengthening, and drainage basin expansion (Figure 2). An ancestral Tano River may have drained a larger catchment prior to capture by the Black Volta in the late Campanian (Addis et al., 2013), while major north-south flowing rivers likely supplied sediment to the Cenomanian-Turonian Abeokuta Formation in Benin (MacGregor et al., 2003).
A comparable evolution is observed along the Brazilian margin. Early short drainage systems transported sediment from uplifting rift shoulders to the onshore Marajó Rift and adjacent basins, with structural arches restricting river length during the syn-rift stage. As these features became inactive and rifts infilled during the Late Cretaceous period, larger river systems developed, including the paleo-Tocantins, which is likely to have utilised the Marajó Rift as a sediment conduit. A larger paleo-Parnaíba River may have supplied sediment to the offshore Ceará Basin before capture by the São Francisco system in the Eocene (Karner & Driscoll, 1999). On both margins, Late Cretaceous drainage expansion and reorganisation are interpreted to explain the high volumes of siliciclastic sediment delivered offshore, with additional Campanian uplift of the Borborema Province relating to magmatism enhancing clastic influx into the Potiguar Basin.
Hinterland quality assessments, using quartz content as a proxy, provide important insight into reservoir quality variations along the Equatorial Margin. Despite incomplete data coverage, the eastern West African margin is characterised by large drainage basins with higher proportions of quartz-rich source areas (Fig-
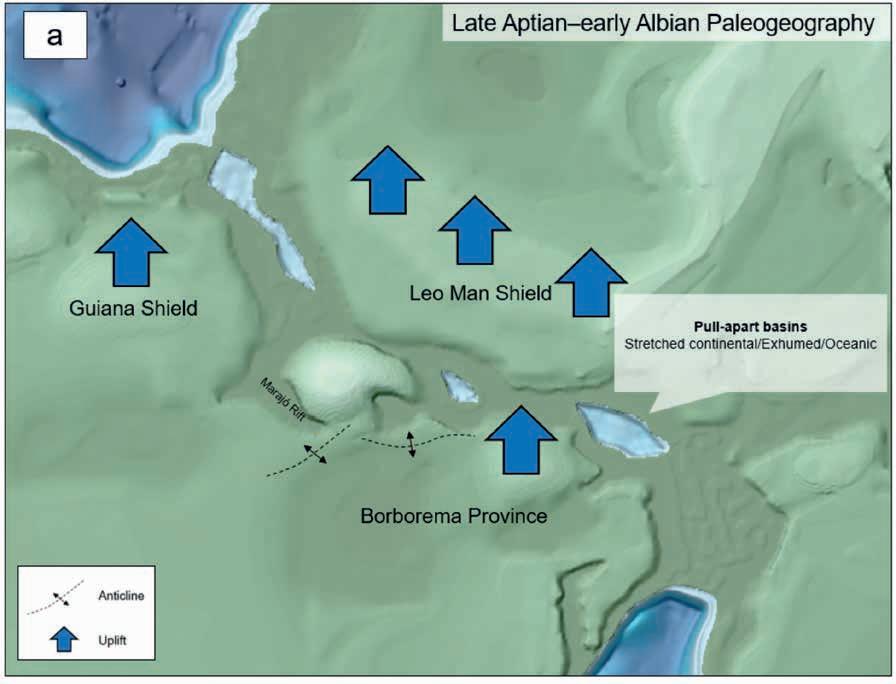
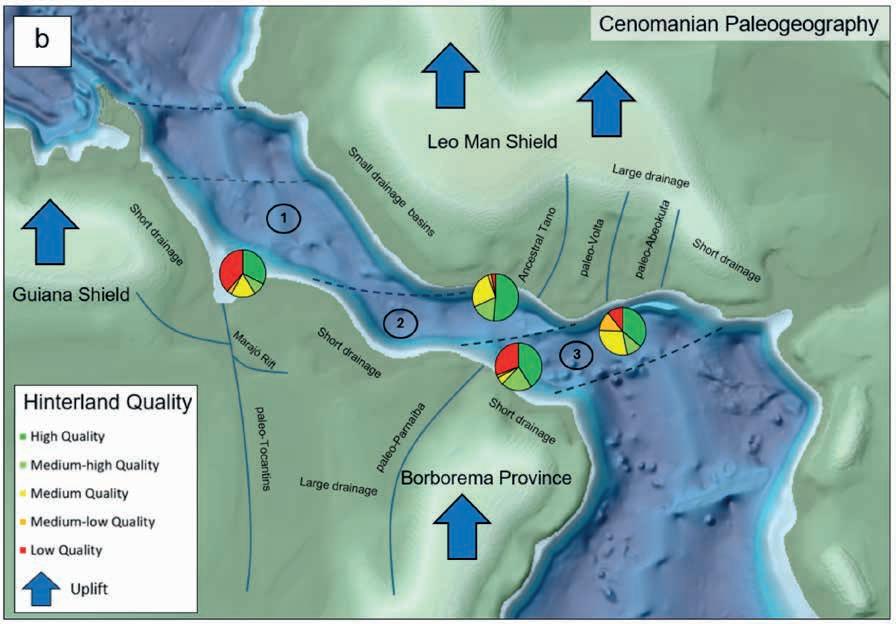
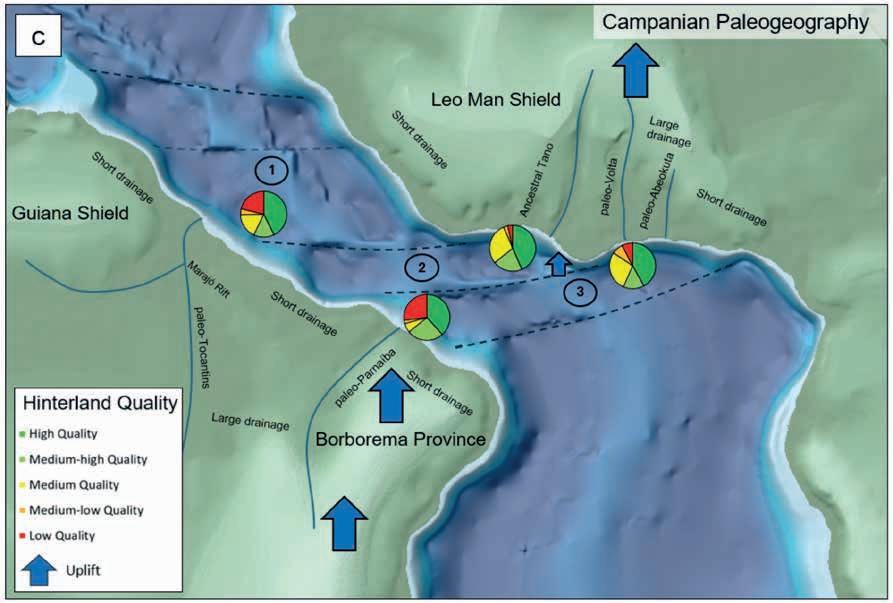
alongside their
ure 2), enhancing reservoir quality in associated deepwater fan systems. This trend is likely to have strengthened through time as basin expansion tapped increasingly quartz-rich hinterlands and longer transport distances improved sediment cleaning, sorting, and mineralogical maturity.
In contrast, shorter drainage systems along the western margin have remained relatively stable in size and drain lower-quality hinterland lithologies, potentially degrading reservoir quality in offshore fan systems and increasing risk in clastic plays. A broadly comparable pattern is observed on the South American margin, although hinterland datasets are more limited. Larger river systems in the eastern sector either access higher-quality source regions or benefit from prolonged sediment transport that enhances sediment maturity, whereas shorter systems drain more heterogeneous sources with limited opportunity for sediment improvement.
Overall, basins fed by larger river systems and more quartzrich hinterlands, or by actively uplifting quartz-rich source regions irrespective of drainage size, are more likely to host thick, high-quality deep-water reservoirs, improving the prospectivity of associated clastic plays.
Both conjugate margins host proven and/or potential Early-Late Cretaceous source rocks. This study focuses on predicted late Albian and Cenomanian-Turonian source intervals as the primary charge for the plays discussed. Neftex® regional depth analysis integrated with first-pass maturity screening workflows highlight broad present-day maturity trends across these intervals (see Plays section). Maturity estimates are based on industry-standard depth thresholds for oil and gas generation from Type II kerogen within the late Albian and Cenomanian-Turonian successions.
For comparative analysis in this article, the margin is segmented into three conjugate domains (Figure 1):
• Segment 1: Guinea Fracture Zone to St Paul Fracture Zone
• Segment 2: St Paul Fracture Zone to Romanche Fracture Zone
• Segment 3: Romanche Fracture Zone to Chain Fracture Zone
The Baleine discovery in the Ivorian Basin demonstrated the viability of late Albian-early Cenomanian shallow-marine carbonate buildups along the Equatorial Margin, highlighting the role of structural topography in providing favourable growth sites. Geological controls on carbonate development vary markedly along the margin, with clearer insights emerging from segment-by-segment comparison.
In central Segment 2, the Ivorian and Tano basins offer the most favourable conditions for carbonate buildup development. Remnant syn-rift basement highs, inverted syn-transform structures and extinct breakup-related volcanoes form numerous elevated sites for carbonate growth (Figure 3). Additional relief generated by breakup-related extension and late Albian-Cenomanian transpression helped to preserve abundant palaeotopography, making these basins the most prospective. Along the outer shelf
and slope, predicted isolated buildups commonly coincide with late Albian oil-mature source rocks, whereas equivalent shelfal source rocks remain immature and may pose a charge risk.
By contrast, the conjugate Barreirinhas Basin evolved differently, with the Romanche Fracture Zone dividing it into shallow and deepwater sub-basins. Although rift-related topography identified in the deepwater sub-basin (de Castro et al., 2025) may host isolated buildups, opportunities appear more limited than in the West African conjugate and commonly overlap gas-mature source rock intervals, reducing overall prospectivity.
In Segment 1, carbonate prospectivity shares some similarities with Segment 2 but is generally less pronounced. Along the West African margin, this segment is characterised by breakup-related volcanism, syn-rift tilted blocks, syn-transform transpressional structures, and uplift and truncation of Late Cretaceous strata (Bennet & Rusk, 2002). The Liberia Basin hosts late Albian shallow-marine carbonates (e.g. Narina-1), interpreted as small, isolated buildups developed on local structural highs, reflecting more limited palaeotopographic relief than in the Ivorian and Tano basins. Source rock maturity is variable, with more favourable conditions offshore Guinea. Along the present-day slope, potential buildup locations coincide with oil-to-gas-mature Late Albian source rocks, leaving reservoir presence and quality as the principal risks. On the conjugate Brazilian margin, Segment 1 is dominated by grabens with limited post-rift deformation in deep water outside the Amazon Cone. In the northwest Foz do Amazonas Basin, carbonate buildups preferentially formed on remnant syn-rift topography beneath the shallow shelf (Boulila et al., 2020), while in the Pará–Maranhão Basin they developed on volcanic edifices emplaced shortly after break-up on newly formed oceanic crust (Zalan et al., 2023). These volcanic highs provide an analogue to the Ranger discovery in the Guyana-Suriname Basin, where Albian carbonates form an additional play alongside established deep-marine clastics. However, predicted buildups largely coincide with overmature late Albian source rocks, highlighting a key charge risk.
Segment 3 appears to be the least prospective for this play on both margins. Although structural elements, such as oblique extension and inherited syn-rift palaeotopography, are shared with Segment 2, the offshore structural expression is more subdued, reflecting weaker syn-transform inversion and increasing uncertainty in reservoir presence. In the Potiguar Basin, Late Albian carbonates are locally productive in shallow water (e.g. Sirri Field; ANP, 2015) but are generally poor reservoirs elsewhere due to pervasive diagenesis. Outboard, structures are onlapped and draped by deep-marine sands, as demonstrated by the Anhangá discovery, suggesting diminishing topographic relief for carbonate growth despite favourable charge conditions.
On the conjugate African margin, carbonates are typically argillaceous, with major north-south river systems supplying large volumes of siliciclastics to the Albian-Turonian successions offshore Benin, limiting carbonate development. Sparse seismic coverage offshore western Nigeria adds structural uncertainty, though the margin may be analogous to the Tano
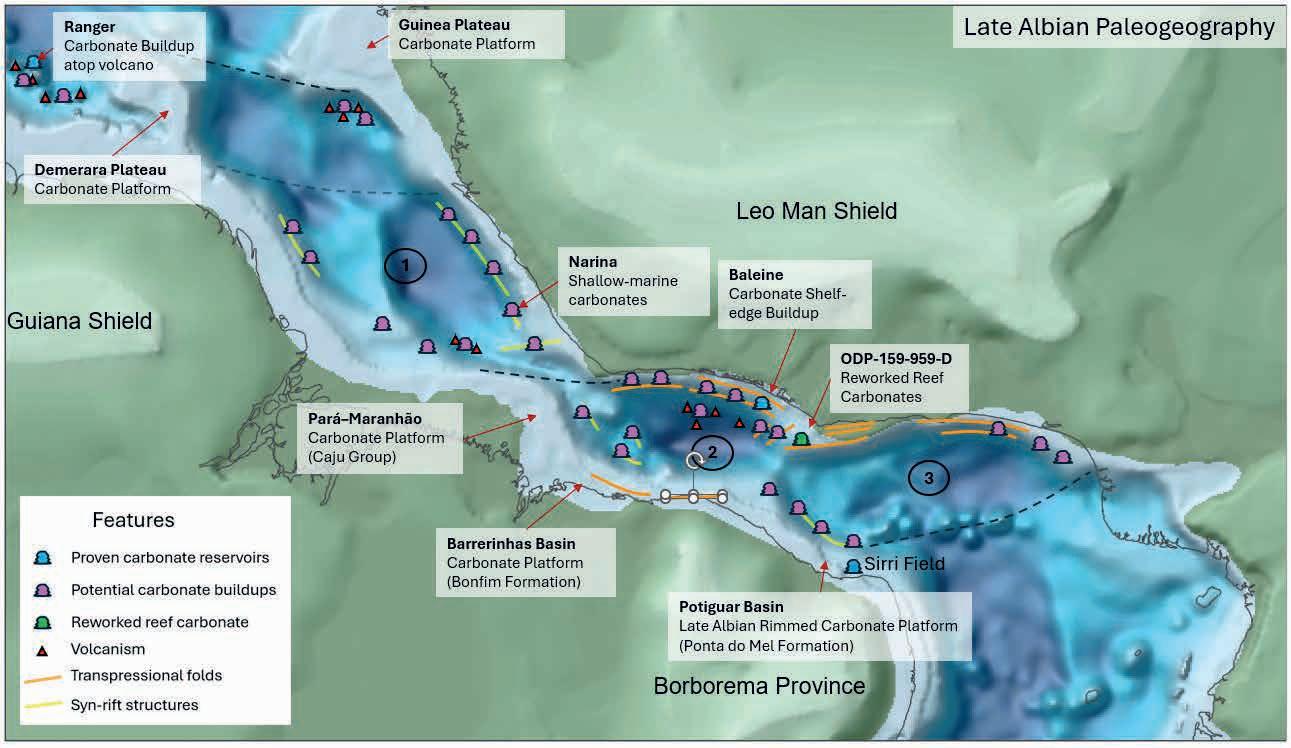
Basin, where greater segmentation promoted carbonate accumulation, albeit with potential deepwater overmaturity risks to source rock.
Overall, carbonate distribution and reservoir quality across both margins are strongly controlled by the preservation of palaeotopography and siliciclastic input. Many West African examples are marl-rich and poor quality, locally acting as seals (e.g. South Tano Field), while diagenesis reduces reservoir quality in parts of Brazil (e.g. Ponta do Mel Formation). Nevertheless, ESS predictions place the Late Albian Equatorial Margin within the same tropical belt as the Eastern Mediterranean and Middle East, where rudist platforms form prolific reservoirs. Locally, where shallow, elevated, low sediment conditions persisted, isolated buildups remained viable, suggesting scope for Baleine-style success to be repeated.
The Albian-Cenomanian deep-marine clastic play is recognised across several Equatorial Margin segments. Although multiple discoveries demonstrate the presence of high-quality reservoirs, the play remains underexplored and unevenly tested.
In Segment 2, Albian-Cenomanian deep-marine clastics are proven in the Ivorian and Tano basins, where the Calao and Calao South discoveries extend the established play westward into the central Ivorian Basin. This sector is particularly favourable for sand accumulation due to quartz-rich hinterlands, large river systems, a wide shelf, gentle slope, and low-relief seabed over thinned continental crust. These conditions promoted sand retention within intraslope depocentres, supporting a range of stratigraphic–structural traps including ponded sands, bypass ramps, and pinchouts. Further west, the steep transform margin associated with the St Paul Fracture Zone encourages sediment bypass onto oceanic crust, increasing the importance of stratigraphic pinchouts and locally volcanic-related trapping (Burrell, 2024). Source-rock maturity models indicate remaining potential, particularly along the present-day slope. Although Civette data are undisclosed, its updip position relative to Calao suggests charge risk may have contributed to failure, with Late Albian and Cenomanian-Turonian source rocks predicted to be immature. On the South American conjugate, this play is less developed, with carbonate dominance limiting deep-marine
clastic deposition. Where present, sands are likely thin and structurally trapped by gravity-driven deformation along the unstable Barreirinhas shelf, implying limited trap volumes.
In Segment 3, both the Potiguar and Ceará basins contain proven or promising Albian-Cenomanian reservoirs. The 2024 Anhangá discovery in the Potiguar Basin confirms deep-marine sandstones of the Quebradas Formation within stratigraphic traps where sands drape or pinch out against inherited structural highs. Seismic data show widespread fans and channels fed from the Borborema Province via early post-rift canyon systems (Figure 4). In the Ceará Basin, sandstones are concentrated within the Mundaú Sub-basin and were delivered by the large paleo-Parnaíba River, with distribution strongly influenced by seabed morphology and intrusive activity. Late Albian source rocks are interpreted to be oil- and gas-mature in both basins, supporting play potential, though reservoir quality remains a risk in Potiguar due to medium-to-low-quality hinterland supply.
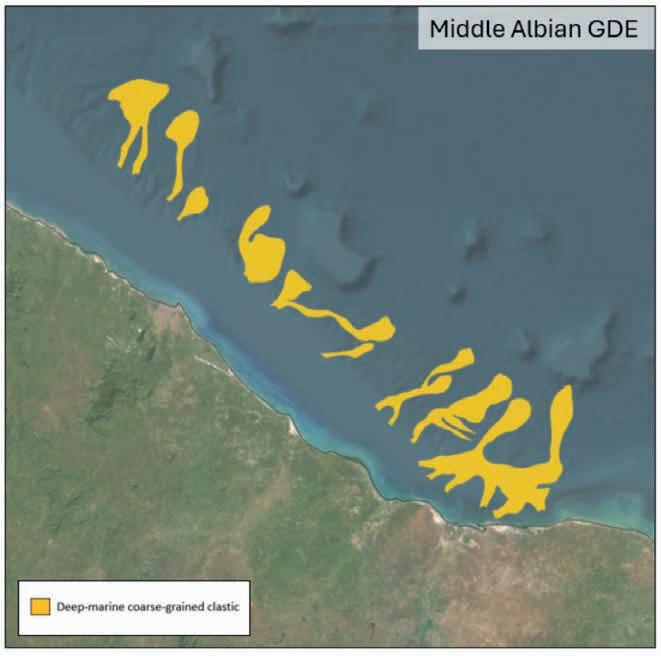
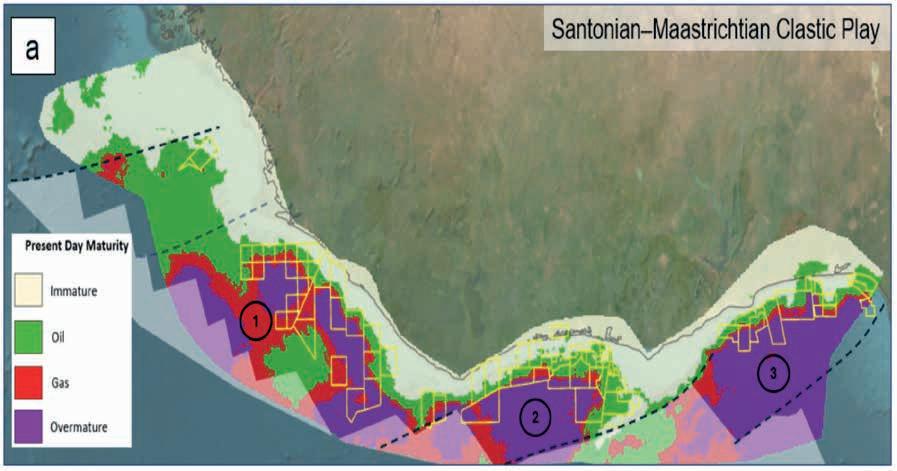
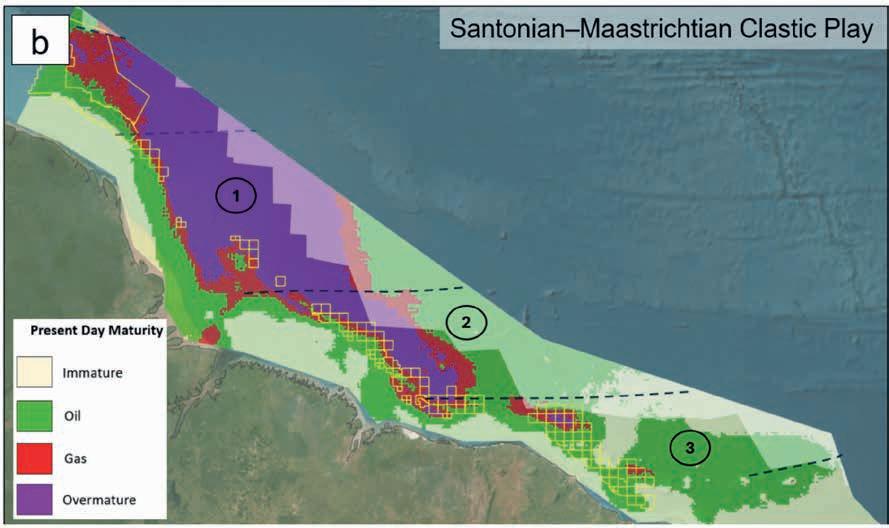
On the West African side, the Keta and Dahomey basins have seen limited success to date; however, syn-transform folds and synclinal traps, particularly where Cenomanian channels may have flowed parallel to fold axes, remain underexplored. Many areas along the present-day slope coincide with predicted oil- and gas-mature source rocks. High-quality Abeokuta Formation sands may be sourced from major north-south palaeodrainage systems. In deeper, frontier areas, mapped Cenomanian channel systems offer additional potential (Rovira et al., 2024), although trapping options are limited and predicted late Albian overmaturity introduces a charge risk.
In Segment 1 on the West African margin, numerous mapped prospects occur within the Albian-Cenomanian interval, with source rocks predicted to be oil mature offshore Guinea. However, mixed hinterland quality represents a key risk to reservoir quality, an example being the unsuccessful Fatala-1. Albian-Cenomanian targets are expected within the undrilled frontier Harper Sub-basin, which benefits from predicted oiland gas-mature late Albian source rocks in deep water.
On the conjugate margin, the Pará–Maranhão and northwestern Foz do Amazonas basins show encouraging potential. High-quality sands sourced from the paleo-Tocantins River are supplemented by mixed-quality sands from shorter drainage systems draining the uplifting Guiana Shield. In the Pará-Maranhão Basin, volcanic edifices provide additional trapping potential where sediments onlap or drape volcanic highs, analogous to
Figure 5 Present-day maturity predictions for the Cenomanian-Turonian source rock interval, highgraded licence blocks highlighted in yellow, areas with crust not yet formed for source rock absence (white shade) for a) West Africa b) South America.
trapping styles observed in the deeper Ivorian-Tano basins and offshore Guinea. In the northwestern Foz do Amazonas Basin, deep-marine clastics are commonly confined within troughs between basement highs, enhancing pinchout-style stratigraphic traps (da Cruz et al., 2021). When integrated with source rock maturity predictions, the northwestern Foz do Amazonas Basin emerges as the most prospective area for this play.
Santonian-Maastrichtian deep-marine clastic play
Santonian-Maastrichtian deep-marine clastic reservoirs are proven on both the Brazilian and West African Equatorial Margins, though discoveries remain limited and are largely confined to shallow-water settings.
In Segment 2, several small discoveries have been made in the eastern and central Ivorian and Tano basins, spanning early exploration in the late 1980s-1990s to more recent campaigns (e.g. the upper Baleine reservoir). Additional potential exists in the underexplored western, central and deeper basin areas, although late-stage tectonism and trap breach represent key risks and have contributed to deepwater well failures (Sayers et al., 2025). In deeper settings, Late Cretaceous sediments drape oceanic crustal highs forming four-way dip closures fed by canyon systems that cut syn-transform structures. Progressive reduction of palaeotopography since the post-rift phase is likely to increase seal risk and limits the development
of isolated sand bodies. The most favourable area lies along the present-day slope, where late Albian and Cenomanian-Turonian source rocks are predicted to be oil- and gas-mature (Figure 5). The Bubale Prospect, located between the Rossignol and Pelican discoveries, is likely to be targeting similar fan-channel systems and benefits from improved charge conditions relative to Civette and Caracal. Further outboard, basin floor fans are widespread and locally influenced by volcanic relief, although overmaturity poses a risk. On the conjugate margin, the Barreirinhas and Pará-Maranhão basins contain mapped Santonian-Maastrichtian fans with numerous seismic leads, including pinchouts analogous to the Jubilee discovery in the Tano Basin. Gravity-driven deformation enhances mixed structural-stratigraphic trapping styles. However, many prospects overlie predominantly gas- mature source rocks, and reservoir quality and thickness remain key risks due to short drainage systems tapping mixed-quality hinterlands and limited hinterland uplift.
In Segment 1, multiple slope fan and channel leads are identified in the Sierra Leone-Liberia Basin, though untested basin-floor fans face charge risk due to overmature source rocks and variable hinterland quality. On the conjugate side, the Pará-Maranhão Basin has delivered sub-commercial results (e.g. 1MAS5), but seismic evidence suggests deep and ultradeepwater fans may still be present. In the northwestern Foz do Amazonas Basin, Santonian-Maastrichtian fans and channels are recognised along trend with the Zaedyus discovery offshore French Guiana. Unlike French Guiana, where multiple failures reduce prospectivity, this region remains promising (Avila et al., 2022). The Morpho Prospect is likely to be targeting this interval, where source rocks are predicted to be oil- and gas-mature, albeit with risks related to trap and seal integrity.
In Segment 3, the Ceará Basin contains proven Upper Cretaceous reservoirs, with the shallow-water Espada Field confirming sand-rich Santonian-Maastrichtian intervals. Although deepwater areas remain untested, well data indicate that the presence of reservoir-quality sands may occur. In the Potiguar Basin, Santonian-Maastrichtian reservoirs occur offshore and are closely linked to uplift events. Uplift of the Borborema Province, associated with Campanian alkaline magmatism during the Campanian, generated shelf-edge canyons, increased sediment flux, and delivered sands into deepwater, where Cenomanian-Turonian source rocks are predicted to be oil to gas mature, reducing charge risk.
On the West African margin, deepwater stratigraphic pinchout traps in the Keta Basin remain prospective, with predicted good-quality sands aligned with oil- and gas-mature source rocks, although overmaturity and trap integrity related to Santonian transform reactivation pose risks. Offshore Benin, transpressional anticlines and adjacent synclines may host reservoir-quality sandstones, though Santonian reactivation is likely to have allowed partial sediment bypass to the basinfloor. Santonian channel systems in the deeper Dahomey Basin indicate sustained north-south sediment supply (Rovira, 2024). Along the present-day slope, Cenomanian-Turonian source rocks are predicted to be oil- and gas-mature, supporting remaining deepwater potential.
Recent discoveries confirm that the Cretaceous petroleum systems of the Equatorial Margins of West Africa and South America host multiple viable plays, but prospectivity is highly heterogeneous and strongly controlled by inherited structure, sediment routing, hinterland quality, and sourcerock maturity. Although play elements are regionally widespread, exploration success is governed by local geological factors.
Late Albian-early Cenomanian carbonate buildups are proven but spatially restricted, with Segment 2 (Ivorian–Tano basins) offering the highest potential where syn-rift and transform-related palaeotopography is preserved and charge conditions are favourable. Carbonate prospectivity diminishes in Segments 1 and 3 due to reduced relief, increased siliciclastic input, diagenesis, and widespread overmaturity.
Albian-Cenomanian deep-marine clastic plays represent the most robust opportunities along the margin, particularly in Segment 2 and parts of Segment 3, where quartz-rich hinterlands, favourable shelf-slope morphology, and mature source rocks support extensive sand development and trapping. Santonian-Maastrichtian deep-marine clastics are present but higher risk, with prospectivity limited by late-stage tectonism, trap degradation, and source rock maturity, though localised deepwater opportunities remain.
Source-to-sink analysis highlights the critical influence of Late Cretaceous uplift, drainage reorganisation, and hinterland composition on reservoir quality and distribution. Integrating palaeogeography, depositional environment mapping, and maturity screening provides an effective framework for derisking frontier plays along this segmented margin. The Neftex® solution supports this regional screening by enabling reproducible, marginscale assessment that helps to focus subsequent detailed geological and geophysical analysis.
If you would like more information on the recent Neftex research into this area or more details on the potential of the Atlantic Equatorial Margins, as only the summary of which has been discussed in this article, please contact us at LandmarkSupport@halliburton.com.
I would like to thank Richard James, Joseph Jennings, Graeme Nicoll and Colin Saunders for their valuable comments and suggestions when reviewing this article.
Abelha, M. [2015]. Brazilian Carbonate Oil Fields: A Perspective. Agencia Nacional do Petroleo, Gas Natural e Biocombustiveis (ANP) Brazil, Presentation.
Addis, D., Brown, A., Grant, J., Kline, P., Layman, J. and Towle, P. [2013]. Influences of Tectonics, Drainage and Sediment supply of Upper Cretaceous Deepwater Deposits in the Deep Ivorian Basin of Western Ghana and Cote D’Ivoire. 12th PESGB/HGS Conference on African E&P, Extended Abstracts
Ávila, R.M., Vital, J.C.D.S., Travassos, R.D.M. and Funke, T. [2022]. Late K-Sandstone Turbidite. Are There Any Analogies between the Foz Do Amazonas Basin in Brazil and the Discoveries in Guy-
ana-Suriname? First EAGE Guyana-Suriname Basin Conference, Extended Abstracts
Boulila, S., Brange, C., Cruz, A.M., Laskar, J., Gorini, C., Reis, T.D. and Silva, C.G. [2020]. Astronomical pacing of Late Cretaceous thirdand second-order sea-level sequences in the Foz do Amazonas Basin. Marine and Petroleum Geology, 117, 1-16.
De Castro, D.L., de Oliviera, D.C., Filho, O.K. and Melo, A.C.C. [2025]. Geophysical characterization of multiphase rifting in the central divergent transform segment of the Brazilian Equatorial Margin. 86th EAGE Annual Conference & Exhibition, Extended Abstracts.
Karner, G.D. and Driscoll, N.W. [1999]. Tectonic and stratigraphic development of the West African and eastern Brazilian Margins: Insights form quantitative basin modelling. In N.R. Cameron, R.H. Bate and V.S. Clure (Eds.), The Oil and Gas Habitats of the South Atlantic. Geological Society of London – Special Publications, 153, 11-40.
Macgregor, D.S., Robinson, J. and Spear, G. [2003]. Play fairways of the Gulf of Guinea transform margin. In T.J. Arthur, D.S. Macgregor and N.R. Cameron (Eds.), Petroleum Geology of Africa – New Themes and Developing Technologies. Geological Society of London – Special Publications, 207, 131-150.
Rouby, D., Ye, J., Chardon, D., Loparev, A., Wildman, M. and Dall’Asta, M. [2023]. Source-To-Sink Sedimentary Budget of the African


Equatorial Atlantic Rifted Margin. Geochemistry, Geophysics, Geosystems, 24(12), 1-22.
Rouby, D., Loparev, A., Chardon, D., Bajolet, F., Dall’Asta, M., Paquet, F., Fillon, C., Roig, J. and Ye, J. [2023]. Sediment routing systems to the Atlantic rifted margin of the Guiana Shield. Geosphere, 19(3), 957-974.
Rovira, P. [2024]. Integrating Regional 2D Seismic Mapping and 3D Seismic Spectral Decomposition to Understand the Fairway Evolution of Offshore Benin. First Break, 42(7), 59-64.
Sayers, B. and Tyrell, M. [2025]. Are half of the Tano Basin’s reservoirs in the Keta Basin? GEO ExPro, 22(4), 48-49.
Scarselli, N., Duval, G., Martin, J., McClay, K. and Toothill, S. [2018]. Insights into the Early Evolution of the Côte d’Ivoire Margin (West Africa). In Passive Margins: Tectonics, Sedimentation and Magmatism, Geological Society of London (Geological Society Publishing House), 1-25.
Ye, J., Rouby, D., Chardon, D., Dall’asta, M., Guillocheau, F., Robin, C. and Ferry, J.N. [2019]. Post-rift stratigraphic architectures along the African margin of the Equatorial Atlantic: Part I the influence of extension obliquity. Tectonophysics, 753, 49-62.
Zalan, P., Cvetkovic, M., Etherington, R. and Reuber, K. [2023]. The “Golden Lane” of the Pará-Maranhão Basin. First EAGE Conference on Deepwater Equatorial Margin: New Energy Frontier for South America, Extended Abstracts


Exploration - Production Present Highlights and Future Plans and Challenges


- Petroleum Systems of the Caribbean and Guyana
- Geology and Geotectonics of the Caribbean and North-South Atlantic


- New and Applied Technologies


- Opportunities in the Energy Transition


- Environmental and Regulatory framework


Mike Lakin1* explains why exploration of oil and gas will be needed for years to come and where to find it.
Introduction
My previous articles on upstream hotspots over the last few years have focused on why all the renewable sources of energy being used to replace the more emissive sources of hydrocarbon energy are often not as green as they are made out to be or as yet, incapable of affordably replacing the world’s current 80% dependence on oil and gas for its secure energy, let alone in the timescale many are expecting.
I’m pleased to say that we are now seeing far more public evidence of the ‘facts’ in the media and even by politicians that are realising that 1+1 really does not yet make 6, and that an achievable and affordable energy transition is simply not possible without more hydrocarbons. Also, that dependence on renewables alone is unlikely to generate the energy needed and worse, has simply moved the emissions elsewhere. Just like the UK, which has stopped new exploration and become reliant on LNG imports which are substantially more emissive than exploiting the remaining resources in the North Sea first. This would also ensure more security of supply as the Middle East conflict has laid bare. Perhaps this is the crisis the previous articles suggested was likely to be needed for a switch to a more achievable transition plan?
I must reiterate that I, and many people I talk with in the upstream business, are absolutely NOT against energy transition but simply want to see a plan which can work and that truly reduces emissions over time but in a way that ensures there is still
affordable energy for both people to live, work and the economy to grow and thrive. i.e. enough secure and less emissive energy in a way that is Achievable, Affordable and Acceptable (the old 3 As of Transition) to the majority, that are then more willing to make the transition happen.
Almost all models of successful economic growth are based on a secure source of affordable (dare I say cheap) power. Expensive energy like the UK now has, including the most expensive industrial power in the world, does the complete opposite.
The following graphic clearly shows the world’s huge challenge to transition due to its continued and complete dependence on fossil fuels. This electricity will clearly need a multi-generational effort to replace oil, gas and coal being used globally. The graph most importantly, also shows very clearly, the historical slower speed of past energy transitions which is unlikely to happen much faster in replacing fossil fuels.
Energy demand: It is unlikely that world energy demand will ever decrease. As the desire and demand for the trappings of prosperity increase, so does energy use. This energy demand, along with food and water will become huge issues as the world’s population wants to become increasingly affluent.
Energy transition planning facts: The current crisis in the Middle East has perhaps not yet really progressed enough to change present transition planning, but it could well do so if, as is now being suggested (at the time of writing in mid-April 2026),
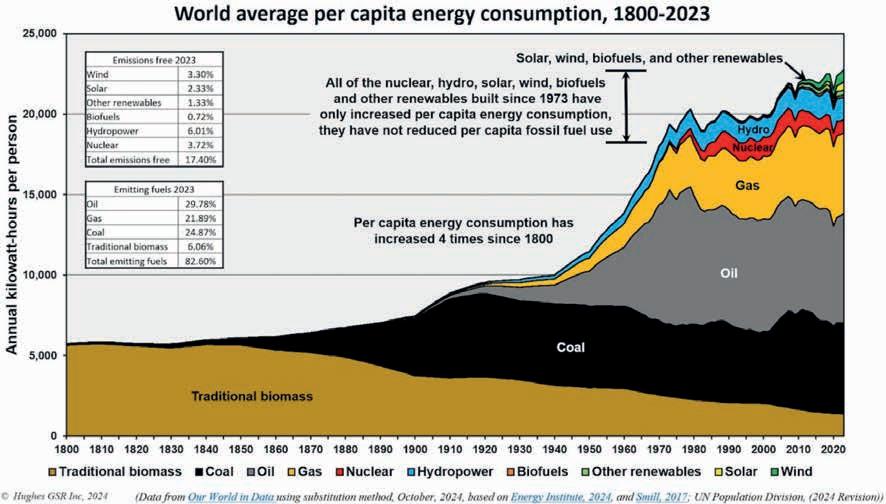
1 Envoi Litd
* Corresponding author, E-mail: mikelakin@envoi.co.uk
DOI: 10.3997/1365-2397.fb2026035
Figure 1 Graph showing historical energy transitions and challenges to changing the world’s dependence on hydrocarbons in anything but decades not years.
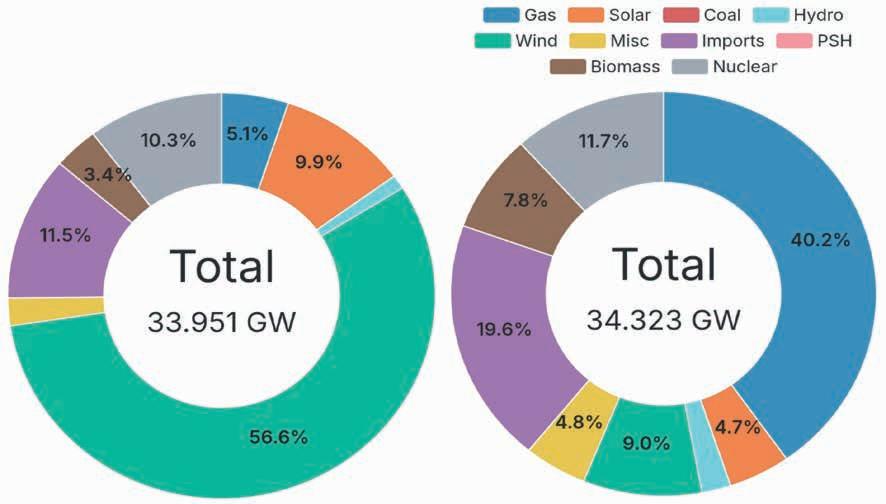
could severely limit energy and product supply and even lead to a global recession.
The UK, for example, is using no less oil albeit yes, is now less dependent on gas with its 10,000 wind turbines but, only when it’s windy. Solar is an increasing part of the equation too but limited if it is not sunny.
That said, when it’s not windy and sunny, the UK, like other European countries with similar transition plans, is still completely reliant upon gas (and in some cases coal) power generation to fill the gaps. This increasingly comes from LNG imports versus exploiting the remaining domestic oil and gas reserves. In the UK this has declined rapidly due to new exploration being restricted or banned. Such ‘switch off’ rather than slower transition policies is often claimed to have reduced emissions but this is largely due to the total emissions of producing and transporting LNG from the Middle East and the USA are not reported. The simple fact is that domestically produced hydrocarbons are always going to generate less emissions than imported LNG. This difference can be significant as demonstrated by the calculations which show that gas produced onshore UK could be up to 50 X less emissive than the same gas imported as LNG.
2 Sources of UK Power Generation on 15th March 2026 @ 09:05 compared with 4 days earlier on 19 th March 22 @ 08:05.
A big transition challenge: It’s therefore obvious we need new sources of secure and less emissive energy (i.e. available when its needed and a back up to the likes of wind and solar) but this ‘challenge’ will involve changing the world’s current hydrocarbon economy (based on 80% of its energy from hydrocarbons) and turn it into an electrical economy.
There is no doubt that wind and solar can reduce emissions, but as both are dependent upon the weather for wind and sun (helped partly it seems from the convenient accounting shift of the emissions offshore), neither is able to achieve the energy security required without a mix of other more secure energies.
This is a huge challenge, highlighted by simply looking at the current energy use by the average house in the UK which remains 80% dependent upon gas which means only 20% is electrical power. This electricity is currently between 4-5 times the cost of an equivalent unit (kWh – Kilowatt hour) of gas. Also, where the UK already struggles with its capacity (as highlighted in my March 2025 article See also recent evidence of UK power generation in Figure 2) to generate enough electricity now to fulfil the 20%, particularly when it is not windy and sunny and dependent upon importing LNG for the gas it needs. This is also
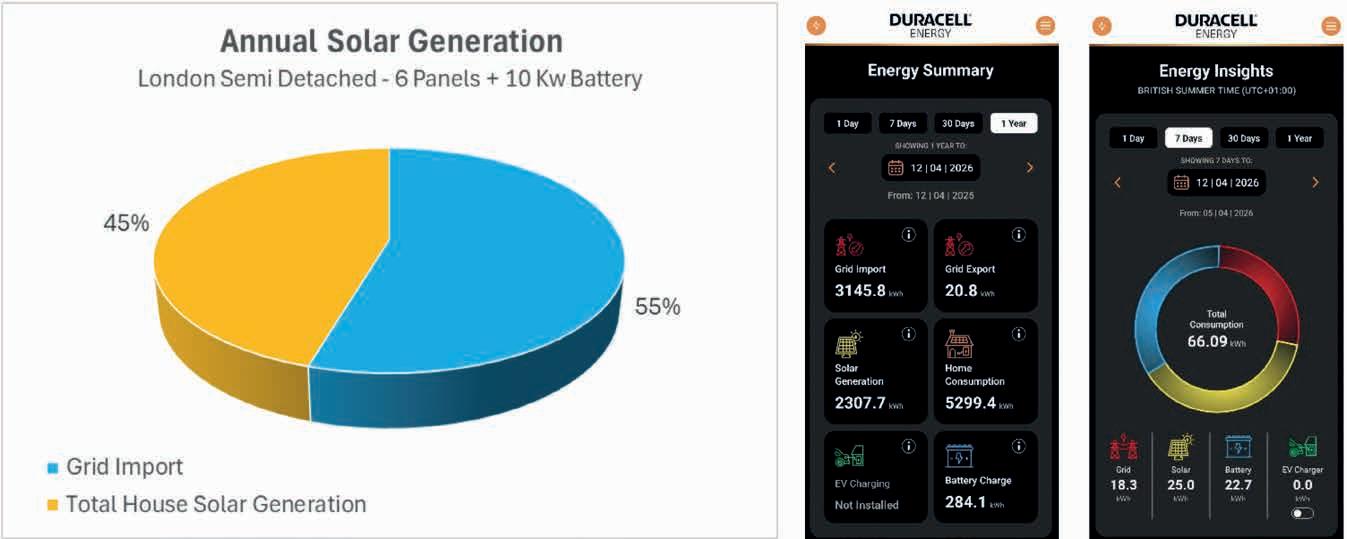
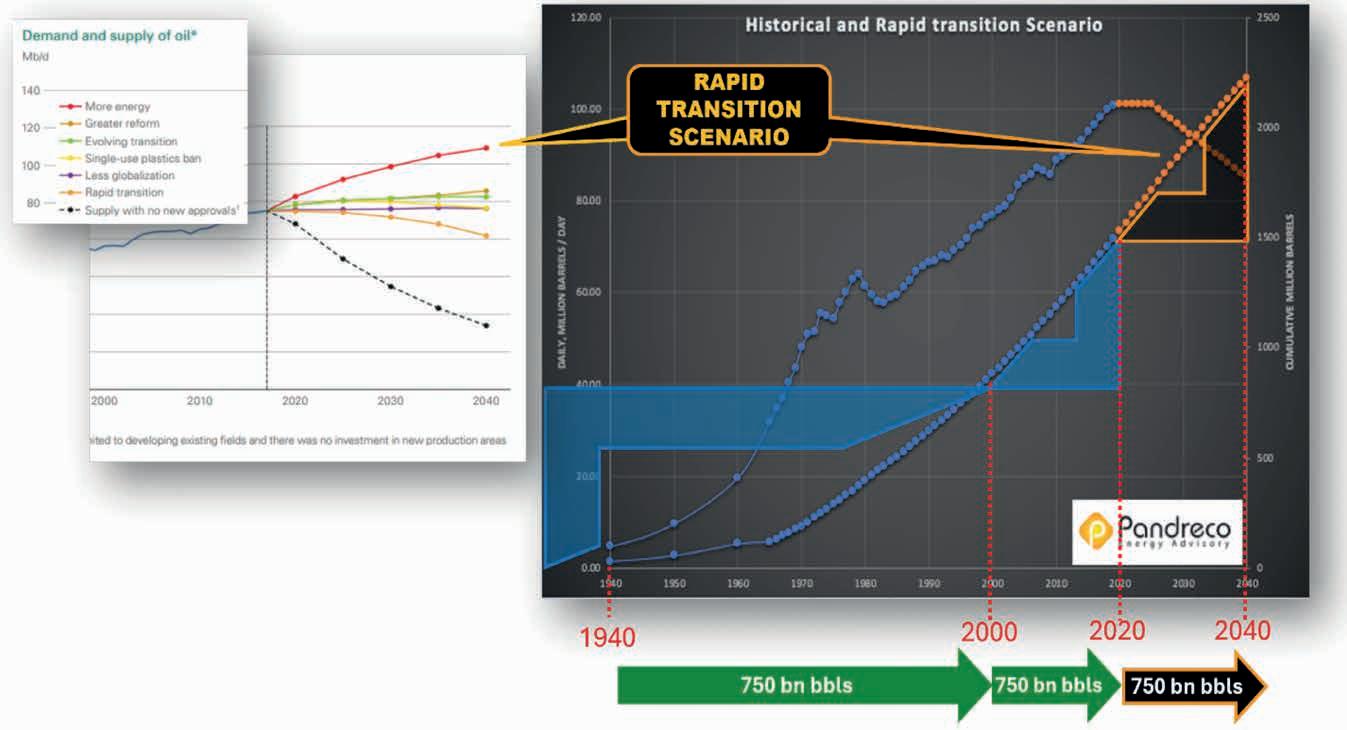
before there is the huge upgrade needed to the power infrastructure to get all the new but as yet electrical energy generation to where it is needed.
Realistic transition solutions: Perhaps one should start with reference to the dictionary definition of ‘transition’ which is clear that it’s a ‘slow change’, and not the ‘switch off’ policies we’ve experienced these last 10 partly wasted years, involving unachievable political ‘net zero’ targets and less secure sources of renewable energy.
On a small scale, solar and more insulation in more houses would help to reduce grid demand but most of the kit to do this is not manufactured in the UK and has to be imported. It arguably could be with the right commercial incentives but is certainly not going to happen overnight.
As an example, take my semi-detached Edwardian house in London on which we installed just 6 solar panels and 2 x 5 Kw battery storage 2 years ago which has generated about 45% of the electrical power the house has needed over the last 12 months including through our northern hemisphere winter season. In the last week alone, this has increased to around 66% of my electrical power needs with the lighter days (Ref: Screen Shots in Figure 3).
If every house had such an installation, we’d all be using quite a bit less electrical power from the grid. If the local infrastructure was equally modified to accept more of the excess power such installation can generate when its sunny, surely this is a more effective, achievable and affordable contribution to reducing emissions.
Achievable transition – More oil and gas, not less: Most of the upstream sector realises that transition is inevitable, with many of the bigger E&P companies likely to be key drivers once oil and gas has a realistic achievable and affordable replacement. Several big companies which refocused on big renewable energy projects due to shareholder and political pressures have since, but
found they are far less commercial than oil and gas at this early stage of the transition
Perhaps more relevant, is that predictions suggest that as much as 700 MMbbls of undiscovered hydrocarbons is still needed to fulfil the world’s needs over the next 30+ years even with the fastest energy transition scenarios as Figure 4 suggests. Where and who will be responsible for finding all this new oil and gas to ‘fill the secure energy gap’ is a key question.
E&P Market Status: The current A&D market over the last 12 months or so shows that perhaps the upstream sector is ahead of this question as the appetite for new E&P is clear. This has definitely improved for all the reasons discussed above and the realisation that more E&P is needed regardless of the political agendas and also the recognition that whilst encompassing renewables into the energy mix, the investments made to date have simply not yet generated the returns that oil and gas still does. These revenues are needed to find the new oil and gas still needed and invest in an achievable transition.
It is therefore not unsurprising that much of the serious new interest in exploration is from the larger E&P sector companies which have existing production cash flows. This includes not only the majors and large independents but a noticeable increase in NOCs investing internationally.
Over the last decade, however, this change follows the majors’ focus on investing more in low carbon energies, dividends to their shareholders and strengthening their balance sheets rather than reserve replacement through exploration which was a key metric in the past. The graphs in Figure 5 taken from a presentation by Rystad in late 2025 show this and the decline of reserves replacement to more like 50% over the last decade.
It’s not that the rest of the remaining E&P companies don’t want to do E&P deals but their ability to raise any risk money and particularly for any exploration including from traditional
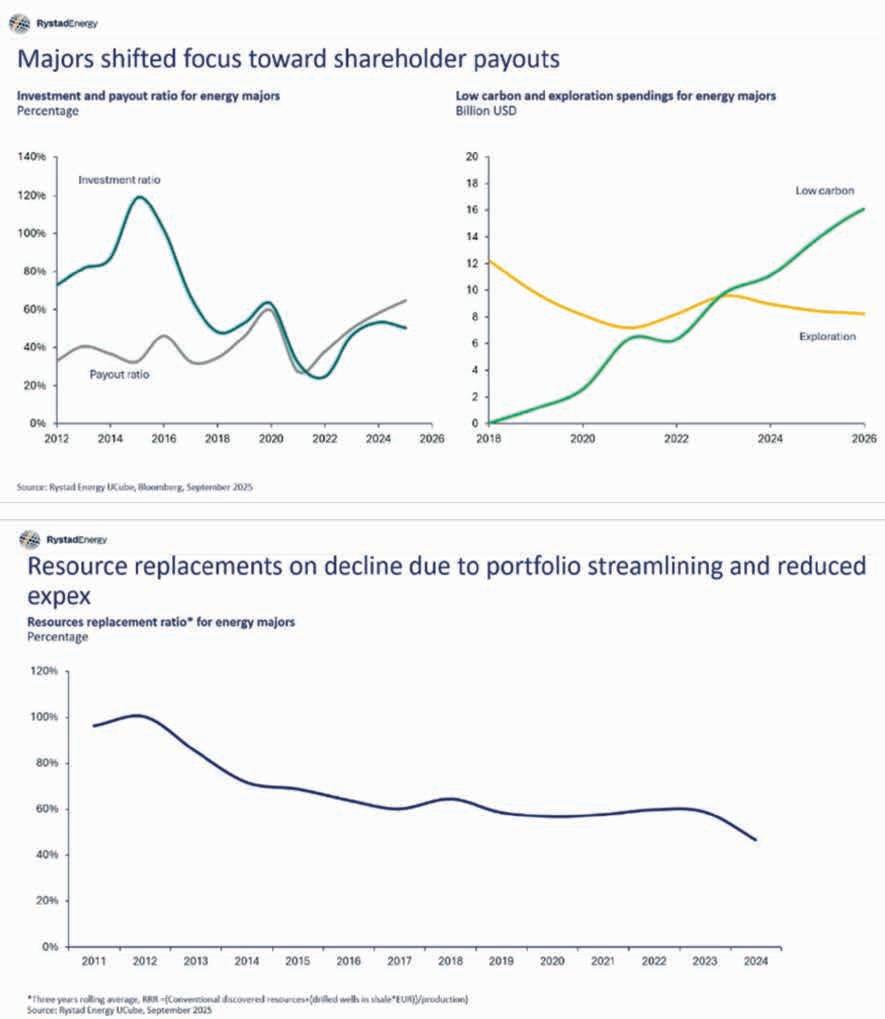
equity markets has evaporated over the same period and as yet not returned. This is the result of all but some of the private investors, having been preoccupied with ESG investment criteria including many of the European equity markets and have avoided or been restricted from investing in fossil fuels. It is hoped that possibly due to continued or more acute crisis, energy supply issues might lead to more realistic transition plans which will allow and perhaps even encourage new investment in the upstream sector.
Who will unlock it? There is no getting around it now but even if the energy companies could raise money again for E&P and particularly exploration, a key issue is whether there will be enough experienced technical people to know where to sink a 6-inch exploration hole in hundreds of square kilometres even to achieve the historical 20% exploration success rate.
Availability of such experienced exploration personnel is probably a bigger issue than where to go and find new oil and gas. This follows the large decline in the number of E&P companies, and particularly the smaller and mid-cap companies. Also key, is that these smaller companies and its experienced staff were historically responsible for generating so many discoveries that the majors farmed into. Both are a key part of a successful E&P sector.
This experience gap is partly due to the big crew change resulting from the 1984 to 2002 commodity price crash when the price of oil never came above $20/bbl and very few people, and
particularly new geologists and geophysicists, were subsequently employed in the upstream sector. Most of the people responsible for finding all the historical oil and gas are therefore either enjoying or past their retirement. This has left a gap of 19 years in the experienced explorationists between the ages of around 45 to 65 and now available to renew exploration activities today, 22 years on from the historical crash. The ESG policies and price crash in 2015/16 has just enhanced this.
This is not to denigrate in any way the remaining work force however, which is clearly both very bright and very well educated, but to successfully benefit from all the historical knowledge and available data available today, the loss of so much experience could clearly have an effect. Of course, the rapid advances in computing power and now arguably AI will help fill that gap.
This will be a very useful tool, where the quality and amount to data available is sufficient, but arguably it cannot yet replace the lost E&P experience. This includes the benefit of hindsight and the historical exploration mistakes that over time help to improve exploration selection processes and helps to ensures ultimate success.
Potential Hotspots: So, where can new E&P unlock new O&G? There are so many places where technically one could target to find new oil and gas in the world, but many of these are currently less favourable or even off limits due to the lack of new equity funding, environmental restrictions or being politically and commercially too risky.
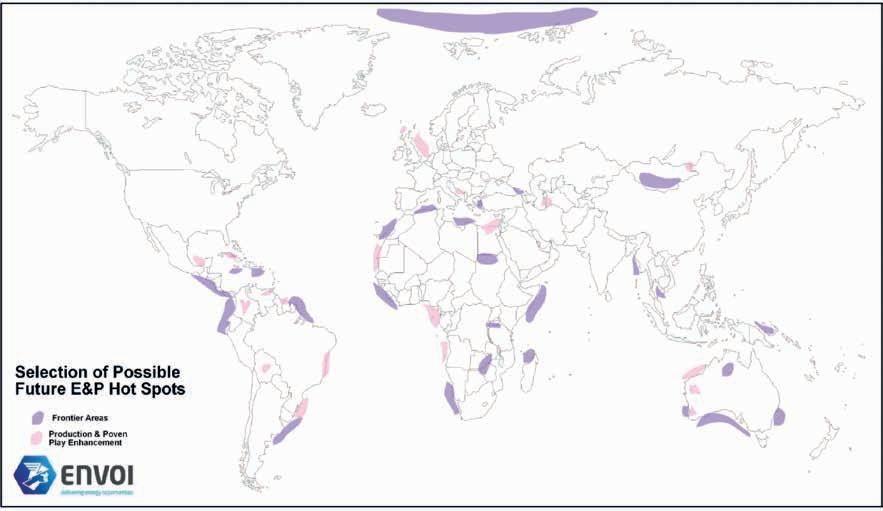
The following summary of potential future hotspots is again limited to my personal knowledge, geological background and A&D activities over the last few decades so is definitely not complete or exhaustive, but where I see there to be new and existing potential. This list has also been graded for my view of its possible technical potential and understanding of its commercial and political accessibility. It includes hotspots mentioned in previous articles as many remain ‘hot’ and/or unexplored.
Each one of the possible ‘hotspots’ could take a whole article on its own, so the following is more of a regional list with comments:
The offshore western coasts or Guatemala, Nicaragua and Cost Rica all have potential but largely unexplored due to their historical politics. This appears to have changed with the potential for new exploration in the future.
Offshore Colombia also offers new prospectivity although the new government seems to be less receptive to new exploration than previous authorities.
Venezuela is an obvious new target as one of the richest plays in the world and following the recent political change.
Suriname remains prospective for the smaller and mid-cap companies after the majors have had their pick the last few years with the remaining open acreage needing reconnaissance exploration to unlock its geology and play prospectivity.
French Guiana has the unexplored plays to the east of Suriname which the French are understood to have expressed interest in allowing new exploration into after prohibition the last decade or so.
Elsewhere, Uruguay is probably one of the hottest new frontier plays on the South American Atlantic margin and is arguably conjugate to the new Namibian plays in Africa and evidenced by all the offshore acreage now licenced by the majors and early mid-cap entrants. Let’s hope drilling unlocks its prospectivity soon.
Jamaica remains a top undrilled frontier pick with its prospective play evidence and both continued and new interest being shown.
Offshore Dominican Republic is also a new frontier play licensed by experienced companies
Cuba still has excellent and large resource offshore to the north in big undrilled thrusted thrust plays but is clearly off limits for most due to the political restrictions.
This remains a key target for E&P companies due to its vast petroleum geology and mostly receptive NOCs. Potential hotspots include:
Offshore Algeria and Libya still offer unexplored potential which is now potentially back on the table after their political struggles too.
The conjugate margin countries to the proven NE South America including Gambia, Guinea Bissau, Sierra Leone and Liberia all offer undrilled potential.
Northern Sudan has largely undrilled play potential but is restricted due to the political unrest there.
The big prospective but as yet undrilled hotspot remains offshore Somalia after decades of political unrest and piracy but back on its feet. The authorities are offering new licences covered by extensive multi-client 2D data which now needs extensive new 3D coverage. TPAO has acquired a new 3D survey in the north and is expected to drill soon, which might unlock the gate to new big company interest. The existing data points to high prospectivity in some three totally undrilled play trends there.
The Majunga Basin situated offshore northern Madagascar equally offers huge undrilled play potential in one of the largest undrilled salt basins. Both Exxon and bp have owned the acreage, but relinquished it due to strategy and poor market conditions rather than lack of technical and commercial potential.
Also, let’s not forget the large recent discoveries offshore Namibia and the Orange Basin’s extension down into South Africa.
Angola clearly also remains a hotspot for the exploitation of existing plays which has been well managed by the country with extensive data facilitating this.
Gabon still has potential but appears to be limited by current government policies with Equatorial Guinea and Cameroon
offering sizeable undrilled prospectivity in extensions of proven / producing play fairways
In several new areas governments are attempting to open up acreage with interesting new and existing play potential. This includes:
Offshore Cambodia and undrilled potential offshore Vietnam. Undrilled plays offshore Northern PNG also appear to be very prospective
This has always offered large play prospectivity but for many has been a plane too far from Europe and North America compared to closer jurisdictions. The anti-fossil fuel lobby has limited the upstream sector as much of Europe has done but is equally realising its dependence of oil and particularly gas for its economic stability.
The undrilled potential of the Sydney Basin offshore New South Wales remains a personal favourite, but environmental concerns have limited all attempts to confirm its potential by drilling in the last 20 years. Increasing issues with affordable gas supply and economics may in the end help to unlock this in the next decade or so.
Western Australia and Northern Territory are open for new business. Where the undrilled deep potential of the Perth Basin offshore, which has been proven onshore, remains prospective. As does the huge ‘resource’ potential of the Beetaloo and South Nicholson Basins in the Northen Territory, which now have two
development projects confirmed with prospectivity considered as rich as the best shale plays is the US.
It is blatantly obvious that a realistic, secure but less emissive energy replacement to oil and gas, and the infrastructure to distribute it, is urgently needed, but also with a plan to create and affordably supply it. Also, that lots more oil and increasingly gas will be required to fill the gap, even with the fastest energy transition scenarios.
There are plenty of places to explore and exploit for the hydrocarbons that are needed, though the sources of funding for it and experienced work force to find it have been decimated by a decade of poor decisions and unachievable energy transition policies. The skills gap remains a big issue. Data and AI will hopefully assist those explorationists left to find oil and gas before the supply of secure and affordable energy becomes a serious crisis.
In the meantime, it is hoped that the decisions to ensure achievable transition plans are made sooner rather than later and before current conflict in the Middle East or other crises force the process. It is equally hoped that the conflicts can be resolved quickly rather than being a trigger for a bigger global energy crisis which just brings misery to so many countries and their populations around the world.
Let us also stay positive and optimistic that we can all get back to finding the new energy needed for the next few decades and assist in a more realistic, achievable and affordable energy transition.


Stephen Wood1*, Genevieve Hirschfeld1, Miguel Sabiran1 and Dheeraj Biharie1 demonstrate that mud gas analysis, when integrated with other datasets, represents a valuable tool for charge derisking offshore Suriname.
Abstract
Mud gas analysis of exploration wells, in conjunction with basin modelling results, provides further evidence of hydrocarbon migration from multiple sources across various play levels and geological provinces within the Guiana Basin. The analysis indicates evidence for lateral hydrocarbon migration from the ACT source rock, as well as vertical migration from an Aptian or deeper source rock at the Demerara Plateau. In addition, mud gas composition further suggests in-situ hydrocarbon generation from a Jurassic source rock. Between 2024 and 2025, Staatsolie, in collaboration with the TiPS1 group, conducted an integrated mud gas interpretation aimed at reducing charge risk in the basin. Source rocks spanning at least the Late Aptian to Turonian intervals are proven, while additional, more speculative source rocks are identified in the Barremian and Late Jurassic. Results from the mud gas study indicate the presence of both oil and wet gas condensate in the wells A2-1, Araku-1, and FG-2 (French Guiana). Integration with STS maturation maps suggests that Aptian and older source rocks are likely to be contributing to the hydrocarbon
charge in plays where significant gas accumulations have been observed. Ultimately, mud gas analysis, when integrated with other datasets, represents a valuable tool for charge derisking. These findings are critical for mitigating charge risk within the province.
Oil exploration in Suriname began in 1924, with the first recorded oil flow to the surface occurring in 1965 during a water well drilling project near a school in Calcutta, Saramacca District. Subsequent drilling campaigns confirmed the presence of oil in the region. Onshore oil production commenced in 1982, facilitating the development of earlier discoveries in the Tambaredjo field, located approximately 55 km west of Paramaribo, Suriname’s capital.
More recently, offshore Suriname has emerged as a prominent region for global oil and gas exploration and production, underpinned by a proven Cretaceous-Tertiary petroleum system and a succession of significant hydrocarbon discoveries since 2019. These discoveries within the deepwater domain, notably
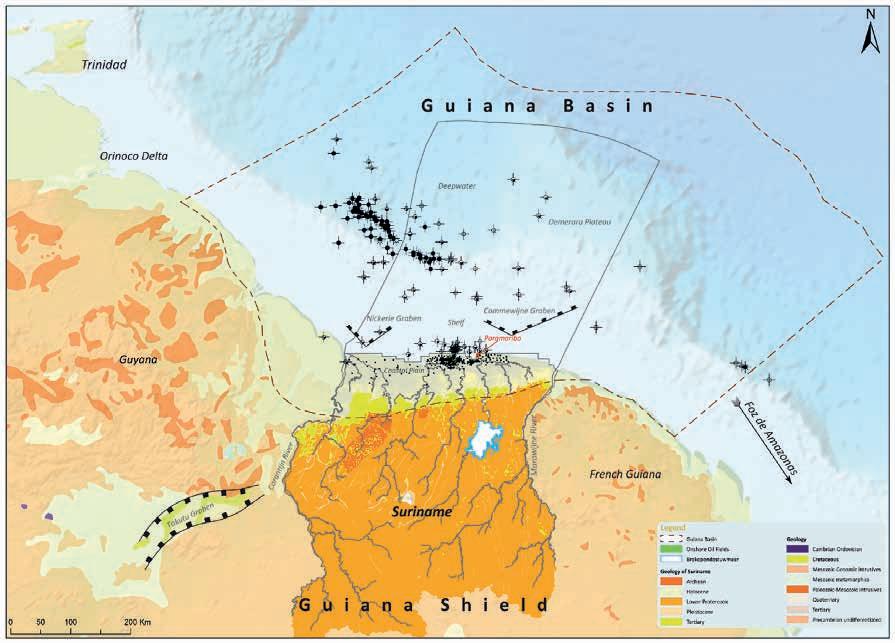
1 Staatsolie Maatschappij Suriname N.V.
* Corresponding author, E-mail: SWood@staatsolie.com
DOI: 10.3997/1365-2397.fb2026036
Figure 0 Map showing the geographical setting of Suriname including the offshore jurisdiction.

GranMorgu and Sloanea, have confirmed the basin’s high prospectivity, particularly within the Lower and Upper Cretaceous turbidite systems. Considerable exploration potential remains, with numerous untapped plays yet to be evaluated.
To further advance exploration activities in the offshore Suriname area, a series of integrated derisking studies have been undertaken by geoscientists from Staatsolie, among which mud gas analysis from multiple exploration wells, many of which having been drilled in the 1960s and 1970s (see BlockOpen Acreage map, Figure 1). These efforts are aligned with Suriname’s Open-Door Offering, launched on 24 November 2025, which provides a transparent and competitive framework for access to offshore open acreage via an open-door application process (see https://www.staatsolie.com/en/open-door-offering/ for details). This initiative is designed to expedite acreage allocation and stimulate exploration activity across the basin. The region discussed herein remains available for exploration, and this article elucidates the utility of mud gas analysis as a charge derisking tool across multiple plays along the eastern margin of offshore Suriname.
Source rocks offshore Suriname fall into two major categories: Proven source rocks include the Albian-Cenomanian-Turonian (ACT) interval and Late-Aptian to Early-Middle Albian strata, the latter of which represent pre-unconformity sources. These intervals have been drilled and analysed, with oil-to-source correlations confirming their ages. The source rock facies responsible for these oils exhibit marine or mixed marine-terrestrial organic geochemical signatures.
Probable source rocks include the Tithonian and Barremian intervals. These have rarely been penetrated in the basin; their inferred presence is primarily based on analogues. Fluid or gas evidence for these intervals is limited, but their existence is generally supported by the basin modelling results.
Figure 2 below shows a cross-section depicting the stratigraphic arrangement of the source rocks identified in the basin.
Table 1 summarises the average properties of source rocks within the basin. Note that for Probable sources, a key reference is the DSDP 0367 well, located in Senegalese waters within what was formerly a conjugate Jurassic basin connected to Suriname. The DSDP 0367 well demonstrates some source richness in these intervals, although these units are only sparsely sampled.
Overview of the wells – Demerara Plateau
In 1978 the offshore A2-1 well was drilled by ESSO (now ExxonMobil) and represented the first deepwater exploration well at a water depth of 1200 m. The well targeted a large Cretaceous four-way dip closure but was ultimately considered unsuccessful due to the lack of reservoir-quality rocks. Notably, A2-1 remains the only well to have penetrated the Jurassic strata in the basin. A thinning Albian wedge encountered in the well contained good source rock (3.7 TOC%, HI 533).
The Araku-1 well, drilled by Tullow Oil in 2017, targeted a four-way structural closure at a water depth of 1001 m. Seismic data revealed hydrocarbon-associated amplitude anomalies. Hydrocarbons were encountered at total depth in the Late-Albiancarbonate reservoir, and a gas-condensate sample was successfully recovered. Measured reservoir permeabilities exceed 1 millidarcy (md), confirming that the hydrocarbons are moveable. Figure 3 below shows a cross section of the interpreted
*Values from DSDP 0367
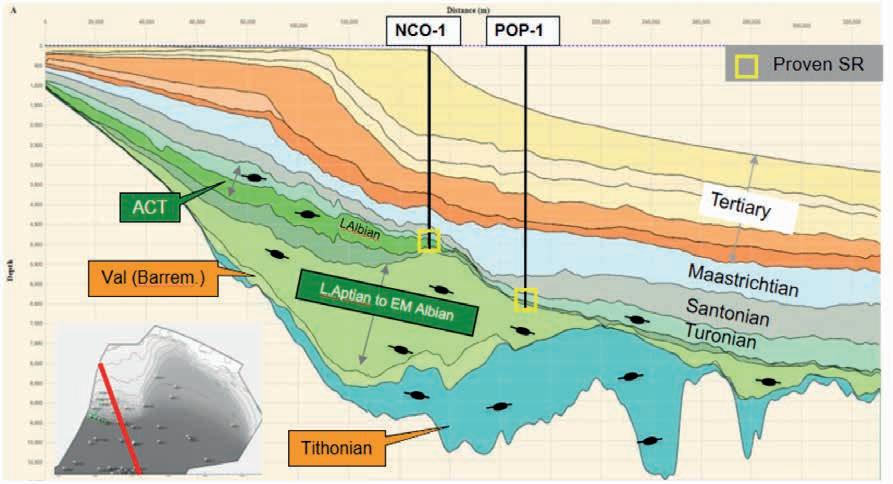
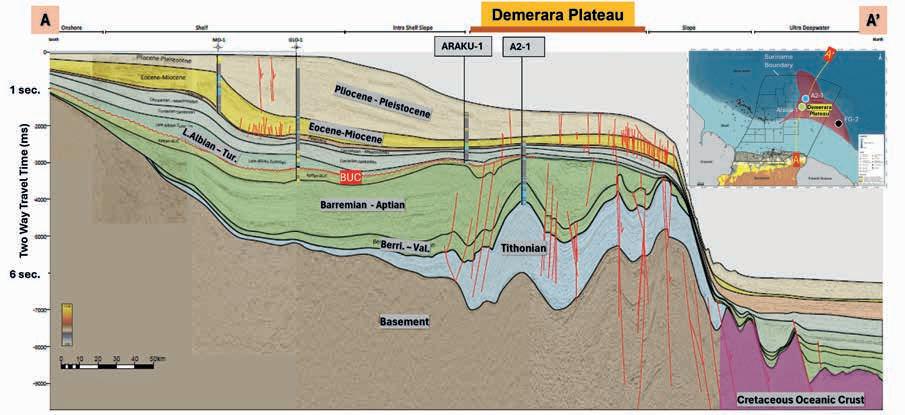
stratigraphic units through the two wells atop the Demerara Plateau.
The FG2-1 well (not shown on Figure 3) drilled by Esso Exploration Guyane in 1978, reached a total depth of 3941 m but was abandoned after no significant hydrocarbon shows were found. The main target, hypothesised to be Neocomian carbonates in an anticlinal structure, was not encountered; instead, a basaltic sequence with interbedded sediments was drilled. The Lower Cretaceous objective, which exhibited good reservoir quality, was water-saturated, and its associated shales had poor source potential due to low organic carbon content. Excellent Cenomanian–Turonian source rocks were present but located above the structural closure.
Staatsolie, in collaboration with the TiPS1 petroleum systems group, conducted a mud gas analysis of legacy data from three key wells located on the Demerara Plateau and one well to the east of the plateau in French Guiana. Gas data analysed in this study included real-time gases, headspace, and PVT gas analyses, all integrated into a global standard model commonly employed in real-time and post-well studies in the Gulf of Mexico.
Key objectives were:
• To characterise the intensity, maturity, and origins of elevated gas intervals, specifically distinguishing between thermogenic and biogenic sources.
Figure 3 Offshore Suriname, the outline of the Demerara Plateau and position of the 2D seismic line shown in through the Demerara Plateau with the location of Araku-1 and well Demerara A2-1.
• To provide supporting evidence for existing basin models; so-called ‘forensic’ evidence that corroborates hydrocarbon migration modelling.
The mud gas approach employs the complementary integration of real-time gas, headspace, and PVT gas analyses. A key quality-control aspect of the methodology is the use of Isotube and Isojar samples, when available. Isotubes allow validation of wellsite gas chromatography and also measure additional unsaturated compounds (e.g., ethene, propene) that may result from drillbit metamorphism of oil-based or synthetic mud, a phenomenon informally known as ‘bit burn.’ Headspace gas data serves a distinct purpose from mud gas data: while mud gas measurements primarily capture signals from higher-permeability rocks, headspace gas analysis is particularly effective for detecting gas in lower-permeability lithologies, such as mudstones, which release gas over time into the headspace. These sampling methods generally retain higher volumes of gas, enabling the measurement of methane isotopes and, in some cases, higher-carbon-number hydrocarbons. Our corresponding workflow thus attempts to provide an integrated assessment of all available gas data, increasing confidence in the resulting interpretations.
The interpretation presented in this article relies on three primary analytical curves, although additional curves may be applicable depending on data complexity. (1) Interval of Interest: This curve identifies zones where both C1 and C2 concentrations consistently increase, which is visualised as a ‘cross over’ on a logarithmic scale. (2) Dry 5: This parameter quantifies gas
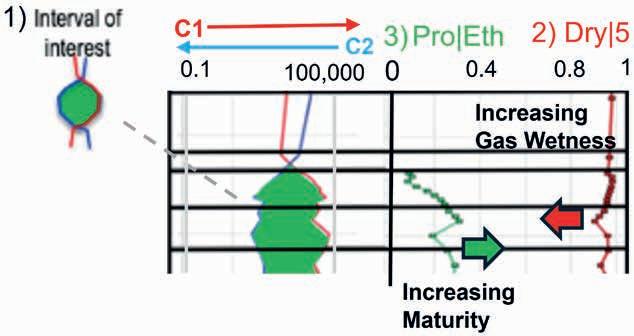
‘wetness,’ where a value of 1 corresponds to pure methane. (3) Pro. Eth.: The ratio of propane to ethane (Pro. | Eth.) serves as a relative indicator of hydrocarbon maturity.
A summary of each parameter is shown in the following figure:All three wells exhibit wet thermogenic gas. In Araku-1, hydrocarbons were encountered in the Albian interval, with gas condensate recovered from a sampled section. Moreover, both the C1/C2 crossover and the Dry 5 parameter indicate that wet gas has migrated into the overlying Turonian to Campanian
unit. The Pro | Eth increases with depth. This is consistent with high-maturity thermogenic gas. In A2-1, gases observed from the Turonian to Albian intervals are likely associated with the source rock. For the deeper A2-1 intervals (Valanginian-Berriasian), the detected mixed wet gas is interpreted as comprising of both a primary and a recycled component. The Pro | Eth varies widely over the interval. This interpretation is supported by the presence of oil shows over the same interval. Notably, mud gas composition, together with basin modelling, further suggests in-situ hydrocarbon generation from a possible Jurassic source rock. The mud gas curves and corresponding data for these two wells are presented in Figure 5A and Figure 5B.
The analytical gas data for the FG-2 well cannot be displayed here, but comments and interpretations of the well results are summarised in Figure 6 alongside the stratigraphic column. Key elements in the analysis of mud gas and headspace gas indicate: (1) an increased response of both total gas and wet gas (Dry 5 value) over the Upper Albian to Turonian interval, with this interval also displaying elevated total gas levels; (2) the basal part of the well, from Early Albian to Barremian, exhibits a low gas response; (3) a small interval in the Pliocene-Miocene
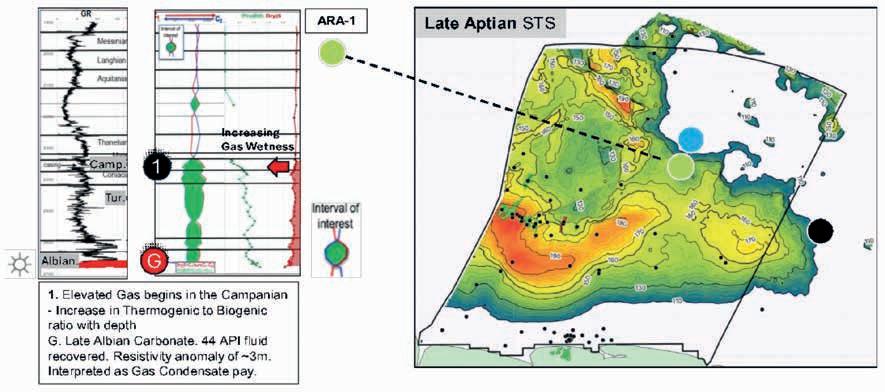
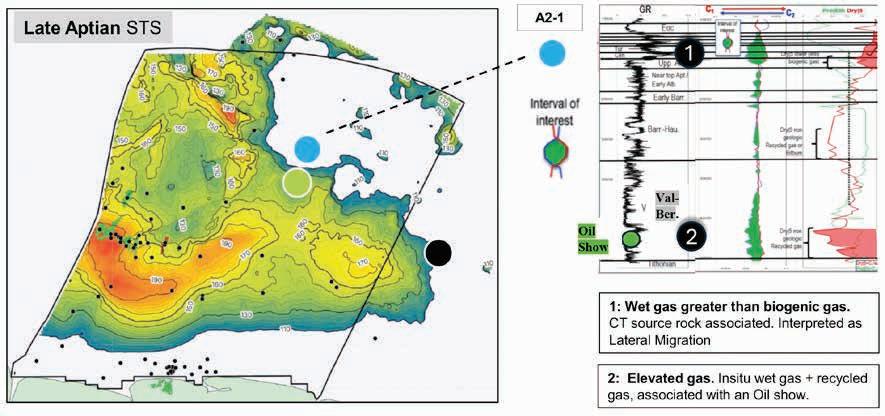
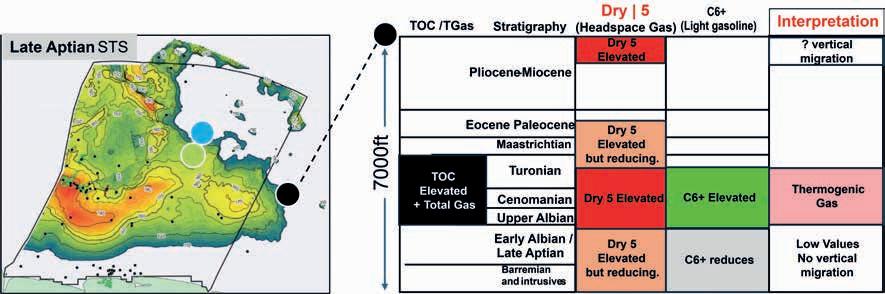
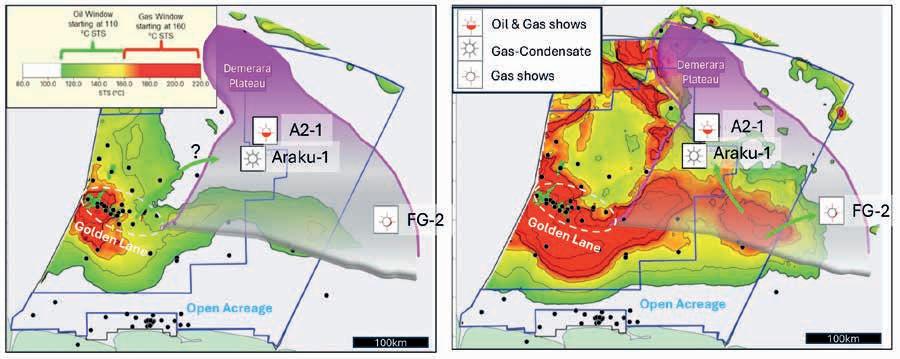
shows an elevated Dry 5 (wet gas) signal, although this is not reflected in the C6+ measurement. This latter observation may suggest vertical migration of wet gas from deeper intervals.
In summary, the evidence for hydrocarbon charge in these three wells is convincing. The significance of these findings will be addressed in the following sections.
Maturity maps for the two proven source rock intervals in the offshore Suriname segment of the Guiana Basin are presented in Figures 7A and 7B.
Key conclusions of the source rock presence, source quality, and mud gas are as follows:
• The recovery of gas condensate, along with the observation of wet gas and oil shows, indicates the presence of mixed-phase hydrocarbons in this region.
• The maturity associated with the ACT (Albian-Cenomanian-Turonian) or ‘proven’ source interval is predominantly concentrated in the western region near the Golden Lane and in a southern belt. For a source pod in the gas window, and for hydrocarbons to be present at the Demerara Plateau, migration would be likely to require long-distance lateral movement from these mature areas into the plateau rather than shorter-range migration. This long-distance lateral migration remains a plausible scenario for the recovered gas, gas condensate, and oil shows at the Demerara Plateau.
• Maturity mapping of the upper Late Aptian interval reveals a broader lateral extent, with larger areas falling within the gas and gas condensate windows, particularly proximal to the wells of interest. This distribution readily explains the gas-condensate charge observed at the Araku-1 well, likely to be resulting from vertical migration. Nonetheless, wet gas is also observed at the A2-1 well.
• Wet gas is observed with high concentrations over the FG-2 well over the source rock interval. Although this corresponds to elevated TOC in the well, Staatsolie’s internal basin modelling shows the FG-2 well is immature at the well location. Therefore, lateral migration, probably from the west, is a more likely scenario. This can also be seen on the STS mapping (Figure 7B).
• Additional potential source rocks deeper than the Aptian may exist. Analysis of total organic carbon (TOC) and hydrogen index (HI) values from DSDP 0367 supports the possibility that both Barremian and Tithonian-age intervals could generate gas and oil phase hydrocarbons. This hypothesis
is further corroborated by the detection of wet gas in the Valanginian-Berriasian interval. Furthermore, Tithonian strata were penetrated at the A2-1 well, with underlying seismic data suggesting the presence of even deeper stratigraphy. Although their presence is uncertain due to limited or absent well penetrations, their existence would significantly increase hydrocarbon charge accessibility within the Demerara Plateau.
The discussion here demonstrates the effectiveness of systematic mud gas analysis in hydrocarbon exploration. Individual gas shows provide solid forensic evidence for the presence of hydrocarbon charge. The findings support the existence of additional source rocks, distinct from traditional ACT sources, and maturity maps suggest that Aptian and deeper intervals are likely to be valid contributors. These results will be included in future assessments of charge risk across the Demerara Plateau, a region currently included in the open acreage offshore Suriname.
Authors at Staatsolie and previous contributors both internal and third party.
1 This is Petroleum Systems LLC, TX, USA. Lara E. Heister & Andrew S. Pepper
Casson, M., Jeremiah, J., Calvès, G., de Goyet, F.D.V., Bulot, L. and Redfern, J. [2024]. An integrated stratigraphic re-evaluation of key Central Atlantic DSDP sites. Journal of African Earth Sciences, 215, 105278.
Heister, L. and Pepper, A. [2024]. TiPS1 Suriname Mud Gas Study: Dataset 1. Staatsolie Internal Report.
Staatsolie Maatschappij Suriname N.V. [2025]. GeoAtlas of Suriname. https://www.staatsolie.com/en/shi/geoatlas/
ACT Albian Cenomanian Turonian (source rock)
Abreviations
Val-Berr. Valanginian to Berriasian
BUC Break Up Unconformity (Aptian – Albian)
A2-1 Short for the 1978 well drilled on the Demerara Plateau known fully as Demerara A2-1.
STS Standard Thermal Stress, (degrees Centigrade)
Pro | Eth Propane to Ethane Ratio. Calculation: C3 / (C2 +C3)
Dry | 5 An expression of gas wetness. Calculation: C1 / (C1 – C5)

4-6 May 15 th International Congress of Prospectors and Explorers (proEXPLO 2026) www.proexplo.com.pe/en
6-7 May DGMK/ÖGEW Spring Conference 2026 dgmk.de/en/events/dgmk-oegew-spring-conference-2026/
11-13 May First EAGE/ALNAFT Workshop – Unlocking Hydrocarbon Potential of West Mediterranean Offshore Frontier Basin of Algeria www.eage.org
11-13 May Second EAGE/ALNAFT Workshop on Techniques of Recovery of Mature Fields and Tight Reservoirs www.eage.org
11-13 May 8 th Asia Pacific Meeting on Near Surface Geoscience & Engineering www.eage.org
19-22 May InterPore2026 www.interpore.org
26-28 May Second EAGE/SBGf Conference on Deepwater Brazil Equatorial Margin www.eage.org
June 2026
1-4 Jun ARPEL Conference 2026 www.arpel.org
8-11 Jun 87 th EAGE Annual Conference & Exhibition www.eageannual.org
July 2026
27-31 Jul 9 th EAGE Conference on Conjugate Margins www.eage.org
28-29 Jul APGCE 2026 Curtain Raiser: EAGE Workshop on Exploration and Opportunities in the Paleogene Play www.eage.org
1-2 Sep EAGE Exploration Workshop: Unlocking New Zealand’s Upstream Potential www.eage.org
7-9 Sep Fifth EAGE Marine Acquisition Workshop www.eage.org
8-11 Sep ECMOR 2026 www.ecmor.org
15-16 Sep 5 th EAGE Conference on Carbon Capture, Utilisation and Storage www.eage.org
20-24 Sep Near Surface Geoscience Conference and Exhibition (NSG) 2026
• 32 nd Conference of Environmental and Engineering Geophysics
• 7 th Conference on Mineral Exploration and Mining
• 3 rd Conference on Hydrogeophysics
• 2 nd Conference on Geohazards Assessment and Risk Mitigation www.eagensg.org
21-25 Sep World CCUS Conference 2026 www.wccus.org
23-24 Sep EAGE/SBGf Workshop on Seismic Processing www.eage.org
27-30 Sep The 16th SEGJ International Symposium www.sites.google.com/segj.org/is-16th
28-30 Sep Fifth AAPG/EAGE Hydrocarbon Seals of the Middle East Workshop www.eage.org
29-30 Sep EAGE Symposium on Subsurface Intelligence: Harnessing AI/ML to Maximise Asset Value www.eage.org
October 2026
5-8 Oct International Conference of Young Professionals – GEOTERRACE 2026 www.eage.org
5-6 Oct Fourth EAGE Workshop on EOR www.eage.org
6-7 Oct EAGE Symposium on From Data to Decisions: Agentic AI and Advanced Data Exploitation for Vietnam’s Upstream and Subsurface Value www.eage.org
6-8 Oct Fourth EAGE Conference on Seismic Inversion www.seismicinversion.org
7-9 Oct First EAGE Workshop on Mobile Shales www.eage.org
12-14 Oct Second EAGE Workshop on Advances in Carbonate Reservoirs: from Prospects to Development www.eage.org
21-23 Oct 6th EAGE Workshop on Fiber Optic Sensing for Energy Applications www.eage.org
25-27 Oct Sixth EAGE Workshop on Naturally Fractured Rocks www.eage.org

November 2026
2-6 Nov 7 th EAGE Global Energy Transition Conference & Exhibition (GET 2026)
• EAGE Carbon Capture and Storage Conference
• EAGE Geothermal Energy Conference
• EAGE Hydrogen and Energy Storage Conference
• EAGE Offshore Wind Energy Conference
• Critical Raw Materials Symposium www.eageget.org
9-11 Nov Second EAGE/AAPG Geothermal Energy in the Middle East Workshop www.eage.org
11-13 Nov Second EAGE Conference on Energy Opportunities in the Caribbean www.eage.org
16-17 Nov Asia Petroleum Geoscience Conference and Exhibition (APGCE) 2026 www.eage.org
16-18 Nov Second International EAGE Workshop on Land Seismic Acquisition www.eage.org
17-19 Nov First EAGE Conference on Basin and Petroleum Systems Modeling www.eage.org
December 2026
1-2 Dec 2 nd EAGE Workshop on Enhancing Subsurface Practices using AI/ML www.eage.org
1-2 Dec Second EAGE Workshop on Techniques for Monitoring CO2 Storage www.eage.org
7-9 Dec Third AAPG/EAGE ‘Maximizing Asset Value: Integrating Geoscience with Reservoir Management and Technologies Optimization’ GTW www.eage.org
13-18 Dec XVII Chilean Geological Congress www.linkedin.com/company/xvii-congreso-geol%C3%B3gico-chileno/
January 2027
19-21 Jan Second EAGE/AAPG Carbonates and Mixed Carbonate Systems Symposium www.eage.org
March 2027
24-26 Mar IPTC 2027 www.iptcnet.org
April 2027
12-14 Apr 24th EAGE Symposium on IOR (IOR+ 2027) www.eageior.org
Apr Fourth EAGE Geoscience Technologies and Applications Conference (GeoTech 2027)
• Fifth EAGE Workshop on Distributed Fibre Optic Sensing
• Fifth EAGE Workshop on Practical Reservoir Monitoring
• Fourth EAGE Workshop on Pore Pressure Prediction
• Second EAGE Workshop on Induced Seismicity www.eage.org
June 2027
31 May - 3 Jun 88 th EAGE Annual Conference & Exhibition www.eageannual.org