


DECEMBER 2022 ISSUE 31 in this issue L ATEST DUBLIN ECONOMIC DATA S&P GLOBAL DUBLIN PMI MASTERCARD SPENDINGPULSE INFLATION BITES BUT SHOULDN’T DERAIL GROWTH
Highlights
Dublin’s unemployment rate ticked upwards by 0.4 percentage points QoQ to stand at 4.9% (SA) in Q3 2022, broadly in line with the national rate.
Business activity reached nearstagnation during Q3 as the services sector continued to grow but manufacturing and construction activity contracted.
Retail spending in the Capital grew by 1.3% QoQ and 6.5% YoY (SA) though there is evidence that consumers are purchasing smaller volumes of products at higher prices.
Dublin Port’s throughput fell by 1.8% QoQ in Q3 as export and import volumes reduced by 5.4% and 1.7% respectively.
Dublin Airport passenger numbers recovered further in Q3, rising by 12.9% QoQ to over 7.9 million (SA) – just 380,000 below the 2019 peak.
Welcome to the December 2022 issue of the Dublin Economic Monitor

The Dublin Economic Monitor is a joint initiative on behalf of the four Dublin Local Authorities, and is designed to be of interest to those living and doing business in Dublin or considering locating here. The report is produced by Grant Thornton with inputs from S&P Global and MasterCard.
There are two special feature articles this quarter. The first is from Dr Sarah Miller, CEO of the Rediscovery Centre which is the National Centre for the Circular Economy in Ireland. The article focusses on circular economy developments in the Dublin economy. The second article is by Chapin Flynn, Senior Vice President at MasterCard, and provides a snapshot of the positive economic impact for Dublin of the Aer Lingus College Football Classic in August of this year.
The Monitor is divided into the following themes for Dublin:
Economy Business Developments Retail Hospitality Labour Market International Rankings Housing Transport & Travel
For more data and insights see: www.dublineconomy.ie
The next edition will be published in March 2023.
www.dublineconomy.ie
@DCCEconDev
This document provides general information on the Dublin economy. It is not intended to be used as a basis for any par ticular course of action or as a substitute for financial advice. The document is produced independently by Grant Thornton and Packed.House; the views and opinions expressed are those of the relevant author, and do not necessarily reflect the views of the Dublin Local Authorities. The Dublin Local Authorities disclaim all liability in connection with any action that may be taken in reliance of this document, and for any error, deficiency, flaw or omission contained in it.
Dublin City Council South Dublin County Council
Fingal County Council
Dún Laoghaire Rathdown County Council
2 //
Dublin’s hospitality sector sustained its revival as seated diners at restaurants in the Capital in November stood 66.3% above the 2019 baseline. WELCOME
Inflation bites but it shouldn’t derail growth
As we approach the end of 2022 and reflect on the year, it is hard to fathom just how different the economy is. A year ago, the economic recovery was well underway and was gathering momentum. MasterCard’s retail spending indicators were highlighting a surge in spending, aided by the release of pent-up demand, and PMI indicators were in strong expansion territory. Now, thanks largely to the Russian invasion of Ukraine, the inflationary pressures have become more embedded and are biting into spending patterns, sentiment and, ultimately, economic growth rates for 2023.
Europe’s Economy at a Turning Point
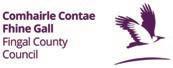
The autumn 2022 economic forecast from the European Commission reflect the changing view and they suggest that the EU economy is at a turning point. While growth for the whole of 2022 in the EU is now expected to be 3.3% (up on the prediction of 2.7% made by the Commission in the summer), this is a result of a strong first half of the year and belies their expectation that the European economy will contract in Q4 this year and Q1 2023. Inflation is now expected to peak by the end of this year and the annualised rate for 2022 will be over 9% before falling back in 2023. Inflation’s grip means a technical recession this winter with a return to growth in spring. This period of lacklustre performance is predicted to deliver real GDP growth of 0.3% in both the Euro Area and the EU as a whole.
The outlook for Ireland, using the EU Commission measure, is not as insipid. GDP growth is however expected to slow from 7.9% this year to 3.2% next year. Modified Domestic Demand, the preferred measure of the domestic economy, is expected to slow from 6.4% this year to 2.3% next year according to the Irish Central Bank.
Given the inflationary pressures at play, household incomes are forecast to fall by 3.3% this year. This real terms decline, coupled with more precautionary savings, means that consumer spending is projected to slow. While the Mastercard SpendingPulse data shows a continuing increase in spending, there is growing evidence to suggest reduced volumes and a change in spending patterns. For example, the number of customers using discount stores in October was up 8% on the same month last year according to analysis by Revolut.
Flagging Consumer Sentiment
The consumer spending squeeze will be a key watch list item in 2023. The Credit Union Consumer Sentiment Index shows an improvement in October compared to September. That said, a reading of 46.1 in October, compared to a 14-year low in September of 42.1, is still far off sentiment readings in excess of 85 a year ago. The improvement in the Consumer Sentiment Index was more pronounced in those elements of the survey focussed on household finances – sentiment regarding personal finances in the 12 months ahead rose by almost 10 points between September and October. This might suggest a broadly positive judgement, albeit modestly so, on the measures announced in Budget 2023. Despite glimmers of an uptick in sentiment, the buying climate remains negative and consumer spending is likely to be constrained for several more months.
Pressing Business Concerns
On business sentiment, Grant Thornton’s Irish Business Voice Report has identified that the most pressing concerns for Irish Businesses currently are inflation; recruitment and retention; generating new business; and volatile trading conditions. These concerns are consistent with Bank of Ireland’s Business Pulse which recorded a reading of 64.2 in October, down 13.6 points on September and 26.1 points lower than a year ago. The Services, Retail and Industry Pulses lost most ground while the Construction Pulse was largely unchanged. Unsurprisingly, softening demand and uncertainty were cited as key factors limiting activity while firms in industry are reportedly unsure of their export prospects in light of the weakness of sterling. Business and consumer stamina and resilience have been tested many times in recent years. As it stands, inflation and geopolitical uncertainty will continue to present challenges into 2023 but with the labour market in good health and expectations that inflation will loosen its grip next year, the consensus view is that a full blown recession will be avoided.
// 3 ECONOMY
SOURCE: CENTRAL BANK OF IRELAND
Irish Economic Growth Rates,
2021-2024F
Big tech cutbacks a concern for Dublin’s economy
Big Tech has been a stalwart of the Dublin economy over the past decade; driving employment growth, demand for office space and Exchequer returns. The recent cutbacks by tech giants across the world is hence a cause for concern. Facebook owner, Meta, which has its main campus in Ballsbridge, has announced plans to cut some 350 jobs in the Capital. Twitter, on foot of its acquisition by Elon Musk, has also cut its global headcount by 50%, which it is reported will result in 140 of its Dublin staff being made redundant.
Stripe has also announced a 14% reduction in its 7,000 global headcount. Its Irish founders stated that the company had “overhired for the world we’re in”. Implications for Dublin may be less severe than first feared as the company has underlined that “commitment to our Irish headquarters remains as strong as ever”.
Further tech giants – including Salesforce, Amazon, Intercom, and Zendesk – have targeted cutbacks in Dublin which will each likely have adverse effects in the quarters to come.
Silver Linings
Despite the gloomy mood music in Big Tech, smaller firms are continuing to recruit, and this may provide opportunities for affected workers to re-position within the industry.
At least one large firm, Huawei, has also announced an expansion via a €150 million investment in Dublin. The company plans to open its first European cloud hub with the creation of 200 jobs in sales, pre-sales, legal, tax, operational, management and research positions.
Google parent company, Alphabet, has selected Lusk as the location for a trial by its drone delivery company, Wing. It is currently recruiting drone pilots for the north Dublin site, which is in close proximity to Balbriggan where Manna Drone Delivery has been trialling deliveries since earlier in the year.
Pharmaceutical Expansions Continue
The pharmaceutical company MSD Ireland has opened a new manufacturing facility in Swords, creating 350 jobs in the process. The facility is the latest phase of a combined €1 billion investment at the site since 2018.
The company will use the facility to increase the supply of its cancer drug, Keytruda.
Pfizer is also planning a €1.2 billion investment in its Grange Castle facility in Dublin. The development represents the largest single pharmaceutical sector investment in the history of the State, and is expected to result in the creation of between 400 and 500 jobs over the coming five years. Subject to planning permission, construction is expected to commence in 2024 and finish in 2027. Speaking at the compnay's announcement, Pfizer executive vice-president Mike Dermott said that “Grange Castle has played a critical role in our global Covid-19 vaccine network and this investment for nonCovid licensed and pipeline products will help to further expand the site’s broad and robust capabilities”.
Office Leasing Activity Picks Up
Dublin office leasing activity in Q3 was the second strongest recorded since the onset of the Covid-19 pandemic. According to CBRE, take-up was marginally ahead of the long-run quarterly average. Notably, the tech sector accounted for 23% of city centre lettings – this may be expected to contract given the recent developments in the sector. This would contribute further towards vacancy rates which rose to 8.1% and 12.8% in Dublin 2/4 and the Dublin suburbs respectively in Q3 (see chart).
4 // Business Developments
Dublin Office Vacancy Rates SOURCE: CBRE. Dublin Suburbs Dublin 2/4 0% 5% 10% 15% 20% 25% Q3 12 Q4 12 Q3 13 Q1 14 Q3 14 Q1 15 Q3 15 Q1 16 Q3 16 Q1 17 Q3 17 Q1 18 Q3 18 Q1 19 Q3 19 Q1 20 Q3 20 Q1 21 Q3 21 Q1 22 Q3 22
Significant slowdown in dublin business activity in Q3
The Dublin private sector is not alone in seeing a slowdown during Q3 2022 as global demand conditions suffer amid widespread cost of living pressures. Output growth slowed to near-stagnation, with manufacturing and construction actually seeing declines. The main positive over the quarter was a further marked expansion in employment.
Overall PMI New Orders (SA)
Overall PMI Employment (SA)
The rate of growth in Dublin business activity reached near-stagnation during Q3 2022, no doubt influenced by waning global demand conditions. A PMI reading of 50.4 was recorded in the quarter – thus barely registering an expansion (a reading above 50 signifies growth). The slowdown was marked both QoQ (-5.6 index points) and YoY (-11.7) and is aligned with trends globally. Activity levels outside the Capital also fell in Q3 but were marginally stronger as reflected by an index reading of 53.2.
In Dublin, growth in Q3 was solely driven by the services sector, with an index reading of 52.5. This more than compensated for contractions in activity in both the construction (43.3) and manufacturing (48.1) sectors in the quarter. Such contractions are concerning and do not bode well for the winter period given the serious macro-economic challenges which face the domestic and international economies.
New orders and employment did remain in expansionary territory in the quarter, however, in spite of slowing growth rates. New orders amongst Dublin companies posted a 6th consecutive quarter of expansion with an index reading of 52.2. This points towards a relatively strong pipeline of upcoming work, and contrasted with the rest of Ireland (49.1) in the quarter.
Employment was the most positive indicator in Q3 for Dublin and across Ireland, resulting in index readings of 55.6 and 53.1 respectively. Companies in the Capital have now recorded rising staffing levels in each quarter since Q1 2021. This chimes with current labour market conditions where close-to-full employment is apparent, and is a notable plus for the economy ahead of a series of challenging quarters for businesses and households.
// 5 Business Developments
Overall
Dublin Rest of Ireland 20 30 40 50 60 70 Q1 03 Q4 03 Q3 04 Q2 05 Q1 06 Q4 06 Q3 07 Q2 08 Q1 09 Q4 09 Q3 10 Q2 11 Q1 12 Q4 12 Q3 13 Q2 14 Q1 15 Q4 15 Q3 16 Q2 17 Q1 18 Q4 18 Q3 19 Q2 20 Q1 21 Q4 21 Q3 22 sa, 50 = no change Increasing rate of growth Increasing rate of contraction
Dublin S&P Global PMI (SA)
Dublin
of
20 30 40 50 60 70 Q1 03 Q4 03 Q3 04 Q2 05 Q1 06 Q4 06 Q3 07 Q2 08 Q1 09 Q4 09 Q3 10 Q2 11 Q1 12 Q4 12 Q3 13 Q2 14 Q1 15 Q4 15 Q3 16 Q2 17 Q1 18 Q4 18 Q3 19 Q2 20 Q1 21 Q4 21 Q3 22 sa, 50 = no change Increasing rate of growth Increasing rate of contraction
Dublin Rest of Ireland 20 30 40 50 60 70 Q1 03 Q4 03 Q3 04 Q2 05 Q1 06 Q4 06 Q3 07 Q2 08 Q1 09 Q4 09 Q3 10 Q2 11 Q1 12 Q4 12 Q3 13 Q2 14 Q1 15 Q4 15 Q3 16 Q2 17 Q1 18 Q4 18 Q3 19 Q2 20 Q1 21 Q4 21 Q3 22 sa, 50 = no change Increasing rate of growth Increasing rate of contraction
Rest
Ireland
Price inflation drives retail spending growth
MasterCard Total Retail Sales Index (SA)
The value of retail spending by consumers in Dublin continued to grow in Q3 2022, driven by price inflation. Growth of 1.3% QoQ and 6.5% YoY (SA) arosethough there is evidence that consumers are purchasing smaller volumes of products, albeit at higher prices. Growth in the value of retail spending resulted in sales of Discretionary items (department and clothing stores), of Household Goods and via eCommerce platforms all reaching new highs in Q3.
On a QoQ basis, growth was positive yet modest in the five categories covered by the SpendingPulse. Discretionary expenditure rose by the greatest proportion with a QoQ expansion of 3.4%. This was followed by growth of 2.4% QoQ in the Necessities category.
Entertainment spending, which had recorded doubledigit QoQ expansions in each of the preceding six quarters, eased considerably in Q3. An expansion of just 0.7% QoQ may be a partial reflection of soaring prices in certain segments of the hospitality sector.
eCommerce spending has been on a constant upward trajectory since 2014 and maintained a positive growth rate of 1.6% QoQ.
Although the value of retail spending continued to expand in Q3, a further slowdown or reversal in growth rates may be expected as winter approaches.
95 100 105 110 115 120 125 130 135 140 145 150 155 Q1 16 Q2 16 Q3 16 Q4 16 Q1 17 Q2 17 Q3 17 Q4 17 Q1 18 Q2 18 Q3 18 Q4 18 Q1 19 Q2 19 Q3 19 Q4 19 Q1 20 Q2 20 Q3 20 Q4 20 Q1 21 Q2 21 Q3 21 Q4 21 Q1 22 Q2 22 Q3 22 6 //
A macro-economic indicator, SpendingPulse™ reports on national and Dublin retail sales and is based on aggregate sales activity in the MasterCard payments network, coupled with estimates for all other payment forms, including cash and cheque. This information has been grossed up to present an estimate of the total retail sales of retail businesses in Ireland and Dublin to both resi dents and tourists. Data is seasonally adjusted but is not adjusted for inflation. MasterCard SpendingPulse™ does not represent MasterCard financial performance. SpendingPulse™ is provided by MasterCard Advisors, the professional services arm of MasterCard International Incorporated. See www.dublineconomy.ie for more info on methodology. Dublin Retail Sales Value Index (SA) Q3 2022
METHODOLOGY
+1.5% YoY Necessities eCommerce Household Goods Entertainment Discretionary +1.2% YoY +4.2% YoY +58.3% YoY +10.7% YoY RETAIL 148 +6.5% YoY 140 +3.5% YoY *ALL VALUES ARE SEASONALLY ADJUSTED BY GRANT THORNTON, AND HAVE BEEN RE-ADJUSTES SINCE THE LAST ISSUE. THE DATA IN THIS ISSUE IS HENCE NOT DIRECTLY COMPARABLE TO PREVIOUS ISSUES.
Ireland Dublin
Dublin
stable in Q3
Spending by visitors to Dublin remained stable in Q3 2022 in a somewhat disappointing return for the Capital’s economy. Growth in tourist spending of just 0.4% QoQ in the late summer season is below expectations for a tourism sector which is still recovering post-pandemic. The modest YoY expansion in Dublin tourist spending was substantially exceeded at the national level where expenditure grew by 11.9% QoQ.
Well-publicised affordability issues in hospitality are a likely contributor to the weakened growth in Dublin. Following a strong Q2, the French market saw a particularly significant reversal. Spending by French visitors to the Capital declined by more than 26% QoQ in Q3 in what is a warning signal ahead of a difficult winter for European countries.
Spending grew amongst tourists from all other markets in Q3, however. The UK market bounced back from a weak second quarter with growth of 15.3% QoQ. The US market, which is also critical to Dublin and Irish tourism, continued to recover apace with an expansion of 27.3% QoQ. The current strength of the Dollar versus the Euro will have aided this trend.
Following a sharp increase in Q2, Chinese tourist spending rose by a further 11.9% in the quarter. This comes in spite of tight pandemic restrictions remaining in place for many residents of the country. The German market recorded tourist spending growth of 5.8% QoQ in Q3 – its strongest thus far in 2022.
Interest Rates Hikes Likely to Dampen Demand
Over the course of 2022, the ECB has moved to tame inflation via three successive interest rate hikes. As shown in the chart, interest rates now stand at 2%representing both the highest level since 2009 and, if passed on to consumers, a greater incentive to save. In combination with costlier loans, increasing mortgage servicing costs and elevated price levels, such measures will be expected to further dampen retail demand over the coming quarters.
// 7
ECB Refinancing
Interest Rate
tourist
133.8 RETAIL
+17.1% QoQ CHANGE IN SPENDING IN IRELAND +27.3% QoQ CHANGE IN SPENDING IN DUBLIN QoQ CHANGE IN SPENDING IN IRELAND +4.1% -26.5% QoQ CHANGE IN SPENDING IN DUBLIN QoQ CHANGE IN SPENDING IN IRELAND +5.2% +5.8% QoQ CHANGE IN SPENDING IN DUBLIN QoQ CHANGE IN SPENDING IN IRELAND +49.5% +11.9% QoQ CHANGE IN SPENDING IN DUBLIN QoQ CHANGE IN SPENDING IN DUBLIN +6.4% +15.3% QoQ CHANGE IN SPENDING IN IRELAND QoQ OVERALL CHANGE IN TOURSIM SPEND IN DUBLIN +11.9% +0.4% QoQ OVERALL CHANGE IN TOURSIM SPEND IN IRELAND Overall Dublin Ireland SOURCE: MASTERCARD SPENDINGPULSE 0% 1% 2% 3% 4% 2008 2009 2010 2011 2012 2013 2014 2015 2016 2017 2018 2019 2020 2021 2022 SOURCE: ECB
spending
Dublin and Ireland Tourist Spend by Origin - Q3 2022 (SA)
Hotel sector's uneven recovery continues
Dublin Hotel Supply & Occupancy Rates (SA)
Seated Diners at Dublin Restaurants (% Change Relative to 2019)
Dublin hotel occupancy rates remained relatively subdued through to October 2022 as the sector's uneven recovery continued. Occupancy rates peaked at 86.1% (SA) in May but have since fallen back to 75.1%. Average Daily Rates for rooms, which reached a new peak of €182 (SA) in September, will have been influential alongside the overall impact of inflation on domestic and international tourism trends. The supply of hotel rooms may also be contributing as the index of available rooms in the Capital reached a new high of 123.5 in October, reflecting the booming hotel construction market of recent years.
The post-Covid revival in the Dublin hospitality trade was sustained through to November 2022 as the number of diners at restaurants continued to exceed the 2019 baseline. The volume of seated diners at the Capital's restaurants stood 66.3% above the 2019 baseline in November of this year, in spite of the impact of inflation on disposable incomes. At the national level, the recovery was considerably more pronounced in November with the volume of diners exceeding the 2019 baseline by more than 104%. Growth in seated diners compared to 2019 highlights how creative restaurants have become over the past year – from increasing their outdoor seating to reducing turn times so they can seat more guests.
-100% -75% -50% -25% 0% 25% 50% 75% 100% 125% 150% Mar 20 May 20 Jul 20 Oct 20 Dec 20 Feb 21 May 21 Jul 21 Sep 21 Nov 21 Feb 22 Apr 22 Jun 22 Sep 22 Nov 22 0 5 10 15 20 25 30 35 40 45 50 55 60 65 70 75 80 85 90 95 100 105 110 115 120 125 130 135 0% 10% 20% 30% 40% 50% 60% 70% 80% 90% Oct 20 Dec 20 Feb 21 Apr 21 Jun 21 Aug 21 Oct 21 Dec 21 Feb 22 Apr 22 Jun 22 Aug 22 Oct 22 8 //
OCT '22
75.1%
+27.0
123.5
+9.0 SOURCE: STR GLOBAL. SEASONALLY ADJUSTED BY GRANT THORNTON. SOURCE: OPENTABLE. NOTE: DATA ONLY INCLUDES SATURDAY DINERS. NOV '22 PERCENTAGE CHANGE IN SEATED DINERS VERSUS 2019 BASELINE - DUBLIN +66.3 PERCENTAGE CHANGE IN SEATED DINERS VERSUS 2019 BASELINE - IRELAND +104.7 Index of Supply Occupancy (%)
HOSPITALITY 120.4% Max National Lockdown/Level 5 Restrictions 86.1% Max
HOTEL OCCUPANCY RATE
YEAR ON YEAR % CHANGE
INDEX OF HOTEL ROOM SUPPLY (SA, JULY 2013=100)
YEAR ON YEAR % CHANGE
Hospitality Revival Continues Despite Inflation
Dublin, a circular economy hotspot in the making
 Dr Sarah Miller Chief Executive Rediscovery Centre

The current cost of living crisis combined with climate breakdown challenges has highlighted once again the urgent need for a just transition to a circular economy that protects both the planet and its people. Businesses need to demonstrate that they understand the difficulties facing customers and are working to support them, providing longer-lasting products and services that reduce the economic burden on consumers and the resource burden on the environment.
The circular economy is a systemic approach that provides a solution to global issues such as climate change, biodiversity loss and pollution. Waste and pollution are eliminated by design, materials are kept in circulation for as long as possible and resources are protected and regenerated. This provides the perfect opportunity for businesses and communities to realise the social, economic and environmental benefits of low carbon living through embracing new and transformative ways of living and working.
Dublin’s Circular Transition
Dubliners recognise this opportunity, with 66% agreeing that going green is critical for the city’s economic development. Reflecting this, Dublin City Council’s Draft Development Plan 2022 -2028 commits to supporting a circular transition in line with national policy.
To ensure the transition to a circular economy is just and equitable, lifelong learning programmes to empower people and build their skills are essential. At the Rediscovery Centre, we advance learning through formal education and embedding the circular economy into the national curriculum. Beyond this we provide
As a host of Circular Economy
Hotspot Dublin 2023, the city will showcase circular economy progress.
technical repair and reuse skills to people distanced from the workforce through innovative labouractivation initiatives. In fact a circular transition creates new job opportunities with the International Labour Organization (ILO) estimating that this shift will result in a global net increase of between 7 and 8 million jobs by 2030.
Our visitor centre also educates and inspires action, through events, tours and workshops, and through demonstrating circular solutions that are replicable across society. Ballymun is just one example of a Dublin community benefiting from the development of localised economies and sharing platforms. Initiatives are flourishing as a result of collaboration between local businesses, non-profits and schools.
Circular Economy Leaders
Dublin is home to some of the world’s greatest circular economy leaders and innovations. As a host of Circular Economy Hotspot Dublin 2023 (May 29th – June 1st) the city will showcase circular economy progress made in design and manufacturing, food and the bioeconomy alongside social enterprise activity. Tackling Dublin’s housing crisis through circular solutions will also be explored; going beyond green building materials to explore additional benefits that can be designed into our city to improve well-being and encourage carbon positive lifestyles. A cross-sectoral and public engagement event, Circular Economy Hotspot Dublin will provide the perfect platform to present the circular economy as a positive framework for the city to demonstrate adaptation and growth within planetary boundaries.
// 9
REPORT
SPECIAL
Dublin unemployment ticks up in Q3
DUBLIN & NATIONAL UNEMPLOYMENT RATE % (SA)
Dublin's unemployment rate rose in Q3 2022 yet the labour market remained close to 'full employment'. The Capital's unemployment rate increased by close to half a percentage point (pp) QoQ to stand at 4.9% (SA) in the quarter. This represented a 1.3pp decline relative to Q3 2021. The national unemployment rate also increased in the quarter, following a similar path in rising by 0.5pp QoQ to 4.8%. Despite these contractions, fewer than 40,000 people (SA) were unemployed in the Dublin region in Q3.
Employment levels fall from Q2 peak
Q3 '22
SERVICES EMPLOYMENT '000s (SA) 654.8
YEAR ON YEAR CHANGE '000s (SA) +1.1 INDUSTRY & CONSTR. EMPLOYMENT '000s (SA) 110.0
YEAR ON YEAR CHANGE '000s (SA) +19.3
Employment levels in the Dublin economy fell in Q3 2022 as the labour market suffered losses, notably in the IT sector. Total employment amongst Dublin residents stood close to 765,000 (SA) in the quarter, up from Q3 2021 (+2.7%) but down QoQ (-1%). The QoQ decline was the first since Q1 2021 and may represent an inflection point. The reduction was mostly attributable to a 12,500 (-2.3%) fall in private services sector employment. Construction and industry were areas of growth QoQ in Q3, recording respective expansions of 4,100 jobs (+11.9%) and 4,900 jobs (+6.8%).
0% 2% 5% 7% 9% 11% 14% 16% Q3 12 Q1 13 Q3 13 Q1 14 Q3 14 Q1 15 Q3 15 Q1 16 Q3 16 Q1 17 Q3 17 Q1 18 Q3 18 Q1 19 Q3 19 Q1 20 Q3 20 Q1 21 Q3 21 Q1 22 Q3 22 10 //
4.9%
Q3 '22 DUBLIN UNEMPLOYMENT RATE (SA)
YEAR ON YEAR CHANGE % POINTS -1.3% DUBLIN EMPLOYMENT '000S (SA) 751.0 YEAR ON YEAR CHANGE '000S (SA) +5.3
LABOUR MARKET 15.5% Max 13.3% Max SOURCE: CSO. DUBLIN SEASONALLY ADJUSTED BY GRANT THORNTON National Dublin 0 200 400 600 800 Q3 12 Q3 13 Q3 14 Q3 15 Q3 16 Q3 17 Q3 18 Q3 19 Q3 20 Q3 21 Q3 22
SOURCE: CSO. SEASONALLY ADJUSTED BY GRANT THORNTON. INDIVIDUAL SECTOR VALUES MAY NOT SUM TO TOTAL DUE TO ROUNDING.
Employment by Broad Sector '000s (SA)
Private Services Public Sector Industry Construction
Job postings in Dublin lag rest of Ireland
on Indeed
The volumes of postings for available jobs in Dublin and across the rest of Ireland remained at significantly different levels through to November 2022, according to Indeed. Dublin job postings on the Indeed website fell marginally in the month relative to August, yet still stood over 40% above the February 2020 baseline. While this shows a significant level of unmet employer demand, the situation outside the Capital is more acute. Job postings on Indeed for the Rest of Ireland were more than double (+103.2%) the level recorded in February 2020. This exceptional demand reflects an increase of 23.5 percentage points versus August of this year.

Sales job vacancies most common pre-Christmas
Job postings for positions in sales were most common across the Dublin region between October and November 2022, according to data from Indeed. Ahead of the Christmas period, which is the annual focal point for retail, postings for sales assistants and sales advisors were most prominent on the job postings website.
Postings for cleaners remained within the top 3 for a third consecutive quarter, underlining the persistent demand which exists. Warehouse workers and customer service representatives completed the top 5. Sales associates in the retail sector were also within the top 10, alongside healthcare assistants, and postings in the hospitality sector.
// 11 LABOUR MARKET
40 60 80 100 120 140 160 180 200 220 Nov 20 Dec 20 Feb 21 Mar 21 May 21 Jun 21 Aug 21 Sep 21 Nov 21 Dec 21 Feb 22 Mar 22 May 22 Jun 22 Aug 22 Sep 22 Nov 22
NOTE: 7 DAY MOVING AVERAGE, INDEXED TO 01/02/2020.
Job Postings
(Feb 2020 = 100)
NOV '22 PERCENTAGE POINT CHANGE VERSUS FEB 2020DUBLIN +40.2 PERCENTAGE POINT CHANGE VERSUS FEB 2020 - REST OF IRELAND +103.2 Dublin Rest of Ireland -59.0 Min Sourced From Top 5 Dublin Job Postings on Indeed by Volume, YoY Change DUB 5 Customer Service representative 4 Warehouse Assistant 3 Cleaner 2 Sales Advisor 1 Sales Assistant
International rankings point to Dublin’s talent base & liveability
Internationally published benchmarks are a useful means of measuring a city’s performance relative to its peers, and recent indicators for Dublin confirm the city’s strong showing across a range of dimensions (see table opposite).
Talent Hotspot
Dublin has been ranked in 10th position in the 2022 INSEAD Global Talent Competitiveness Index, though its ranking was down four places on 2021. The city ranked particularly well (7th globally) in terms of its regulatory, market, business and labour landscapes which facilitate talent attraction and growth. It also ranked in 7th position for its attractiveness for FDI and creative persons, and labour market accessibility for women, non-native people and those from underprivileged backgrounds. Areas for improvement for the Capital include third level enrolment as a proportion of total population, and software development. San Francisco topped the ranking globally, with Zurich (3rd) leading the way in Europe.
High Living Standards
Dublin has been ranked as the 19th best city in the world, according to Resonance Consultancy. The Capital was rated as the safest of the 100 cities in the ranking, while international air connections were a further positive contributor. Resonance also highlighted “homegrown economic development initiatives like Ireland’s Local Enterprise Office, which supports international companies with mentoring, training and financial grants”.
In a separate index from Global Finance, Dublin
has retained its position within the top 30 cities in the world to live in. The Capital ranked ahead of Geneva, Barcelona and San Francisco in rankings which were based on eight metrics including economic strength, Covid-19 deaths and population growth. London rose one place to take top spot in the 2022 rankings.
LGBTQ+ Inclusiveness
The Capital has been ranked as one of the top 30 most LGBTQ+ friendly cities in the world. Dublin placed 26th in Big 7 Travel’s rankings, where criteria included safety, rights, laws, freedoms and the gay communities in cities. The city’s Pride celebration, which will reach its 40th anniversary in 2023, was hailed, along with the annual International Dublin Gay Theatre Festival.
Eco-Friendly Tourism Challenges
Dublin has been ranked as one of the least eco-friendly tourist destinations in Europe. The Capital ranked as the fourth least eco-friendly destination of 28 cities, according to research from travel app Bounce. Rankings were particularly poor for green energy performance and the number of eco-friendly hotels. Berlin was the most eco-friendly city in Europe, with Rotterdam placed in last position.

12 //
DUBLIN'S INTERNATIONAL RANKINGS
Source
INSEAD Global Talent Competitiveness Index
Resonance World's Best Cities
DUBLIN'S LATEST INTERNATIONAL RANKINGS
Benchmarking Criteria Year Ranking
Regulatory, market and business/labour landscape, external and international openness, education and access to growth opportunities and sustainability and lifestyle 2022 10 ▼
24 criteria across six categories of Place, Product, Programming, People, Prosperity, Promotion 2023 19 ▲
Global Finance Top 30 Cities in the World to Live In
Big 7 Travel Most LGBTQ+ Friendly Cities in the World
Bounce Most Eco-Friendly Tourist Destinations in Europe

Economic strength, R&D, cultural interaction, liveability, environment, accessibility, Covid-19 deaths, population growth 2022 27
Gay Index Rating, Equality Index Rating, membership of UN LGBTI Core Group, celebrations & community 2022 26
8 criteria including sustainable hotels, public transport use and air quality 2022 25
Eden Strategy Institute Top 50 Smart City Governments 10 key factors covering governance, resourcing, smart programmes, policies and ecosystem 2021 26 ▲
EU European Capital of Innovation Awards
fDi x TNW European Tech Cities of the Future
fDi Small Regions of the Future
fDi Global Cities of the Future
EY Financial Services Brexit Tracker
Inter-disciplinary ecosystems, and promotion of innovative initiatives to improve wellbeing of citizens 2021 2 ▲
FDI performance, connectivity, cost effectiveness, economic potential, innovation & attractiveness 2021 3
Economic potential, human capital and lifestyle, cost effectiveness, connectivity and business friendliness 2022 1 ▲
FDI performance, connectivity, cost effectiveness, economic potential, innovation & attractiveness 2021 5 ▼
Movement of services and staff at financial services firms in the UK since the Brexit referendum in 2016 2022 1
Cost of consumer goods and services 2022 49 ▲ Mercer Quality of Living City Rankings Environmental/ socio-economic 2019 33 ▲
Mercer Cost of Living City Rankings
PwC-ULI Emerging Trends in Real Estate Europe
Startup Genome Global Startup Ecosystem Report
ECA International Most Liveable Locations for European Expatriates
QS World University Rankings
Outlook for investment and development, and the scale/liquidity of the city's market 2021 13 ▼
Performance, funding, market reach, connectedness, talent, experience 2021 36
Quality of expatriate living conditions, including climate, health services, housing and utilities, social networks, infrastructure, personal safety, political tensions and air quality. 2022 10 ▲
University quality 2022 101*
IMD World Competitiveness Ranking 332 criteria related to competitiveness, digital competitiveness and talent 2020 12 ▼
// 13 ‡ CHANGE ON PREVIOUS PUBLICATION OF THE RELEVANT BENCHMARK. AN UPWARD-POINTING ARROW DENOTES AN IMPROVEMENT. *TCD.
DUBLIN'S INTERNATIONAL RANKINGS
Housing transactions peak though uncertainty ahead
Dublin Residential Property Transactions (SA)
SEP '22
DUBLIN RESIDENTIAL PROPERTY TRANSACTIONS (SA) 2635
YEAR ON YEAR % CHANGE +53.1 IRELAND RESIDENTIAL PROPERTY TRANSACTIONS (SA) 6926 YEAR ON YEAR % CHANGE +255
The volume of residential property transactions in Dublin reached a new peak in September 2022. Over 2,600 residential units (SA) were sold in the month, exceeding the pre-pandemic peak of March 2020. Growth of 30.3% MoM and 53.1% YoY in the volume of transactions underlines the rebound in the Capital's property market, though the combination of rising interest rates and loosening Central Bank mortgage lending rules make for an uncertain period ahead. Nationally, transactions also surged in September with growth of 25.5% YoY.
Dublin residential prices rise further in Q3
Residential Property Price Index (2015 = 100)
SEP '22
PROPERTY PRICE INDEX DUBLIN 151.1
YEAR ON YEAR % CHANGE +9.6 PROPERTY PRICE INDEX NATIONAL EXCL. DUBLIN 185.9 YEAR ON YEAR % CHANGE +11.8
Residential property prices in Dublin maintained an upward trajectory through to September 2022, ahead of a challenging winter period for the domestic and global economies. Although the rate of YoY price growth slowed in September, it remained robust at 9.6%. The price index for Dublin hence reached 151.1 in the month, moving closer to the February 2007 peak of 160. Across the rest of Ireland prices continued to break new ground with growth of 11.8% YoY driving the index to another new high of 185.9.
40 80 120 160 200 Sep 12 Sep 13 Sep 14 Sep 15 Sep 16 Sep 17 Sep 18 Sep 19 Sep 20 Sep 21 Sep 22
Mar 17 Sep 17 Mar 18 Sep 18 Mar 19 Sep 19 Mar 20 Sep 20 Mar 21 Sep 21 Mar 22 Sep
14 //
0 500 1,000 1,500 2,000 2,500 3,000
22
SOURCE: CSO.
Dublin National excl. Dublin HOUSING
SOURCE: CSO. SEASONALLY ADJUSTED BY GRANT THORNTON. 2,653 Max 151.0 Max
Growth in residential rents accelerates in Q2
Residential Rents € Per Month
DUBLIN AVG RESIDENTIAL RENT € PER MONTH 1,863 YEAR ON YEAR € CHANGE +31
Growth in residential rents in Dublin accelerated in Q2 2022 as housing remained a significant challenge for the domestic economy. Average monthly rents in the Capital grew by 1.8% (+€32) QoQ and 1.7% (+€31) YoY to stand at €1,863. This was broadly in line with the highest average rent of €1,866 recorded in Q3 2021, and is likely linked to interest rate hikes and ongoing supply issues, which have made the transition from renting to buying more difficult for many tenants. Rents in the Greater Dublin Area (GDA) were stable at €1,367 in the quarter, while outside the GDA growth of 1.9% QoQ drove rents to a new peak of €914 per month.
Capital's housing supply plateaus in Q3
Q3 '22
TOTAL HOUSE COMMENCEMENTS 2,653 YEAR ON YEAR CHANGE -943 TOTAL HOUSE COMPLETIONS (SA) 2,787 YEAR ON YEAR CHANGE +1,488
The supply of new houses to the Dublin residential market largely plateaued in the third quarter of the year. The volume of commencements remained above the medium term average but fell marginally QoQ (-1.9%) to stand at 2,653. Such stagnation is likely due to multiple factors, but sharp increases in the cost of construction may be a significant contributory factor. Housing completions were marginally stronger in the quarter at 2,787 (SA), though this also represented a slowdown versus the previous quarter (-4.1%).
Q1 12 Q4 12 Q3 13 Q2 14 Q1 15 Q4 15 Q3 16 Q2 17 Q1 18 Q4 18 Q3 19 Q2 20 Q1 21 Q4 21 0 1000 2000 3000 4000 5000 6000 Q1 16 Q3 16 Q1 17 Q3 17 Q1 18 Q3 18 Q1 19 Q3 19 Q1 20 Q3 20 Q1 21 Q3 21 Q1 22 Q3 22 // 15
€400 €600 €800 €1,000 €1,200 €1,400 €1,600 €1,800 €2,000
Dublin House Commencements & Completions
Completions (SA) Commencements
SOURCE: CSO, DHLGH HOUSING
SOURCE: RTB
Q2 '22
Outside GDA Greater
Area Dublin €1,866 Max 5,013 Max 2,905 Max Q2
Dublin
22
Fare reductions contribute to public transport growth
Public Transport Million Trips (SA)
PUBLIC TRANSPORT MILLION TRIPS (SA) 53.5 YEAR ON YEAR % CHANGE +64.3
The steady post-pandemic recovery in the level of public transport usage in Dublin continued in Q3 2022. More than 53 million passenger journeys (SA) were undertaken in the quarter, representing QoQ and YoY growth of 11.6% and 64.3% respectively. Dublin Bus recorded the largest bounce in the quarter with QoQ growth of 4.6 million trips or 15.3%. Q3 was the first full quarter in which the NTA's fare reductions applied yet public transport remains below pre-pandemic levels.
Traffic volumes increase from mid-year dip
Traffic volumes on eight main Dublin thoroughfares increased in November 2022 following a mid-year dip. Average daily traffic volumes rose from 481,000 (SA) in July to over 667,000 in November. Such volumes were thus broadly on par with the longer term trend, but down from peak levels of in excess of 750,000. The modest falloff versus the pre-pandemic period may be related to recent reductions in public transport fares. The announcement of increased tolls at all bar two locations in Dublin from July 2023 may be a further deterrent to road users in the latter half of next year.
100 200 300 400 500 600 700 800 Nov 17 Apr 18 Sep 18 Jan 19 Jun 19 Oct 19 Mar 20 Aug 20 Dec 20 May 21 Sep 21 Feb 22 Jul 22 Nov 22 16 //
Dublin Average Daily Traffic Count '000s (SA)
Q3 '22
SOURCE: TII. SEASONALLY ADJUSTED BY GRANT THORNTON. DATA IS WEEKLY.
SOURCE: NTA. SEASONALLY ADJUSTED BY GRANT THORNTON. NOTE: PROVISIONAL DATA VERIFIED BY ALL OPERATORS. NOV '22 AVERAGE DAILY TRAFFIC COUNT (SA) 667,657 YEAR ON YEAR % CHANGE -2.3 PEAK VOLUME COUNT
47,225 YEAR ON YEAR % CHANGE +0.8 PEAK VOLUME COUNT
(SA) 49,937 YEAR ON YEAR % CHANGE -7.0 Dublin City Bus Bus Éireann Irish Rail Luas TRANSPORT & TRAVEL Storm Emma 201,469 Min 0 10 20 30 40 50 60 70 Q2 17 Q3 17 Q4 17 Q1 18 Q2 18 Q3 18 Q4 18 Q1 19 Q2 19 Q3 19 Q4 19 Q1 20 Q2 20 Q3 20 Q4 20 Q1 21 Q2 21 Q3 21 Q4 21 Q1 22 Q2 22 Q3 22
(AM) (SA)
(PM)
New runway expected to add further to Airport recovery
Q3 '22 TOTAL PASSENGERS '000s (SA) 7,918 YEAR ON YEAR CHANGE '000s TRIPS (SA) +4,342
Passenger numbers at Dublin Airport recovered further in Q3 2022, with nearly 8 million passengers (SA) passing through. This represented QoQ and YoY increases of 906,617 (+12.9%) and 4.3 million (+121.4%) passenger journeys respectively. Throughput in July, August and September averaged 90% of prepandemic levels as demand continued to rebound at swifter than anticipated rates. The August opening of the north runway is a significant milestone, and will be expected to enable the Airport to serve more routes and greater volumes of passengers over the longer term.
Port throughput falls as trade conditions worsen
Q3 '22
DUBLIN PORT EXPORTS MILLION TONNES (SA) 3.64
YOY CHANGE MILLION TONNES (SA) +0.10
DUBLIN PORT IMPORTS MILLION TONNES (SA) 5.65
YOY CHANGE MILLION TONNES (SA) +0.14
Activity levels at Dublin Port fell by 1.8% QoQ in Q3 2022 as 9.3 million tonnes (SA) of cargo were handled in the quarter. Both export and import volumes reduced with respective declines of 5.4% and 1.7% QoQ. The recent poor performance of sterling may have been a contributory factor to the more severe contraction in exports, along with the wider global economic slowdown. On a YoY basis, throughput growth at Dublin Port slowed to 2.7% in Q3 following +7.2% YoY growth in Q2 2022. Given the significant inflation challenges affecting economies across the world, including Ireland's, further slowdowns or falling trade may be expected over the winter period.
0 1 2 3 4 5 6 7 8 9 10 11 Q1 14 Q3 14 Q1 15 Q3 15 Q1 16 Q3 16 Q1 17 Q3 17 Q1 18 Q3 18 Q1 19 Q3 19 Q1 20 Q3 20 Q1 21 Q3 21 Q1 22 Q3 22 0 1,000 2,000 3,000 4,000 5,000 6,000 7,000 8,000 9,000 Q3 14 Q1 15 Q3 15 Q1 16 Q3 16 Q1 17 Q3 17 Q1 18 Q3 18 Q1 19 Q3 19 Q1 20 Q3 20 Q1 21 Q3 21 Q1 22 Q3 22 // 17
Dublin Airport Passengers '000s (SA)
Dublin Port Tonnage Million Tonnes (SA)
SOURCE: CSO & DUBLIN AIRPORT. SEASONALLY ADJUSTED BY GRANT THORNTON.
SOURCE: DUBLIN PORT. SEASONALLY ADJUSTED BY GRANT THORNTON. Imports Exports Total Tonnage TRANSPORT & TRAVEL 10.1 Max 8.3m Max Min
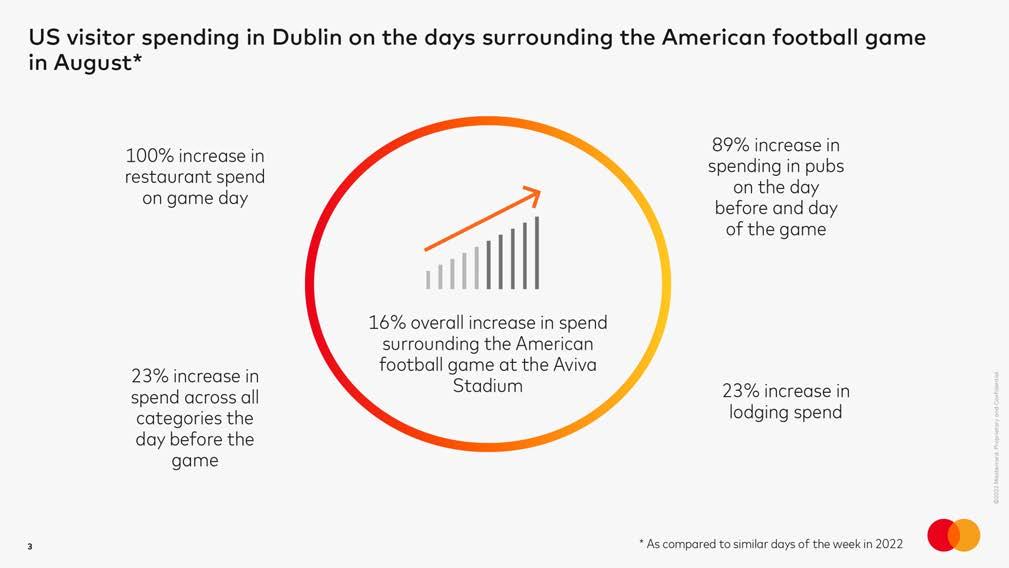
American football game linked to US tourist spending surge in Dublin
Chapin Flynn Senior Vice President of Urban

Mastercard is no stranger to this type of work, having evaluated the economic impacts of events on local economies around the world – including revealing insights such as an uplift of 14% in restaurant sales during the Australian Grand Prix.
Impact of Events on the Local Economy
Dublin City Council (DCC), through its Smart City programme, has long been exploring ways to create new types of data insights that support data driven decision making. To this end, the Council has partnered with Mastercard through its City Possible global network, to leverage place-based spending data for Ireland.

This next generation data, which is anonymised and aggregated so that no individual information can be identified, allows users, such as the DCC, to track the impact of specific events or public realm changes across different industry segments in near real time.
To demonstrate the robustness of the programme, we partnered with DCC to evaluate the impact of the American College Football game played in the Aviva Stadium on August 27th. The fact that over 10,000 fans were estimated to have travelled from the US to attend the season opening game presented a unique opportunity to better understand the impact of this event on the local economy.
For this project in Dublin, we analysed spending trends across 85 different services. To distinguish noteworthy variances from the norm, we compared the days up to and after the event to similar periods in May, June, July, and August. The data was aggregated and anonymised so that we could identify and compare spending patterns for Irish, American, European, and other visitors to local spending.
18 //
SPECIAL REPORT
Mobility, Mastercard
Next-generation spending analysis is enabling Dublin City Council to evaluate the economic impact of events in the City
Mastercard Spending Insights
In total, the data included more than €1.2bn in spend on the Mastercard network in Dublin and the surrounding area over the relevant periods. Some of the spending insights from US visitors when comparing the days surrounding the football game to the average spend across similar time periods in May-August are included in the infographic below.
The Power of Actual Spend Data
This data definitively demonstrates the impact the American Football game had on the Dublin economy and, in particular, the increase in American tourist spending. While this was only a proof of concept, it effectively demonstrated the power of utilising actual spend data as compared to using estimates and models.
The new insights generated from this analysis allows DCC to make informed decisions about the potential impact of similar events in the future. On a broader scale, the Mastercard data can be used to evaluate the
impact of attracting a major concert, festival, conference, etc. For example, similar data could be used to assess the impact of the five Garth Brooks dates in Dublin in September?
The insights from this data create many opportunities to better understand city investment decisions. It could be used for something as nuanced as analysing spending patterns in different commercial districts as businesses return to near full-time in-office work weeks. Cities that avail of this type of concrete data-driven decision making will be at a considerable advantage when compared to cities that make decisions based on models or anecdotal feedback.
This is a further step in DCC’s evolution towards a culture of more data-driven decision making and utilising data to evaluate the impact of those decisions.
The ultimate goal of this partnership is to address data gaps and provide the best government services for the people and businesses of Dublin.

// 19 SPECIAL REPORT

SOURCES: CSO, PMI IHS MARKIT; SEAPORT CARGO DUBLIN PORT; PUBLIC TRANSPORT NTA; RESIDENTIAL RENTS RTB; COMMERCIAL PROPERTY CBRE RESEARCH, HOTEL OCCUPANCY STR GLOBAL. NOTE: THESE "PETROL GAUGE" CHARTS PRESENT THE PERFORMANCE OF THE PARTICULAR INDICATOR RELATIVE TO A RANGE OF PERFORMANCES FROM MOST POSITIVE (GREEN) TO LEAST POSITIVE (RED). EACH GAUGE PRESENTS THE LATEST VALUE COMPARED TO THE PEAK VALUE AND THE TROUGH VALUE OVER THE LAST DECADE (EXCEPT FOR PUBLIC TRANSPORT TRIPS, MASTERCARD SPENDINGPULSE AND STR GLOBAL WHICH COVER THE PAST 5 YEARS, HOUSING COMPLETIONS WHICH COVER THE PAST 6 YEARS). THE COMMERCIAL PROPERTY GAUGES ARE RED AT THE HIGH AND LOW EXTREMES, IN RECOGNITION OF THE UNDESIRABILITY OF RENTS THAT ARE EITHER TOO HIGH OR TOO LOW AS WELL AS VACANCY RATES. Dublin Economic Scorecard ECONOMY S&P Global Business PMI Q3 2022 Unemployment Rate Q3 2022 SpendingPulse Sales Index Q3 2022 3 MONTH MOVING AVERAGE (SA) % (SA) INDEX (2014 = 100) (SA) 25 63 4 13 111 148 TRAVEL Hotel Occupancy Rate OCT 2022 Seaport Cargo Q3 2022 Public Transport Trips Q3 2022 % OF TOTAL ROOMS (SA) MILLION TONNES/QUARTER (SA) MILLION TRIPS/QUARTER (SA) 5 84 6.8 10.1 13.5 62.4 RESIDENTIAL PROPERTY Average Residential Rents Q2 2022 Residential Property Price Index Sep 2022 Housing Completions Q3 2022 €/QUARTER INDEX (2015 = 100) UNITS/QUARTER (SA) 1,051 1,870 65 151 882 2,900 COMMERCIAL PROPERTY Dublin City Centre Office Rent Q3 2022 Dublin 2/4 Office Vacancy Rate Q3 2022 Dublin Suburbs Office Vacancy Rate Q3 2022 INDEX (2006 = 100) % % 50 119 4 20 6 24 50.4 4.9 148 75.1 9.3 53.5 1,863 114 12.8 8.1 151.0 2,787
