EXECUTIVE SUMMARY: INNOVATIVE BENCHMARK COUNTRIES AND REGIONS FOR FLANDERS
As partoftheambitionofthe FlemishGovernmentto reachthetopofknowledgeand innovationdriven regions, Minister-President Jan Jambon and Minister of Economy and Innovation Hilde Crevits asked to select relevant European benchmark countries and regions (First Phase of the request for advice)
VARIO1 selects FIVE INNOVATIVE BENCHMARK COUNTRIES:
• Switzerland, Sweden, Denmark, Finland andThe Netherlands
Additionally, SEVENTEEN INNOVATIVE BENCHMARK REGIONS are selected:
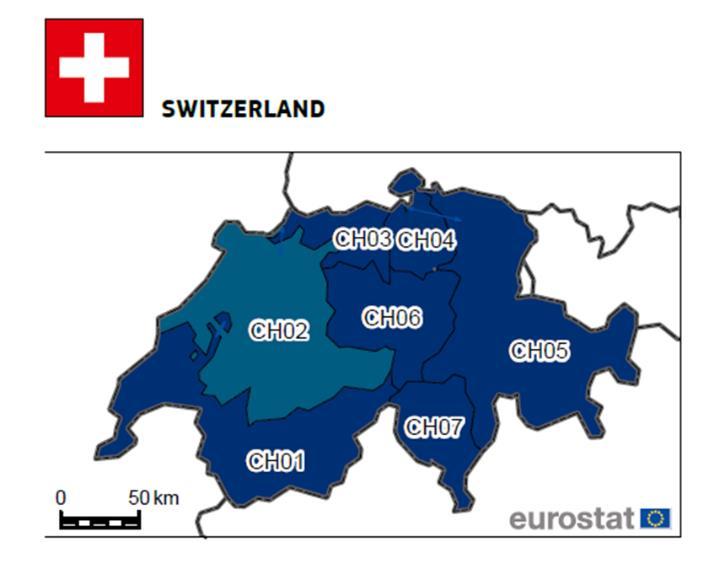
• Seven from Switzerland: Zürich, Région Lémanique,Espace Mittelland, Nordwest-schweiz, Ostschweiz, Zentralschweiz and Ticino
• Two from Sweden: Stockholm and Sydsverige
• One from Denmark: Hovedstaden
• One from Finland: Helsinki-Uusimaa
• Two from the Netherlands: Utrecht and Noord-Brabant
• Four from Germany: Oberbayern, Karlsruhe, Tübingen and Stuttgart
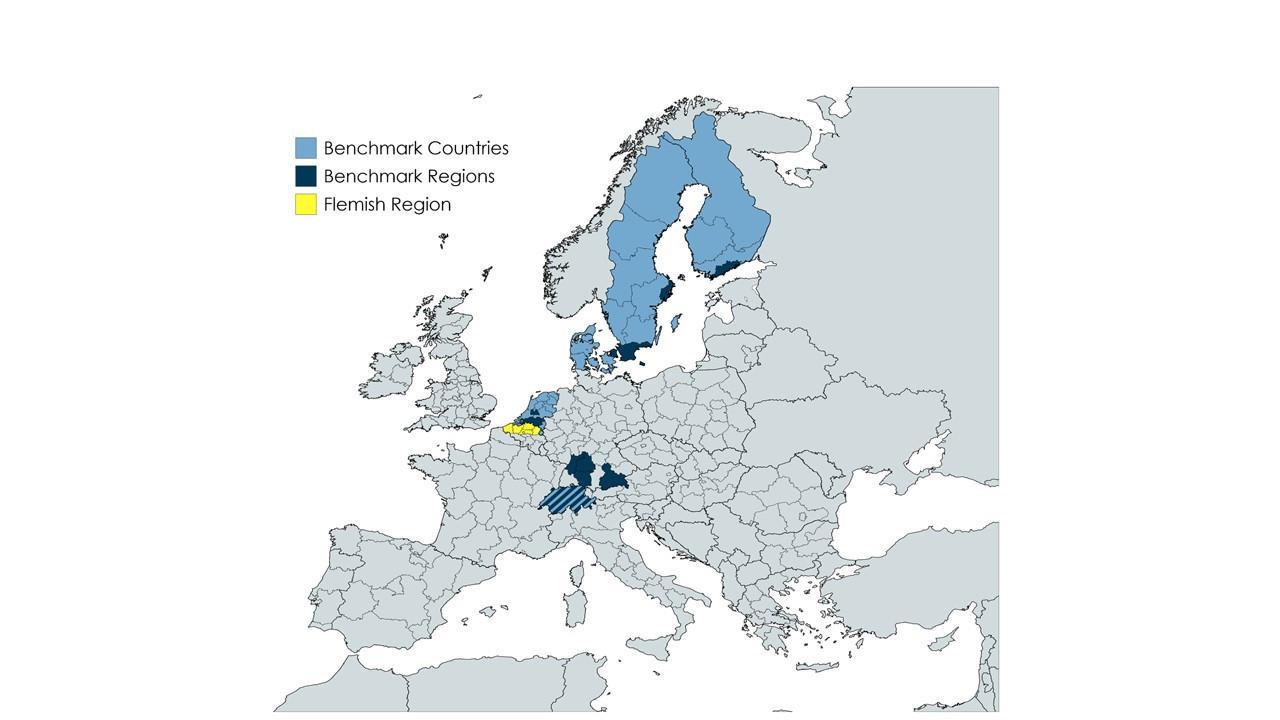
Theselectedcountriesandregions(Figure1B)largelybelongtothelargecorridorofurbanizationtheBlue Banana on the one hand, and the Scandinavian countries on the other.Although Flanders belongs to the Blue Banana, we cannot yet count the Flemish Region among the top European regions. The top regions Sydsverige (Malmö) and Hovedstaden (Copenhagen) together, form the Swedish-Danish top cross border innovative region, with the famous Öresund Bridge as its physical link.
VARIO emphasizes that a benchmark approach always has its limitations There will always be fundamental (and immutable) differences between Flanders and its benchmark countries of regions (e.g. in economic structure, infrastructure, historical decisions and investments…).The context of a country or regionisalwaysimportant:agoodpracticeinoneregioncannotsimplybetransferredtoanother.VARIO also notes that Flanders can not only learn from success stories but also from countries or regions such as Austria that have failed in their strategy to reach the top
In a Second Phase of the request for advice, VARIO will formulate concrete recommendations for a roadmap for the Flemish Region by the summer of 2020, in order to join the select group of top regions by 2030. These recommendations will be based on an extensive analysis of the rankings (innovation and competitiveness), literature research and qualitative research based on interviews.
pagina 8 van 18 VARIO ADVIES NR. 10INNOVATIEVE BENCHMARKLANDEN EN -REGIO’S
1 Acronym for The Flemish Advisory Council for Innovation and Enterprise: www.vario.be/en
//////////////////////////////////////////////////////////////////////////////////////////////////////////////////////////////////////////////////////////////// // MAART 2020 VARIO ADVIES NR. 10INNOVATIEVE BENCHMARKLANDEN EN -REGIO’S pagina 9 van 18
FIGURE 1B:Benchmark Countries and Regions for the Flemish Region
Source: Mapchart.net; Own editing
ADVIES
1. SITUERING
In het kader van de ambitie van de Vlaamse Regering om Vlaanderen een top-vijf positie te laten verwerventussendemeestinnovatieveregio’senlandeninEuropa,willenminister-presidentJanJambon en minister van Economie en Innovatie Hilde Crevits VARIO actief inschakelen in twee fasen:
1. In een eerste fase voorstellen te doen voor (1) relevante benchmarklanden en -regio’s, en (2) transparantestrategischebeleidsindicatorendieperiodiekbeschikbaarzijn,ookophetniveauvan Vlaanderen;
2. In een tweede fase werk te maken van concrete aanbevelingen en adviezen die aansluiten op de eerste fase t.a.v. (1) gerichte optimalisering van het Vlaamse wetenschaps- en innovatiebeleid en onderwijsbeleidomdetop-5ambitieterealiseren;(2)adviezenvoordeandereactoren(bedrijven, speerpuntclusters, kennisinstellingen…) om zich hierin te engageren; (3) aanbevelingen t.a.v. een internationaliseringsstrategie en profilering van Vlaanderen als innovatieve topregio.
Voorliggend advies beperkt zich tot de 1ste fase van de adviesvraag t.a.v. relevante benchmarkregio’s en/of -landen
2. WAT VERSTAAT VARIO ONDER BENCHMARKLANDEN OF –REGIO’S?
Benchmarklandenen-regio’szijnEuropesereferentie-of‘bestpractice ’-landenen-regio’sdievooroplopen in socio-economische ontwikkeling (economische toplanden of topregio’s, ‘InnovationPowerhouses’…) en waarvanVlaanderenzoveelmogelijkkanleren,metalsambitiedetopvanEuropatebereikenvankennisen innovatieregio’s.
Voor het bepalen van relevante benchmarkregio’s en -landen baseerde VARIO zich zowel op innovatieals op competitiviteitsindicatoren (Regionaal Innovatiescorebord (RIS), Regionale Competitiviteitsindex (RCI), Europees Innovatie Scoreboard (EIS), WEF Competitiviteitsrapport (GCI), Global Innovation Index (GII)…).Eenhogescoreopinnovatiehangtimmersingrotematesamenmetsterkeprestatiesophetgebied van competitiviteit2 of concurrentievermogen, een hoge score op competitiviteit gaat op zijn beurt in sterkematesamenmeteenhoogBrutoNationaalProduct(BNP)(maarisernietgelijkaan,zievb.RCI2019).
2.1. Selectiecriteria
VARIO maakte maximaal gebruik van volgende selectiecriteria, met het oog op het selecteren van de meest relevante benchmarklanden en -regio’s:
1. Consistent hoge scores op de meeste indicatoren van zowel innovatie als competitiviteit:
2 WEF definieert Competitiviteit als volgt: “the set of institutions, policies and factors that determine the level of productivity of a country." Other definitions exist, but all generally include the word “productivity” zie https://www.weforum.org/agenda/2019/10/the-worlds-most-competitive-economies-global-report/
pagina 10 van 18 VARIO ADVIES NR. 10INNOVATIEVE BENCHMARKLANDEN EN -REGIO’S
• Innovatie:
o Europees Innovatie Scorebord (EIS2019): enkel de Innovatieleiders;
o Regionaal Innovatie Scorebord (RIS2019): enkel Innovatie Leiders+ en Innovatie Leiders (zonderde Innovation Leaders-)
• Competitiviteit:
o Regionale CompetitiviteitsIndex (RCI2019):Top25
o Globale CompetitiviteitsIndex (WEF) (GCI2019):Top20
2. Consistentie van de scores over de tijd (periode 2011-2019);
3. Agglomeratievoordelen: grootstedelijke regio’s en (hoofd-)steden (capital/metropolitanregions) speleneenbelangrijkerolininnovatieeneconomischecompetitiviteit(zievb.EU-RCI,2019)omwille van agglomeratievoordelen3 Bedrijven, kennisinstellingen, talent… clusteren in elkaars nabijheid, watleidttoteenaantalbatenzoalsgemeenschappelijkeinfrastructuur,toegangtottalentenskills We nemen bevolkingsdichtheid (aantal inwoners/km²) – samen met de grootte van de regio (NUTS-classificatie) - mee in de analyse (Appendix I, zie ook Appendix II en III: ‘Structural differences ’), alhoewel zeker geen perfecte indicator voor agglomeratievoordelen (vb. Ajmone Marsan & Maguire, 2011). Om de vergelijking met Vlaanderen te maken sluiten we de ‘city-success’ regio’suit,metnamedieregio’swaarhetsucceshoofdzakelijksteuntopéénbepaaldestad,eerder dan het een succes is voor een hele regio. Dan denken we aan Londen en Berlijn.
4. Vergelijkbareeconomischestructuur(zieprofielenvangeselecteerdebenchmarklandenen-regio’s in Appendix II en III);
5. Regio’s hebben (verregaande) beleidscompetenties mbt innovatie
3. RELEVANTE BENCHMARKLANDEN EN -REGIO’S
In dit hoofdstuk gaat VARIO eerst in op (3.1.) de gemeenschappelijke kenmerken van benchmarklanden of -regio’s, vervolgens (3.2.) op de selectie van een aantal benchmarklanden en -regio’s en ten slotte (3.3.) op de beperkingen van een benchmarkbenadering en de rol van context.
3.1. Gemeenschappelijke kenmerken van benchmarklanden of –regio’s
OpbasisvandeanalysesvanVARIO(Naardetopvankennis-eninnovatieregio’s,invoorbereiding)blijken topregio’ s en toplanden volgende algemene kenmerken gemeenschappelijk te hebben:
1. Topregio’s scoren consistent hoogop demeeste4 indicatoren van innovatie en competitiviteit Om een topregio te worden is een globale, brede transformatie nodig met aandacht voor alle ingrediënten van een kennis- en innovatiegedreven economie. Dit vergt een uitgesproken kwaliteitsstreven in het hele maatschappelijk weefsel: in het bedrijfsleven, het onderwijs, de
3 https://nl.wikipedia.org/wiki/Agglomeratie-effect
4 Er bestaat hier zeker een aantal uitzonderingen. We verwijzen hier o.a. naar Nederland dat over het algemeen zeer goed scoort op innovatie- en competitiviteitsindicatoren maar bijvoorbeeld op het aandeel afgestudeerden in de STEM-richtingen zeer laag scoort als rode lantaarn in Europa.
//////////////////////////////////////////////////////////////////////////////////////////////////////////////////////////////////////////////////////////////// // MAART 2020 VARIO ADVIES NR. 10INNOVATIEVE BENCHMARKLANDEN EN -REGIO’S pagina 11 van 18
overheidsdiensten… Het is een EN-EN-verhaal met een cultuur van innovatie, ambitieus ondernemen en internationalisering als de hoofdingrediënten5. O&O-investeringen, levenslang leren… zijn slechts een deel van een complexe puzzel; ook andere ingrediënten spelen een rol zoalsvormenvanvraaggedreveninnovatie(vb.overheidsaanbestedingengerichtopinnovatie en duurzaamheid), culturele uitwisseling van ‘mindset ’ (vb. in Silicon Valley): jonge ondernemers die door bepaalde regio’s worden aangetrokken en nadien opnieuw vertrekken (‘braincirculation’)…
Om een metafoor te gebruiken uit het wielrennen: een topregio is zoals een topteam met een vast aantal renners in een ploegentijdrit Het beste team wordt niet bepaald door de tijd van deeersterenner,maardievandelaatsterenner:ookderenners‘LevenslangLeren’,‘Ambitieus ondernemen ’ …dienentijdigofzo snel mogelijk demeet tehalen omeentopprestatievanhet team neer te zetten…
VARIO benadrukt hier dat indicatoren zorgvuldig dienen te worden geïnterpreteerd (Nog) hoger scoren op een indicator is bijvoorbeeld niet altijd beter en kan aanleiding geven tot efficiëntiekosten.VolgensForay&Hollanders(2015)zougeenenkellandofregioerbijvoorbeeld baat bij hebben als heel de bevolking een tertiaire opleiding zou hebben... of als de O&Ointensiteit 50% zou bedragen van het BBP. Het is duidelijk dat er voor de meeste indicatoren eensoortvanU-vormigeperformantiecurve bestaat(meteenkeerpunt),waarbijlageniveaus het de moeite waard is om het prestatieniveau nog te verbeteren, maar dat verdere verbeteringen (na het keerpunt) kunnen leiden tot inefficiënties6
2. Topinnovatie dient zich ook te vertalen in economisch succes (impact) Zo lijken bijvoorbeeld landen met een bovengemiddeld aandeel in hightechindustrie beter te scoren op veel van de innovatie-indicatoren(EIS2019 VARIOmerkthierbijwelopdatdeterm‘hightechindustrie’met denodige voorzichtigheid dientworden geïnterpreteerd.Zo isdecategoriehigh-tech(export) gebaseerd op de NACE-codes 21 (Manufacture of basic pharmaceutical products and pharmaceutical preparations) en 26 (Manufacture of computer, electronic and optical products). Dit komt echter niet altijd overeen met de realiteit en is slechts een benaderende indicatie voor hightech (export). In Vlaanderen zijn bijvoorbeeld delen van de textielsector (nieuwe materialen die niet onder de NACE-codes 21 en 26 vallen) ook hightech (vb. technisch of medisch textiel). Deze mismatch geldt echter niet alleen voor Vlaanderen maar ook voor andere landen en regio’s. Zo scoorde China een aantal jaar terug al hoog op deze indicator door loutere assemblage van elektronische componenten. Bijkomende voorzichtigheid in de interpretatievandezeindicatorisookgebodenomdatinVlaanderendenoemergroterisdoor
economische ontwikkeling.
6 Foray & Hollanders (2015) verwijzen o.a. naar het (te) hoge aantal jonge mensen met een diploma uit het tertiair onderwijs in landen zoals vb. Luxemburg of het hoge aandeel nieuwe doctoraathouders in Zweden of Zwitserland, de (mogelijk te) hoge O&O-intensiteit in Zweden of Zwitserland:“ApossiblecaseisthehighR&D intensitiesinFinlandandSweden.Althoughasignificantshareofthesecountries’GDPisspentonR&Dactivities,percapitaincomeisnotamongthehighestinEurope. OnecouldarguethatthesecountrieshavebeenoverinvestingintheirR&Dactivities.[…]Forseveralcountries,theshareoftheirpopulationaged30–34yearshaving completedtertiaryeducationmightbereachingtheabove-mentionedturningpoint.InIreland,Cyprus,Luxembourg,Finland,Sweden,andNorway,theindicatoris alreadyabove45%,andinSwitzerland,the44.2%mightalsobeclosetothisturningpoint.[...]Asimilarargumentcouldbemadefornewdoctorategraduateswhere SwedenandSwitzerlandaretheonlycountrieswithashareabove3%.”
pagina 12 van 18 VARIO ADVIES NR. 10INNOVATIEVE BENCHMARKLANDEN EN -REGIO’S
5 Zie De Voldere en collega’s (2014) voor een goed overzicht en model van (geavanceerde)
de doorvoerhandel in zijn havens (Antwerpen, Zeebrugge en Gent). Wallonië scoort bijvoorbeeld beter op deze indicator (o.a. GSK speelt hier een rol in), maar heeft een kleinere noemermededoordat het geen havens heeft.
3. De meeste Europese topregio’s huisvesten grootstedelijke gebieden. Zij spelen een belangrijke rol in het concurrentievermogen van de regio (cf. supra m.b.t. agglomeratievoordelen). Vertaald naar Vlaanderen betreft het dan bijvoorbeeld de Vlaamse Ruit, Antwerpen (en zijn haven), Lille-Kortrijk-Doornik, Brussels Hoofdstedelijk Gewest7).
4. De kans op een sterke regionale innovatieprestatie stijgt wanneer de regio behoort tot een land dat ook sterk presteert (landen zoals Zwitserland, Denemarken, Zweden…);
5. Topregio’s omarmen de toekomst (vb. 5G, E-commerce, adoptie van AI, duurzaamheid…): “[…] Beingforward-thinkingandembracingthefutureisanotherkeythemeforthetopplayers, alongsidemakingtechnologyanintegralpartofpolicy.TheUS,whichissecondontheoverall list,comestopforbusinessdynamismandsecondforinnovationcapability”8
6. Innovatie maakt deel uit van het hele economisch systeem: “Whatreallyisadifferentiating factoristheinnovationecosystem,”[…]“Creatingtheconditionsforinnovationtobecomepart oftheentireeconomy,notjustpocketsofexcellence.Thattakesalotofeffort.”9 7.
3.2. Meest relevante benchmarklanden of –regio’s
Op basis van de analyse in Appendix I selecteert VARIO eerst de meest relevante Europese benchmarklanden, vervolgens relevante benchmarkregio’s.
3.2.1. Benchmarklanden
VandeEuropeselandenselecteertVARIOalleEIS-2019-innovatieleiders:Zwitserland,Denemarken,Zweden, Finland en Nederland
Zwitserland is het enige Europese land dat zowel in zijn geheel als met elk van zijn regio’ s (NUTS-2) zeer sterke prestaties neerzet Bovendien situeerden alle zeven Zwitserse regio’s zich consistent in de TOP-25 van RIS over de periode 2011-2019
Van Zwitserland kan Vlaanderen (en met uitbreiding België) in sterke mate leren op systemisch niveau (waaronder op vlak van het interinstitutioneel kader), de mix van maatregelen op federaal en kantonniveau, de beleidsinstrumenten (zoals vb. het ETH-domein van Zürich en Lausanne, fiscaliteit…), historische investeringen en beleidsbeslissingen… Deze hebben geleid tot de uitzonderlijk sterke prestatie vanZwitserland HetadviestrajectvanVARIO‘NaardetopgroepvanKennis-enInnovatieregio’s ’(inprep.) bevat een diepgaande analyse van het Zwitserse O&O&I- en onderwijssysteem.
//////////////////////////////////////////////////////////////////////////////////////////////////////////////////////////////////////////////////////////////// // MAART 2020 VARIO ADVIES NR. 10INNOVATIEVE BENCHMARKLANDEN EN -REGIO’S pagina 13 van 18
https://en.wikipedia.org/wiki/List_of_metropolitan_areas_in_Europe 8
9
7
Charlton, 2019
Charlton, 2019
Naast Zwitserland selecteert VARIO alle andere innovatieleiders uit EIS(2019): Denemarken, Zweden, Finland en Nederland Ook in EIS(2011) waren deze Scandinavische landen al Innovatieleiders. In EIS(2011) was Nederland nog een innovatievolger (net als België), maar heeft de laatste jaren als runner-up veel vooruitgang geboekt. Nederland is op dit moment een Innovatieleider (EIS2019) en in de Global Competitiveness Index (GCI) 2019 bekleedt Nederland een bijzonder knappe vierde plaats (na Singapore, de VS en Hong Kong) Wat kan Vlaanderen leren van deze recente dynamiek in Nederland?
InAppendixIIvoegenwealleprofielenvandegeselecteerdelandenuitEIS2019toe,samenmethetprofiel van België.
VARIO merkt nog op dat de race naar kennis- en innovatie-economieën op wereldniveau wordt gevoerd (Atkinson & Ezell, 2012) Het adviestraject van VARIO ‘NaardetopgroepvanKennis-enInnovatieregio’s ’ (in prep.) bevat daarom ook een diepgaande analyse van Singapore. Deze eilandstaat is sinds 2019 het meest competitieve land ter wereld en heeft de meest open economie. Wat betreft innovatie staat Singaporeglobaalopeenmooie8ste plaatsenishetderegionaleinnovatieleiderinZuidoost-Azië,Oost-Azië en Oceanië (Global Innovation Index 2019).
3.2.2. Benchmarkregio’s
VARIO selecteert in totaal 17 regio’s uit 6 landen. Uit Zwitserland selecteert VARIO alle NUTS2 regio’s. Een overzicht tonen we in Figuur 2.
FIGUUR 2: Innovatieperformantie van Zwitserse Nuts-2 regio’s (RIS2019)
pagina 14 van 18 VARIO ADVIES NR. 10INNOVATIEVE BENCHMARKLANDEN EN -REGIO’S
REGIO Bevolkingsdichtheid RII Rang Groep Région Lémanique (CH01) 152 inw./km2 140,7 10 Leader + Espace Mittelland (CH02) 171 inw./km2 134,8 17 Leader Nordwest-schweiz (CH03) 591 inw./km² 149,6 7 Leader + Zürich (CH04) 870 inw./km² 160,1 1 Leader + Ostschweiz (CH05) 104 inw./km² 150,2 6 Leader + Zentralschweiz (CH06) 181 inw./km² 146,1 8 Leader + Ticino (CH07) 126 inw./km² 156,8 2 Leader +
Bron: RIS2019; Eurostat; Nota: NUTS-2 regio’s zijn vergelijkbaarmet de grootte van Belgische provincies.
Naast de NUTS-2 regio’s uit Zwitserland, selecteert VARIO een reeks andere NUTS-2 regio’s uit volgende landen10 die evenzeer sterke prestaties neerzetten:
• Zweden (Innovatieleider in EIS2019):
o Stockholm (RIS2019: n°4; RCI2019: n°1)
o Sydsverige (RIS2019: n°13; RCI2019: n°24)
• Denemarken (Innovatieleider in EIS2019):
o Hovedstaden (RIS2019: n°5; RCI2019: n°6)
• Finland (Innovatieleider in EIS2019):
o Helsinki-Uusimaa (RIS2019:n°3; RCI2019: n°10)
• Nederland (Innovatieleider in EIS2019):
o Utrecht (RIS2019: n°18; RCI2019: n°3)
o Noord-Brabant (RIS2019: n°24; RCI2019: n°20)
• Duitsland:
o Oberbayern (RIS2019: n°11; RCI2019: n°8)
o Karlsruhe (RIS2019: n°14; RCI2019: n°15)
o Tübingen (RIS2019: n°19; RCI2019: n°23)
o Stuttgart (RIS2019: n°23; RCI2019: n°18)
Deze benchmarkregio’s behoren in grote lijnen tot de ‘blauwe banaan ’11 (Figuur 3) enerzijds, en de Scandinavische landen (exclusief Noorwegen) anderzijds. Van de Scandinavische regio’s vormen Sydsverige (Malmö) en Hovedstaden (Copenhagen) bovendien de Zweeds-Deense grensoverschrijdende topregio met de bekende Sontbrug12 als fysieke verbinding.
FIGUUR3:DegeografischuitgestrektestedelijkeagglomeratiedeBlauweBanaanwaartoeookVlaanderen (m.i.v. de Vlaamse Ruit en de EU-metropolen RIJN-Maas en Kortrijk-Rijsel-Doornik) behoort
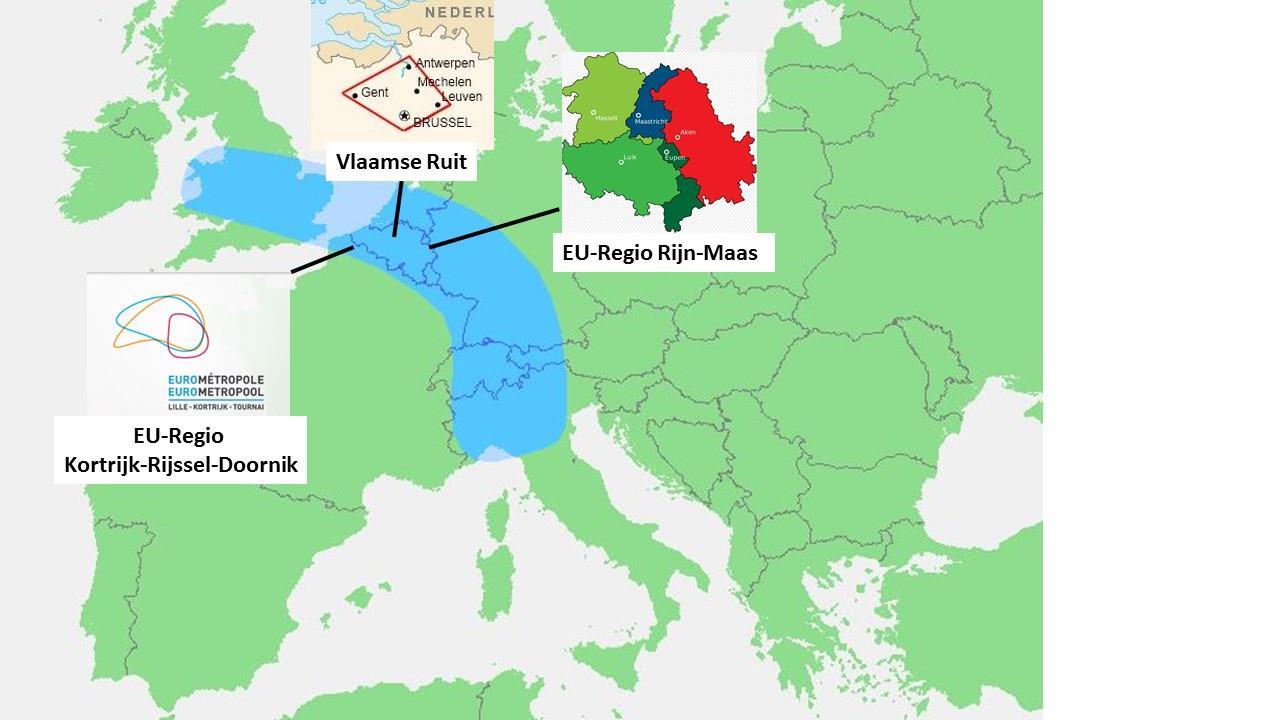
Bron: https://nl.wikipedia.org/wiki/Blauwe_Banaan, https://nl.wikipedia.org/wiki/Vlaamse_Ruit, https://nl.wikipedia.org/wiki/Euregio_Maas-Rijn en https://nl.wikipedia.org/wiki/Eurometropool_Rijsel-Kortrijk-Doornik
10 Voor Noorwegen ontbreken regionale competitiviteitsindicatoren en staat Noorwegen in de Global Competitiveness Index 2020 “slechts” op een 17de plaats. 11 https://nl.wikipedia.org/wiki/Blauwe_Banaan 12 https://nl.wikipedia.org/wiki/Sontbrug_(Kopenhagen_-_Malm%C3%B6)
//////////////////////////////////////////////////////////////////////////////////////////////////////////////////////////////////////////////////////////////// // MAART 2020 VARIO ADVIES NR. 10INNOVATIEVE BENCHMARKLANDEN EN -REGIO’S pagina 15 van 18
VARIOsteltvastdatalhoewelVlaanderen(enBelgië)totdeBlauweBanaanbehoort,wenochBelgiënoch Vlaanderen13 op dit moment tot de Europese toplanden/regio’s qua innovatie en competitiviteit kunnen rekenen. Vlaanderen is daarin niet alleen; ook de Franse, Italiaanse en Oostenrijkse deelgebieden binnen de Blauwe Banaan, maar ook Wales behoren niet tot de topregio’s.
In Appendix III voegen we de profielen van alle geselecteerde regio’s uit RIS2019 toe, samen met de profielen van het Vlaams Gewest en het Brussels Hoofdstedelijk Gewest.
3.3. Beperkingen van een benchmarkbenadering: het belang van context

Een benchmarkbenadering heeft beperkingen. De perfecte benchmarkregio of -land bestaat niet Gezien het beperkt aantal regio’s en landen - er zijn er geen tienduizenden om uit te kiezen - zullen er altijd fundamentele verschillen bestaan tussen Vlaanderen en zijn benchmarkregio’s We verwijzen o.a. naar (meestal op korte termijn onveranderbare) verschillen14 in economische structuur (vb. eerder B2B of B2C15…), infrastructuur (vb. de aanwezigheid van een grote haven), mate van verstedelijking, historische investeringen en beleidsbeslissingen, democratische bestuursvorm (vb. al dan niet ingebed in FederaalDemocratische unie), het al dan niet hebben van grondstoffen (vb. de gasvelden van Nederland of Noorwegen)… De context van een regio is belangrijk, een goede praktijk (bestpractice) in het ene land of regio kan niet zondermeer worden getransfereerd naar een ander land of regio. Een zeker pragmatisme en gezond verstand zijn noodzakelijk.
VARIO merkt op dat Vlaanderen niet alleen kan leren van succesverhalen, maar tegelijkertijd ook van landen die hierin hebben gefaald16 . Bijvoorbeeld, ondanks een gestage groei van zijn O&O-intensiteit van 2,4% (2007) naar 3,16% (2017) (3%-nota, juni 2019), in het kader van een gerichte strategie of roadmap om van Strong Innovator (in 2010) naar Innovation Leader (2020) te gaan, behoort Oostenrijk vandaag (nog) niet tot de innovatieleiders (EIS 2019). Wat kunnen we van deze case leren? Anderzijds is Nederland ondanks een daling van zijn O&O-intensiteit wel opgeklommen van innovatievolger naar innovatieleider. Wat kunnen we leren zowel van de succesverhalen als van de verhalen die minder goed slaagden?
Danielle Raspoet Lieven Danneels Directeur Voorzitter
13 Het Brussels Gewest is innovatieleider-
14 Andere relevante factoren zijn uiteraard wel veranderbaar enkan je als regio wel invloed op uitoefenen of stimuleren,zoals innovatiecultuur, (tertiair) onderwijs, de O&O-investeringen, het creëren van een aantrekkelijk vestigingsklimaat…
15 https://jerryrenson.be/kennisbank/b2b-en-b2c-definitie-en-uitleg/
16 Zie opiniestuk van Frederik Anseel (UNSW Sydney) https://www.tijd.be/opinie/column/het-einde-van-silicon-valley-tours/9917096.html

pagina 16 van 18 VARIO ADVIES NR. 10INNOVATIEVE BENCHMARKLANDEN EN -REGIO’S
4. REFERENTIES
Ajmone Marsan, G., & Maguire, K. (2011) Categorisation of OECDRegions UsingInnovation-Related Variables OECDRegional Development Working Papers, 2011/03, OECDPublishing.
http://dx.doi.org/10.1787/5kg8bf42qv7k-en
Atkinson, R. D., & Ezell, S.J. (2012). Innovation Economics: The Race for Global Advantage.Yale University Press. New Haven and London.
Charlton, E. (2019). The secrets of the world’s most competitive economies
https://www.weforum.org/agenda/2019/10/the-worlds-most-competitive-economies-global-report/
Cornell University, INSEAD & WIPO (2019). Global Innovation Index 2019:Creating Healthy Lives The Future of Medical Innovation. Ithaca, Fontainebleau, and Geneva.
https://www.wipo.int/publications/en/details.jsp?id=4434
De Voldere, B., Buelens, M., De Stobbeleir, K., Debruyne, M., Meuleman, M., & Sleuwaegen, L. (2014). De inspiratie-economie: een toekomst voor de regionale ontwikkeling van Vlaanderen. Onderzoeksrapport. Flanders DC en Vlerick Business School.
Europese Commissie (2011). European Innovation Scoreboard. Luxemburg: Publications office of the European Union. https://op.europa.eu/en/publication-detail/-/publication/705c770c-68f7-4f90-ac2b618cc6cc8ed7/language-en/format-PDF
Europese Commissie (2012). Regional Innovation Scoreboard 2011. Luxemburg: Publications office of the European Union. https://op.europa.eu/en/publication-detail/-/publication/aaff75f0-8d26-450396a4-a61a7906d133
Europese Commissie (2019a). Regional Innovation Scoreboard 2019.Luxemburg: Publications office of the European Union. https://ec.europa.eu/growth/industry/innovation/facts-figures/regional_nl
Europese Commissie (2019b). The EU Regional Competitiveness Index 2019.Luxemburg: Publications office of the European Union. https://ec.europa.eu/regional_policy/sources/docgener/work/2019_03_rci2019.pdf
Europese Commissie (2019c). European Innovation Scoreboard 2019. Luxemburg: Publications office of the European Union. https://ec.europa.eu/docsroom/documents/38781
Foray, D., & Hollanders, H.(2015). An assessment of the innovation union scoreboard as a tool to analyse national innovation capacities: the case ofSwitzerland. Research evaluation 24, pp. 213-228. doi:10.1093/reseval/rvu036
OESO (2013). Regions andInnovation:Collaboratingacross Borders. OECDReviews of Regional innovation. OECD Publishing. http://dx.doi.org/10.1787/9789264205307-en
VARIO(in prep.). Naar de Topgroep van Kennis- en Innovatieregio’s.
//////////////////////////////////////////////////////////////////////////////////////////////////////////////////////////////////////////////////////////////// // MAART 2020 VARIO ADVIES NR. 10INNOVATIEVE BENCHMARKLANDEN EN -REGIO’S pagina 17 van 18
WEF (2019). The Global Competitiveness Report 2019. Switzerland: World Economic Forum. http://www3.weforum.org/docs/WEF_TheGlobalCompetitivenessReport2019.pdf
pagina 18 van 18 VARIO ADVIES NR. 10INNOVATIEVE BENCHMARKLANDEN EN -REGIO’S
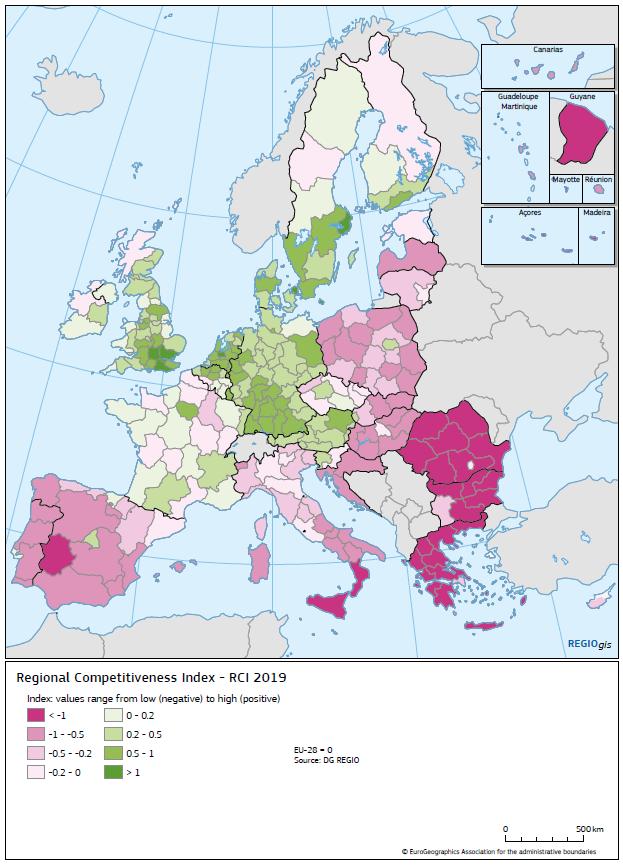
FIGUUR C: Regionale competitiviteit in Europees perspectief (RCI, 2019)
Bron: Europese Commissie, Regional Competitiveness Index – RCI 2019
Nota: gegevens voor Zwitserse en Noorse regio’s ontbreken
TABEL 2: Top 25 Regionale Innovatieleiders (RIS 2019)
Nota: Enkel Innovation Leaders+ en Innovation Leaders (11% sterkst presterende regio’s van in totaal 238 regio’s) worden getoond. De Innovation Leaders- (waaronder BHG) worden niet weergegeven in de tabel.
REGIO LAND Rang (2011) 1 Zürich Zwitserland 1 2 Ticino Zwitserland 12 3 Helsinki-Uusimaa Finland 9 4 Stockholm Zweden 4 5 Hovedstaden Denemarken 3 6 Ostschweiz Zwitserland 14 7 Nordwestschweiz Zwitserland 2 8 Zentralschweiz Zwitserland 5 9 Berlin Duitsland 20 10 Région lémanique Zwitserland 11 11 Oberbayern Duitsland 7 12 Västsverige Zweden 16 13 Sydsverige Zweden 6 14 Karlsruhe Duitsland 8 15 Trøndelag Noorwegen <25 (top25 sinds 2015) 16 Oslo og Akershus Noorwegen <25 (top25 sinds 2017) 17 Espace Mittelland Zwitserland 22 18 Utrecht Nederland <25 (top25 sinds 2013) 19 Tübingen Duitsland 10 20 Östra Mellansverige Zweden 13 21 Braunschweig Duitsland <25 (eenmaal top25 in 2013) 22 South East Verenigd Koninkrijk <25 (top25 sinds 2017) 23 Stuttgart Duitsland 15 24 Noord-Brabant Nederland <25 (tweemaal top25 in 2013 en 2015) 25 Mittelfranken Duitsland 19 … … 40 Vlaams Gewest België Innovation Leader (Medium)
RIS2019
Bron:
REGIO LAND 1 Stockholm Zweden 2 London & its commuting zones (Inner London West & Inner London East & Outer London East-North-East & Outer London West North West & Bedfroshire/Hertfordshire & Essex) Verenigd Koninkrijk 3 Utrecht Nederland 4 Berkshire, Buckinghamshire and Oxfordshire Verenigd Koninkrijk 5 Surrey, East and West Sussex Verenigd Koninkrijk 6 Hovedstaden Denemarken 7 Luxembourg Luxemburg 8 Oberbayern Duitsland 9 Amsterdam & its commuting zones (Flevoland&Noord-Holland) Nederland 10 Helsinki-Uusimaa Finland 11 Île de France Frankrijk 12 Hamburg Duitsland 13 Darmstadt Duitsland Zuid-Holland Nederland 15 Karlsruhe Duitsland Hampshire and Isle of Wight Verenigd Koninkrijk 17 Cheshire Verenigd Koninkrijk 18 Stuttgart Duitsland 19 Köln Duitsland 20 Gelderland Nederland Noord-Brabant Nederland 22 Gloucestershire, Wiltshire & Bristol/Bath area Verenigd Koninkrijk 23 Tübingen Duitsland 24 Sydsverige Zweden 25 Brussels & its commuting zones (Vlaams &Waals Brabant) België … 29 Antwerpen België … … … 31 Oost-Vlaanderen België … … … 56 Limburg België … … … 63 West-Vlaanderen België Bron: RCI2019; 268 regio’s Nota: gegevens voor Noorwegen
TABEL 3: Top-25 meest competitieve regio’s (RCI 2019)
of
Zwitserland werden
niet meegenomen in RCI2019; In GCI2019 staat Zwitserland als land op plaats 5.
Op basis van Tabel 2 en Tabel 3 en de selectiecriteria (in Hoofdstuk 2.1.), worden in totaal zeventien
benmarkregio’s (Tabel 4) weerhouden: uit Zwitserland (alle zeven regio’s), Denemarken (1 regio), Finland (1 regio), Zweden (2 regio’s), Duitsland (4 regio’s) en Nederland (2 regio’s).
TABEL 4: Zeventien weerhouden benchmarkregio’s o.b.v. selectiecriteria uitgevoerd op Tabel 2 en 3
Bron: RCI2019, RIS2019; Wikipedia
Nota: Voor NUTS-classificatie zie: https://nl.wikipedia.org/wiki/Nomenclatuur_van_territoriale_eenheden_voor_de_statistiek
Alle weerhouden regio’ s bevinden zich op NUTS-2 niveau (qua grootte vergelijkbaar met Belgische provincies) en vallen onder de leidende innovatielanden in EIS2019, samen met de vier NUTS-2 regio’s uit Duitsland We merken op dat in de top25 van RCI2019 ook heel wat sterk competitieve regio’s uit het Verenigd Koninkrijk voorkomen. In RIS2019 komt er echter slechts 1 Britse regio voor (South East), dat pas sinds 2017 in de top 25 van het Regionale Innovatie Scoreboard voorkomt en daardoor niet weerhouden werd Een aantal Duitse (Braunschweig, Berlijn) en Zweedse regio’s (Västsverige, Östra Mellansverige)komenwelvoorindetop25vanRIS2019maarnietindetop25vanRCI2019ofomgekeerd
REGIO LAND NUTS (grootte van de regio) Bevolkingsdichtheid (inw./km²) 1 Zürich Zwitserland 2 870 2 Ticino Zwitserland 2 126 3 Helsinki-Uusimaa Finland 2 181 4 Stockholm Zweden 2 351 5 Hovedstaden Denemarken 2 745 6 Ostschweiz Zwitserland 2 104 7 Nordwestschweiz Zwitserland 2 591 8 Zentralschweiz Zwitserland 2 181 9 Région lémanique Zwitserland 2 152 10 Oberbayern Duitsland 2 270 11 Sydsverige Zweden 2 108 12 Karlsruhe Duitsland 2 406 13 Espace Mittelland Zwitserland 2 171 14 Utrecht Nederland 2 918 15 Tübingen Duitsland 2 212 16 Stuttgart Duitsland 2 390 17 Noord-Brabant Nederland 2 508 Vlaams Gewest 1 487 West-Vlaanderen 2 380 Oost-Vlaanderen 2 508 Antwerpen 2 648 Limburg 2 361 Vlaams-Brabant 2 544 Brussels Hoofdstedelijk Gewest 1/2 7422 Vlaamse ruit - 820
enwerden daardoor niet weerhouden. Bovendien is Berlijn als city-succes regio te beschouwen en daardoor ook niet vergelijkbaar met Vlaanderen.
De meeste topregio’s (zie Tabel 2 en Tabel 3) uit Nederland, Zwitserland, Duitsland en het Verenigd Koninkrijk volgen niet toevallig de bekende, uitgestrekte stedelijke agglomeratie de Blauwe Banaan (FIGUUR D), een Europese megalopolis, met meer dan 85 miljoen inwoners1 . We stellen vast dat alhoewel Vlaanderen (en België) tot de Blauwe Banaan behoort, we Vlaanderen2 op dit moment nog niet tot de Europese toplanden of regio’s qua innovatie en competitiviteit kunnen rekenen. Vlaanderen is daarin niet alleen; ook de Franse, Italiaanse en Oostenrijkse deelgebieden binnen de Blauwe Banaan, maar ook Wales behoren niet tot de topregio’s. In RCI2019 staat enkel het Brussels Hoofdstedelijk Gewest met de woon-werkzones (commuting zones) Vlaams en Waals Brabant, in de top25 (plaats 25).
FIGUUR D: De Vlaamse Ruit, de EU-regio Kortrijk-Rijsel-Doornik en de EU-Regio Rijn-Maas als onderdelen van de geografisch veel uitgestrektere stedelijke agglomeratie de Blauwe Banaan
Bron: https://nl.wikipedia.org/wiki/Blauwe_Banaan, https://nl.wikipedia.org/wiki/Vlaamse_Ruit, https://nl.wikipedia.org/wiki/Euregio_Maas-Rijn en https://nl.wikipedia.org/wiki/Eurometropool_Rijsel-Kortrijk-Doornik
1 https://nl.wikipedia.org/wiki/Blauwe_Banaan
2 Het Brussels Hoofdstedelijk Gewest is Innovatieleider-
APPENDIX II: PROFIELEN VAN BENCHMARKLANDEN EN BELGIË
Belgium is a Strong Innovator. Over time, performance has increased relative to that of the EU in 2011.
Linkages, Innovators and Attractive research systems, are the strongest innovation dimensions. Belgium scores particularly well on Innovative SMEs collaborating with others, International scientific co-publications, and Enterprises providing ICT training. Employment impacts and Intellectual assets are the weakest innovation dimensions. Overall, Belgium scores weakest on Employment fast-growing enterprises of innovative sectors, Opportunity-driven entrepreneurship, and Non-R&D innovation expenditures.
Structural differences with the EU are shown in the table below. Top R&D spending enterprises per 10 million population are well above the EU average, whereas the turnover share of large enterprises, FDI net inflows, and enterprise births are well below the EU average.
The colours show normalised performance in 2018 relative to that of the EU in 2018: dark green: above 120%; light green: between 90% and 120%; yellow: between 50% and 90%; orange: below 50%. Normalised performance uses the data after a possible imputation of missing data and transformation of the data.
EU targets for 2020
1 Sources are provided in the introduction to the country profiles.
European Semester country report and country specific recommendations:
https://rio.jrc.ec.europa.eu/en/library/research-and-innovation-analysis-europeansemester-2019-country-reports
https://rio.jrc.ec.europa.eu/en/library/country-specific-recommendations-2019research-and-innovation-analysis
43 European Innovation Scoreboard 2019 Belgium Relative to EU 2018 in Performance relative to EU 2011 in 201820112018 SUMMARY INNOVATION INDEX 117.7 116.3128.1 Human resources 106.1 115.1 129.7 New doctorate graduates 94.2 100.0136.7 Population with tertiary education 143.1 163.4170.9 Lifelong learning 75.5 77.177.1 Attractive research systems 128.5 147.9 144.7 International scientific co-publications 176.3 189.8256.4 Most cited publications 116.6 127.2127.7 Foreign doctorate students 187.4 152.6179.2 Innovation-friendly environment 106.4 173.0168.2 Broadband penetration 161.1 177.8 322.2 Opportunity-driven entrepreneurship 48.9 169.863.3 Finance and support 108.3 95.5 118.4 R&D expenditure in the public sector 130.3 90.7120.5 Venture capital expenditures 89.7 101.1115.9 Firm investments 119.6 123.0142.6 R&D expenditure in the business sector 130.0 116.3148.9 Non-R&D innovation expenditures 62.1 83.5 72.6 Enterprises providing ICT training 168.4 173.3 213.3 Innovators 148.8 130.7135.2 SMEs product/process innovations 148.9 132.5 144.6 SMEs marketing/organizational innovations 137.6 114.1117.5 SMEs innovating in-house 159.4 145.7143.5 Linkages 157.7 151.6163.8 Innovative SMEs collaborating with others 196.5 210.9209.8 Public-private co-publications 148.4 142.2174.2 Private co-funding of public R&D exp. 130.9 112.2 125.7 Intellectual assets 89.7 97.8 87.2 PCT patent applications 98.1 94.489.3 Trademark applications 104.6 108.7116.6 Design applications 66.3 92.261.1 Employment impacts 76.4 74.7 79.8 Employment in knowledge-intensive activities 116.5 126.9126.9 Employment fast-growing enterprises 45.2 36.945.8 Sales impacts 100.1 81.1103.1 Medium and high-tech product exports 79.2 80.885.4 Knowledge-intensive services exports 100.6 97.4103.8 Sales of new-to-market/firm innovations 127.0 62.8 123.2 BEEU Performance and structure of the economy GDP per capita (PPS) 34,60029,500 Average annual GDP growth (%) 1.52.2 Employment share manufacturing (NACE C) (%) 12.6 15.5 of which High and medium high-tech (%) 35.1 37.5 Employment share services (NACE G-N) (%) 40.241.8 of which Knowledge-intensive services (%) 36.535.0 Turnover share SMEs (%) 39.837.9 Turnover share large enterprises (%) 35.744.4 Foreign-controlled enterprises – share of value added (%) 13.1 12.6 Business and entrepreneurship Enterprise births (10+ employees) (%) 0.6 1.5 Total Entrepreneurial Activity (TEA) (%) 6.26.7 FDI net inflows (% GDP) 2.1 4.3 Top R&D spending enterprises per 10 million population 29.219.6 Buyer sophistication (1 to 7 best) 4.43.7 Governance and policy framework Ease of starting a business (0 to 100 best) 71.976.8 Basic-school entrepren. education and training (1 to 5 best) 2.01.9 Govt. procurement of advanced tech products (1 to 7 best) 3.53.5 Rule of law (-2.5 to 2.5 best) 1.4 1.2 Demography Population size (millions) 11.4 511.3 Average annual population growth (%) 0.40.2 Population density (inhabitants/km2) 373.0117.5
Indicator 2014LatestTarget1 Gross domestic expenditure on R&D (% of GDP) 2.39 2.58 3.00 Tertiary educational attainment (% of population aged 30-34) 43.847.647.0
116 116 116 116 117 121 124 128 118 0 20 40 60 80 100 120 140 160 180 20112012201320142015201620172018 Relative to EU in 2011 Relative to EU in 2018
Denmark is an Innovation Leader. Over time, performance has remained the same compared to that of the EU in 2011.
Attractive research systems, Innovation-friendly environment and Human resources are the strongest innovation dimensions. Denmark scores particularly well on Public-private co-publications, International scientific co-publications, and Lifelong learning. Sales impacts and Innovators are the weakest innovation dimensions. Overall, Denmark’s lowest indicator scores comprise Sales of new-to-market and new-to-firm product innovations, Non-R&D innovation expenditures, and Venture capital expenditures.
Structural differences with the EU are shown in the table below. GDP per capita and top R&D spending enterprises per 10 million population are well above the EU average. Enterprise births and FDI net inflows are well below the EU average.
The colours show normalised performance in 2018 relative to that of the EU in 2018: dark green: above 120%; light green: between 90% and 120%; yellow: between 50% and 90%; orange: below 50%. Normalised performance uses the data after a possible imputation of missing data and transformation of the data.
EU targets for 2020
1
European Semester country report and country specific recommendations:
https://rio.jrc.ec.europa.eu/en/library/research-and-innovation-analysis-europeansemester-2019-country-reports
https://rio.jrc.ec.europa.eu/en/library/country-specific-recommendations-2019research-and-innovation-analysis
46 European Innovation Scoreboard 2019 Denmark Relative to EU 2018 in Performance relative to EU 2011 in 201820112018 SUMMARY INNOVATION INDEX 129.5 140.7 140.9 Human resources 180.4 192.5 220.6 New doctorate graduates 157.2 146.2 228.3 Population with tertiary education 143.1 167.2170.9 Lifelong learning 262.2 267.7267.7 Attractive research systems 183.8 160.0207.0 International scientific co-publications 265.1 257.0385.6 Most cited publications 143.5 144.1157.1 Foreign doctorate students 174.0 120.2166.4 Innovation-friendly environment 182.3 244.6288.1 Broadband penetration 177.8 266.7355.6 Opportunity-driven entrepreneurship 187.0 229.6242.2 Finance and support 106.7 128.2116.7 R&D expenditure in the public sector 174.7 141.1161.6 Venture capital expenditures 49.1 112.963.5 Firm investments 104.5 119.7 124.6 R&D expenditure in the business sector 145.7 166.1166.9 Non-R&D innovation expenditures 45.3 45.952.9 Enterprises providing ICT training 126.3 153.3 160.0 Innovators 95.7 103.4 86.9 SMEs product/process innovations 96.1 109.193.3 SMEs marketing/organizational innovations 114.2 100.297.5 SMEs innovating in-house 77.5 100.969.8 Linkages 139.2 175.5144.6 Innovative SMEs collaborating with others 109.8 215.5 117.2 Public-private co-publications 315.1 349.3369.7 Private co-funding of public R&D exp. 70.5 71.567.7 Intellectual assets 163.8 152.4 159.3 PCT patent applications 175.1 171.7159.3 Trademark applications 142.6 135.2 158.9 Design applications 173.2 146.5159.7 Employment impacts 100.7 127.3105.1 Employment in knowledge-intensive activities 110.6 120.5120.5 Employment fast-growing enterprises 93.0 132.1 94.0 Sales impacts 75.3 91.2 77.6 Medium and high-tech product exports 79.8 68.186.1 Knowledge-intensive services exports 112.8 123.1 116.4 Sales of new-to-market/firm innovations 23.7 82.022.9 DK EU Performance and structure of the economy GDP per capita (PPS) 37,40029,500 Average annual GDP growth (%) 1.82.2 Employment share manufacturing (NACE C) (%) 11.815.5 of which High and medium high-tech (%) 42.937.5 Employment share services (NACE G-N) (%) 41.441.8 of which Knowledge-intensive services (%) 34.835.0 Turnover share SMEs (%) 40.737.9 Turnover share large enterprises (%) 40.744.4 Foreign-controlled enterprises – share of value added (%) 10.612.6 Business and entrepreneurship Enterprise births (10+ employees) (%) 0.5 1.5 Total Entrepreneurial Activity (TEA) (%) n/a 6.7 FDI net inflows (% GDP) 1.3 4.3 Top R&D spending enterprises per 10 million population 63.119.6 Buyer sophistication (1 to 7 best) 3.73.7 Governance and policy framework Ease of starting a business (0 to 100 best) 84.076.8 Basic-school entrepreneurial education and training (1 to 5 best) n/a 1.9 Govt. procurement of advanced tech products (1 to 7 best) 3.53.5 Rule of law (-2.5 to 2.5 best) 1.9 1.2 Demography Population size (millions) 5.7 511.3 Average annual population growth (%) 0.60.2 Population density (inhabitants/km2) 135.4117.5
Indicator 2014LatestTarget1 Gross domestic expenditure on R&D (% of GDP) 2.913.053.00 Tertiary educational attainment (% of population aged 30-34) 44.949.140.0
Sources are provided in the introduction to the country profiles.
141 143 145 143 143 140 141 141 130 0 20 40 60 80 100 120 140 160 180 200
to EU in 2011 Relative to EU in 2018
20112012201320142015201620172018 Relative
The Netherlands is an Innovation Leader Over time, performance has increased relative to that of the EU in 2011.
Attractive research systems, Innovation-friendly environment and Linkages are the strongest innovation dimensions. The Netherlands scores particularly well on Foreign doctorate students, International scientific co-publications, and Public-private co-publications. Firm investments and Sales impacts are the weakest innovation dimensions. Overall, the Netherlands’ lowest indicator scores comprise Non-R&D innovation expenditures, Sales of new-to-market and new-to-firm product innovations, and Medium and high-tech product exports.
Structural differences with the EU are shown in the table below. The Netherlands scores high on various economic indicators. GDP per capita, the turnover share of SMEs, total entrepreneurial activity, FDI net inflows, and top R&D spending enterprises per 10 million population are well above the EU average. The employment share in high and medium high-tech manufacturing and enterprise births are well below the EU average.
The colours show normalised performance in 2018 relative to that of the EU in 2018: dark green: above 120%; light green: between 90% and 120%; yellow: between 50% and 90%; orange: below 50%. Normalised performance uses the data after a possible imputation of missing data and transformation of the data.
EU targets for 2020
1 Sources are provided in the introduction to the country profiles.
European Semester country report and country specific recommendations:
https://rio.jrc.ec.europa.eu/en/library/research-and-innovation-analysis-europeansemester-2019-country-reports
https://rio.jrc.ec.europa.eu/en/library/country-specific-recommendations-2019research-and-innovation-analysis
61 European Innovation Scoreboard 2019 NL EU Performance and structure of the economy GDP per capita (PPS) 37,90029,500 Average annual GDP growth (%) 2.7 2.2 Employment share manufacturing (NACE C) (%) 10.3 15.5 of which High and medium high-tech (%) 30.337.5 Employment share services (NACE G-N) (%) 46.541.8 of which Knowledge-intensive services (%) 39.635.0 Turnover share SMEs (%) 47.737.9 Turnover share large enterprises (%) 37.344.4 Foreign-controlled enterprises – share of value added (%) 13.5 12.6 Business and entrepreneurship Enterprise births (10+ employees) (%) 0.9 1.5 Total Entrepreneurial Activity (TEA) (%) 11.1 6.7 FDI net inflows (% GDP) 27.74.3 Top R&D spending enterprises per 10 million population 29.019.6 Buyer sophistication (1 to 7 best) 4.43.7 Governance and policy framework Ease of starting a business (0 to 100 best) 75.776.8 Basic-school entrepren. education and training (1 to 5 best) 3.3 1.9 Govt. procurement of advanced tech products (1 to 7 best) 4.0 3.5 Rule of law (-2.5 to 2.5 best) 1.9 1.2 Demography Population size (millions) 17.1 511.3 Average annual population growth (%) 0.60.2 Population density (inhabitants/km2) 500.8117.5
Indicator 2014LatestTarget1 Gross domestic expenditure on R&D (% of GDP) 1.981.992.50 Tertiary educational attainment (% of population aged 30-34) 44.849.440.0
Netherlands Relative to EU 2018 in Performance relative to EU 2011 in 201820112018 SUMMARY INNOVATION INDEX 124.0 118.9 135.0 Human resources 142.1 152.8173.7 New doctorate graduates 107.9 130.8156.7 Population with tertiary education 148.1 153.0176.9 Lifelong learning 183.7 175.0187.5 Attractive research systems 170.0 172.4 191.4 International scientific co-publications 191.8 198.4279.0 Most cited publications 142.5 154.5156.0 Foreign doctorate students 197.4 183.1 188.7 Innovation-friendly environment 166.6 196.4 263.4 Broadband penetration 172.2 166.7344.4 Opportunity-driven entrepreneurship 160.7 216.7208.2 Finance and support 118.4 107.2 129.4 R&D expenditure in the public sector 128.3 122.4118.7 Venture capital expenditures 110.0 89.2142.2 Firm investments 71.2 81.984.9 R&D expenditure in the business sector 85.8 88.8 98.3 Non-R&D innovation expenditures 13.9 77.016.2 Enterprises providing ICT training 115.8 80.0146.7 Innovators 125.7 76.8114.1 SMEs product/process innovations 153.3 87.0148.8 SMEs marketing/organizational innovations 84.0 61.571.7 SMEs innovating in-house 135.4 81.9122.0 Linkages 143.5 149.0149.1 Innovative SMEs collaborating with others 124.5 118.0132.9 Public-private co-publications 187.1 227.8219.5 Private co-funding of public R&D exp. 136.1 137.8130.6 Intellectual assets 124.3 120.2120.8 PCT patent applications 156.5 149.5142.3 Trademark applications 117.4 124.0130.8 Design applications 98.2 86.790.5 Employment impacts 113.8 120.5118.8 Employment in knowledge-intensive activities 134.1 146.2146.2 Employment fast-growing enterprises 98.0 102.099.1 Sales impacts 92.7 84.3 95.5 Medium and high-tech product exports 82.6 71.289.1 Knowledge-intensive services exports 118.9 122.0122.7 Sales of new-to-market/firm innovations 74.0 56.471.8 119 126 128 126 127 129 134 135 124 0 20 40 60 80 100 120 140 160 180 200 20112012201320142015201620172018 Relative to EU in 2011 Relative to EU in 2018
Finland is an Innovation Leader. Over time, performance has increased relative to that of the EU in 2011. The strong increase in 2018 is almost entirely explained by improved performance on the indicators using CIS data.
Innovation-friendly environment, Innovators and Human resources are the strongest innovation dimensions. Performance on Lifelong learning, PCT patent applications, and International scientific co-publications is well above the EU average. Employment impacts and Sales impacts are the weakest innovation dimensions. Finland’s lowest indicator scores are on Employment fast-growing enterprises of innovative sectors, Medium and high-tech product exports, and Venture capital expenditures.
Structural differences with the EU are shown in the table below. All indicators are close to the EU average, except for the share of enterprise births, which is well below the EU average, and top R&D spending enterprises per 10 million population, which is well above the EU average.
The colours show normalised performance in 2018 relative to that of the EU in 2018: dark green: above 120%; light green: between 90% and 120%; yellow: between 50% and 90%; orange: below 50%. Normalised performance uses the data after a possible imputation of missing data and transformation of the data.
EU targets for 2020
European Semester country report and country specific recommendations:
https://rio.jrc.ec.europa.eu/en/library/research-and-innovation-analysis-europeansemester-2019-country-reports
https://rio.jrc.ec.europa.eu/en/library/country-specific-recommendations-2019research-and-innovation-analysis
68 European Innovation Scoreboard 2019 FIEU Performance and structure of the economy GDP per capita (PPS) 32,10029,500 Average annual GDP growth (%) 2.52.2 Employment share manufacturing (NACE C) (%) 13.4 15.5 of which High and medium high-tech (%) 36.137.5 Employment share services (NACE G-N) (%) 40.041.8 of which Knowledge-intensive services (%) 39.335.0 Turnover share SMEs (%) 40.137.9 Turnover share large enterprises (%) 44.344.4 Foreign-controlled enterprises – share of value added (%) 9.512.6 Business and entrepreneurship Enterprise births (10+ employees) (%) 0.4 1.5 Total Entrepreneurial Activity (TEA) (%) 6.76.7 FDI net inflows (% GDP) 4.94.3 Top R&D spending enterprises per 10 million population 67.419.6 Buyer sophistication (1 to 7 best) 4.63.7 Governance and policy framework Ease of starting a business (0 to 100 best) 80.476.8 Basic-school entrepren. education and training (1 to 5 best) 2.41.9 Govt. procurement of advanced tech products (1 to 7 best) 3.9 3.5 Rule of law (-2.5 to 2.5 best) 2.0 1.2 Demography Population size (millions) 5.5511.3 Average annual population growth (%) 0.20.2 Population density (inhabitants/km2) 18.1 117.5
Indicator 2014LatestTarget1 Gross domestic expenditure on R&D (% of GDP) 3.172.764.00 Tertiary educational attainment (% of population aged 30-34) 45.344.242.0
Sources
1
are provided in the introduction to the country profiles.
Finland Relative to EU 2018 in Performance relative to EU 2011 in 201820112018 SUMMARY INNOVATION INDEX 134.0 131.6 145.9 Human resources 157.0 176.8 192.0 New doctorate graduates 128.8 184.6187.0 Population with tertiary education 102.5 123.1 122.4 Lifelong learning 268.4 228.1 274.0 Attractive research systems 135.4 108.6152.5 International scientific co-publications 202.8 199.4295.0 Most cited publications 112.8 107.9 123.5 Foreign doctorate students 107.8 49.0103.1 Innovation-friendly environment 182.3 161.2288.1 Broadband penetration 177.8 222.2 355.6 Opportunity-driven entrepreneurship 187.0 119.6242.2 Finance and support 113.6 158.5124.2 R&D expenditure in the public sector 152.5 161.6141.1 Venture capital expenditures 80.6 154.8104.3 Firm investments 129.8 174.1154.7 R&D expenditure in the business sector 133.0 220.2152.4 Non-R&D innovation expenditures 88.9 83.5 103.8 Enterprises providing ICT training 168.4 226.7 213.3 Innovators 168.2 111.2152.7 SMEs product/process innovations 174.9 124.5169.8 SMEs marketing/organizational innovations 136.6 71.3116.6 SMEs innovating in-house 191.1 138.2 172.1 Linkages 152.0 158.1 157.9 Innovative SMEs collaborating with others 189.1 141.4201.9 Public-private co-publications 202.2 234.6237.2 Private co-funding of public R&D exp. 95.3 137.391.5 Intellectual assets 151.8 142.4147.6 PCT patent applications 219.4 212.8 199.5 Trademark applications 137.1 115.4152.7 Design applications 97.5 91.889.9 Employment impacts 80.2 86.483.7 Employment in knowledge-intensive activities 123.5 121.8 134.6 Employment fast-growing enterprises 46.5 60.847.0 Sales impacts 85.4 80.288.0 Medium and high-tech product exports 67.5 67.272.9 Knowledge-intensive services exports 106.6 56.4109.9 Sales of new-to-market/firm innovations 83.1 123.1 80.6 132 132 132 129 132 133 135 146 134 0 20 40 60 80 100 120 140 160 180 200
Relative to EU in 2011 Relative to EU in 2018
20112012201320142015201620172018
Sweden is an Innovation Leader. Over time, performance has increased relative to that of the EU in 2011.
Human resources, Innovation-friendly environment and Attractive research systems are the strongest innovation dimensions. Sweden scores high on Public-private co-publications, Lifelong learning, and International scientific co-publications. Sales impacts is the weakest innovation dimension. Low-scoring indicators include Sales of newto-market and new-to-firm product innovations, Venture capital expenditures, and Private co-funding of public R&D expenditure.
Structural differences with the EU are shown in the table below. GDP per capita and top R&D spending enterprises per 10 million population are well above the EU average. The employment share in manufacturing, enterprise births, and FDI net inflows are well below the EU average.
The colours show normalised performance in 2018 relative to that of the EU in 2018: dark green: above 120%; light green: between 90% and 120%; yellow: between 50% and 90%; orange: below 50%. Normalised performance uses the data after a possible imputation of missing data and transformation of the data.
EU targets for 2020
European Semester country report and country specific recommendations:
https://rio.jrc.ec.europa.eu/en/library/research-and-innovation-analysis-europeansemester-2019-country-reports
https://rio.jrc.ec.europa.eu/en/library/country-specific-recommendations-2019research-and-innovation-analysis
69 European Innovation Scoreboard 2019 SEEU Performance and
economy GDP per capita (PPS) 36,10029,500 Average annual GDP growth (%) 2.22.2 Employment share manufacturing (NACE C) (%) 10.3 15.5 of which High and medium high-tech (%) 42.537.5 Employment share services (NACE G-N) (%) 41.341.8 of which Knowledge-intensive services (%) 44.035.0 Turnover share SMEs (%) 38.437.9 Turnover share large enterprises (%) 43.044.4 Foreign-controlled enterprises – share of value added (%) 13.5 12.6 Business and entrepreneurship Enterprise births (10+ employees) (%) 0.4 1.5 Total Entrepreneurial Activity (TEA) (%) 7.26.7 FDI net inflows (% GDP) 3.04.3 Top R&D spending enterprises per 10 million population 81.8 19.6 Buyer sophistication (1 to 7 best) 4.63.7 Governance and policy framework Ease of starting a business (0 to 100 best) 81.1 76.8 Basic-school entrepren. education and training (1 to 5 best) 2.41.9 Govt. procurement of advanced tech products (1 to 7 best) 4.0 3.5 Rule of law (-2.5 to 2.5 best) 2.0 1.2 Demography Population size (millions) 10.0 511.3 Average annual population growth (%) 1.40.2 Population density (inhabitants/km2) 24.4117.5
structure of the
Indicator 2014LatestTarget1 Gross domestic expenditure on R&D (% of GDP) 3.143.404.00 Tertiary educational attainment (% of population aged 30-34) 49.952.045.0
Sources
1
are provided in the introduction to the country profiles.
Sweden Relative to EU 2018 in Performance relative to EU 2011 in 201820112018 SUMMARY INNOVATION INDEX 135.8 143.4147.7 Human resources 174.9 205.0 213.9 New doctorate graduates 133.2 207.7193.4 Population with tertiary education 149.4 165.7178.4 Lifelong learning 268.4 245.8274.0 Attractive research systems 166.2 151.5187.2 International scientific co-publications 239.2 241.4347.9 Most cited publications 121.0 125.3132.5 Foreign doctorate students 173.7 132.7166.1 Innovation-friendly environment 172.3 232.7272.4 Broadband penetration 177.8 244.4355.6 Opportunity-driven entrepreneurship 166.6 224.7215.7 Finance and support 109.3 141.8 119.5 R&D expenditure in the public sector 158.5 154.2146.7 Venture capital expenditures 67.5 127.287.3 Firm investments 124.3 138.7148.1 R&D expenditure in the business sector 179.4 187.5205.6 Non-R&D innovation expenditures 92.4 104.0107.9 Enterprises providing ICT training 105.3 126.7 133.3 Innovators 115.4 113.3104.8 SMEs product/process innovations 115.1 119.9111.7 SMEs marketing/organizational innovations 102.8 89.187.7 SMEs innovating in-house 127.8 131.0115.0 Linkages 147.3 155.5153.0 Innovative SMEs collaborating with others 112.8 153.5 120.4 Public-private co-publications 314.5 306.5369.0 Private co-funding of public R&D exp. 87.4 92.0 83.8 Intellectual assets 156.2 149.8151.9 PCT patent applications 234.0 212.8212.8 Trademark applications 132.5 126.3147.6 Design applications 100.4 103.792.6 Employment impacts 134.5 136.9 140.5 Employment in knowledge-intensive activities 150.6 143.6164.1 Employment fast-growing enterprises 122.0 132.0123.4 Sales impacts 88.0 91.790.6 Medium and high-tech product exports 94.9 100.1102.4 Knowledge-intensive services exports 106.2 111.1 109.6 Sales of new-to-market/firm innovations 56.6 59.554.9 143 145 146 144 145 148 148 148 136 0 20 40 60 80 100 120 140 160 180 200
Relative to EU in 2011 Relative to EU in 2018
20112012201320142015201620172018
Switzerland is an Innovation Leader. Over time, performance has increased relative to that of the EU in 2011.
Attractive research systems, Human resources and Firm investments are the strongest innovation dimensions. Switzerland scores particularly well on Public-private co-publications, Foreign doctorate students, and Lifelong learning. Employment impacts and Sales impacts are the weakest innovation dimensions. Overall, Switzerland’s lowest indicator scores comprise Employment fast-growing enterprises of innovative sectors, Innovative SMEs collaborating with others, and Medium and high-tech product exports.
Structural differences with the EU are shown in the table below. For several indicators data are not available. Many economic indicators are well above the EU average, including GDP per capita, the employment share in knowledge-intensive services, FDI net inflows, top R&D spending enterprises per 10 million population, and buyer sophistication. However, enterprise births is well below the EU average.
The colours show normalised performance in 2018 relative to that of the EU in 2018: dark green: above 120%; light green: between 90% and 120%; yellow: between 50% and 90%; orange: below 50%. Normalised performance uses the data after a possible imputation of missing data and transformation of the data.
§ Due to missing data, the relative dimension score does not necessarily reflect that of the indicators.
76 European Innovation Scoreboard 2019 CHEU Performance and structure of the economy GDP per capita (PPS) 47,20029,500 Average annual GDP growth (%) 2.12.2 Employment share manufacturing (NACE C) (%) 12.9 15.5 of which High and medium high-tech (%) 44.637.5 Employment share services (NACE G-N) (%) 45.141.8 of which Knowledge-intensive services (%) 45.735.0 Turnover share SMEs (%) n/a 37.9 Turnover share large enterprises (%) n/a 44.4 Foreign-controlled enterprises – share of value added (%) n/a 12.6 Business and entrepreneurship Enterprise births (10+ employees) (%) 0.2 1.5 Total Entrepreneurial Activity (TEA) (%) 8.06.7 FDI net inflows (% GDP) 10.64.3 Top R&D spending enterprises per 10 million population 67.619.6 Buyer sophistication (1 to 7 best) 5.03.7 Governance and policy framework Ease of starting a business (0 to 100 best) 75.676.8 Basic-school entrepren. education and training (1 to 5 best) 2.2 1.9 Govt. procurement of advanced tech products (1 to 7 best) 3.83.5 Rule of law (-2.5 to 2.5 best) 1.9 1.2 Demography Population size (millions) 8.4 511.3 Average annual population growth (%) 0.90.2 Population density (inhabitants/km2) 209.7117.5
Switzerland Relative to EU 2018 in Performance relative to EU 2011 in 201820112018 SUMMARY INNOVATION INDEX 156.7 161.4170.6 Human resources 195.5 229.3239.0 New doctorate graduates 170.7 269.2247.9 Population with tertiary education 166.9 152.2 199.3 Lifelong learning 268.4 274.0274.0 Attractive research systems 207.9 226.1234.2 International scientific co-publications 265.1 385.6385.6 Most cited publications 141.9 157.1155.4 Foreign doctorate students 268.8 228.4257.1 Innovation-friendly environment § 147.0 175.4232.4 Broadband penetration N/A N/AN/A Opportunity-driven entrepreneurship 150.8 147.5195.3 Finance and support 134.9 84.7147.6 R&D expenditure in the public sector 150.5 105.6139.2 Venture capital expenditures 121.8 60.0157.5 Firm investments § 175.0 172.6208.7 R&D expenditure in the business sector 177.1 193.6203.0 Non-R&D innovation expenditures 176.1 146.1205.6 Enterprises providing ICT training N/A N/AN/A Innovators 157.2 143.7142.8 SMEs product/process innovations 139.3 169.8 135.2 SMEs marketing/organizational innovations 190.5 170.0162.6 SMEs innovating in-house 144.7 90.7130.3 Linkages 158.6 163.8164.7 Innovative SMEs collaborating with others 79.6 82.2 85.0 Public-private co-publications 315.1 369.7369.7 Private co-funding of public R&D exp. 140.5 134.8134.8 Intellectual assets 173.4 187.5168.6 PCT patent applications 191.1 188.6173.8 Trademark applications 186.4 223.8 207.6 Design applications 142.4 156.7 131.3 Employment impacts 112.3 106.9 117.2 Employment in knowledge-intensive activities 184.7 175.6201.3 Employment fast-growing enterprises 55.9 57.356.6 Sales impacts 115.8 130.6 119.2 Medium and high-tech product exports 88.5 125.795.5 Knowledge-intensive services exports 102.5 97.5105.7 Sales of new-to-market/firm innovations 167.9 174.5162.9 161 158 159 161 163 166 168 171 157 0 20 40 60 80 100 120 140 160 180 200 20112012201320142015201620172018 Relative to EU in 2011 Relative to EU in 2018
APPENDIX III: PROFIELEN VAN BENCHMARKREGIO’S, HET VLAAMS GEWEST EN BHG
Région de Bruxelles-Capitale / Brussels Hoofdstedelijk Gewest (BE1)
Regional Innovation Scoreboard 2019 Data
Relative to Brussels (BE1) is an Innovation Leader -; innovation performance has increased over time (13.5%).
The table on the left shows the normalised scores per indicator and relative results compared to Belgium and the EU. The table also shows the Regional Innovation Index (RII) in 2019 compared to that of Belgium and the EU in 2019, the RII in 2019 compared to that of the EU in 2011, and performance change over time between 2011 and 2019.
The radar graph shows relative strengths compared to Belgium (orange line) and the EU (blue line), showing relative strengths (e.g. Innovative SMEs collaborating) and weaknesses (e.g. Design applications).
The table below shows data highlighting possible structural differences, e.g. Population density (above average) and Employment in Agriculture & Mining (below average).
± Relative-to-EU scores are not shown as these would allow recalculating confidentialregional CIS data.
BEEU Tertiary education 54.40.720127157 Lifelong learning 12.60.363152117 Internationalscientific co-publications 31461.000136174 Most-cited scientific publications 0.1080.5278797 R&D expenditures public sector 0.780.612102107 R&D expenditures business sector 1.050.5187588 Non-R&D innovation expenditures ±0.508±± Product/process innovations ±0.732±± Marketing/ org. innovations ±0.637±± SMEs innovating in-house ±0.704±± Innovative SMEs collaborating ±0.748±± Public-private co-publications 88.00.599105147 PCT patent applications 2.290.2175551 Trademark applications 8.380.595128134 Design applications 1.110.2366448 Employment MHT manuf./KIS services 16.70.558117111 Sales new-to-market/firm innovations ±0.962±± BE1BEEU28 Average score --0.602---- Share of employment in: Country EIS-RIS correction factor 0.984 Agriculture & Mining (A-B) 0.01.24.6 RegionalInnovation Index 2019 --0.592---- Manufacturing (C) 4.912.715.4 RII 2019 (same year) ----105.6121.9 Utilities & Construction (D-F) 7.58.48.2 RII 2019 (cf. to EU2011) ------127.7 Services (G-N) 72.668.264.1 RegionalInnovation Index 2011 --0.530---- Public administration (O-U) 14.89.47.0 RII 2011 (same year) ----98.1114.2 RII - change between 2011 and 2019 --13.5---GDP per capita (PPS), 2017 58,70035,00030,000 Population density, 2017 7422374118 Urbanisation, 2018 100.088.176.0 Population size, 2018 (000s) 1,21011,400512,380 Average employed persons per enterprise (firm size), 2015-2016 4.44.45.5
GDP per capita growth (PPS), 20132017 0.832.192.86
score
Norm alised
0 20 40 60 80 100 120 140 160 180 200 Tertiaryeducation Lifelonglearning Internationalscientificcopublications Most-citedscientificpublications R&Dexpenditurespublicsector R&Dexpendituresbusiness sector Non-R&Dinnovation expenditures
Marketing/organisational innovations SMEsinnovatingin-house InnovativeSMEscollaborating Public-privateco-publications PCTpatentapplications Trademarkapplications Designapplications EmploymentMHTman.+KIS services Salesnew-to-market/firm innovations Relativetocountry RelativetoEU
Product/processinnovations
Vlaams Gewest (BE2)
Regional Innovation Scoreboard 2019
to Vlaams Gewest (BE2) is a Strong + Innovator; innovation performance has increased over time (2.2%).
The table on the left shows the normalised scores per indicator and relative results compared to Belgium and the EU. The table also shows the Regional Innovation Index (RII) in 2019 compared to that of Belgium and the EU in 2019, the RII in 2019 compared to that of the EU in 2011, and performance change over time between 2011 and 2019.
The radar graph shows relative strengths compared to Belgium (orange line) and the EU (blue line), showing relative strengths (e.g. Innovative SMEs collaborating) and weaknesses (e.g. Lifelong learning).
The table below shows data highlighting possible structural differences, e.g. Population density (above average) and Employment in Agriculture & Mining (below average).
BEEU Tertiary education 46.40.576102125 Lifelong learning 8.70.24510379 Internationalscientific co-publications 18620.769105134 Most-cited scientific publications 0.1330.648107120 R&D expenditures public sector 0.800.621104109 R&D expenditures business sector 1.950.724105123 Non-R&D innovation expenditures ±0.499±± Product/process innovations ±0.680±± Marketing/ org. innovations ±0.586±± SMEs innovating in-house ±0.627±± Innovative SMEs collaborating ±0.823±± Public-private co-publications 90.40.607106149 PCT patent applications 4.580.443113104 Trademark applications 6.560.463100105 Design applications 3.150.41311284 Employment MHT manuf./KIS services 15.60.513108102 Sales new-to-market/firm innovations ±0.787±± BE2BEEU28 Average score --0.590---- Share of employment in: Country EIS-RIS correction factor 0.984 Agriculture & Mining (A-B) 1.21.24.6 RegionalInnovation Index 2019 --0.580---- Manufacturing (C) 14.812.715.4 RII 2019 (same year) ----103.5119.4 Utilities & Construction (D-F) 8.48.48.2 RII 2019 (cf. to EU2011) ------125.1 Services (G-N) 68.268.264.1 RegionalInnovation Index 2011 --0.570---- Public administration (O-U) 7.49.47.0 RII 2011 (same year) ----105.6122.9 RII - change between 2011 and 2019 --2.2---GDP per capita (PPS), 2017 35,90035,00030,000 Population density, 2017 487374118 Urbanisation, 2018 93.088.176.0 Population size, 2018 (000s) 6,56011,400512,380 Average employed persons per enterprise (firm size), 2015-2016 4.44.45.5
GDP per capita growth (PPS), 20132017 2.522.192.86
± Relative-to-EU scores are not shown as these would allow recalculating confidentialregional CIS data.
Data Norm alised score Relative
0 50 100 150 200 250 Tertiaryeducation Lifelonglearning Internationalscientificcopublications Most-citedscientificpublications R&Dexpenditurespublicsector R&Dexpendituresbusiness sector Non-R&Dinnovation expenditures Product/processinnovations Marketing/organisational innovations SMEsinnovatingin-house InnovativeSMEscollaborating Public-privateco-publications PCTpatentapplications Trademarkapplications Designapplications EmploymentMHTman.+KIS services Salesnew-to-market/firm innovations Series2Series3 Relativetocountry RelativetoEU
Région lémanique (CH01)
to Régionlémanique(CH01)isanInnovationLeader+; innovationperformancehasdecreasedovertime(0.4%).
Thetableontheleftshowsthenormalisedscoresper indicatorandrelativeresultscomparedtoSwitzerland andtheEU.ThetablealsoshowstheRegional InnovationIndex(RII)in2019comparedtothatof SwitzerlandandtheEUin2019,theRIIin2019 comparedtothatoftheEUin2011,andperformance change over time between 2011 and 2019.
Theradargraphshowsrelativestrengthscomparedto Switzerland(orangeline)andtheEU(blueline), showingrelativestrengths(e.g.Lifelonglearning)and weaknesses (e.g. Innovative SMEs collaborating).
Thetablebelowshowsdatahighlightingpossible structuraldifferences,e.g.Averageemployedpersons perenterprise(aboveaverage)andEmploymentin Agriculture &
average).
CHEU Tertiaryeducation 53.00.695101151 Lifelonglearning 27.60.81788262 Internationalscientificco-publications 31461.000106174 Most-citedscientificpublications 0.1550.754101139 R&Dexpenditurespublicsector 0.930.676100118 R&Dexpendituresbusinesssector 2.390.807100137 Non-R&Dinnovationexpenditures ±n/a±± Product/processinnovations ±0.509±± Marketing/org.innovations ±0.527±± SMEsinnovatingin-house ±0.461±± Innovative SMEscollaborating ±0.176±± Public-private co-publications 237.10.98398241 PCT patent applications 8.900.747118175 Trademarkapplications 10.460.74498168 Design applications 2.980.4017382 EmploymentMHT manuf./KIS services 16.70.55889111 Salesnew-to-market/firminnovations ±0.303±±CH01CHEU28 Average score --0.635---- Share ofemploymentin: Country EIS-RIS correction factor 1.076 Agriculture &Mining(A-B) 2.43.24.6 RegionalInnovationIndex2019 --0.683---- Manufacturing(C) 8.112.615.4 RII2019 (same year) ----89.7140.7 Utilities &Construction(D-F) 7.37.58.2 RII2019 (cf.toEU2011) ------147.3 Services (G-N) 74.169.464.1 RegionalInnovationIndex2011 --0.685---- Publicadministration (O-U) 5.34.77.0 RII2011 (same year) ----91.5147.7 RII-change between 2011 and2019 ---0.4---GDPper capita (PPS),2017 * 45,10046,80030,000 Populationdensity,2017 196212118 Urbanisation,2018 n/an/a76.0 Populationsize,2018 (000s) 1,6308,480512,380
Estimates for the region Regional Innovation
Data Norm alised score Relative
*
Scoreboard 2019
Mining (below
Average employed personsper enterprise (firmsize),2015-2016 8.78.75.5 ±Relative-to-EUscoresare notshown asthese wouldallow recalculatingconfidentialregionalCISdata. GDPper capita growth(PPS),20132017 * 2.902.302.86 0 50 100 150 200 250 300 Tertiaryeducation Lifelonglearning Internationalscientificcopublications Most-citedscientificpublications R&Dexpenditurespublicsector R&Dexpendituresbusiness sector Non-R&Dinnovation expenditures Product/processinnovations Marketing/organisational innovations SMEsinnovatingin-house InnovativeSMEscollaborating Public-privateco-publications PCTpatentapplications Trademarkapplications Designapplications EmploymentMHTman.+KIS services Salesnew-to-market/firm innovations Relativetocountry RelativetoEU
Espace Mittelland (CH02)
Norm
Innovation Scoreboard 2019
Relative to EspaceMittelland(CH02)isanInnovationLeader+; innovation performance has increased over time (6%).
Thetableontheleftshowsthenormalisedscoresper indicatorandrelativeresultscomparedtoSwitzerland andtheEU.ThetablealsoshowstheRegional InnovationIndex(RII)in2019comparedtothatof SwitzerlandandtheEUin2019,theRIIin2019 comparedtothatoftheEUin2011,andperformance change over time between 2011 and 2019.
Theradargraphshowsrelativestrengthscomparedto Switzerland(orangeline)andtheEU(blueline), showingrelativestrengths(e.g.Lifelonglearning)and weaknesses (e.g. Innovative SMEs collaborating). Thetablebelowshowsdatahighlightingpossible structuraldifferences,e.g.Averageemployedpersons perenterprise(aboveaverage)andGDPpercapita growth (below average).
* Estimates for the region
CHEU Tertiaryeducation 50.30.64694141 Lifelonglearning 30.80.91499293 Internationalscientificco-publications 21220.82187143 Most-citedscientificpublications 0.1160.56275104 R&Dexpenditurespublicsector 0.930.676100118 R&Dexpendituresbusinesssector 2.390.807100137 Non-R&Dinnovationexpenditures ±n/a±± Product/processinnovations ±0.589±± Marketing/org.innovations ±0.865±± SMEsinnovatingin-house ±0.586±± Innovative SMEscollaborating ±0.276±± Public-private co-publications 83.40.58358143 PCT patent applications 5.170.49178115 Trademarkapplications 5.950.4195595 Design applications 3.420.4327888 EmploymentMHT manuf./KIS services 17.10.57592115 Salesnew-to-market/firminnovations ±0.494±±CH02CHEU28 Average score --0.608---- Share ofemploymentin: Country EIS-RIS correction factor 1.076 Agriculture &Mining(A-B) 4.23.24.6 RegionalInnovationIndex2019 --0.655---- Manufacturing(C) 15.212.615.4 RII2019 (same year) ----86.0134.8 Utilities &Construction(D-F) 7.97.58.2 RII2019 (cf.toEU2011) ------141.2 Services (G-N) 64.769.464.1 RegionalInnovationIndex2011 --0.627---- Publicadministration (O-U) 6.14.77.0 RII2011 (same year) ----83.8135.2 RII-change between 2011 and2019 --6.0---GDPper capita (PPS),2017 * 43,00046,80030,000 Populationdensity,2017 191212118 Urbanisation,2018 n/an/a76.0 Populationsize,2018 (000s) 1,8708,480512,380
Regional
Data
alised score
Average employed personsper enterprise (firmsize),2015-2016 8.78.75.5 ±Relative-to-EUscoresare notshown asthese wouldallow recalculatingconfidentialregionalCISdata. GDPper capita growth(PPS),20132017 * 2.202.302.86 0 50 100 150 200 250 300 Tertiaryeducation Lifelonglearning Internationalscientificcopublications Most-citedscientificpublications R&Dexpenditurespublicsector R&Dexpendituresbusiness sector Non-R&Dinnovation expenditures Product/processinnovations Marketing/organisational innovations SMEsinnovatingin-house InnovativeSMEscollaborating Public-privateco-publications PCTpatentapplications Trademarkapplications Designapplications EmploymentMHTman.+KIS services Salesnew-to-market/firm innovations Series2Series3 Relativetocountry RelativetoEU
Nordwestschweiz (CH03)
Regional Innovation Scoreboard 2019
Norm
Relative to Nordwestschweiz(CH03)isanInnovationLeader+; innovationperformancehasdecreasedovertime(9%).
Thetableontheleftshowsthenormalisedscoresper indicatorandrelativeresultscomparedtoSwitzerland andtheEU.ThetablealsoshowstheRegional InnovationIndex(RII)in2019comparedtothatof SwitzerlandandtheEUin2019,theRIIin2019 comparedtothatoftheEUin2011,andperformance change over time between 2011 and 2019.
Theradargraphshowsrelativestrengthscomparedto Switzerland(orangeline)andtheEU(blueline), showingrelativestrengths(e.g.Lifelonglearning)and weaknesses (e.g. Innovative SMEs collaborating). Thetablebelowshowsdatahighlightingpossible structuraldifferences,e.g.Populationdensity(above average)andEmploymentinAgriculture&Mining (below average).
±Relative-to-EUscoresare notshown asthese wouldallow recalculatingconfidentialregionalCISdata.
CHEU Tertiaryeducation 48.70.61889134 Lifelonglearning 31.90.948102304 Internationalscientificco-publications 31461.000106174 Most-citedscientificpublications 0.1560.760101141 R&Dexpenditurespublicsector 0.930.676100118 R&Dexpendituresbusinesssector 2.390.807100137 Non-R&Dinnovationexpenditures ±n/a±± Product/processinnovations ±0.525±± Marketing/org.innovations ±0.673±± SMEsinnovatingin-house ±0.518±± Innovative SMEscollaborating ±0.146±± Public-private co-publications 245.51.000100245 PCT patent applications 9.220.766122179 Trademarkapplications 9.200.65486148 Design applications 3.270.4227786 EmploymentMHT manuf./KIS services 20.30.705112141 Salesnew-to-market/firminnovations ±0.584±±CH03CHEU28 Average score --0.675---- Share ofemploymentin: Country EIS-RIS correction factor 1.076 Agriculture &Mining(A-B) 2.13.24.6 RegionalInnovationIndex2019 --0.727---- Manufacturing(C) 14.812.615.4 RII2019 (same year) ----95.4149.6 Utilities &Construction(D-F) 7.77.58.2 RII2019 (cf.toEU2011) ------156.6 Services (G-N) 69.069.464.1 RegionalInnovationIndex2011 --0.768---- Publicadministration (O-U) 4.04.77.0 RII2011 (same year) ----102.6165.6 RII-change between 2011 and2019 ---9.0---GDPper capita (PPS),2017 * 49,00046,80030,000 Populationdensity,2017 593212118 Urbanisation,2018 n/an/a76.0 Populationsize,2018 (000s) 1,1508,480512,380
Estimates for the region
*
Data
alised score
Average employed personsper enterprise (firmsize),2015-2016 8.78.75.5 GDPper capita growth(PPS),20132017 * 2.412.302.86 0 50 100 150 200 250 300 350 Tertiaryeducation Lifelonglearning Internationalscientificcopublications Most-citedscientificpublications R&Dexpenditurespublicsector R&Dexpendituresbusiness sector Non-R&Dinnovation expenditures Product/processinnovations Marketing/organisational innovations SMEsinnovatingin-house InnovativeSMEscollaborating Public-privateco-publications PCTpatentapplications Trademarkapplications Designapplications EmploymentMHTman.+KIS services Salesnew-to-market/firm innovations Series2Series3 Relativetocountry RelativetoEU
Zürich (CH04)
Regional Innovation Scoreboard 2019
Norm
alised
Relative to Zürich(CH04)isanInnovationLeader+;innovation
Thetableontheleftshowsthenormalisedscoresper indicatorandrelativeresultscomparedtoSwitzerland andtheEU.ThetablealsoshowstheRegional InnovationIndex(RII)in2019comparedtothatof SwitzerlandandtheEUin2019,theRIIin2019 comparedtothatoftheEUin2011,andperformance change over time between 2011 and 2019.
Theradargraphshowsrelativestrengthscomparedto Switzerland(orangeline)andtheEU(blueline), showingrelativestrengths(e.g.Lifelonglearning)and weaknesses (e.g. Design applications).
Thetablebelowshowsdatahighlightingpossible structuraldifferences,e.g.Populationdensity(above average)andEmploymentinAgriculture&Mining (below average).
CHEU Tertiaryeducation 64.60.903131196 Lifelonglearning 33.61.000108321 Internationalscientificco-publications 31461.000106174 Most-citedscientificpublications 0.1730.842112156 R&Dexpenditurespublicsector 0.930.676100118 R&Dexpendituresbusinesssector 2.390.807100137 Non-R&Dinnovationexpenditures ±n/a±± Product/processinnovations ±0.700±± Marketing/org.innovations ±0.840±± SMEsinnovatingin-house ±0.636±± Innovative SMEscollaborating ±0.361±± Public-private co-publications 239.80.98899242 PCT patent applications 7.150.635101149 Trademarkapplications 7.420.52669119 Design applications 1.440.2724955 EmploymentMHT manuf./KIS services 21.60.759121151 Salesnew-to-market/firminnovations ±0.615±±CH04CHEU28 Average score --0.722---- Share ofemploymentin: Country EIS-RIS correction factor 1.076 Agriculture &Mining(A-B) 1.73.24.6 RegionalInnovationIndex2019 --0.778---- Manufacturing(C) 8.812.615.4 RII2019 (same year) ----102.1160.1 Utilities &Construction(D-F) 5.77.58.2 RII2019 (cf.toEU2011) ------167.6 Services (G-N) 77.669.464.1 RegionalInnovationIndex2011 --0.808---- Publicadministration (O-U) 3.74.77.0 RII2011 (same year) ----107.9174.1 RII-change between 2011 and2019 ---6.5---GDPper capita (PPS),2017 * 55,50046,80030,000 Populationdensity,2017 905212118 Urbanisation,2018 n/an/a76.0 Populationsize,2018 (000s) 1,5008,480512,380 * Estimates for the region Average employed personsper enterprise (firmsize),2015-2016 8.78.75.5 ±Relative-to-EUscoresare notshown asthese wouldallow recalculatingconfidentialregionalCISdata. GDPper capita growth(PPS),20132017 * 1.702.302.86
Data
score
performance has decreased over time (-6.5%).
0 50 100 150 200 250 300 350 Tertiaryeducation Lifelonglearning Internationalscientificcopublications Most-citedscientificpublications R&Dexpenditurespublicsector R&Dexpendituresbusiness sector Non-R&Dinnovation expenditures Product/processinnovations Marketing/organisational innovations SMEsinnovatingin-house InnovativeSMEscollaborating Public-privateco-publications PCTpatentapplications Trademarkapplications Designapplications EmploymentMHTman.+KIS services Salesnew-to-market/firm innovations Relativetocountry RelativetoEU
Ostschweiz (CH05)
Regional Innovation Scoreboard 2019
Ostschweiz(CH05)isanInnovationLeader+;
Thetableontheleftshowsthenormalisedscoresper indicatorandrelativeresultscomparedtoSwitzerland andtheEU.ThetablealsoshowstheRegional InnovationIndex(RII)in2019comparedtothatof SwitzerlandandtheEUin2019,theRIIin2019 comparedtothatoftheEUin2011,andperformance change over time between 2011 and 2019.
Theradargraphshowsrelativestrengthscomparedto Switzerland(orangeline)andtheEU(blueline), showingrelativestrengths(e.g.Lifelonglearning)and weaknesses(e.g.Internationalscientificcopublications).
Thetablebelowshowsdatahighlightingpossible structuraldifferences,e.g.Employmentin Manufacturing(aboveaverage)andEmploymentin Public administration (below average).
CHEU Tertiaryeducation 41.00.47969104 Lifelonglearning 30.20.89697287 Internationalscientificco-publications 7000.4725082 Most-citedscientificpublications 0.1370.66489123 R&Dexpenditurespublicsector 0.930.676100118 R&Dexpendituresbusinesssector 2.390.807100137 Non-R&Dinnovationexpenditures ±n/a±± Product/processinnovations ±0.776±± Marketing/org.innovations ±0.843±± SMEsinnovatingin-house ±0.633±± Innovative SMEscollaborating ±0.501±± Public-private co-publications 44.50.42643104 PCT patent applications 6.130.56489132 Trademarkapplications 8.720.61981140 Design applications 17.351.000182204 EmploymentMHT manuf./KIS services 17.20.57992115 Salesnew-to-market/firminnovations ±0.913±±CH05CHEU28 Average score --0.678---- Share ofemploymentin: Country EIS-RIS correction factor 1.076 Agriculture &Mining(A-B) 4.53.24.6 RegionalInnovationIndex2019 --0.730---- Manufacturing(C) 16.812.615.4 RII2019 (same year) ----95.8150.2 Utilities &Construction(D-F) 8.47.58.2 RII2019 (cf.toEU2011) ------157.3 Services (G-N) 62.769.464.1 RegionalInnovationIndex2011 --0.664---- Publicadministration (O-U) 3.84.77.0 RII2011 (same year) ----88.7143.1 RII-change between 2011 and2019 --14.1---GDPper capita (PPS),2017 * 41,50046,80030,000 Populationdensity,2017 103212118 Urbanisation,2018 n/an/a76.0 Populationsize,2018 (000s) 1,1708,480512,380 * Estimates for the region Average employed personsper enterprise (firmsize),2015-2016 8.78.75.5 ±Relative-to-EUscoresare notshown asthese wouldallow recalculatingconfidentialregionalCISdata. GDPper capita growth(PPS),20132017 * 2.252.302.86
Data Norm alised score
(14.1%).
Relative to
innovationperformancehasincreasedovertime
0 50 100 150 200 250 300 Tertiaryeducation Lifelonglearning Internationalscientificcopublications Most-citedscientificpublications R&Dexpenditurespublicsector R&Dexpendituresbusiness sector Non-R&Dinnovation expenditures Product/processinnovations Marketing/organisational innovations SMEsinnovatingin-house InnovativeSMEscollaborating Public-privateco-publications PCTpatentapplications Trademarkapplications Designapplications EmploymentMHTman.+KIS services Salesnew-to-market/firm innovations Series2Series3 Relativetocountry RelativetoEU
Zentralschweiz (CH06)
Regional Innovation Scoreboard 2019
Relative to Zentralschweiz(CH06)isanInnovationLeader+; innovationperformancehasdecreasedovertime(3.5%).
Thetableontheleftshowsthenormalisedscoresper indicatorandrelativeresultscomparedtoSwitzerland andtheEU.ThetablealsoshowstheRegional InnovationIndex(RII)in2019comparedtothatof SwitzerlandandtheEUin2019,theRIIin2019 comparedtothatoftheEUin2011,andperformance change over time between 2011 and 2019.
Theradargraphshowsrelativestrengthscomparedto Switzerland(orangeline)andtheEU(blueline), showingrelativestrengths(e.g.Lifelonglearning)and weaknesses(e.g.Internationalscientificcopublications).
Thetablebelowshowsdatahighlightingpossible structuraldifferences,e.g.EmploymentinAgriculture& Mining(aboveaverage)andEmploymentinPublic administration
average).
CHEU Tertiaryeducation 53.30.700101152 Lifelonglearning 33.40.993107318 Internationalscientificco-publications 5690.4254574 Most-citedscientificpublications 0.1160.56575105 R&Dexpenditurespublicsector 0.930.676100118 R&Dexpendituresbusinesssector 2.390.807100137 Non-R&Dinnovationexpenditures ±n/a±± Product/processinnovations ±0.607±± Marketing/org.innovations ±0.729±± SMEsinnovatingin-house ±0.511±± Innovative SMEscollaborating ±0.386±± Public-private co-publications 166.00.82282201 PCT patent applications 6.010.55588130 Trademarkapplications 14.021.000131226 Design applications 7.340.643117131 EmploymentMHT manuf./KIS services 19.00.652104130 Salesnew-to-market/firminnovations ±0.474±±CH06CHEU28 Average score --0.659---- Share ofemploymentin: Country EIS-RIS correction factor 1.076 Agriculture &Mining(A-B) 4.93.24.6 RegionalInnovationIndex2019 --0.710---- Manufacturing(C) 14.612.615.4 RII2019 (same year) ----93.2146.1 Utilities &Construction(D-F) 8.67.58.2 RII2019 (cf.toEU2011) ------152.9 Services (G-N) 66.169.464.1 RegionalInnovationIndex2011 --0.726---- Publicadministration (O-U) 3.84.77.0 RII2011 (same year) ----96.9156.5 RII-change between 2011 and2019 ---3.5---GDPper capita (PPS),2017 * 46,20046,80030,000 Populationdensity,2017 189212118 Urbanisation,2018 n/an/a76.0 Populationsize,2018 (000s) 8108,480512,380 * Estimates for the region Average employed personsper enterprise (firmsize),2015-2016 8.78.75.5 ±Relative-to-EUscoresare notshown asthese wouldallow recalculatingconfidentialregionalCISdata. GDPper capita growth(PPS),20132017 * 2.512.302.86
Data Norm alised score
(below
0 50 100 150 200 250 300 350 Tertiaryeducation Lifelonglearning Internationalscientificcopublications Most-citedscientificpublications R&Dexpenditurespublicsector R&Dexpendituresbusiness sector Non-R&Dinnovation expenditures Product/processinnovations Marketing/organisational innovations SMEsinnovatingin-house InnovativeSMEscollaborating Public-privateco-publications PCTpatentapplications Trademarkapplications Designapplications EmploymentMHTman.+KIS services Salesnew-to-market/firm innovations Series2Series3 Relativetocountry RelativetoEU
Ticino (CH07)
Regional Innovation Scoreboard 2019
Relative to Ticino(CH07)isanInnovationLeader+;innovation performance has increased over time
Thetableontheleftshowsthenormalisedscoresper indicatorandrelativeresultscomparedtoSwitzerland andtheEU.ThetablealsoshowstheRegional InnovationIndex(RII)in2019comparedtothatof SwitzerlandandtheEUin2019,theRIIin2019 comparedtothatoftheEUin2011,andperformance change over time between 2011 and 2019.
Theradargraphshowsrelativestrengthscomparedto Switzerland(orangeline)andtheEU(blueline), showingrelativestrengths(e.g.Lifelonglearning)and weaknesses (e.g. Most-cited scientific publications). Thetablebelowshowsdatahighlightingpossible structuraldifferences,e.g.GDPpercapita(above average)andEmploymentinManufacturing(below average).
±Relative-to-EUscoresare notshown asthese wouldallow recalculatingconfidentialregionalCISdata.
CHEU Tertiaryeducation 54.60.724105157 Lifelonglearning 26.20.77584249 Internationalscientificco-publications 15490.70274122 Most-citedscientificpublications 0.0990.4796489 R&Dexpenditurespublicsector 0.930.676100118 R&Dexpendituresbusinesssector 2.390.807100137 Non-R&Dinnovationexpenditures ±n/a±± Product/processinnovations ±0.880±± Marketing/org.innovations ±0.971±± SMEsinnovatingin-house ±0.975±± Innovative SMEscollaborating ±0.403±± Public-private co-publications 77.80.56356138 PCT patent applications 5.940.55087129 Trademarkapplications 14.021.000131226 Design applications 4.950.52495107 EmploymentMHT manuf./KIS services 15.90.52684105 Salesnew-to-market/firminnovations ±0.768±±CH07CHEU28 Average score --0.708---- Share ofemploymentin: Country EIS-RIS correction factor 1.076 Agriculture &Mining(A-B) 2.13.24.6 RegionalInnovationIndex2019 --0.762---- Manufacturing(C) 7.712.615.4 RII2019 (same year) ----100.0156.8 Utilities &Construction(D-F) 8.47.58.2 RII2019 (cf.toEU2011) ------164.2 Services (G-N) 72.669.464.1 RegionalInnovationIndex2011 --0.680---- Publicadministration (O-U) 5.94.77.0 RII2011 (same year) ----90.9146.7 RII-change between 2011 and2019 --17.5---GDPper capita (PPS),2017 * 50,60046,80030,000 Populationdensity,2017 130212118 Urbanisation,2018 n/an/a76.0 Populationsize,2018 (000s) 3508,480512,380 * Estimates for the region Average employed personsper enterprise (firmsize),2015-2016 8.78.75.5
GDPper capita growth(PPS),20132017 * 2.582.302.86
Data Norm alised score
(17.5%).
0 50 100 150 200 250 Tertiaryeducation Lifelonglearning Internationalscientificcopublications Most-citedscientificpublications R&Dexpenditurespublicsector R&Dexpendituresbusiness sector Non-R&Dinnovation expenditures Product/processinnovations Marketing/organisational innovations SMEsinnovatingin-house InnovativeSMEscollaborating Public-privateco-publications PCTpatentapplications Trademarkapplications Designapplications EmploymentMHTman.+KIS services Salesnew-to-market/firm innovations Relativetocountry RelativetoEU
Stockholm (SE11)
Norm alised
Regional Innovation Scoreboard 2019 Data
Relative to Stockholm (SE11) is an Innovation Leader +; innovation performance has increased over time (0.1%).
The table on the left shows the normalised scores per indicator and relative results compared to Sweden and the EU. The table also shows the Regional Innovation Index (RII) in 2019 compared to that of Sweden and the EU in 2019, the RII in 2019 compared to that of the EU in 2011, and performance change over time between 2011 and 2019.
The radar graph shows relative strengths compared to Sweden (orange line) and the EU (blue line), showing relative strengths (e.g. Lifelong learning) and weaknesses (e.g. Sales new-to-market/firm innovations).
The table below shows data highlighting possible structural differences, e.g. Population density (above average) and Employment in Agriculture & Mining (below average).
± Relative-to-EU scores are not shown as these would allow recalculating confidentialregional CIS data.
SEEU Tertiary education 61.90.855129186 Lifelong learning 31.60.939104301 Internationalscientific co-publications 31461.000118174 Most-cited scientific publications 0.1280.621108115 R&D expenditures public sector 0.960.68798120 R&D expenditures business sector 2.820.881112149 Non-R&D innovation expenditures ±0.456±± Product/process innovations ±0.591±± Marketing/ org. innovations ±0.534±± SMEs innovating in-house ±0.594±± Innovative SMEs collaborating ±0.563±± Public-private co-publications 172.30.838115205 PCT patent applications 11.880.914115214 Trademark applications 13.380.954142215 Design applications 4.230.4829898 Employment MHT manuf./KIS services 25.90.934141186 Sales new-to-market/firm innovations ±0.469±± SE11SEEU28 Average score --0.724---- Share of employment in: Country EIS-RIS correction factor 1.032 Agriculture & Mining (A-B) 0.32.14.6 RegionalInnovation Index 2019 --0.747---- Manufacturing (C) 4.310.315.4 RII 2019 (same year) ----113.3153.8 Utilities & Construction (D-F) 6.17.78.2 RII 2019 (cf. to EU2011) ------161.1 Services (G-N) 81.672.764.1 RegionalInnovation Index 2011 --0.747---- Public administration (O-U) 7.16.77.0 RII 2011 (same year) ----112.2160.9 RII - change between 2011 and 2019 --0.1---GDP per capita (PPS), 2017 49,70036,30030,000 Population density, 2017 35125118 Urbanisation, 2018 36.260.976.0 Population size, 2018 (000s) 2,31010,120512,380 Average employed persons per enterprise (firm size), 2015-2016 4.24.25.5
GDP per capita growth (PPS), 20132017 1.511.952.86
score
0 50 100 150 200 250 300 350 Tertiaryeducation Lifelonglearning Internationalscientificcopublications Most-citedscientificpublications R&Dexpenditurespublicsector R&Dexpendituresbusiness sector Non-R&Dinnovation expenditures Product/processinnovations Marketing/organisational innovations SMEsinnovatingin-house InnovativeSMEscollaborating Public-privateco-publications PCTpatentapplications Trademarkapplications Designapplications EmploymentMHTman.+KIS services Salesnew-to-market/firm innovations Relativetocountry RelativetoEU
Sydsverige (SE22)
Regional Innovation Scoreboard 2019
Norm
alised
Relative to Sydsverige (SE22) is an Innovation Leader +; innovation performance has decreased over time (12.3%).
The table on the left shows the normalised scores per indicator and relative results compared to Sweden and the EU. The table also shows the Regional Innovation Index (RII) in 2019 compared to that of Sweden and the EU in 2019, the RII in 2019 compared to that of the EU in 2011, and performance change over time between 2011 and 2019.
The radar graph shows relative strengths compared to Sweden (orange line) and the EU (blue line), showing relative strengths (e.g. Lifelong learning) and weaknesses (e.g. Sales new-to-market/firm innovations).
The table below shows data highlighting possible structural differences, e.g. Employment in Services (above average) and Employment in Manufacturing
average).
SEEU Tertiary education 52.60.688104150 Lifelong learning 31.60.939104301 Internationalscientific co-publications 23950.872103152 Most-cited scientific publications 0.1210.587102108 R&D expenditures public sector 1.220.786112138 R&D expenditures business sector 2.040.74294126 Non-R&D innovation expenditures ±0.470±± Product/process innovations ±0.534±± Marketing/ org. innovations ±0.473±± SMEs innovating in-house ±0.507±± Innovative SMEs collaborating ±0.409±± Public-private co-publications 79.80.57078140 PCT patent applications 13.591.000126234 Trademark applications 11.610.826123187 Design applications 5.500.553112113 Employment MHT manuf./KIS services 17.80.60391120 Sales new-to-market/firm innovations ±0.407±± SE22SEEU28 Average score --0.645---- Share of employment in: Country EIS-RIS correction factor 1.032 Agriculture & Mining (A-B) 2.22.14.6 RegionalInnovation Index 2019 --0.665---- Manufacturing (C) 9.610.315.4 RII 2019 (same year) ----100.9137.0 Utilities & Construction (D-F) 7.57.78.2 RII 2019 (cf. to EU2011) ------143.4 Services (G-N) 73.472.764.1 RegionalInnovation Index 2011 --0.722---- Public administration (O-U) 6.66.77.0 RII 2011 (same year) ----108.6155.7 RII - change between 2011 and 2019 ---12.3---GDP per capita (PPS), 2017 31,30036,30030,000 Population density, 2017 10825118 Urbanisation, 2018 55.660.976.0 Population size, 2018 (000s) 1,50010,120512,380
Data
score
(below
Average employed persons per enterprise (firm size), 2015-2016 4.24.25.5 ± Relative-to-EU scores are not shown as these would allow recalculating confidentialregional CIS data. GDP per capita growth (PPS), 20132017 2.371.952.86 0 50 100 150 200 250 300 350 Tertiaryeducation Lifelonglearning Internationalscientificcopublications Most-citedscientificpublications R&Dexpenditurespublicsector R&Dexpendituresbusiness sector Non-R&Dinnovation expenditures Product/processinnovations Marketing/organisational innovations SMEsinnovatingin-house InnovativeSMEscollaborating Public-privateco-publications PCTpatentapplications Trademarkapplications Designapplications EmploymentMHTman.+KIS services Salesnew-to-market/firm innovations Relativetocountry RelativetoEU
Hovedstaden (DK01)
Regional Innovation Scoreboard 2019
Norm alised score
Relative to Hovedstaden (DK01) is an Innovation Leader +; innovation performance has decreased over time (6.2%).
The table on the left shows the normalised scores per indicator and relative results compared to Denmark and the EU. The table also shows the Regional Innovation Index (RII) in 2019 compared to that of Denmark and the EU in 2019, the RII in 2019 compared to that of the EU in 2011, and performance change over time between 2011 and 2019.
The radar graph shows relative strengths compared to Denmark (orange line) and the EU (blue line), showing relative strengths (e.g. Lifelong learning) and weaknesses (e.g. Non-R&D innovation expenditures). The table below shows data highlighting possible structural differences, e.g. Population density (above average) and Employment in Agriculture & Mining (below average).
DKEU Tertiary education 62.30.862139188 Lifelong learning 30.60.908115291 Internationalscientific co-publications 31461.000112174 Most-cited scientific publications 0.1370.667105123 R&D expenditures public sector 1.470.869119152 R&D expenditures business sector 3.490.985133167 Non-R&D innovation expenditures ±0.314±± Product/process innovations ±0.516±± Marketing/ org. innovations ±0.590±± SMEs innovating in-house ±0.695±± Innovative SMEs collaborating ±0.470±± Public-private co-publications 245.51.000123245 PCT patent applications 8.570.726118170 Trademark applications 12.260.874121197 Design applications 9.700.742114151 Employment MHT manuf./KIS services 18.50.632131126 Sales new-to-market/firm innovations ±0.471±± DK01DKEU28 Average score --0.725---- Share of employment in: Country EIS-RIS correction factor 1.012 Agriculture & Mining (A-B) 0.52.64.6 RegionalInnovation Index 2019 --0.733---- Manufacturing (C) 7.311.715.4 RII 2019 (same year) ----116.6151.0 Utilities & Construction (D-F) 5.17.08.2 RII 2019 (cf. to EU2011) ------158.1 Services (G-N) 80.172.964.1 RegionalInnovation Index 2011 --0.762---- Public administration (O-U) 6.55.37.0 RII 2011 (same year) ----116.8164.3 RII - change between 2011 and 2019 ---6.2---GDP per capita (PPS), 2017 49,80038,40030,000 Population density, 2017 745137118 Urbanisation, 2018 92.261.876.0 Population size, 2018 (000s) 1,8205,780512,380
Data
Average employed persons per enterprise (firm size), 2015-2016 8.08.05.5 ± Relative-to-EU scores are not shown as these would allow recalculating confidentialregional CIS data. GDP per capita growth (PPS), 20132017 3.682.862.86 0 50 100 150 200 250 300 Tertiaryeducation Lifelonglearning Internationalscientificcopublications Most-citedscientificpublications R&Dexpenditurespublicsector R&Dexpendituresbusiness sector Non-R&Dinnovation expenditures Product/processinnovations Marketing/organisational innovations SMEsinnovatingin-house InnovativeSMEscollaborating Public-privateco-publications PCTpatentapplications Trademarkapplications Designapplications EmploymentMHTman.+KIS services Salesnew-to-market/firm innovations Relativetocountry RelativetoEU
Helsinki-Uusimaa (FI1B)
Regional Innovation Scoreboard 2019
Norm alised
Relative to Helsinki-Uusimaa(FI1B)isanInnovationLeader+; innovationperformancehasincreasedovertime (12.8%).
Thetableontheleftshowsthenormalisedscoresper indicatorandrelativeresultscomparedtoFinlandand theEU.ThetablealsoshowstheRegionalInnovation Index(RII)in2019comparedtothatofFinlandand theEUin2019,theRIIin2019comparedtothatof theEUin2011,andperformancechangeovertime between 2011 and 2019.
Theradargraphshowsrelativestrengthscomparedto Finland(orangeline)andtheEU(blueline),showing relativestrengths(e.g.Lifelonglearning)and weaknesses (e.g. Non-R&D innovation expenditures). Thetablebelowshowsdatahighlightingpossible structuraldifferences,e.g.Populationdensity(above average)andEmploymentinAgriculture&Mining (below average).
FIEU Tertiaryeducation 52.50.686126149 Lifelonglearning 30.40.902111289 Internationalscientificco-publications 28500.952123166 Most-citedscientificpublications 0.1110.541105100 R&D expenditures publicsector 1.110.745112131 R&D expenditures businesssector 2.340.799115135 Non-R&D innovation expenditures ±0.476±± Product/processinnovations ±0.794±± Marketing/org.innovations ±0.578±± SMEsinnovatingin-house ±0.772±± Innovative SMEscollaborating ±0.805±± Public-private co-publications 145.80.771131189 PCT patent applications 11.190.877123205 Trademarkapplications 13.970.996155225 Design applications 5.430.549114112 EmploymentMHT manuf./KIS services 22.80.808143161 Sales new-to-market/firminnovations ±0.628±±FI1BFIEU28 Average score --0.746---- Share ofemploymentin: Country EIS-RIS correction factor 1.017 Agriculture &Mining(A-B) 0.84.24.6 RegionalInnovation Index2019 --0.758---- Manufacturing(C) 8.913.415.4 RII2019 (same year) ----116.4156.0 Utilities &Construction (D-F) 7.68.48.2 RII2019 (cf.toEU2011) ------163.4 Services (G-N) 77.269.264.1 RegionalInnovation Index2011 --0.699---- Publicadministration (O-U) 5.04.57.0 RII2011 (same year) ----114.4150.6 RII-change between 2011 and2019 --12.8---GDPper capita (PPS),2017 42,40032,70030,000 Population density,2017 18118118 Urbanisation,2018 89.271.376.0 Population size,2018 (000s) 1,6605,510512,380
Data
score
Average employed personsper enterprise (firmsize),2015-2016 7.14.95.5 ±Relative-to-EUscoresare notshown asthese wouldallow recalculatingconfidentialregionalCISdata. GDPper capita growth (PPS),20132017 1.471.922.86 0 50 100 150 200 250 300 Tertiaryeducation Lifelonglearning Internationalscientificcopublications Most-citedscientificpublications R&Dexpenditurespublicsector R&Dexpendituresbusiness sector Non-R&Dinnovation expenditures Product/processinnovations Marketing/organisational innovations SMEsinnovatingin-house InnovativeSMEscollaborating Public-privateco-publications PCTpatentapplications Trademarkapplications Designapplications EmploymentMHTman.+KIS services Salesnew-to-market/firm innovations Relativetocountry RelativetoEU
Utrecht (NL31)
Regional Innovation Scoreboard 2019
Relative to Utrecht(NL31)isanInnovationLeader+;innovation performance has increased over time (14.3%).
Thetableontheleftshowsthenormalisedscoresper indicatorandrelativeresultscomparedtothe NetherlandsandtheEU.Thetablealsoshowsthe RegionalInnovationIndex(RII)in2019comparedto thatoftheNetherlandsandtheEUin2019,theRIIin 2019comparedtothatoftheEUin2011,and performancechangeovertimebetween2011and 2019.
Theradargraphshowsrelativestrengthscomparedto theNetherlands(orangeline)andtheEU(blueline), showingrelativestrengths(e.g.Public-privatecopublications)andweaknesses(e.g.R&Dexpenditures business sector).
Thetablebelowshowsdatahighlightingpossible structuraldifferences,e.g.Populationdensity(above average)andEmploymentinAgriculture&Mining (below average).
NLEU Tertiaryeducation 60.10.822136179 Lifelonglearning 21.80.642115206 Internationalscientificco-publications 31461.000125174 Most-citedscientificpublications 0.1530.744105138 R&Dexpenditurespublicsector 1.370.838131147 R&Dexpendituresbusinesssector 0.550.3636662 Non-R&Dinnovationexpenditures ±0.409±± Product/processinnovations ±0.595±± Marketing/org.innovations ±0.410±± SMEsinnovatingin-house ±0.437±± Innovative SMEscollaborating ±0.523±± Public-private co-publications 219.80.946149232 PCT patent applications 3.920.3866590 Trademarkapplications 7.300.51798117 Design applications 4.330.488100100 EmploymentMHT manuf./KIS services 17.90.607121121 Salesnew-to-market/firminnovations ±0.671±±NL31NLEU28 Average score --0.631---- Share ofemploymentin: Country EIS-RIS correction factor 1.038 Agriculture &Mining(A-B) 0.92.24.6 RegionalInnovationIndex2019 --0.655---- Manufacturing(C) 5.59.415.4 RII2019 (same year) ----108.7134.8 Utilities &Construction(D-F) 4.55.58.2 RII2019 (cf.toEU2011) ------141.2 Services (G-N) 73.568.564.1 RegionalInnovationIndex2011 --0.589---- Publicadministration (O-U) 5.95.87.0 RII2011 (same year) ----106.8126.9 RII-change between 2011 and2019 --14.3---GDPper capita (PPS),2017 46,60038,40030,000 Populationdensity,2017 918501118 Urbanisation,2018 99.090.476.0 Populationsize,2018 (000s) 1,30017,180512,380
Data
alised score
Norm
Average employed personsper enterprise (firmsize),2015-2016 5.15.15.5 ±Relative-to-EUscoresare notshown asthese wouldallow recalculatingconfidentialregionalCISdata. GDPper capita growth(PPS),20132017 0.430.792.86 0 50 100 150 200 250 Tertiaryeducation Lifelonglearning Internationalscientificcopublications Most-citedscientificpublications R&Dexpenditurespublicsector R&Dexpendituresbusiness sector Non-R&Dinnovation expenditures Product/processinnovations Marketing/organisational innovations SMEsinnovatingin-house InnovativeSMEscollaborating Public-privateco-publications PCTpatentapplications Trademarkapplications Designapplications EmploymentMHTman.+KIS services Salesnew-to-market/firm innovations Relativetocountry RelativetoEU
Noord-Brabant (NL41)
Regional Innovation Scoreboard 2019
to Noord-Brabant(NL41)isanInnovationLeader+; innovationperformancehasincreasedovertime (6.4%).
Thetableontheleftshowsthenormalisedscoresper indicatorandrelativeresultscomparedtothe NetherlandsandtheEU.Thetablealsoshowsthe RegionalInnovationIndex(RII)in2019comparedto thatoftheNetherlandsandtheEUin2019,theRIIin 2019comparedtothatoftheEUin2011,and performancechangeovertimebetween2011and 2019.
Theradargraphshowsrelativestrengthscomparedto theNetherlands(orangeline)andtheEU(blueline), showingrelativestrengths(e.g.PCTpatent applications)andweaknesses(e.g. Marketing/organisational innovations).
Thetablebelowshowsdatahighlightingpossible structuraldifferences,e.g.Populationdensity(above average) and Employment in Public administration
NLEU Tertiaryeducation 45.50.56093122 Lifelonglearning 17.90.52494168 Internationalscientificco-publications 8320.5146490 Most-citedscientificpublications 0.1320.64290119 R&Dexpenditurespublicsector 0.420.4286775 R&Dexpendituresbusinesssector 2.710.862157146 Non-R&Dinnovationexpenditures ±0.365±± Product/processinnovations ±0.509±± Marketing/org.innovations ±0.343±± SMEsinnovatingin-house ±0.437±± Innovative SMEscollaborating ±0.472±± Public-private co-publications 149.40.780123191 PCT patent applications 13.591.000169234 Trademarkapplications 8.920.633120143 Design applications 9.050.716146146 EmploymentMHT manuf./KIS services 16.30.542108108 Salesnew-to-market/firminnovations ±0.603±±NL41NLEU28 Average score --0.604---- Share ofemploymentin: Country EIS-RIS correction factor 1.038 Agriculture &Mining(A-B) 2.42.24.6 RegionalInnovationIndex2019 --0.627---- Manufacturing(C) 13.39.415.4 RII2019 (same year) ----104.0129.1 Utilities &Construction(D-F) 6.25.58.2 RII2019 (cf.toEU2011) ------135.2 Services (G-N) 65.668.564.1 RegionalInnovationIndex2011 --0.597---- Publicadministration (O-U) 4.65.87.0 RII2011 (same year) ----108.3128.7 RII-change between 2011 and2019 --6.4---GDPper capita (PPS),2017 38,80038,40030,000 Populationdensity,2017 508501118 Urbanisation,2018 91.790.476.0 Populationsize,2018 (000s) 2,53017,180512,380
Data Norm alised score
Relative
Average employed personsper enterprise (firmsize),2015-2016 5.15.15.5 ±Relative-to-EUscoresare notshown asthese wouldallow recalculatingconfidentialregionalCISdata. GDPper capita growth(PPS),20132017 1.310.792.86 0 50 100 150 200 250 Tertiaryeducation Lifelonglearning Internationalscientificcopublications Most-citedscientificpublications R&Dexpenditurespublicsector R&Dexpendituresbusiness sector Non-R&Dinnovation expenditures Product/processinnovations Marketing/organisational innovations SMEsinnovatingin-house InnovativeSMEscollaborating Public-privateco-publications PCTpatentapplications Trademarkapplications Designapplications EmploymentMHTman.+KIS services Salesnew-to-market/firm innovations Series2Series3 Relativetocountry RelativetoEU
Stuttgart (DE11)
Regional Innovation Scoreboard 2019 Data
Norm alised score
Relative to Stuttgart (DE11) is an Innovation Leader +; innovation performance has decreased over time (-7.5%).
The table on the left shows the normalised scores per indicator and relative results compared to Germany and the EU. The table also shows the Regional Innovation Index (RII) in 2019 compared to that of Germany and the EU in 2019, the RII in 2019 compared to that of the EU in 2011, and performance change over time between 2011 and 2019.
The radar graph shows relative strengths compared to Germany (orange line) and the EU (blue line), showing relative strengths (e.g. PCT patent applications) and weaknesses (e.g. Innovative SMEs collaborating). The table below shows data highlighting possible structural differences, e.g. Population density (above average) and Employment in Agriculture & Mining (below average).
Relative-to-EU scores are not shown as these would allow recalculating confidentialregional CIS data.
DEEU Tertiary education 39.20.44712697 Lifelong learning 9.40.26611385 Internationalscientific co-publications 4760.3896568 Most-cited scientific publications 0.1180.575104106 R&D expenditures public sector 0.470.4586880 R&D expenditures business sector 3.591.000136169 Non-R&D innovation expenditures ±0.599±± Product/process innovations ±0.640±± Marketing/ org. innovations ±0.618±± SMEs innovating in-house ±0.653±± Innovative SMEs collaborating ±0.230±± Public-private co-publications 56.60.48095118 PCT patent applications 11.750.907149212 Trademark applications 7.000.49598112 Design applications 12.920.860138176 Employment MHT manuf./KIS services 27.51.000163199 Sales new-to-market/firm innovations ±0.565±± DE11DEEU28 Average score --0.599---- Share of employment in: Country EIS-RIS correction factor 1.050 Agriculture & Mining (A-B) 1.01.54.6 RegionalInnovation Index 2019 --0.629---- Manufacturing (C) 29.119.315.4 RII 2019 (same year) ----111.1129.5 Utilities & Construction (D-F) 7.18.28.2 RII 2019 (cf. to EU2011) ------135.6 Services (G-N) 57.364.164.1 RegionalInnovation Index 2011 --0.664---- Public administration (O-U) 5.57.07.0 RII 2011 (same year) ----112.0143.1 RII - change between 2011 and 2019 ---7.5---GDP per capita (PPS), 2017 47,80037,10030,000 Population density, 2017 390234118 Urbanisation, 2018 87.779.376.0 Population size, 2018 (000s) 4,13082,790512,380
Average employed persons per enterprise (firm size), 2015-2016 10.110.15.5
GDP per capita growth (PPS), 20132017 2.922.822.86 0 50 100 150 200 250 Tertiaryeducation Lifelonglearning Internationalscientificcopublications Most-citedscientificpublications R&Dexpenditurespublicsector R&Dexpendituresbusiness sector Non-R&Dinnovation expenditures Product/processinnovations Marketing/organisational innovations SMEsinnovatingin-house InnovativeSMEscollaborating Public-privateco-publications PCTpatentapplications Trademarkapplications Designapplications EmploymentMHTman.+KIS services Salesnew-to-market/firm innovations Relativetocountry RelativetoEU
±
Karlsruhe (DE12)
Regional Innovation Scoreboard 2019
Norm alised
Relative to Karlsruhe (DE12) is an Innovation Leader +; innovation performance has decreased over time (-8.9%).
The table on the left shows the normalised scores per indicator and relative results compared to Germany and the EU. The table also shows the Regional Innovation Index (RII) in 2019 compared to that of Germany and the EU in 2019, the RII in 2019 compared to that of the EU in 2011, and performance change over time between 2011 and 2019.
The radar graph shows relative strengths compared to Germany (orange line) and the EU (blue line), showing relative strengths (e.g. PCT patent applications) and weaknesses (e.g. Innovative SMEs collaborating). The table below shows data highlighting possible structural differences, e.g. Population density (above average) and Employment in Agriculture & Mining (below average).
DEEU Tertiary education 39.30.44912798 Lifelong learning 9.60.27211587 Internationalscientific co-publications 24400.881148154 Most-cited scientific publications 0.1280.624112115 R&D expenditures public sector 1.590.907134159 R&D expenditures business sector 2.920.897122152 Non-R&D innovation expenditures ±0.641±± Product/process innovations ±0.672±± Marketing/ org. innovations ±0.671±± SMEs innovating in-house ±0.657±± Innovative SMEs collaborating ±0.326±± Public-private co-publications 94.40.620123152 PCT patent applications 9.170.763125179 Trademark applications 7.770.551109124 Design applications 4.450.49680101 Employment MHT manuf./KIS services 22.70.804131160 Sales new-to-market/firm innovations ±0.531±± DE12DEEU28 Average score --0.633---- Share of employment in: Country EIS-RIS correction factor 1.050 Agriculture & Mining (A-B) 0.51.54.6 RegionalInnovation Index 2019 --0.665---- Manufacturing (C) 24.519.315.4 RII 2019 (same year) ----117.4136.9 Utilities & Construction (D-F) 7.08.28.2 RII 2019 (cf. to EU2011) ------143.3 Services (G-N) 61.964.164.1 RegionalInnovation Index 2011 --0.706---- Public administration (O-U) 6.17.07.0 RII 2011 (same year) ----119.1152.3 RII - change between 2011 and 2019 ---8.9---GDP per capita (PPS), 2017 40,80037,10030,000 Population density, 2017 406234118 Urbanisation, 2018 86.079.376.0 Population size, 2018 (000s) 2,80082,790512,380
Data
score
Average employed persons per enterprise (firm size), 2015-2016 10.110.15.5
Relative-to-EU scores are not
recalculating confidentialregional CIS data. GDP per capita growth (PPS), 20132017 2.342.822.86 0 20 40 60 80 100 120 140 160 180 Tertiaryeducation Lifelonglearning Internationalscientificcopublications
R&Dexpenditurespublicsector
sector Non-R&Dinnovation expenditures Product/processinnovations Marketing/organisational innovations SMEsinnovatingin-house InnovativeSMEscollaborating Public-privateco-publications PCTpatentapplications Trademarkapplications Designapplications EmploymentMHTman.+KIS services Salesnew-to-market/firm innovations Series2Series3 Relativetocountry RelativetoEU
±
shown as these would allow
Most-citedscientificpublications
R&Dexpendituresbusiness
Tübingen (DE14)
Regional Innovation Scoreboard 2019
Relative to Tübingen (DE14) is an Innovation Leader +; innovation performance has decreased over time (-9.2%).
The table on the left shows the normalised scores per indicator and relative results compared to Germany and the EU. The table also shows the Regional Innovation Index (RII) in 2019 compared to that of Germany and the EU in 2019, the RII in 2019 compared to that of the EU in 2011, and performance change over time between 2011 and 2019.
The radar graph shows relative strengths compared to Germany (orange line) and the EU (blue line), showing relative strengths (e.g. PCT patent applications) and weaknesses (e.g. Innovative SMEs collaborating). The table below shows data highlighting possible structural differences, e.g. Employment in Manufacturing (above average) and Employment in Public administration (below average).
DEEU Tertiary education 37.70.42011991 Lifelong learning 9.50.26911486 Internationalscientific co-publications 18160.760128133 Most-cited scientific publications 0.1100.5369799 R&D expenditures public sector 0.960.688102120 R&D expenditures business sector 3.570.997136169 Non-R&D innovation expenditures ±0.699±± Product/process innovations ±0.704±± Marketing/ org. innovations ±0.640±± SMEs innovating in-house ±0.726±± Innovative SMEs collaborating ±0.197±± Public-private co-publications 71.90.541107133 PCT patent applications 8.990.752123176 Trademark applications 7.470.529105119 Design applications 5.260.54087110 Employment MHT manuf./KIS services 23.40.832136166 Sales new-to-market/firm innovations ±0.614±± DE14DEEU28 Average score --0.614---- Share of employment in: Country EIS-RIS correction factor 1.050 Agriculture & Mining (A-B) 1.81.54.6 RegionalInnovation Index 2019 --0.645---- Manufacturing (C) 29.819.315.4 RII 2019 (same year) ----114.0132.9 Utilities & Construction (D-F) 7.68.28.2 RII 2019 (cf. to EU2011) ------139.1 Services (G-N) 55.064.164.1 RegionalInnovation Index 2011 --0.688---- Public administration (O-U) 5.87.07.0 RII 2011 (same year) ----116.0148.3 RII - change between 2011 and 2019 ---9.2---GDP per capita (PPS), 2017 40,40037,10030,000 Population density, 2017 212234118 Urbanisation, 2018 69.779.376.0 Population size, 2018 (000s) 1,85082,790512,380 Average employed persons per enterprise (firm size), 2015-2016 10.110.15.5
Relative-to-EU scores are not shown as these would allow recalculating confidentialregional CIS data. GDP per capita growth (PPS), 20132017 3.002.822.86
±
Data
alised score
Norm
0 20 40 60 80 100 120 140 160 180 Tertiaryeducation Lifelonglearning Internationalscientificcopublications Most-citedscientificpublications R&Dexpenditurespublicsector R&Dexpendituresbusiness sector Non-R&Dinnovation expenditures Product/processinnovations Marketing/organisational
SMEsinnovatingin-house InnovativeSMEscollaborating Public-privateco-publications PCTpatentapplications Trademarkapplications Designapplications EmploymentMHTman.+KIS services Salesnew-to-market/firm innovations Relativetocountry RelativetoEU
innovations
Oberbayern (DE21)
Norm alised
Regional Innovation Scoreboard 2019 Data
Relative to Oberbayern (DE21) is an Innovation Leader +; innovation performance has decreased over time (6.5%).
The table on the left shows the normalised scores per indicator and relative results compared to Germany and the EU. The table also shows the Regional Innovation Index (RII) in 2019 compared to that of Germany and the EU in 2019, the RII in 2019 compared to that of the EU in 2011, and performance change over time between 2011 and 2019.
The radar graph shows relative strengths compared to Germany (orange line) and the EU (blue line), showing relative strengths (e.g. Public-private co-publications) and weaknesses (e.g. Innovative SMEs collaborating). The table below shows data highlighting possible structural differences, e.g. Population density (above average) and Employment in Utilities & Construction (below average).
± Relative-to-EU scores are not shown as these would allow recalculating confidentialregional CIS data.
DEEU Tertiary education 48.30.610173133 Lifelong learning 8.50.23910177 Internationalscientific co-publications 19730.792133138 Most-cited scientific publications 0.1350.657118121 R&D expenditures public sector 1.060.726108127 R&D expenditures business sector 3.310.959131162 Non-R&D innovation expenditures ±0.455±± Product/process innovations ±0.561±± Marketing/ org. innovations ±0.622±± SMEs innovating in-house ±0.572±± Innovative SMEs collaborating ±0.258±± Public-private co-publications 153.50.791157194 PCT patent applications 10.170.821135192 Trademark applications 10.830.771152174 Design applications 10.450.771124157 Employment MHT manuf./KIS services 25.10.902147180 Sales new-to-market/firm innovations ±0.535±± DE21DEEU28 Average score --0.649---- Share of employment in: Country EIS-RIS correction factor 1.050 Agriculture & Mining (A-B) 1.61.54.6 RegionalInnovation Index 2019 --0.682---- Manufacturing (C) 19.019.315.4 RII 2019 (same year) ----120.4140.4 Utilities & Construction (D-F) 6.78.28.2 RII 2019 (cf. to EU2011) ------147.1 Services (G-N) 66.564.164.1 RegionalInnovation Index 2011 --0.713---- Public administration (O-U) 6.17.07.0 RII 2011 (same year) ----120.2153.6 RII - change between 2011 and 2019 ---6.5---GDP per capita (PPS), 2017 53,00037,10030,000 Population density, 2017 270234118 Urbanisation, 2018 79.179.376.0 Population size, 2018 (000s) 4,65082,790512,380 Average employed persons per enterprise (firm size), 2015-2016 10.110.15.5
GDP per capita growth (PPS), 20132017 2.722.822.86
score
0 20 40 60 80 100 120 140 160 180 200 Tertiaryeducation Lifelonglearning Internationalscientificcopublications Most-citedscientificpublications R&Dexpenditurespublicsector R&Dexpendituresbusiness sector Non-R&Dinnovation expenditures
Marketing/organisational innovations SMEsinnovatingin-house InnovativeSMEscollaborating Public-privateco-publications PCTpatentapplications Trademarkapplications Designapplications EmploymentMHTman.+KIS services Salesnew-to-market/firm innovations Series2Series3 Relativetocountry RelativetoEU
Product/processinnovations
Het advies en de analyse ter ondersteuning ervan werden voorbereid door de VARIO-staf: Elie Ratinckx,KristienVercoutere,AnneliesWastyn,VeerleLinseele&DanielleRaspoet . VARIO wenst prof StijnKelchtermans(KU Leuven) te danken voor waardevolle suggesties.

+32 (0)2 553 24 40
info@vario.be www.vario.be
VlaamseAdviesraad voorInnoverenenOndernemen
Koolstraat 35 1000 Brussel


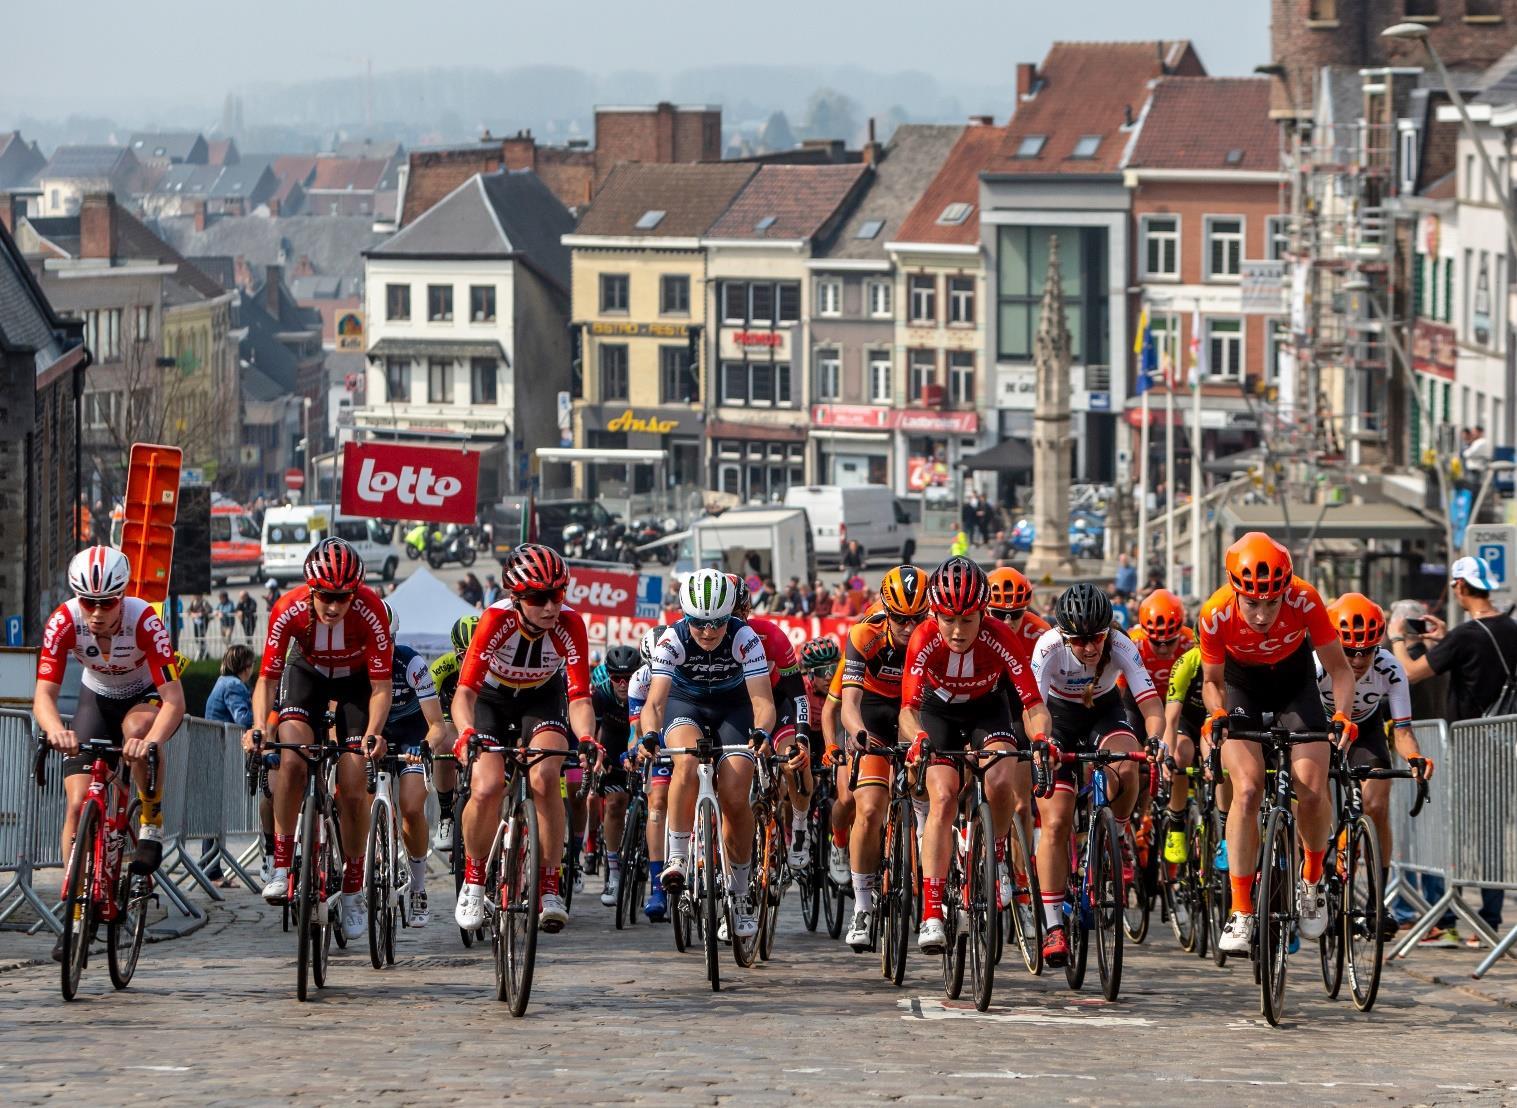
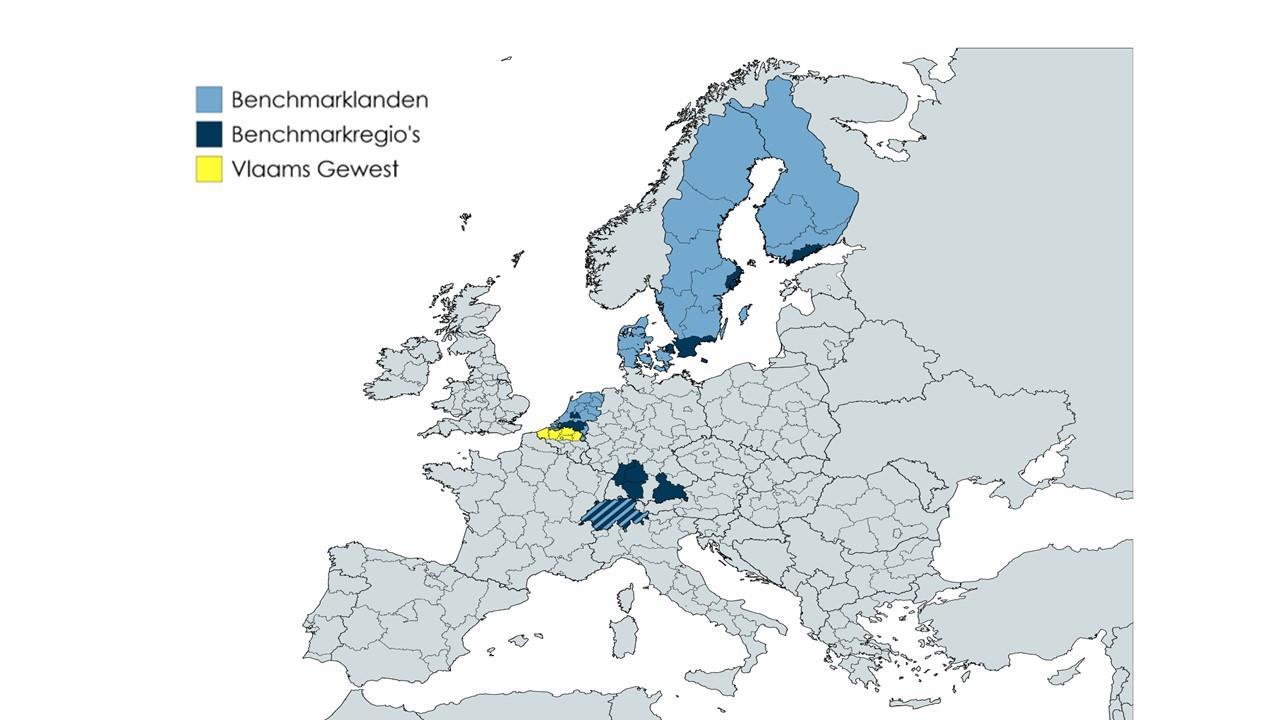
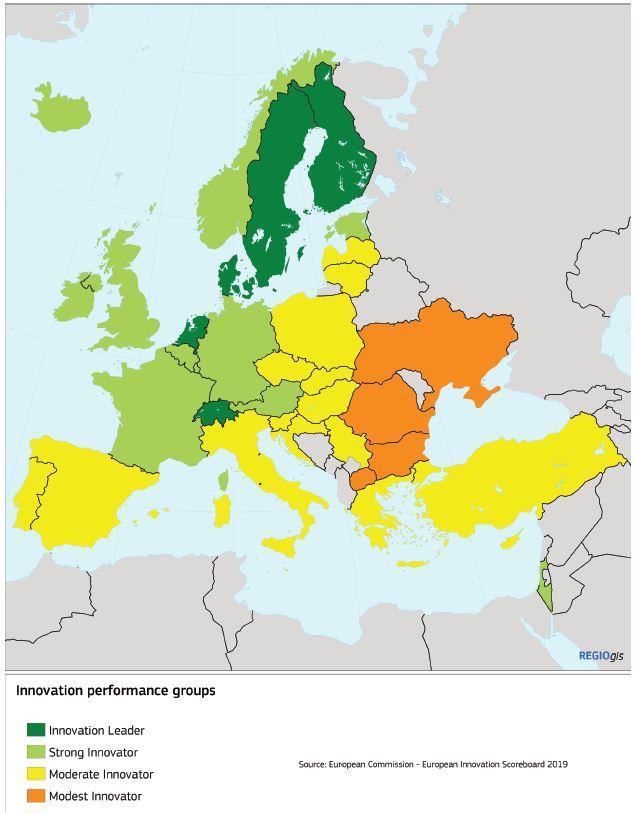
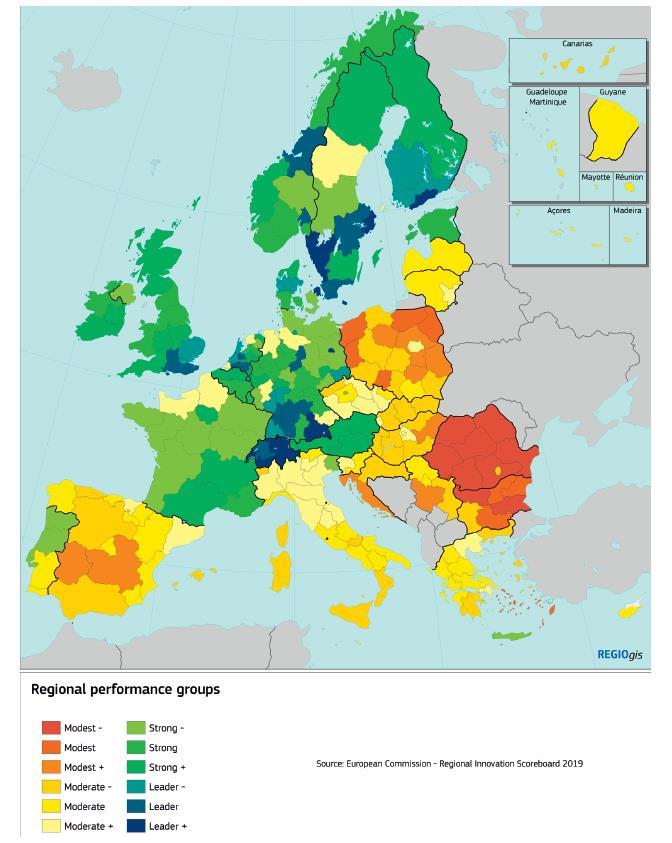 FIGUUR B: Regionale innovatieprestaties in Europees perspectief (RIS2019)
Bron: Europese Commissie, Regionaal Innovatiescorebord 2019
FIGUUR B: Regionale innovatieprestaties in Europees perspectief (RIS2019)
Bron: Europese Commissie, Regionaal Innovatiescorebord 2019