De economische effecten van internationalisering in het hoger onderwijs
Studie in opdracht van de ‘Vlaamse Universiteiten en Hogescholen Raad’ (VLUHR) en de Vlaamse Adviesraad voor Innoveren en Ondernemen (VARIO)
 Kristof De Witte, Mara Soncin, Sarah Vansteenkiste en Luc Sels
Beleidssamenvatting
1. Inleiding
Deinternationaliseringvan het hoger onderwijskrijgt zowel vanuit academischperspectiefalsvanuit het beleid toenemende aandacht. Het aantal bachelor-, master- en doctoraatsstudenten dat naar een ander land trekt met het doel om er te studeren groeit jaarlijks, en vertegenwoordigt reeds een aanzienlijk deel van de studenten in diverse landen. De landen met de grootste instroom van internationale studenten zijn de Verenigde Staten, Frankrijk, Duitsland, het Verenigd Koningrijk, Canada en Australië. Europa trok in 2016 bijna de helft van het aantal internationale studenten aan. Bovendien steeg hun aantal met 15% tussen 2013 en 2017 (OESO, 2020).
De academische literatuur heeft vooral gefocust op de determinanten van internationale studentenmobiliteit door de (economische) factoren te modelleren. Hierbij werd gekeken naar de economische prestatie, de onderwijskosten, de politieke stabiliteit, de culturele nabijheid en de instructietaal (Naidoo, 2007; González et al., 2011; Kahanec & Králiková, 2011; Caruso, & De Wit, 2015; OESO, 2018). Onderzoek heeft ook aandacht geschonken aan de invloed van buitenlandse studenten op de totale tewerkstelling van hooggeschoolden. Hierbij wordt een positieve relatie gevonden,al hangt derelatiesterkaf vandematewaariner wordt teruggekeerdnaarhet geboorteland (Demange & Fenge, 2010; Felbermayr & Reczkowski, 2012). Een beperkt deel van de literatuur analyseert ook de inputzijde, waarbij gekeken wordt hoe internationalisering de kostenstructuur van de ontvangende instellingen beïnvloedt (Zhang et al., 2017). Tot voor kort bleef de aandacht voor de kosten en baten van internationalisering beperkt (Throsby, 1991; 1998; De Villé et al., 1996). Recent zijn er echter enkele interessante beleidsdocumenten die de kosten en baten kwantificeren voor Nederland (Centraal Planbureau, 2012; Inspectie van het Onderwijs, 2019) en het Verenigd Koninkrijk (London Economics, 2018).
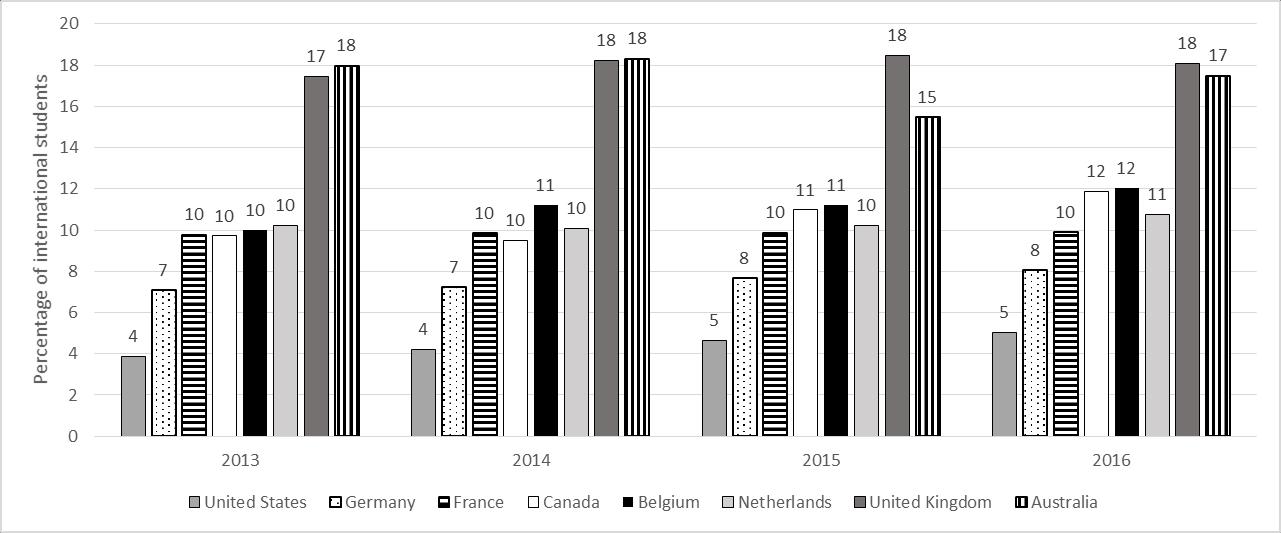
SpecifiekvoorVlaanderenneemt zowel hetaantal(Figuur 1)alshet aandeel(Figuur 2)internationale bachelor-, master- en doctoraatsstudenten toe.1 De OESO en Eurostat omschrijven internationale studenten als studenten die geen inwoner zijn van het land waar ze hoger onderwijs volgen en er niet het diploma van secundair onderwijs behaald hebben. Vaak zijn gegevens volgens deze definitie niet beschikbaar. De OESO gebruikt daarom doorgaans gegevens van buitenlandse studenten, gedefinieerd volgens de nationaliteit van de student.
Uit Figuur 1blijktdat hetaantal buitenlandsestudenten(gemetenvolgensnationaliteit)inhetVlaams hoger onderwijs toenam van 13 327 in academiejaar 2008/09 tot 27 162 in academiejaar 2014/15 en 32 964 in 2018/19. Waar in 2008/09 slechts 6,4% van de hogeronderwijsstudenten niet-Belg was, was dit 5jaar later al gestegen tot 10,2% en in2018/19 reeds 11,9%.Zowel het aantal EU-(van 7 246 naar 17 832 studenten) als het aantal niet-EU studenten (van 6 081 naar 15 132) nam toe in de laatste 10 jaar. De stijging was initieel proportioneel groter bij de EU studenten, maar de niet-EU studenten maken de laatste jaren een inhaalbeweging (zie Figuur 2).
2
1 Bij doctoraatstudenten focussen we op de studenten met een diplomacontract zodat dubbeltellingen met ‘academische graad van doctor’ vermeden worden.
Gegeven deze toename van het aantal buitenlandse studenten kan de vraag gesteld worden welke de economische kosten en baten zijn van deze internationalisering in het hoger onderwijs. We focussen hierbij op studenten die zich inschrijven voor voltijdse programma’s, en sluiten bijgevolg studenten in het kader van een uitwisselingsprogramma (bv. Erasmus) uit. Deze laatste groep van studenten heeft typisch een kort verblijf (één semester of één jaar) in het buitenland voor ogen, waardoor de blijfkans en de resulterende economische effecten wellicht gering zijn.
Figuur 1: Evolutie van het absolute aantal buitenlandse bachelor-, master- en doctoraatsstudenten (gemeten volgens nationaliteit) in het Vlaams hoger onderwijs (Bron: Ministerie van Onderwijs en Vorming, 2020)
3
0 50 000 100 000 150 000 200 000 250 000 300 000 2008-2009 2009-2010 2010-2011 2011-2012 2012-2013 2013-2014 2014-2015 2015-2016 2016-2017 2017-2018 2018-2019 Belg niet-Belg
2. Centrale onderzoeksvragen
Dit rapport wil twee centrale onderzoeksvragen beantwoorden.
1. Wie zijn de buitenlandse studenten in Vlaanderen?
In het eerste deel van het rapport schetsen we het profiel van internationale studenten in Vlaanderen op basis van gegevens van het Vlaams Ministerie van Onderwijs en Vorming (2019). In lijn met de definitie van internationale studenten die door de OESO wordt gehanteerd, definiëren we internationale studenten eerst als "zij die hun land van herkomst hebben verlaten en naar een ander land zijn verhuisd om te studeren", waar het land van herkomst bepaald wordt door het diploma middelbaar onderwijs. Voor een verdere analyse bestuderen we het profiel van internationale studentenopbasisvanhunnationaliteit.Ditiseenbrederedefinitie,omdatzestudentenkanomvatten die met hun gezin zijn verhuisd voor verschillende doeleinden anders dan studeren.
In de profielbeschrijvingmaken we een onderscheid tusseninternationale studenten aan hogescholen en universiteiten. We bespreken verder de instroom van internationale studenten volgens onderwijsniveau (bachelor-, master- en doctoraatsopleiding) en wetenschapsgebieden (humane wetenschappen, wetenschap en technologie, en biomedische wetenschappen). Een uitgebreide bespreking van de gegevens is weergegeven in Deel 1 van het rapport.
4
Figuur 2: Aandeel internationale bachelor-, master- en doctoraatsstudenten (gemeten volgens nationaliteit) in het Vlaams hoger onderwijs en uitsplitsing naar EU en niet-EU (Bron: Ministerie van Onderwijs en Vorming, 2020)
0 10 20 30 40 50 60 70 2008-2009 2009-2010 2010-2011 2011-2012 2012-2013 2013-2014 2014-2015 2015-2016 2016-2017 2017-2018 2018-2019 % % niet-Belg in Vlaams HO % niet-Belg uit EU % niet-Belg uit niet-EU
2. De monetaire voordelen van internationalisering in het hoger onderwijs
Er is een brede consensus onder arbeidsmarkteconomen dat hooggeschoolde migratie gunstig is voor de economie (Kahanec en Zimmermann, 2011; Kahanec en Kralikova, 2011). Internationale studentenstromen vormen een belangrijk kanaal waarlangs hooggeschoolde migratie plaatsvindt, en is in het bijzonder aantrekkelijk door het hoge potentieel aan integratie van de hooggeschoolde studenten (Chiswick en Miller, 2012).
In het onderzoek gaan we in op de economische gevolgen van internationalisering in het hoger onderwijs. We bespreken de directe en indirecte effecten van internationalisering vanuit het perspectief van buitenlandse studenten die naar Vlaanderen komen. We brengen daartoe in eerste instantie de omvang en samenstelling van de inkomende studentenstromen in kaart. Om het economisch effect te kunnen inschatten, moet onder meer bestudeerd worden in welke wetenschapsgebieden de instroom zich voornamelijk situeert.
In dit perspectief is Figuur 3 interessant. Ze geeft aan hoe de internationale studenten, ingeschreven in het hoger onderwijs in 2017 (data van OESO, 2019), verdeeld zijn over de verschillende wetenschapsgebieden. De figuur toont dat de samenstelling van de internationale instroom sterk verschilt van land tot land, en dus ookvoor Vlaanderenvan dichterbij bestudeerd zal moeten worden. Specifiek voor België stellen we vast dat het aandeel STEM-studenten (in figuur 3 vormen deze ‘natural sciences, mathematics and statistics’, ‘engineering, manufacturing and construction’; ‘information and communication technologies’) in de internationale instroom relatief beperkt is.
Education
Social sciences, journalism and information
Natural sciences, mathematics and statistics
Engineering, manufacturing and construction
Arts and humanities
Business, administration and law
Information and Communication Technologies
Agriculture, forestry, fisheries and veterinary
Health and welfare Services
5
0% 20% 40% 60% 80% 100% Australia Belgium Canada France Germany Netherlands United Kingdom United States
Figuur 3: Internationale studenten ingeschreven in het hoger onderwijs (data 2017; bron OESO, 2019)
Het Nederlandse Centraal Planbureau gaf in een rapport aan dat er “overwegend positieve economische effecten zijn, zoals een betere allocatie van studenten, meer concurrentie tussen onderwijsinstellingen, kennisspillovers en een mogelijke versterking van handelsrelaties” (CPB, 2012, p. 3). Maar wat opgaat voor Nederland, hoeft niet noodzakelijk te gelden voor Vlaanderen. Of internationale studentenmobiliteit al dan niet bijdraagt aan de welvaart is afhankelijk van meerdere factoren. Ten eerste is het van belang dat er een netto-instroomsaldo is en geen brain drain in de andere richting. Ten tweede is de kwaliteit van de internationale studenten van tel. In de mate dat internationale studenten betere diplomarendementen laten optekenen dan de Vlaamse, kan er sprake zijn van een positief effect. Ten derde hangt het effect af van de blijfkans. Dit is de kans dat een buitenlandse student in het land van studie blijft werken en hier dus bijdraagt aan het bruto binnenlands product (BBP). Op elk van deze drie criteria kunnen de prestaties in Vlaanderen anders liggen dan in het buitenland
In de studie kwantificeren we de kosten en baten voor Vlaanderen. Daarbij krijgen de drie hoger vermelde factoren – het netto-instroomsaldo, de blijfkans, het rendementsverschil – bijzondere aandacht. Ook de kosten en baten voor de overheidsfinanciering worden berekend. We maken een onderscheid tussen de kosten en baten tijdens de studietijd (bv. directe kosten in studiefinanciering (afhankelijk van EU of niet-EU instroom), consumptie tijdens de studie), en na de studietijd (bv. beroep op sociale uitkeringen, belastingen). Tot slot duiden we ook de mogelijke spillovereffecten op andere studenten. Hieronder vallen effecten zoals internationalisering ‘at home’ wat een invloed kan hebben op het diplomarendement van de Vlaamse studenten. We maken in de studie gebruik van diverse databestanden. We combineren gegevens van de OESO, Departement Onderwijs en Vorming, Toerisme Vlaanderen en Vacature.com, met microdatabestanden uit de Kruispuntbank voor Sociale Zekerheid, het huishoudbudgetonderzoek en de gegevens van de Associatie KU Leuven. Een uitgebreide analyse en beschrijving van de onderliggende gegevens is weergegeven in Deel 2 van het rapport.
3. Resultaten
De resultaten wijzen op een netto positief effect van internationalisering, met directe baten die 2,6 tot 3,3keerdekosten overstijgen Weobserverenookeensterkverschil tussendebaten-kostenratio’s voor de respectievelijke opleidingsniveaus, waarbij de mate waarin de voordelen de kosten overstijgen beduidend groter is voor internationale bachelor- en masterstudenten dan voor doctoraatsstudenten. De resultaten wijzen op een bijdrage van internationale studenten aan de economie met een factor tussen € 3.072 miljoen en € 4.408 miljoen, wat een netto bijdrage betekent van €465 - €613 per inwoner in Vlaanderen. Een soortgelijk onderzoek uitgevoerd door het Institute of International Education (2019) in de VS meldde een netto bijdrage van $41 miljard aan internationale studenten in 2018/19, of bijna €116 per inwoner, wat lager is dan het geschatte effect in Vlaanderen.
Onze bevindingen bevestigen de relevantie van de impact van internationale studenten op de economie, hoewel er een aantal overwegingen zijn. In de eerste plaats wordt het grootste deel van
6
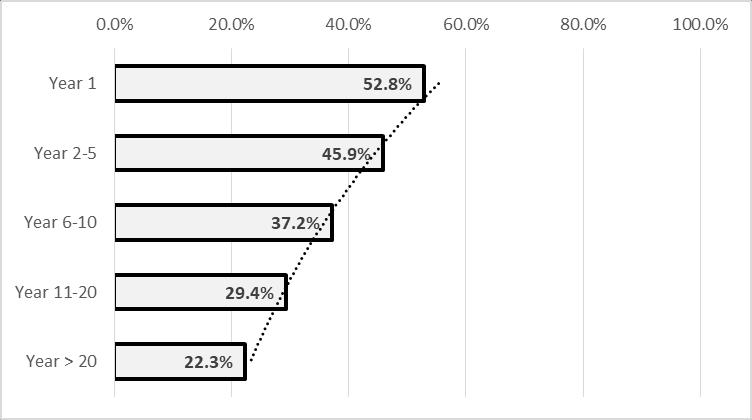
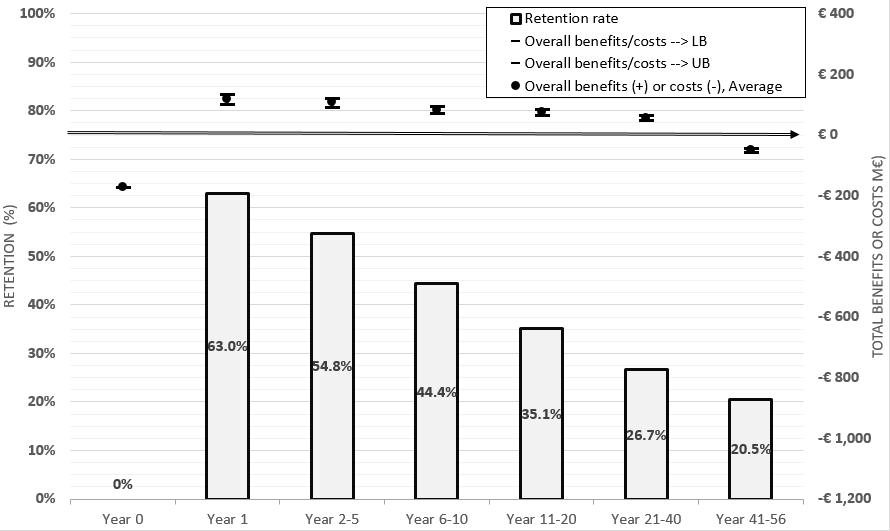
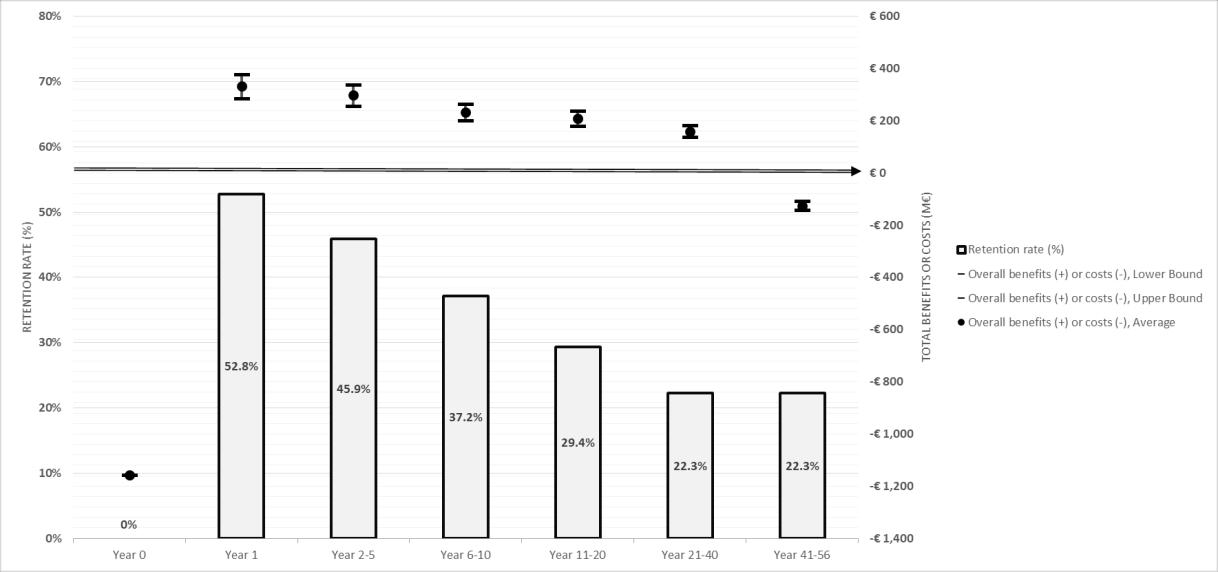
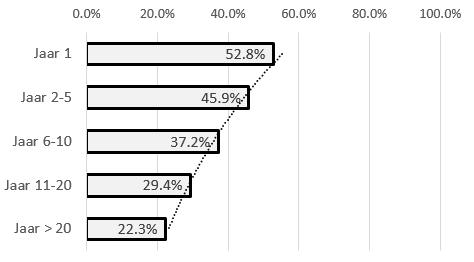
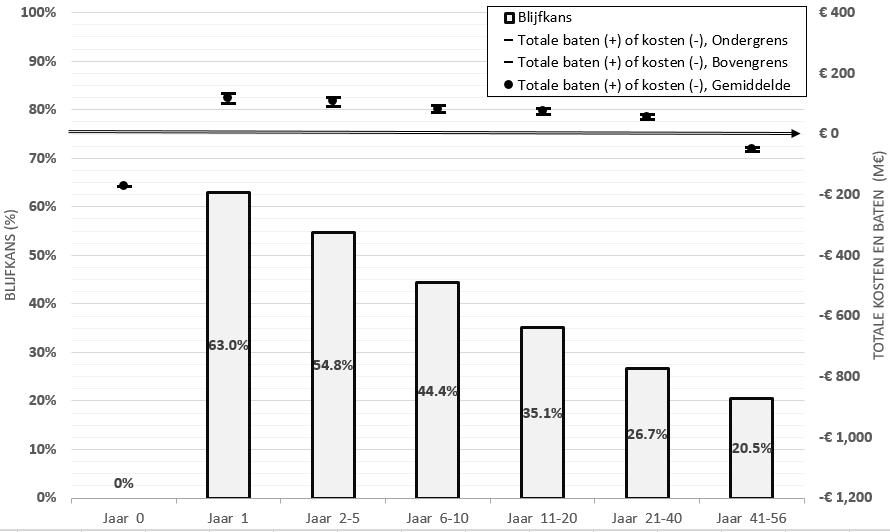
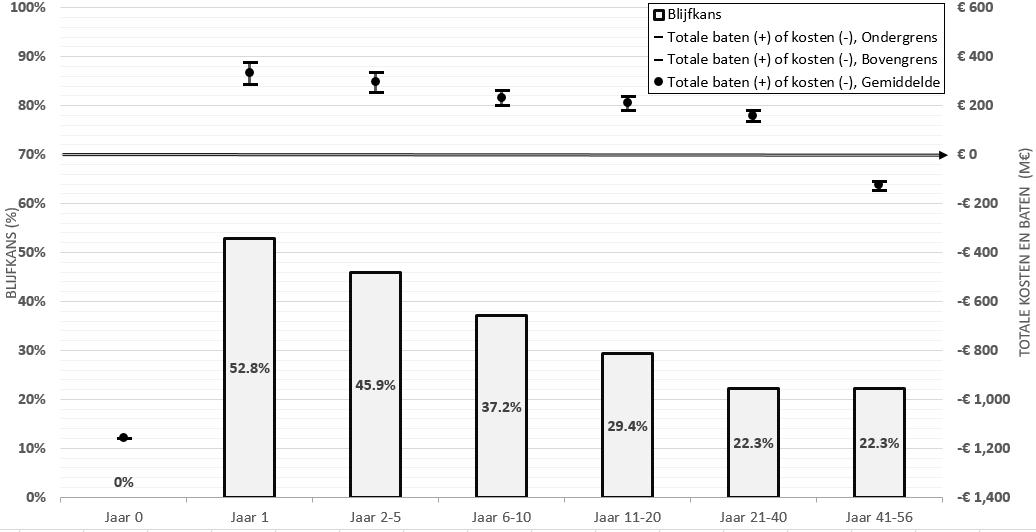
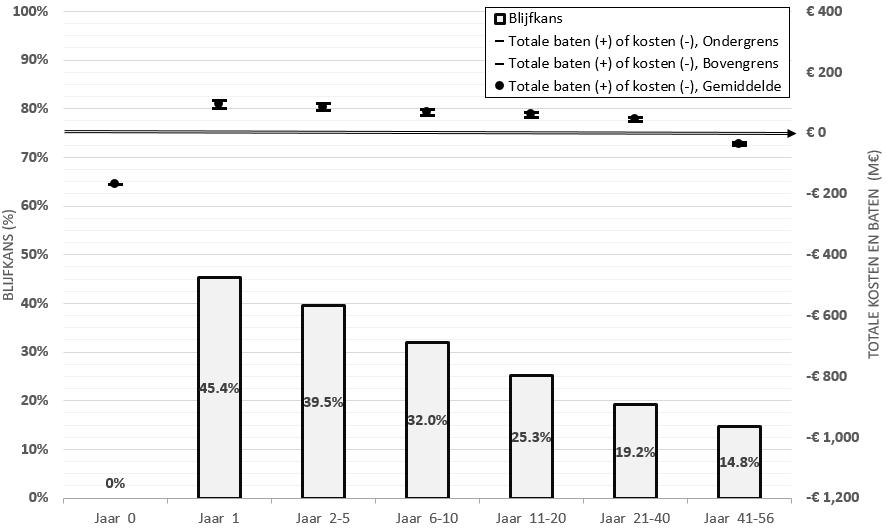
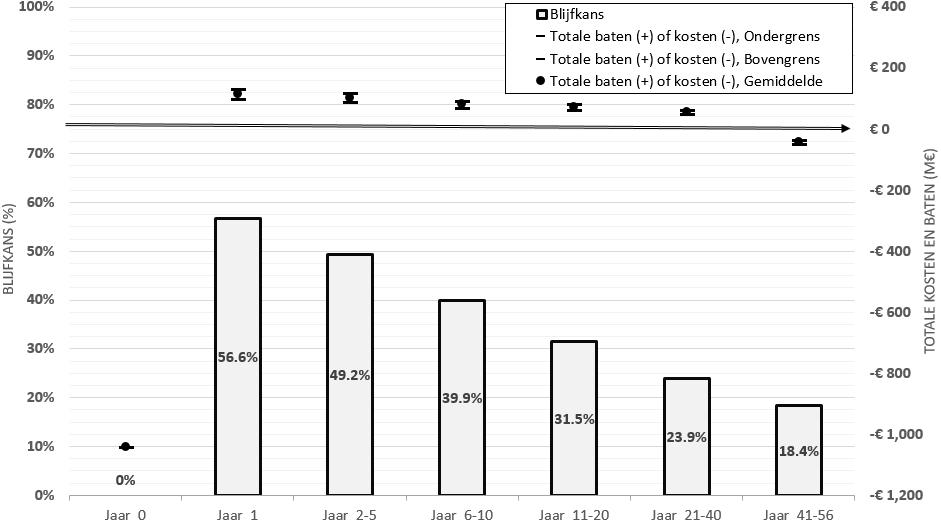
het effect bepaald door de langetermijnimpact van internationale studenten op de economie. We observeren immers een hoge blijfkans, die 1 jaar na het afstuderen gelijk is aan 52,8% van de afgestudeerde internationale studenten. Zoals weergegeven in Figuur 4 blijft ongeveer 45,9% van de internationale studenten 2 tot 5 jaar in Vlaanderen, 37,2% blijft 6 tot 10 jaar, 29,4% blijft tussen de 11 en 20 jaar, terwijl ongeveer 22,3% van de internationale studenten nog langer blijft. De hoge blijfkans is op zich een interessante vaststelling. Een recente Nederlandse studie rapporteert een blijfkans variërend van 36% tot 42% gemeten vijf jaar na het afstuderen (Nuffic, 2017), terwijl de cijfers variëren tussen 3% en 64% voor het Verenigd Koninkrijk (Weisser, 2016). Specifiek voor doctoraatsstudenten stelt Nederlands onderzoek een blijfkans na 10 jaar vast van 32% (Centraal Planbureau, 2015). Zoals weergegeven in Figuren 5b, 5c en 5d varieert de blijfkans ook in Vlaanderen volgens het opleidingsniveau. We observeren hogere blijfkansen voor bachelors en doctoraatsstudenten dan voor masters
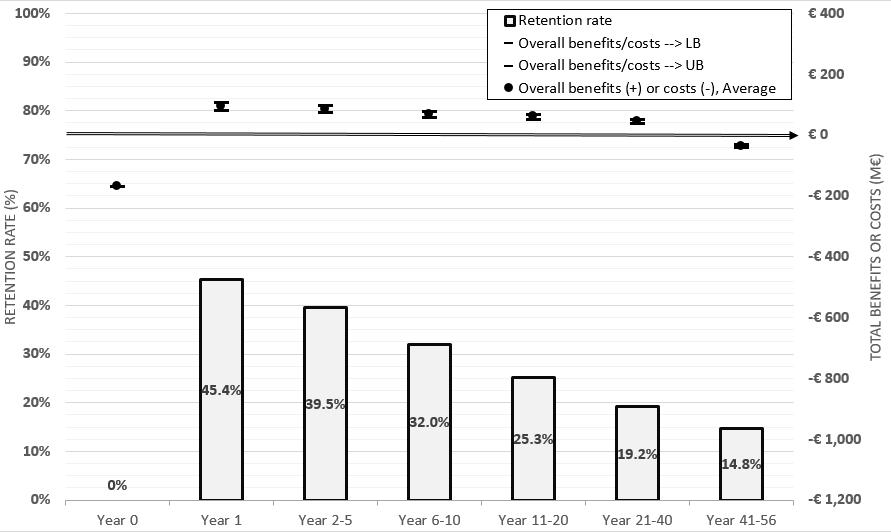
Ten tweede observeren we dat tijdens de studies de nettokosten hoger zijn dan de baten, maar nadien de baten snel de overhand nemen. Zoals weergegeven in Figuur 5a observeren we tijdens de studies (jaar 0) een geaggregeerd nettoverlies van bijna €1,158 miljoen wanneer bachelor-, master- en doctoraatsstudenten worden geaggregeerd. Al een jaar na afstuderen zijn de globale baten positief (€ 332 miljoen), vanwege de belastingen op arbeid Rekeninghoudend met degemiddeldeblijfkans van internationale studenten observen we dat de terugverdientijd voor internationale bachelor-, masteren doctoraatsstudenten gemiddeld bijna vier jaar bedraagt. Met andere woorden, gegeven de huidige blijfkans worden de maatschappelijke kosten voor internationale studenten na 4 jaar terugverdiend. Als we vervolgens inzoomen op de bachelorstudenten observeren we in Figuur 5b dat de geschatte kosten van €171 miljoen, gegeven de hoge blijfkans van 63% in het eerste jaar, in minder dan twee jaar terugverdiend zijn. Ook bij masterstudenten (Figuur 5c) worden de geschatte kosten van €167 miljoen in bijna twee jaar terug verdiend. Door de studiebeurs die doctoraatsstudenten ontvangen, loopt de terugverdientijd op tot 14 jaar (Figuur 5d)
7
Figuur 4: Geschatte blijfkans van internationale studenten in Vlaanderen
Ten derde blijven, zolang de internationale studenten wonen en werken in Vlaanderen, de jaarlijkse baten positief. Zodra de pensioenleeftijd ingaat, worden, net zoals bij de Vlaamse studenten, de jaarlijkse baten terug negatief.
8
Figuur 5a: Blijfkans, en de baten en kosten van internationalisering overheen de tijd voor zowel bachelors, masters als doctoraatsstudenten.
Figuur 5b: Blijfkans, en de baten en kosten van internationalisering overheen de tijd voor bachelorstudenten.
9
Figuur 5c: Blijfkans, en de baten en kosten van internationalisering overheen de tijd voor masterstudenten.
Figuur 5d: Blijfkans, en de baten en kosten van internationalisering overheen de tijd voor doctoraatsstudenten.
De resultaten verschillen naar nationaliteit en opleidingsniveau van internationale studenten. De meest positieve baten-kostenratio's komen naar voren voor studenten uit buurlanden (de baten bedragen er 5,1 tot 5,6 keer de kosten) en voor studenten die een bachelor- (basten-kostenratio van 4,7 – 6,1) of masteropleiding (4,1 – 5,2) volgen. Het eerste resultaat wordt veroorzaakt door de hogere blijfkans voor studenten uit buurlanden ten opzichte van niet-Europese studenten. Het tweede resultaat wordt beïnvloed door de lagere onderwijskosten vanwege de kortere duur van studies voor masterstudenten, en door een hoge blijfkans voor bachelorstudenten. Studenten in doctoraatsopleidingen ontvangen een studiebeurs wat hun lage baten-kostenverhouding verklaart. Let wel, in deze analyse negeren we de spillover van internationalisering in doctoraatsopleidingen in termen van onderzoek(soutput) en mogelijke innovatiebijdrage, die wellicht heel substantieel is. Bovendien is de krapte op de Vlaamse arbeidsmarkt zo scherp, zeker in dit erg hooggeschoolde segment, dat internationale instroom hoogst noodzakelijk is om het Vlaamse onderzoek op niveau te houden.
Bij het analyseren van de resultaten per wetenschapsgebied is de baten-kostenverhouding het hoogst voor studenten in biomedische disciplines (3,0 – 3,9), gevolgd door humane wetenschappen (2,7
3,4) en STEM (2,5 – 3,9) De hoogste baten-kostenverhouding observeren we voor biomedische disciplines, al trekt dit wetenschapsgebied slechts een minderheid (12,5%) van de internationale studenten aan. De laagste, desalniettemin nog steeds sterk positieve, baten-kostenverhouding wordt waargenomen voor STEM-disciplines. In STEM-disciplines is de blijfkans het laagst, wat intuïtief te verklaren valt doordat STEM een prioriteit is van veel landen en zo het speerpunt vormt in de internationale war for talent Bovendien observeren we dat 60% van de internationale studenten in STEM-richtingen niet uit de EU komen, en dat dus ook het toelatingsbeleid een invloed kan hebben op de blijfkans Om de baten-kostenverhouding te verbeteren moet ook de blijfkans verhoogd worden Dit is vooral relevant in een context waarin meer STEM-afgestudeerden bijzonder gunstig is voor innovatie en ondernemerschap (VARIO, 2017).
Tabel 1. Verschillen in blijfkans en baten-kosten-verhouding naar nationaliteit, onderwijsniveau en wetenschapsgebied
Aandeel van de internationale studenten Blijfkans na 1 jaar Baten-kosten verhouding
10
–
Panel A. Naar nationaliteit Buurlanden 36,1% 64,9% 5,1-5,6 Andere EU landen 10,5% 60,4% 4,8-5,2 Europe extra-EU 1,6% 51,7% 4,2-4,5 Rest van de wereld 51,8% 38,4% 3,2-3,5 Panel B. Naar onderwijsniveau Bacheloropleiding 34,8% 63,0% 4,7-6,1 Masteropleiding 33,6% 45,4% 4,1-5,2 Doctoraatsopleiding 31,5% 56,6% 1,4-1,8 Panel C. Naar wetenschapsgebied Humane wetenschappen 62,50% 55,9% 2,7-3,4 Wetenschap en technologie (STEM) 24,50% 48,1% 2,5-3,1 Biomedische wetenschappen 12,50% 60,1% 3,0-3,9
De studie gaat ook in op de indirecte effecten van internationalisering van het hoger onderwijs, en in het bijzonder op ‘Internationalisation at home’. Op basis van longitudinale data van de Associatie KU Leuven schatten we in welke mate een groter aandeel internationale studenten leidt tot betere studieresultaten van master- en master-na-masterstudenten. In het bijzonder kijken we naar de variatie in aandeel internationale studenten binnen een opleiding en corrigeren we voor diverse controlevariabelen. In het algemeen wijzen de resultaten niet op positieve, noch negatieve invloeden van internationalisering op de studieduur, het diplomagemiddelde, het studiesucces en de studieuitval. De resultaten kunnen te wijten zijn aan het feit dat dergelijke ‘peer-effecten’ niet detecteerbaar zijn alseenimpact op"harde" onderwijsuitkomsten, zoalsstudieduur enpunten,terwijl deinvloedzichtbaar kanzijnop demeer"zachte"aspecten zoalshetklasklimaatende betrokkenheid. Zoals gesuggereerd door de Nederlandse Inspectie van het Onderwijs (2019), zijn internationale studenten mogelijk ook onvoldoende geïntegreerd in het internationale klaslokaal.
4. Beleidsaanbevelingen
De bevindingen benadrukken de relevantie van internationalisering van het hoger onderwijs als een strategischaandachtspunt,in overeenstemming met dewereldwijdeaandacht voorhet fenomeen Ter illustratie wijzen we op de nieuwe strategische visie op onderwijs van het Britse ministerie van Onderwijs en Internationale Handel (2019). Deze wil het totale aantal internationale studenten verhogen van 460 000 in 2018/19 tot 600 000 in 2030. Internationalisering wordt in het buitenland dan ook geïnterpreteerd als een kans voor de toekomst van het hoger onderwijs (Nederlands Ministerie van Onderwijs, 2019), terwijl de mogelijke ‘brain gain’ centraal staat in de wereldwijde strijd om talent (Haupt et al., 2016).
Op basis van de huidige studie kunnen we een aantal beleidsimplicaties afleiden. Ten eerste zouden beleidsmakers, gezien de aanzienlijke voordelen van internationalisering in het hoger onderwijs, de trend in internationalisering nauwgezet moeten opvolgen op basis van een aantal indicatoren In Tabel 2 wordt een dashboard gegeven met voor elke voorgestelde indicator de definitie, het aggregatieniveau, de gegevensbron, de internationale vergelijkbaarheid en de specifieke verwijzing naar het gedeelte van het onderzoek waarin die gegevens worden besproken Gezien de verschillen die worden waargenomen in de directe effecten naar nationaliteit, opleidingsniveau en studiegebied, moeten de meeste indicatoren zowel als geaggregeerde indicatoren als via uitgesplitste indicatoren worden berekend op basis van nationaliteit, opleidingsniveau en studiegebied. De indicatoren verwijzen naar het aantal internationale studenten en hun percentage in de totale studentenpopulatie, evenals naar de blijfkans na één of vier jaar na afstuderen. Deze laatste dimensie moet zorgvuldig bewaakt worden, omdat deze sterk de baten-kostenverhouding beïnvloedt. Bovendien valt daarom aan te bevelen om hier ook meer nauwkeurige indicatoren (bv via micro-databestanden) voor te ontwikkelen
11
Tabel 2: Indicatoren
Indicator Definitie Niveau Databron Internationaal vergelijkbaar
Uitleg berekening in de studie
Het absolute aantal internationale studenten in het hoger onderwijs
Aantal studenten in het hoger onderwijs dat hun land van herkomst heeft verlaten en naar een ander land is verhuisd om te studeren, waar het land van herkomst dat van het secundair onderwijs was
Algemeen
Naar nationaliteit
Naar onderwijsnivea u
Naar studiegebied
Vlaams Ministerie van Onderwijs en Vorming x
Kruispuntbank van de Sociale Zekerheid (KSZ) x
Vlaams Ministerie van Onderwijs en Vorming x
KSZ en Ministerie van Onderwijs en Vorming x
Deel 2Appendix A.1.a
Het percentage internationale studenten in de totale studentenpopulat ie
Percentage studenten dat is ingeschreven voor het hoger onderwijs dat hun secundair onderwijs in het buitenland heeft gevolgd, ten opzichte van het totale aantal studenten dat is ingeschreven voor het hoger onderwijs
Algemeen
Naar nationaliteit
Naar onderwijsnivea u
Naar studiegebied
Vlaams Ministerie van Onderwijs en Vorming x
Kruispuntbank van de Sociale Zekerheid (KSZ) x
Vlaams Ministerie van Onderwijs en Vorming x
KSZ en Ministerie van Onderwijs en Vorming x
Deel 2Appendix A.1.a
Aandeel
internationale studenten volgens nationaliteit, onderwijsniveau, studiegebied
Studieduur van internationale studenten
Verdeling van het aandeel internationale studenten over het totale aantal internationale studenten, naar specifieke kenmerken
Aantal jaren in het Vlaams hoger onderwijs door internationale studenten
Naar nationaliteit
Naar onderwijsnivea u
Kruispuntbank van de Sociale Zekerheid (KSZ) x
Vlaams Ministerie van Onderwijs en Vorming x
Naar studiegebied KSZ en Ministerie van Onderwijs en Vorming x
Algemeen Gegevens Associaties hoger onderwijs
Deel 2Hoofdstuk 6.2
Deel 2Appendix A.1.a Naar onderwijsnivea u
Blijfkans één jaar na afstuderen
Percentage internationale studenten dat één jaar na het afstuderen nog in het land verblijft, over het totale aantal internationale studenten
Algemeen
Naar nationaliteit Naar onderwijsnivea u
Naar studiegebied
Kruispuntbank van de Sociale Zekerheid (KSZ)
Deel 2Appendix A.3
Blijfkans vier jaar na afstuderen
Percentage internationale studenten dat vier jaar na hun afstuderen nog in het land verblijft, over het totale aantal internationale studenten
Algemeen
Naar nationaliteit
Naar onderwijsnivea u
Naar studiegebied
Kruispuntbank van de Sociale Zekerheid en DIOC database
Deel 2Appendix A.3
12
x
x
Ten tweede wijst deze studie op de relevantie van een voldoende omvangrijk aanbod van anderstalig hoger onderwijs. Momenteel ontbreekt een debat ten gronde over internationalisering van het hoger onderwijs vanuit een vrees voor ‘verengelsing’. Maar verengelsing is niet echt aan de orde in Vlaanderen. In Vlaanderen heeft elke student de kans om een nagenoeg volledig Nederlandstalig bachelorprogramma te volgen en zo een academisch fundament te creëren in de moedertaal. Er zijn in Vlaanderen bovendien strikte regels, zowel wat het aandeel programma’s betreft dat in een andere taal gedoceerd mag worden als inzake het aandeel studiepunten dat binnen een Nederlandstalig programma in een andere taal gedoceerd mag worden. Gegeven de geobserveerde positieve effecten van internationalisering, ondersteunt dit rapport de vraag uit het hoger onderwijs om versoepeling van deze drempels. In Onderwijsdecreet XXX (artikel 96) staat een bescheiden uitbreiding van het aandeel anderstalige bacheloropleidingen ingeschreven, namelijk van 6 naar 9 procent. Dat is een stap in de goede richting. Zulke uitbreiding heeft overigens nauwelijks impact op de Vlaamse studenten. Anderstalige academische bacheloropleidingen trekken immers overwegend internationale studenten aan. Ze worden gebruikt om Vlaamse speerpuntdomeinen te openen voor de wereld, om de zonen en dochters van expats hier te kunnen verwelkomen, om de talenten die onze arbeidsmarkt zo hard nodigheeft aan tetrekken. Dit rapport wijst in elkgeval uit dat een geleidelijke, voorzichtige uitbreiding van het anderstalig aanbod aanzienlijke economische baten oplevert, en dit in elk van de wetenschapsgebieden en op alle niveaus van academisch hoger onderwijs. Willen we Vlaanderen internationaal nog krachtiger op de kaart zetten, dan vraagt dit ook een internationaal competitieve wetenschappelijke basis. Dat kan niet zonder een substantieel internationaal gericht onderwijsaanbod in een, ook in de toekomst, overwegend Nederlandstalig hoger onderwijs.
Een derde groep van beleidsimplicaties focust op de blijfkans. Deze is bijzonder relevant aangezien het internationaliseringsproces van het hoger onderwijs niet per se netto voordelen oplevert, maar alleen als studenten na afstuderen ook in Vlaanderen blijven. Daarom moet het beleid erop gericht zijn de al vrij hoge blijfkansen verder te verhogen, zodat ook de voordelen van internationalisering gemaximaliseerd worden. Op basis van onze resultaten wegen de netto voordelen op tegen de kosten vanaf vier jaar na afstuderen, al is dit voor bachelor- en masterstudenten minder dan 2 jaar. Bovendien is het debat over de mogelijkheid om internationale studenten te behouden nauw verbonden met de beschikbaarheid van visa en vergunningen om in het land te blijven, vooral voor studenten van buiten de EU (Han et al., 2015). Daarom kan een beleid gericht op kennismigratie een grote invloed hebben op het effect van internationalisering en moet het immigratiebeleid zo worden ontworpen dat het rekening houdt met de specificiteit van deze categorie studenten (zie ook Vlaamse Interuniversitaire Raad, 2019). Internationale studenten laten immers toe dat er voldoende goede profielen kunnen worden aangetrokken voor hooggekwalificeerde beroepen met een knelpunt op de arbeidsmarkt. De analyse in de huidige studie vult de bevindingen van het VARIO-rapport ‘Internationaal toptalent aantrekken en verankeren’ verder aan en versterkt de onderbouwing van de bijhorende VARIO-beleidsaanbevelingen die het belang van een geïntegreerde aanpak benadrukken.
Een vierde groep van beleidsaanbevelingen komt voort uit de ‘brain drain’ die kennismigratie kan veroorzaken in andere landen. De brain drain kan in zendende landen immers voor een dalende aantrekkelijkheid van hun hogeronderwijsstelsel zorgen (of een gevolg zijn van te lage kwaliteit en aantrekkelijkheid), evenals voor schade op de arbeidsmarkt door een gebrek aan hoogopgeleide
13
werkenden (Docquier & Rapoport, 2012). Internationalisering is gedeeltelijk gunstig voor een reeks grote, middeninkomen ontwikkelende economieën (Docquier, 2014). De strijd om talent zorgt voor toenemende wereldwijde concurrentie, waarbij gastlanden concurreren om de meest begaafde talenten aan te trekken en na hun afstuderen te behouden, terwijl de zendende landen proberen de studenten na hun opleiding te laten terugkeren naar hun thuisland (Haupt et al., 2016). In dit opzicht wordt hoger onderwijs intoenemende mate gezien als een exportproduct voor gastlanden. Hoe groter de instroom en blijfkans van internationale studenten, hoe groter de voordelen. Uit de universitaire ontwikkelingssamenwerking weten we overigens dat de terugkeerkans van in Vlaanderen opgeleide doctorandi uit Zuidlanden hoog is. Dat is specifiek voor dit segment van groot belang, omdat deze terugkeerbeweging toelaat om in het Zuiden academische capaciteit op te bouwen.
Ten vijfde kan er ook in gastlanden een concurrentie op de arbeidsmarkt ontstaan tussen internationale en autochtone afgestudeerden. Zoals echter aangetoond door Kahanec en Králiková (2011) komt "hooggeschoolde immigratie ook ten goede aan de laaggeschoolde autochtone beroepsbevolkingenkan, maar hoeft ze het hooggeschooldeautochtone werknemers nietteschaden" (p. 3). Hoogopgeleide immigratie blijkt inderdaad een herverdelingseffect te hebben (Kahanec en Zimmermann, 2008), maar het kan ook de concurrentie om hoogopgeleide banen beïnvloeden, wat leidt tot dubbelzinnige effecten. Beleidsmakers moeten het brede publiek daarom informeren over de relevantie, het belang en de toegevoegde waarde van internationalisering in het hoger onderwijs.
Referenties
Bijwaard, G. E. (2010). Immigrant migration dynamics model for The Netherlands. Journal of Population Economics, 23(4), 1213-1247.
Britse ministerie van Onderwijs en Internationale Handel (2019). International Education Strategy: global potential, global growth. London.
Caruso,R.,&DeWit,H.(2015).DeterminantsofmobilityofstudentsinEurope: Empirical evidence for the period 1998-2009. Journal of Studies in International Education, 19(3), 265-282.
Centraal Planbureau. (2012). De economische effecten van internationalisering in het hoger onderwijs CPB Notitie.
Centraal Planbureau. (2015). Stay rates of foreign PhD graduates in the Netherlands. CPB Rapport. Pp. 34.
Chiswick, B. R., & Miller, P. W. (2012). Negative and positive assimilation, skill transferability, and linguistic distance. Journal of Human Capital, 6(1), 35-55.
De Villé, P., Martou, F., & Vandenberghe, V. (1996). Cost-benefit analysis and regulatory issues of student mobility in the EU. European Journal of Education, 31(2), 205-222.
Demange, G., & Fenge, R. (2010). Competition in the quality of higher education: the impact of students' mobility.
Docquier,F.(2014).Thebraindrainfromdevelopingcountries:Thebraindrainproducesmanymore losers than winners in developing countries. IZA World of Labor, 31, 1-10.
Docquier, F., & Rapoport, H. (2012). Globalization, brain drain, and development. Journal of Economic Literature, 50(3), 681-730.
Felbermayr, G. J., & Reczkowski, I. (2012). International student mobility and high-skilled migration: the evidence. Ifo Working Paper 132
14
González, C. R., Mesanza, R. B., & Mariel, P. (2011). The determinants of international student mobility flows: an empirical study on the Erasmus programme. Higher Education, 62(4), 413430.
Han, X., Stocking, G., Gebbie, M. A., & Appelbaum, R. P. (2015). Will they stay or will they go? International graduate students and their decisions to stay or leave the US upon graduation. PloS one, 10(3), e0118183.
Haupt, A., Krieger, T., & Lange, T. (2016). Competition for the international pool of talent. Journal of Population Economics, 29(4), 1113-1154.
Inspectie van het Onderwijs. (2019). Internationalisering en de toegankelijkheid van het hoger onderwijs voor Nederlandse studenten. Pp. 70.
Institute of International Education. (2019). Open Doors 2019. Washington, DC: U.S. Institute of Peace.
Kahanec, M. and Zimmermann, K. F. (2008). Migration, the Quality of the Labour Force and Economic Inequality. IZA Discussion Paper No. 3560, Bonn: Institute for the Study of Labor.
Kahanec, M., & Králiková, R. (2011). Pulls of international student mobility. IZA Discussion paper n. 6233. Bonn: Institute for the Study of Labor.
Knight, J. (2013). The changing landscape of higher education internationalisation–for better or worse?. Perspectives: Policy and practice in higher education, 17(3), 84-90.
London Economics. (2018). The costs and benefits of international students by parliamentary constituency. Retrieved from https://www.hepi.ac.uk/category/publications/ Opgehaald oktober 2019.
Ministerie van Onderwijs en Vorming (2020). Dataloep – Inschrijvingen hoger onderwijs. dataloeppubliek.vlaanderen.be. Opgehaald februari 2020.
Naidoo, V. (2007). Research on the flow of international students to UK universities: Determinants and implications. Journal of Research in International Education, 6(3), 287-307.
Nederlands Ministrie van Onderwijs (2019). Discussienotitie hoger onderwijs en onderzoek: trends en strategische vragen. Den Haag.
Nederlandse Inspectie van het Onderwijs. (2019). Internationalisering en de toegankelijkheid van het hoger onderwijs voor Nederlandse studenten. Pp. 70.
OESO (2018). Education at a Glance 2018: OECD Indicators. OECD Publishing, Paris.
OESO (2019). Education at a Glance 2019. OECD indicators. Paris: OECD Publishing.
OESO (2020). OECD data. https://data.oecd.org/students/international-student-mobility.htm. Opgehaald februari 2020.
Throsby, C. D. (1991). The financial impact of foreign student enrolments. Higher Education, 21(3), 351-358.
Throsby, D. (1998). Financing and Effects of Internationalisation in Higher Education. The Economic Costs and Benefits of International Student Flows. Paris: OECD-CERI.
VARIO – Vlaamse Adviesraad voor Innoveren & Ondernemen. (2017). Internationaal Toptalent Aantrekken En Verankeren. Advies Nr 1. Retrieved from https://www.vlaanderen.be/nl/publicaties
Vlaamse Interuniversitaire Raad (2019). Ruim baan voor kennismigratie uit derde landen. Retrieved from https://vlir.be/wp-content/.
Weisser, R. (2016). Internationally mobile students and their post-graduation migratory: An analysis of determinants of student mobility and retention rates in the EU. OECD Social, Employment and Migration Working Papers, No. 186, OECD Publishing, Paris.
Zhang, L. C., Worthington, A. C., & Hu, M. (2017). Cost economies in the provision of higher education for international students: Australian evidence. Higher Education, 74(4), 717-734.
15
1. Introduction
Thenumberofstudentsmovingtoadifferentcountrywiththepurposeofstudyinghasgrownsteadily and represents a significant proportion of the student body in a number of countries (Knight, 2013). The European Economic Area (EEA) attracts almost half (as estimated approximately 45% in 2017) of the entire number of international students (OECD, 2019a). However, the increasing pressure on education budgets and the use of migration targets that include international students results in increased awareness of the costs of internationalisation. The paper contributes to this debate by exploiting various sources of administrative microdata to provide a comprehensive cost-benefit analysis of internationalisation in higher education. In particular, it answers the following research question: from the perspective of the national economy, what are the monetary benefits of internationalisation in higher education?
Thispaperisthefirsttoreport andutilizea unique combination of micro-administrativedata, survey data as well as regional expenditures. The methodology relies on a composite framework, by which the benefits and costs associated with public spending, social expenditure and consumption of goods are assessed, in addition to the induced effects such as student-related tourism. Moreover, the long-term impact of internationalisation is examined by building a proxy for the estimation of internationalstudents’retentionrateaftergraduationandtheirsubsequentcontributiontothenational economy. The heterogeneity of results by students’ nationality, level of education attained and field of study is explored. Further, the indirect effects of the presence of international students in the classroom are analysed by estimating the peer-effect that internationalisation may drive. The study focuses on internationalisation in both universities and university colleges.
We demonstrate that incoming international students generate net costs while in education, however, the national economy benefits from their presence in the long run, depending on the share of international students retained after graduation. Hence, the findings of the study suggest a net positive impact of internationalisation, as direct benefits are a factor of 2.6 to 3.3 of the costs.3 This average hidesconsiderableheterogeneityas the ratio between benefits and costs ranges between 1.39 – 1.78 for doctoral students, while it is equal to 4.73 – 6.06 for bachelor students. In between, international master students report benefits equal to 4.05 – 5.16 times the costs. Together with the level of education, the retention rates and costs differ, which explains the large variation in benefitcost ratios.
24
3 The uncertainty in the benefit-cost ratio is driven by the graduation rate of international students.
Following earlier literature (Rumbley, 2012; OECD, 2018a, Inspectie van het Onderwijs, 2019), international students are characterized in the present paper as “those who left their country of origin and moved to another country for the purpose of studying”, where the country of origin was that ofsecondaryeducation.Theearlierliteratureonthetopichasmainlyfocusedonthedeterminants of this phenomenon by modelling economic factors, such as overall economic performance and education costs, and by considering non-economic factors such as the political stability or cultural and language proximity (Naidoo, 2007; González et al., 2011; Kahanec & Králiková, 2011; Caruso, & De Wit, 2015; OECD, 2018a). Part of the literature also paid attention to the impact that foreign students have on the stock of high-skilled workers, and subsequently, found positive evidence for increased internationalisation, however, it was highly dependent on the degree of return migration (Demange & Fenge, 2010; Felbermayr & Reczkowski, 2012; Lange, 2013). In addition, a more restricted body of literature focused on the input processes and discussed, for instance, how internationalisation modified the cost structure of institutions (Zhang et al., 2017). Over time, academics discussed the most comprehensive way to assess costs and revenues generated by the presenceofinternational students, bymeans ofcost-benefit analyses at institutional or national levels (Throsby, 1991; 1998; DeVillé et al., 1996). Recently, policy reports have quantitatively contributed to this discussion by analysing the costs and benefits in national contexts such as the Netherlands (Centraal Planbureau, 2012, Inspectie van het Onderwijs, 2019) and the UK (London Economics, 2018).
This paper focuses on Belgium in general, and its Dutch-speaking Flemish region in particular. The reasons are threefold. The primary reason is that the Flemish higher education system is highly international, such that our estimates can be considered as upper bounds for the impact of internationalisation in other countries. About 12% of the entire student population has an international background in 2016, and their share increased by 37% from 2013 to 2016, despite a reduction in 2017 (OECD, 2018a; 2019a). Second, the upper bound estimates are further reinforced as Belgium is a net receiving country. For each Belgian student studying abroad, around four international students select the country for their studies (OECD, 2018a). Hence, the possibility of a braindrainatthenational level ishighlyunlikely,whilethepoint ofassessingtheimpact ofincoming students – on whom this study focuses – is particularly urgent. Third, using the Belgian case, we can exploit micro-data from various sources such that a more comprehensive picture can arise. Given these premises, the results of the paper at hand have significant policy implications for other national and supranational authorities.
25
The article is organised as follows: Section 2 presents a review of the literature to which we contribute. Section 3 provides a theoretical framework to study internationalization. Section 4 providesanoverviewofthecontextandoftheextentoftheinternationalisationphenomenon.Section 5explainsthedatasourcesandmethodologyused,whileanext sectiondescribestheresultsobtained. A final section discusses and derives conclusions.
2. Related Literature
The literature on internationalisation in higher education has focused on three main pillars. First, it discusses the determinants of the phenomenon; second, it analyses the impact that international students have on the stock of high-skilled workers; finally, it examines the overall impact at different levels: individuals, Higher Education (HE) institutions, central government and the national economy. We discuss the main findings in these pillars next.
Concerning the first line of research, the previous literature identifies a number of economic and cultural-related factors that drive this phenomenon. In terms of economic features, Caruso and de Wit (2014) found in a correlational study at macro level that higher expenditure per student, as a proxy for the quality of tertiary education, is the main determinant of student mobility across 33 European countries for the period 1998-2009, together with the degree of openness of the economy and the GDP per capita. Moreover, educational factors like the level of tuition fees showed a nonlinear relationship with the outcome variable, as fees are often considered as a proxy by students for educational quality, however,theamount offeesdiscourages student mobilityifit passes athreshold. The impact of tuition fees has been debated in earlier literature, especially given the increasing differentiation in financial contributions required to international students, with the threat of squeezing out a less “attractive” population of residential students (De Wit, 2015; Weisser, 2016; OECD,2018a).Usingpaneldatafrom1985to2003, Naidoo(2007)foundthat tuitionfeesnegatively affect the inflow of international students in the UK. In the same study, the accessibility of tertiary education in the country of origin has a negative correlation with the share of international students, possibly indicating that studying internationally is a substitute for a demand of tertiary education that cannot be met domestically (Naidoo, 2007; Healey, 2008). It implies a decrease in internationalisation overtime on a par with the increase of tertiary education offer in developing countries. Recently, a similar point has also been raised by OECD (2018a), even though no evidence about a decrease in the number of international students from developing countries emerged over time. A number of social-related factors have also been found to influence the attractiveness of a country for international students, especially in terms of closer political relations with sending
26
countries (Suter & Jandl, 2006), cultural and religious proximity (González et al., 2011; Kahanec & Králiková, 2011; OECD, 2018a), university reputation (Kahanec & Králiková, 2011; De Wit, 2015) and the language of instruction (Kahanec & Králiková, 2011; OECD, 2018a). Rosenzweig et al., (2006) analysed this phenomenon in the US and found that students are mainly attracted by the skillwage gap between the original country and that of study.
The second stream of research examines the retention rates of international students after graduation and links this to the stock of high-skilled workers. Weisser (2016) reported a substantial level of between-studies variability. For instance, evidence from the Netherlands reports retention rates between 29-94%, while the numbers vary between 3 and 64% for the United Kingdom, with most of the variation depending on underlying data, level of education of graduate students and time horizon (Weisser, 2016). Also, PhD students are found to be more likely stayers after obtaining a degree. Kim et al. (2011) found that the percentage of doctorates staying in the US has increased over time, from nearly 50% in the 1980s to 66% in the 2000s. However, as Han et al., (2015) pointed out, the difficulties in getting visas in the US may discourage international students from staying, therefore affecting the overall attractiveness of the country. Felbermayr and Reczkowski (2012) matched multinational data about bilateral student mobility and stock of international high-skilled migrants, finding that, in the year 2000, the increase of tertiary-educated workers was 71% of the increase in international students, with high cross-country heterogeneity particularly between nonand Anglo-Saxon states. A report by the Dutch Education Inspectorate analyses how international students displace native students in higher education (Inspectie van het Onderwijs, 2019). Despite a significant increase in international students in the Netherlands during the last decades, the report does not find an indication that the overall accessibility of higher education is at stake. Additionally, part of the evidence in this second stream of research is related to the relationshipbetweenhavinganinternationaleducationexperienceandthepropensitytoworkabroad. In Norway, Wiers-Jenssen (2008) found an increase by 2-4% in the probability of entry in a foreign labour market conditional on spending part of the education abroad, while Oosterbeek and Webbink (2011) observed that the probability amounted to 30% in the Netherlands. Further evidence in the Netherlands showed that the average retention rate for tertiary-education students was 19% in the long run and that employment status, as well as marriage decision, highly affected the propensity to stay (Bijwaard, 2010; Bijwaard & Wang, 2016).
A thirdstreamofliterature,and most connectedtoour researchquestion,analysesthe overall benefits and costs of internationalisation from four alternative points of view: from the perspective of individuals (de Villé et al. 1996; Throsby, 1998), from HE institutions (Throsby, 1998), from
27
central government (Centraal Planbureau, 2012), and from the perspective of the national economy (de Villé et al. 1996; Throsby, 1998; London Economics, 2018). It should be noted that the academic literature on the topic is mainly theoretical and refers to studies carried out in the 1990s, which provide the underlying elements for the theoretical framework used in this study (Throsby, 1991; de Villé et al. 1996).
Subsequently, policy reports have quantitatively assessed the net impact driven by international students (Throsby, 1998; Centraal Planbureau, 2012; London Economics, 2018). The policy reports highlight a positive or zero-sum net effect of internationalisation on the economy. In 1998, Throsby carried out a comparative analysis at the institutional as well as the national level for Australia, Germany and the UK. On the one hand, the study compared the costs at (i) HE institutions level, namely for internationalisation activities, student and academic support services, and costs at (ii) governmental level, namely central administration services and financial support; on the other hand, direct economic benefits related to tuition fees, external grants and value of research outputs, value for working students and goods expenditures were compared. The findings from Throsby (1998) suggested that, about 20 years ago, incoming students in the UK and Australia did not yield a significant surplus nor deficit. A more recent report by the Centraal Planbureau (CPB, 2012) models costs and benefits for incoming and outgoing students in the Netherlands both during studies and after graduation. In addition, the public expenditures for education, including student grants, social costs and general expenditures, were considered from the viewpoint of the central government duringthe timeframe of studies and after that, based on a retention rate for graduate students by 19%, as estimated by Bijwaard (2010). In terms of benefits, indirect taxation on good consumptions and taxation on incomes were compared in the short and long run. The results showed net benefits by € 739million,whichcorrespondsto0.12%ofGDP,obtainedbymodellingboththeinflowandoutflow of international students. The study also analysed the impact of indirect effects, in terms of quality of international students compared to Dutch students. They found that international students gained their degree more likely on time than Dutch students and obtained higher grades, suggesting the presenceofpositivespill-oversonthenativestudents.Finally,areportbyLondonEconomics(2018), analysed the costs against the benefits on the national economy generated by international students enrolled in the UK in the 2015/16 academic year. As for the costs, the study considered teaching grants, student aid and other public costs such as healthcare, housing, social security and childreneducation expenditure. In the case of benefits,the studyassociatedthe benefits withfee income, nonfee expenses such as accommodation, subsistence, course costs and spending on children, and visitor income. The reportrevealeda benefit-cost ratio by4.6 for EU students and 14.8fornon-EU students, given the higher tuition fees required to the latter group.
28
From a methodological perspective, the studies in the third stream of literature adopted a common framework for most of the costs and benefits, such as regarding tuition fees and non-fee income, although some specificities emerged. In particular, Throsby (1998) only considered costs andbenefitsduringthetimeofenrolment ofstudents.AsimilarapproachwasalsoappliedbyLondon Economics (2018), whose results strongly benefitted from the increase in tuition fees required by non-EU students in the UK. Moreover, the report interestingly analysed the impact of visitor income. The report by Centraal Planbureau (2012) considered the impact both in the short and in the long run, by computing the present value of future contributions due by international students working in theNetherlandsaftergraduation.Thestudydeliveredasignificantcontributiontothemethodological framework, given the data available on the retention rates of graduate students. Further, addressing a similar research question employing a simulation based on the Lucas model, Bergerhoff et al. (2013) estimated the potential growth effects of internationalisation on the national economy. In the two-country model, the study found a state increase by 0.013 percentage points due to international student mobility.
Thecurrent studyrelies onthe earlier fundamental insights bybuildingan overallframework ofanalysisthatconsidersmostoftheevidencesuggestedbybothpractitionerandacademicliterature.
3. Theoretical Framework
The studies assessing the costs against the benefits of internationalisation for the hosting economy agreed on the general categorisation between direct and indirect (or external) effects (Throsby, 1991; 1998; de Villé et al., 1996; CPB, 2012; London Economics, 2018; OECD, 2018a). The theoretical framework on which this study is grounded takes advantage from the previous contributions in the field moving from the general categories provided by Throsby (1998), according to whom costs and benefits of internationalisation may be traced back to four categories: (i) resource costs borne by institutions; (ii) administrative costs borne by governments; (iii) direct economic benefits; and (iv) external effects. A detailed description of dimensions related to each of the cost/benefit categories mentioned in the literature is given in Table 1. Costs that arise at the institutional level are mainly due to the programme delivery and the functioning of facilities. Their size is proxied by the level of public expenditure in tertiary education (referred to category 1.a in Table 1). Second, costs may be driven by the number of scholarships and subsidies granted to international students (1.b), and by specific student support expenditures (1.c) that relate to (i) marketing of programmes, (ii) international offices, (iii) admission administration, (iv) teaching grants to attract international faculty, and (v) contributions to international education networks. Moreover (vi), in non-English
29
speakingcountries,programmes maybeduplicatedtobeofferedinbothlocal andEnglishlanguages. Besides, there are also public social costs due to the presence of international students in the country, mainly because of healthcare and social security (2.d).
Ontheother hand,direct benefitsarisefromprivatesocialcontributionsthat areagainrelated to healthcare or social security expenditures (3.e). The direct benefits also derive from tuition fees, which might vary according to the country of residence, as it is the case for non-EEA students in Europe (3.f) and from non-tuition fee expenses, which are due to students’ purchases of goods and services that generate income for the supplyingindustries and, hence, for the national economy (3.g). The benefits further originate from students’ relatives and friends, who visit the hosting country and spend money that again affects the overall economy (3.h).
Finally, an important element of internationalisation are the long term effects of internationalisation, as measured by labour market outcomes and by the contributions given and received by international students staying in the host country after graduation, as well as the indirect effects of internationalisation. The estimation of the former is subject to significant variation depending on the retention rate of international students and requires a dynamic approach to be estimated (CPB, 2012; Weisser, 2016). The latter indirect effects consist of various sources. First, there might be externalities that are driven by a peer effect in the classroom (4.a). Earlier research provided evidence on peer effects in higher education (Sacerdote, 2001; Zimmermann, 2003). The report by CPB (2012) provided a descriptive measure of the phenomenon in the Netherlands, suggesting that international students have higher educational outcomes than domestic ones. An additional indirect effect that is measured in the literature is the radial effect on the economy that is producedbyinternationalstudents.ThereportbytheLondonEconomics(2018)estimatedtheimpact through the estimation of economic multipliers and observed a net positive effect of internationalisation (4.i). Besides this, additional indirect effects were reported in earlier studies, however, they were not measured in any way. The effects may have been related to the integration of different cultures that may result in cultural barriers (4.b) or, on the contrary, in a positive multicultural environment (4.c). Moreover, internationalisation leads universities to compete for a global pool of talents, fostering competition (4.d) and increasing visibility and reputation (4.g) that is expected to be beneficial especially for a restricted sample of prominent universities, which generally attracts international students for their already prestigious reputation. The presence of international students is also expected to play a positive role in attracting foreign trades and investments (4.e) and in increasing the diplomatic power (4.f) of the hosting nations, given the closer relationship with the students’ countries of origin. As a possible drawback, internationalisation may
30
causethedisplacement ofdomesticstudents(4.h)giventhecapacityconstraintofuniversityfacilities and the possible interest of universities to enrol more international students than domestic ones, because of the higher revenues and positive expected external effects. The monetary value of these dimensions is rarely computed because of the difficulty to make them measurable. Still, it is important to consider them in a theoretical framework that analyses the overall impact of internationalisation, given that they indirectly affect human capital or economic dimensions that in turn generate financial effects linked to internationalisation.
[Table 1 around here]
Within a cost-benefit analysis, the direct effects are monetised to estimate their actual value (Levin, 1987; Levin et al., 2017). In particular, two economic measures are estimated for the economic impact of internationalisation. First, equation (1) presents the Net Present Value (NPV) which measures the difference between the discounted value of benefits and costs. Second, equation (2) denotes the Benefit-Cost (BC) ratio, where the present value of benefits is divided by that of the costs.
where ���� and ���� are, respectively, the benefits and the costs; t refers to the reference year, ranging from 1 to n; and i is the discount rate, which is assumed to be equal to the inflation rate.
The present paper also estimates the peer effects induced by the presence of international students in the classroom. Starting from an Education Production Function (EPF) the peer effects are estimated by the following regression model:
where �������� refers to a number of educational attainment measures for the student i within the programme j inthe cohort t.Output measures refer to(i) time to graduation(in years); (ii) grade point average (GPA); (iii) exam success measured by courses succeeded by the student over the number of courses in the study plan (hence ranging between 0 and 1); and (iv) student drop-out (a dummy identifying students who never got a degree). The controls are captured by �������� 1 , which specifically refers to students’ level characteristics (e.g., gender, scholarship, age); ������ 2 refers to a set of controls at programme level (e.g. two years program, English program); �� ������ is a measure of the peer effect
31
������ = ∑ ���� (1+��)�� 1 �� ��=1 ∑ ���� (1+��)�� 1 �� ��=1 (1) ��������������= ∑ ���� (1+��)�� 1 �� ��=1 ∑ ���� (1+��)�� 1 �� ��=1 (2)
�������� =��0 +��1�������� 1 +��2������ 2 +��3�� ������ +���� +���� +�������� (3)
which is equivalent to the proportion of international students within programme without including the student i; ���� indicates program fixed effects to capture observed and unobserved differences at program level and ���� controls for time fixed effects.
4. Context
In all Western countries, the student body becomes increasingly more diverse in terms of international background. Although less than 2 million students worldwide wereattendingthe higher education studies abroad in the 1990s, nearly 5 million students were studying abroad in 2016 (OECD, 2018a). Despite the strong growth over time, a somewhat stable inflow of international students is observed currently. Figure 1 compares the share of international students in Belgium, the reference country for the present study, to Anglo Saxon countries, historical catalysts for the flow of international students as Canada, the United States, the United Kingdom and Australia. Moreover, it considers other western European countries such as France, Germany and the Netherlands. In the case of Belgium, international students represented 12% of the overall student body in 2016, with a trajectory over time and an overall proportion similar to that of the Netherlands and Canada (OECD, 2018a).
International students are unevenly distributed across educational levels, as shown in Figure 2. They represent 7% to 9% in Belgian short-tertiary and bachelor programmes, respectively, while they make up 20% of master students and 44% of doctoral students. The latter is higher than in comparable countries. The amount of international students at professional and academic bachelor levels in Belgium is the highest across non-Anglo Saxon countries. As indicated in Table 2, most of the international students (47% in 2016) come from the European Economic Area (EEA) countries, even though the proportion of students coming from outside the EEA increased significantly over time. In total, more than 60,000 international students were enrolled in Belgium in 2016, with an increase by more than one third in the previous three years. Finally, Figure 3 reports a comparison between the number of outward and inward mobile students. For all the countries considered in the figure, the ratio is skewed in favour of incoming students, mainly for Australia, the United States and the United Kingdom. The ratio for Belgium is similar to the ratio for Canada and the Netherlands, with a number of incoming students that is nearly four times that of outgoing students. This aspect justifies the focus on inward international students that is adopted throughout the paper.
[Figure 1, 2, 3 and Table 2 around here]
32
5. Data Sources
To measure the direct and indirect effects of internationalisation in higher education, different data sources are exploited. At the macro level, aggregate OECD data are considered for the number and origin of international students, the expenditure and drop-out rate in tertiary education, social expenditureandunemploymentrate(OECD,2013a;2013b;2018a;2018b;2019b).Allthedatarefers to the latest year for which international student data is collected by the OECD, which corresponds to the academic year 2015/2016 (further denoted by 2016). However, when data for 2016 was not available, the data from the most recent year was utilized and the costs were adjusted accordingly to 2016 prices by making use of the harmonized consumer price index (similar to Schreyer & Koechlin, 2002).
At the meso level, the information made available by HE institutions and by the Flemish government is considered. Tuition fees are retrieved from the websites of the Flemish universities for the academic year 2015/16 (KU Leuven, University of Antwerp, Ghent University, Hasselt University, Vrije Universiteit Brussel). Information on tourists' expenditure is obtained from the Flemish Tourism Office (Toerisme Vlaanderen, 2017; 2018). Data related to students’ earnings after graduation are based on projections made by the KU Leuven and presented in the website Vacature.com.4
At themicrolevel,threesourcesof dataareused.First,theHouseholdBudget Survey(HBS), a representative survey taken every two years by the Belgian Statistical Office (StatBel) that is filled out by Flemish families about their purchases of goods and services, is employed. In the 2014 wave, 6,131 households completed the survey, reporting monthly expenditures for food and beverages, clothes, maintenance and repair of personal transport, facilities, furniture, communication devices, culture and leisure, education and private healthcare. The survey data is used to compute the expenditure for goods and services, as well as to compute the non-fee income generated by international students. Second, micro-level data is used from the Flemish Government Social Security Data to estimate the student retention rate after graduation. The data link education outcomes of all individuals graduated (or dropped out) from tertiary education in 2011 to labour market outcomes in the consequent ten quarters after leaving tertiary education. Further, 53,305 individualsareobserved,whichcorrespondtoall studentsirrespectiveoftheuniversity(oruniversity college) attended. As also citizenship is recorded, an indicator is constructed to measure the presence
4 https://www.vacature.com/salariskompas/ (Accessed November 2019)
33
of international students in the Flemish labour market. Also, to disentangle the population of people coming with the purpose of studying from those already living in the country but being born abroad, the subpopulation of foreign graduate students is considered who were not granted a scholarship during their studies, as students are only entitled to scholarships if they live or work for a substantial period of time in the country.5 This way, 2,027 international graduate students are observed, who make up 4.6% of the sample. Linking the degree of the student to the Social Security data, the retention rate is measured by examining whether the student appears in the Social Security data (either as employed or unemployed). Finally, the dataset presents information about the level of education attained by students, enabling us to study heterogeneity in retention rates across levels of tertiary education attained.
As a third source of micro-data, the population of students that are enrolled at master and advanced master level (master after master) at the KU Leuven is considered. In the data, the international status of students,the origin,degree,credits taken intheprogram, successfullyacquired credits and the Grade Point Average (GPA) is observed. In addition, to estimate the influence of international students on the native students, the program fixed effects regression of equation (3) is run to account for all observed and unobserved heterogeneity at the program level. The cohort variation is exploited regarding the composition of international students, so that we link the percentage of international students to various outcome variables such as GPA and acquired credits. The individual characteristics as age, gender and nationality are also controlled. The indication of the peer-effects, that are commonly referred to as ‘Internationalisation at home’ is provided by the estimates. A panel at the programme level is available from 2007 to 2017, making up a total number of 170,000 observations at master level and 27,000 at the advanced master level.
6. Results
The section provides an overview and general discussion of the results, while detailed discussions on the underlying assumptions, data and computations are provided in Appendix A. First, Section 6.1 reports the estimated direct costs and benefits that have been monetised as mentioned in Section
3. Second, Section 6.2 presents some additional analyses on the heterogeneity of the effects by students’ nationality, level of education attained and field of study. Section 6.3 reports some
5 Ignoring this assumption in the data delivers robust findings, as the full number of foreign citizens amounts to 2,209 people. Although the retention rate is with 55.5% slightly higher without the assumption on scholarships (instead of 52.8%), our main findings hold.
34
robustness checks, while Section 6.4 presents the estimated peer effects induced by the presence of international students in the classroom
6.1 Direct benefits and costs
The direct costs and benefits of internationalisation in higher education are summarized in Table 3. Following the structure of the theoretical framework, as first, dimensions of costs are composed of public spending for international students in higher education and of welfare costs as social security and healthcare for international students (the measurement of the costs is extensively discussed in Appendix A.1). Educational expenditure per student in tertiary education, as provided by OECD (2018b), is multiplied by the 21,898 international students in Flanders in 2016, as given by the Flemish Ministry of Education. Of them, 6,251 (31.5%) are doctoral students, while remaining students are almost evenly distributed between bachelor and master level.6 Moreover, yearly expenditure is multiplied by the average duration of studies as deduced and proxied by micro data from KU Leuven. For master students, who represent a large part of the international students in Flanders, the distribution is as follows: 33% of the students complete the study program in one year; 47% takes two years to complete; 14% needs three years, while 6% takes four years or more. This average duration of studies is considered to properly account for all the costs and benefits incurred during the time of students enrolment. In the case of doctoral students, the formal duration of the program takes four years. As the yearly public expenditure per student amounts to nearly € 17,7007 per student in tertiary education and to € 45,000 for doctoral students (that is the value of the doctoral scholarship)8, a total amount of around € 1,682.5 million is derived for educational provision to international students.
A second dimension of costs consist of the amount of money allocated for scholarships to bachelor and master students and subsidies (see Appendix A.1.b). The scholarships to bachelor and master students and subsidies are ignored as international students are typically not entitled to them in Flanders (although there are some very specific scholarship programs like the one provided to the
6 It should be noted that we consider only the level of education in which the international student is enrolled in 2016. Hence, if an international student took a bachelor in Flanders and next a master in Flanders, he/she is registered only as a bachelor. It can actually be the case that bachelors stay to take a master or that masters stay to take a PhD. Due to data limitations, this is not accounted for. Moreover, it should be noted that, due to data limitations, we cannot distinguish between professional and academic bachelors
7 The variable is defined as “Spending includes instruction and ancillary services for students and families provided through educational institutions.” (OECD, 2019a).
8 We acknowledge the fact that not all the doctoral students receive a scholarship. Hence, our estimates can be considered as upper bounds in this respect.
35
top 2% performers of non-EER students, for most scholarships students have to live or work in the country for a substantial period of time before being eligible for a scholarship).
A third dimension in the theoretical framework considers the budget allocation within HE institutions to provide support for international students (see Appendix A.1.c). Institutional support for international students is ignored as there is a lack of reliable data about costs borne by HE institutions for international activities. Most institutional support for international students is spread between the central level in universities and the different faculties, and some universities have outsourced part of the services for international students (e.g. Leuven Mindgate), which make it intricate to measure the costs in a reliable way. Hence, the costs may be underestimated in this respect. However, in the Flemish context, financial transfers by the government account for the proportionofinternationalstudentsenrolled,thusthesecostsarepartiallyincludedintheexpenditure per student previously specified.
As a fourth dimension of costs, the amount of money incurred for the provision of social services is computed, in terms of social security and healthcare for international students (a detailed discussion on the measurement of these costs is provided in Appendix A.1.d). For the former, we consider the social expenditure for support to the working age population that represents 7.5% of GDP per capita as given by OECD (2019b) and includes incapacity benefits, family cash benefits, unemployment benefits and other social supports in cash9. For the estimation of healthcare costs, the health costs for young people are proxied assuming that public costs for this category of social services are strongly differentiated along with the citizen’s life, with elderly people and children outweighing and young adults underweighing the average. As the healthcare costs per age group are not available in Flanders (nor in Belgium), the data from the Netherlands is considered, which has a similar demographic structure. As outlined in the Appendix A.1.d, it is found that the young adults, like students (20-24 years old), can be imputed with a level of expenditure for healthcare services that is140%lessthantheaverageformenand65%lessforwomen10 .Thesumofthetwocomponents (i.e. social security and healthcare) makes up € 4,887 per student, which multiplied by the overall number of international students and by the average duration of studies. This gives a total amount of nearly € 230 million.
36
9 Despite not being specifically related to international students, this is the best proxy available to account for any social security costs incurred for social or community services provided to students.
10 Having no data available on the health status of students, we adopted the age distribution as the closest proxy.
A second main reference category in the theoretical framework refers to the direct economic benefits. The benefits are represented by private social contributions, tuition fee income, non-tuition fee income (good expenditure) and income from visitors. Moreover, the long term labour market outcomes and net contribution to GDP (conditional on the probability of staying after graduation) are estimated. The private social contributions made by students (e.g. due to student jobs) are approximated by OECD (2018b) as making up 1.80% of the GDP per capita, equal to € 737 per person. That multiplied by number of international students makes up an amount of € 41 2 million As discussed in more detail in Appendix A.2.a, private expenditure for healthcare is included in the expenditure made by households (HBS survey) and so accounted for in the expenditure for good consumptions.
A second dimension in the benefits consists of the tuition fee income (Appendix A.2.b), which varies by the level of education and student’s nationality. The general tuition fee in 2016 is equal to € 890 per student, with the exception of non-EEA master students, whose average tuition fee corresponds to € 2,283, and doctoral students, whose tuition fee is € 450 only in the first and last years of attendance. Summing up the different components and multiplying by the duration of studies, a total amount of nearly € 51.2 million tuition fees of international students is obtained.
A third dimension considers the benefits from non-fee income, which includes all expenditures for purchases related to food, beverages, transports, personal care, leisure activities, but also rent and private healthcare (Appendix A.2.c). In the Household Budget Survey, households with and without children with a tertiary education age (18-30 years) are distinguished and the household expenditure is divided by the number of family components. This is carried out by means of microdatarelatedtoFlanders,ensuringahighlevel ofaccuracydespitethefactthatdataarenot specifically related to international students. Multiplying the monthly expenditure per person in 2016 prices (€ 808) by the total number of international students and duration of studies, the total spending of international students on food, beverages, transport, leisure activities and personal care of € 542.5 million is obtained.
Finally, as a fourth dimension, income generated by tourists visiting relatives or friends who study in Flanders is obtained by using data collected by the Flemish Tourism Office (more detailed discussionin Appendix A.2.d). In order todisentanglethe expenditure bytourists comingto Flanders to visit relatives working in the region from those coming because of students, a ratio reporting the percentage of students over the overall foreign population is computed for the most representative nationalities. Subsequently, the ratio is multiplied by the overall number of people visiting relatives
37
or friends in 2016 and by the average length of stay and expenditure per day. In total, an amount of nearly € 120 million per year is obtained that is spent on visiting international students.
As a third reference category, the long term effect induced by international students is assessed (Appendix A.3). This is profoundly related to the estimation of the probability of living and working in the country after graduation. The micro-data from the Flemish Government Social Security Data on the educational attainment of students and their labour market outcomes after graduation, accounting for students’ nationality is used. The results show a retention rate by 52.8%, suggesting that more than half of international students stay in Belgium for at least a few months after graduation. This is an interesting result on itself, even though the intertemporal variation has to be considered in this decision to estimate its long term effect. This is the motivation for the use of the DIOC database11 (Database on Immigrants in OECD Countries, OECD, 2013a). The database enables the creation of a proxy for the length of stay of international students, assuming that the average length of stay of highly educated immigrants in the past reflects the behaviours of graduate students inthefuture.Thisanalysis, asoutlinedin theAppendix A.3 andshown graphicallyin Figure 4, results in a distribution of students that is structured as follows: about half of the international students stay after graduation at least a quarter. From the students who stay at least one quarter, 13% of graduate students leave within one year. 45.9% of the international students stay for more than one year but less than five years. About 37.2% of the international students stay for five to ten years; 29.4% of them will stay for ten to twenty years; the final 22.3% will stay for life.
This distribution of the retention rate is the basis for the computation of future benefits and costs. In line with the general theoretical framework, benefits are represented by good expenditures, private social contributions, taxation on gross salaries (average taxation amounts to 53.9%; OECD, 2018a), and employer contribution (average contribution amounts to 32.8%; OECD, 2019). The underlying reason for the increase in salaries is due to work experience (i.e. seniority), while other values are held constant and discounted to the average inflation rate between 2010 and 2017 (1.8%; OECD, 2018b). Costs are made by social expenditures incurred by the government, which are composed of (i) income support to the working-age population; (ii) family services (since five years after graduation); and (iii) pensions (since forty years after graduation). These values are kept constant over time and discounted to the average inflation rate of 1.8%, in order to estimate their present value. The number of international graduates working in the national job market is highly dependent on the drop-out rate during tertiary education, which is equal to 24% in Flanders. The
38
11 http://www.oecd.org/els/mig/dioc.htm (Accessed July 2019)
drop-out rate provided by OECD has been triangulated using data from KU Leuven, showing that drop-out among international students is slightly lower, i.e. 21-22%. Nevertheless, given the uncertainty in the data and the importance of graduation for the findings, we use the dropout rate to provide upper and lower bound estimations. In particular, the upper bound correspond to the best case scenario in which all international students graduate, while the lower bound assumes a dropout rate of 24% among the international students. The results show that the lower bound corresponds to a present value of € 4.2 billion; the upper bound constitutes a value of € 5.6 billion.
[Table 3 and Figure 4 around here]
Comparing the estimated costs and benefits, overall, cost-benefit measures given in Table 4 report a net benefit from the presence of international students in the country of € 3,072 million to € 4,408 million euro, corresponding to 1.24% to 1.77% of GDP in Flanders. The total benefits are a factor of 2.6 to 3.3 times the total costs, with a net contribution to the national economy per student ranging between € 140 297 and € 201 300
[Table 4 around here]
6.2 Heterogeneity in direct benefits and costs
Starting from the baseline results, we are interested in investigating how much the findings vary depending on three main elements: students’ nationality, level of education attained and field of study.Results,presentedinTable5,providetheproportionofeachcategoryofinternational students, the relative retention rates and the benefit-cost (BC) ratios. Moreover, we include information on the unemployment rate for eachcategoryone year after graduation (information fromthe Social Security data) such that in the estimation of the long-run effects (after attaining tertiary education) we correct the number of students who are unemployed.
Panel A of Table 5 presents the heterogeneous results along with the nationality of students
In particular, we create four groups as follows: neighbouring countries (i.e. Germany, France and the Netherlands), other EU countries, other European countries outside the EU and, finally, the rest of the world. For the latter two groups the retention rate may be influenced by the availability of visas, making this a central policy topic. The centrality of the issue is further stressed by the proportion of internationalstudentscomingfromnon-Europeancountries,astheymakeup51.8%ofthepopulation of international students in the Social Security dataset and hence represent the most numerous group. Neighbouring countries follow with a proportion by 36.1% of the total number of international students. Despite the high number of students coming from non-European countries, the benefit-cost
39
ratio for this category is the lowest, being highly affected by the level of the retention rate. Indeed, students coming from outside Europe report the lowest retention rate across groups, 38.4%, yielding to an amount of benefits that overcome by 3.2-3.5 times the costs. On the contrary, students coming from neighbouring countries show the highest retention rate in the short run (as defined in the previous section), to the extent of 64.9%. This result is likely to be affected by the possibility to easily commute to the country of origin given the geographical proximity as well as by the low cultural and language barriers that may affect employability. This results in a benefit-cost ratio that ranges between 5.1 and 5.6.
Panel B of Table 5 considers the level of education attained by international students. The level of education affects both the retention rate and costs and benefits incurred while students are in education. Results show an even distribution of international students between educational levels. Students getting a bachelor degree represent the majority group making up 34.8% of the student population, with a retention rate by 63.0%. Master students make up nearly the same proportion, being 33.6% of the international students population. The retention rate of master students is with 45.4%thelowest Finally,doctoral studentsrepresent31.5%oftheinternationalstudentspopulation, with a retention rate of 56.6%. Hence, bachelor and doctoral students are more likely to stay after graduation than master graduates. Taking into account the duration of the studies, this suggests that the longer a student lived in the host country, the more likely it is that he or she will stay after graduation. In this respect, a trade-off between likelihood of retention and costs incurred while students are in education emerges. On the one hand, the benefit-cost ratio highly resents the duration of studies. Therefore, despite the lower costs for international master students, the benefit-cost ratio for bachelor and master students is similar due to the higher retention of bachelor students. The benefit-cost ratio is lowest for doctoral students (between 1.4 and 1.8) mainly because of the cost of scholarships awarded to students. However, there are two points to make with respect to the doctoral students. First, in the present paper we ignore the impact of international doctoral students on the research output Second, international doctoral students might substitute native doctoral students, given the limited number of available scholarships. This is to a large exent not the case for international bachelor and master students.
Finally, we consider in Panel C the field of study in which international students enrol, classifying the disciplines into three clusters: humanities, STEM and biomedical degrees. Students graduated from biomedical degrees compose the smallest group (12.5% of the population of international students in the Social Security data), but report the highest retention rate (60.1%) probably due to the presence of internships during their studies, which make more likely for the
40
student to stay afterwards. For this reason, the benefit-cost ratio for this category is the highest, and ranges between 3.0 and 3.9. Students graduated from humanities represent the majority group (62.5%) and more than half of them (55.9%) stay in the short term despite a slightly higher unemployment rate one year after graduation (around 9% against 7% for STEM and 3% for biomedical degrees). For international students in humanities, the benefit-cost ratio equals to 2.7 to 3.4. Finally, students graduating from STEM programs show the lowest retention rate (48.1%) and report a benefit-cost ratio ranging between 2.5 and 3.1. It might be the case that job positions related to STEM disciplines are the most internationalised, hence students graduating in this field start their career more often abroad, resulting in lower retention rates
[Table 5 around here]
6.3 Robustness checks
As a robustness check for our analyses, we simulate the benefit-cost ratios in alternative scenarios as presented in Table 6. In particular, we simulate how the benefit-cost ratio modifies when there is a change in the retention rate (Panel A) or in the timeframe under investigation (Panel B). Hence, starting from the estimated retention rate of 52.80%, we test our results by simulating retention rates of 60%, 40%, 30% and 19% (as in the report by the CPB, 2012). In the three cases below the actual value, the benefit-cost ratio is still positive, meaning that the benefits are larger than the costs. Even when the retention rate is assumed to equal 19%, the lower bound reports benefits equal to 119% of the costs. Whentheretention rateincreasesto 60%,theupper boundofthe benefit-cost ratioamounts to 3.70, all else being equal.
By adopting a similar approach, we test our results when a different timeframe is considered. In our baseline analysis, we consider the costs and the benefits related to international students over their entire lifetime. As a robustness check, we simulate how the benefit-cost ratio changes if we suppose that all the international students leave Flanders after 20, 10 or 5 years. Also in these alternative scenarios the benefits overcome the costs, as the benefit-cost ratios range between 2.71 and 1.02 (worst case scenario). Indeed, supposing that all the international students leave after 5 years, the lower bound shows almost a parity between costs and benefits, as the benefit-cost ratio is equal to 1.02.
[Table 6 around here]
41
6.4 Indirect effects
Along with the direct effects, the theoretical model highlights the role played by the indirect effects produced by international students on the national economy. These may take various forms as described in Section 3, among which we specifically investigate the peer effect of attending an international class, as measured by the proportion of international students attending a programme. Descriptive statistics are given in Table 7, while Table 8 and 9 present results for master and advanced master students, respectively.
The percentage of international students per programme seems not to affect students’ attainment, except for a small negative effect on study success (measured as a number of courses succeededoverthecoursesbookedduringthelast yearbeforegraduation).Inparticular,anadditional 1% of international students are related to an average 0.7% decrease in the ratio between courses passed and booked at master level. Among individual level variables, international students need more time to get a degree and with lower grades, hence registering lower study success. This may be coherent with the idea that international students take time to get used to the hosting educational system, resultingin more time needed tograduate and lower GPAs.Thisis particularlytruefor extraEU students (i.e. students from outside the EU), who receive an average GPA that is 2.50% and 2.98% lower than their peers at master and advanced master level, respectively. Other individuals and programme characteristics affect consistently the educational outputs, such as gender, which suggestspositiveeducational attainmentsforfemalestudents,particularlyat themasterlevel.Indeed, female students are nearly 3.6% and 2.3% less likely to drop out at master and advanced master levels respectively, completing their master programs with an average additional 1 GPA point (up to 100). On the contrary, age shows a negative correlation with measures of students’ results, possibly because of part-time or working students. At the programme level, results are mixed, with the provision of the programme in English that is related with longer time to degree, lower grades and lower study success for advanced master students, but that is also related with smaller drop-out probability, in the measure of 37% and 19%, on average, for master and advanced master students. Hence, students in these programmes struggle more but are more likely to finally succeed. To take the study time into account, we control for programs which last for 2 years relatively to one year programs. It is found that students attending longer programmes are more likely to graduate on time and with an average of 10 additional GPA points, probably indicating more motivation to succeed due to self-selection of students in challenging programmes, or suggesting that students need time to adapt to the hosting educational system.
42
Finally, Table 10 reports an analysis of the heterogeneity of the variable under investigation, the proportionofinternational students per program, bythe field of study. Accordingly, the programs have been classified into humanities, STEM and biomedical disciplines. Results show that the proportion ofinternationalstudentsdo notaffect significantlyanyoftheoutput variables, confirming the baseline results.
[Tables 7 – 10 around here]
7. Conclusion and Discussion
This study analyses the benefits against the costs of internationalisation in higher education, with an empirical applicationtoFlanders,Belgium.Directcostsandbenefitshavebeencomparedintheshort run (i.e. during students’ education) and the long run (i.e. after graduation, conditional on the probability to live and work in the host country). This study is one of the first taking full advantage of the amount of data increasingly available on the topic, offering a quantification of the impact of internationalisation on a western economy based on sound data at different levels of aggregation. Results show a net positive impact of internationalisation, with direct benefits counting from 2.6 to 3.3 times the costs. The results highlight a contribution of international students to the national economy by a factor between € 3,072 million and € 4,408 million, which suggests a net contribution of € 465 - 613 per Flemish inhabitant. A similar study conducted in the USA by the Institute of InternationalEducation(2019)reportedanet contributionof$41billionduetointernationalstudents in 2018/19. Despite the large value, this is equal to nearly € 116 per inhabitant, which is lower than the estimated effect in Flanders. High heterogeneity is observed by level of education, as the benefits outweigh the costs much more consistently for international bachelor and master students than for doctoral students.
Our findings confirm the relevance of the impact of international students on the local economy, although there are a number of considerations. First, the favourable benefit-cost ratio is primarily driven by the long term impact of international students on the local economy. We observe a high retention rate after one year, equal to 52.8% of graduate international students. Bijwaard (2010) estimated a retention rate of 19% for students in the Netherlands, even though other studies reported a probability of stay ranging between 29-94% in the Netherlands, while the numbers vary between 3 and 64% for the United Kingdom (Weisser, 2016). Second, it can be noted that during studies net costs exceed benefits, creating a net balance that is represented in Figure 5 (Year 0, when a net loss of nearly€ 1,158millionishighlighted). Alreadyone yearafter graduation benefitsprevail,
43
due to the wage taxation. By manipulating the level of retention rate and by simulating alternative results, we seethat the pay-backtime foraninternational student amounts tonearlyfour years, which means that if students stayfor four years or more after graduation, the costs fortheir education would be rebalanced by their contributions to the job market, especially in terms of wage taxation. This result is partially driven by the labour market conditions in Flanders, where the unemployment rate is relatively low (around 5% on average, 8% one year after graduation as retrieved by the Social Security data) and the level of taxation is relatively high (53.9% plus 32.8% of employer contribution). Third, the prevalence of net benefits persists along the entire time horizon as long as students work and live in the country, except for the last few years, in which costs for pensions outweigh the net benefits.
[Figure 5 around here]
Thestudyalso contributes to thedebate ontheindirect impact ofinternationalisation, finding no peer effect due to the presence of international students at master and advanced master levels at the KU Leuven. The results may be due to the fact that the peer effect is not detectable as an impact on “hard” measures of educational attainment, like time to graduation or GPA, while the influence may be visible on “soft” aspects like classroom climate and engagement. As suggested by Inspectie van het Onderwijs (2019), international students might also be insufficiently integrated in the international classroom.
Heterogeneous findings. The paper reports heterogeneous results by nationality and level of education attained by international students. The highest benefit-cost ratios emerge for students coming from neighbouring countries (namely France, Germany and the Netherlands) and for those pursuing a bachelor or a master degree. Moreover, when analysing results by field of study, the benefit-cost ratio is the highest for biomedical degrees. The first result is driven by the higher retention rate for students from neighbouring countries relatively to non-European students. The second result is led jointly by lower costs of education because of the shorter duration of studies for master students, and by a high retention rate for bachelor students. On the heterogeneity by nationality, given the increase in the number of students coming from extra-European countries (OECD, 2018a), the issue of stimulating the retention rate for this subgroup of students is central and highly related to the national immigration policies. On the heterogeneity by level of education, the high benefits deriving from the presence of international master graduates should be interpreted carefully. Master graduates represent a highly skilled labour force, whose wage growth is faster than that of bachelor graduates.Though, before enteringthemaster level, the costsfor the bachelor degree
44
might be incurred by the hosting country or by the country of origin. In the former case, the current calculation underestimates the real costs that should actually consider the costs for students’ overall tertiary education. In the latter case, the competition across countries would go even further, encouraging hosting education systems to attract international students whose tertiary education was already partially fulfilled (also in terms of costs incurred) in another country. Finally, on the heterogeneity by field of study, the fact that biomedical degrees present the highest benefit-cost ratio should be interpreted in line with the cost per study program, which is usually higher for biomedical degrees than for other study fields. The lowest benefit-cost ratio is observed for STEM disciplines, whose retention rate should be increased in order to observe a growth in the net benefits. This is especially relevant in a context in which the rise of STEM graduates will be particularly beneficial for innovation and entrepreneurship (VARIO, 2017).
Policy recommendations
The findings highlight the relevance of internationalisation as a strategic phenomenon, in line with worldwide attention to the issue. A report by the UK Department of Education and International Trade (Department of Education & Department of International Trade, 2019) recently launched the new strategic vision for education, aiming to increase the total number of international students choosing to study in the UK higher education system to 600,000 by 2030.
Internationalisationisinterpretedasanopportunityforthefutureofhighereducation(DutchMinistry of Education, 2019), while the issue of the possible brain gain becomes central in the competition for a pool of talent at the global level (Haupt et al., 2016).
Within the frame of the growing debate about the costs and benefits of internationalisation in higher education, a number of policy implications are derived from this study. First, given the significant benefits of internationalisation in higher education, policy makers could monitor the state of internationalisation at national level by a set of Key Performance Indicators (KPIs). A dashboard is given in Table 11 containing, for each KPI, the definition, the level of aggregation (granularity), the source of data, international comparability and the specific reference to the section of the study in which that data are discussed. Given the high level of heterogeneity observed in the direct effects by nationality, educational level and field of study, most of the indicators should be computed both as aggregated measures and as disaggregated indicators by nationality, level of education and field of study. Indicators refer to the number of international students and their percentage over to the total student population at tertiary level, as well as to the student retention rate after one or four years from graduation. This last dimension should be carefully monitored, as it drives most of the long term effects observed.
45
[Table 11 around here]
Second, this study points to the relevance of offering higher education programs in a foreign language. In Flanders, there is currently little debate on internationalization of higher education due to a fear of 'anglicisation'. But ‘anglication’ is not really an issue in Flanders. In Flanders, every student has the opportunity to study an almost completeDutch-language bachelor's programand thus create an academic foundation in the mother tongue. We also have strict rules in Flanders, both with regard to the proportion of programs that may be taught in another language and the proportion of credits that may be taught in another language in a Dutch-language program. The new education law XXX allows for a modest increase in the share of foreign-language Bachelor's programs, from 6 to 9 percent. That is a step in the right direction. Incidentally, such an extension has little impact on Flemish students. After all, foreign-language academic bachelor's programs mainly attract internationalstudents.TheyareusedtoopenupFlemishspearheaddomainstotheworld,towelcome the sons and daughters of expats, and to attract the talents that our labor market desperately needs. In any case, this report shows that a gradual, cautious expansion of the foreign-language offering produces significant economic benefits, in each of the scientific groups and at all levels of academic higher education. More international exposure of Flanders also requires an internationally competitive scientific basis.
This leads to the most important policy implication, as the process of internationalisation of higher education does not bring net benefits per se, but only in combination with students’ retention after graduation. Hence, policies aimed at stimulating international students’ retention should be designed to maximise net benefits, in line with previous findings on the topic (Bergerhoff et al., 2013). Based on our results, net benefits outweigh the costs after more than four years from graduation, and even less than two years for bachelor and master students. After ten years from graduation, the net benefits double the costs. From this perspective, policy-makers should promote reforms aimed at student retention. A specific suggestion is introduction of a ‘search year’: After graduation or the completion of a research project, non-EEA students or researchers cannot move on to the Belgian labor market. As the search year is limited in time, but at the same time unlimited in terms of access to the labor market, it allows for quality control. Moreover, as pointed out by Han et al. (2015), the debate about the ability to retain international students is closely linked to the availability of visas and permits to stay in the country, especially for extra-EU students. Hence, immigration policies could highly impact the effect of internationalisation and should be designed considering the specificity of this category of students, as suggested also in a recent report by the Flemish UniversityCouncil (Vlaamse InteruniversitaireRaad,2019). After all,international students
46
allow that sufficient good profiles can be recruited for highly qualified professions with shortages on the labor market. The analysis in the current study further complements the findings of the VARIO report 'Attracting and Anchoring Top International Talent' and reinforces the underpinning of the accompanying VARIO policy recommendations that emphasize the importance of an integrated approach.
As a fourth point, internationalisation of higher education is studied from the perspective of a developed country, where a net inflow of international students is registered. However, internationalisation poses an issue of brain drain for sending countries, potentially hurting not only less attractive educational systems, but also the corresponding job markets, which would suffer from a lack of high-skilled and high-mobility workers (Docquier & Rapoport, 2012). Despite the potential harmfulness of brain drain for developing countries, the phenomenon has been found to be partially beneficial for a set of large, middle-income developing economies (Docquier, 2014). Taken together with the students’ retention after graduation, the brain gain could enhance mechanisms of competition at global level, where hosting countries compete to attract the most gifted talents and to retain them after graduation, while sending economies try to make students’ return to the home country as appealing as possible, with ambiguous effects on overall educational quality (Haupt et al., 2016).Inthisrespect,highereducationisincreasinglyseenasanexportproductforhostingcountries The higher the number of international students (and their retention rate), the higher the benefits.
Fifth, competition in the job market could arise in hosting economies as well, between international and native graduates. As shown by Kahanec and Králiková, (2011) “Skilled immigration benefits the low-skilled native labour force and may, but does not need to hurt highskilled native workers” (p. 3). Indeed, high-skilled immigration is found to have redistributive effect (Kahanec & Zimmermann, 2008) beneficial for inequality reduction, but it may also put pressure on the competition for high skilled job positions resulting in ambiguous effects. Policy makers should inform the wider public on the relevance, importance and added value of internationalisation in higher education.
Future research. The paper provides several lines for future research. First, the present study uses a number of proxies to estimate direct effects and, hence, there is possibility of underestimating or overestimating the phenomenon. Future research could exploit in greater detail some of the proxies and assumptions made along the study, for instance related to the retention rate, or to more detailed data on spending of international students. Second, more research is needed to study the impact of international student on soft dimensions as classroom atmosphere, cultural
47
diversity and societal engagement. Moreover, future research unfold the mediating and moderating effects oftheindirect elements of internationalisation that impacta national economy. In this respect, future studies could explore the relationship between internationalisation and university rankings, to estimate how strong is the role of reputation in attracting international students and scholars. Finally, impact studies could focus on the effect of improving retention rates of graduate international students, as this appears to be the key benefit of internationalisation.
References
Bergerhoff, J., Borghans, L., Seegers, P. K., & Van Veen, T. (2013). International education and economic growth. IZA Journal of European Labor Studies, 2(1), 3.
Bijwaard, G. E. (2010). Immigrant migration dynamics model for The Netherlands. Journal of Population Economics, 23(4), 1213-1247.
Bijwaard, G. E., & Wang, Q. (2016). Return migration of foreign students. European Journal of Population, 32(1), 31-54.
Caruso,R.,&DeWit,H.(2015).DeterminantsofmobilityofstudentsinEurope: Empirical evidence for the period 1998-2009. Journal of Studies in International Education, 19(3), 265-282.
Centraal Planbureau. (2012). De economische effecten van internationalisering in het hoger onderwijs. CPB Notitie. Retrieved from https://www.cpb.nl/publicaties.
De Villé, P., Martou, F., & Vandenberghe, V. (1996). Cost-benefit analysis and regulatory issues of student mobility in the EU. European Journal of Education, 31(2), 205-222.
De Wit, H. (2015). Recent trends and issues in international student mobility. International Higher Education, (59).
Demange, G., & Fenge, R. (2010). Competition in the quality of higher education: the impact of students' mobility. Paris School of Economics Working Paper 2010-27.
Department of Education and Department of International Trade. (2019). International Education Strategy: global potential, global growth.
Docquier,F.(2014).Thebraindrainfromdevelopingcountries:Thebraindrainproducesmanymore losers than winners in developing countries. IZA World of Labor, 31, 1-10.
Docquier, F., & Rapoport, H. (2012). Globalization, brain drain, and development. Journal of Economic Literature, 50(3), 681-730.
Felbermayr, G. J., & Reczkowski, I. (2012). International student mobility and high-skilled migration: the evidence. Ifo Working Paper 132
González, C. R., Mesanza, R. B., & Mariel, P. (2011). The determinants of international student mobility flows: an empirical study on the Erasmus programme. Higher Education, 62(4), 413-430.
Haupt, A., Krieger, T., & Lange, T. (2016). Competition for the international pool of talent. Journal of Population Economics, 29(4), 1113-1154.
48
Healey, N. M. (2008). Is higher education in really ‘internationalising’?. Higher education, 55(3), 333-355.
Han, X., Stocking, G., Gebbie, M. A., & Appelbaum, R. P. (2015). Will they stay or will they go? International graduate students and their decisions to stay or leave the US upon graduation. PloS one, 10(3), e0118183.
Inspectie van het Onderwijs. (2019). Internationalisering en de toegankelijkheid van het hoger onderwijs voor Nederlandse studenten. Pp. 70.
Institute of International Education. (2019). Open Doors 2019. Washington, DC: U.S. Institute of Peace.
Kahanec, M., & Králiková, R. (2011). Pulls of international student mobility. IZA Discussion paper n. 6233. Bonn: Institute for the Study of Labor.
Kahanec, M. and Zimmermann, K. F. (2008). Migration, the Quality of the Labour Force and Economic Inequality. IZA Discussion Paper No. 3560, Bonn: Institute for the Study of Labor.
Kim, D., Bankart, C. A., & Isdell, L. (2011). International doctorates: trends analysis on their decision to stay in US. Higher Education, 62(2), 141-161.
Knight, J. (2013). The changing landscape of higher education internationalisation–for better or worse?. Perspectives: Policy and practice in higher education, 17(3), 84-90.
Lange, T. (2013). Return migration of foreign students and non-resident tuition fees. Journal of Population Economics, 26(2), 703-718.
Levin, H. M. (1987). Cost‐benefit and cost‐effectiveness analyses. New directions for program evaluation, 1987(34), 83-99.
Levin, H. M., McEwan, P. J., Belfield, C., Bowden, A. B., & Shand, R. (2017). Economic evaluation in education: Cost-effectiveness and benefit-cost analysis. SAGE publications.
London Economics. (2018).The costs and benefits of international students by parliamentary constituency. Retrieved from https://www.hepi.ac.uk/category/publications/
Ministry of Education (2019). Discussienotitie hoger onderwijs en onderzoek: trends en strategische vragen. Den Haag.
Naidoo, V. (2007). Research on the flow of international students to UK universities: Determinants and implications. Journal of Research in International Education, 6(3), 287-307.
OECD (2013a). Database on Immigrants in OECD and non-OECD Countries: DIOC 2010/11. Retrieved from http://www.oecd.org/els/mig/dioc.htm
OECD (2013b). Pensions at a Glance 2013, OECD and G20 Indicators. OECD Publishing, Paris.
OECD (2018a). Education at a Glance 2018: OECD Indicators. OECD Publishing, Paris. http://dx.doi.org/10.1787/eag-2018-en.
OECD (2018b), Country statistical profile: Belgium 2018/4, in Country statistical profiles: Key tables from OECD, OECD Publishing, Paris, https://doi.org/10.1787/csp-bel-table-2018-4-en
OECD (2019a). Education at a Glance 2019: OECD Indicators. OECD Publishing, Paris.
OECD (2019b). Social Expenditure Update 2019, Public social spending is high in many OECD countries. OECD Publishing, Paris.
49
Oosterbeek, H., & Webbink, D. (2011). Does studying abroad induce a brain drain?. Economica, 78(310), 347-366.
Rosenzweig, M. R., Irwin, D. A., & Williamson, J. G. (2006, January). Global wage differences and international student flows. In Brookings trade forum (pp. 57-96). Brookings Institution Press.
Rumbley, L. (2012). So many data, so little clarity. In J. Beelen & H. De Wit (Eds.), Internationalisation Revisited: New dimensions in the Internationalisation of Higher Education. (pp. 125-134). Amsterdam, The Netherlands.
Sacerdote, B. (2001). Peer effects with random assignment: Results for Dartmouth roommates. The Quarterly Journal of Economics, 116(2), 681-704.
Schreyer, P., & Koechlin, F. (2002). Purchasing power parities–measurement and uses. Statistics Brief, 3(2002/3), 1-8.
Suter, B., & Jandl, M. (2006). Comparative Study on Policies towards Foreign Graduates: Study on Admission and Retention Policies towards Foreign Students in Industrialised Countries. International Centre for Migration Policy Development (ICMPD).
Throsby, C. D. (1991). The financial impact of foreign student enrolments. Higher Education, 21(3), 351-358.
Throsby, D. (1998). Financing and Effects of Internationalisation in Higher Education. The Economic Costs and Benefits of International Student Flows. Paris: OECD-CERI.
Toerisme Vlaanderen (2017). Tourism in Key Figures Edution 2017. Retrieved from https://www.vlaanderen.be/nl/publicaties/
Toerisme Vlaanderen (2018). Art cities research 2018. Retrieved from https://www.vlaanderen.be/nl/publicaties/.
VARIO – Vlaamse Adviesraad voor Innoveren & Ondernemen. (2017). Internationaal Toptalent Aantrekken En Verankeren. Advies Nr 1. Retrieved from https://www.vlaanderen.be/nl/publicaties
Vlaamse Interuniversitaire Raad (2019). Ruim baan voor kennismigratie uit derde landen. Retrieved from https://vlir.be/wp-content/.
Weisser, R. (2016). Internationally mobile students and their post-graduation migratory: An analysis of determinants of student mobility and retention rates in the EU. OECD Social, Employment and Migration Working Papers, No. 186, OECD Publishing, Paris.
Wiers-Jenssen, J. (2008). Does higher education attained abroad lead to international jobs?. Journal of studies in International Education, 12(2), 101-130.
Zhang, L. C., Worthington, A. C., & Hu, M. (2017). Cost economies in the provision of higher education for international students: Australian evidence. Higher Education, 74(4), 717-734.
Zimmerman, D. J. (2003). Peer effects in academic outcomes: Evidence from a natural experiment. Review of Economics and statistics, 85(1), 9-23.
50
Table 1. Theoretical framework – Dimensions and indicators related to each of the cost/benefit categories.
Reference categories (from Throsby, 1998) Dimension
“Hard” – Direct effects
Expected impact Reference
a. Public spending for education (-)
Throsby (1991)*; de Villé et al. (1996)*; Throsby (1998); CPB (2012)
b. Scholarships/Subsidies (-) Throsby (1998); CPB (2012); London Economics (2018)
(1) Costs borne by institutions
c. International students support: (i) marketing of programmes, (ii) international offices, (iii) admission administration, (iv) teaching grants to attract international faculty, (v) contributions to international education networks, (vi) program duplications.
(-) Throsby (1991)*; Throsby (1998); London Economics (2018)
(2) Costs borne by governments
d. Public social costs (social security; healthcare) (-) Throsby (1991)*; de Villé et al. (1996)*; CPB (2012); London Economics (2018)
e. Private social contributions (social security; healthcare) (+) London Economics (2018)*
(3) Direct economic benefits
f. Tuition fee income (+) Throsby (1991)*; de Villé et al. (1996)*; Throsby (1998); London Economics (2018); OECD (2018a)*
g. Good consumptions (non-tuition fee expenditure) (+) de Villé et al. (1996)*; CPB (2012); London Economics (2018); OECD (2018a)*
h. Income from visitors (+) London Economics (2018)
(3) - (2) – (1)
i. Long term labour market outcomes and net contribution to GDP (conditional on the probability of staying after graduation) (+/-) Throsby (1991)*; de Villé et al. (1996)*; CPB (2012); London Economics (2018)*; OECD (2018a)*
“Soft” – Indirect effects
a. Classroom peer-effect (+/-) Throsby (1991)*; Throsby (1998)*; CPB (2012);
b. Cultural barriers due to a composite student population (-) Throsby (1991)*; CPB (2012)*
c. Multicultural environment (+) OECD (2018a)*
d. Global status of domestic universities (+) de Villé et al. (1996)*; OECD (2018a)*
(4) External effects
e. Induced investments and trade (+) Throsby (1991)*; de Villé et al. (1996)*; Throsby (1998)*; CPB (2012)*; London Economics (2018)*
f. Soft diplomatic power (+) London Economics (2018)*
g. Competition across institutions (+/-) CPB (2012)*; OECD (2018a)*
h. Displacement of domestic students (-) Throsby (1998)*; OECD (2018a)*
i. Indirect and induced effects on local economy by means of economic multipliers (+) Throsby (1991)*; London Economics (2018)
Note: All the dimensions of costs and benefits are traced back to the reference categories proposed by Throsby (1998) to explain the economic impact of international students. For each of the direct and indirect effects, we report the direction of the expected impact as well as the list of references that mention the dimension as a source of cost or benefit due to the presence of international students. References marked by a star (*) mention but not measure the corresponding dimension.
51
Table 2. Incoming international students in Belgium by geographical area between 2013 and 2016.
Source: Authors’ elaborations on OECD (2018a).
Note: For each year between 2013 and 2016, the table reports the composition in terms of absolute numbers and share of the total (up to 100%) of the incoming international student body enrolled in Belgium at any levels of tertiary education.
52
2013 2014 2015 2016 Absolute number Share of the total Absolute number Share of the total Absolute number Share of the total Absolute number Share of the total European Economic Area (EEA) 24,877 56% 28,167 51% 28,332 50% 28,456 47% Non-OECD countries (not allocated) 9,928 22% 16,708 30% 17,799 32% 20,946 34% Africa 5,346 12% 5,273 9% 5,282 9% 5,801 9% Asia 2,523 5% 2,982 5% 2,739 5% 3,048 5% Latin America 881 2% 1,024 2% 1,038 2% 1,276 2% Europe (non-EEA) 778 2% 874 2% 776 1% 983 2% North America 339 1% 414 1% 428 1% 533 1% Oceania 51 <1% 74 <1% 59 <1% 59 <1% Total 44,723 100% 55,516 100% 56,453 100% 61,102 100%
Table 3. Estimation of the direct costs and benefits of internationalisation.
Direct effects
1. Costs
a. Public spending
€ 1,682,475,012
b. Social costs (social security; healthcare)
€ 230,392,557
TOTAL
€ 1,912,867,569
2. Benefits
a. Student fees
€ 51,220,833
b. Consumptions (accommodation costs; subsistence; direct course costs)
€ 542,548,613
c. Income from visitors
€ 119,961,452
d. Private social security
€ 41,191,187
e. Taxation and contribution to GDP (subsequent net revenues conditional on the probability of staying after graduation)
€ 4,230,178,084
€ 5,566,023,795
TOTAL
€ 4,985,100,170
€ 6,320,945,880
Source: Authors’ elaboration on OECD (2013a; 2013b; 2017; 2018a; 2018b; 2019); Flemish Government Social Security Data; HBS survey; Toerisme Vlaanderen (2017; 2018).
Note: Direct costs and benefits driven by the presence of international students in the short and long run are given. For total benefits, we compute a lower bound (in case all students got a professional bachelor degree) and an upper bound (in case all students got an academic master degree) of estimation.
53
Table 4. Cost-benefit measures of internationalisation of higher education in Flanders.
Note: Overall Net Present Value (NPV) is computed by means of actualisation of future benefits and costs derived from the presence of international students,both during studies and afterwards. Benefit-cost ratio is computed as the ratio between the overall benefits and costs of internationalisation. The net contribution per student is obtained by dividing the overall NPV by the number of international students estimated in 2016.
54
Lower bound Upper bound Overall NPV € 3,072,232,600 € 4,408,078,311 Benefit-cost ratio 2.6 3.3 Net contribution per student € 140 297 € 201 300
Table 5. Analysis of heterogeneityin retention rates and benefit-cost ratios byinternational students’ nationality and level of education attained.
Panel A. By nationality
Panel B. By level of education
Panel C. By field of study
Source: Authors’ elaboration on OECD (2013a; 2013b; 2017; 2018a; 2018b; 2019b); Flemish Government Social Security Data; HBS survey; Toerisme Vlaanderen (2017; 2018).
Note: The proportion of international students population presents the breakdown of students across categories. The retention rate reports the proportion of students who stayed in Belgium at least one quarter after graduation. The benefit-cost ratio is computed considering all the components of benefits and costs. The two values of the benefit-cost ratio reported by nationality refer to the upper and lower bounds of estimation (the first in the case that the entire population gained a professional bachelor degree, the second in the case of academic master degree). The benefit-cost ratio reports an upper and a lower bound, depending on the fact that the computation is made net or gross the students drop-out rate.
55
Proportion of the international students population Retention rate Benefit-cost ratio
Neighbouring countries 36.1% 64.9% 5.1-5.6 Other EU countries 10.5% 60.4% 4.8-5.2 Other Europe extra EU 1.6% 51.7% 4.2-4.5 Rest of the world 51.8% 38.4% 3.2-3.5
Bachelor degree 34.8% 63.0% 4.7-6.1 Master degree 33.6% 45.4% 4.1-5.2 Doctoral degree 31.5% 56.6% 1.4-1.8
Humanities 62.50% 55.9% 2.7-3.4 STEM 24.50% 48.1% 2.5-3.1 Biomedical 12.50% 60.1% 3.0-3.9
Table 6. Robustness checks – simulations by using alternative retention rates and timeframes.
Panel A. By retention rate
Panel B. By timeframe
Source: Authors’ elaboration on OECD (2013a; 2013b; 2017; 2018a; 2018b; 2019b); Flemish Government Social Security Data; HBS survey; Toerisme Vlaanderen (2017; 2018).
Note: The benefit-cost ratio reports an upper and a lower bound, depending on the fact that the computation is made net or gross the students drop-out rate.
56
BC ratio (Lower bound) BC ratio (Upper bound)
Retention rate: 60% 2.91 3.70 Retention rate (actual): 52.8% 2.61 3.30 Retention rate: 40% 2.07 2.60 Retention rate: 30% 1.65 2.05 Retention rate: 19% 1.19 1.44
All international students leaving after 20 years 2.16 2.71 All international students leaving after 10 years 1.46 1.80 All international students leaving after 5 years 1.02 1.22
Table 7. Descriptive statistics for master and advanced master students.
Source: Authors’ elaboration on data from the KU Leuven, cohorts 2007/2017. Note. The “graduate” sample refers to students graduated between 2007 and 2017. The “graduate and drop-out” sample considers also dropped-out students defined as students enrolled before 2014 that did not get a degree by 2017. Students switching to a different programme are also defined as dropped-out. Mean valueand number of observations given for each of the variables used in the subsequent peer effect models. Output variables are the dependent variables. Individual and programme-level variables are the regressors.
57
Master level Advanced master level Graduate Graduate and drop-out Graduate Graduate and drop-out Mean No. Mean No. Mean No. Mean No. Output variables Time to graduation (years) 1.95 67246 - - 1.81 8129 -Final grade (up to 100) 70.10 67236 - - 72.09 8126 -Study success (proportion of courses succeeded over courses booked in an academic year) 0.99 66865 - - 0.99 8088 -Drop-out student (=1) - - 0.18 81324 - - 0.22 10376 Individual-level variables Gender (female =1) 0.54 67246 0.53 81324 0.54 8129 0.53 10376 International student (=1) 0.11 67246 0.12 81324 0.31 8129 0.31 10376 Extra-EU student (=1) 0.06 67246 0.07 81324 0.20 8129 0.19 10376 Scholarship granted student (=1) 0.13 67246 0.14 81324 0.01 8129 0.01 10376 Age 22.45 67246 22.67 81324 26.05 8129 26.50 10376 Programme-level variables English programme (=1) 0.14 67246 0.14 81324 0.47 8129 0.47 10376 Two years programme (=1) 0.23 67246 0.26 81324 - - -Proportion of international students 0.12 67246 0.12 81324 0.32 8129 0.31 10354
Table 8. Peer effect estimation, master students.
Source: Authors’ elaboration on data from the KU Leuven, cohorts 2007/2017. Note. The measure of the peer effect is given by the proportion of international students at programme level. Time to graduation indicates the years between enrolment and graduation; GPA indicates the graduation grade; study success is obtained by dividing the number of courses passed in the last academic year by thenumber of courses booked in the study plan; drop-out identifies drop-out studentsby means of a dummy variable (equal to one if the student dropped out and zero otherwise). Models for time to graduation, GPA and study success are run on the “graduate” students sample. Model for student drop-out is run on the “graduate and drop-out” students sample. ***<.01; **<.05; *<.1. Standard errors in parenthesis.
58
Variable Time to graduation GPA Study success Drop-out Proportion of international students -0.106 -0.450 -0.007** 0.007 (0.192) (0.712) (0.003) (0.913) Gender (female =1) -0.083*** 1.014*** 0.001*** -0.036*** (0.010) (0.128) (0.000) (0.004) International student (=1) 0.047** -1.297*** -0.001** 0.013* (0.021) (0.229) (0.000) (0.009) Extra-EU student (=1) -0.011 -2.504*** -0.000*** 0.005 (0.023) (0.209) (0.001) (0.009) Scholarship granted student (=1) 0.017 -0.527*** -0.001*** 0.082*** (0.009) (0.073) (0.000) (0.006) Age 0.025*** -0.048** -0.000 0.013*** (0.003) (0.023) (0.000) (0.001) English programme (=1) 1.090 2.370*** -0.010 -0.377*** (0.232) (0.844) (0.010) (0.079) Two years programme (=1) -0.532*** 10.726*** 0.001 -0.380*** (0.043) (0.284) (0.001) (0.018) Program FE Yes Yes Yes Yes Cohort FE Yes Yes Yes Yes No. 67246 67236 66865 81324 R squared 0.553 0.213 0.050 0.326
Table 9. Peer effect estimation, advanced master students.
Source: Authors’ elaboration on data from the KU Leuven, cohorts 2007/2017. Note. The measure of the peer effect is given by the proportion of international students at programme level. Time to graduation indicates the years between enrolment and graduation; final grade indicates the graduation grade; study success is obtained by dividing the number of courses passed in an academic year by the number of courses booked; drop-out identifies drop-out students by means of a dummy variable (equal to one if the student dropped out and zero otherwise). Models for time to graduation, GPA and study success are run on the “graduate” students sample. Model for student drop-out is run on the “graduate and drop-out” students sample. ***<.01; **<.05; *<.1. Standard errors in parenthesis.
59
Variable Time to graduation GPA Study success Drop-out Proportion of international students -0.149 -0.813 0.006 0.152* (0.147) (1.506) (0.011) (0.081) Gender (female =1) 0.002 0.355 0.001 -0.023*** (0.024) (0.290) (0.001) (0.008) International student (=1) 0.075*** -1.966*** -0.003 0.030 (0.024) (0.332) (0.003) (0.021) Extra-EU student (=1) -0.048 -2.981*** 0.002 -0.028 (0.034) (0.371) (0.002) (0.019) Scholarship granted student (=1) -0.170*** -1.199 0.000 0.231*** (0.055) (0.787) (0.002) (0.086) Age 0.013*** -0.087*** 0.000 0.009*** (0.003) (0.031) (0.000) (0.001) English programme (=1) 0.474*** -2.479*** -0.028** -0.190*** (0.107) (0.437) (0.011) (0.054) Program FE Yes Yes Yes Yes Cohort FE Yes Yes Yes Yes No. 8129 8126 8088 10354 R squared (0.792) (0.373) (0.102) (0.275)
Table 10. Heterogeneity analysis of the peer effect estimation by field of study, master and advanced master students.
Source: Authors’ elaboration on data from the KU Leuven, cohorts 2007/2017. Note. The measure of the peer effect is given by the proportion of international students at programme level. Time to graduation indicates the years between enrolment and graduation; final grade indicates the graduation grade; study success is obtained by dividing the number of courses passed in an academic year by the number of courses booked; drop-out identifies drop-out students by means of a dummy variable (equal to one if the student dropped out and zero otherwise). Models for time to graduation, GPA and study success are run on the “graduate” students sample. Model for student drop-out is run on the “graduate and drop-out” students sample. ***<.01; **<.05; *<.1. Standard errors in parenthesis.
60
Time to graduation Final grade Study success Drop-out Master Humanities -0.293 -0.275 -0.009** 0.004 (0.201) (0.65) (0.003) (0.087) STEM -0.116 0.437 -0.003 -0.019 (0.152) (1.713) (0.003) (0.092) Biomedical 1.593 -5.824 -0.012 0.188 (1.187) (3.604) (0.011) (0.304) Student controls Yes Yes Yes Yes Program controls Yes Yes Yes Yes Program FE Yes Yes Yes Yes Cohort FE Yes Yes Yes Yes N 66851 66841 66471 80908 r2 0.555 0.212 0.050 0.326 Master after master Humanities -0.259 -0.426 0.013 0.119 (0.188) (1.841) (0.014) (0.084) STEM 0.133 -2.256 -0.016 0.251 (0.240) (2.639) (0.014) (0.192) Biomedical -0.405 2.884 0.038 0.092 (0.308) (1.858) (0.030) (0.143) Student controls Yes Yes Yes Yes Program controls Yes Yes Yes Yes Program FE Yes Yes Yes Yes Cohort FE Yes Yes Yes Yes N 8081 8078 8040 10282 r2 0.792 0.375 0.103 0.271
Detailed calculations of costs and benefits.
The following Appendix renders a detailed description of the methodology employed in deriving conclusions on the overall costs and benefits of incoming international students on the national economy of the hosting country. Each of the following paragraphs comprises of precise description of the sources of data and method of calculation, divided by the dimensions of costs and benefits.
1. Costs
a. Public spending for education
Data containing national spending on education are provided by OECD (2018b) within the ‘Country Statistical Profile: Belgium 2018’. The variable is defined as “Spending includes instruction and ancillary services for students and families provided through educational institutions.” (OECD, 2019a). Data between 2010 and 2016 is available pertaining to expenditure per student in tertiary education in 2010 prices. As a primary step, the future value (FV) has been computed as ���� = ����(1+��)�� wherein PV is the present value of the expenditure (i.e. the datum in 2010 prices), �� is the inflation rate per year and �� are the number of years considered (i.e. years between 2010 and 2016).
After obtaining the expenditure per student in 2016, the subsequent step is to multiply the value per capita by the number of international students in Flanders, which correspond to 21,898 students(dataFlemishMinistryofEducation).Subsequently,multiplyingtheexpenditureperstudent by the number of international students, we get the overall expenditure for the educational offer to international students per year. The expenditure per student is differentiated between students enrolled at bachelor and master levels, and the doctoral students.
The final step consists in considering the average duration of studies, namely the number of years spent in the country by international students while attending university. For this purpose, we use micro data from the KU Leuven, the largest university in Flanders, as a proxy for the entire population of international students. In particular, we use data from master students, being the majority group across level of education. This way, it is possible to consider the effective time spent in education by international students, and not the theoretical duration of studies. From this analysis, we get the distribution that is presented in Table A1. The obtained proportion will be then applied throughout the paper as the primary reference for the actual duration of studies with the exception of doctoral students, for whom a formal duration of four years is considered. Finally, by multiplying
69
–
Appendix A
the cost per year by the number of years of education, and by adjusting the values for the inflation rate in order to get the result in 2016 prices, we get the value presented in Table A2.
Source: Authors’ elaboration on data from the KU Leuven, cohorts 2007/2017.
Source: authors’ elaboration on data from Flemish Ministry of Education and OECD (2018a; 2018b).
b. Scholarship subsidies
A second dimension of the costs may be represented by scholarship subsidies incurred in relation to the international students. In Flanders, though, the legislation poses specific requests for granting scholarships which comprises of livingin the countryfor at least five years, havingworked or having parents working in Belgium for at least one year12. For the international students, specific scholarships are available, whose amount is considered negligible in the analysis pertaining to all the sources of costs that are instead included.
12 http://www.studyinflanders.be/en/scholarship-programmes/other-funding-opportunities/ (Accessed July 2019)
70
Time between
and degree Percentage of students 1 year 33.11% 2 years 47.30% 3 years 13.59% 4 years or more 5.99%
Table A1. International students’ distribution by duration of studies.
first enrolment
Dimension Metric Value Expenditure per student: tertiary education (OECD, 2018) € € 17,683 Expenditure per student: PhD (FWO, 2018) € € 45,000 Number of international students in Flanders (2016/17) N 15,647 Number of international PhD candidates in Flanders (2016/17) 6,251 Total amount € € 1,682,475,012
Table A2. Calculation of the educational expenditure for international students.
c. International student support
Costs borne by HE institutions for international students support include budget dedicated to activities and staff specifically related to internationalisation. These costs are not included in the analysis due to a lack of reliable data. Still, it is worth to mention them given the contribution in terms of theoretical model. Costs related to international marketing; international office staff and functioning; admission administration; duplication of courses provided in both Dutch and English; activities related to on-boarding of international faculty; contributions for international education networks.
d. Public social costs
Additional costs are induced by the presence of international students in the country, with respect to public spendingfor socialsecurityservices andhealthcare.Weaimat attributingcostsproportionally to the actual use of services made by students, to avoid under or over allocation. Hence, regarding social security, we only consider the proportion of spending related to “Income support to the working age population” which makes up 7.5% of the Belgian GDP per capita (OECD, 2019b). This way, the amount of spending for social security is € 3,175 per student, as the GDP per capita equals to € 42,333 in 2016. The second source of spending is made by healthcare services. With respect to this, the fact that access to these services is strongly stratified by age is considered, with elderly people and children making the most of the total costs. Given the similar population demographics with respect to the Netherlands13, we analyse the distribution of the costs for healthcare services in the neighbouring country14, and apply this stratification to data from Belgium. Indeed, OECD (2018b) reports government spending for healthcare as making up 7.9% of the annual Belgian GDP in 2016, corresponding to € 3,344 per capita. Though, citizens in tertiary education age are found to spend 140% less than the average for men and 65% less for women. Assuming an overall population of students who are gender balanced, a cost for healthcare services attributable to international students equals to € 1,395 (for men) and € 2,030 (for women) is computed. The value reported in Table A3 is obtained by multiplying the sum of healthcare and social security costs by the total number of international students in Flanders and by the duration of studies as described in Section A.1a.
13 https://www.indexmundi.com/factbook/compare/belgium.netherlands/demographics (Accessed July 2019)
14https://www.zorgprismapubliek.nl/producten/zorgverzekeringen/zorgkosten-basisverzekering/row-1/gemiddelde-kosten-voor-de-zorg-in-dezorgverzekeringswet/ (Accessed July 2019)
71
Source: authors’ elaboration on OECD (2018b; 2019b).
2. Benefits
a. Private social contributions
In addition to the government spending for the provision of social services, private contributions plays a significant role in the national balance and can be interpreted as a net benefit for the hosting economy. According to OECD (2018b), in Belgium the private social expenditure is 1.80% of the GDP per capita. The latest data available refer to 2013, so the amount has been expressed in 2016 prices by computing the equivalent Future Value as given in Section A.1a, making up € 737 per capita. Further, by multiplying this value by the number of international students and by the duration of studies, the final value given in Table A4 is obtained.
72
Dimension Metric Value Healthcare government expenditure per capita € € 3,344 Healthcare government expenditure age 20-24 € € 1,395 (Men) € 2,030 (Women) Social security: Income support to the working age population % of GDP 7.50% GDP per capita (2016) € € 42,333 Social secutiry expenditure per capita € € 3,175 Number of international students in Flanders (2015/16) N 21,898 Total amount € € 230,392,557
Table A3. Calculation of the expenditure for social services for international students.
Dimension Metric Value Private social expenditure (in 2013) % of GDP 1.80% GDP per capita (2013) € € 39,769 Private social expenditure per capita (in 2016 prices) € € 737 Number of international students in Flanders (2015/16) N 21,898
Table A4. Calculation of the private social expenditure by international students.
Total amount € € 41,191,187
Source: authors’ elaboration on OECD (2018b).
b. Tuition fee income
The amount of tuition fees in Flanders is differentiated by level of tertiary education and, in some cases, by student nationality. Additionally, for students coming from the European Economic Area (EEA), the level of tuition fees is set by the government and in the a.y. 2015/16 it is equal to € 890 for every course at bachelor or master level. Non-EEA students may have to pay increased tuition fees, whose amount is independently set by HE institutions. Information about the amount of tuition fees required to non-EEA students has been retrieved by the Institutional websites, pertaining to the academic year 2015/16. A number of master programmes at KU Leuven and Antwerp University require increased tuition fees, making up an average of nearly € 2,700 a year per student at KU Leuven and € 2,900 a year at Antwerp University. VUB increases the tuition fee for all non-EEA students, requiring around € 2,950 per student. However, no evidence of additional tuition fees emerged for Ghent University, wherein an amount of € 890 is required to all students, independently from their nationality. Finally, no information was retrieved for Hasselt University, for which a weighted average of the previous fees has been used. Despite this lack of information, it is worth mentioningthatonly3%ofthetotalamountofinternational studentsenrolledat thislatterinstitution, so that a variation in this sense cannot outweigh results. Subsequently, the amount of tuition fee per institution has been multiplied by the number of master students coming from non-EEA countries, as rendered by OECD (2018b). To make the computation as precise as possible, the overall proportion of non-EEA master students has been divided according to the composition of internationalstudentsperinstitution,asreportedinSectionA.1a(hence,49%enrolledatKULeuven, 22% at Ghent University, 13% at Antwerp University, 13% at VUB, 3% at Hasselt University).
Moreover, for PhD students a different computation is required, for whom the tuition fee is required in the first and last year of attendance and amounts to € 450 per student per year. In consideration of the PhD students enrolled in 2015/16 as evenly distributed over cohorts (i.e. one fourth per year, being an average PhD programme 4-years long), we multiply the yearly tuition fee by half of the number of international PhD students (i.e. assuming that half of them will be enrolled in the first or in the last years).
Furthermore, by summing the ‘regular’ tuition fee by the number of non-EEA bachelor or master students to the tuition fees for non-EEA master students by the weighted additional tuition
73
fee plus the tuition fees for PhD students by the number of PhD students enrolled in the first or last years, the total value given in Table A5 is obtained.
c. Good consumptions (non-tuition fee expenditure)
Expenditure for good consumption is obtained by the Household Budget Survey 2014, a survey administered by the Flemish Statistical Office collecting detailed information about household expenditures for: food and non-alcoholic beverages, alcoholic beverages and tobacco, maintenance and repair of personal transport, transport services, clothes and shoes, real rent, communication devices, water and waste collection, culture and leisure, electricity, gas and fuels, education, furniture, household and maintenance, restaurant and catering, healthcare and personal care. There is no identification for international students in the survey. Still it is possible to identify families with kids in tertiary education age (between 19 and 30 years old), whose status was identified as “student” in the survey. Hence, 800 families were considered, whose monthly expenditure for goods and services is € 788.4 per person (i.e. the household spending has been divided by the number of household components). In 2016 prices, this makes up € 808 per capita per month, and this value has beenmultipliedbytheoverallnumber ofinternational studentsandbytheaveragedurationofstudies in order to estimate the overall spending for consumption of goods, as given in Table A6.
74
Dimension Metric Value Tuition fee per student (2015/16) € € 890 Tuition fee per PhD student (2015/16) (first and last year) € € 450 Tuition fee per non EEA master student (weighted average) € € 2,283 Number of international PhD students in Flanders (evenly distributed) N 6251 Number of non EEA master students in Flanders N 3176 Other international students in Flanders N 12562 Total amount € € 51,220,833
Table A5. Calculation of overall tuition fees paid by international students.
Source: authors’ elaboration on data retrieved from HE institutions’ websites.
Table A6. Calculation of the monthly good expenditure by international students.
Dimension
Monthly
Total
Source: authors’ elaboration on HBS survey.
d. Income from visitors
An additional source of economic benefit derives from the impact of people visiting relatives and friends whilst they are studying in the hosting country. As per the report by the Flemish Tourism Office (Toerisme Vlaanderen, 2017) a total amount of 14.76 million people visited Flanders in 2016. Of them, 49% visited art cities, where university campuses are located. The following report by the Flemish Tourism Office (Toerisme Vlaanderen, 2018) focuses on art cities, presenting results from a survey taken among people visiting Flanders. From the analysis it is discerned that 8% of people visiting art cities cited “visiting relatives of friends” as the primary purpose for coming. It can be noted that the overall number of people coming to Flanders to visit the region in 2016 was around 579,000 people, as given in Table A7. The following step is to trace back the presence of tourists to that of international students. Moreover, to make a detailed analysis, we consider the foreign population in Belgium by nationality15, computing a ratio to indicate the proportion of international students by nationality over the overall number of foreign people. Results are provided in Table A8.
For instance, the ratio computed for France asserts that international students make up around 10% of the total French population living in Belgium. By multiplying the number of international students by the average length of stay in Flanders and expenditure per day, the final value of around € 47 million is obtained that can be imputed to the presence of tourists visiting international students in 2016. Then, by multiplying this value by the average duration of studies, we get the final value of € 90.6 million.
15 https://www.statista.com/statistics/517235/foreign-population-of-belgium-by-origin/ (Accessed November 2019)
75
Metric Value
prices) € € 808
consumption (in 2016
N 21,898
Number of international students in Flanders (2015/16)
€ € 542,548,613
amount (yearly)
Metric Value
to
N 14,760,000
Table A7. Numbers of tourists visiting international students in 2016.
Dimension
Visitors coming
Flanders (2016)
Percentage of visitors going to art cities
49%
Percentage of people visiting relatives and friends % 8%
Total number of people coming to the main cities to visit relatives and friends
Source: authors’ elaboration on Toerisme Vlaanderen (2017; 2018).
578,592
Source: authors’ elaboration on Toerisme Vlaanderen (2017; 2018).
3. Long term labour market outcomes and net contribution to GDP
For estimating the long term effect driven by the presence of international students, we first of all estimate the probability of staying and looking for a job in Belgium after graduation. Therefore, we use Flemish Government Social Security Data in order to match information about tertiary education attainment of Flemish students graduated in 2010/11 to the following labour market outcomes over a time frame of 10 quarters (until 2013). As mentioned in the Section 5 ‘Data Sources’, an
76
%
N
Foreign
Ratio Proportion of visitors per country related to international students Length of stay Expenditu re per day Total France 165,486 16856 10.19% 58934 2.12 135 € 43,074,589 Italy 156,063 1166 0.75% 4323 2.30 141 € 3,580,171 Netherlands 155,239 4438 2.86% 16541 1.84 129 € 10,026,567 Romania 87,616 432 0.49% 2853 2.05 150 € 2,240,287 Morocco 81,215 785 0.97% 5592 2.05 150 € 4,391,742 Poland 71,537 275 0.38% 2224 2.05 150 € 1,746,648 Spain 64,049 629 0.98% 5682 2.64 132 € 5,056,784 Portugal 46,611 278 0.60% 3451 2.05 150 € 2,709,940 Germany 39,469 770 1.95% 11288 2.26 140 € 9,120,724 Turkey 36,233 218 0.60% 3481 2.05 150 € 2,733,730 Others 454,038 35255 7.76% 44926 2.05 150 € 35,280,269 Total amount € 119,961,452
Table A8. Calculation of the yearly expenditure by tourists coming to Flanders to visit international students.
population in 2018 Student population in 2016
identification label for international students is not provided, however, we use the citizenship and the status of scholarship granted student for this purpose. In detail, havingno wayto specificallyidentify international students, we consider only foreign students that did not get a scholarship. The reason is twofold. First, as discussed in Appendix A.1.b, there are not many scholarships available for international students in Flanders, so that foreign students getting a scholarship are likely to live in Flanders since many years before enrolling at university and they cannot be labelled as international students. Second, we assume that the socio-economic status of international students is higher than that of students whose families are moving for economic reasons. Hence, international students are lesslikelytobeeligibleforascholarship.Matchingthedataabouteducationalattainment withlabour market outcomes, a retention rate by 52.8% is obtained, with high heterogeneity by macro-area as given in Table A9. Students from neighbouring countries have a higher retention rate (64.9%) compared to those having extra-European nationalities (38.4%).
Majority of the arguments coming from this analysis cannot hold without considering that the decision to stay and work in a foreign country is a dynamic phenomenon, that must be analysed as such. To date, no data have been collected about the length of stay of international students working in Flanders. Though, a proxy is represented by the attitude to stay in the country shown by highly educated immigrants in the past. Hence, the DIOC (Database on Immigrants in OECD Countries) database well serves the purpose, providing information about the number of years spent in a country by foreign citizens, together with the highest educational attainment (ISCED level) and the sector they work in (ISCO level). Besides this, the file B of the database contains details about Census data 2011 and specifically refers to immigrants’ educational level and length of stay in the country. Selecting immigrants resident in Belgium who got a bachelor degree or higher and were born in a foreign country, we get a distribution with respect to the length of stay that is given in Table A10.
77
Internationalstudentsretentionrate 52.8% Neighbouringcountries(France,Netherlands, Germany) 64.9% OtherEUcountries 60.4% EuropeExtra-EU 51.7% Extra-Europe 38.4%
Table A9. Retention rates of international students after graduation.
Source: authors’ elaboration on Flemish Government Social Security Data.
Based on the assumption that international students in the future will show a probability to stay similar to highly educated immigrants in the past, distribution to estimate the length of stay of international students in the future is used. Table A10 shows the average years in Belgium spent by highly educated immigrants.
Table A10. Average years in Belgium spent by highly educated immigrants.
Source: authors’ elaboration on DIOC database (OECD, 2013a).
This is the primary basis for the computation of the benefits and costs generated by international students, conditional on their decision to stay after graduation. Consequently, benefits are related to contributions to the economy represented by wage taxation, good consumption and private social contributions; instead, costs are represented by social costs with particular reference to healthcare services (stratified by age), income support to the working age population, family services (since 5 years fromgraduation, being the age for the first child in Belgium around 29) and pensions (from the age of 65 to 81, which is the average life expectancy in Belgium, OECD, 2017). With respect to the benefits for the hosting economy, majority of the contribution depends on the sector in which graduate students are employed and, hence, on the amount of taxes paid. This is again provided within the DIOC database in its file D, which contains data from the European Labour Force Survey and reports the sector in which foreign people work. Immigrants who completed tertiary education and work in Belgium are so distributed across ISCO sectors: 7% of them have an occupation that requires elementary activities (ISCO 1); 35% of them are workers with occupations related to sales, production, services (ISCO 2); 58% of them are professionals and managers (ISCO 3/4). This specification is then used for estimating the average salary over time depending on the occupation typology. Data have been retrieved from the website Vacature.com elaborating wage data for Flandersincollaboration with theKU Leuven16. An average taxationrate of 52.80%on gross salaries has been computed (OECD, 2018a), plus an employer contribution by 32.80% (OECD, 2019b).
78
YearsinBelgium One year or less One to five years Five to ten years Ten to twenty years More than twenty years AverageYearsinBelgium 1 3 7 15 30 Distribution of the population 13% 19% 21% 24% 23%
16 https://www.vacature.com/nl-be (Accessed July 2019)
Expenditures for food consumption and private social security are perceived as constant over time, as presented in Section A.2c and A.2a, respectively. Social security costs have been discerned as income support for the working age population (as presented in Section 1.d), plus family services (when graduate students are 30 or older), plus pensions (when graduate students are 65 or older). In Belgium, data about pensions report that retired people receive around 81% of their previous wages as social contributions (OECD, 2013b).
Based on this, the present value of net benefits and costs has been computed, with an upper and a lower bound of estimation. Indeed, the precise number of students who will enter the local job market depends on the students drop-out rate. This has been found to be equal to 24% as national average (OECD, 2010). As a double check, we compute the student drop-out rate on the population ofinternationalstudentsenrolledatKULeuven,observingadrop-outrateby21-22%,whichislower than the national value that may be used as lower bound. Hence, the lower bound is asserted to the caseinwhich24%ofthestudentsdrop-out fromhighereducationbeforegraduating;theupperbound to the case in which all students gained their degree. As a discount rate for future economic flows, the average inflation rate between 2010 and 2017 is used, which is equal to 1.8% (OECD, 2018b). As time horizon, we use T=56 years, being the average life expectancy for Belgian population equal to 81 years (OECD, 2017). Subsequently, we multiply the average costs and benefits per capita by the number of international students over time, depending on the estimation of their retention rate right after graduation and over the following years (OECD, 2013b) and net of student drop-out rate (27%, OECD, 2010) and average unemployment (7.9% one year after graduation, as retrieved from the Social Security data). As a result, a lower bound of € 4,230 million as net benefits, and an upper bound of € 5,566 million is obtained.
79
References for Appendix.
OECD (2010). How many students drop out of tertiary education?, in Highlights from Education at a Glance 2010, OECD Publishing, Paris.
OECD (2013a). Database on Immigrants in OECD and non-OECD Countries: DIOC 2010/11. Retrieved from http://www.oecd.org/els/mig/dioc.htm
OECD (2013b), Pensions at a Glance 2013, OECD and G20 Indicators. OECD Publishing, Paris.
OECD (2017). Pensions at a Glance 2017, Country Profiles: Belgium. OECD Publishing, Paris.
OECD (2018a), Education at a Glance 2018: OECD Indicators, OECD Publishing, Paris.
OECD (2018b), Country statistical profile: Belgium 2018/4, in Country statistical profiles: Key tables from OECD, OECD Publishing, Paris.
OECD (2019a), Education spending (indicator). doi: 10.1787/ca274bac-en (Accessed on 29 March 2019)
OECD (2019b), Social Expenditure Update 2019, Public social spending is high in many OECD countries, OECD Publishing, Paris.
Toerisme Vlaanderen (2017). Tourism in Key Figures Edition 2017. Retrieved from https://www.vlaanderen.be/nl/publicaties/
Toerisme Vlaanderen (2018). Art cities research 2018. Retrieved from https://www.vlaanderen.be/nl/publicaties/
80