Durham Parks and Recreation 2025 Comprehensive System Plan
Durham Parks & Recreation Comprehensive System Plan
CITY OF DURHAM, NC 2025
ACKNOWLEDGMENTS
CITY OF DURHAM STAFF
Wade Walcutt, Director
Joy Guy, Assistant Director
Rukea Womack, Assistant Director
Denise Chaplick, Assistant Director
Tom Dawson, Principal Planner
Mary Unterreiner, Public Information & Communications Manager
Rich Hahn, Business Services Manager
Robert Jennings, Parks Superintendent
Kyesha Jennings, Creative Content Producer
Almira Marshall, Senior Business Systems Analyst
Gina Morais, Recreation Manager
Emilie McIntosh, Liaison to RAC and Durham Parks Foundation
DURHAM CITY COUNCIL
Mayor Leonardo Williams
Mayor Pro-Tem Mark-Anthony
Middleton, Ward 2
Nate Baker, At-Large
Javiera Caballero, At-Large
Chelsea Cook, Ward 3
DeDreana Freeman, Ward 1
Carl Rist, At-Large
DURHAM RECREATION ADVISORY COMMISSION
Cedric Burke, Chair
Karthik Sundaramoorthy, Vice Chair
Girija Mahajan
Dale McKeel
Mary Parsons
Teah Rawlings
Gabriell Rivero
Bo Ferguson, City Manager
Keith Chadwell, Deputy City Manager
Bertha Winbush, Deputy City Manager
Executive Summary
The 2025 City of Durham Parks and Recreation Comprehensive Plan is a visionary plan that is intended to guide the growth and operations of the Durham Parks and Recreation Department (DPR) over the course of the next ten years.
The development of a Parks and Recreation Comprehensive Plan is an opportunity for the DPR staff, appointed and elected officials, and the public to work with a team of parks planning consultants to reflect on the state of DPR, changes that are happening in the City, and future growth of the City. This comprehensive engagement, combined with multiple analyses performed with the project team has resulted in a broad array of recommendations and action items for the City to execute over the upcoming ten years. These recommendations and action items address what was found during both the engagement efforts and the analysis of the parks and recreation system.
This Executive Summary provides a brief overview of the planning process, engagement efforts, results of the inventory and analysis conducted, and the resulting recommendations, strategies, and action items.
DPR Mission Statement
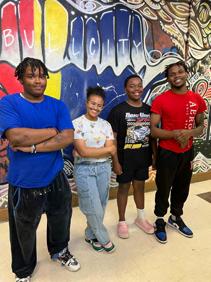
To create fun, enriching, inclusive programs, experiences, and spaces to build a safer, happier, and healthier Bull City!
DPR Vision Statement
Durham Parks and Recreation will be Durham’s leading resource for recreational choices to help citizens enjoy life while contributing to their health and well-being.
2025 Comprehensive Plan Guiding Principles
The process to produce this plan spanned two years, engagement with over 2,000 Durham residents, and nearly a dozen technical assessments and analyses. Through this, the project team worked with staff to identify the guiding principles of the Comprehensive Plan, these principles are the foundation of the plan distilled from all of the information gathered in the planning process.
The Guiding Principles are meant to serve as guideposts for DPR as they are implementing the plan over the next 10 years. When new opportunities arise DPR can evaluate those opportunities and their alignment with this plan using the Guiding Principles. All recommendations and action items in this plan tie to one or more guiding principle. These principles are meant to guide how the Department interacts internally, across the larger City of Durham organization, and with the community. The Guiding Principles for Durham’s 2025 Comprehensive Parks and Recreation Plan are:
• Durham Parks and Recreation puts Fairness First
• Durham Parks and Recreation is Rooted in the Community
• Durham Parks and Recreation has Foresight
• Durham Parks and Recreation will be Bull City Great
• Durham Parks and Recreation prioritizes Stewardship
Fairness First
This guiding principle illustrates a commitment to putting fairness first in all that DPR does. The future of Durham is one where all community members, regardless of socioeconomic status, race, age, or ability, have equal opportunities to benefit from the parks and recreation services that DPR o ers. Recommendations stemming from this principle focus on creating inclusive, accessible, and well distributed parks that contribute to the overall well-being of the population. Recommendations also focus on reinvesting in parks in a way that prioritizes historically underserved communities and telling the long histories of Durham’s community.
Rooted In The Community
This guiding principle centers DPR in the community to make sure that what is being o ered to the community is clearly in line with their wants, needs, and expectations. Recognizing that parks and recreation are a significant component of the community’s culture necessitates that future o erings are relevant, and that decision making is clear and transparent to the community. Recommendations stemming from this principle focus on maintaining the responsiveness of the department, increasing transparency, and making sure that engagement e orts continue to be thoughtful and impactful.
Foresight
This guiding principle acknowledges the rapid growth of Durham and shows a commitment to being proactive when it comes to coping with growth. Rapidly growing communities like Durham often struggle to balance providing for existing residents while also preparing to extend high quality services to new areas of the community. Recommendations related to this principle seek to ensure the Department is maintaining an understanding of growth trends, is providing a high level of service to the community and has plans in place regarding future expansion as the city grows.
the community and has plans in place regarding future expansion as the city grows.
Bull City Great
This guiding principle recognizes that providing a high-quality experience to the community starts with having a strong organization that is committed to continuous improvement of themselves and the services they are providing. Providing diverse and meaningful experiences to the community requires a lot of internal
This guiding principle recognizes that providing a high-quality experience to the community starts with having a strong organization that is committed to continuous improvement of themselves and the services they are providing. Providing diverse and meaningful experiences to the community requires a lot of internal work and coordination. Recommendations related to this principle seek to ensure that the department has adequate technology resources, critical training, and collaboration across the organization. These recommendations also focus on ways to elevate operations and maintenance system wide.
Stewardship
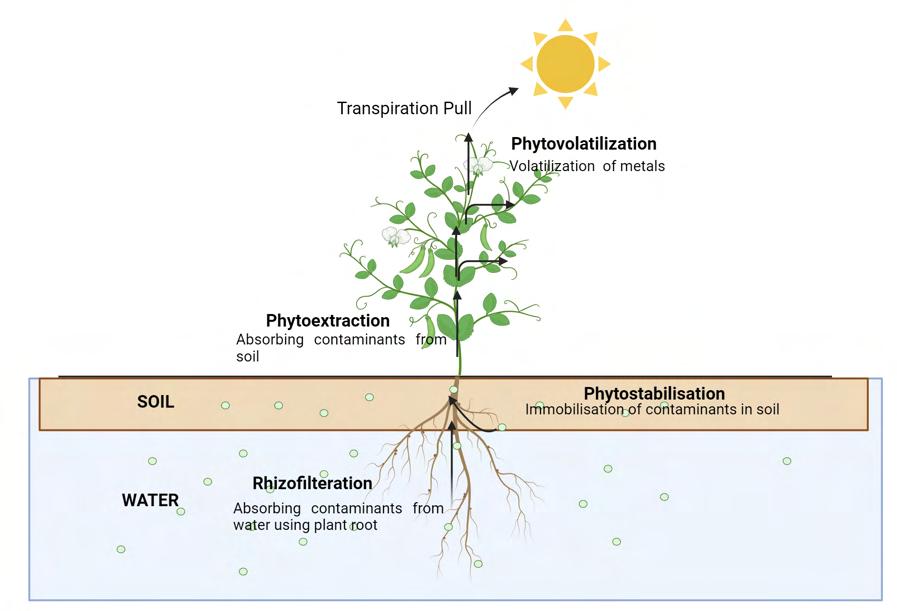
This guiding principle acknowledges that climate change and its impacts are real and have an impact on the community and that parks play a vital role in improving the environment and mitigating impacts of climate change. The community already recognizes parks as a major component of their quality of life in terms of social, physical, and mental wellbeing. Parks can also be critical pieces of environmental infrastructure that can mitigate numerous environmental challenges and impacts. Recommendations related to this principle are centered around how to leverage parks as gamechangers in addressing stormwater runo , air quality, excessive heat, biodiversity, and site contamination.
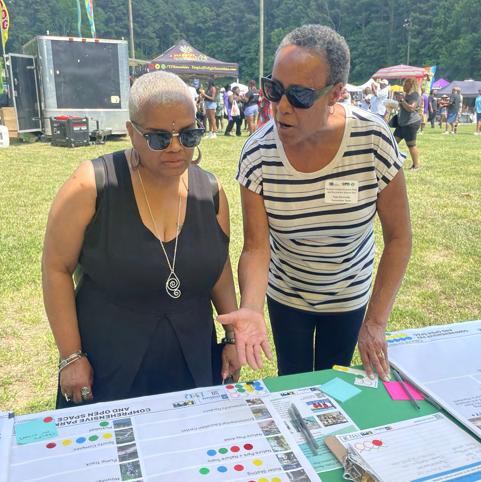
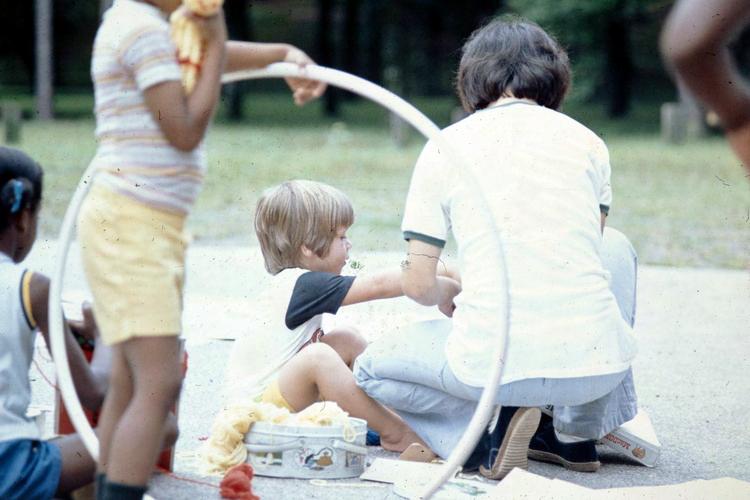
Engagement
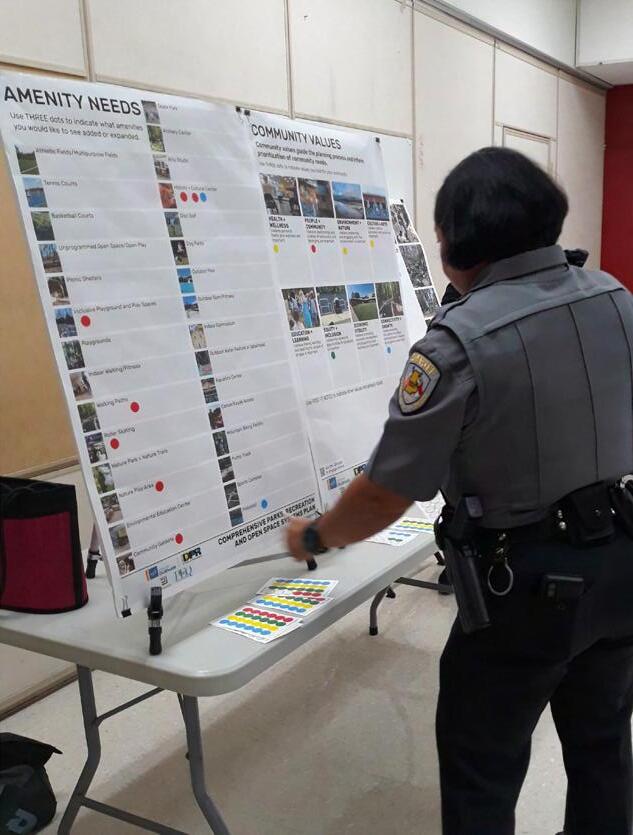
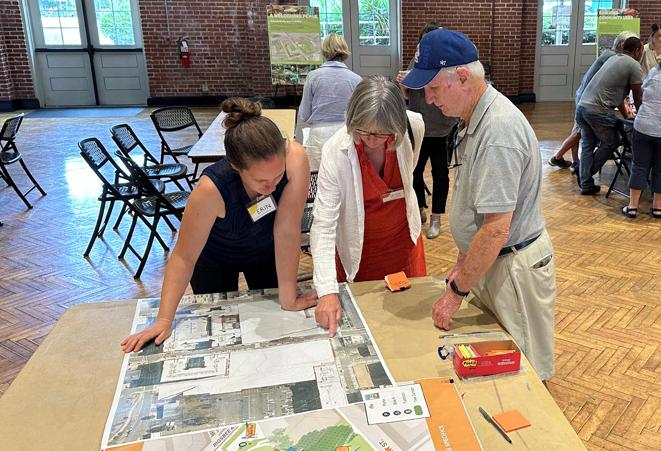
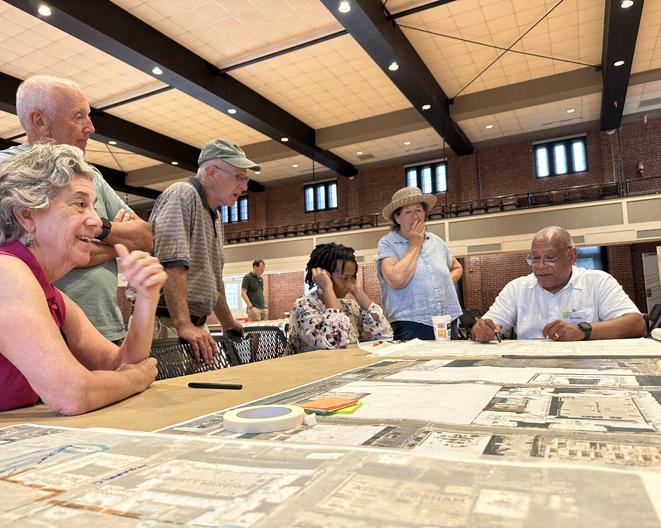
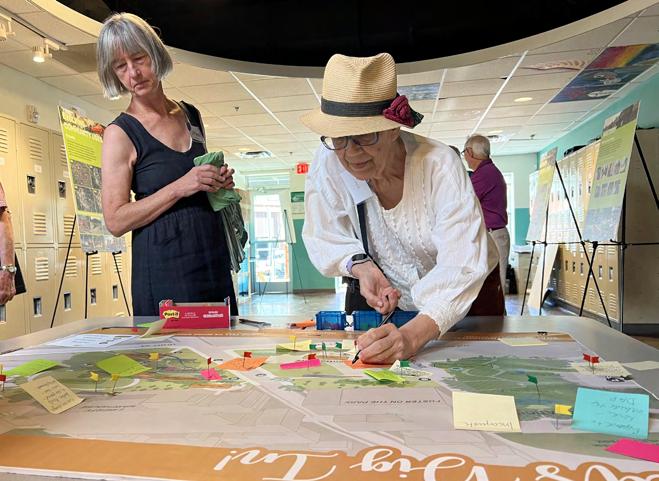
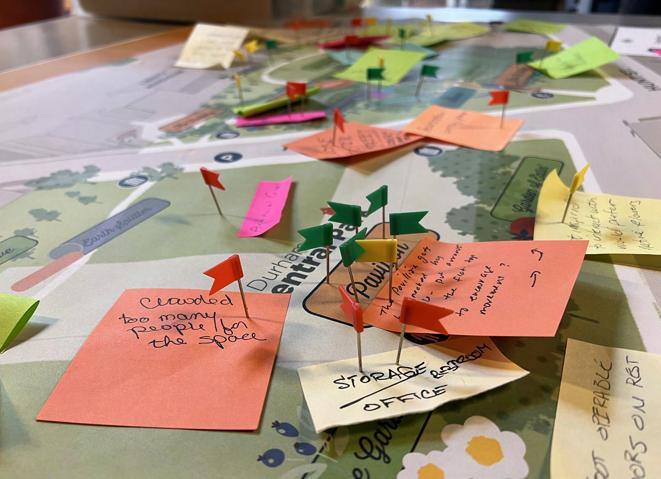
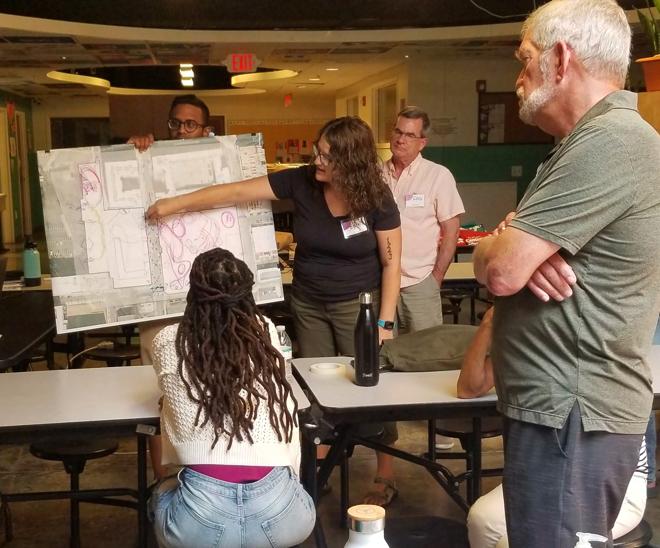
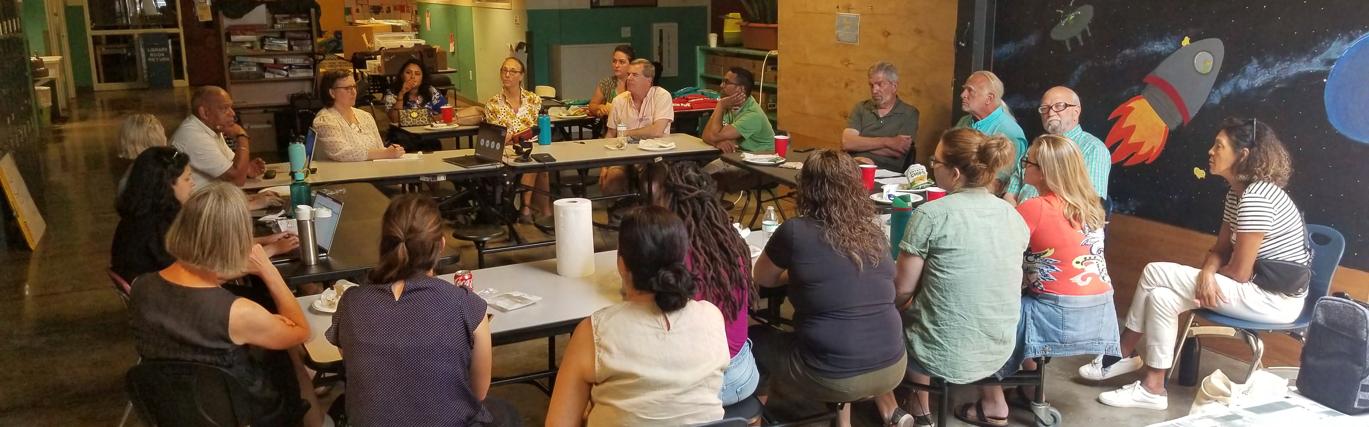
Engagement efforts for the development of the Comprehensive Parks and Recreation Plan can be divided into three distinct areas: community engagement, staff engagement, and engagement with elected and appointed officials.
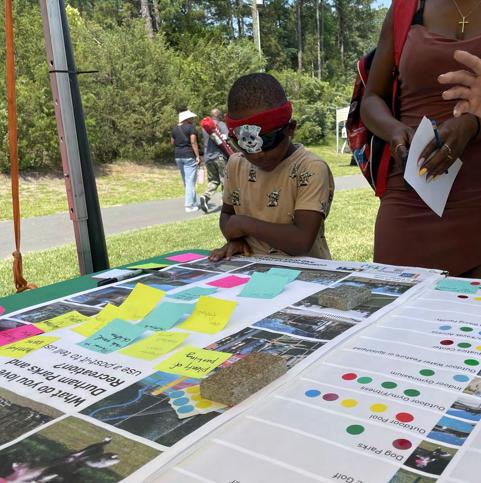
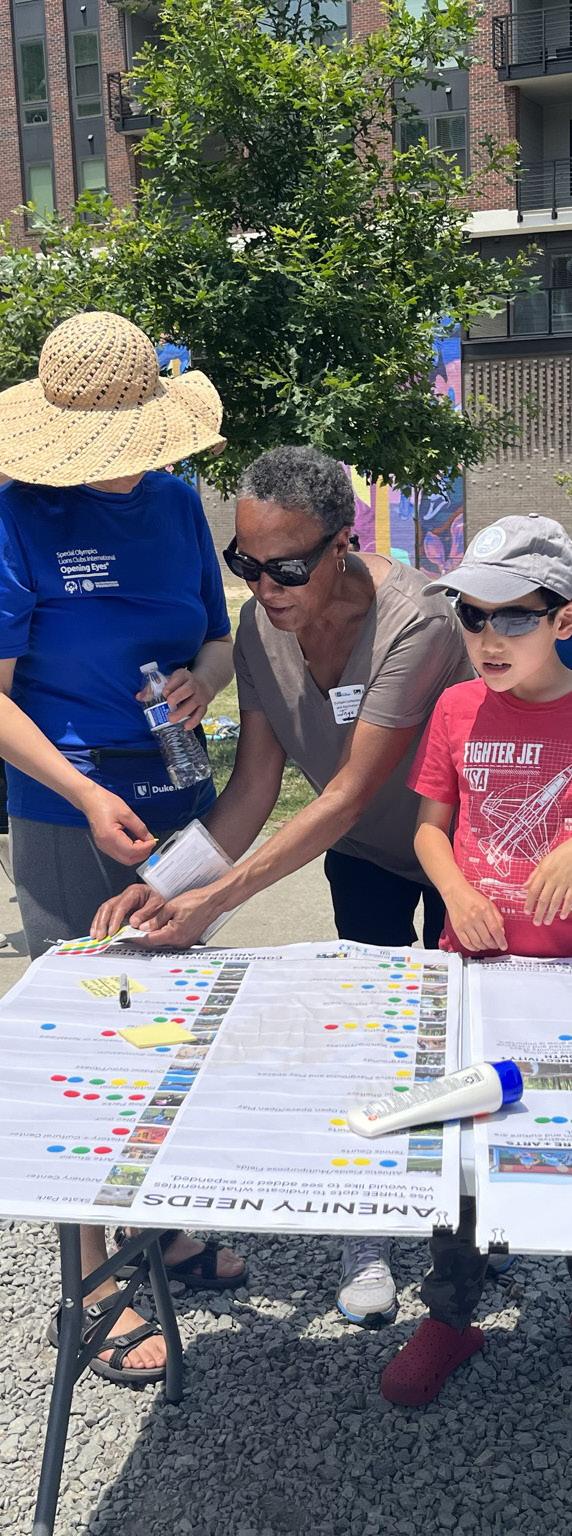
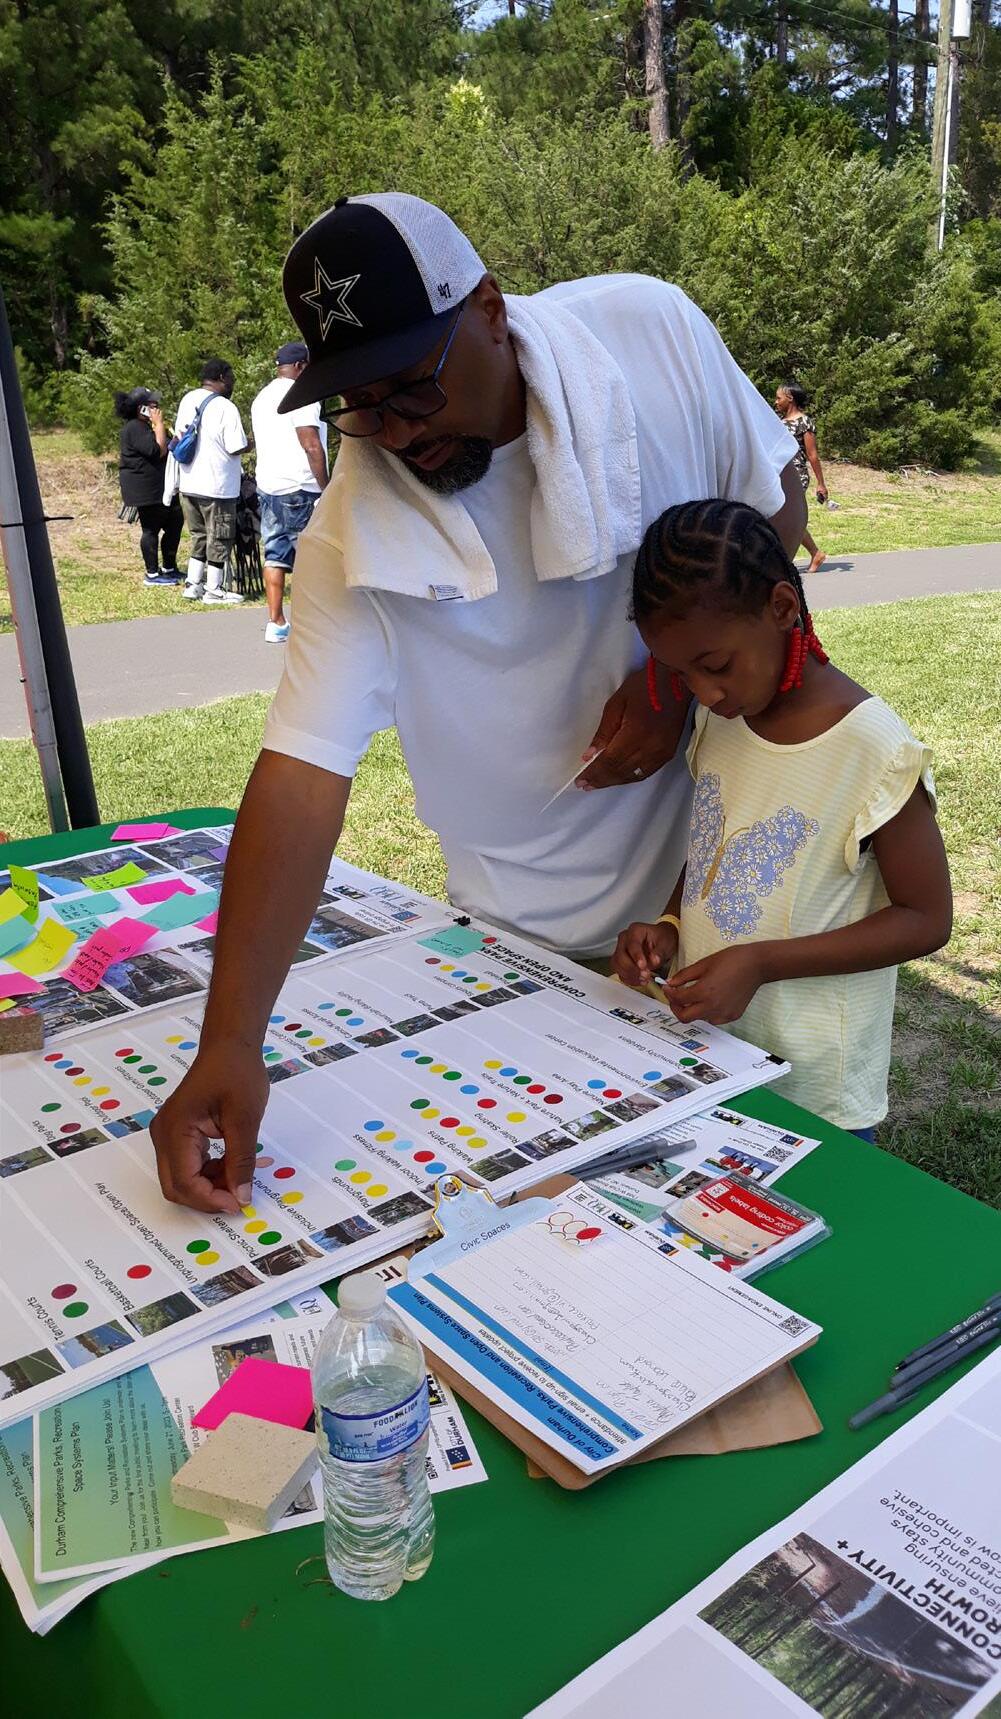
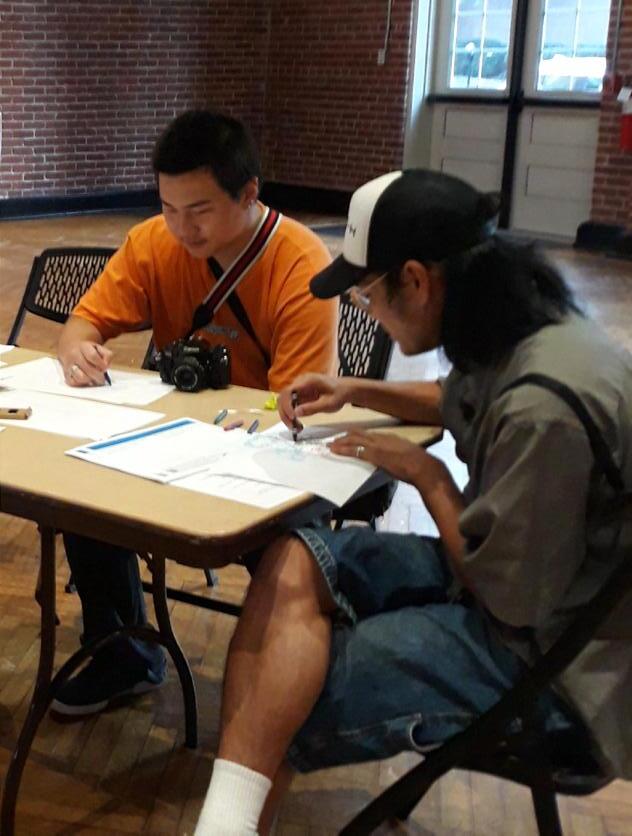
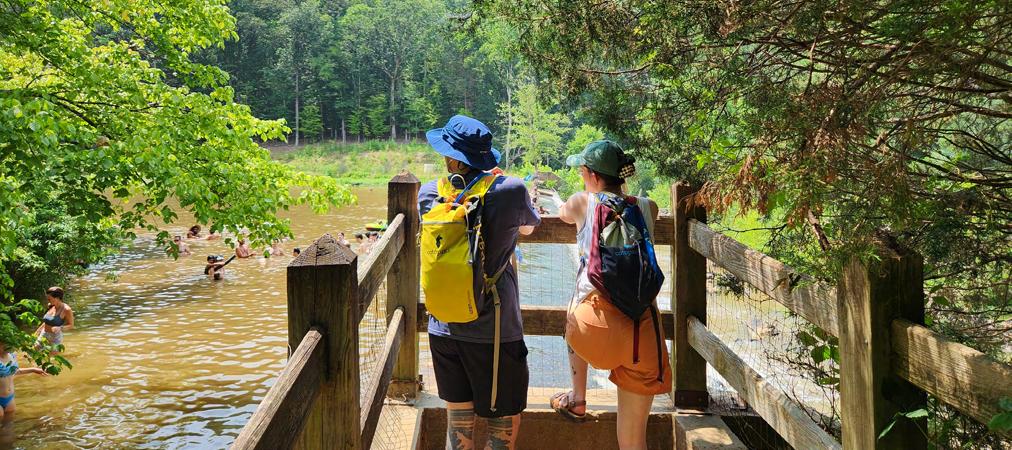
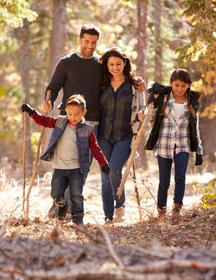
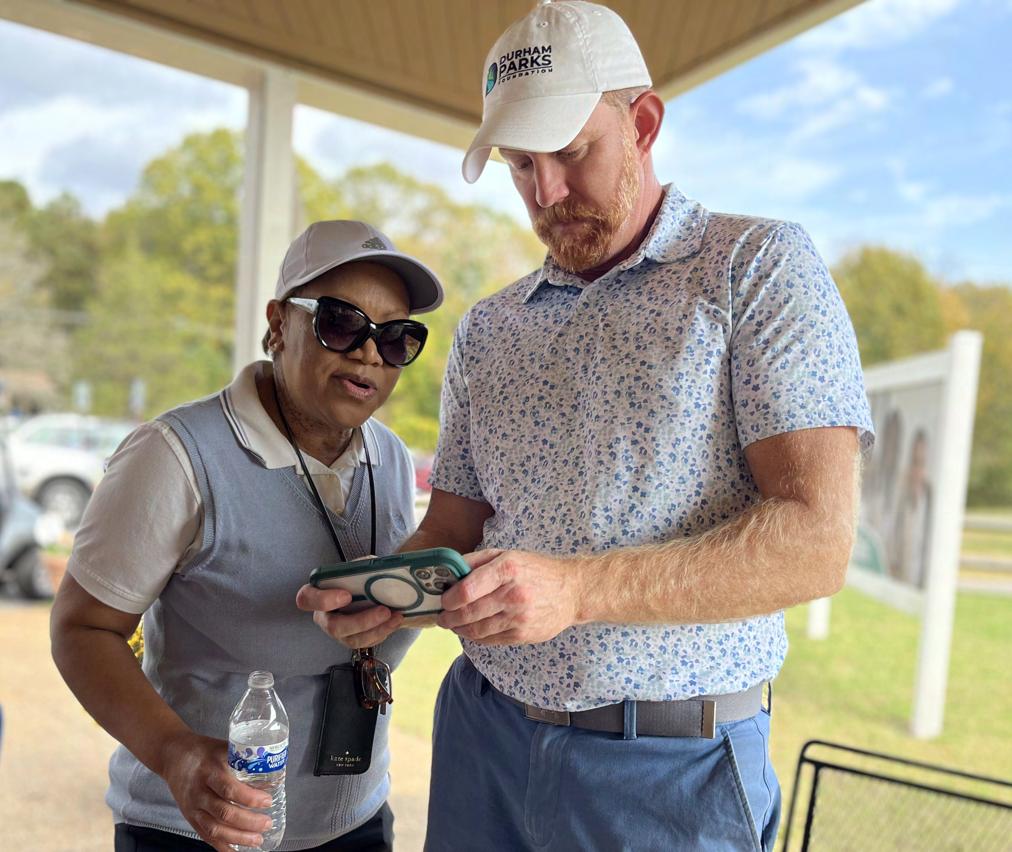
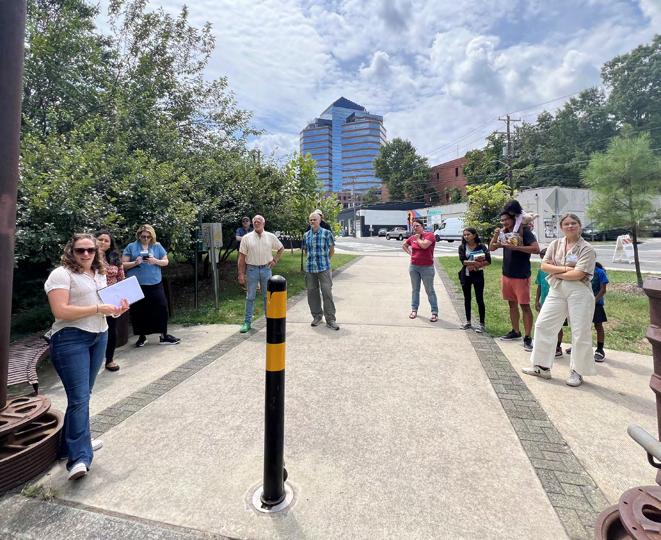
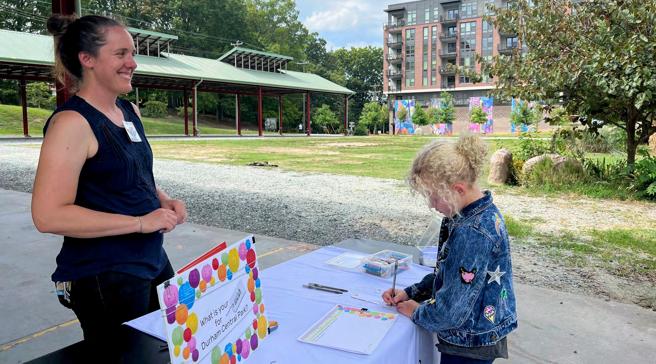
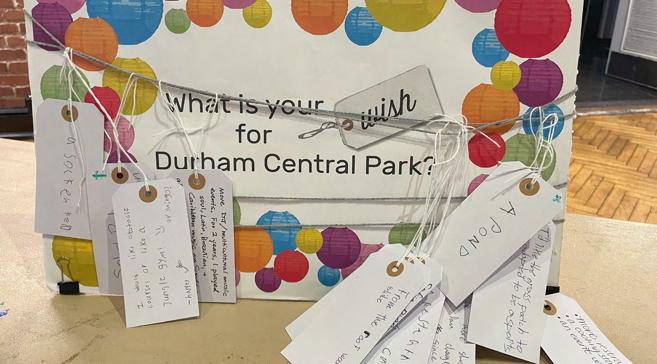
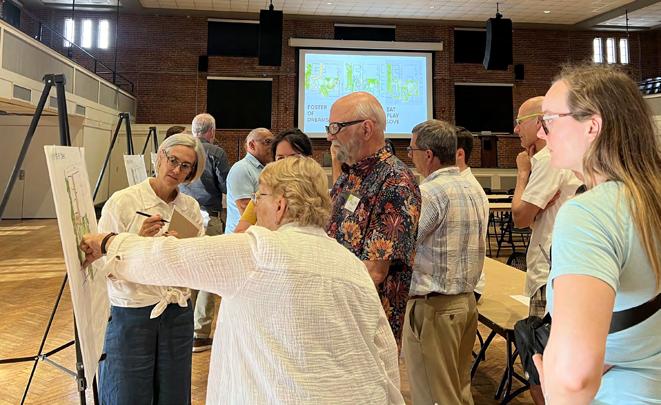
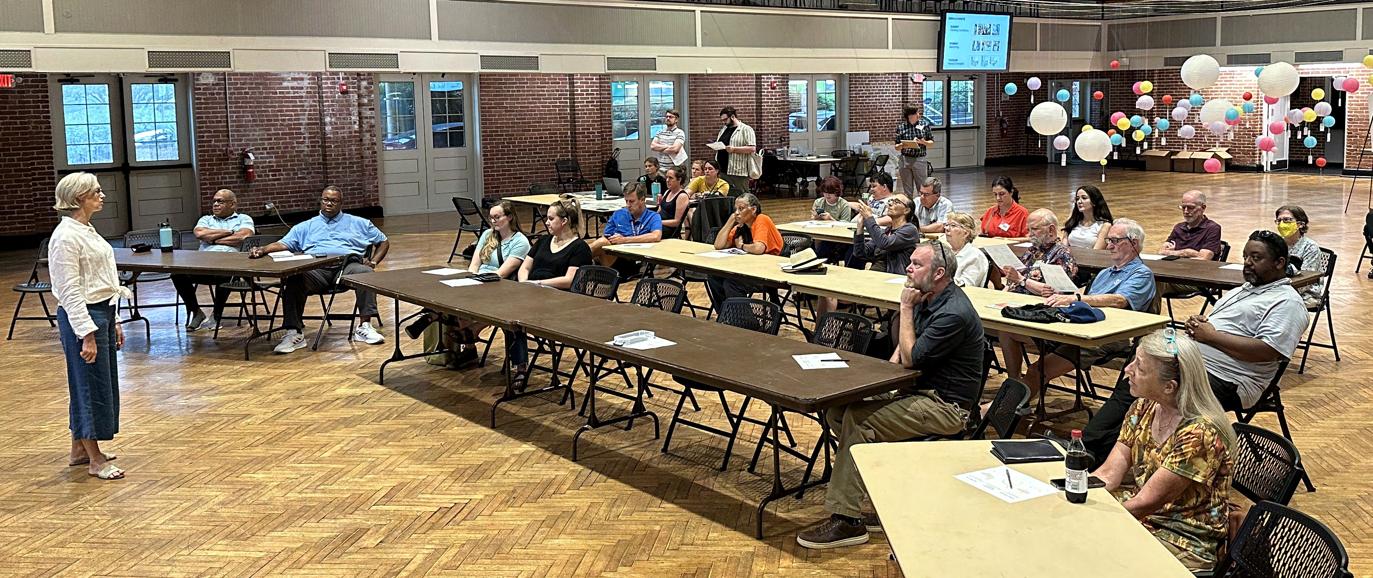
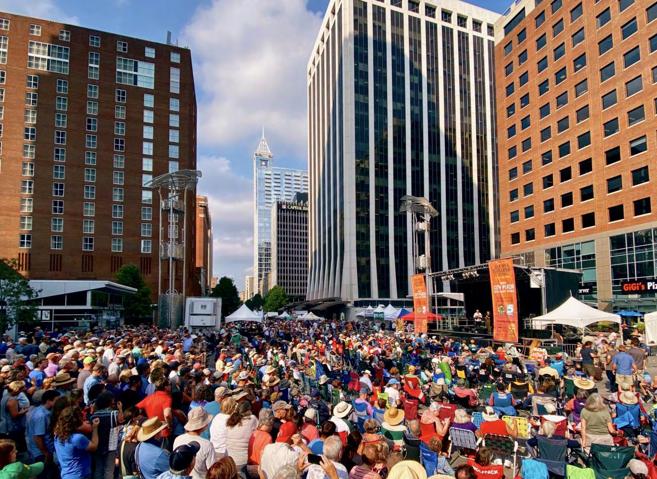
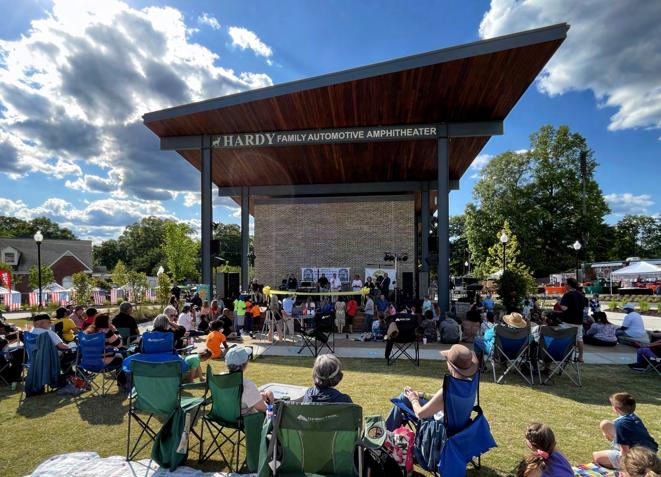
Community engagement was conducted through multiple methods including a Scientific Survey, a public opinion survey, focus groups, and open house meetings. Feedback from community engagement revealed high levels of engagement and use of the DPR programs. The public also indicated high satisfaction with DPR’s ongoing evaluation and relevancy of programs. Conversations with the public revealed that the top values for the community as it relates to parks and recreation are:
• Supporting people and the community,
• Creating a healthy natural environment and connections with nature,
• Creating a parks and recreation system that is equitable and inclusive, and
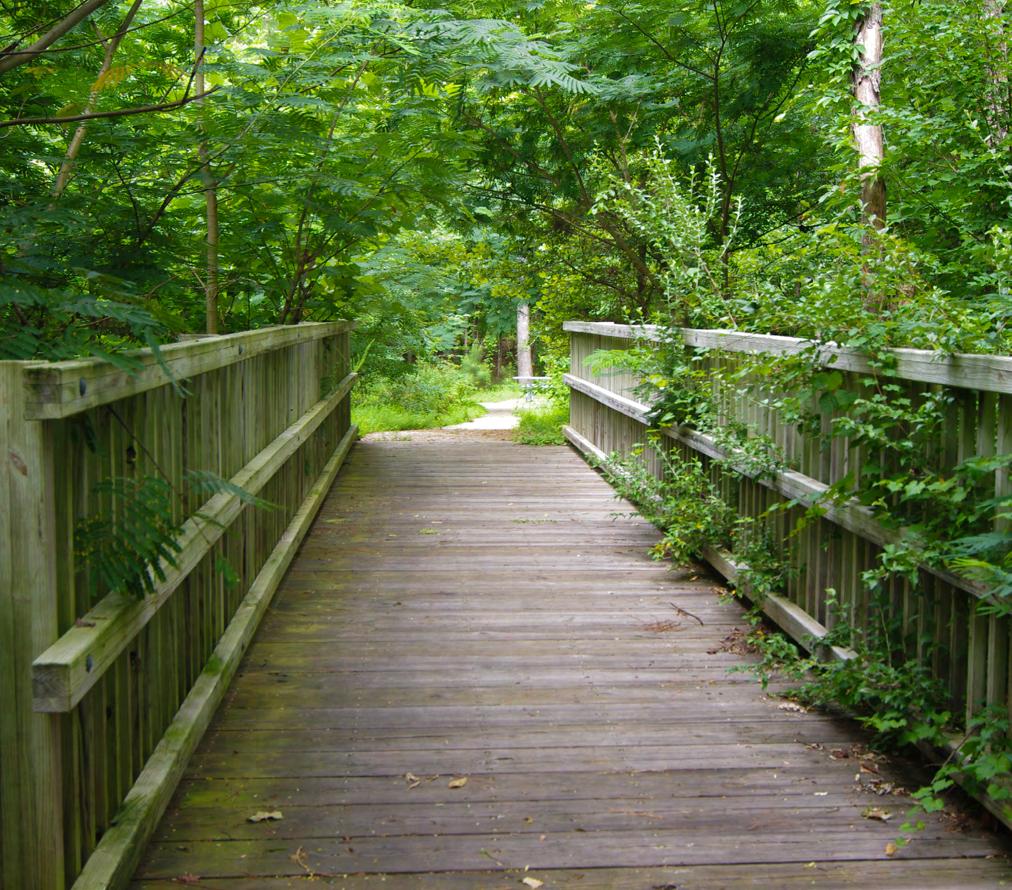
• Increasing connectivity to cope with growth. The highest ranked amenity need in the scientific survey was both the addition of year round restrooms and increasing the mileage of natural surface trails. Focus group sessions, which were held to elicit more nuanced
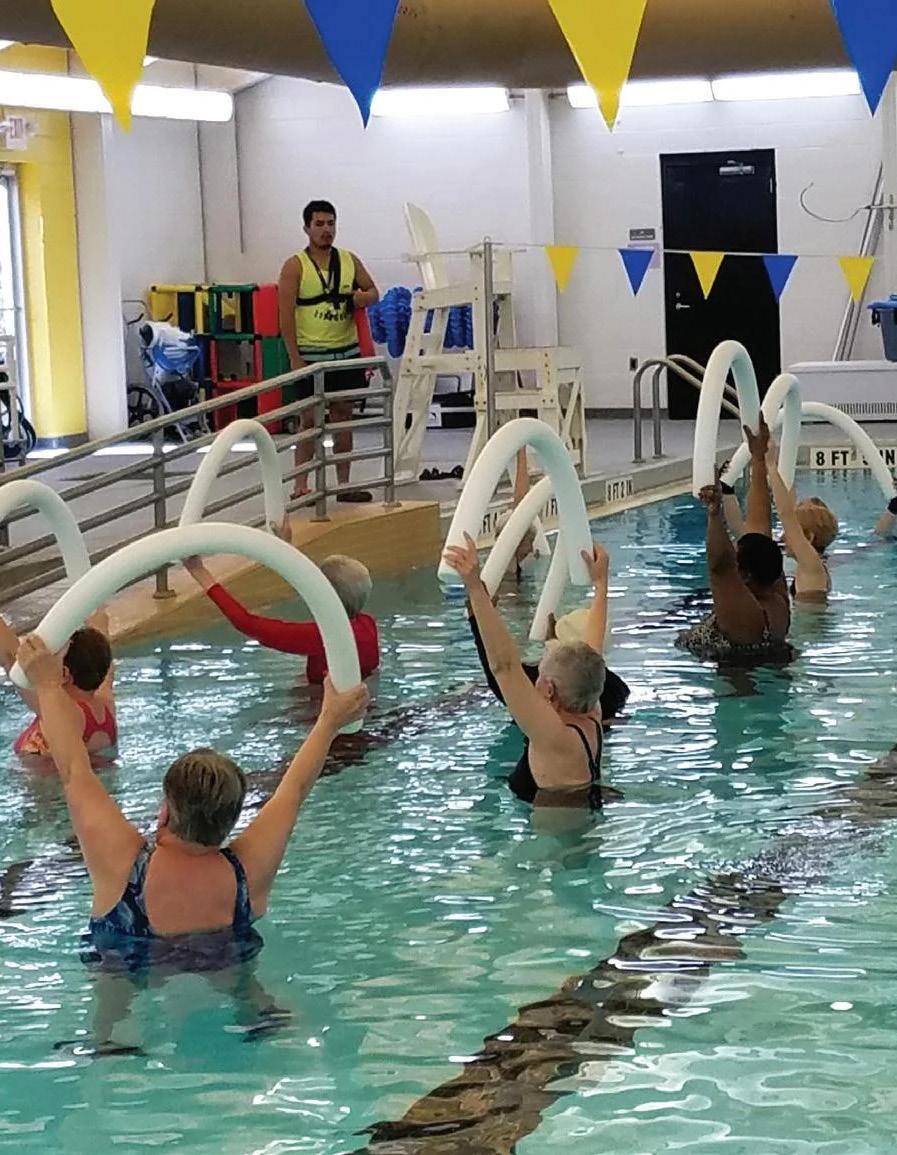
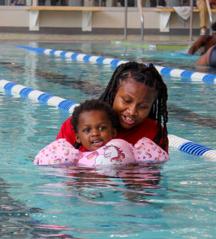
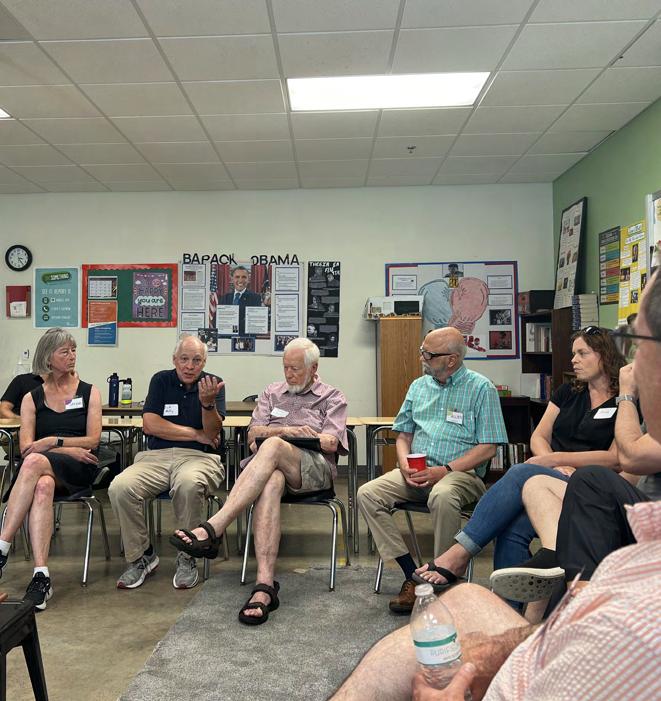
feedback from specific groups within the community, revealed a desire for additional staffing to increase hours of operations and consistency at facilities, especially aquatics facilities, a desire for continued effort to reduce barriers to program registration, and a need for increased maintenance and modernization of parks and facilities. The Focus Groups unanimously praised the abundance of programming and the dedication of staff in providing this programming, and many participants indicated increased desires to partner with DPR in the future.
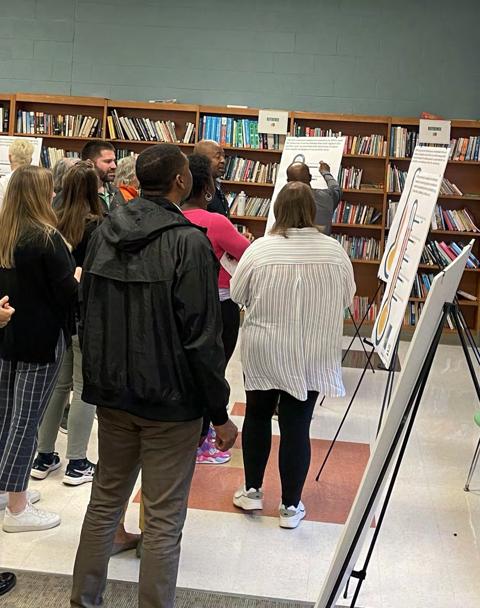
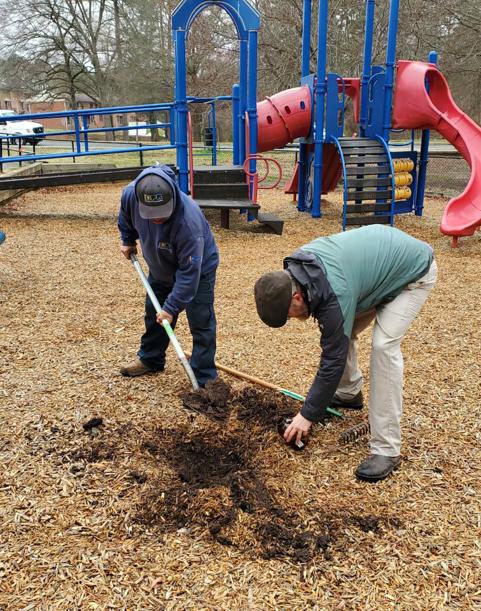
The project team engaged with staff through a series of listening sessions where the staff were given the opportunity to express their honest opinions. The staff listening session resulted in a set of themes that captured their feedback as well as their hopes for the Department and the parks and recreation system. Staff recognized that parks and recreation is often the most tangible interaction the public has with the local government. Staff felt that the system successfully connects the community to one another and with the City’s public services, but recognized that there are opportunities to continue to improve this by enhancing amenities, safety, and maintenance of parks. Staff also indicated a desire to continue providing elevated park and recreational experiences at parks across the system through provision of expanded amenities and creation of unique experiences. Finally, staff conveyed the importance of empowering the DPR staff through professional development, continued training in areas such as equity and inclusion, and increased allocation of resources to the department.
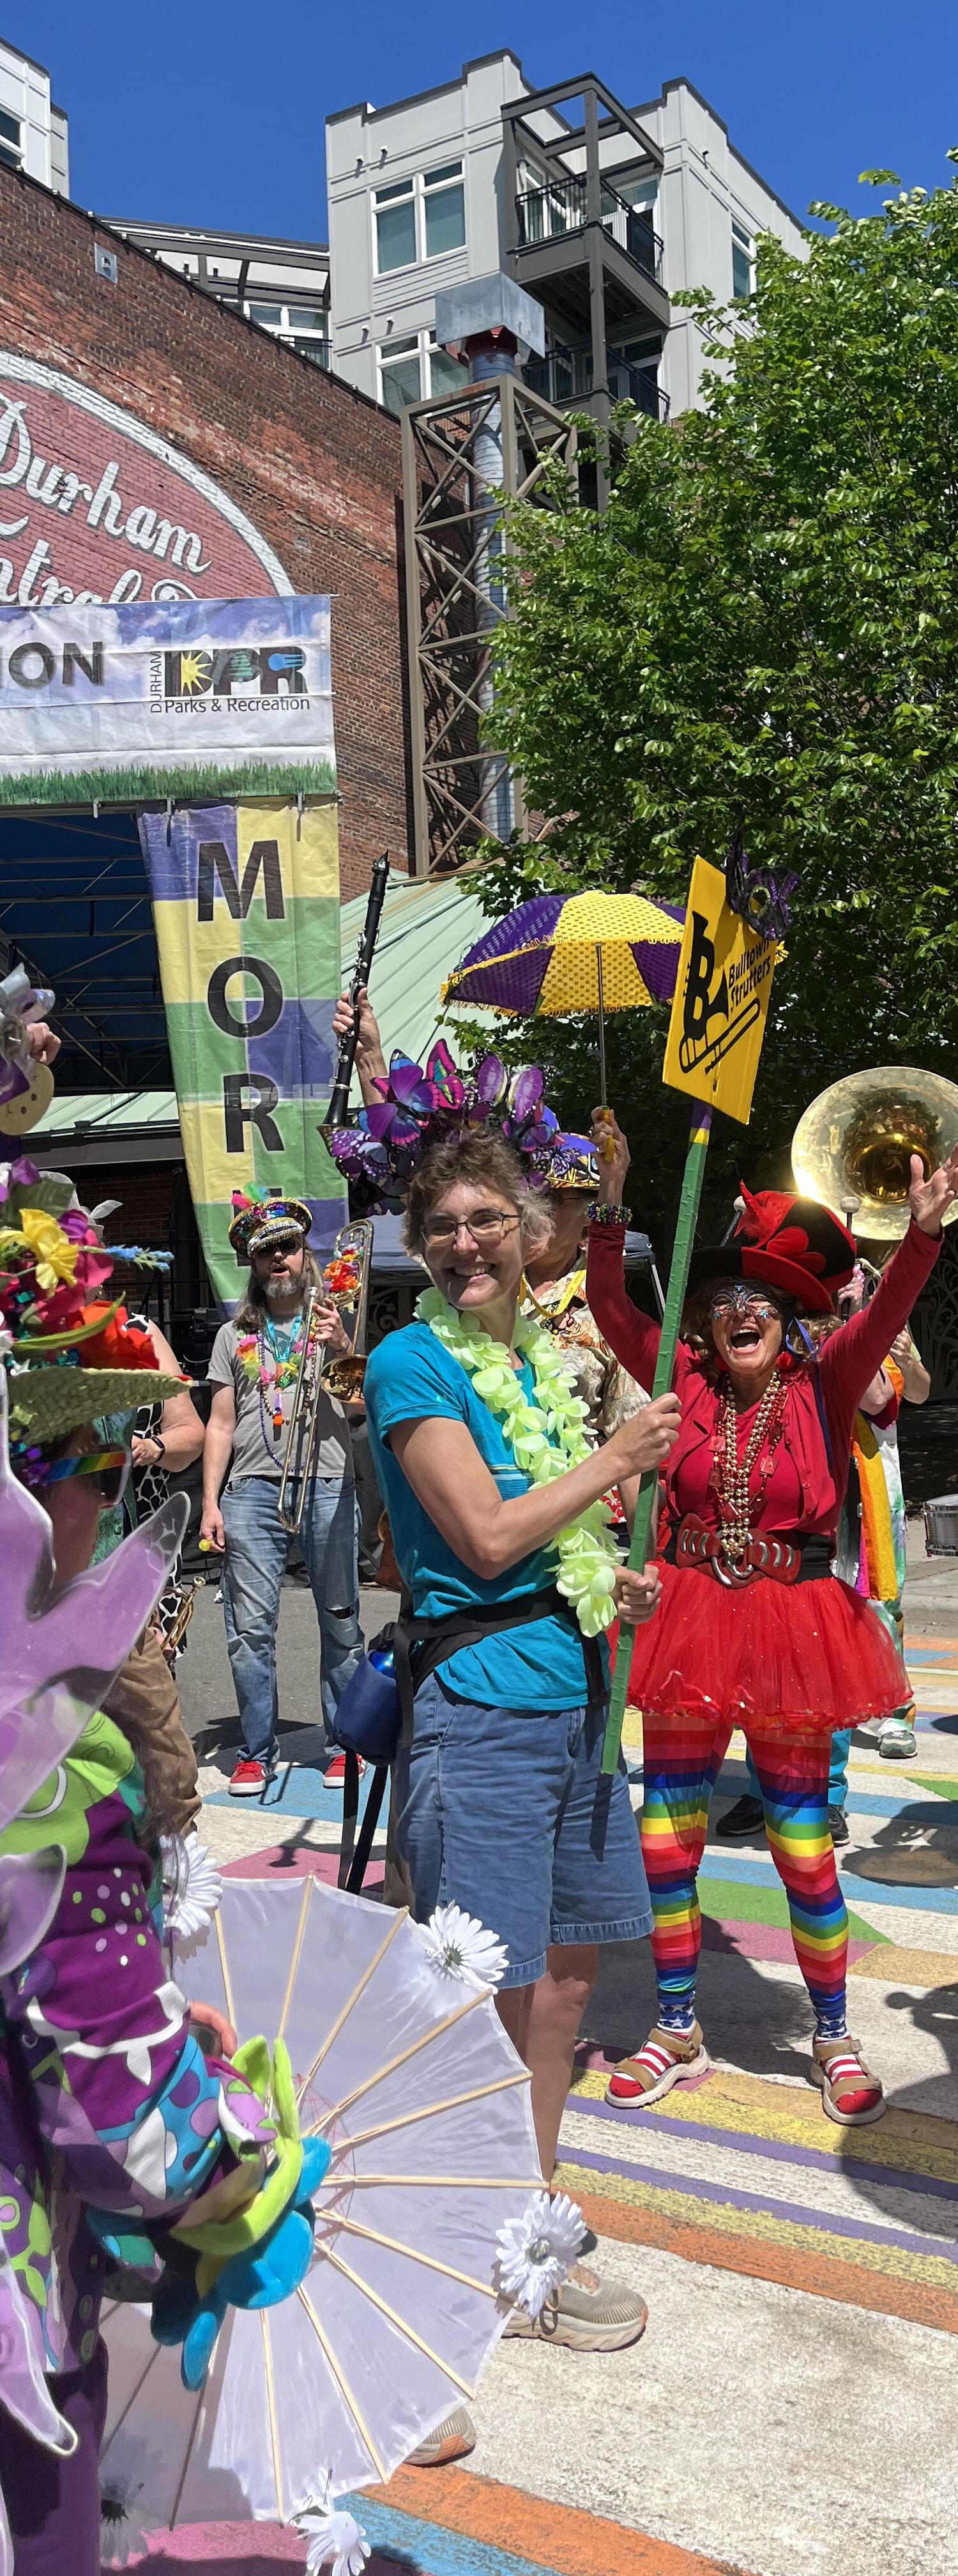
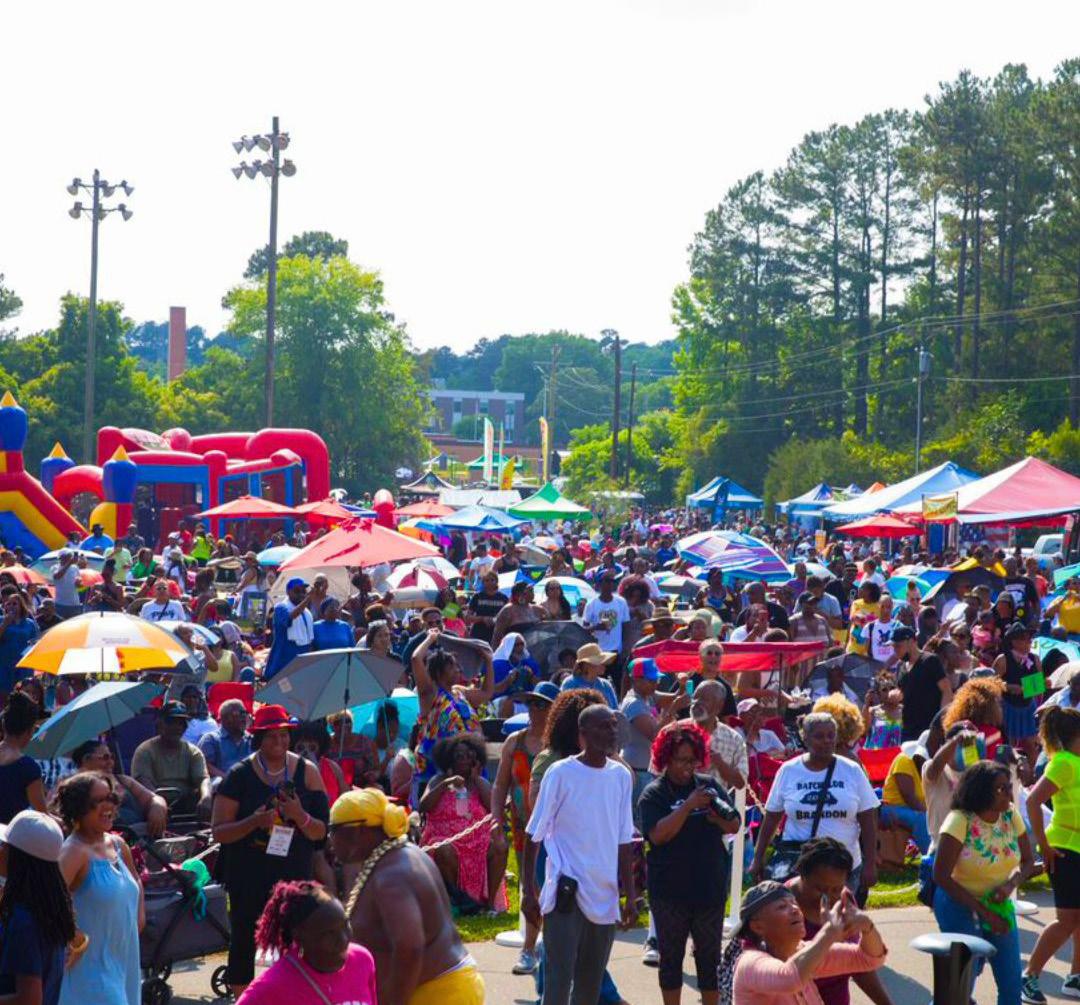
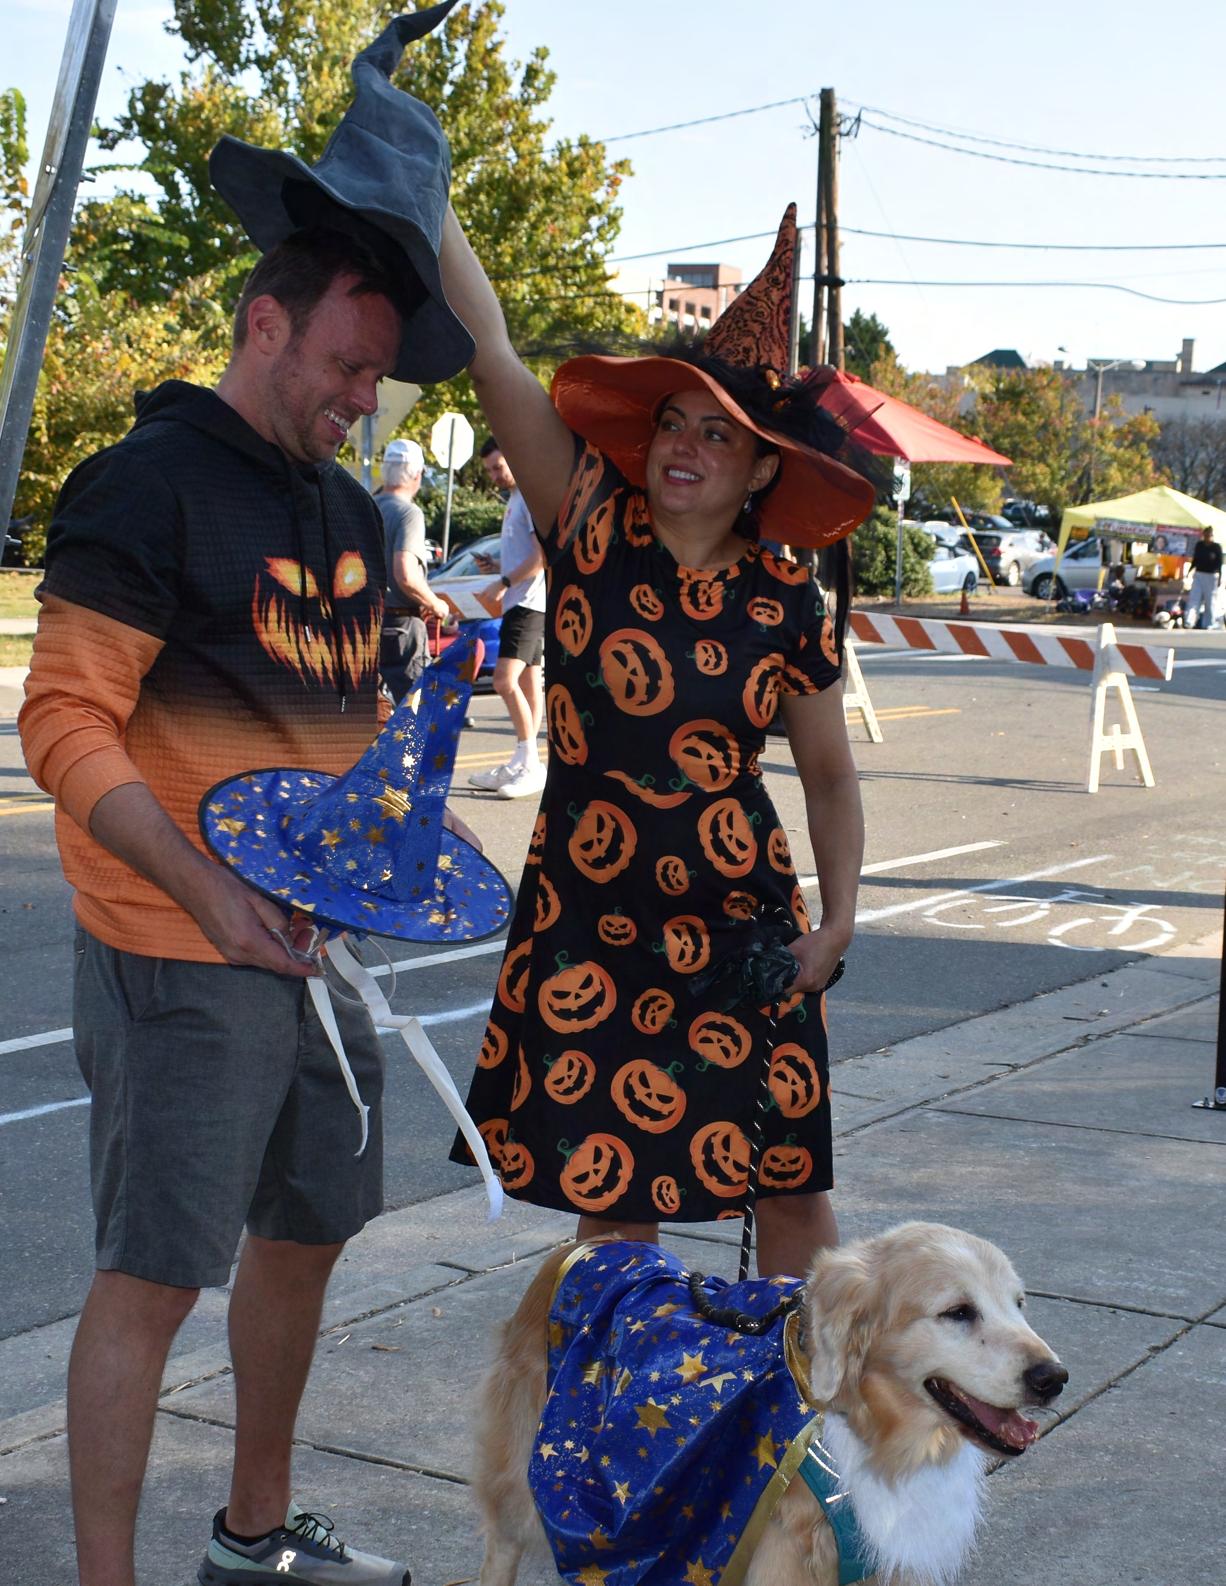
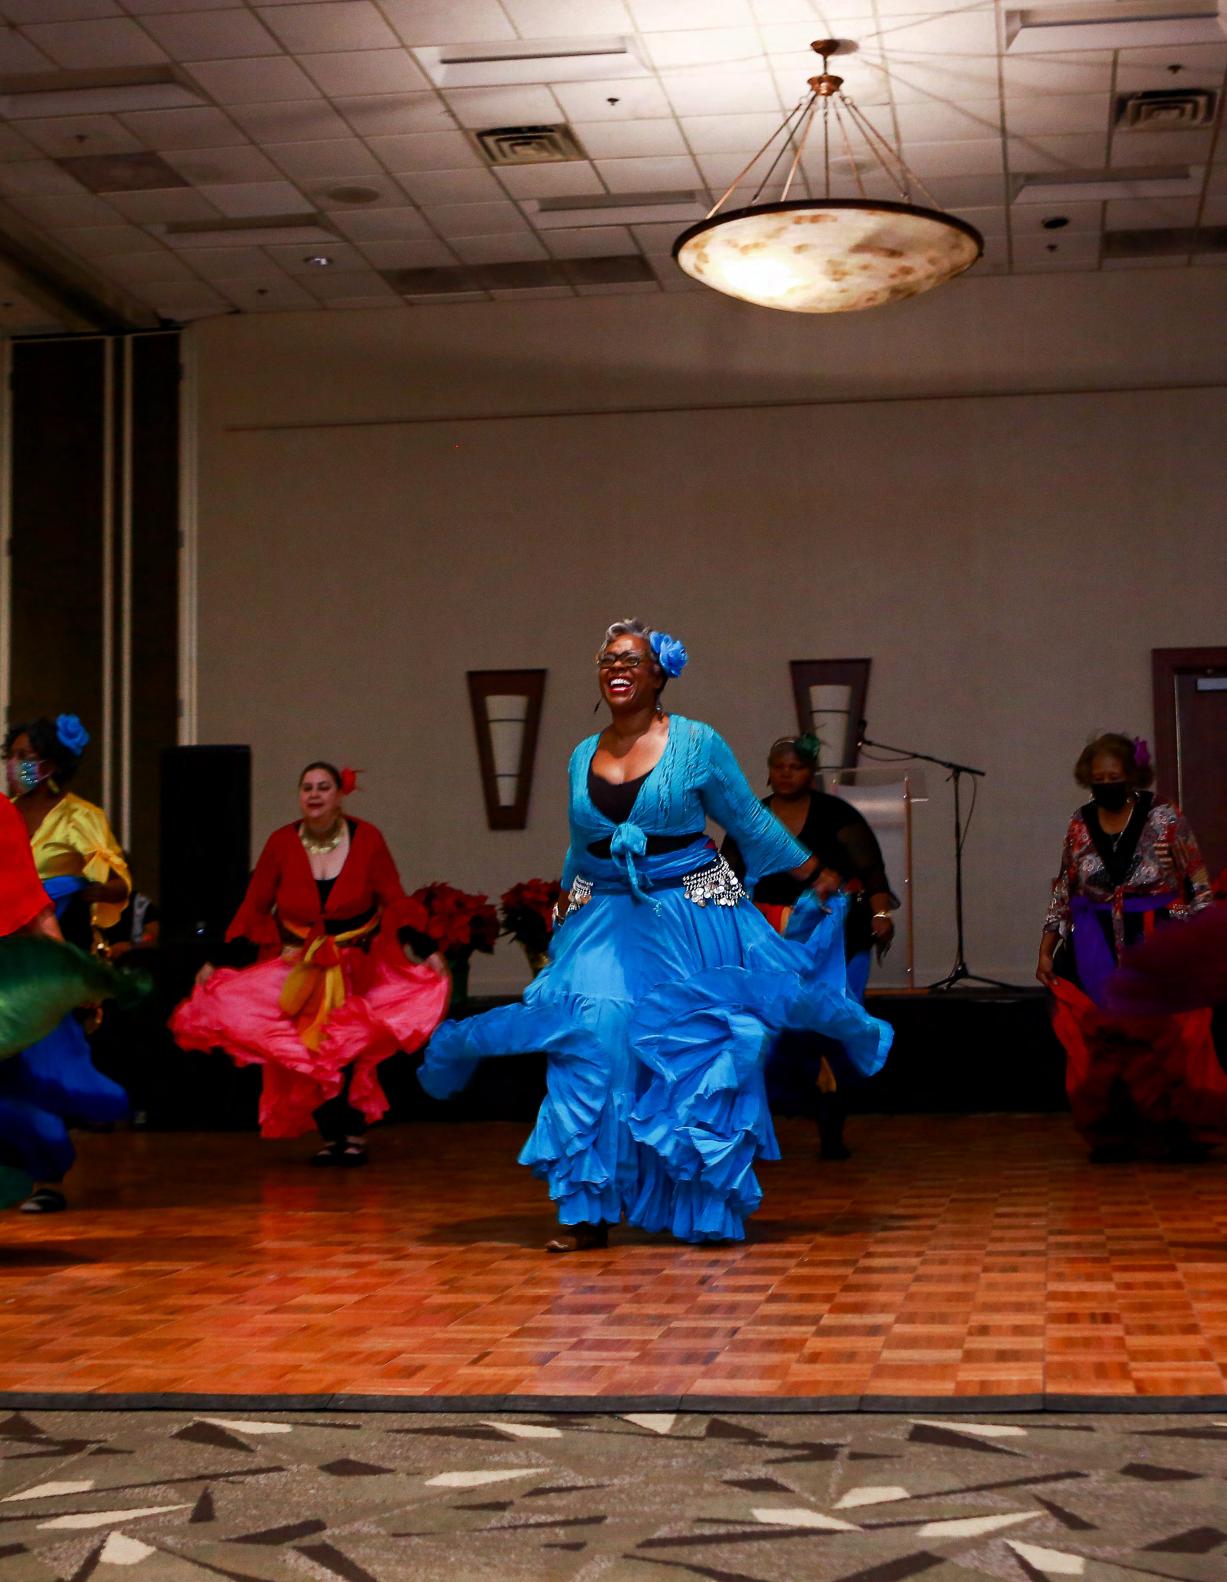
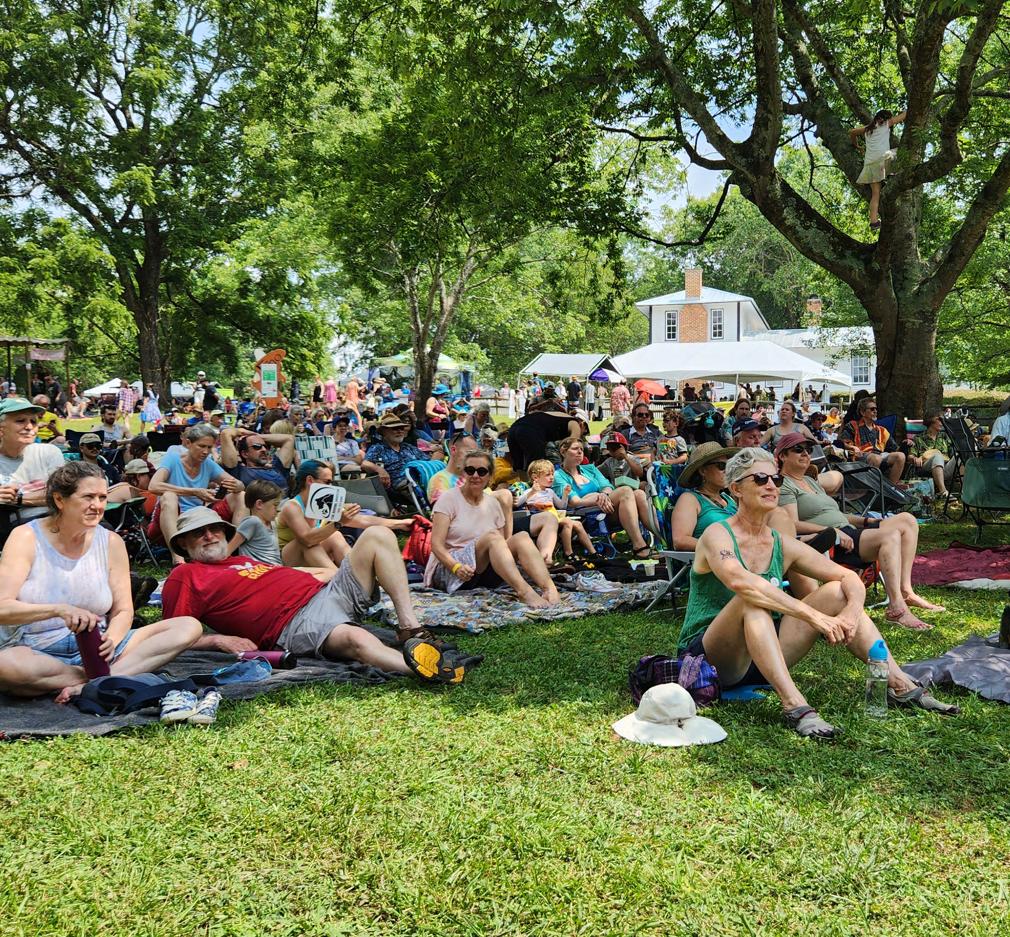
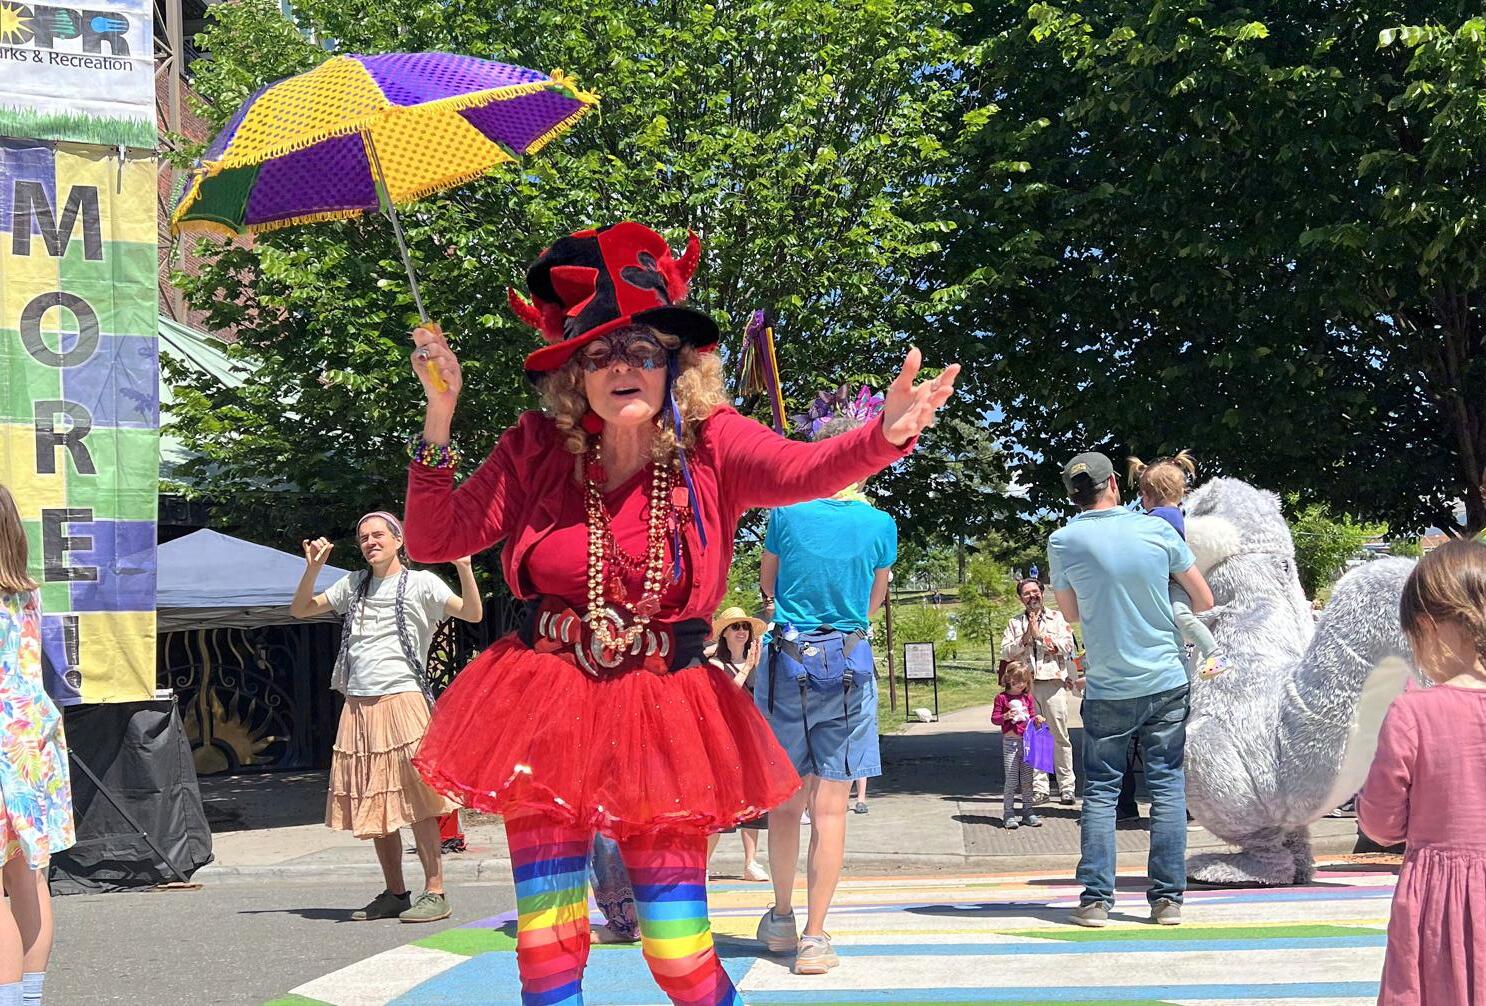
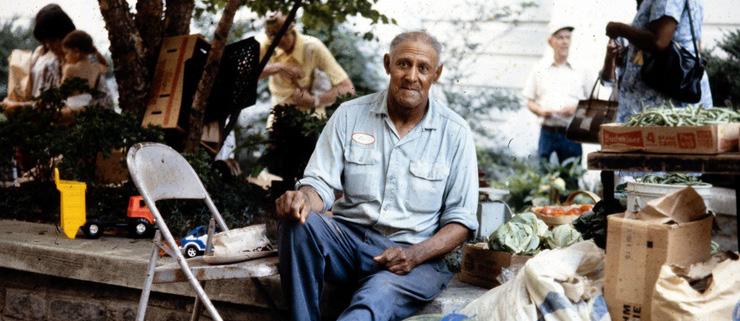
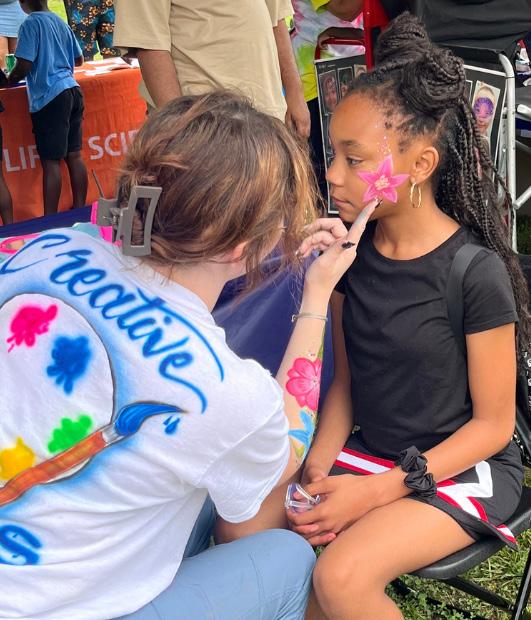
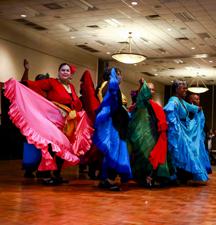
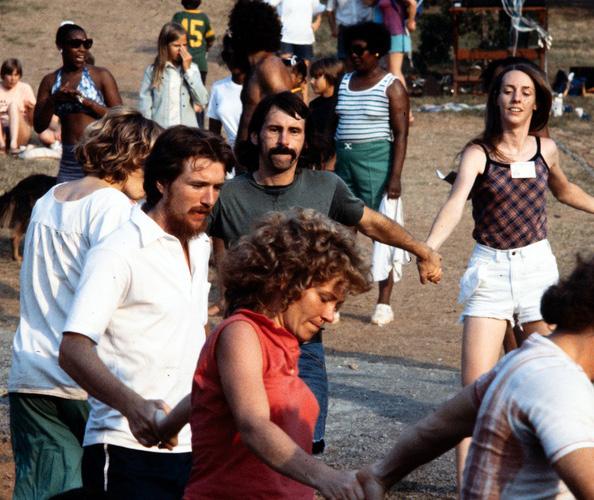
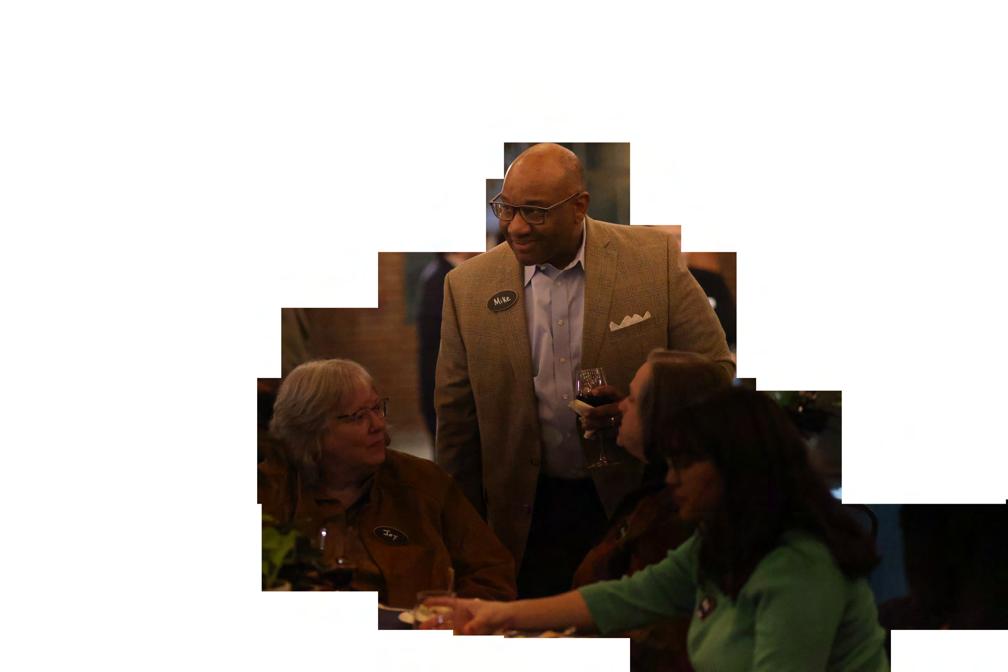
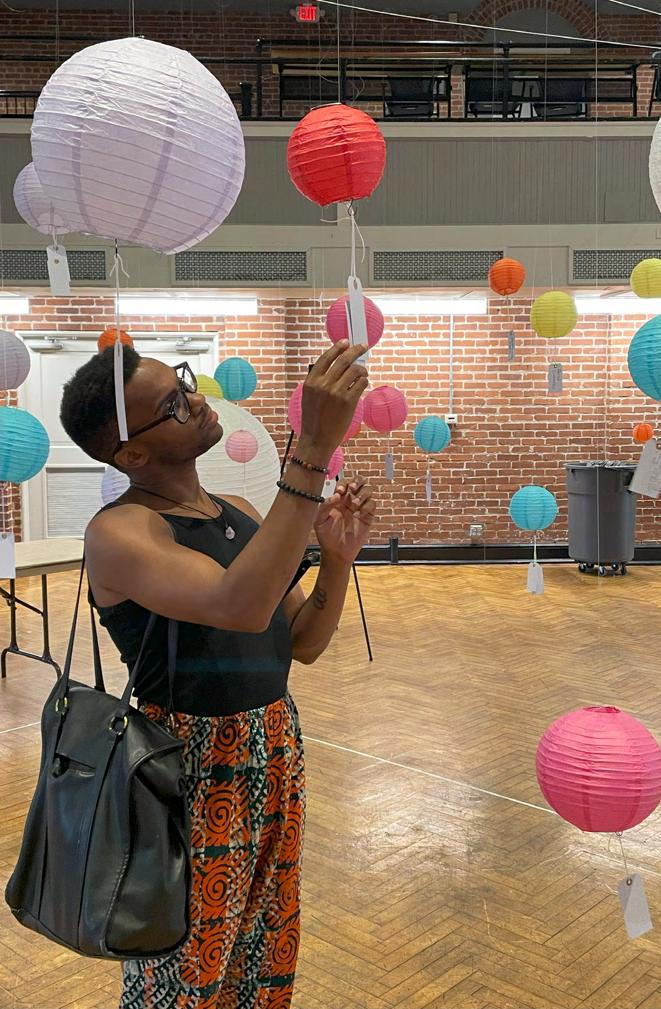
Bimbe Festival Engagement
Bimbe Festival Engagement
Staff Asset Mapping
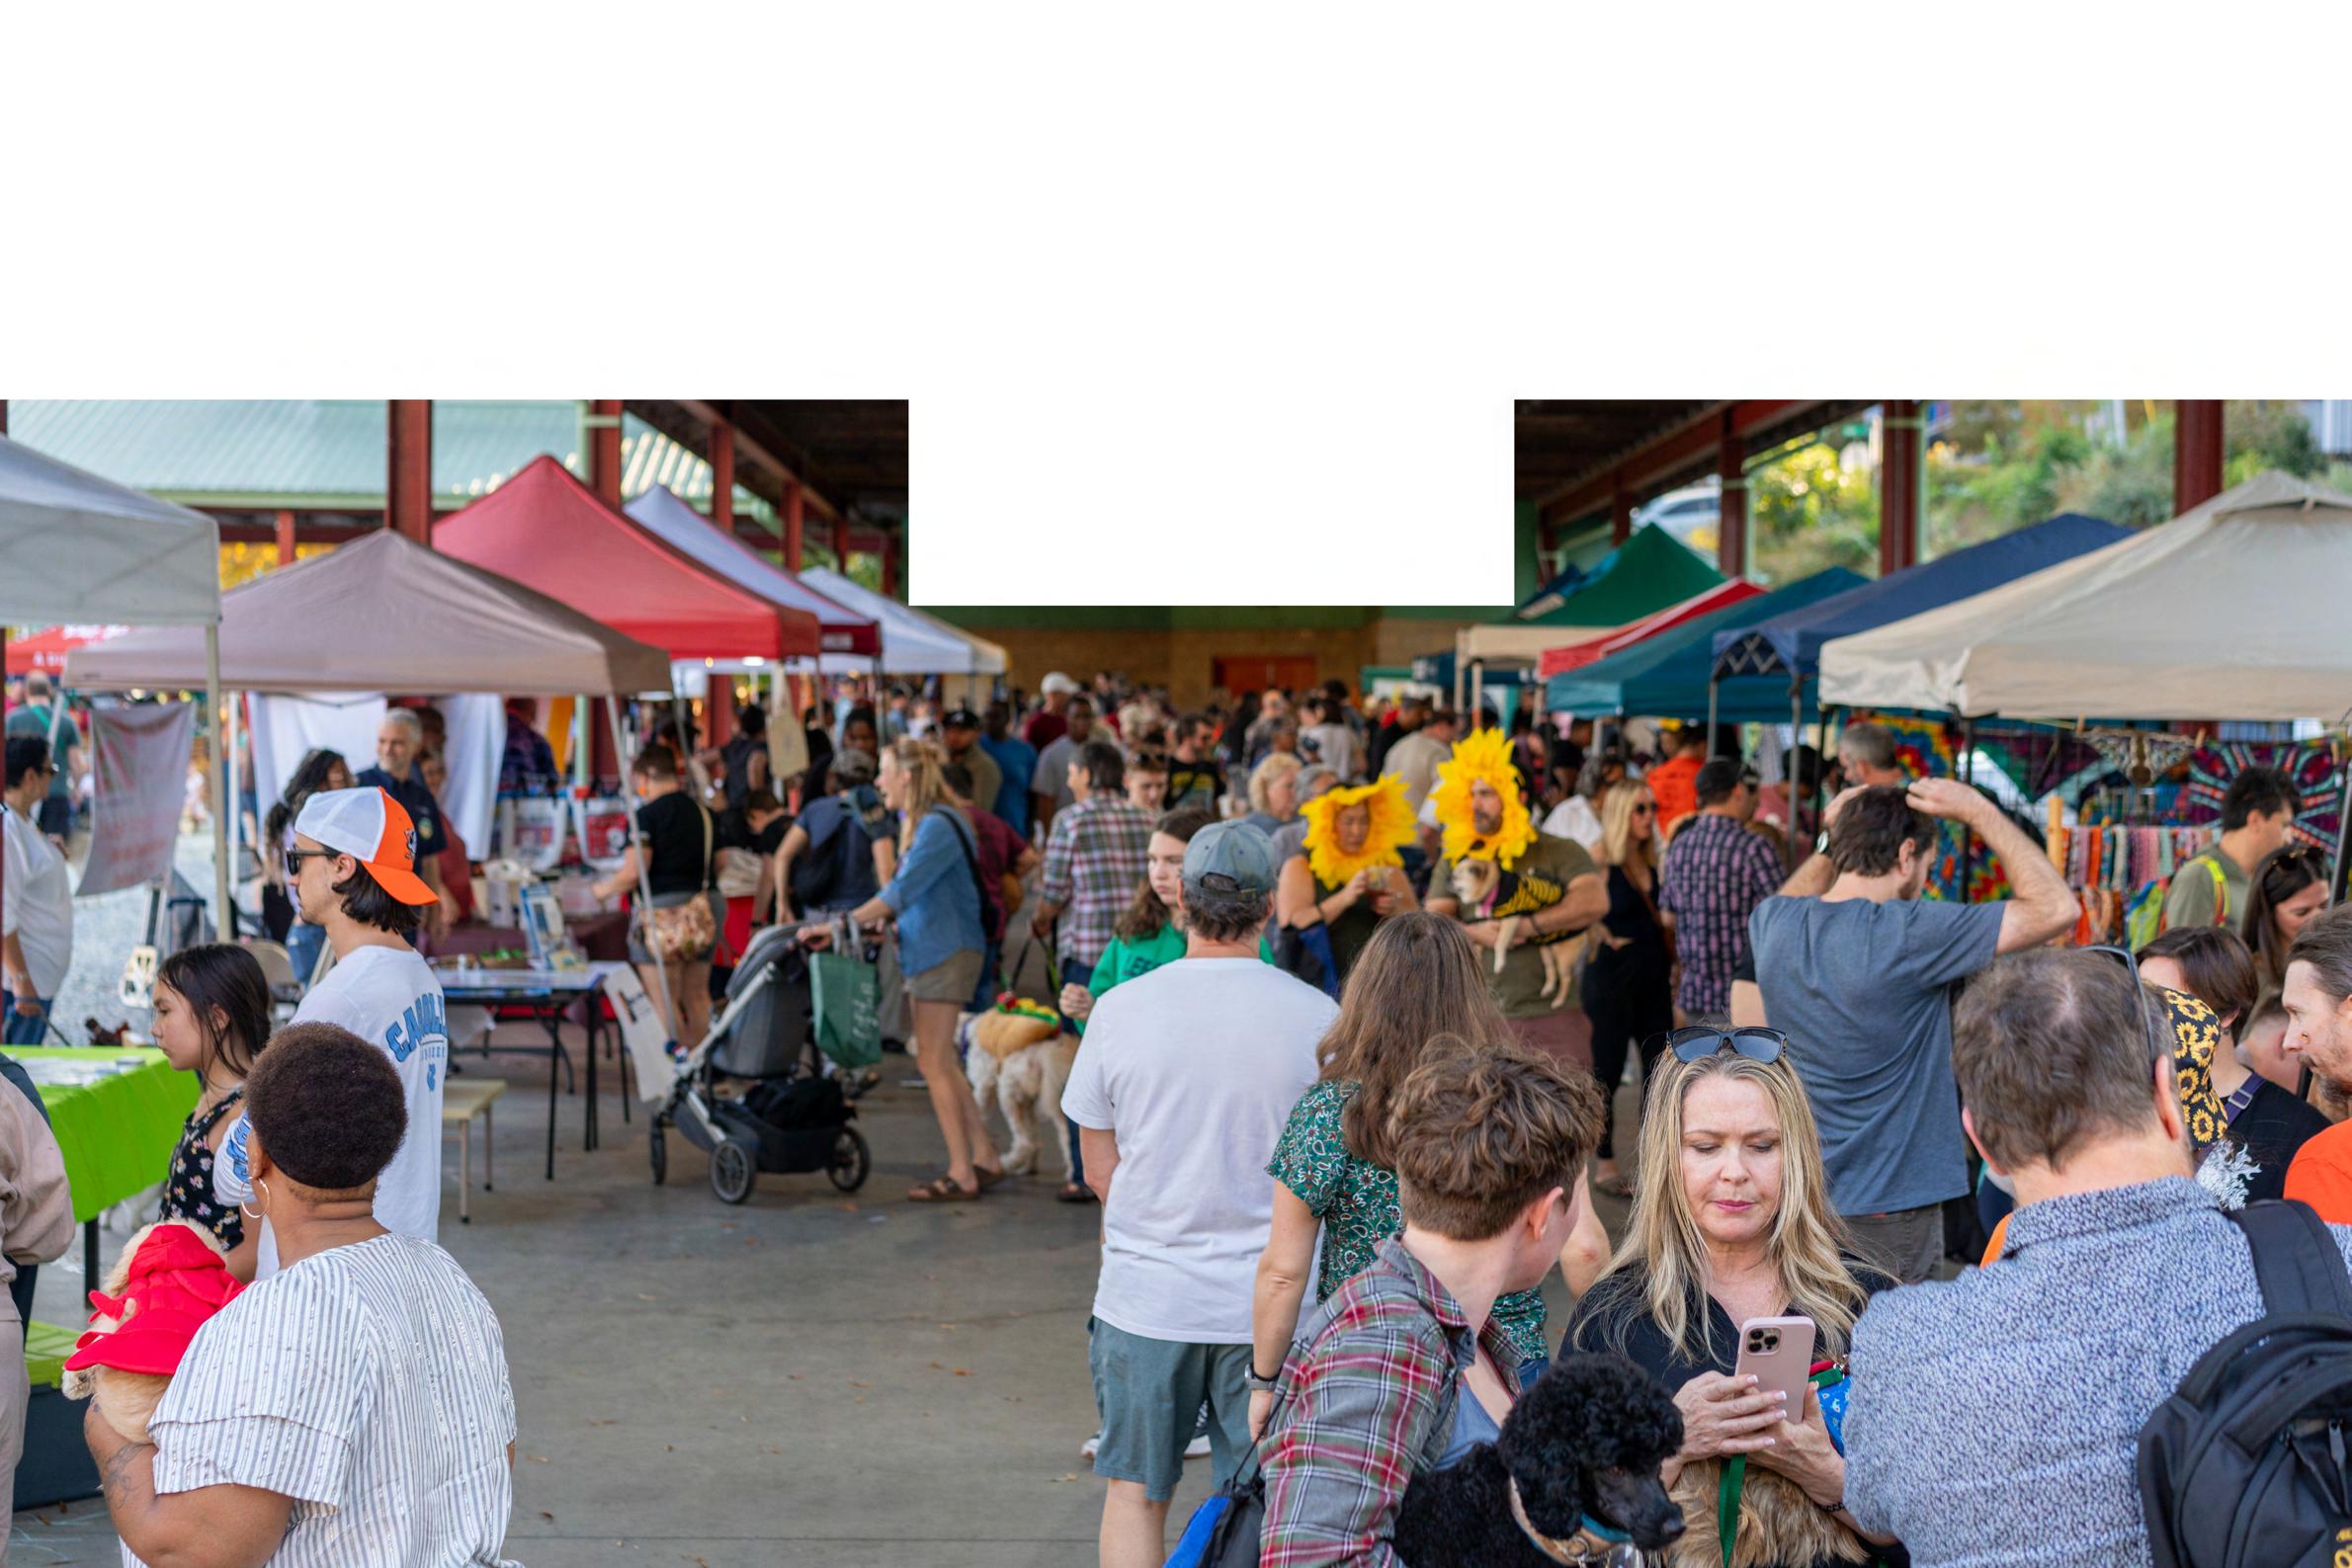
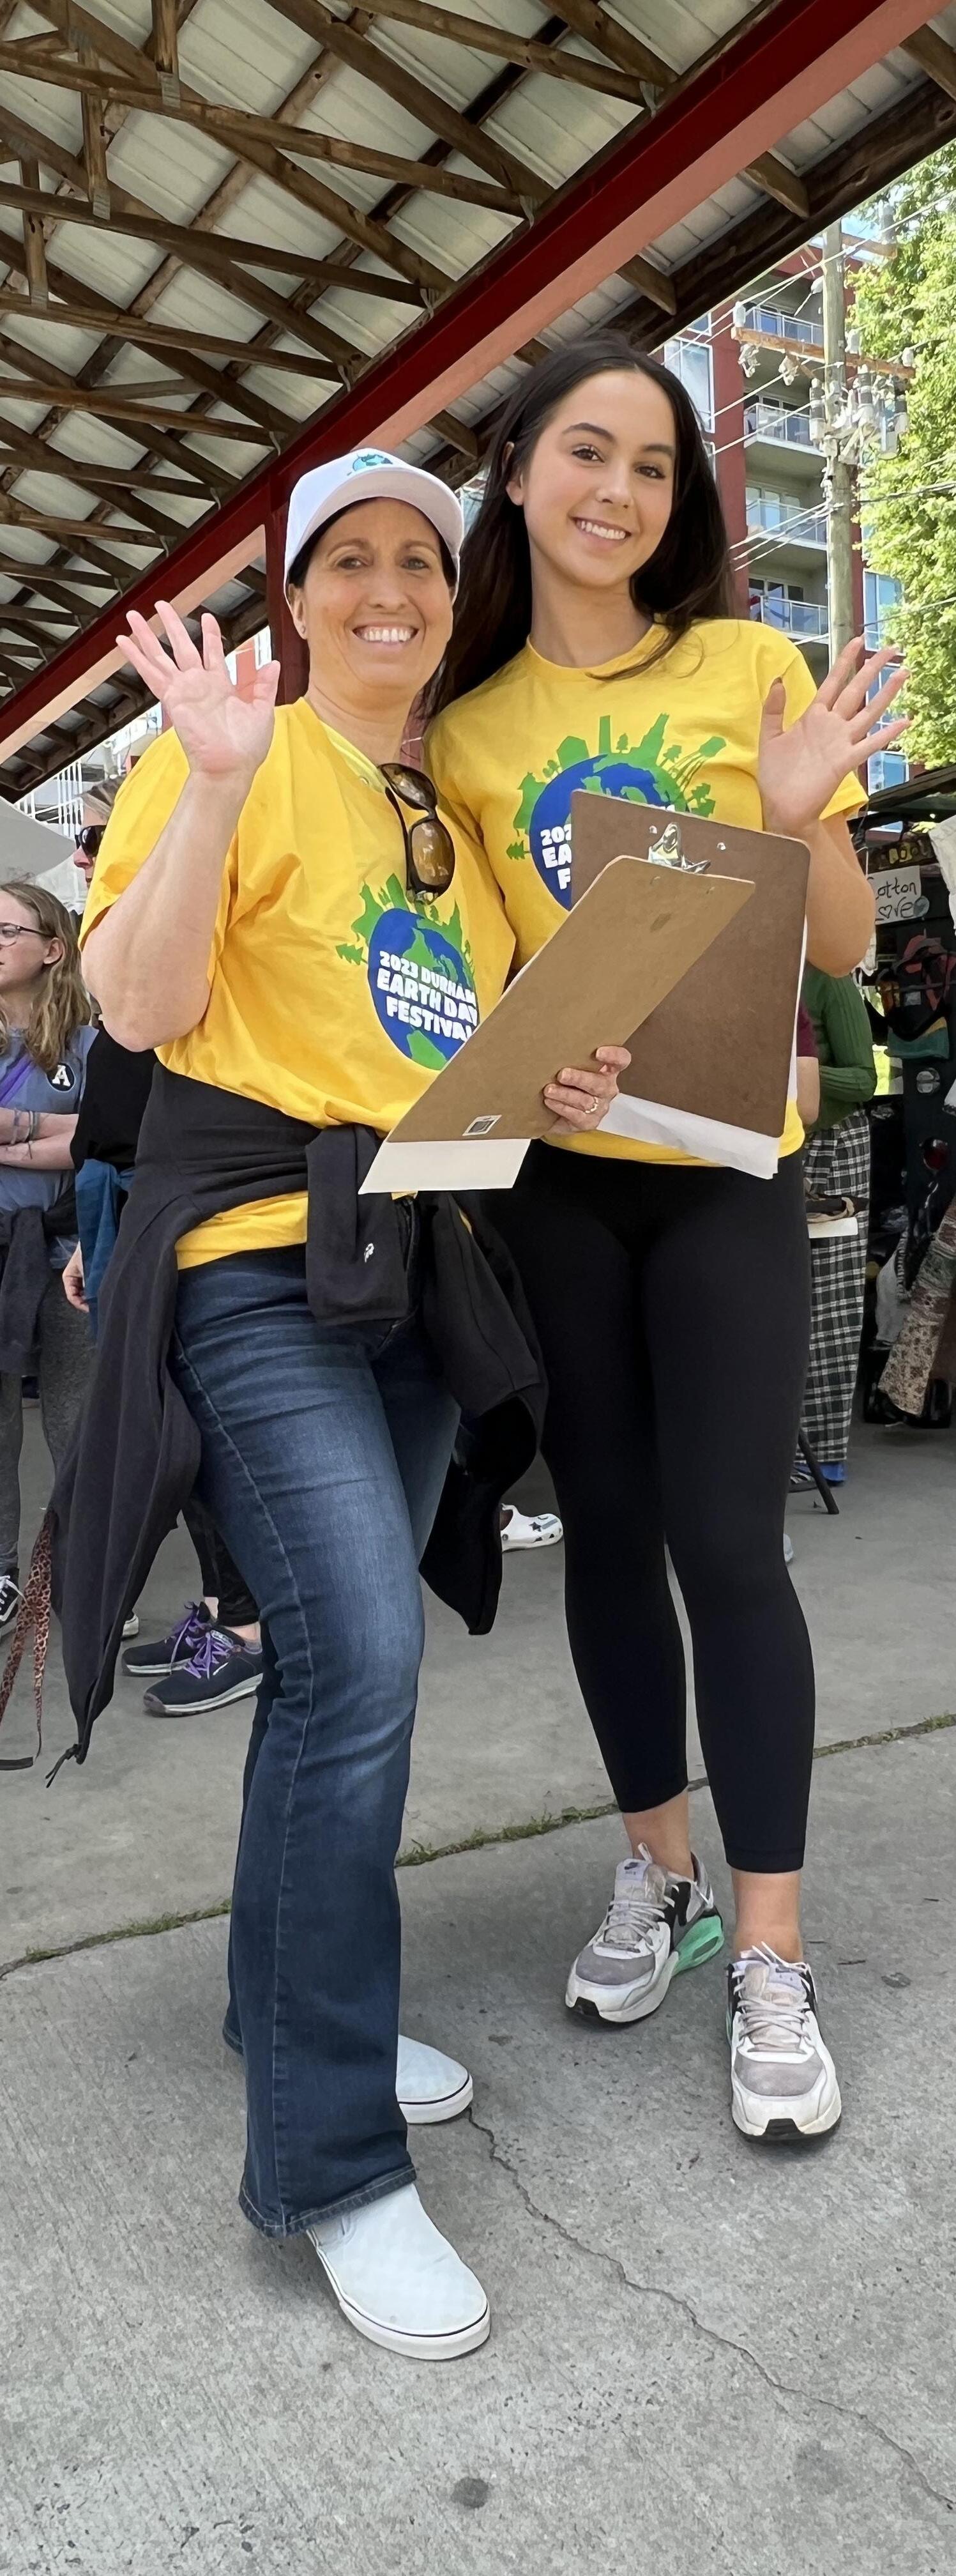
Farmers Market Engagement
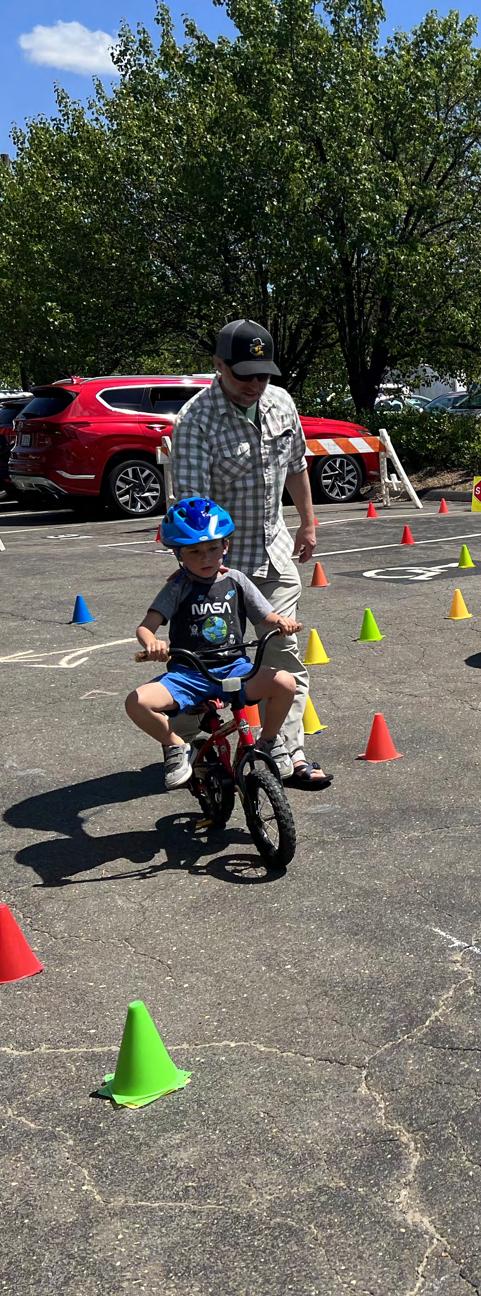
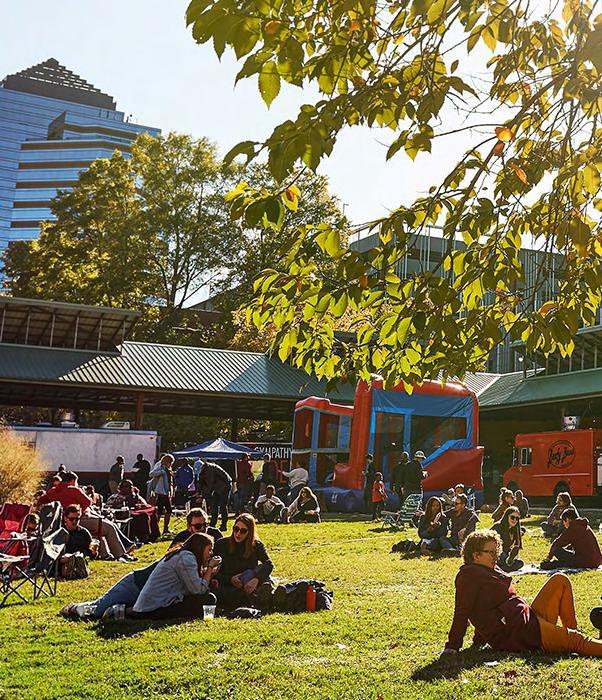
Food Truck Rodeo Engagement
Community Analysis
A key component of the plan is the Community Analysis conducted by the project team. These more technical analyses give the entire project team a better understanding of the community and the population level dynamics that DPR should be aware of. These analyses taken into context with community feedback should show what the Department needs to focus on over the course of the next several years.
To kick off the community analysis, previous plans are reviewed to understand what the priority of the City has been based on their prior planning efforts. Analysis of the previous plans revealed clear priorities that have been incorporated into this plan.
Increased need for a focus on maintenance and modernization
• Development of equitable fee structures
• Focused program offerings for specific age groups
• Funding and construction of urban trails
• Leveraging parks for cultural & historic storytelling
To gain a better understanding of the community, a Demographics and Trends analysis was conducted. This analysis offers an understanding of the community makeup today as well as the community makeup over the next 10 years. The analysis also gives data-centric insights into community recreation trends based on consumer behavior. The demographics analysis revealed a rapidly growing community. The analysis also showed that generally, the community composition is relatively stable demographically, meaning that there aren’t any large shifts in age composition or racial identity. Income data showed that the community is generally wealthier than other communities in the region but there is a sizeable percentage of the population that has a lower income and large and growing wealth gap. The trends analysis resulted in two key takeaways:
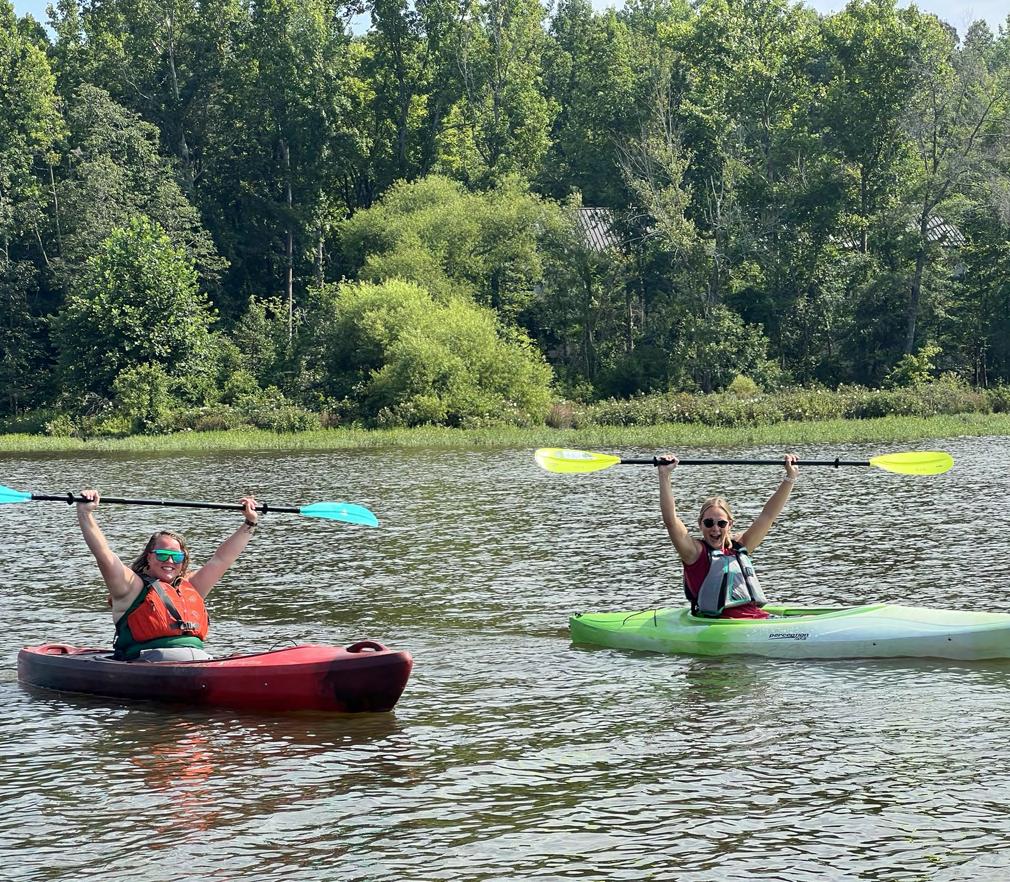
• Popularity of outdoor activities
» As found during the engagement process, the trends analysis showed high popularity of outdoor activities in the community based on consumer spending.
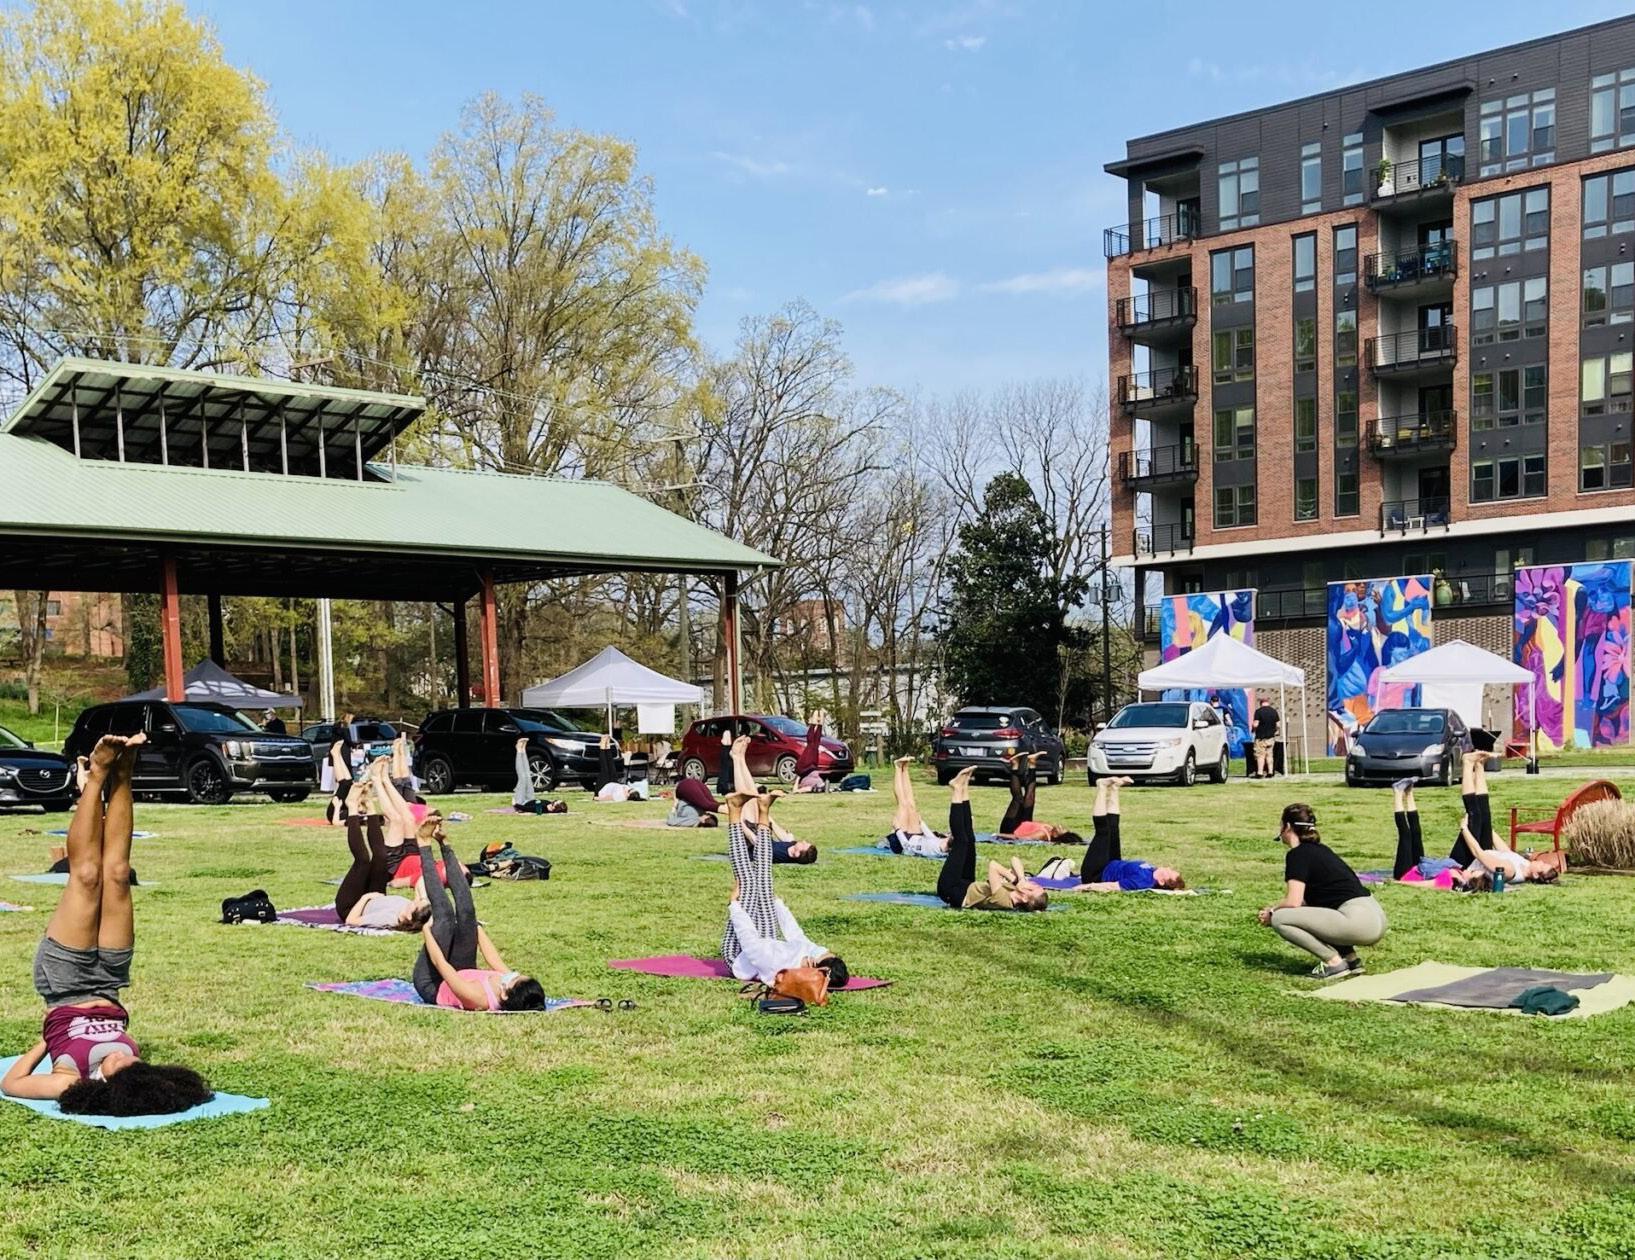
• Increasing comfort with indoor group programming
» As fears of COVID have waned and comfort with indoor group activities like exercise classes has increased, people have returned to traditional exercise classes like Pilates and Yoga.
DPR Department Analysis
These analyses are conducted to give the project team an understanding of the Parks and Recreation System and the Department. Analyses include assessments of the current facilities, analysis of offerings compared to national peers, and analysis of Department finances and staffing.
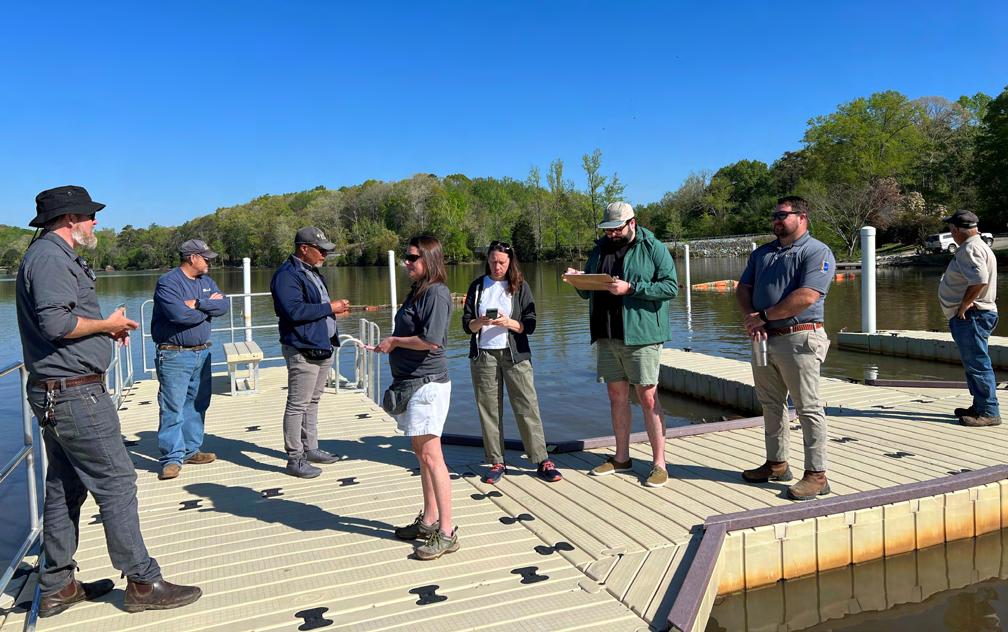
The facility assessments were conducted by the consultant team and entailed touring a sample of parks with staff to get a better understanding of the state of the facilities and any challenges staff have in operating them. The goal is to document consistent themes in observations that encapsulate the observations made. Themes taken away from the facility assessments include:
• Signage, Wayfinding, and Connectivity:
» The opportunity exists for DPR to integrate engaging and educational signage to enhance the community’s understanding and appreciation for historical and cultural value of the parks.
» The absence of signage and wayfinding can be challenging for visitors trying to navigate and fully appreciate available recreational amenities in the parks.
• Park System Character:
» City of Durham Parks from Lake Michie to Forest Hills Park to the Grant Street neighborhood park, are characterized by their natural features – a strong unifying thread across the park system.
» The City’s parks balance the need for programmed and undeveloped open space, frequently providing a combination of both in each park.
» There is opportunity to enhance individual park identity, creating distinct and vibrant recreational spaces that resonate with the local communities/ neighborhoods, and attract visitors.
• Diversity of Amenities:
» There is opportunity to strengthen Durham’s park system by providing an expanded variety of amenities and to ensure diverse recreation opportunities are provided and community recreation needs are met.
» The City’s nature-based parks’ scenic vistas, fishing opportunities, boating options, hiking trails, picnic areas, and educational aspects make them distinct and valued assets for the community. However, there are some limitations in terms of the user experience due to a shortage of recreational amenities such as dedicated gathering spaces.
» Some parks, such as Orchard Park, Leigh Farm Park, River Forest Park (Mountainsto-Sea and other trail connections) provide unique features but are underutilized.
• Consistency and Modernity:
» The City makes concerted efforts to ensure all parks, not just the high-performing ones, are clean, free of debris, and well-manicured.
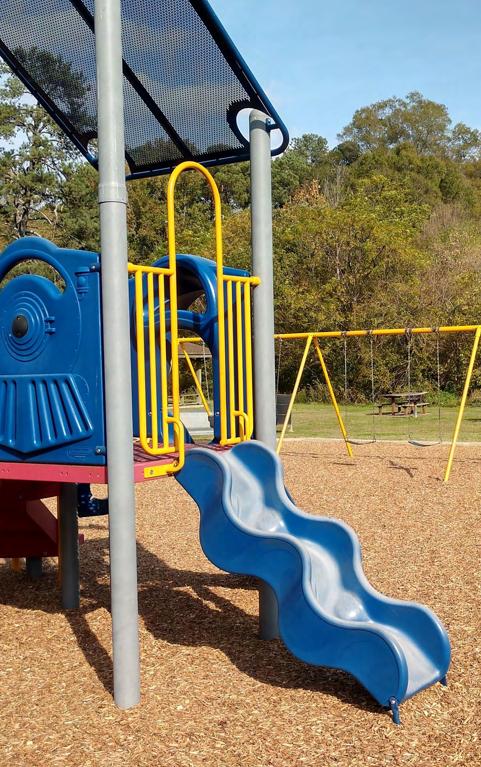
» Although they are well-maintained and landscaped, many recreational amenities (playgrounds, shelters, etc. encountered by the project team were observed to be beyond their useful life.
» The project team observed inconsistent use of standard construction materials across the system. There is opportunity to standardize means and methods to ensure more efficient and cost effective construction of new facilities.
» Some playground and splashpad surfacing was worn or had holes, presenting a safety hazard.
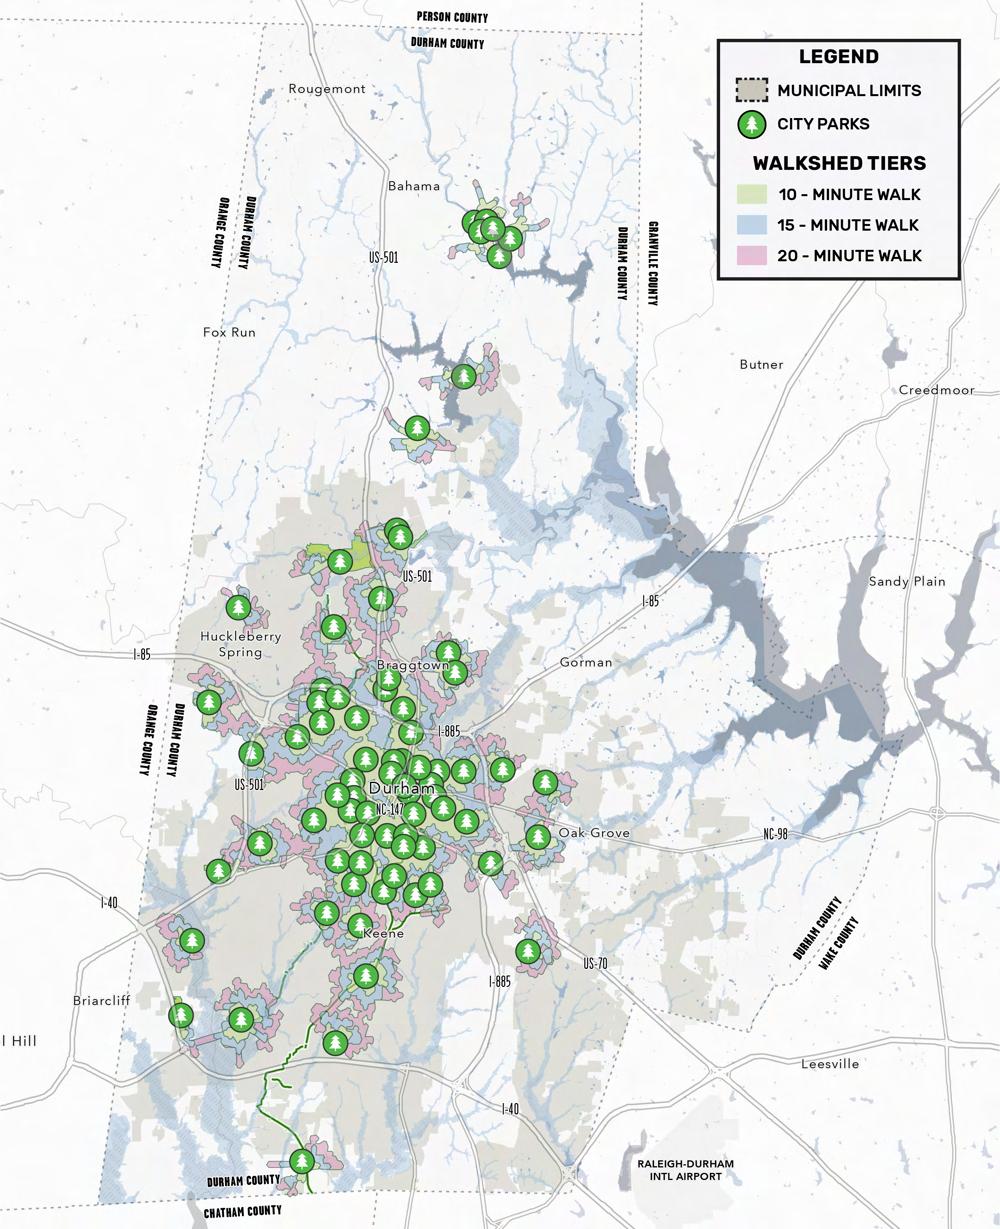
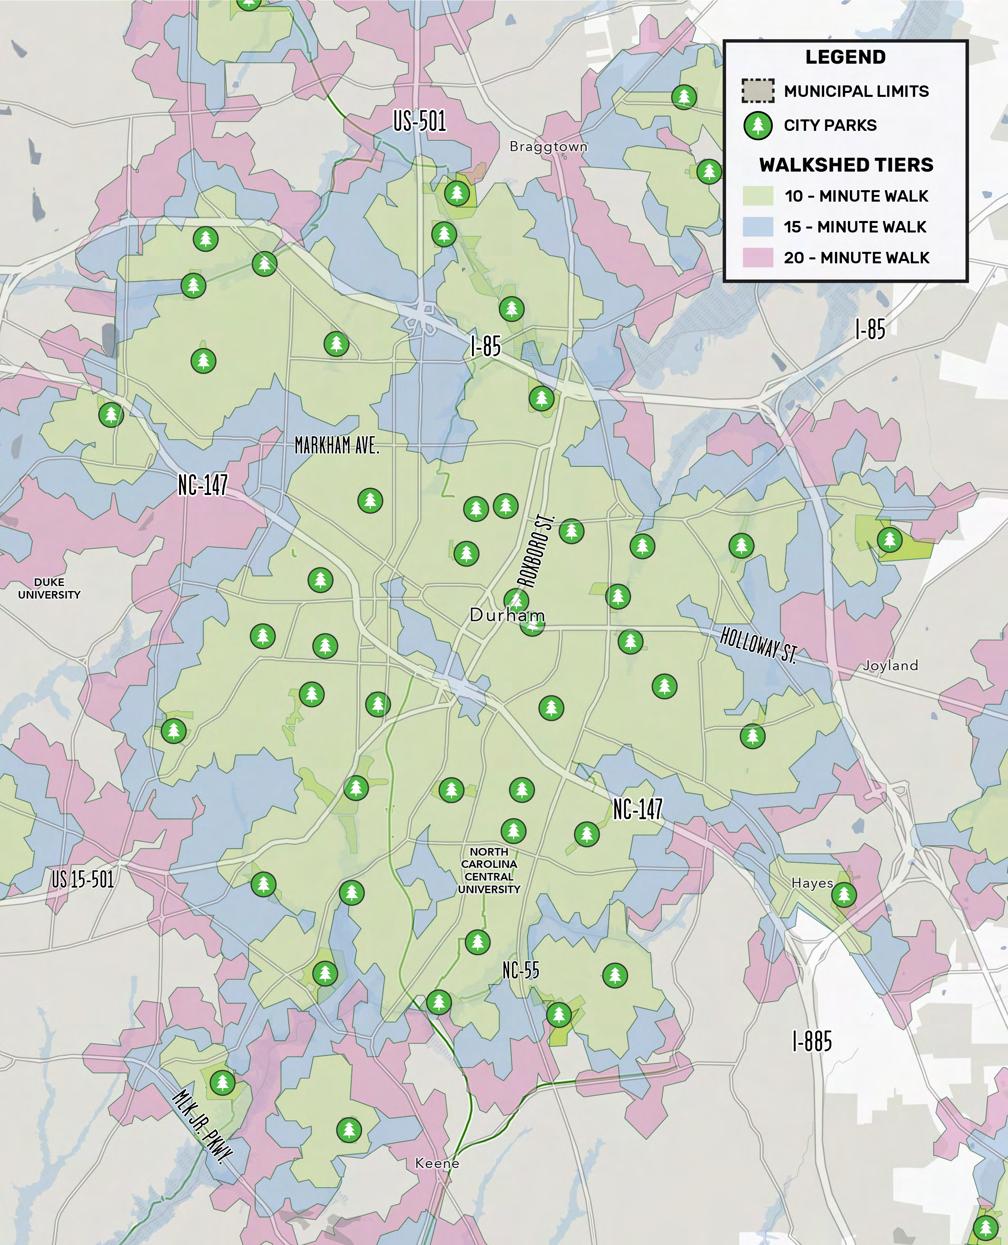
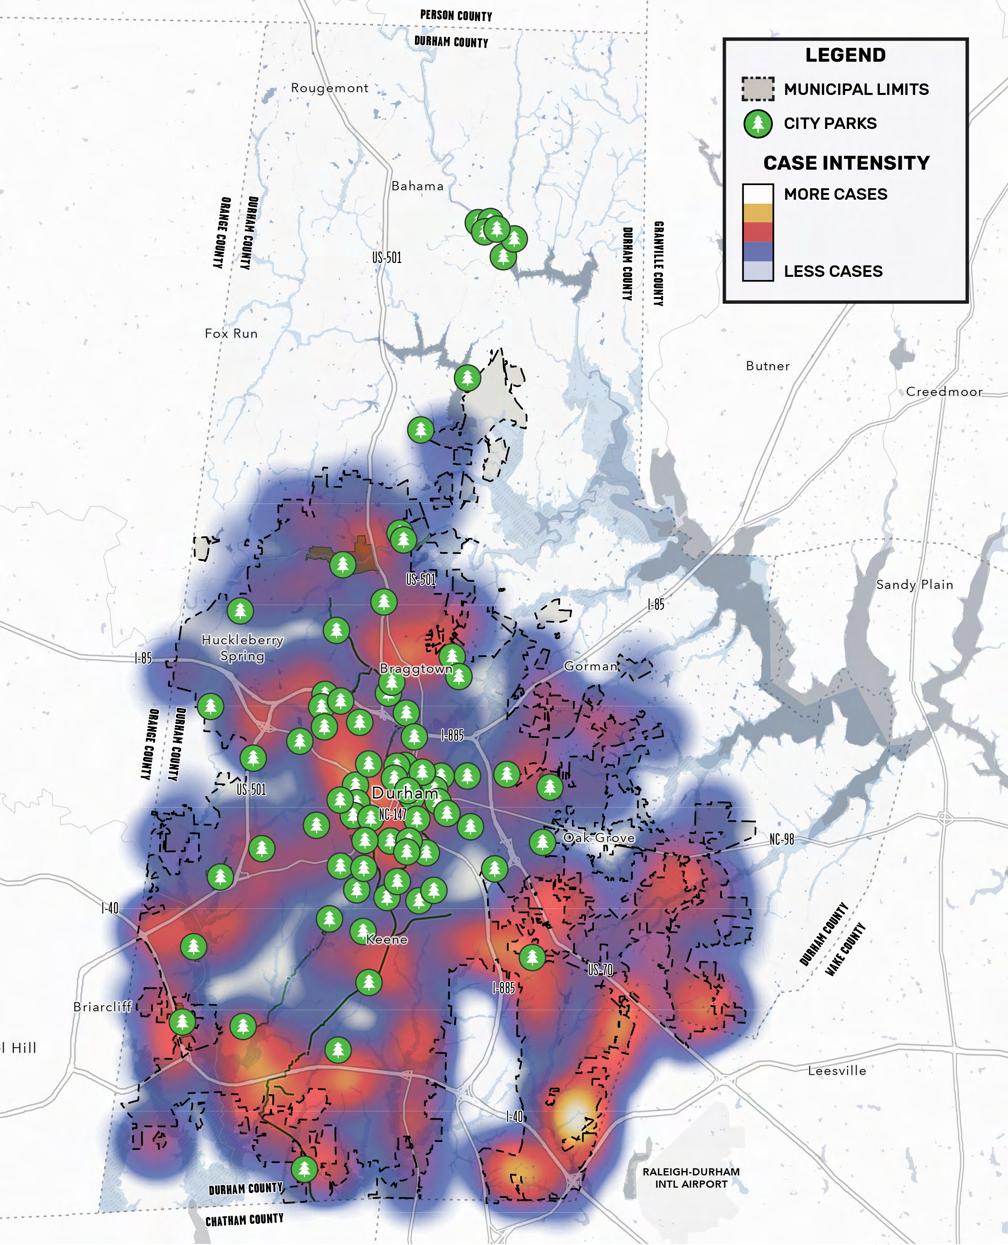
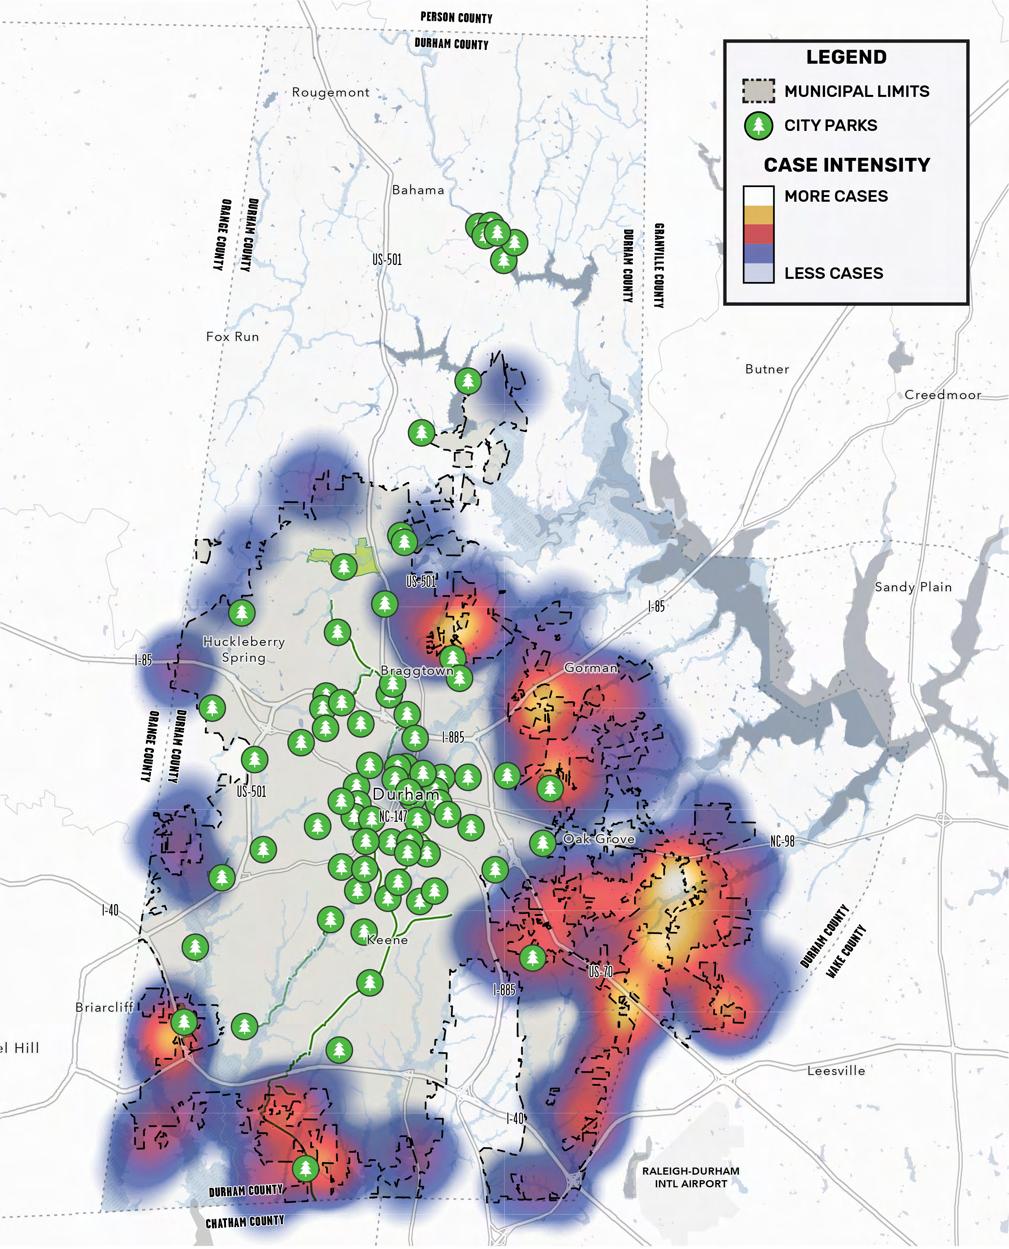
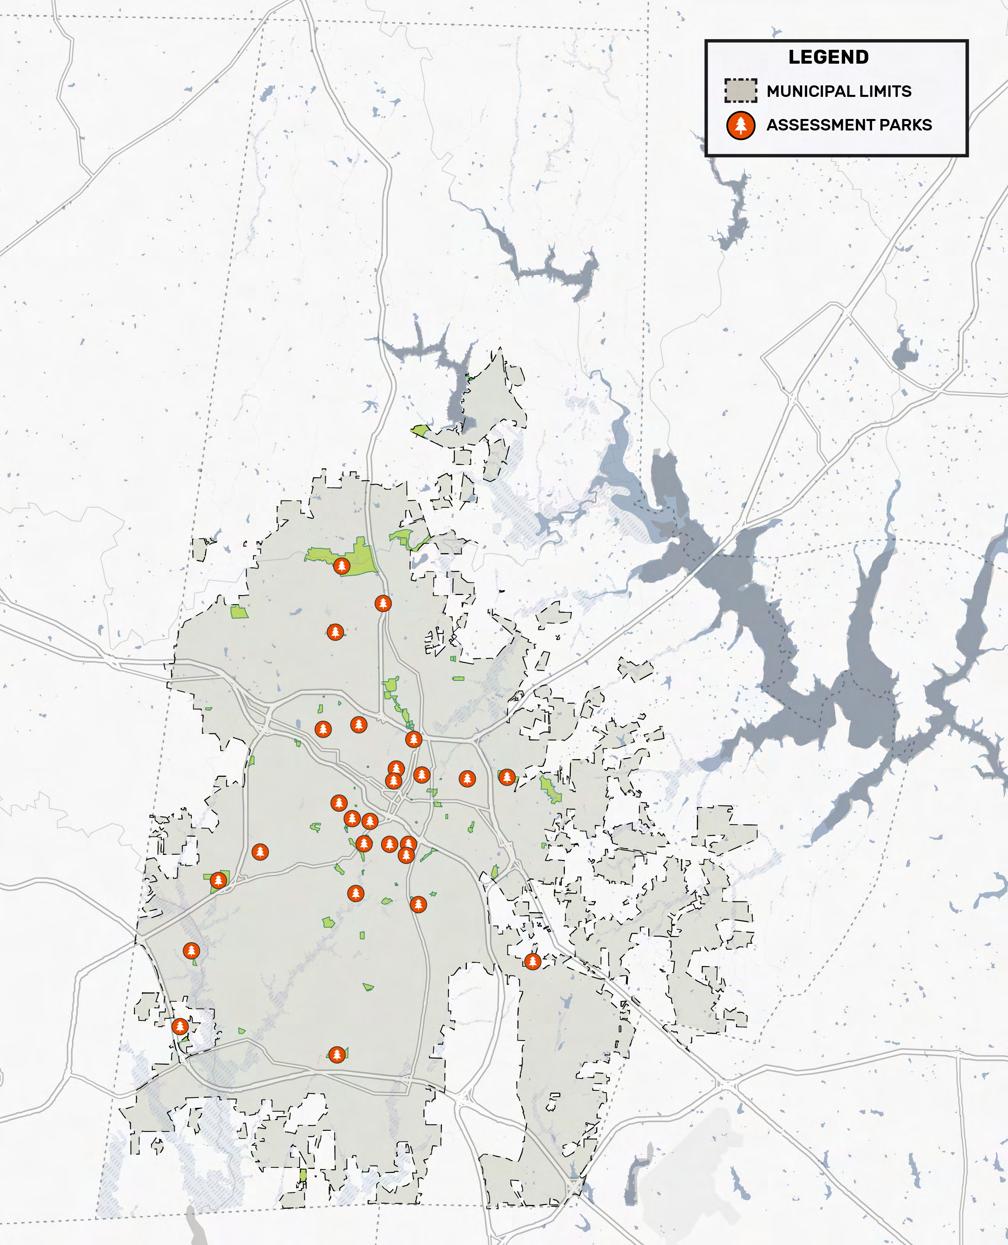
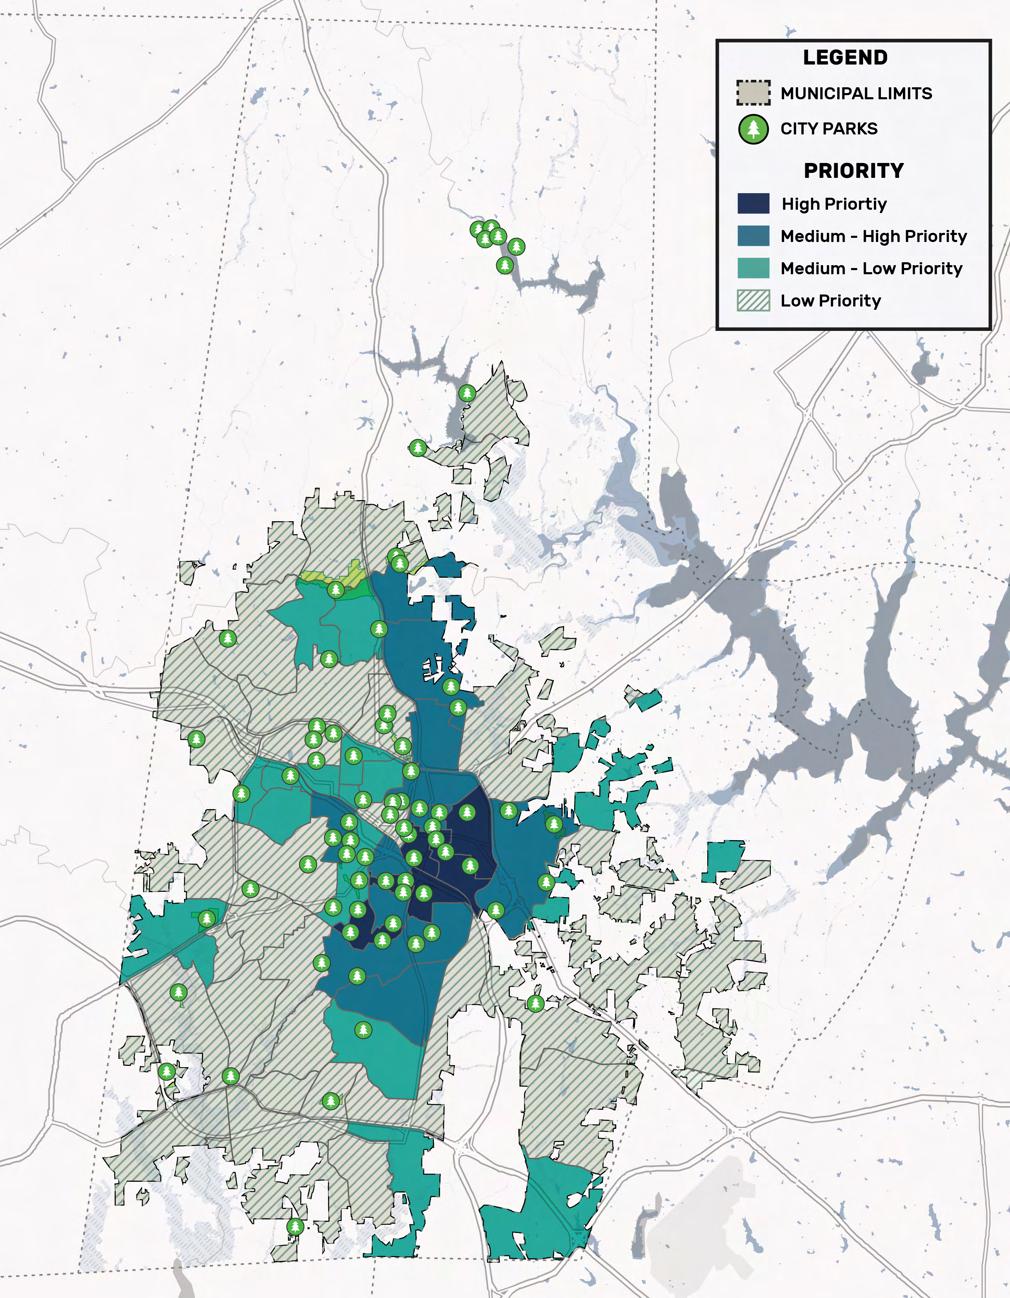
The Level of Service analysis establishes a quantitative understanding of the Parks and Recreation system, benchmarks it against peer jurisdictions nationwide, and assesses the footprint of the current system to determine where there are gaps that the department can fill. The Level of Service analysis revealed the following key findings:
• The amount of parkland in Durham currently is lower than jurisdictions of similar sizes nationwide and identified peer jurisdictions and increasing the amount of parkland to provide for both the current and future population will ensure that the Department is providing for the community.
• Compared to national peers, DPR has lower operations and maintenance staffing. Given the importance of parks and recreation to the community, the aging of parks and facilities, and the rapid growth of the community, increasing operations and maintenance capabilities will be critical in balancing expansion with keeping existing facilities in excellent condition.
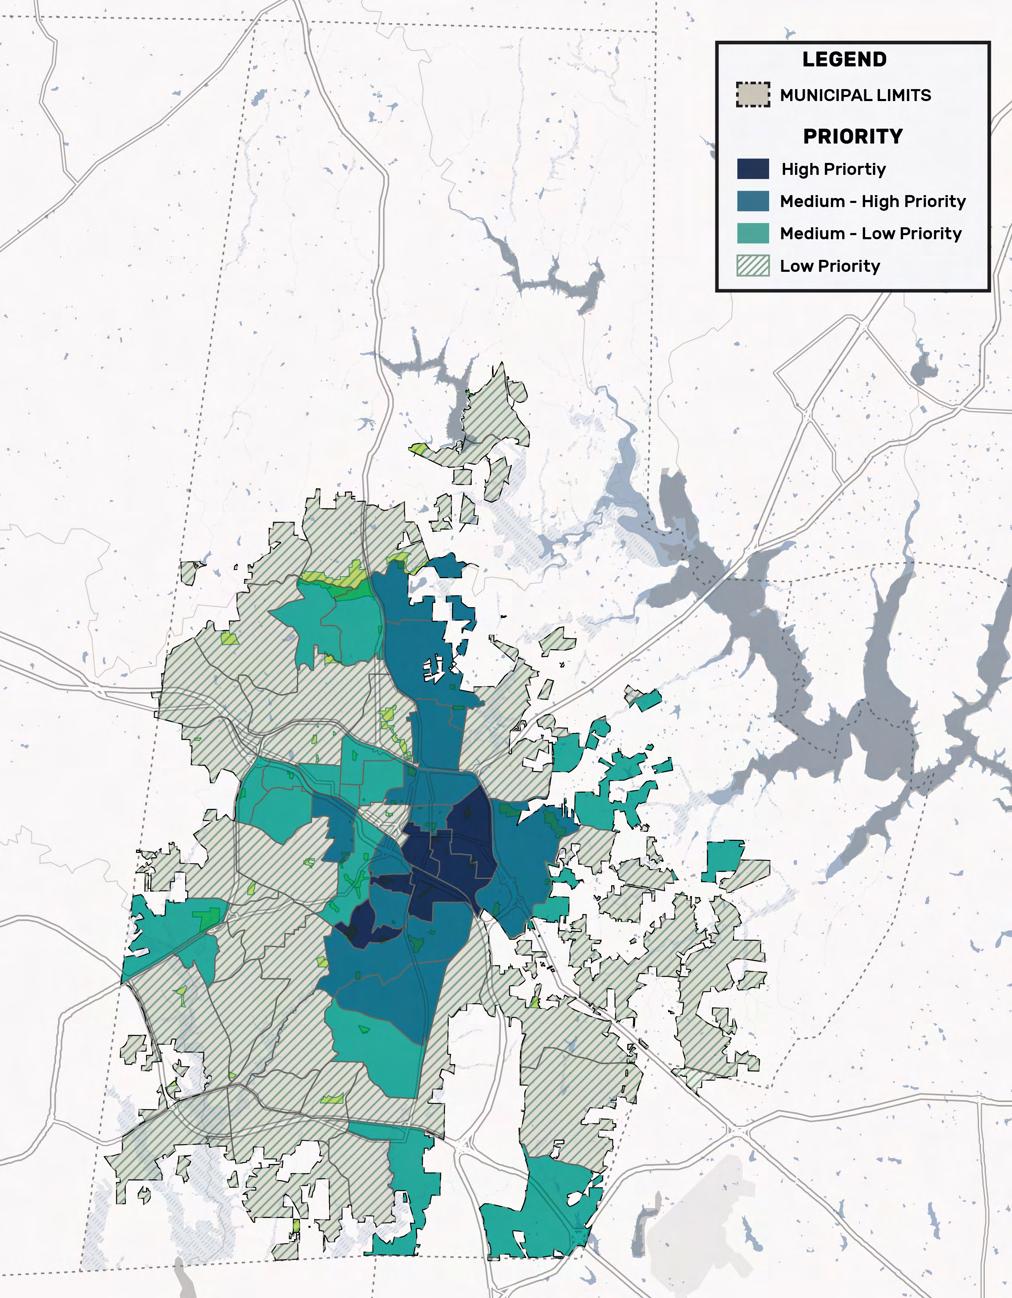
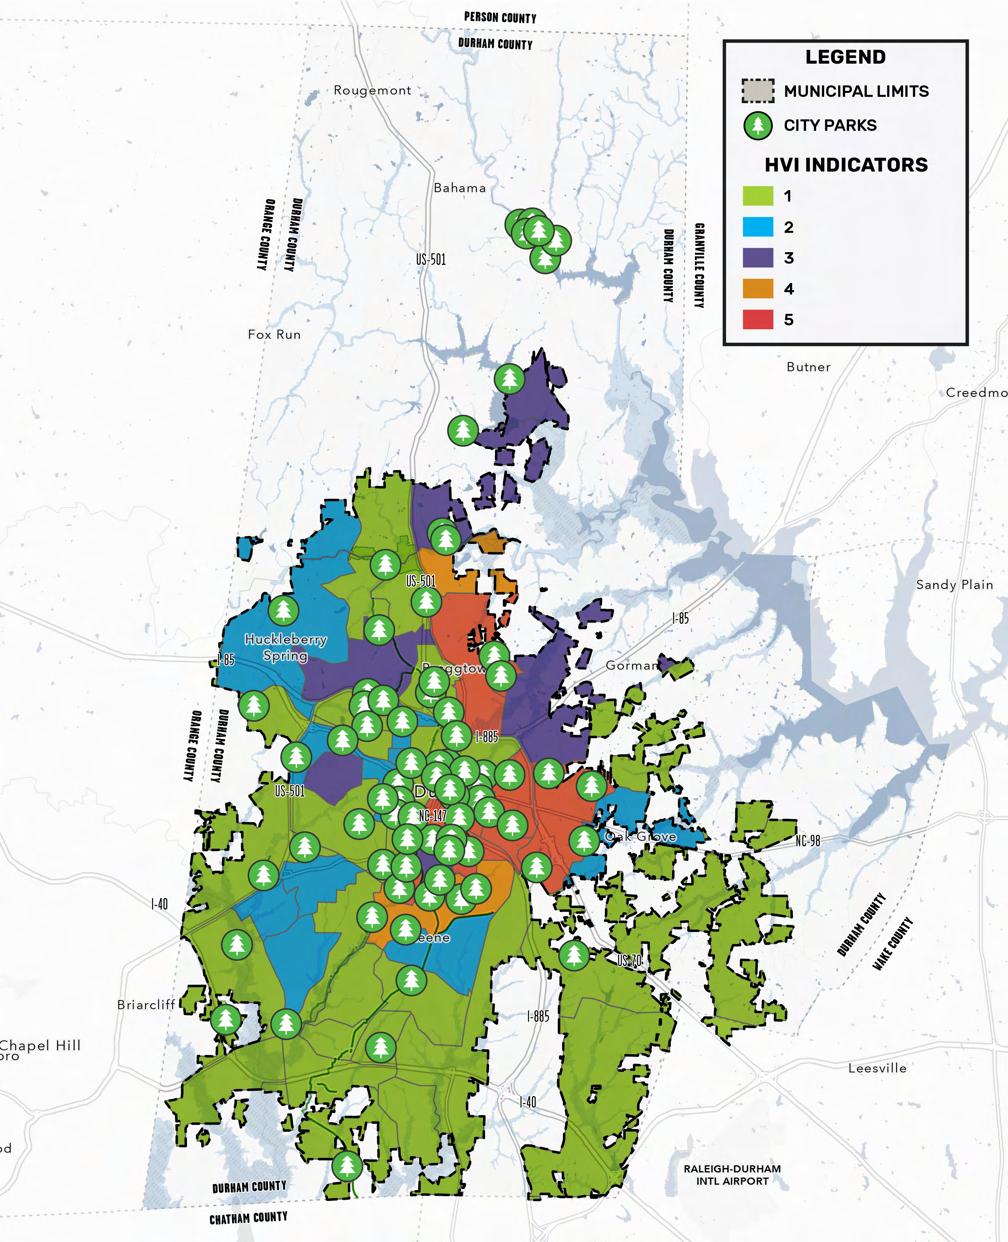
• Small gaps in the system exist in the southern portion of Durham and there is intense growth on the community’s southern, southeastern, and eastern edge. These areas are ideal targets for future expansion to better serve both current and future populations.
Several staffing analyses were undertaken to get a better understanding of successes and challenges Department staff have in operating the system, particularly as it relates to Technology, Communications and Culture, and Maintenance. The key findings of the analyses are:
• DPR has established and maintained a positive internal culture focused on service and providing improved quality of life to residents.
• The Department is undertaking efforts to ensure that expectations and values are cultivated at all levels and communicated effectively across all positions.
• Needs exist to incorporate Wi-Fi into existing facilities to increase their usefulness to the community, especially youth.
• Real and perceived safety is a major concern of maintenance staff who feel there are some locations where they cannot safely carry out their responsibilities.
• Maintenance staff struggle to efficiently provide services given the size of the system – DPR should consider building an additional maintenance facility in the northern part of the City to reduce drivetimes and better distribute resources.
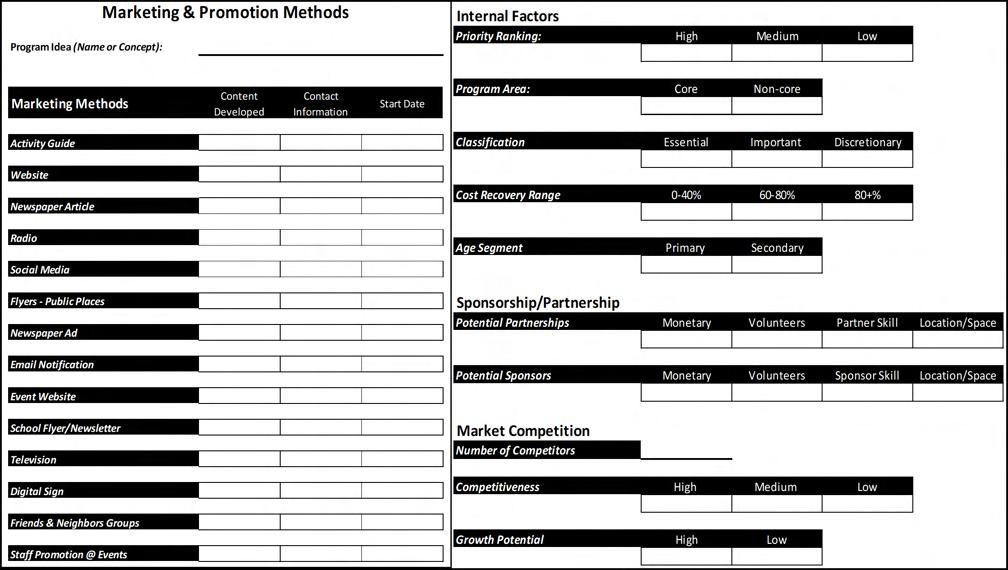
A programming assessment was completed to get a better understanding of DPR’s overall programming portfolio and how they are managed from planning through execution. This analysis looks at several aspects of programming including the programming lifecycle, program planning and management, cost recovery, and popularity and effectiveness of programming. Key takeaways for this assessment include:
• The City has a well-established programming portfolio that is in alignment with the demographics of the population.
• The City should work to balance its program lifecycle, so more programs are well established and consistently offered while still maintaining the majority of its programming as new or fresh.
• The City should undertake development of a new cost recovery model that improves financial health of programming portfolio while simultaneously maintaining the ability for all community members to access programs.
• DPR should create Mini Business Plans for each core program area and update them annually to have regular evaluation of a Core Program Areas outcomes, effectiveness, and cost recovery. This assessment provided DPR key findings including various pricing strategies and a cost recovery model as well as matrices for program evaluation.
An fairness and access assessment was completed to provide guidance to DPR on their role in creating a more equitable and inclusive Durham. This is a complex task as efforts to increase equitable outcomes are often the results of collaboration across the organization and aren’t solely within the purview of DPR. This assessment focused on highlighting strategies related to anti-displacement and how DPR could be an effective team member with other Departments and organizations to produce more equitable outcomes and reduce any perceived negative impacts of parks projects on the community. It is a common belief that capital projects such as parks construction can lead to gentrification, often referred to as ‘Green Gentrification’, this assessment highlighted the role DPR can play as a community partner to develop anti displacement strategies and reduce community impacts and reduce the perception of parks projects as drivers of gentrification.
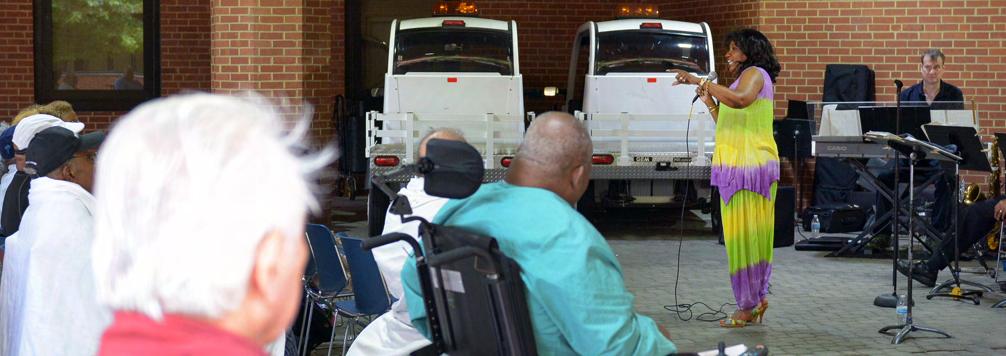
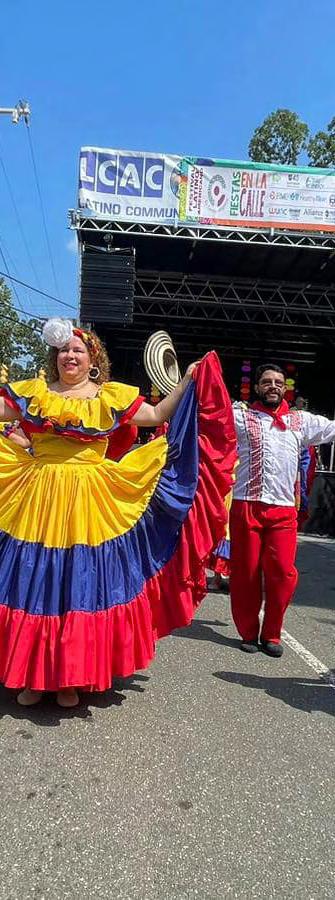
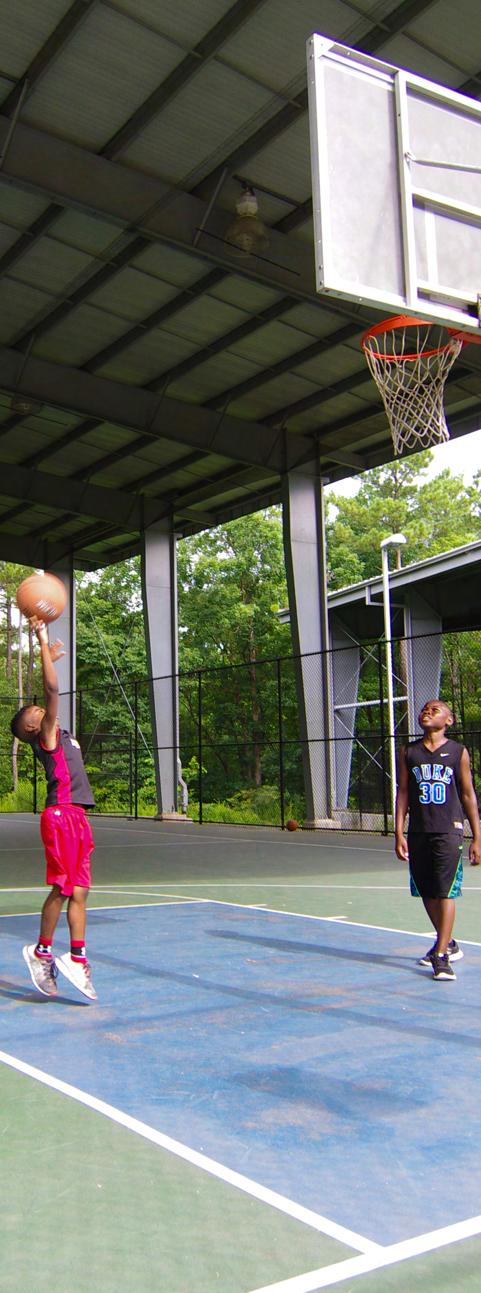
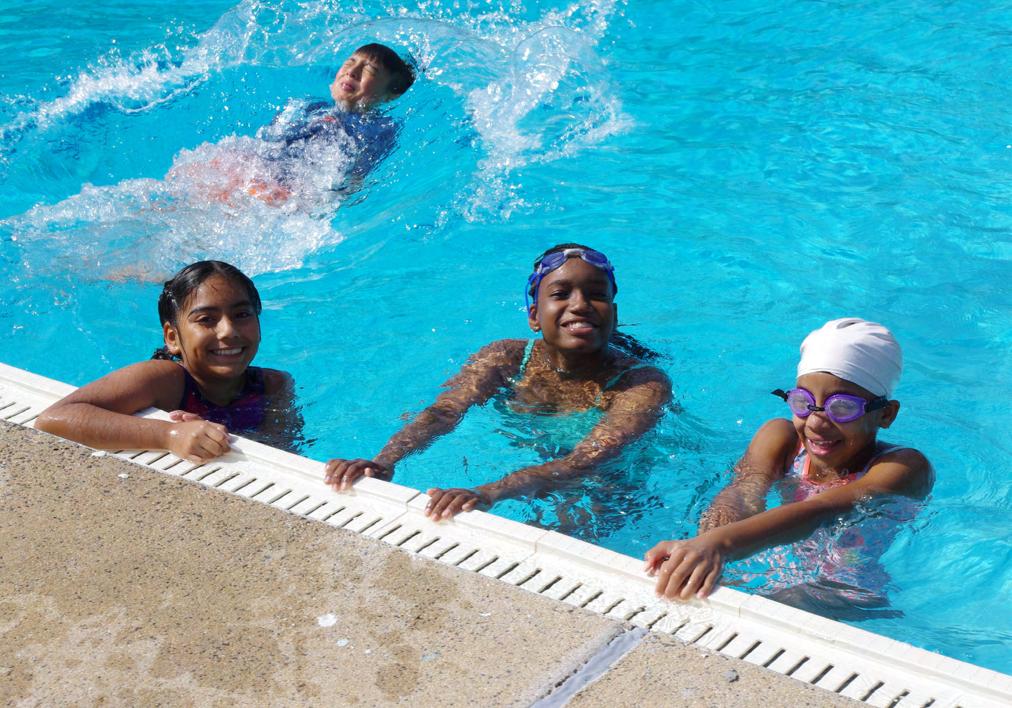
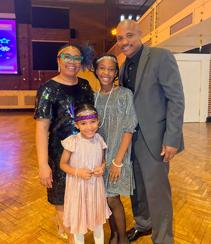
Durham Parks and Recreation Centennial Celebration Photo Gallery
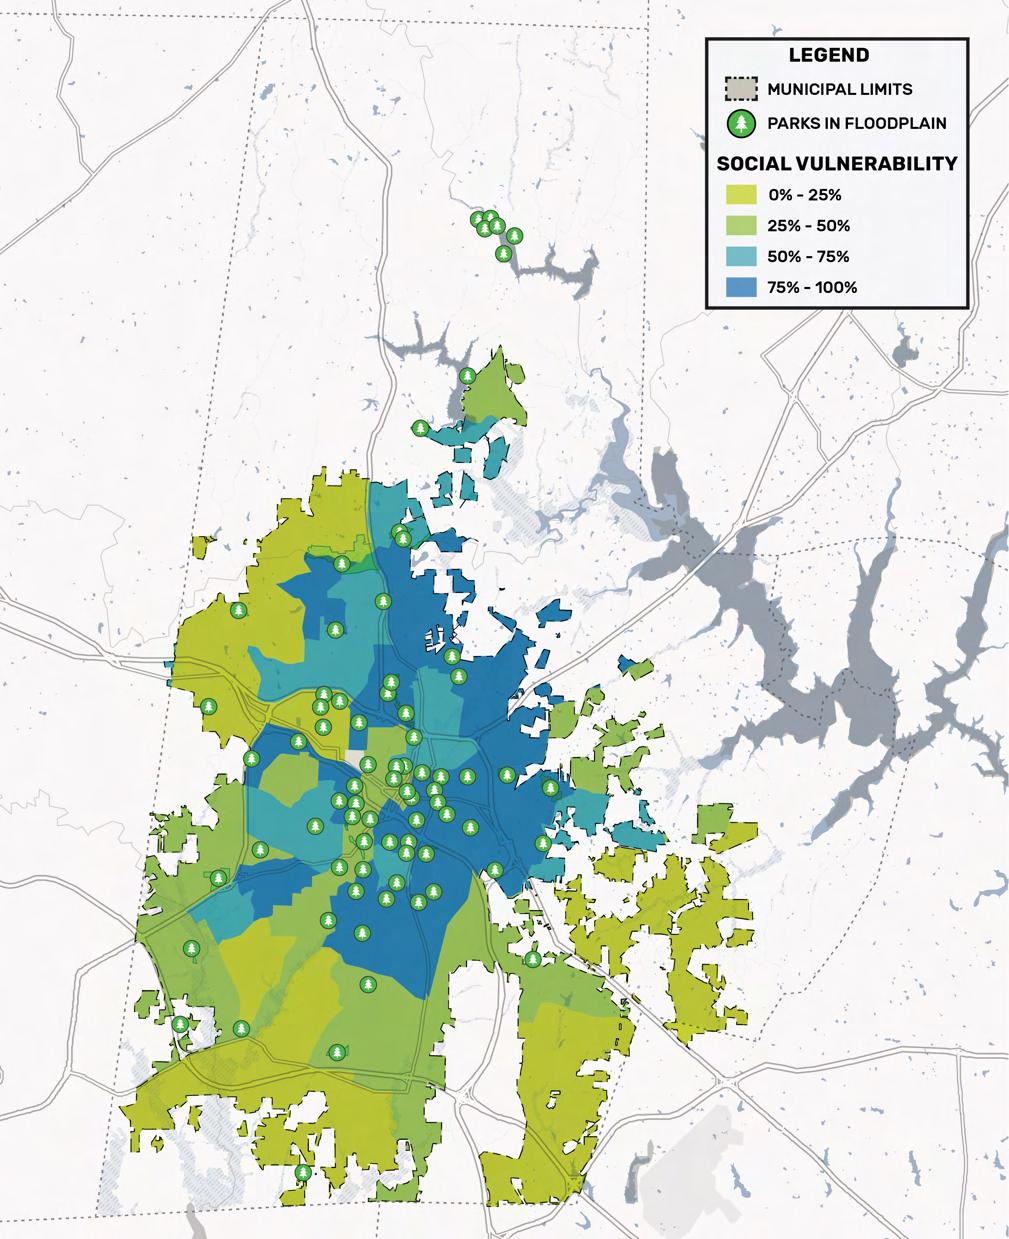
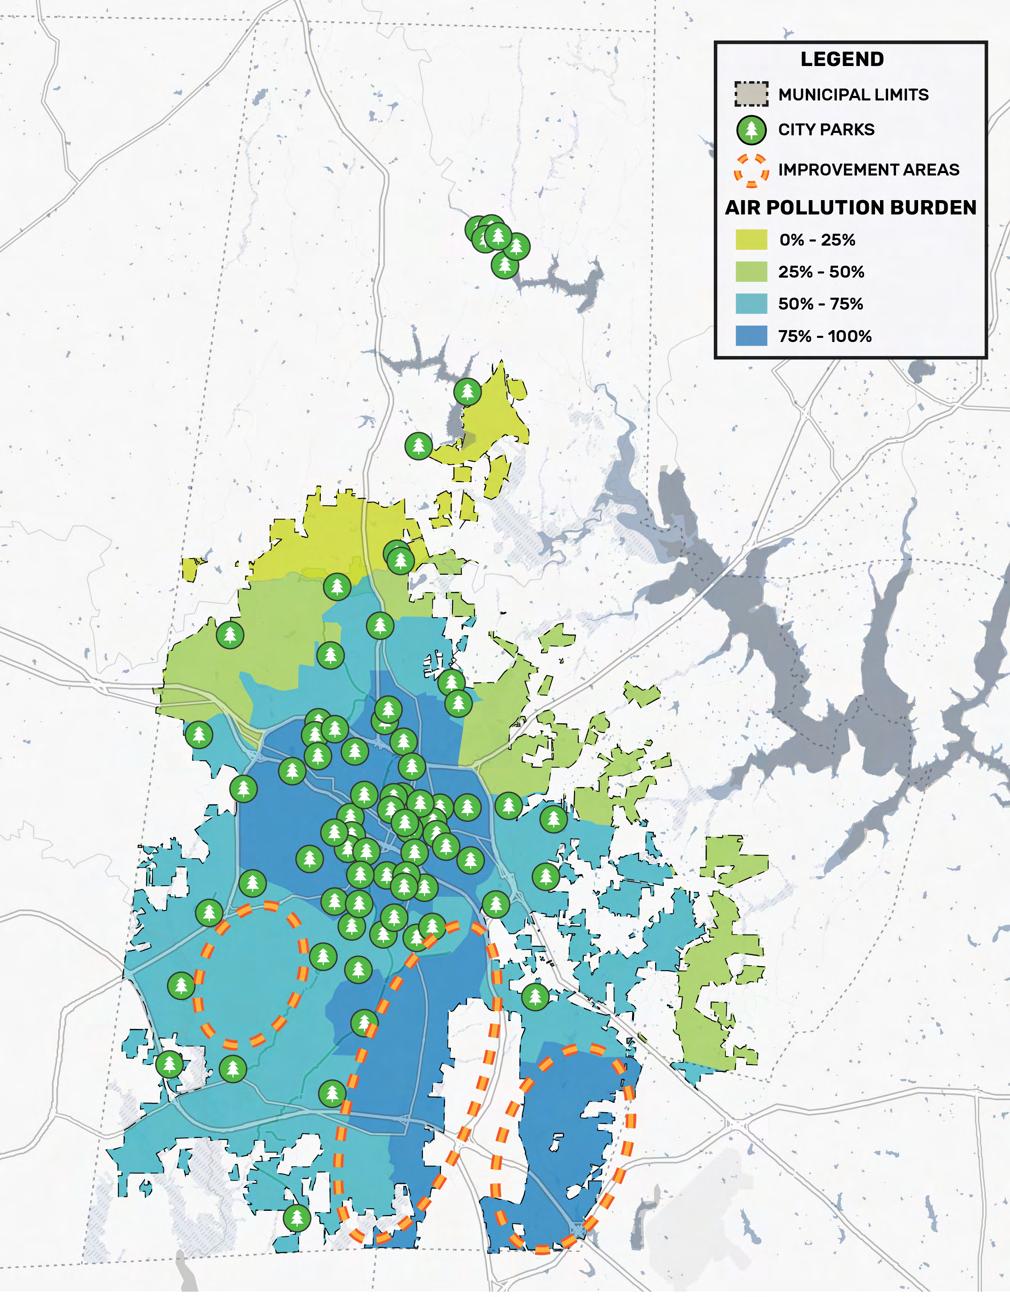
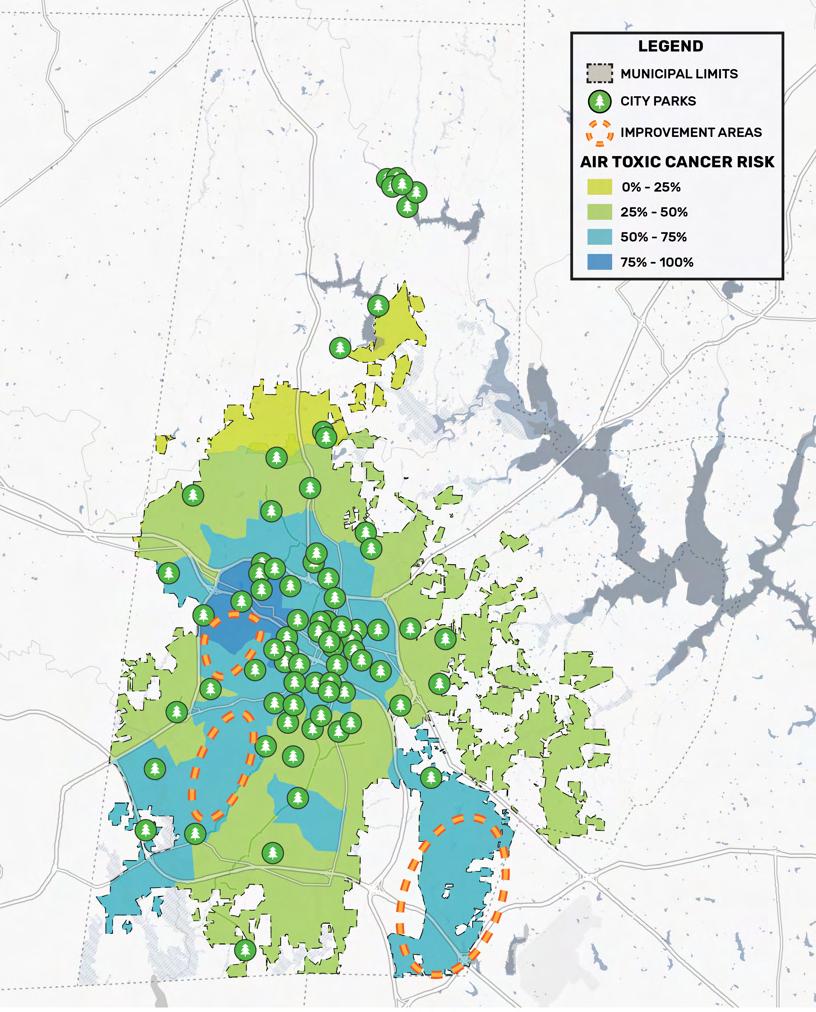
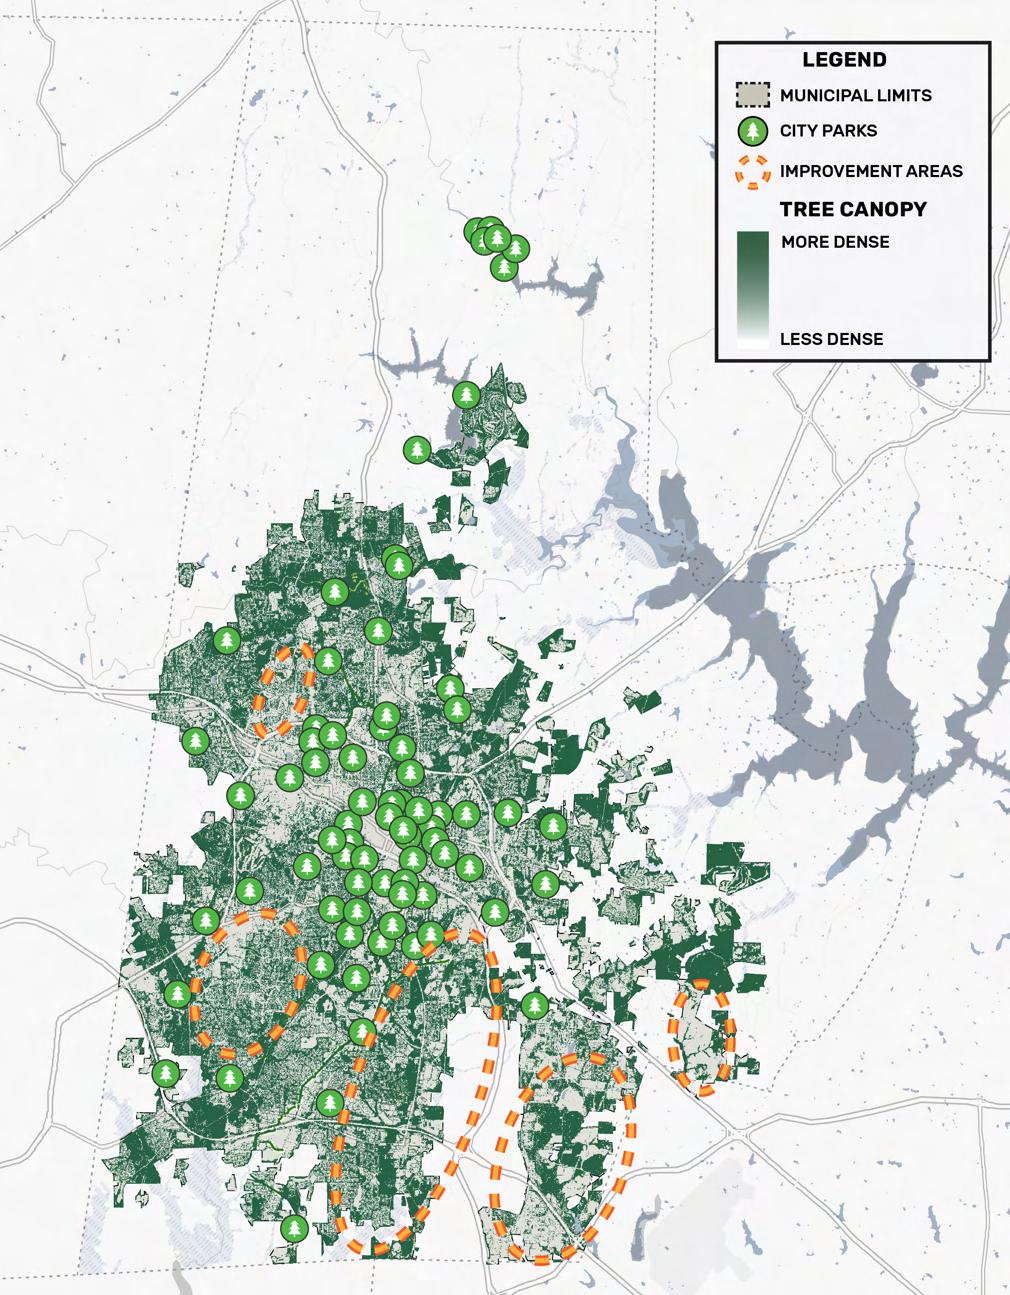
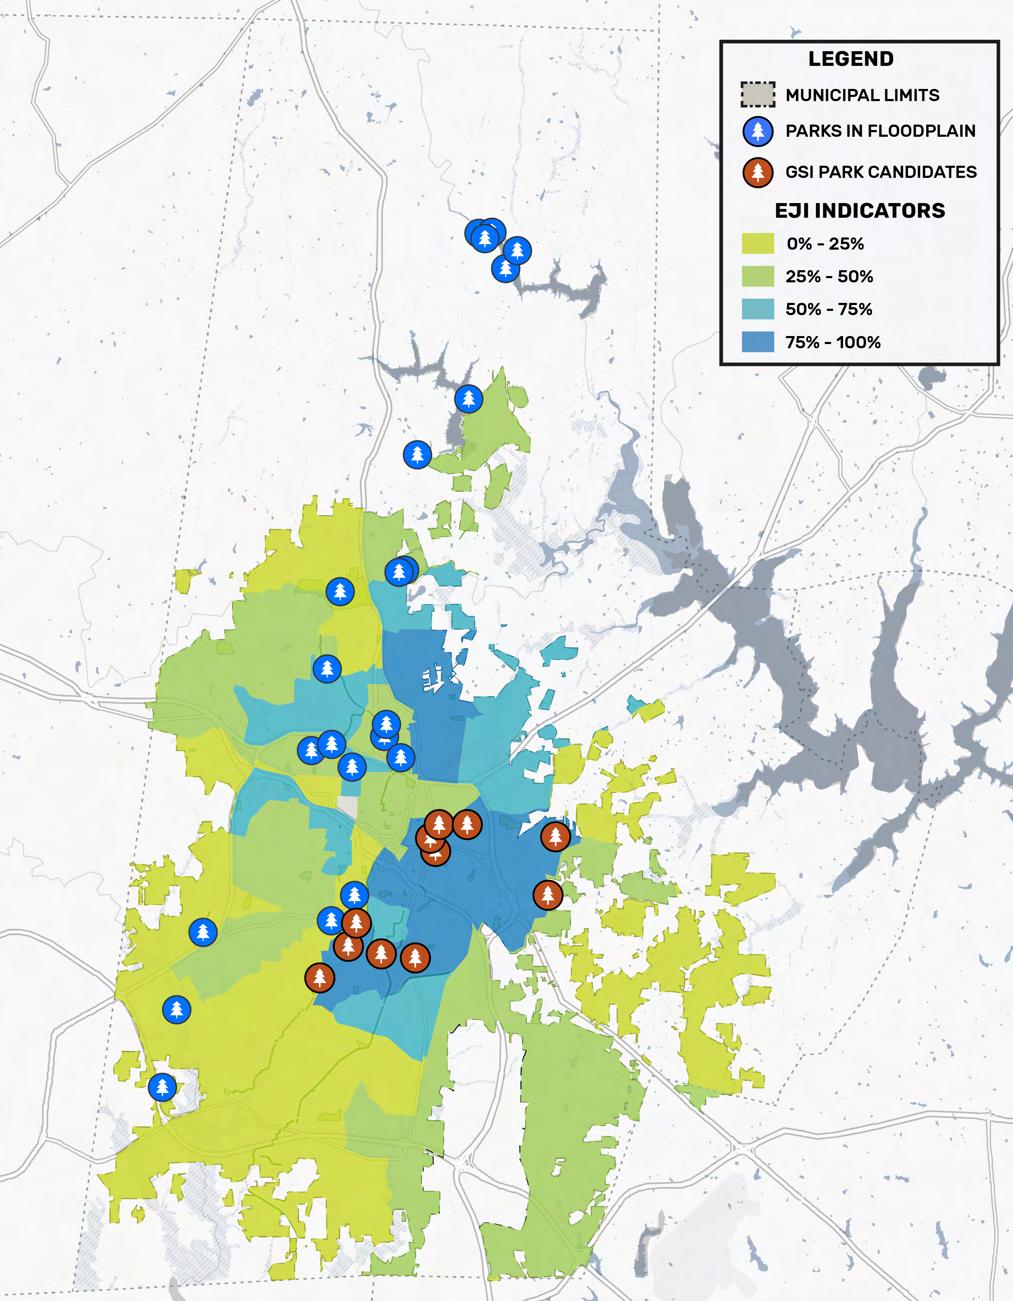
Finally, a resilience assessment was included in the Comprehensive Plan. Mitigating and reducing climate impacts is a shared responsibility and in large cities, such as Durham, impacts can be felt more regularly and more intensely. The resilience assessment was built on five dimensions that were each evaluated specifically for Durham. These dimensions were also components of resilience that DPR could have a larger role in providing positive impact. Those dimensions were:
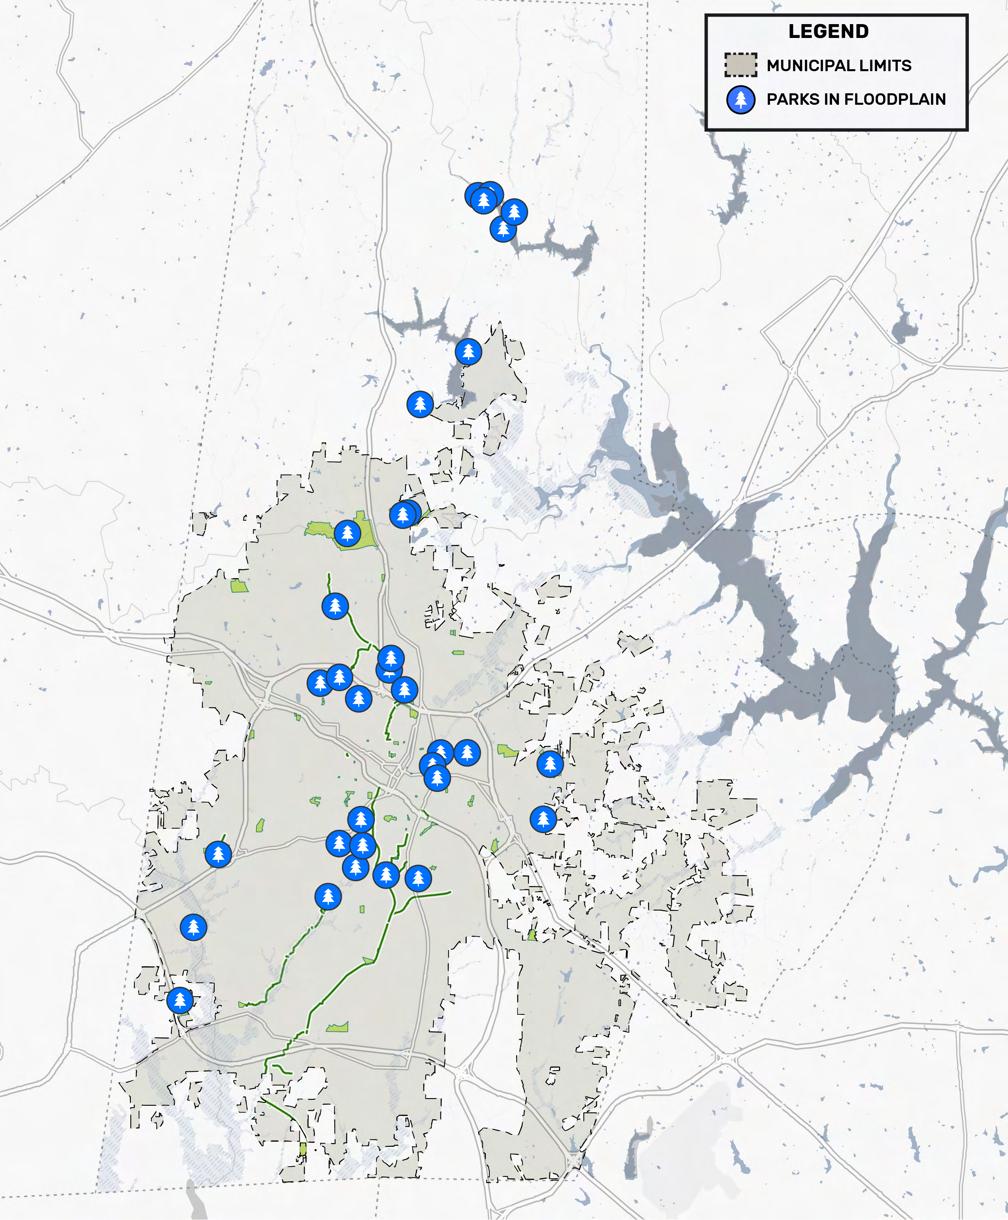
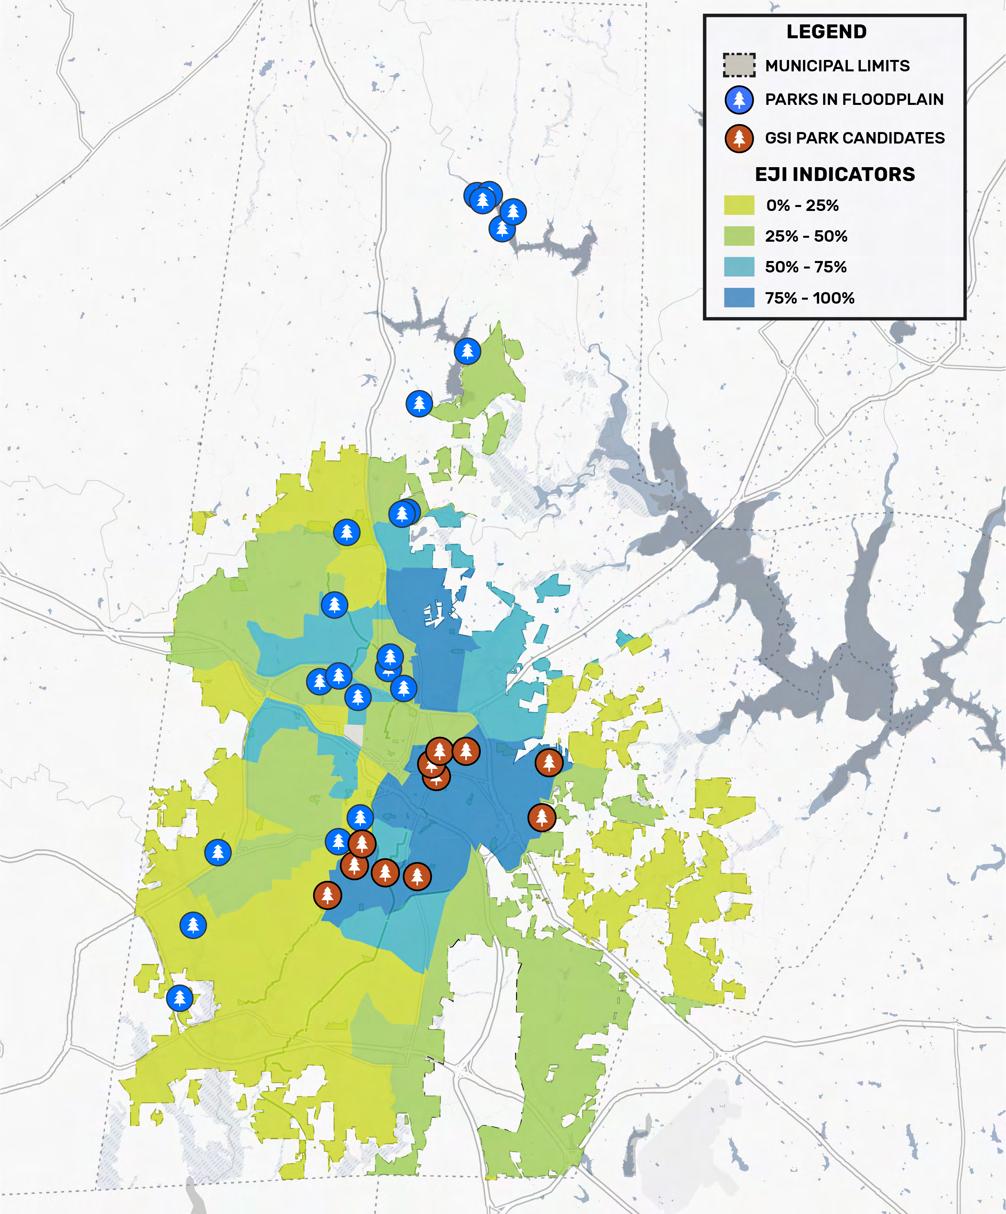
• Flooding & Stormwater Management
• Air Quality & Pollution
• Heat Impacts
• Natural Resources & Biodiversity
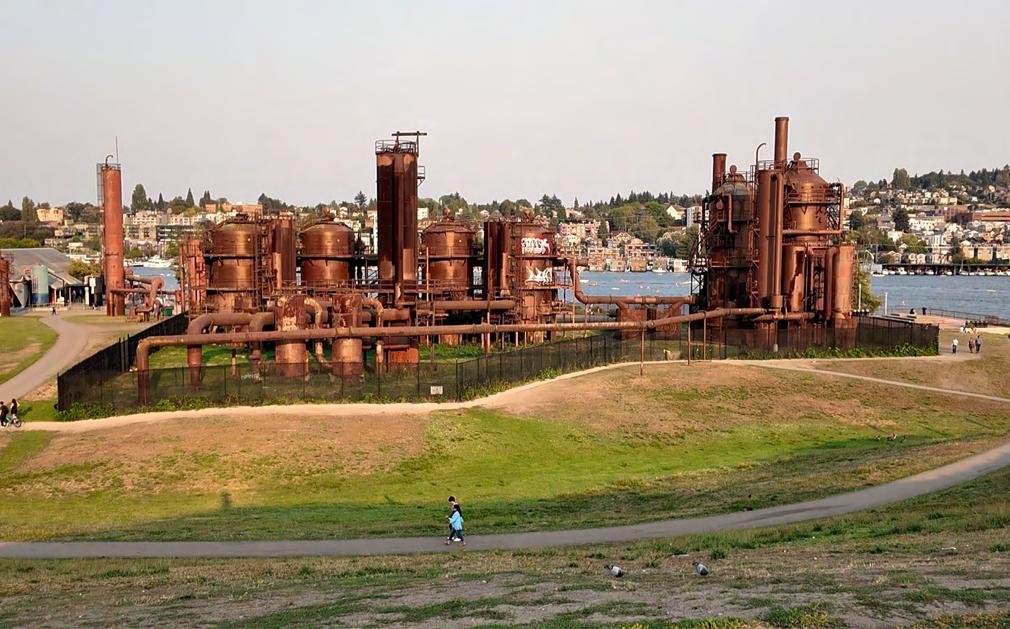
• Brownfields & Contamination Mitigation
Key areas where it was identified that DPR could have meaningful impact included:
• Mitigating and preventing flooding through incorporation of green stormwater infrastructure in parks.
• Improve air quality and aid in reducing air pollution burden by providing “greening” in identified areas in the city.
• Aid in conservation efforts to protect natural resources and increase biodiversity.
• Leverage parks as infrastructure to aid in remediating contaminated sites safely.
At the conclusion of the investigation process and after completion of the initial engagement efforts, the project team worked with DPR leadership to develop the guiding principles for the plan highlighted at the beginning of this summary.
With those principles in mind, the project team worked to create and refine recommendations and action items for the guiding principles. In sum this plan offers 26 high-level recommendations, and 125 action items meant to help DPR achieve the vision set forth in the guiding principles. Each principle, recommendation, and action item is intended to target potential areas for growth and improvement within DPR and within the system it maintains to continue to provide excellent service to Durham’s residents.
Summary
Through the planning process it has become clear that the Parks and Recreation system in Durham is a vital community asset and is well loved by the community. It is also clear that DPR staff consistently demonstrate their care for the people and the environment of Durham and are invested in continuing to provide a high-quality experience for residents. Parks and Recreation Comprehensive plans are a tool that give the City insight on how to care for and grow a well-loved asset over a long-term planning horizon.
With the adoption of this plan, the City has committed to providing a Parks and Recreation system that reflects the desires and needs of the community, is equitable, is responsive and adaptive to changing circumstances, is resilient and an environmental benefit, and reflects a unique sense of place and an experience that is authentically Bull City.
Fairness First Rooted in The Community
1 CHAPTER INTRODUCTION
What is a Parks & Recreation Comprehensive Plan?
A Parks and Recreation Comprehensive Plan is a strategic document that guides the development, management, and improvement of a community’s parks, recreational facilities, and open spaces over a long-term period, often 5 to 20 years. It serves as a roadmap for decision-makers, staff, and stakeholders by outlining goals, priorities, and actions to ensure that the park system meets current and future community needs.
The Durham Comprehensive Parks and Recreation Plan will guide Durham Parks and Recreation (DPR) for the next ten years. This plan focuses on improving Durham’s Parks system to improve equitable access, respond to growth, continue to root DPR in the community, embed resiliency into DPRs offerings, and aim for organizational excellence within DPR.
Why do we need a Parks & Recreation Comprehensive Plan?
This plan comes at a critical time for DPR’s system. The Department has just celebrated its 100th anniversary and the challenges and opportunities facing the Department now are unique and call for a planning effort to chart the path for a just and resilient future.
Since the completion of the previous Parks and Recreation Comprehensive Plan, the City has undergone significant changes. The COVID-19 pandemic, growing unrest and calls to focus on equity, massive amounts of development and population growth, and worsening impacts of climate change have placed strain on the City and the parks system. As a provider of invaluable amenities and experiences, DPR plays a major role in responding to these strains.
More specifically, this plan seeks to answer the following questions that are at the forefront in planning DPR’s future.
• How can DPR continue to root itself into the community?
• How can DPR respond to the large growth pressures facing the city?
• How can DPR continue to embed fairness into its actions and improve equitable access across the city?
• How can DPR leverage its parks and facilities to mitigate climate impacts and improve resiliency?
• How can DPR find a sustainable balance between operations and maintenance and the system expansion?
A consistent theme revealed by the community, staff, and stakeholders in this planning process was the need for an equitable parks system. According to the American Planning Association, “PolicyLink defines equity as “just and fair inclusion into a society in which all can participate, prosper, and reach their full potential. Unlocking the promise of the nation by unleashing the promise in us all.” Unlike equality, which connotes sameness, equity is responsive to difference; equitable policies actively
mitigate the disproportionate harm faced by certain communities. Four cross-cutting issues related to social equity in planning include gentrification, environmental justice, community engagement, and empowerment.” This plan prioritizes setting a vision and recommendations for creating a more equitable parks system.
What does a Fair Park System Look Like?
Durham is home to a diverse community in so many regards. While different communities may have nuanced individual needs, it has become clear through the planning process that a key shared value to all residents is equity.Depending on the individual and the situation, equity can have different meanings. For Parks and Recreation, the community has articulated consistently that equity means fair and easy access to high-quality facilities that are safe, well-maintained, and reflective of the community’s needs and values. DPR’s services are invaluable to the community. They provide opportunities to improve physical and mental health, support community gatherings and belonging, provide unique and fun experiences, and produce significant economic benefits. They also have a profound impact on the natural environment. DPR’s facilities can help manage stormwater issues, reduce urban heat, and improve air quality throughout the city.
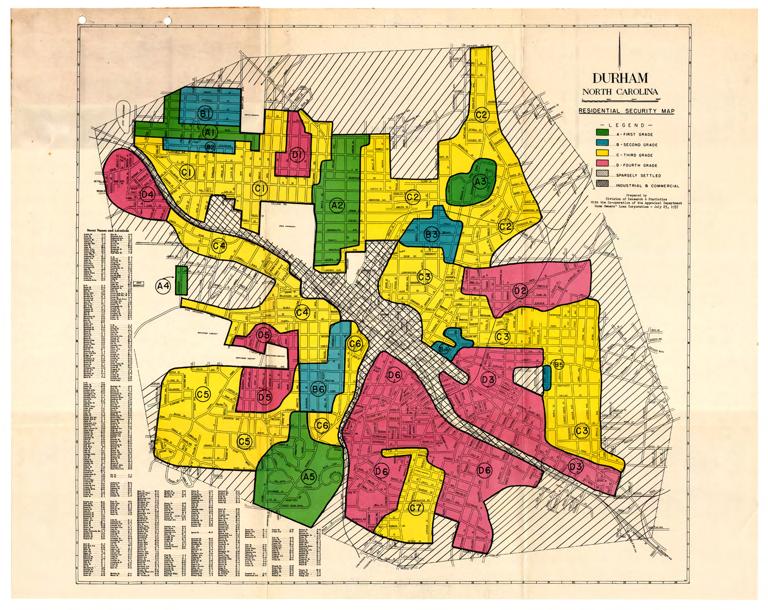
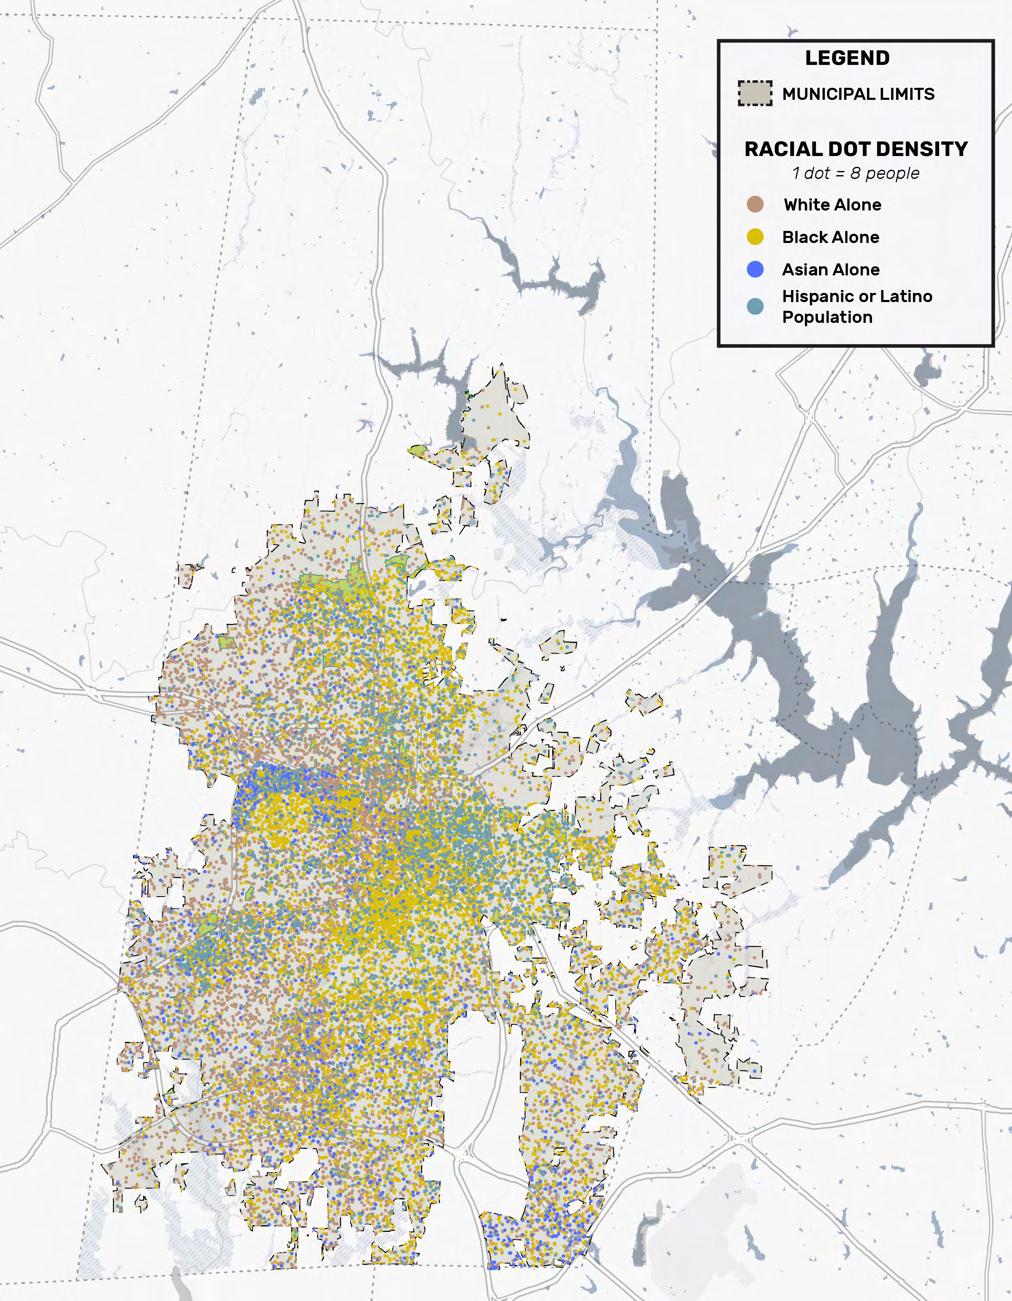
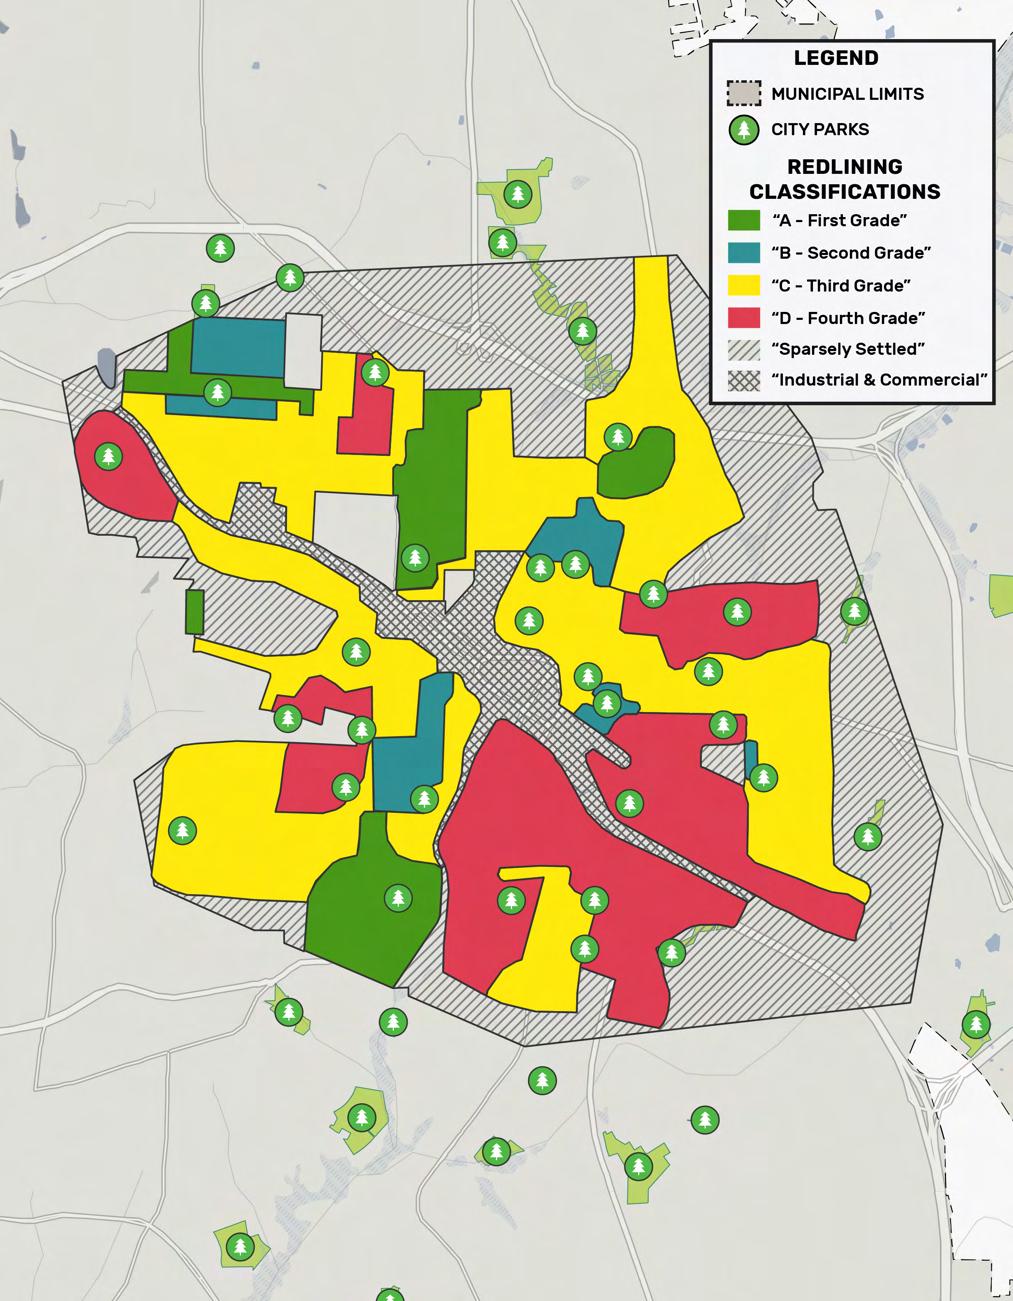
Like many communities across the United States, Durham has a long and complicated history that has created barriers to access recreation opportunities. Segregation, redlining, urban renewal, and other historical policies rife with injustices have impacted park development and thus people’s relationship with the system, the Department, and the City. This plan’s vision looks to propel DPR into the next century where all residents can rely on the Department to listen and respond to their needs and provide benefits of parks across the City.
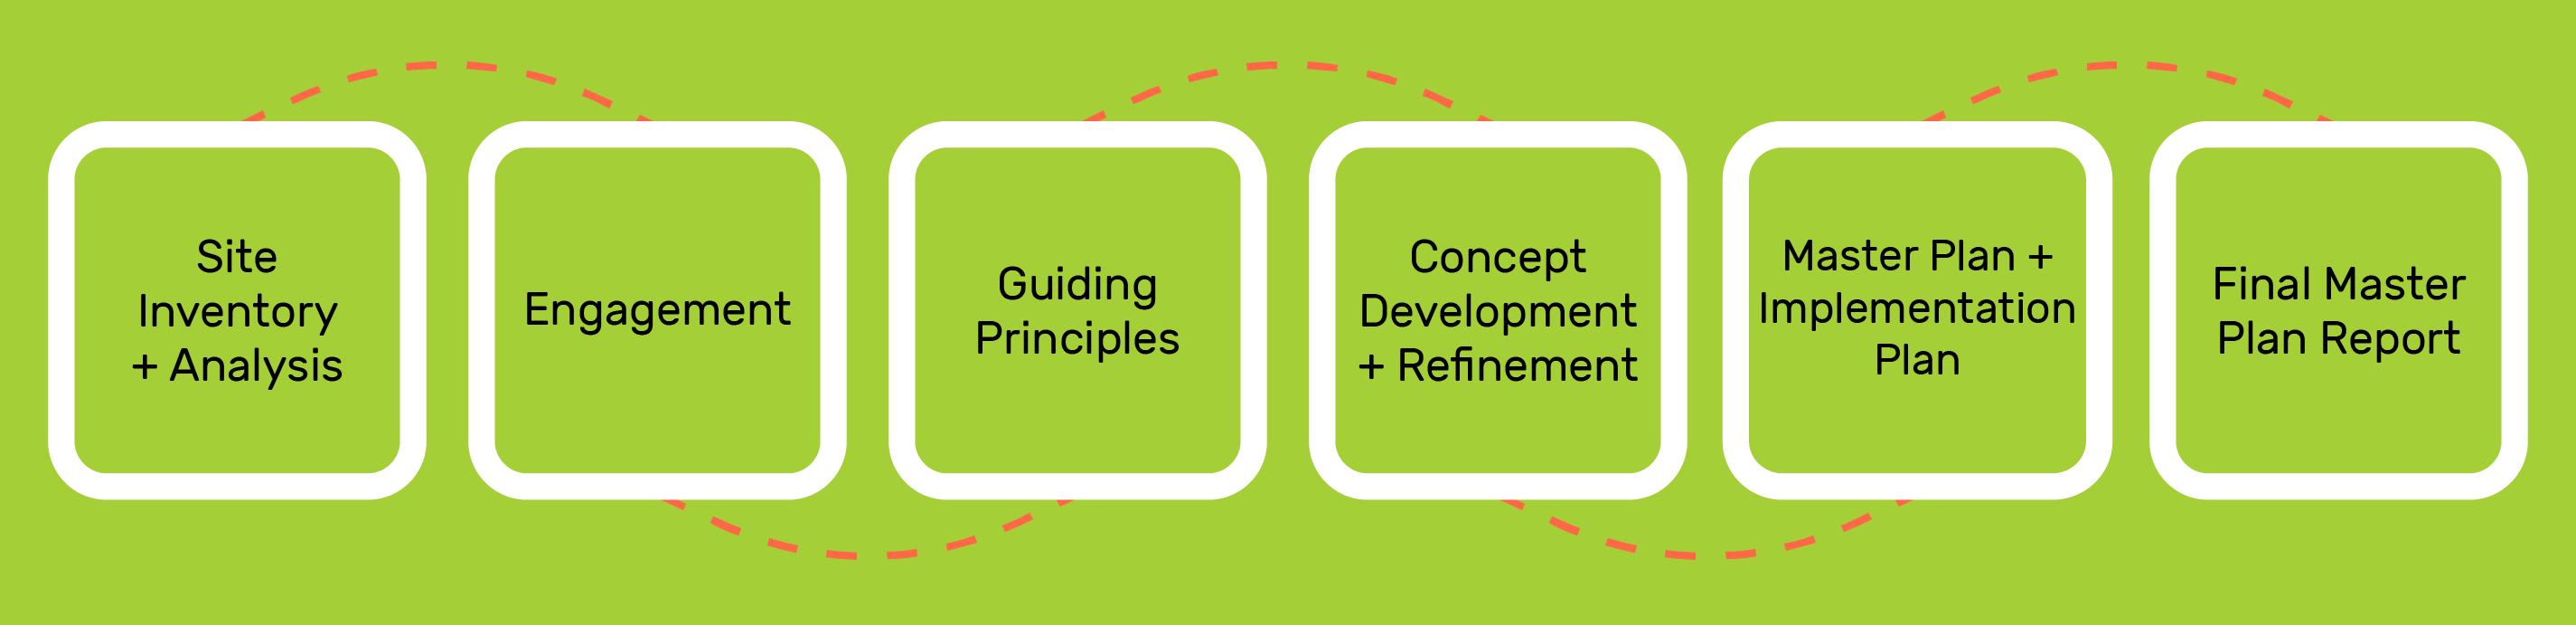
Planning Process
The process for the Durham Parks and Recreation Comprehensive Plan entailed a 24-month effort to combine extensive data collection and analysis, community and stakeholder engagement, and close collaboration with staff to build a plan rooted in a thorough understanding of the state of the system and the needs of the community and provides clear and realistic recommendations for DPR for the next ten years.
This plan would not be possible without the hard work and dedication of DPR staff who worked closely with the planning team to provide insight, guide the process, and facilitate engagement.
Plan Content
This plan is grounded in robust community and staff engagement efforts as well as data-driven analyses of Durham’s Parks and Recreation system. From the initial inventory and analysis phase through the development of recommendations and action items, the team engaged with appointed officials, stakeholders, focus groups, staff, and the community.
This plan also acknowledges local, regional, and national recreation trends, changes to Durham’s demographics, and agency performance. The project team visited current parks and facilities and assessed current program offerings to evaluate the overall operational successes and challenges of DPR and its mission. Finally, the project team, alongside DPR staff developed a set of guiding principles that brought forth recommendations that aim to equip DPR with a clear agenda to improve and grow its system.
This 2024 Comprehensive Plan includes the following components:
Demographics & Trends
The project team completed a demographic and trends analysis to conclude current and future recreation trends and participation levels as they relate to Durham’s unique community composition.
Planning Context Analysis
The project team reviewed the past planning efforts of DPR and the City to understand the planning context and the Department’s evolution. The past planning efforts provide a comprehensive understanding of the recommendations that guide the growth and development of the City.
Community Engagement
Through the public engagement process, the project team gathered input from the staff, focus groups, and the community. The process was designed to be transparent, equitable and engage the widest range of residents possible.
System Inventory & Analysis
The inventory and analyses take a full account of the existing parks, recreation, open space, and greenways system. Parkland and facilities, programming, arts and culture, operations and maintenance, resilience, equity efforts, and finance were inventoried and analyzed to inform the need for enhancing the current services the Department provides and recommendations for the future.
Vision & Recommendations
The vision, recommendations, and prioritized implementation plan provide a framework to guide park, facility, open space, greenways, programming, and operational improvements for the future. It is structured to guide decision-making for DPR’s policies. Each recommendation is further prioritized for 0-4 years, 4-7 years and 7-10 years’ timeframe. The criteria for recommendation prioritization vary based on the context, the abilities of the Department, and available resources. Therefore, criteria may range from land availability to financial implications, but each are firmly rooted in community values established early in the process.
Local Context & City History
Durham Parks and Recreation Centennial Celebration Photo Gallery
Geographic Context
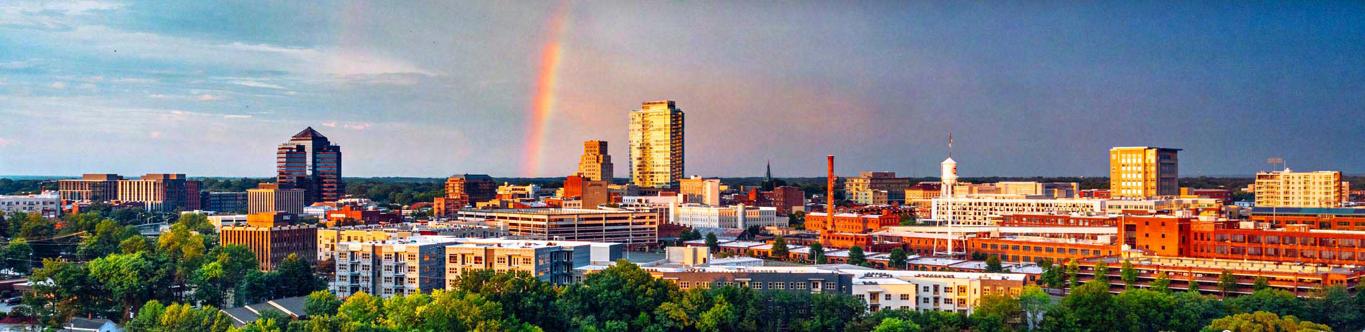
Durham, North Carolina, is located in the central Piedmont region, a transitional area between the Atlantic Coastal Plain and the Appalachian Mountains. This geographic position gives Durham a gently rolling landscape with elevations typically ranging between 300 and 500 feet above sea level. The area is characterized by ridges, valleys, and streams, creating a varied topography that influences both natural habitats and urban development.
Landforms & Watersheds
Durham sits within the larger Cape Fear River Basin, with several significant watersheds, including the Eno River, Little River, and Flat River, which are part of the Neuse River Basin. The Eno River is particularly notable for its scenic beauty and its contribution to Durham’s water supply, as well as for providing recreational opportunities through Eno River State Park. The river’s floodplain and riparian areas support diverse ecosystems and help mitigate flooding. Falls Lake, to the east of Durham, is a major water reservoir and recreational area.
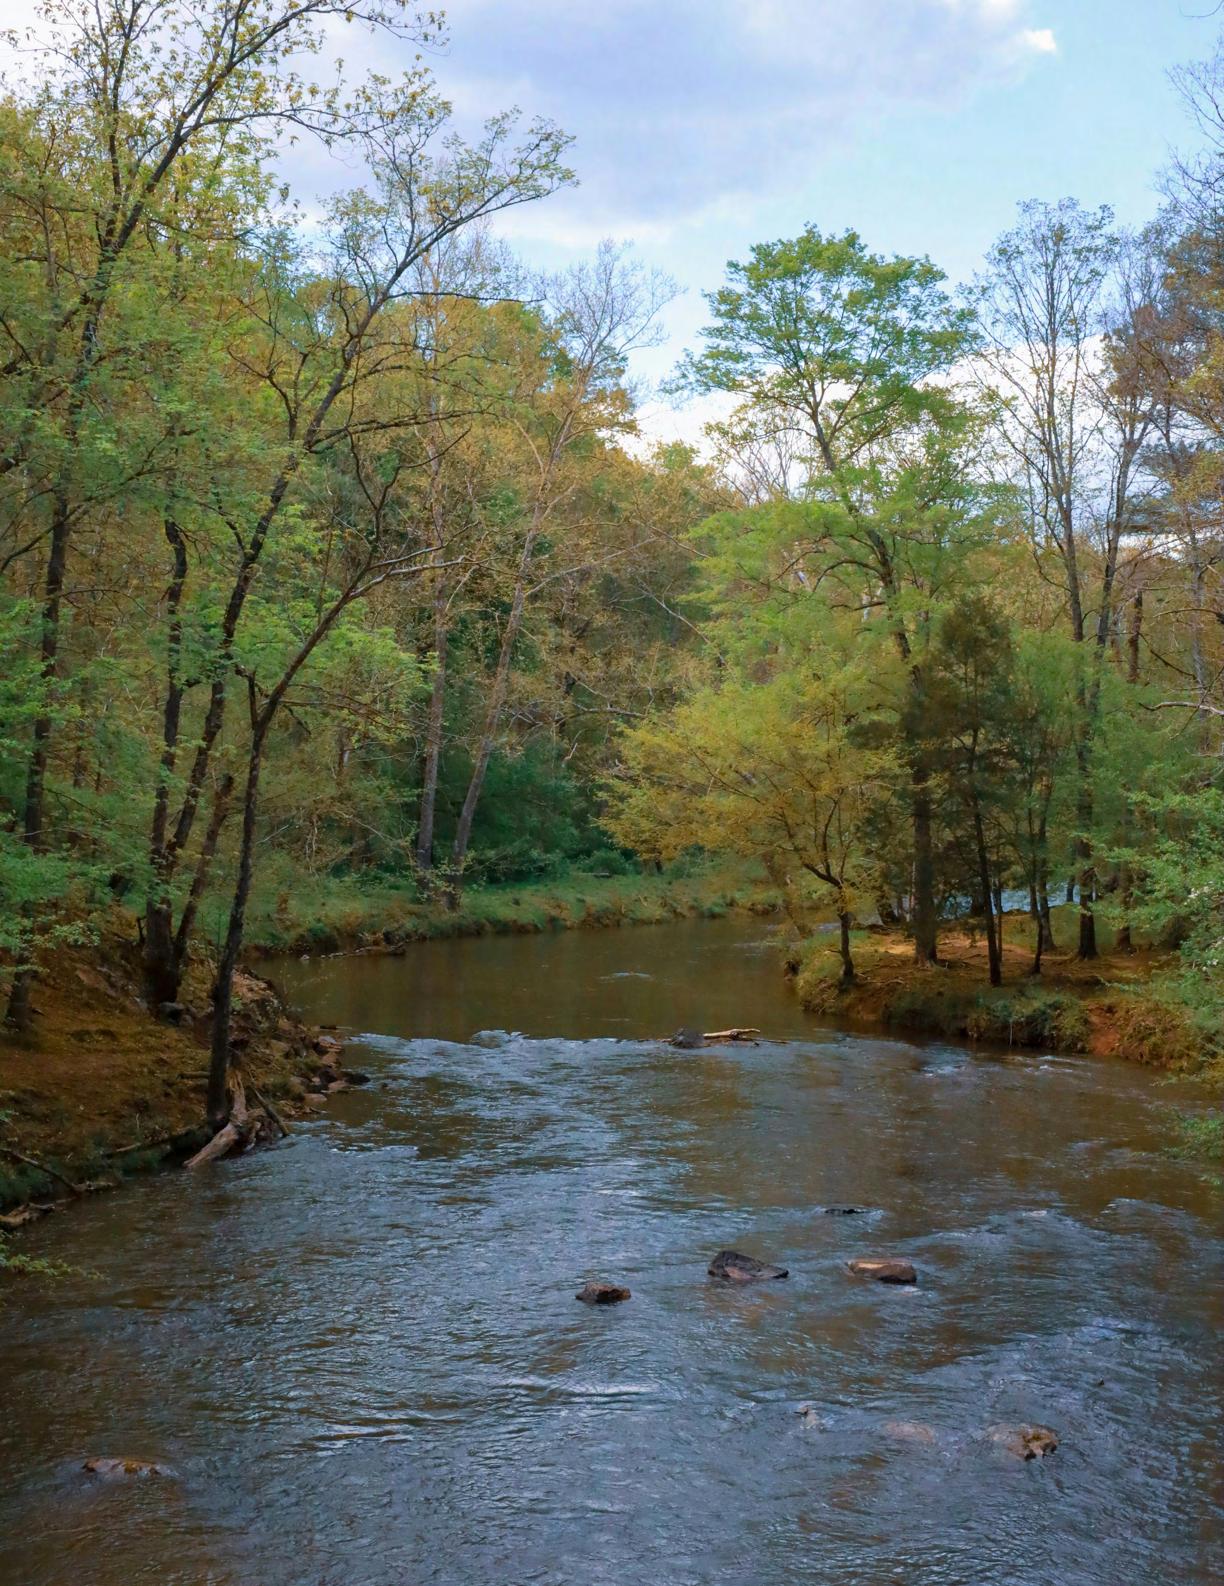
Rivers & Streams
The rivers and streams that flow through Durham carve through the clay soils and hardwood forests typical of the region. The Eno River is a tributary to the Neuse River, and its watershed is crucial for both water quality and biodiversity. These waterways host species of fish, amphibians, and invertebrates, as well as serve as important migratory paths for birds. The creeks and streams that feed into larger bodies of water create important riparian corridors, providing both habitats and natural filtration systems for stormwater.
Durham is also in close proximity to Jordan Lake, which is a critical water source for the City of Durham as well as other municipalities in the area. Approximately half of the City of Durham is in Jordan Lake’s watershed. As such, the Jordan Lake watershed is protected by numerous rules at the local and state level. The Park also has a regional draw for recreation as a State Recreation Area. The Jordan Lake State Recreation Area offers camping, hiking trails, beaches, and boat launches.
Climate
Durham experiences a humid subtropical climate, characterized by hot, humid summers and mild winters. Average summer temperatures can reach the mid-80s to 90s Fahrenheit, with significant humidity, while winters are generally mild, with average temperatures in the 40s and 50s, though occasional cold spells can bring temperatures down to freezing. Precipitation is well distributed throughout the year, averaging around 45 inches annually, with a peak during the late spring and summer months. This climate supports a diverse range of vegetation and wildlife.
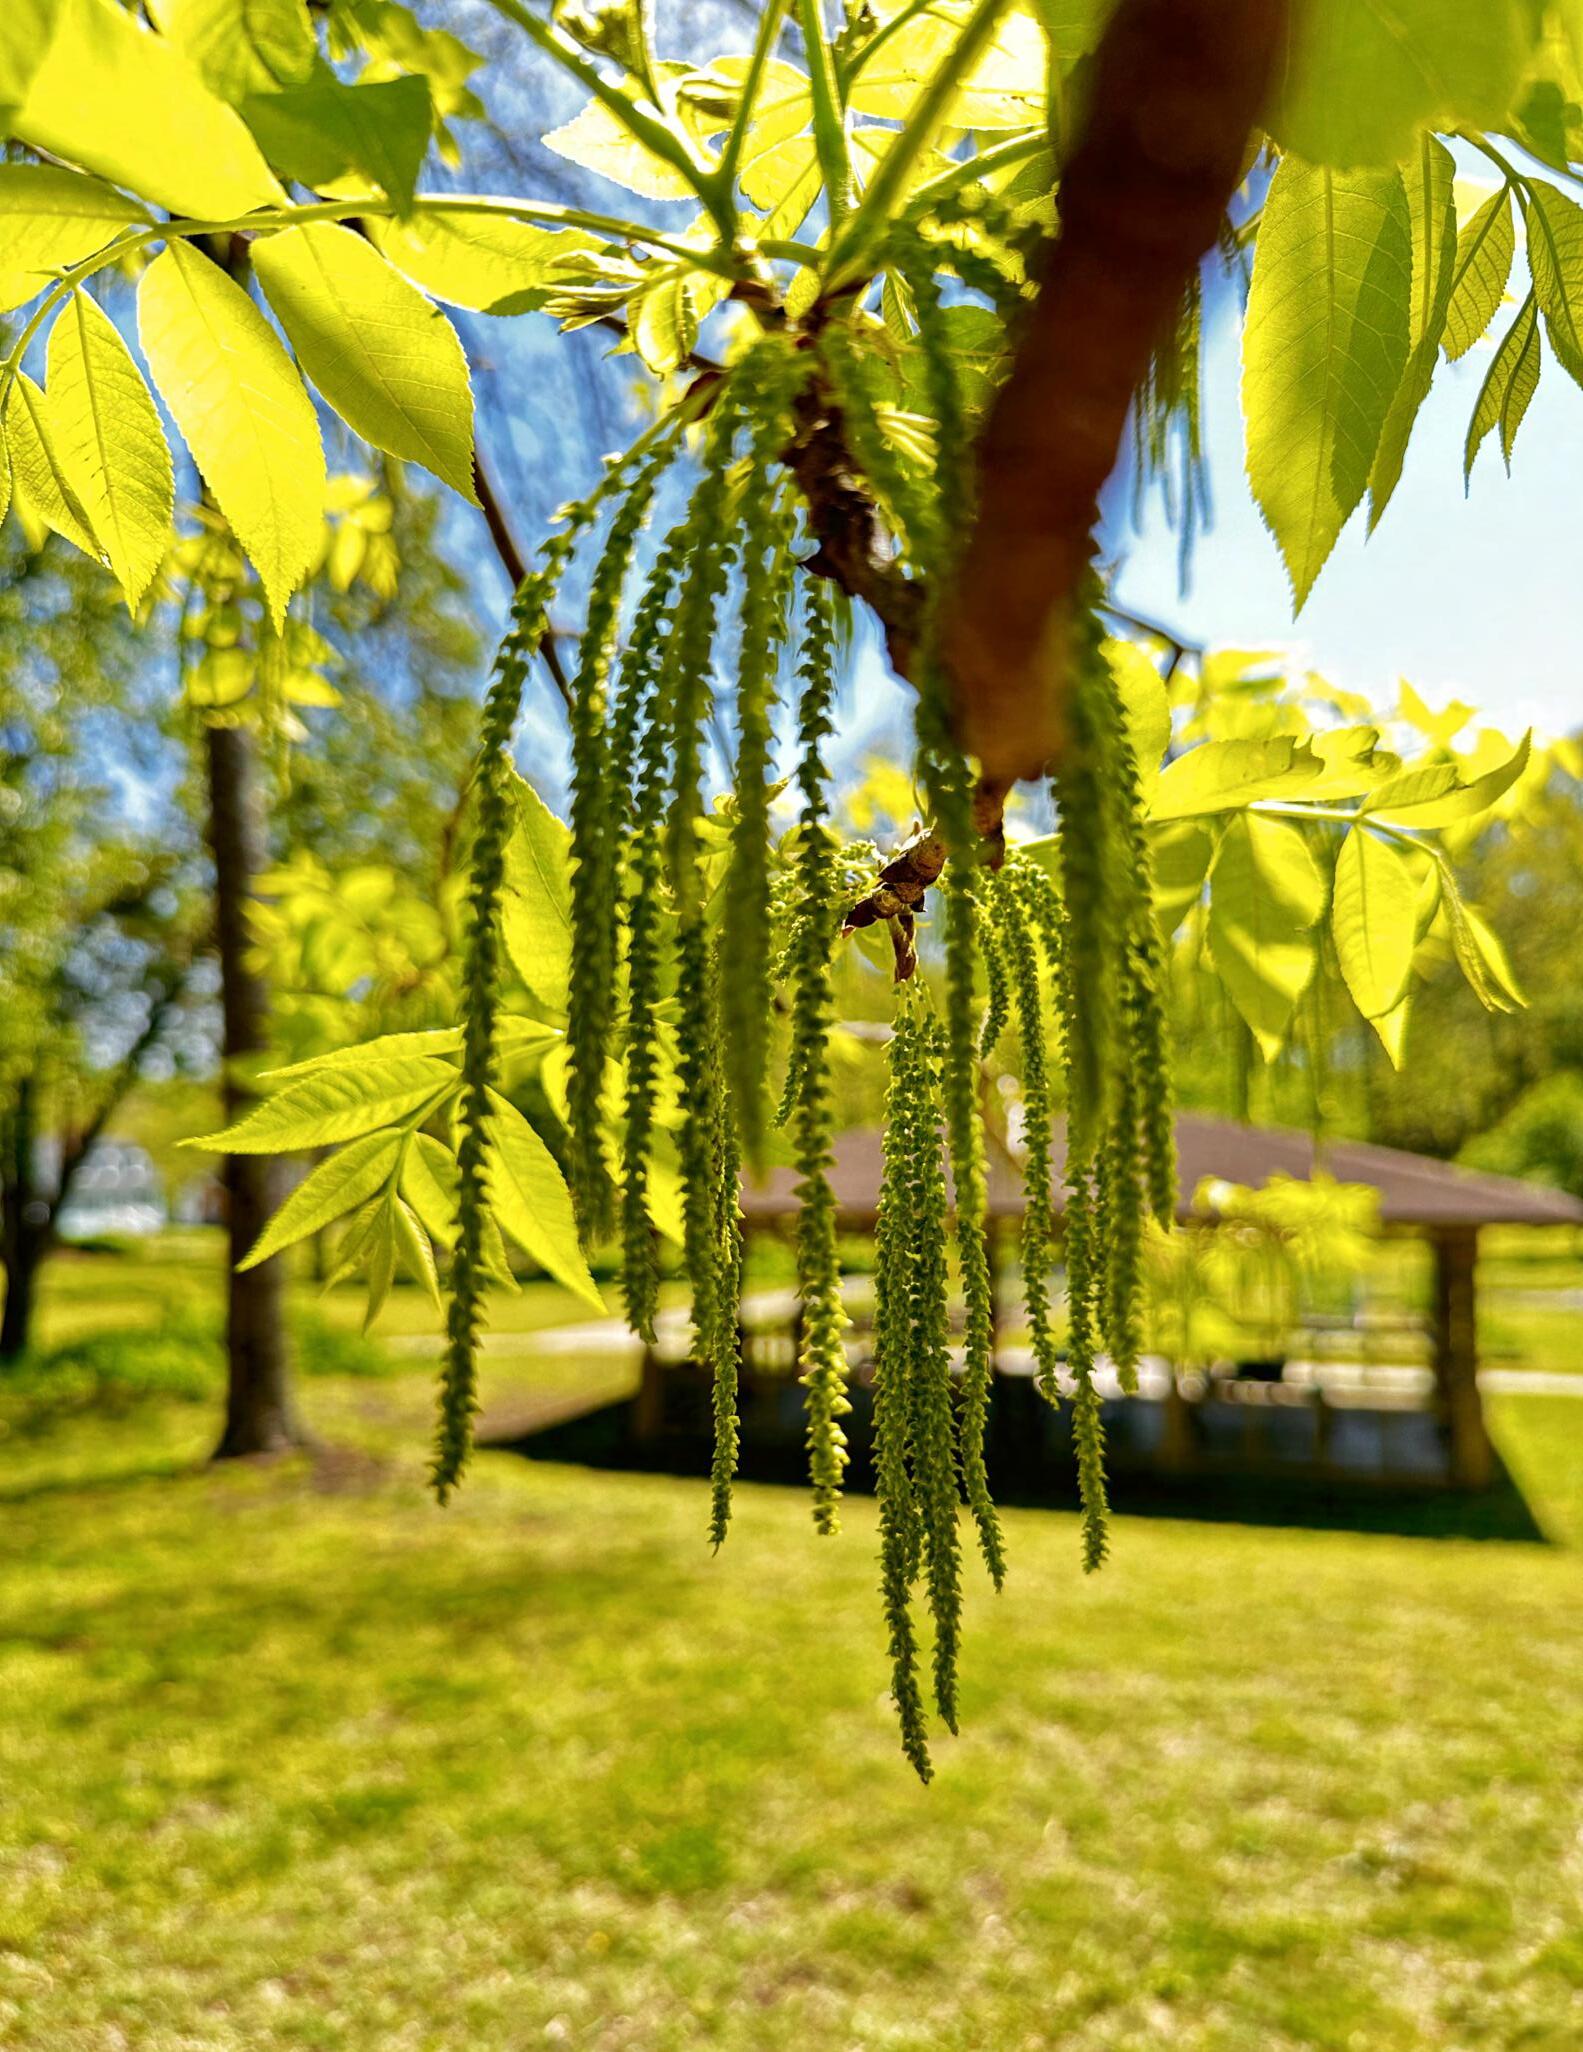
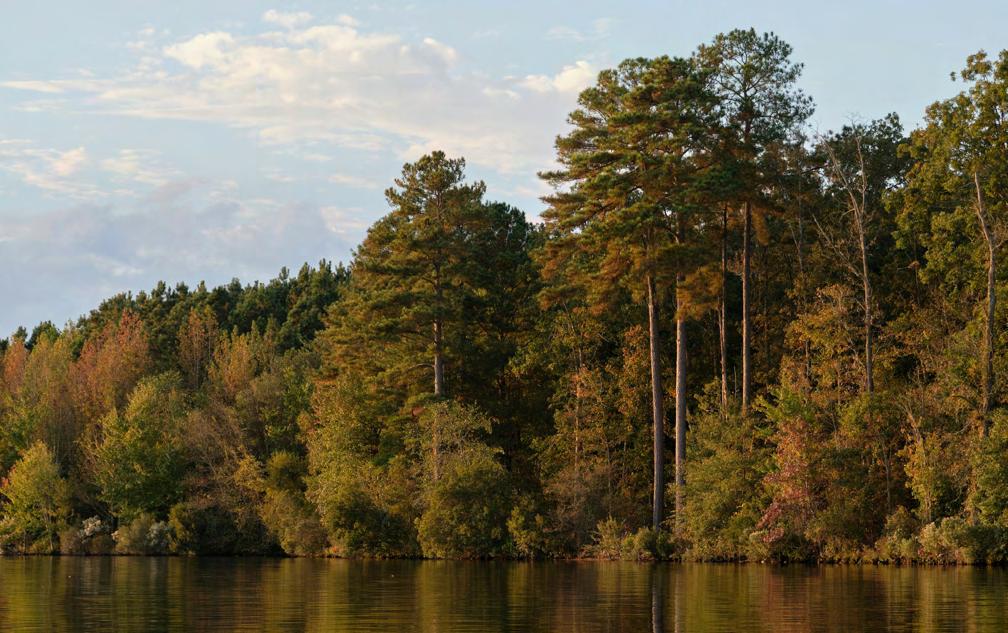
Plants & Wildlife
Durham’s natural environment is rich in biodiversity, owing to its location in the Piedmont region. Forests in the area are typically mixed hardwoods, including oak, hickory, maple, and beech. Pine forests, particularly loblolly and shortleaf pine, are also common. Understory vegetation includes dogwoods, redbuds, and a variety of shrubs like mountain laurel and holly. In more open areas, wildflowers such as black-eyed susans, coneflowers, and goldenrods flourish.
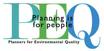
The area supports a variety of wildlife, from common mammals like white-tailed deer, raccoons, and foxes to smaller species such as squirrels and rabbits. Bird species, including hawks, owls, woodpeckers, and migratory songbirds, are abundant, especially along river corridors. Reptiles like box turtles and various snake species can be found in the forests and wetlands, while amphibians such as frogs and salamanders inhabit the many ponds, creeks, and swampy areas around Durham.
Ecological Significance
Durham’s rivers, forests, and wetlands play a critical role in supporting biodiversity and maintaining the ecological balance. Protected areas like the Eno River State Park and Duke Forest help conserve these vital ecosystems. They also offer green spaces that contribute to the resilience of the region against environmental stressors, such as urbanization and climate change. The variety of habitats supports complex food webs, where native plants provide for pollinators like bees and butterflies, and the surrounding rivers are home to freshwater mussels, fish, and other aquatic species.
Protected Natural Areas
In addition to Durham’s parks and open space areas, there are significant protected lands managed by the state and other institutions. These areas also serve as regional destinations for people seeking outdoor recreation opportunities while protecting the local sensitive flora and fauna.
• Eno River State Park: Eno River State Park is a significant natural area in Durham, offering over 4,000 acres of preserved land along the Eno River, with hiking trails, picnic areas, and opportunities to enjoy wildlife and nature close to the city.
• Duke Forest: Managed by Duke University, Duke Forest is a large research and recreational forest that covers portions of Durham, Orange, and Alamance counties. It serves as a resource for environmental research and education and offers trails for hiking and running.
• Falls Lake State Recreation Area: Just east of Durham, this state-managed area surrounds Falls Lake, a reservoir that provides drinking water to the region. It includes campgrounds, hiking and biking trails, and access to water-based recreation like boating and fishing.
Historic Context
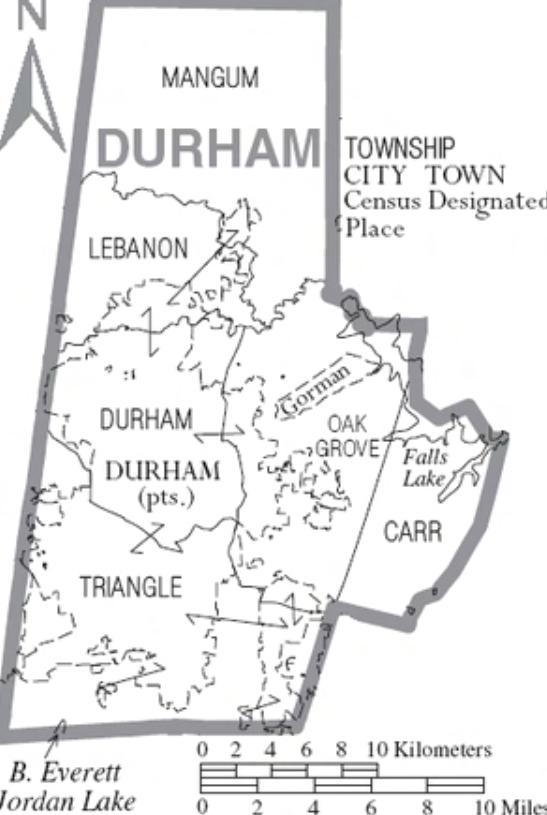
Durham County
Durham County was created in 1881 from parts of Orange County and Wake County, taking its name from its own county seat. The County was incorporated largely as a matter of convenience. Durham was experiencing exponential growth of population, commerce, and industry. This massive growth made it very clear the disadvantages of being 14 miles from the county seat in Hillsborough. In 1911, additional land was transferred into Durham County from Wake County. The first Board of Commissioners convened its inaugural meeting May 2, 1881. As it was in the 1800s, the City of Durham is still the heart of Durham County, with the City’s population being 87% of the County’s total population.
City’s Beginnings
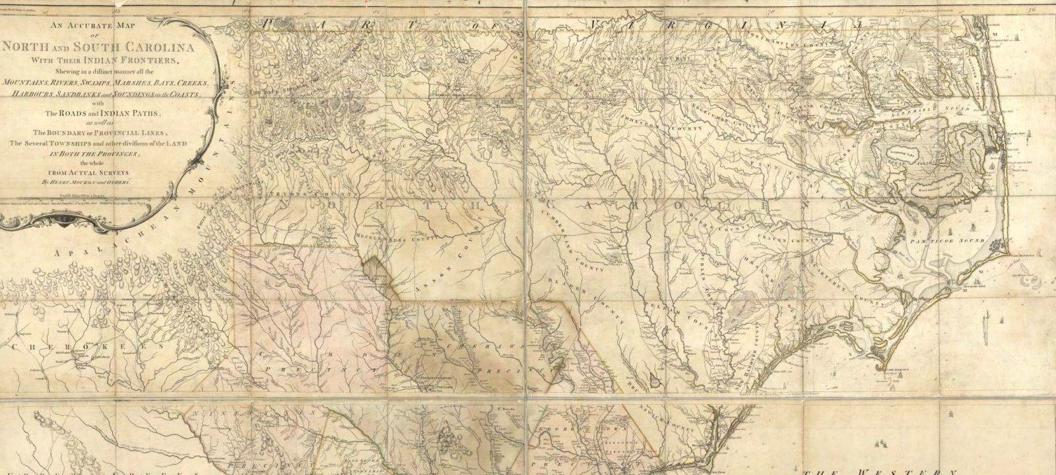
The City of Durham has a long and unique documented history dating back to the 1600s. The Eno and Occoneechi lived in the area and may have established an early settlement, Adshusheer, in the area that ultimately became Durham. The Occoneechi Path, a vital corridor for trade ran through the area and Native Americans expanded in the region off of these trade routes. In the early 1700s, land in what would become Durham was granted to George Carteret by King Charles I. Early settlers built settlements that included farms and Mills, including
West Point Mill which still stands in a Durham Park, West Point on the Eno.
Prior to the arrival of the railroad, Durham was almost entirely agricultural and existed in the easternmost part of Orange County. Large plantations existed in the area during the antebellum period, including Stagville Plantation which was one of the largest plantation holdings in the South. Durham’s location is largely due to the needs of the railroad industry, the North Carolina Railroad (NCRR) needed a stop for wood and water between Hillsborough and Raleigh and Durham was the ideal candidate. The NCRR established a depot on land donated by Dr. Bartlett S. Durham and a post office was established in the depot on April 26, 1853, and the City of Durham was born as Durham Station.
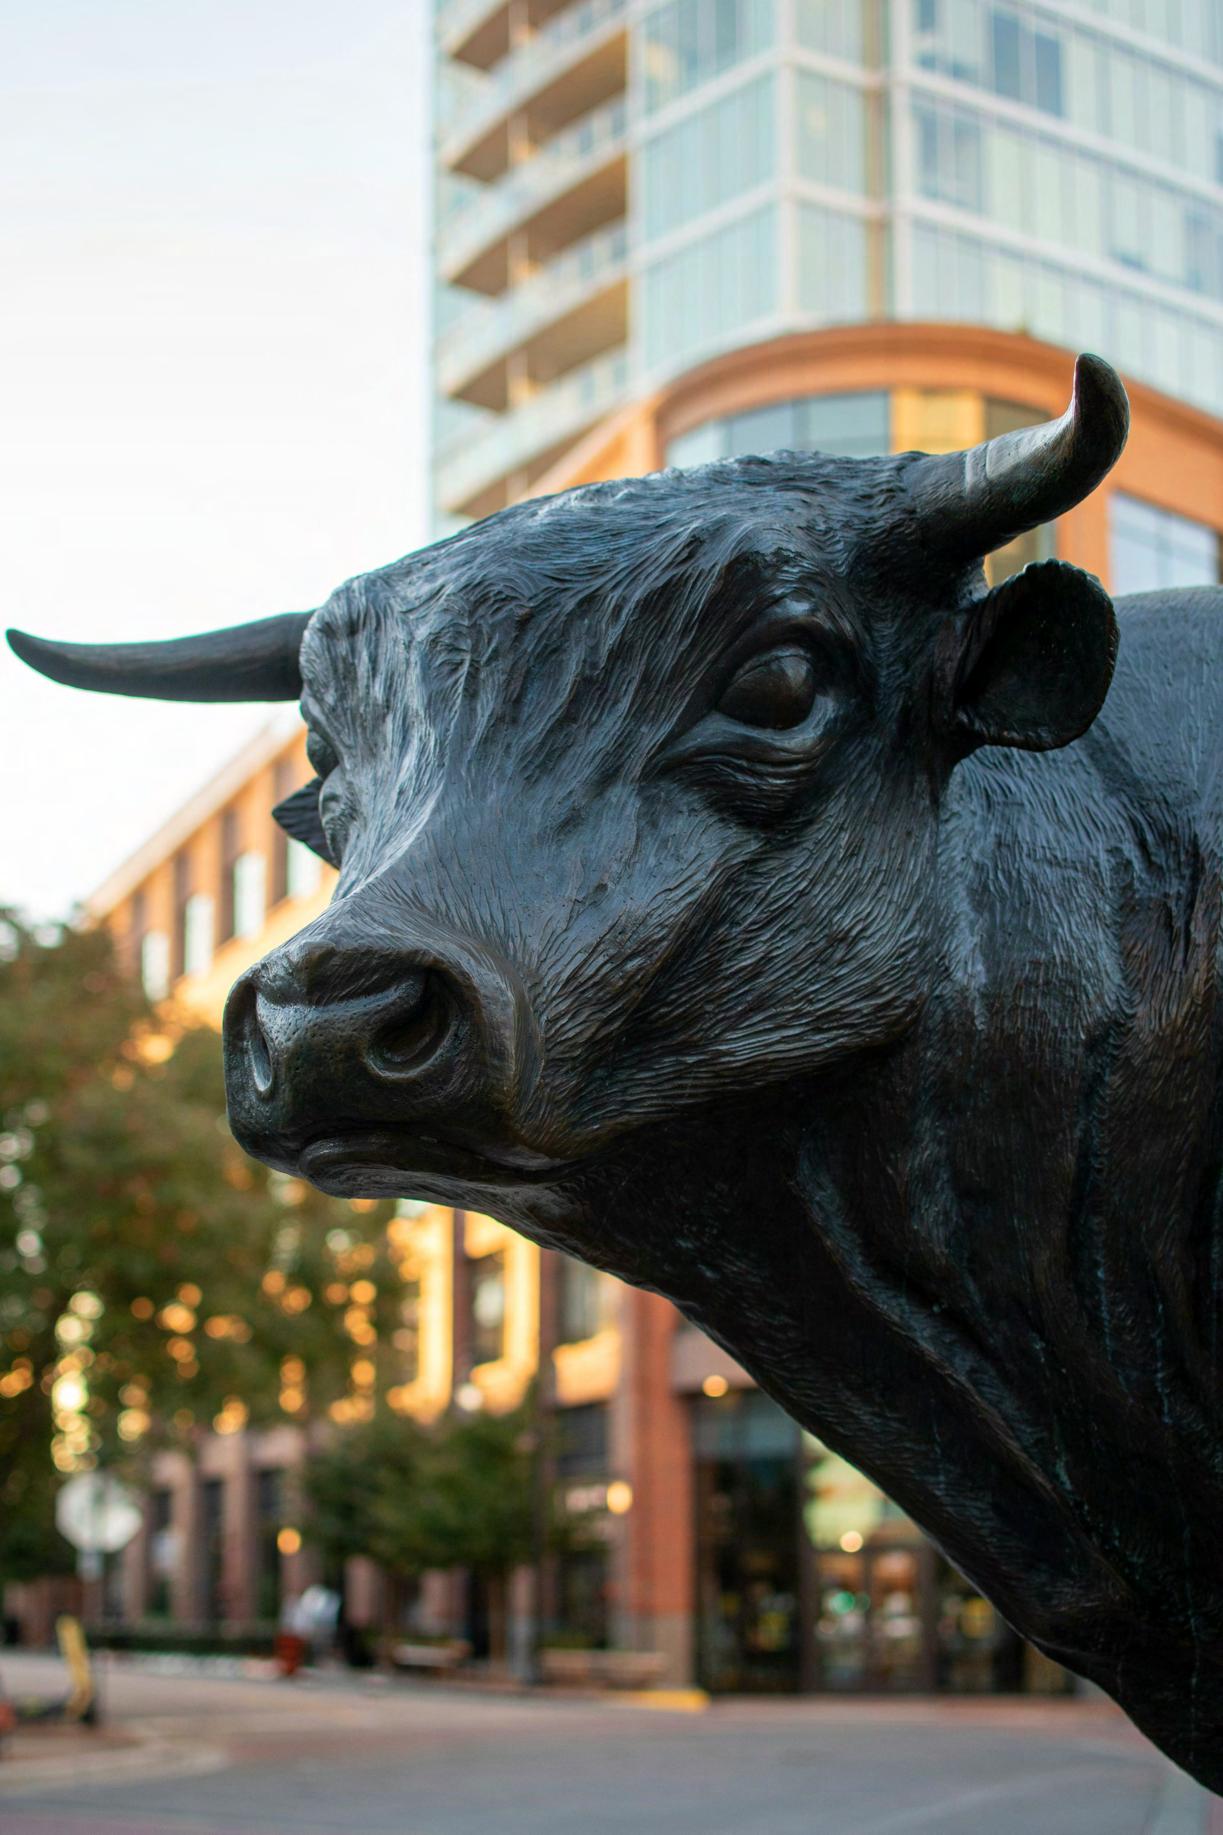
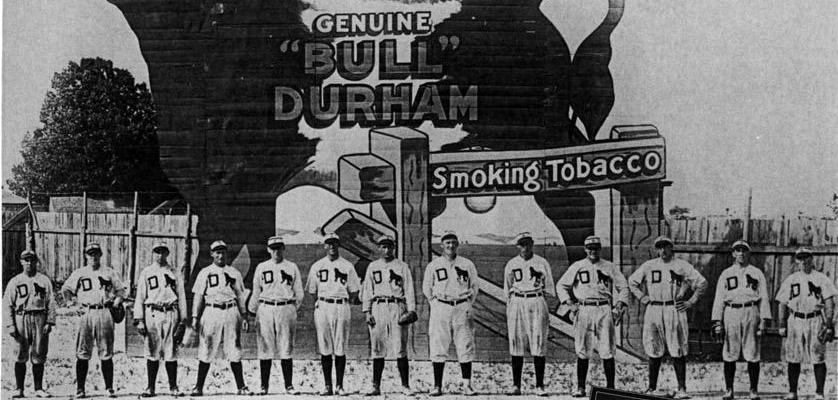
Durham Station grew relatively slowly before the Civil War but grew quickly during Reconstruction. Much of the community’s growth can be attributed to a thriving tobacco industry. W.T. Blackwell partnered with John Ruffin Green and renamed his tobacco company as the “Bull Durham Tobacco Factory”. The name “Bull Durham” was taken from the bull on the British Colman’s Mustard, which Mr. Blackwell mistakenly believed was manufactured in Durham, England.
As Durham Station’s population grew rapidly, the station became a town and was incorporated by the North Carolina General Assembly on April 10, 1869, only 16 years after the opening of the original post office. It maintained its name after Dr. Bartlett Durham. After incorporation, the increases in business activity necessitated the establishment of Durham County in 1881. It was during this period of growth and prosperity that Trinity College, now Duke University, moved from Trinity, North Carolina to Durham. The rapid growth and prosperity of the Bull Durham Tobacco Company, and Washington Duke’s W. Duke & Sons Tobacco Company, resulted in the rapid growth of the city of Durham. Washington Duke’s business had what amounted to a monopoly of the tobacco business in the United States by 1900. The Federal Government forced a breakup which led to the creation of American Tobacco which remained in Durham, the campus of American Tobacco remains a major destination in Downtown Durham today. The Dukes, forbidden from expanding their tobacco business, forayed into electric power and founded Duke Power, now Duke Energy, in the early 1910s.
Durham quickly developed a large black community, the center of which was an area called Hayti, just south of Downtown where some of the most prominent and successful black-owned businesses in the country during the early 20th century were established. These businesses, including North Carolina Mutual Life Insurance Company and Mechanics & Farmers Bank, were centered on Parrish St., which would come to be known as “Black Wall Street”.
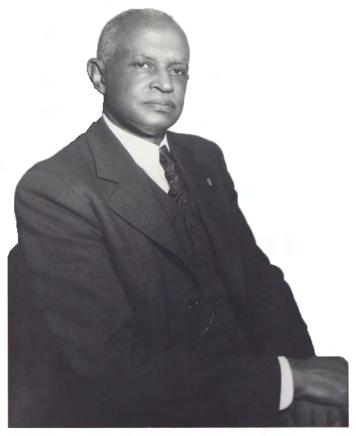
In 1910, Dr. James E. Shepard founded North Carolina Central University, the nation’s first publicly supported liberal arts college for African Americans. Durham’s African American community was unfortunately targeted through Redlining in the 1930s. Redlining is a discriminatory practice in which financial services are withheld from neighborhoods that have a significant number of racial and ethnic minorities.
In 1924, James Buchanan Duke established a philanthropic foundation in honor of his father Washington Duke to support Trinity College. The college changed its name to Duke University and built a new large campus and hospital a mile west of Trinity College (the original site of Trinity College is still part of the University’s campus just west of Downtown as the Duke East Campus).
Due to its substantial African American community, including many activists, a prominent civil rights movement developed in Durham. Multiple sit-ins were held, and Martin Luther King Jr., visited the City during the struggle for equal rights. The Durham Committee on Negro Affairs has been cited nationally for its role in fighting for black voting rights. In 1957, Douglas E. Moore, minister of Durham’s Asbury Temple Methodist Church, along with other religious and community leaders, pioneered sit-ins throughout North Carolina to protest discrimination at lunch counters that served only whites. Widely credited as the first sit-in of the civil rights movement in North Carolina, on June 23, 1957, Moore and six others assem-
OcconeechiPath
bled at the church to plan a protest. The young African Americans moved over to the Royal Ice Cream Parlor and took up whites-only booths. When they refused to move, the seven were charged with trespassing. Unlike the Greensboro Four, three years later, the Royal Seven were arrested and ultimately found guilty of trespassing.
Urban Renewal in Durham overwhelmed the African American community leading to the demolition of significant portions of the Hayti community to build the Durham Freeway. The Freeway resulted in significant losses to numerous other African-American neighborhoods, including Morehead Hill, West End, and West Durham. This large-scale demolition not only fractured the social fabric of these neighborhoods but also caused significant losses to Durham’s historic architectural bases.
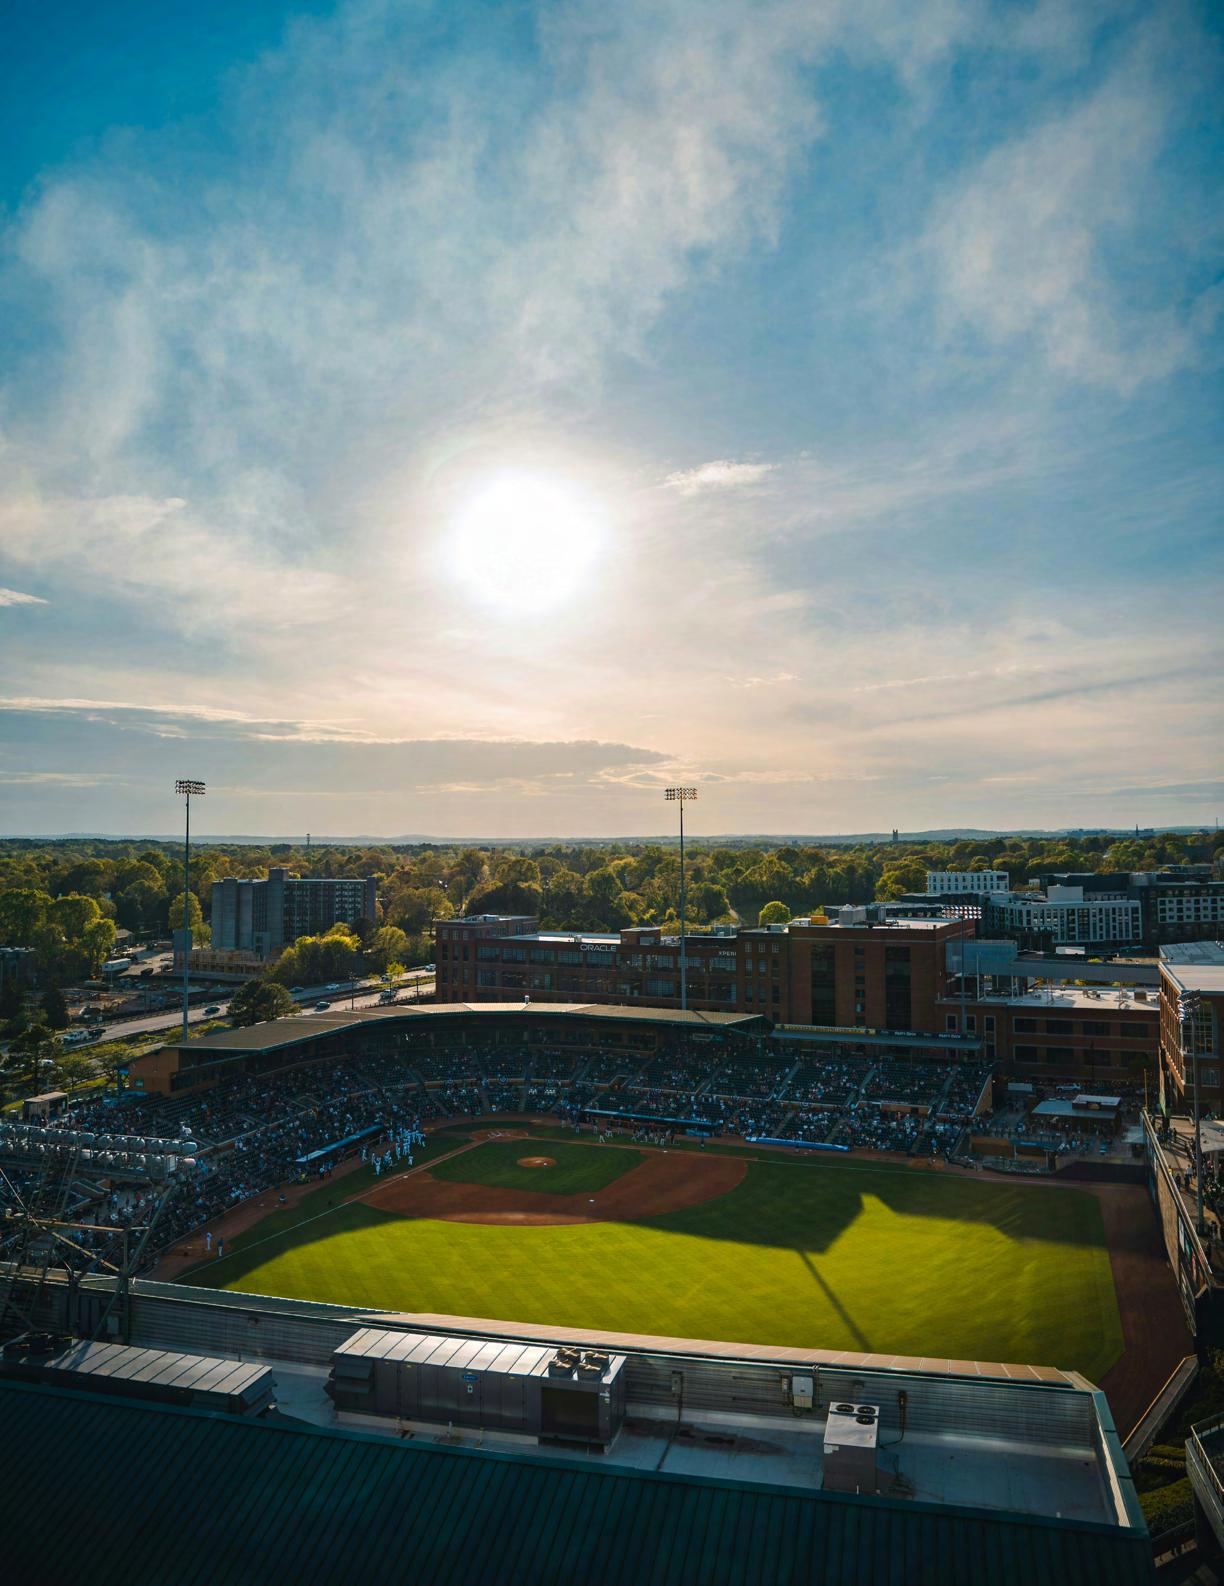
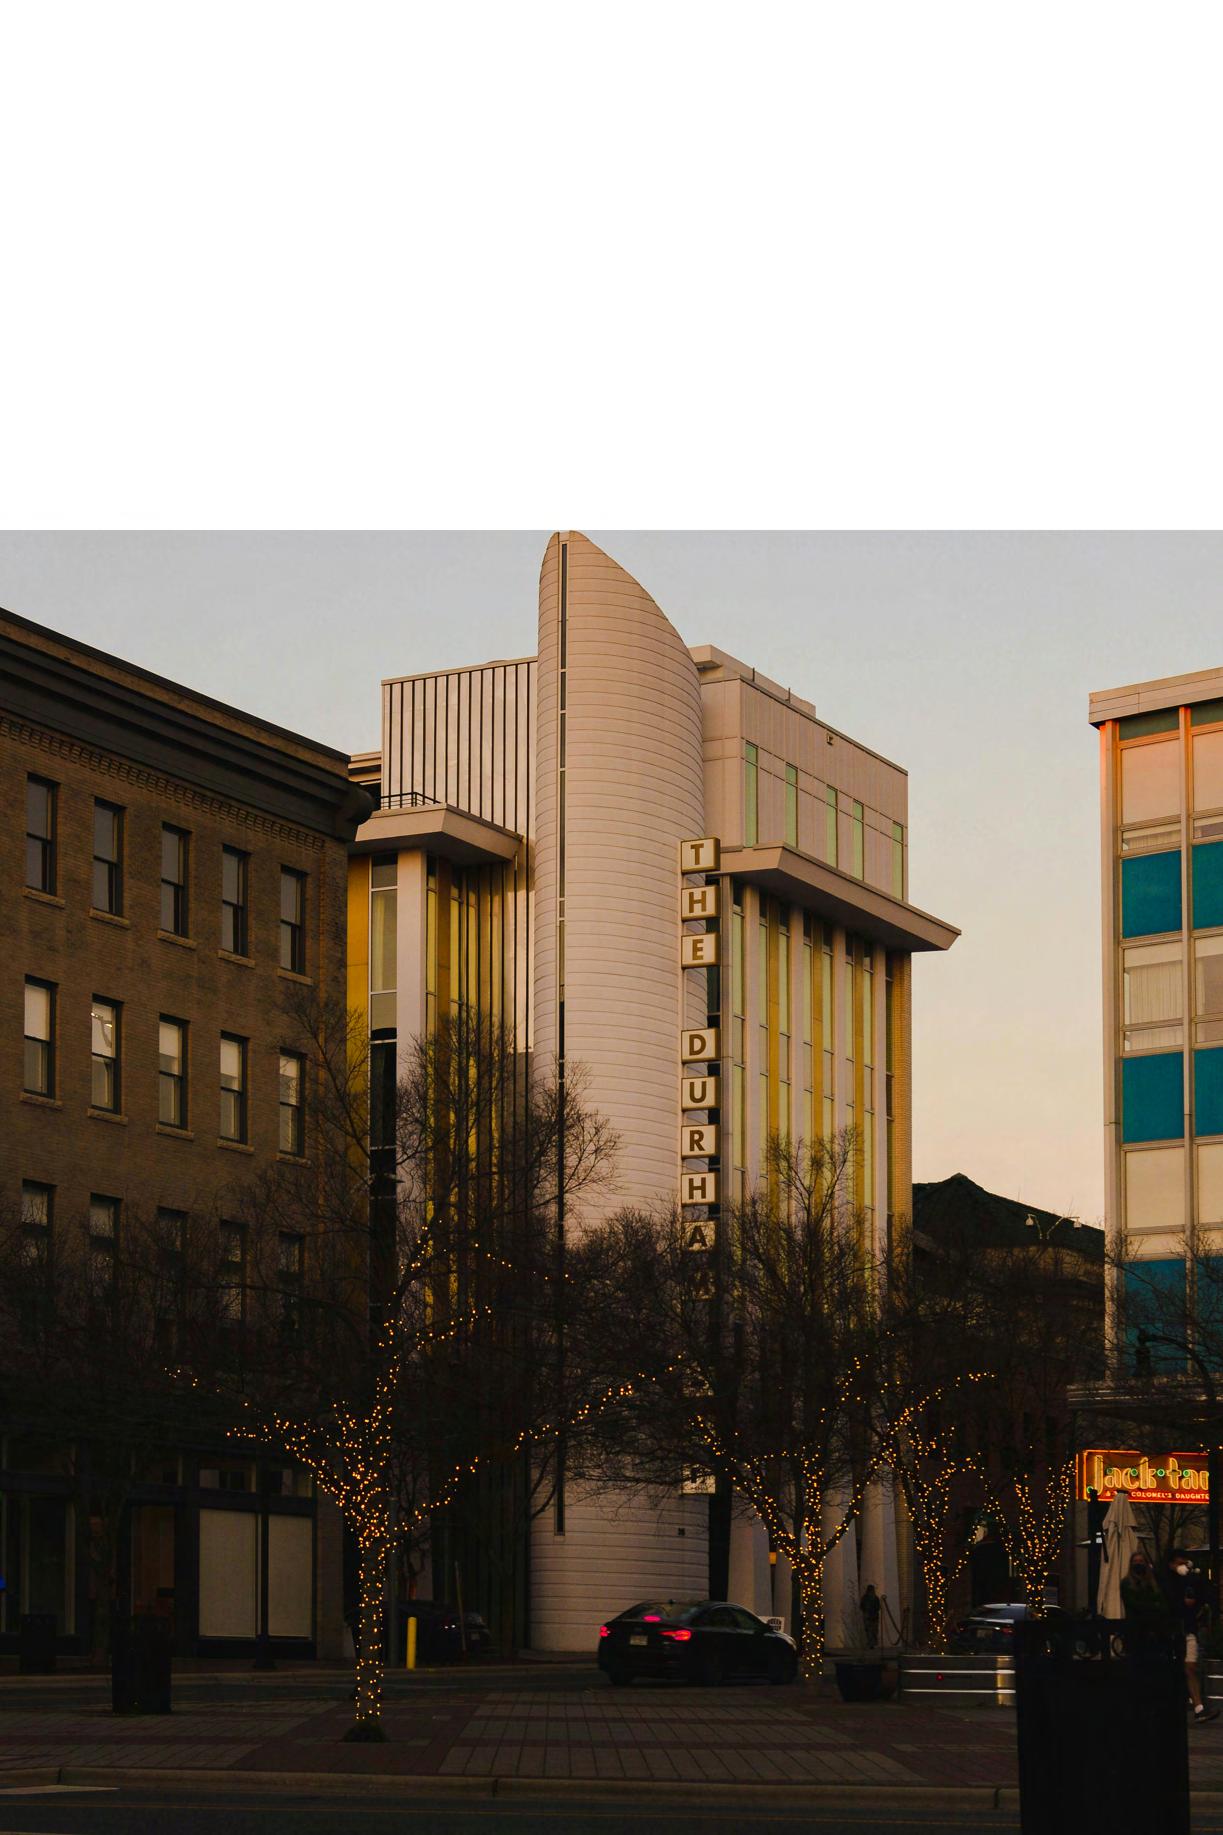
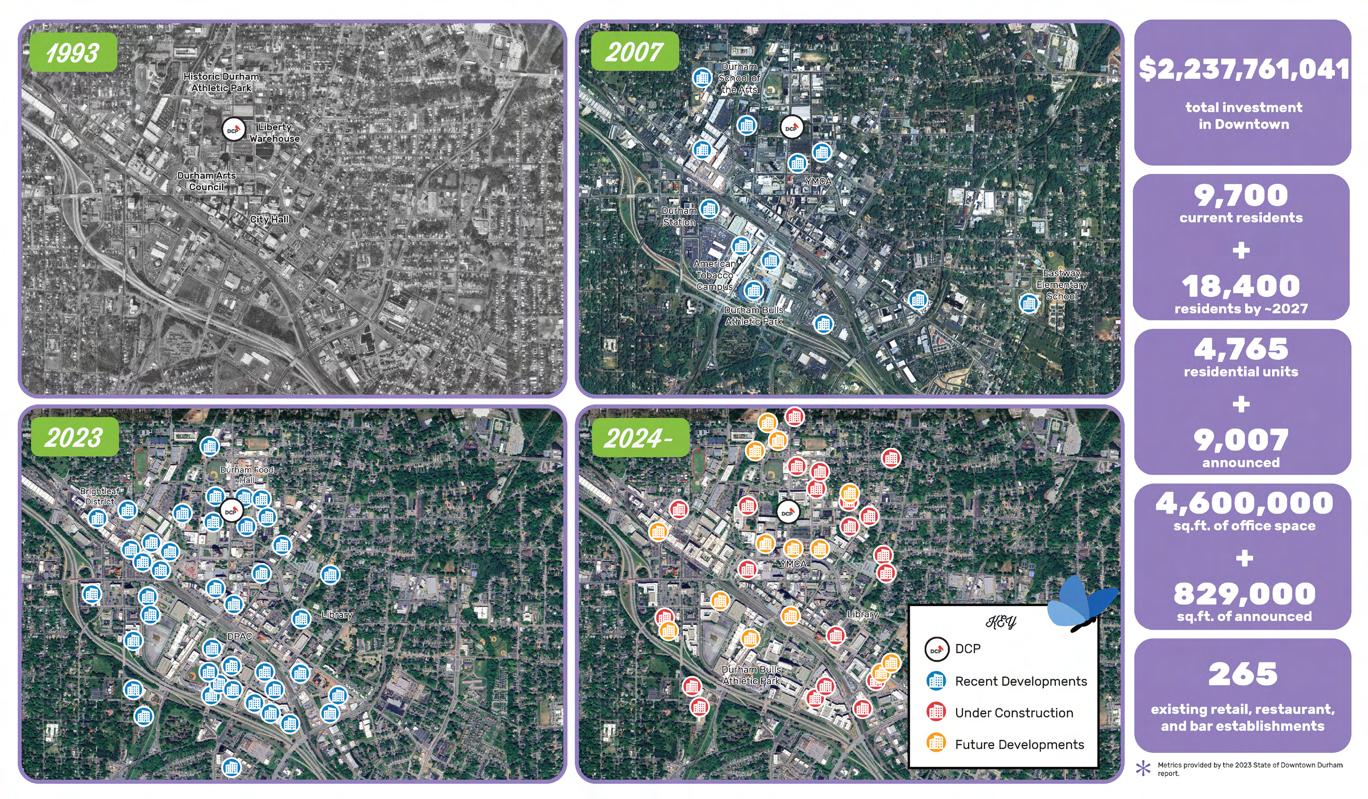
Durham faced an economic downturn in the later 1980s with the closure of the American Tobacco Factory. In an effort to revitalize Downtown, the Durham Bulls Stadium was constructed in 1994. Since the early 2000s, many of the historic factories in Downtown have been converted into offices, condominiums, apartments, and restaurants. The Durham Performing Arts Center in Downtown was built and now ranks in the top ten in theater ticket sales in the US. While development in Downtown continues to be strong, the vast majority of Durham’s growth has been concentrated along the I-40 corridor in South Durham. Major employers in Durham are Duke University and Duke Medical Center (39,000 employees, 14,000 students) and companies in the Research Triangle Park (49,000 employees).
History of Durham Parks & Recreation
DPR’s long history begins in 1924 with the installation of the first publicly funded playgrounds in Durham. At the time, community leaders lobbied the City Council for the development of parks to serve as an antidote to the negative effects of urbanization. The Parks and Recreation Department was inaugurated in 1925 with its first director C.R. Wood, who held the position until 1960. There were ten staff members, other than the Director, in the first year of the Recreation Department. Attendance in the first year of operation at summer playgrounds and the pool was recorded as 99,845. In 1927, the Herbert S. Swan City Plan published many locations across the City for future park sites. The first City of Durham playground was opened in the Lakewood neighborhood in 1929.
In the late 1930s, due to the expansion of the parks system, the first full-time maintenance foreman for parks was hired. One year later a State Supreme Court decision said that playgrounds and parks were a necessary municipal expense. As a result, Durham passed a $60,000 parks bond issue and secured $109,195 to develop Long Meadow Park and Hillside Park and add pools to them.
In the 1940s, the system continued to expand and make itself a core community service, despite World War II. An annual report from 1942 stated “It is noteworthy that after losing 80% of the trained workers of the Department to the armed services and to defense work, younger and newly trained leaders directed the twenty-two parks and playground areas including four swimming pools, without an accident of any consequence. Total attendance at all areas for the quarter was 523,216, an increase of 17,107 over last year’s 506,109.” Two years later in 1944, the City Council abolished the Recreation Commission and created the Department of Public Recreation, the first DPR. In 1947, DPR opened its first African American recreation center, W.D. Hill.
The 1950s saw further investment in Parks and Recreation. In 1954, a successful bond issue made it possible to build East Durham, West Durham, E.D. Mickle, T.A. Grady, and
Walltown Recreation Centers. Erwin Field, Lyon Park, and Lakewood Park were also developed. Simultaneously, Director C.R. Wood stated, “The Recreation Department’s activities now cover all sexes, races, and ages.”
DPR entered the 1960s by bidding farewell to C.R. Wood, the first and only director of DPR at the time. Harold Moss became the new director. Wood oversaw an expansion of reach into the community, the Department’s first day camp for youth with intellectual disabilities was held at Forest Hills. This decade also saw tremendous growth including the purchase of land at Lake Michie that included Spruce Pine Lodge. With the addition of this land, the Department’s total park acreage reached 1,200 acres. Durham was one of the first cities in the state to receive federal money for the purchase of land for municipal recreation. New Director, Roger Brown, oversaw the integration of all pools in DPR. Wood resigned after 4 years, leaving the department with 3 directors over the span of a decade. The Department also established a summer day camp for youth with intellectual disabilities.
In the 1970s, the number of Durham parks continued to grow. In addition to West Point on the Eno, 20 other parks were developed. Athletic programming for women, recreation programming at Public Housing sites, and the initiation of a mobile recreation concept which took activities to low-income neighborhoods was also established in this era. By the end of the 1980s, there were more than 60 parks in the City, rivaling any park system in the state for comprehensive coverage of municipality.
The 1990s brought with it a new programming focus: troubled teens. Recreation programming emphasized efforts to deal with the core social problems of teens: lack of self-esteem, lack of decision-making skills, and lack of positive alternatives during leisure time. 1993 saw the closure of Durham Athletic Park to professional baseball, as the new Tobacco Road ball park was anticipated to open. DPR embraced the new age of the internet with the creation of its first web page for the 1997 Bimbe Festival. In 1998 the Department developed a plan to expand the City’s Greenways and Trails System. More than 20 miles of greenways and trails will be developed in the City during the next six years.
Since the 2000s, the Department has sought to expand its offerings for all residents. The introduction of a sliding fee scale removed barriers for families experiencing economic hardship. The Department also expanded into offering dog parks, all-abilities playgrounds, and community gardens. In 2008, DPR became Nationally Accredited by the Commission for Accreditation of Park and Recreation Agencies (CAPRA).
DPR enters its tenth decade of operation focused in some ways on the same thing it has always been focused on – providing connection to nature, play, and community for the residents of Durham. This plan hopes to help DPR usher in this next decade by taking that focus and sharpening it with fairness and resilience in mind.
Durham Parks and Recreation Centennial Celebration Photo Gallery
DURHAM TIMELINE
1900-2019
1910
N.C. Central, the first publicly funded liberal arts college for African Americans is founded in Durham.
1949
The Ebony magazine article which inspired the term, “Black Wall Street” to describe the African American financial and business district on Parrish Street is published.
1912
The Durham Bulls were created alongside the NC State League.
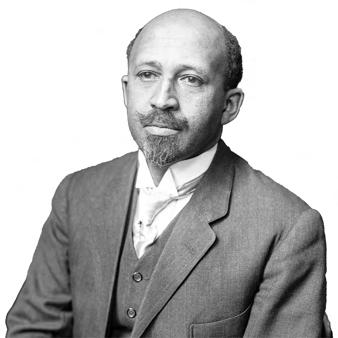
In 1912, W.E.B. Dubois visited Durham and published an article titled “The Upbuilding of Black Durham” praising the black community and its leaders in Durham.
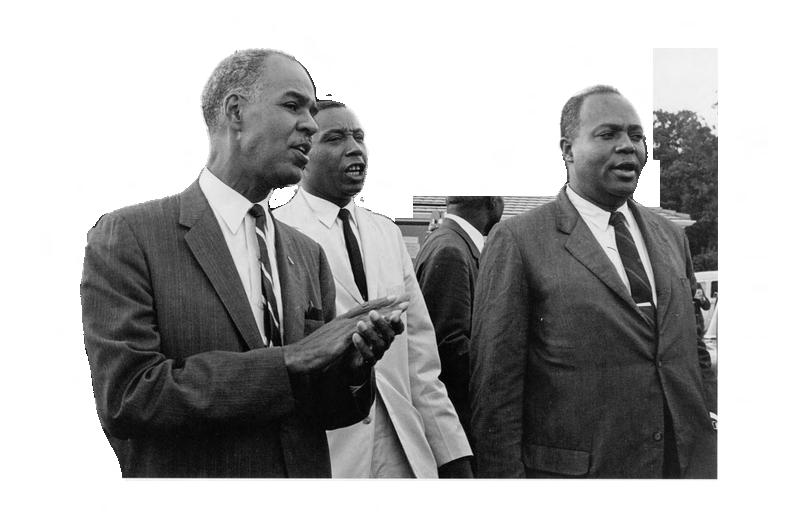
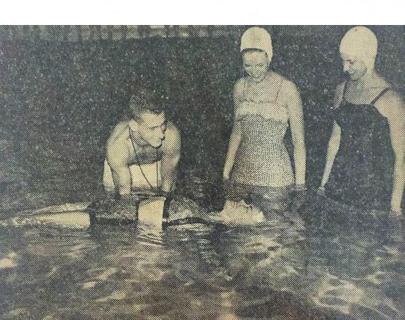
After a year of demonstrations, segregation ended at most of Durham’s restaurants, hotels, and movie theaters. The men pictured are Roy Wilkins (left), Durham Attorney Floyd McKissick, and James
2000
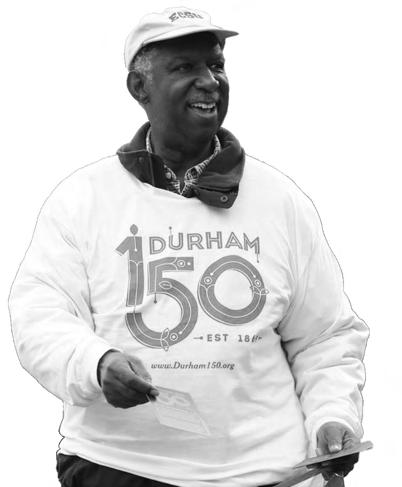
is former City Council Member,
helping to celebrate Durham’s anniversary. The festivities featured a year of community organized events.
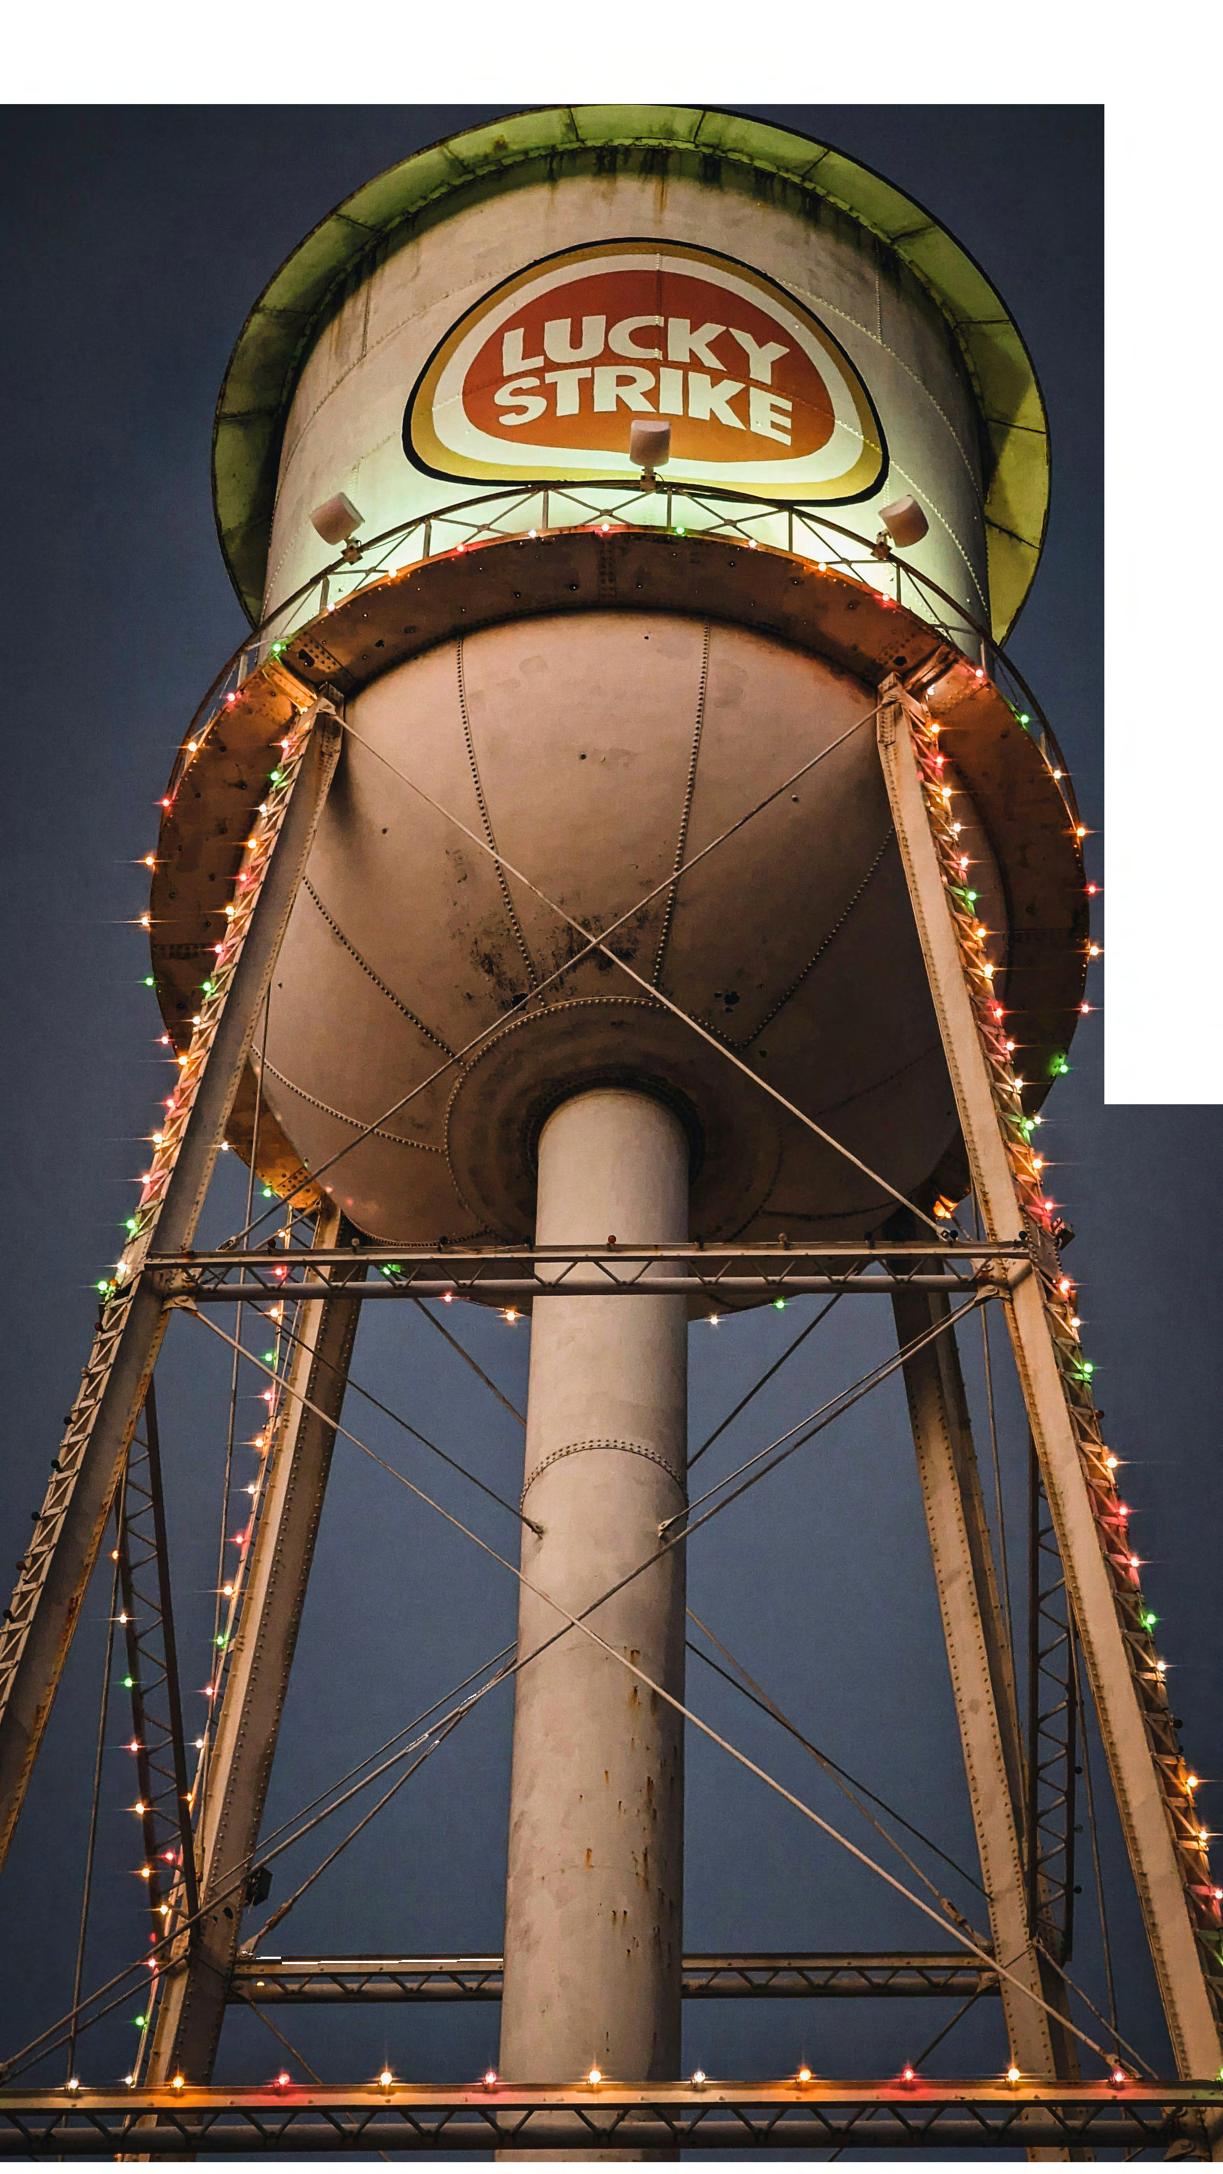
The Last cigarette was produced in Durham.
1962
The Howard Johnson’s restaurant on Chapel Hill Blvd. was Durham’s site for multiple protests associated with the Freedom Highways movement.
2019
Durham celebrates its 150th anniversary of being incorporated.
A photo of James E. Shepard, the founder of N.C. Central University.
Photo Courtesy of the Durham
Photo Courtesy of The Atlantic.
An old lighter and box of cigarettes from Liggett & Meyers. The final Tobacco Company to close its factory in Durham.
Pictured
Eddie Davis
Photo Courtesy of Durham 150 Facebook Page.
DPR TIMELINE
1912-2024
In
first
1912
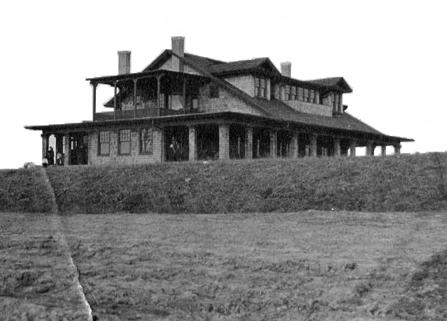
The Durham Country Club opens to the public, making it the first public recreation facility in Durham.
The
A
1924
The Parks and Recreation department was founded.
1965
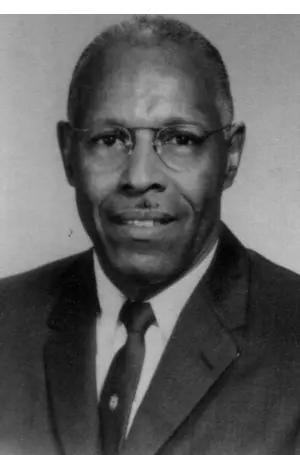
Irwin Holmes Sr. was DPR’s first Black employee.
1969
Holmes is also known for helping to integrate ACC sports, acting as the co-captain of NC State’s Tennis Team. He later went to work with IBM for 20 years helping create technology that would send a man to space and also lay the groundwork for the Intenet.
2007
Rhonda B. Parker was named the first female Durham Parks and Recreation Director.
2024
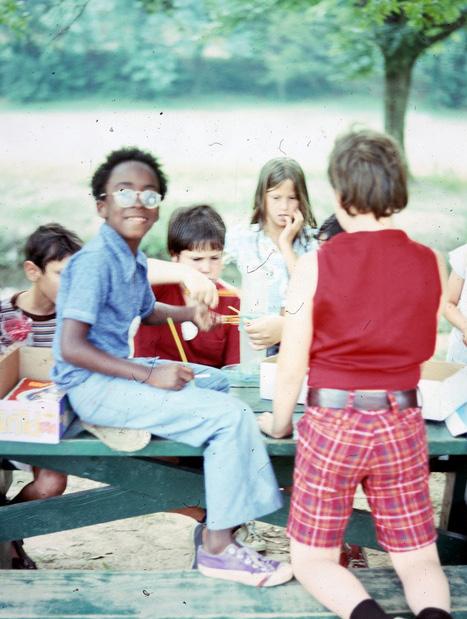
The first Bimbé Cultural Arts Festival is held.
After years of serving the
Durham Parks and Recreation celebrates its 100th anniversary.
photo of the Hillendale Country Club.
Photo Courtesy of NCCU Athletics.
Bimbe Cultural Arts Festival is a celebration of a
Pictured is Durham’s Mayor Leonardo Williams reading DPR’s Centennial Proclamation
Photo Courtesy of Durham Parks and Recreation.
Durham community, Parker retired in 2020.
Photo courtesy of WUNC.
the
year of DPR’s career, summer playgrounds and the
Photo Courtesy of Durham Parks
DURHAM TIMELINE
1900-2019
1910
N.C. Central, the first publicly funded liberal arts college for African Americans is founded in Durham.
1949
The Ebony magazine article which inspired the term, “Black Wall Street” to describe the African American financial and business district on Parrish Street is published.
1912
The Durham Bulls were created alongside the NC State League.
In 1912, W.E.B. Dubois visited Durham and published an article titled “The Upbuilding of Black Durham” praising the black community and its leaders in Durham.
After a year of demonstrations, segregation ended at most of Durham’s restaurants, hotels, and movie theaters. The men pictured are Roy Wilkins (left), Durham Attorney Floyd McKissick, and James
is former City Council Member, Eddie
helping to celebrate Durham’s anniversary. The festivities featured a year of community organized events.
2000
The Last cigarette was produced in Durham.
1962
The Howard Johnson’s restaurant on Chapel Hill Blvd. was Durham’s site for multiple protests associated with the Freedom Highways movement.
2019
Durham celebrates its 150th anniversary of being incorporated.
A photo of James E. Shepard, the founder of N.C. Central University.
Photo Courtesy of the Durham
Photo Courtesy of The Atlantic.
An old lighter and box of cigarettes from Liggett & Meyers. The final Tobacco Company to close its factory in Durham.
Pictured
Davis
Photo Courtesy of Durham 150 Facebook Page.
2 CHAPTER
THE CITY
Planning Context
Over the past ten years, DPR and the City at large have completed a multitude of planning studies ranging from site specific park master plans to citywide comprehensive plans. These plans all have recommendations and action items that serve to guide the Department as it considers priorities and investments. It is important to understand as part of the Parks and Recreation Comprehensive Plan process, themes and critical items that have emerged through previous planning efforts. This analysis allows for greater understanding of existing priorities and how those work with new priorities identified in this Comprehensive Plan.
The planning team, in conjunction with staff, identified key plans completed previously including plans completed by DPR and plans completed by other departments that were inclusive of DPR input. These plans were analyzed for key themes that are relevant to the DPR mission, additionally key takeaways and recommendations were pulled from the previous master plan and served as guidance for making new recommendations in this Comprehensive Plan. The identified plans, along with summaries of themes and takeaways are found on the following pages.
Durham Parks and Recreation Centennial Celebration Photo Gallery
Durham Parks & Recreation Master Plan
Focus Areas:
Completed: 2013
Related Plans: City’s 2005 Comprehensive Plan and Strategic Plan, 2011 Trails & Greenways Master Plan, Various City-County Open Space Plans & DPR Operational Plans
The City’s previous parks and recreation master plan was created to guide the Durham Parks and Recreation Department’s decision-making regarding parks, recreational amenity, and facility development for the next 10 years – and recreation programming for the next 5 years. The plan’s steering identified three key concepts that serve as the basis of recommendations for future actions.: Making Connections; Improving Sustainability; and Optimizing Current Facilities & Programs.
Key Takeaways
• Essential DPR priorities included: 1) Provide green and natural spaces within the community with park lands and open spaces, (2) Protect the natural environment and promote environmental sustainability, (3) Provide opportunities for residents to maintain and improve their physical health, (4) Provide positive activities for children and teens, and (5) Provide mobility, with trails and paths for residents to use to exercise and non-motorized transportation.
• The top two “most important” DPR recreation programs included (1) fitness or health and wellness classes, (2) children and teen summer camp.
• The top two “most important” facilities provided by DPR included (1) trails and greenways, (2) recreation centers.
Recommendations
• Continue to upgrade and renovate existing parks.
• Diversify amenities and usage of existing parks.
• Continue to make trails and greenway projects a high priority.
• Acquire land and build new parks in underserved areas.
• Prioritize maintaining recreation and park assets.
• Enhance revenue generation.
• Monitor recreation program growth and customer feedback.
• Prioritize continuing education and training for staff.
• Establish a parks foundation to advocate and fundraise for DPR.
Durham Parks & Recreation Historic Resources Management Plan
Focus Areas:
Completed: 2015
Related Plans: 2012 Historic Resources Plan
This plan recognizes the essential role access to parks and recreational amenities has played throughout the City’s development. Many historical parks and recreational facilities remain intact and are still accessible to the public. To that end, the plan acknowledges parks and recreation’s contribution to Durham’s historical legacy and creates a framework for Durham Parks and Recreation to preserve, maintain, and interpret those elements for the public good.
Key Takeaways
• As is common, most of Durham’s parks do not accurately reflect the details of their original landscape design. However, the parks’ location within the system and the history of its evolution may retain substantial historic value to warrant special treatment even as individual resources within a site change.
• The City’s parks are more than a collection of unrelated spaces; each park in the system contributes to the City’s fabric and the relationship between parks and between parks and the areas surrounding them can be as meaningful as the sites themselves. Growth of the park system and its reflection of the City’s image of itself can be seen as one measure of its historic significance.
• According to this plan, the sites themselves, or culturally significant elements within nearly half (32) of Durham’s 66 parks are “sites of historic interest” managed by DPR.
Recommendations
• Ensure culturally and historically significant buildings, structures, objects, and landscapes under the management of DPR are identified, described, and mapped in GIS.
• Survey residents about potentially culturally and historically significant buildings, structures, objects, and landscapes managed by DPR - and collect anecdotal data (oral history accounts documenting traditional cultural practices and usage of parks).
• Provide training for DPR staff regarding the treatment and maintenance of historic buildings, structures, objects, and landscapes.
• Elevate the public’s awareness of historic resources through the interpretation of buildings, structures, objects, and landscapes in both staffed and unstaffed facilities.
West Point on the Eno Park Improvements & ADA Accessibility Improvement Plan
Focus Areas:
Completed: 2017
Related Plans: 2013 Parks & Recreation Master Plan, City’s UDO
Durham
City-County Urban Open Space Plan
Focus Areas:
Completed: 2017
Related Plans: 2014 Downtown Open Space Plan, Durham Comprehensive Plan, City’s and County’s Strategic Plan, 2013 P+R Master Plan, 2012 Trails & Greenways Plan, Watershed Management Plans, City’s UDO
The purpose of this plan is to create a checklist of items improving accessibility and inclusivity – so that DPR can mitigate outstanding accessibility concerns brought to light as a result of the 2005 settlement outlining ADA non-compliance – and thereby provide a park experience that is open and accessible to people of all mobility levels.
Key Takeaways
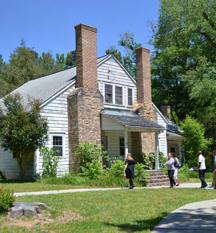
• The plan identified ADA non-compliance including (1) the absence of accessible parking, (2) McCown-Mangum House restrooms and entrance specifications, (3) inaccessible routes from parking lot to the McCown-Mangum House and to the Mangum Museum, and (4) West Point Mill entrance and ramp.
• After presenting the citations determined by the U.S. DOJ, the plan presents a series of mitigation recommendations followed by an opinion of probable costs totaling over $2.6 million.
• The plan’s recommendations are varied and specific. Changes and/or construction activities proposed ranged from major efforts such as a complete re-build of the McCown-Mangum House deck structure, and complete renovation of restroom facilities – to efforts of lighter heft such as installing accessible parking.
• The plan provides schematic design for accessible walking loops, re-oriented interior pathways and focus area upgrades intended to elevate all park visitors’ experience.
Recommendations
• Pave the entire loop road with asphalt.
• Construct a new restroom facility and entry plaza at the main parking areas.
• Deliberately incorporate existing West Point Mill artifacts into the user experience by creating exhibits with signage.
• Relocate existing beehives next to the garden that may be expanded into a prairie.
• Categorize improvements into three phases to be implemented over the next 10 years, to include mitigating all DOJ citations.
This plan points to the need to recognize growth in Durham’s urban downtown core and to understand the implications associated with growth regarding preserving existing – and creating new open green spaces. The Downtown Open Space Plans were requested by Durham Open Space and Trails (DOST) and developed by Durham City County Planning staff. This plan outlines a process for identifying significant open space properties within urban areas - specifically focusing on the Urban Tier, which comprises core neighborhoods developed before the 1960s, characterized by small lots, traditional street layouts, and mixed land uses in proximity.
Key Takeaways
• The plan included a proximity analysis to understand which parts of the community are wellserved or underserved by the current park and trail system. The analysis showed that residents in approximately 38 percent of the Urban Tier are not within a half-mile distance of a public park or trail access.
• In order to better analyze the Urban Tier, the plan divided the Urban Tier into five districts that have several distinct neighborhoods and identities.
Recommendations
• Prioritize updating highly-utilized open spaces and recreational facilities in communities of concern.
• Maintain and repair recreational facilities to modern maintenance standards.
• Prioritize, fund and construct urban trails recommended in the Durham Trails and Greenways plan that improve access to parks and open spaces in underserved areas.
Durham Beltline Master Plan
Focus Areas:
Completed: 2018
Related Plans: 2011 Trails & Greenways Master Plan, 2014 Downtown Open Space Plan, 2017 City-County Urban Open Space Plan
Focus Areas:
Completed: 2018
Related Plans: 2011 Trails & Greenways Master Plan, 2018 Comprehensive Park & Trail Maintenance Plan
This plan addresses the next phases of the Durham Beltline Trail, a rail trail and linear park in Durham’s downtown. Recommendations of the plan address trail design, feasibility, implementation and construction. It also includes policy recommendations to ensure the project’s implementation related to the overall vision and ensure that the project benefits all of Durham. The proposed trail design included in the plan is meant to elevate social, cultural, economic and health benefits of trail users, neighbors, communities and investors. Objectives included determining the trail cross-section, access points, opportunities for historic preservation, placemaking, and development along the trail.
Key Takeaways
• Trail safety was the primary concern of those participating in the engagement process.
• Equity was also a concern, as stakeholders expressed concern over the potential for increased property values as a result of the trail, and subsequent reduction of affordable housing in nearby neighborhoods.
• The plan’s 5 guiding principles include Safety and Connectivity, Engaging Public Space, Recreation and Ecological Enhancement, Quality Redevelopment and Neighborhood Preservation.
• The trail will support redevelopment of significant tracts of underutilized and abandoned industrial properties.
Recommendations
• Design the trail to accommodate a variety of users and high levels of traffic., while simultaneously improving connections to neighborhoods, transit, jobs, regional trails, and key destinations.
• Ensure that the development of green spaces and the Belt Line trail does not lead to the displacement of residents of color by implementing policies and programs that prioritize affordable housing in nearby neighborhoods and preserve existing communities.
• Create public spaces along the trail that are activated and utilized by all ages. Incorporate seating areas, drinking water stations, restrooms, play areas, community gardens, and public art to enhance the trail experience.
• Pay tribute to the history of the Warehouse District and surrounding neighborhoods.
• Improve access to the trail by enhancing connections to neighborhoods, transit options, jobs, and other trails including the existing Ellerbee Creek Trail, the American Tobacco Trail, and the planned Goose Creek Trail.
Lyon Park was constructed in 1964, a time during which cities across the country were establishing parks and recreation systems. During this time, parks were created and programmed primarily to support sports and athletic facilities. As was the case with the City of Durham’s Lyon Park. As demand for recreational amenities and leisure services expanded, local parks departments responded by adding amenities across park systems, often haphazardly, and absent of an overall vision and program for each park. The Lyon Park Master Plan came in response to like conditions as a way of addressing the park’s inconsistent design and layout to establish pathway toward establishing Lyon Park’s sense of place and identity. The plan seeks to accomplish this goal using a placemaking approach and CPTED standards.
Key Takeaways
• At the time of the plan’s creation Lyon Park was experiencing very little usage and was considered a “placeless park.”
• The plan considers the area of ¼ mile radius around Lyon Park as the “study area” reflective of the characteristics of surrounding neighborhoods –and stresses the importance of understanding the recreational needs of this population to mitigate disconnect between them and the park’s identity.
• The study area is reflective of higher rates of robbery, aggravated assault, and burglary compared to the City of Durham as a whole.
• Recommendations are tied to the goals of establishing the park’s identity, increasing usage, and decreasing the potential for crime and isolation.
Recommendations
• The plan identifies four underused areas as potential spaces for positive activity generation. Within these spaces, the plan proposes a variety of amenities to increase park usage and provide a broader range of activities, so the park is visited by a variety of user groups. Recommendations include:
» Creating connections between the four areas, and to existing amenities such as the Teen Center;
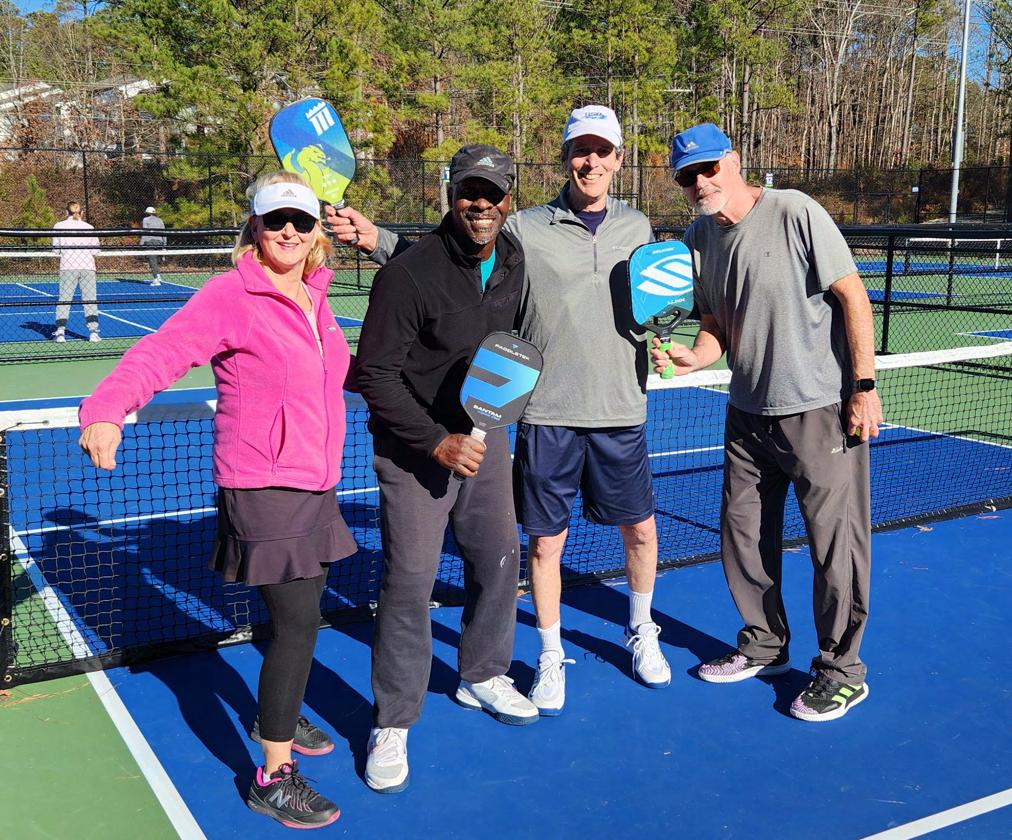
» Inserting recreational amenities on trend (pickleball, futsal, sand and water play, canopy walk, fitness equipment, etc.) and in line with local desires;
» Establishing a celebrated entranceway; and
» Constructing the Lyon Park-Forest Hills connector trail.
Snow Hill Road Park Master Plan
Focus Areas:
Completed: 2018
Related Plans: 2013 Parks & Recreation Master Plan
The master plan for Snow Hill Road Park presents a vision to maximize the park’s remaining acreage to speak to the need for accommodating the City’s growth and addressing the shortage of parkland in northern Durham. The plan takes a unique approach grounded in a comprehensive understanding of the site’s unique history as part of one of the largest plantations in North Carolina, and much later, as supporting Durham’s first watershed protection initiative. To that end, the plan and its recommendations for new and enhanced recreational amenities and facilities are framed around the conceptual theme of “convergence” – a recognition of the park’s juxtaposing narratives as a place that supported an antebellum south, a place preserving natural environments, and a place where urban sprawl coalesces with woodland scenery.
Key Takeaways
• The needs assessment and community engagement process helped shape the park’s expansion program, with a focus on amenities such as walking trails, playgrounds, picnic shelters, aquatic facilities, rock climbing, and mountain biking.
• Utilities needed for park development, including water, sanitary sewer, and electricity, present challenges due to existing infrastructure limitations and the for extension.
• The proximity of existing parks to Snow Hill Road Park reveals the lack of park offerings in northern Durham and presents opportunity to minimizing redundancies among existing facilities and promotes unique experience.
• Walking trails, playgrounds & outdoor fitness, and
pavilions were the most desired recreational amenities among survey takers. Open house attendees demonstrated a desire for unique amenities like futsal courts and drone flying area, as well as more consistent access to the restrooms and for the City to address crime at Snow Hill Park with CPTED.
Recommendations
• Create a premier destination park that provides diverse recreational amenities, celebrates the natural environment, and provides spaces for community connection and engagement.
• Develop an aquatics center with a pool, splash pad, and recreation center to provide water-based recreation in this area of the City.
• Incorporate an outdoor classroom, council circle, and labyrinth to support environmental education and provide spaces for learning, reflection, and community engagement.
• Integrate Outdoor Fitness facilities to promote health and wellness, providing opportunities for exercise and outdoor workouts.
• Design hiking and biking trails, including natural and paved surfaces, as well as mountain biking trails, to cater to different user preferences and ability levels.
Twin Lakes Feasibility Study Report
Focus Areas:
Completed: 2018
Related Plans: 2013 Parks & Recreation Master Plan, Durham Zoning Atlas Map
The Twin Lakes Feasibility Study assessed various possibilities for the a 23-acre expansion of Twin Lakes Park, an approximately 50-acre park in northeast Durham featuring a championship-sized turf soccer field. The feasibility study is a response to the community and local leaders recognizing the need for redevelopment of the park, specifically focusing on areas near the soccer field. The study’s objective was to offer three distinct options for future development, which came to include a natural play concept, aquatics concept, and athletic field concept.
Key Takeaways
• Community input gleaned as a result of Durham’s 2013 parks and recreation master plan effort determined a need for multi-use trails, play space, pavilions, updated amenities, a central commons, expanded parking and restrooms – these components are proposed within each of the three Twin Lakes Park concepts.
• The soccer field amenities at Twin Lakes Park are appreciated by and play a central role in the Latino community’s recreation and activity regimen.
• The study recognizes the significant changes to the park’s current layout if the expansion were to take place, particularly regarding the proposed new main entrance at Junction Drive.
Recommendations
• Expand Twin Lakes Park as a combination of the athletic field and natural play concepts.
• Ensure adequate parking is available by installing a new lot on the park’s northern side.
• Develop a central commons and new restrooms, as well as a meadow at the front end of the park to serve as an established entry way welcoming visitors arriving from Junction Drive.
• Install two new championship-sized multipurpose fields with artificial turf to remain at the same level of quality as the existing field.
• Consider options for future phases or design alternatives to account for other high demand park amenities and programs such as a splashpad, universal play, nature center, and walking/hiking trails (paved and natural surface).
DPR Park & Trail Maintenance Plan
Focus Areas:
Completed: 2022
Related Plans: 2013 Parks & Recreation Master Plan, City’s UDO
DPR Recreation Programming Plan
Focus Areas: Completed: 2022
Related Plans: 2013 Parks & Recreation Master Plan, 2017 Aquatics Facilities Plan, 2011 Trails & Greenways Plan, 2017 Parks + Recreation Strategic Plan, DPR’s Annual Work Plan, City of Durham Comprehensive Master Plan, City of Durham Strategic Plan, Downtown Open Space Plan, Urban Open Space Plan, The City’s Capital Improvement Plan, Equitable Engagement Blueprint
The core objective of DPR’s most current park and trail maintenance plan, is to establish a systematic and proactive approach towards the regular and consistent servicing and monitoring of park and recreation facilities. The is a guide for the department and maintenance staff to ensure the continuous upkeep and performance of park and recreation amenities and facilities, ultimately enhancing the overall user experience, minimizing potential risks, and supporting the long-term sustainability of the park system.
Key Takeaways
• Operational standards are outlined as benchmarks for consistent service and support the Asset Management Plan for park facilities – with the goal of increasing efficiency.
• The plan recognizes the need for clear and published park maintenance standards to define the minimum level of performance that is acceptable to DPR in terms of cleanliness, safety, and aesthetics.
• The plan is framed by a park classification system, which in the City of Durham include mini parks, neighborhood parks, community parks, regional parks, and special use sites. Each classification serves specific functions and has different size and service area requirements.
• Development standards, as stated in the 2022 plan, were derived from community input and balance active and passive recreation activities. Facilities such as parking, restrooms, play areas, picnic spots, and sport facilities are provided accordingly for different park classifications.
• The plan establishes different levels of service for park maintenance, based on park usage, facilities available, and level of rental activity. These levels of service determine the frequency and extent of maintenance activities provided to each park.
Recommendations
• Create clear and readily available standards for park maintenance to ensure a common understanding among DPR maintenance staff as it applies establishing procedures, frequency, and resource requirements for maintaining Durham parks, recreational amenities, and facilities.
• Ensure that resource allocation aligns with park usage to ensure the designated level of service standards for operations and maintenance.
Durham Parks & Recreation’s 2021-24 Programming Plan has been developed to enhance the existing recreational offerings in the City of Durham. As an accredited agency, the department is committed to meeting the standards set by CAPRA. This plan, guided by the “Management of Parks & Recreation Agencies” (4th Edition), incorporates various key elements such as program objectives, statistics, determinants, leisure trends analysis, and community inventory. It aims to address the recreation needs of Durham and provides a strategy to meet those needs over the next three years. The plan aligns with City Council values, facilitates budget planning, promotes program development, and ensures consistency in program quality. The Recreation Programming Plan serves as a three-year guide, with the DPR Annual Work Plan acting as the operational plan for each year. Evaluations and discussions are conducted regularly to identify program strengths and weaknesses, facilitating improvements and adjustments as needed.
Key Takeaways
• The plan was developed during the pandemic, which allowed for a unique perspective on the benefits of recreation program as major adjustments needed to be made to ensure recreational activity remained available to the public amid quarantines and lockdowns.
• Themes representing the plan’s overarching goals included a focus on prosperity, safety, diversity, engagement, innovation, and sustainability.
• The plan states that DPR’s major focus in providing recreation programs is ensuring “connected, engaged and diverse communities.”
• In addition to themes, DPR uses six determinants to guide the recreation program planning process: Foundations, Philosophy, Interests, Culture, Experiences, and Opportunities.
Recommendations
• Regularly assess how leisure services offered by DPR foster the goals of the City’s most current Strategic Plan to prioritize efforts towards meeting the broader objectives of the City.
• Involve the community in the planning process to accurately address diverse interests and needs of Durham’s residents, thus fostering a sense of ownership and engagement with DPR.
• Emphasize a culture of continuous improvement, where feedback and suggestions from staff and community members are valued and implemented to enhance the overall delivery of recreational offerings in the City of Durham.
DPR Risk Management Plan & Operating
Focus Areas:
Completed: 2022
Related Plans: City of Durham Safety Policy “S 201, Human Resources policy “HRM 322 Disciplinary and Grievance Policy”, City of Durham and DPR’s SOPs
DPR Splash & Play Plan
Focus Areas:
Completed: 2022
Related Plans: 2013 City of Durham Parks & Recreation Master Plan, 2011 Durham Trails & Greenways Master Plan, 2017 City of Durham Aquatics Facilities Plan, Durham Equitable Community Engagement Blueprint
The plan establishes a comprehensive program for ensuring the safety of employees and the public using the facilities and services provided by DPR. It aims to prevent accidents, injuries, and losses by identifying and eliminating hazards, implementing safety training, and compliance with regulations and standards. The plan includes elements such as safety training, emergency action plans, PPE assessments, hazard communication, and inspections.
Key Takeaways
• To ensure a culture where safety is a top priority, the plan prioritizes DPR employee involvement and continuous training whereby staff have sense of ownership and duty.
• Public education and awareness are at the center of the plan-ensuring park users understand safety rules, and codes of conduct within parks and recreational facilities.
• The plan requires the establishing of a Safety & Health Committee made up of a representative sample of management and non-management employees, overseen by the Recreation Services Manager and the Business Services Analyst.
Recommendations
• Ensure that safety presentations are conducted periodically at DPR All-Staff meetings, Operations meetings, or other staff meetings.
• Develop a comprehensive safety training program that addresses initial basic safety orientation, job-specific training, emergency procedures, and the use of personal protective equipment (PPE).
• Implement a Learning Management System (LMS) to assign and track training modules. Ensure that supervisors verify employees’ completion of required training and maintain accurate training records.
• Conduct department-wide assessments to identify potential hazard exposures for each job. These assessments should determine the necessary PPE for hazardous jobs and establish health screening and training requirements.
• Maintain site-specific Emergency Action Plans for each facility, outlining appropriate responses to threats such as fire, weather emergencies, medical emergencies, workplace violence incidents, power outages, and chemical spills. Ensure that these plans include facility information, evacuation diagrams, and action steps for emergency scenarios.
• Ensure that employees are aware of reporting procedures for customer accidents/injuries and employee accidents/injuries. Establish clear responsibilities for employees, supervisors, and the Safety and Health Committee in reporting, documenting, and investigating incidents.
The purpose of the plan is to provide a comprehensive and inclusive design for new recreation and aquatic facilities at East End Park, Long Meadow Park, and the former Wheels Fun Park. These spaces are currently under design and will be called Centennial Park: Longmeadow and East End and Merrick Moore Park Aquatic Center. The plan encompasses various stages, including planning, data gathering, investigations, envisioning, engagement, and final implementation. The efforts and ideas captured at each stage are detailed in the report, along with the final master plan recommendations for each site. The plan is a result of extensive engagement with stakeholders, including residents and technical steering committee members from different City departments. The goal is to develop modern amenities that improve or replace existing amenities and consider potential funding sources. The plan also addresses the need for alternative aquatic or recreational features due to limitations of existing infrastructure.
Key Takeaways
• The plan provides one primary goal for the improvement of each of the three park properties.
• Community outreach and engagement conducted as part of this plan was reflective of the City’s Equitable Engagement Blueprint.
• The plan involves the development of various design concepts for each site based on feedback received during the engagement process. For the former Wheels Fun Park site, preserving and continuing the operation of the indoor skating rink was identified as a priority. The concepts for this site aim to balance the creation of a large outdoor aquatics facility while maintaining the skating rink.
• For East End and Long Meadow Parks, the plan envisions unifying the parks into a cohesive park district. The design team explores extending the park footprint, incorporating the R. Kelly Bryant Bridge Trail as a connector, and conceptualizing aquatic and recreational offerings that could be developed in different areas of the parks.
Recommendations
• Install a crosswalk and rectangular flashing beacon at the entrance to Merrick-Moore Park on N Hoover Rd. to ensure safe pedestrian access between Wheels Fun Park and development.
• Enhance the cultural significance of the parks by preserving and repurposing existing historic structures, such as the East End Park historic pavilion and the Long Meadow Park pool and 1925 structure.
• Create a central gateway and amenity building at the intersection of Gilbert Street and N. Alston Ave. in East End Park.
• Develop stormwater control measures in both East End and Long Meadow Parks to address water quality and quantity.
• Consider extending the existing sidewalk within the park to connect to the new curb ramp and improve overall pedestrian connectivity within East End Park.
Durham Comprehensive Plan
Focus Areas:
Completed: 2023
Related Plans: Equitable Engagement Blueprint
The Durham Comprehensive Plan serves as a policy framework shaping the growth and transformation of both the City of Durham and Durham County over the next three decades. It seeks to guide the allocation of resources, act as a blueprint for future development, and help make informed decisions regarding opportunities and concerns. In light of recent challenges such as rapid development, an outdated land use plan, and the impact of the global pandemic, this new comprehensive plan aims to address the inequities that have emerged and amplify the principles of equity and accessibility for all residents. By learning from past experiences, particularly those that marginalized certain communities, this plan seeks to include historically excluded voices in decision-making and shape a future that benefits the entire community, with a special focus on addressing racial equity. The plan is the result of extensive engagement with community members, with a particular emphasis on residents of color, to ensure their perspectives and priorities are reflected in the policies, actions, and strategies outlined within the plan.
Key Takeaways
• The plan should be implemented by changes to the Unified Development Ordinance (UDO) so that the plan’s recommendations they become legally binding rules that developers and property owners must follow, ensuring that the vision and goals of the comprehensive plan are translated into enforceable regulations for land development in Durham.
• The guiding values of equity, accountability, accessibility, and well-being are the foundation of the Durham Comprehensive Plan. These values, identified through extensive community engagement, prioritize creating a Durham where everyone has equal opportunities and access, holding the local government accountable for equitable outcomes, reducing barriers and ensuring resources are accessible.
Recommendations
• Ensure publicly available parks and natural areas, community centers, libraries, and outdoor recreation facilities that are safe to use, easy to get to, well-maintained, designed for everyone, and located throughout Durham’s neighborhoods and rural communities.
• Establish cultural and recreational opportunities, events, and activities that are affordable to all Durham residents. Creating recreational opportunities that prioritizes those who have the fewest resources and options.
• Welcome and celebrate the diverse identities of Durham’s residents through recreation activities, cultural events, and public spaces and involve the community in planning and creating them.
• Ensure accessible green spaces are continuously woven throughout our community, without putting residents of color at risk of displacement as this investment is made.
Introduction
A detailed and accurate understanding of a community’s demographics is a critical component of a successful long-range plan. Growth and change within the population will ultimately impact the City’s parks and recreation goals. Therefore, the intent of this analysis is to provide the City of Durham with a roadmap to keep parks and recreation offerings at pace with evolving demand. Alongside growth, changing demographics – including race and income – have a significant impact on recreational needs within a community. These factors influence the types of activities desired, the availability of resources, and the overall accessibility of recreational opportunities.
In addition to demographics, understanding recreational trends is important as they can help predict what recreation activities may be expected or desired by park users and program participants. Trends in recreational preferences change continuously, sparking shifts in desire for new activities and programming. Even when demographic factors are unchanging, preferences and trends influence the type of demand for parks and recreation services within a community.
This chapter provides an assessment of the City of Durham’s current demographic characteristics, a population growth forecast, and projections for the 10-year planning horizon. This summary is complemented by an assessment of national and local trends. Combining these two sets of data provides a framework for recommendations that target the current and future population and align with trends in recreation.
Data Sources
The current analysis utilizes data obtained from the United States Census Bureau (USCB), supplemented by additional data from the Bureau of Labor Statistics (BLS) and the Environmental Systems Research Institute (ESRI). Census data is reflective of the USCB’s most recent (2020) Decennial Census of Population and Housing and the American Community Survey (ACS). The ACS is conducted by the USCB on an ongoing basis and is reported every five years. Demographic data is collected and synthesized using a variety of methods to inform current and future population characteristics. Data obtained from the BLS is used to assess current employment and unemployment rates within the City of Durham.
Population projections gathered as a component of the current assessment are sourced from ESRI. ESRI uses a proprietary methodology to extract current population estimates and five-year population projection estimate. ESRI uses data from the USCB, the Internal Revenue Service (IRS) and high-quality local sources. ESRI has developed methods specially tailored to estimating demographic characteristics of small areas such as Census Blocks.
Estimates & Projections
Estimates summarize the present population and demographic traits of an area, whereas projections present a proposed scenario for the future population based on assumptions like a steady growth rate or an anticipated migration influx. Typically, population estimates, and Annual Growth Rate (AGR) are based on data found in the American Community Survey (ACS). For this study, population projections were taken from the Durham City-County Planning Department. The Planning Department used the population count from the 2020 Census as the base population and then adds population based on the average household size, occupancy rate, and dwelling units added since the Census. In a rapidly growing community, a methodology like this one can give much greater insight into population growth than annual ACS estimates. These numbers are meant to be a snapshot in time and often do not match perfectly with conditions on the ground due to continuous fluctuations related to community growth. While these numbers are helpful for the project team and the municipality in gaining an understanding of the community, no recommendation of this plan will be solely based on the population estimate or calculated AGR. Growth and development will be addressed in the Level of Service chapter and that information should be equally weighted with the contents of this chapter for decision-making purposes.
When discussing projections, it is important to remember that in a community experiencing positive population growth, if a specific demographic indicator may have a “negative” rate of growth, that does not mean that individuals who fit that demographic indicator are simply disappearing. While some members of the community fitting that indicator might be leaving, changes are often more attributable to larger growth in other areas that reduces the overall percentage of an indicator in the population.
Average Annual Growth
Average annual growth is a measure for determining the rate of growth per year over a given period. Understanding the rate of growth is especially important in cities like Durham where growth is happening rapidly and getting an understanding of the magnitude of that growth is critical for future success in the park system. Data obtained from Durham City – County Planning and the Census shows the city’s current annual growth rate is currently 1.43%. This is nearly half a percent higher than North Carolina and over twice that of the United States.
Population Projections
The City of Durham is experiencing well above-average population growth, which is anticipated to result in slight shifts in the overall demographic composition of the city in the next 10 years. On population alone, the city can expect to add approximately 50,000 people in the next 10 years.
Age Segment
The following chart presents the changing proportions of the age cohorts based on population estimates and projections from 2023 through 2033. The proportional charts show a downward trend in segments representing people ages 0-15 and ages 25-54. Of note are the rates of decline in the two age groups “Children” and “Adults” being nearly identical to the growth in the two age groups “Youth and Young Adults” and “Seniors”. This is indicative of a few possibilities – the first is that the primary dynamic affecting changes in the age composition is aging as opposed to any external factor such as relocation or rapid growth in a single age segment. The second possibility is that even though the city is facing rapid growth, those new additions to the population as a whole have a largely similar demographic makeup from an age perspective as the current population. Finally, it could be a combination of those two factors. The median age in 2023 in the City of Durham is 34.8 years, compared to 38.3 years for North Carolina and 38.1 years for the United States.
This relative stability means that the Department does not need to prepare for any large wholesale shifts in offerings from the perspective of age-appropriate programming. The department should instead focus on reinforcing offerings at each age segment to maintain a level of service that the community is accustomed to.
Age of Population
Population Projections
Table 2.3
Figure 2.2
Location Growth Rate
Race & Ethnicity
Estimates show that currently, Durham residents identifying as White Alone make up less than 40 percent of the population, with the population identifying as Black Alone at 35 percent. This makes Durham a majority minority community. Combined, these two groups make up almost 75 percent of the population.
By 2033, the portion of the population identifying as White or Black Alone will shrink to just over 70 percent and the gap between White Alone and Black Alone as a percentage of the population will shrink from 4.7 percent to 2.5 percent. This means that while White Alone will remain the largest individual race, this will likely change within in the next 20 years given the rate of decline is larger than the rate of decline in the population identifying as Black Alone.
All the other Census racial groups are experiencing positive growth. The percentage of the population identifying as American Indian, Asian Alone, Some Other Race Alone, or Two or More Races are experiencing rates of growth that vary in magnitude but in most cases are significant. The group experiencing the largest growth is those who identify as Some Other Race Alone. While it is impossible to know exactly who selects into this category, past research has indicated that many in this group feel like the Census terms don’t exactly fit their racial identity. Additionally, research has indicated that large portions communities nationwide who identify as having Hispanic Origin select into this category even though the census includes a question on Hispanic Origin.
While the greatest growth is being experienced by a segment of the population that is impossible to describe in detail from a racial perspective, the continued growth of the non-white population means that efforts related to ensuring equity within the offerings of the Department should be continued and enhanced over time.
Race of Population
Household Income
Pew Research defines low-income households as those earning less than two-thirds of the United States median income; middle income households as those earning between two-thirds of the country’s median income, and upper income households as those making more than double the U.S. median income. The current US median income, as documented by the US Department of Housing and Urban Development, is $79,900. Current income ranges for City of Durham households are listed below.
Currently, at least 34.5 percent of households in Durham would be classified as low-income based on the Pew Research metric; at least 30.1 percent would be considered middle-income, and at least 9.8 percent would be considered upper income. Due to the way income is reported to the Census, some Census income ranges span two income thresholds making it impossible to be certain the exact percentage of the population in each income tier. 16.8 percent fall somewhere between low and middle-income and 17.3 percent fall between middle and upper-income.
Low-income households are experiencing a strong negative growth trend in Durham. This indicates that as a portion of all households, those earning less than $50,000 will be fewer than they are currently yet will remain a sizable portion of the population. Low-income households currently, make up at least 34.5 percent of all households, by 2033 that number is expected to fall to at least 22.7percent. Households earning $75,000 or more are either stable or experiencing strong positive growth with households earning between $100,000 and $150,000 growing the fastest with an average annual growth rate of 0.44 percent.
The average household income in 2023 according to the ESRI Community Profile was $104,581 – a figure that is projected to increase to $140,503 by 2033. The current median household income is $72,556, which is projected to increase to $97,591 by 2033.
In cases like this where there is a significant difference between median household income and average household income, the median household income should be used when trying to understand income at the community level because the median measurement eliminates outliers. Such a gap between average and median income levels is also indicative of a significant wealth gap in the community.
Another measure to consider is the median income versus the Living Wage for the community. For this analysis the Living Wage for Durham was obtained from
the Massachusetts Institute of Technology’s (MIT) Living Wage Calculator. The calculation of the Living Wage from the MIT Calculator is seen in the figure below. The current Living Wage is $84,905 which is significantly higher than the median income. This means that from a financial perspective most households are constrained to varying extents.
2.5
Average Household Income vs. Median Household Income
Household Income Series
Education
The City of Durham’s population, according to estimates for 2023, has higher attainment of both bachelor’s degrees and graduate degrees than the United States. More than 55 percent of the population has an education beyond high school compared to 37.9 percent for the United States as a whole. The percentage of the population with no high school diploma or equivalent is 8.5 percent which is on par with the United States at large, where 8.9 percent of the population do not have at least a high school diploma or equivalent.
While making projections of education attainment isn’t possible with available data, it is possible to look for some insights based on where growth is happening in the labor market. Consistent growth is still occurring in the area in Education and Health Services, Information and Professional and Business Services according to the US Bureau of Labor Statistics (BLS). All these sectors correlate with high attainment of college degrees and advanced degrees. Therefore, a reasonable assumption is that the percentage of the population with a bachelor’s degree or higher will at least maintain its current level if not increase.
Education Attainment
Figure
Disability Status
A detailed understanding of the prevalence in a population of disabilities is helpful to not only understand the challenges a population is facing but to help plan for making existing and new facilities more accessible and responsive to the population.
The portion of the population within Durham that has at least one recognized disability is 10.3 percent. The
largest categories are cognitive difficulties, ambulatory difficulties, and independent living difficulties. All of these are seen at the highest prevalence within the portion of the population that is over 65. This means that ensuring that facilities, particularly centers that offer senior programming are ADA accessible and evaluated regularly is important to ensure that this piece of the population has reliable access.
Disability Characteristics
Trends in Parks & Recreation
The field of parks and recreation continually updates best practices and integrates new policies and technologies as they become available. A forward-looking parks and recreation department will be aware of new and emerging recreation trends and can understand and anticipate the impacts broader trends will have. This plan looks at local and national recreation and activity trends as well as prevailing trends across the parks and recreation industry. All these components will likely impact the provision of leisure services in the City of Durham over the 10-year planning period.
Introduction
Local recreation trends are sourced from ESRI’s Market Potential Index (MPI). The MPI is a measure that compares demand for a product or service within a pre-determined geographic area to the national demand for that product or service. Demand for recreational activities is measured by an individual’s participation in a certain activity within the past 12 months. An MPI of more than 100 indicates that the local demand for a product is higher than the national average, while an MPI of less than 100 indicates that the local demand is lower than the national average. The products or services included within this comparison are specific to parks and recreation activities, though the products or services are not necessarily indicative of the City’s facility or program offerings. Demand for recreational activity is measured based on whether an individual has participated in a certain activity within the past 12 months.
Prevailing industry-wide trends are sourced from a variety of industry-standard publications including The Sports & Fitness Industry Association’s (SFIA) Sports, Fitness & Recreational Activities Topline Participation Report. The report was utilized in evaluating the following trends:
• National Sport and Fitness Participatory Trends
• Core versus Casual Participation Trends
• Participation by Generation
• Non-Participant Interest by Age Segment
The study is based on findings from surveys carried out in 2022 by the Physical Activity Council (PAC), resulting
Sources
• Local Recreation Trends » ESRI Market Potential Index
• National Recreation Trends » Sport & Fitness Industry Association (SFIA) » NRPA Trends
• Equity Trends
» National Recreation and Parks Association (NRPA)
in a total of N= 18,000 online interviews. A sample size of N= 18,000 completed interviews is considered to result in a high degree of statistical accuracy. A sport with a participation rate of five percent has a confidence interval of plus or minus 0.32 percentage points at a 95 percent confidence interval. Using a weighting technique, survey results are applied to the total U.S. population figure of 305,439,858 people (ages six and older). The purpose of the report is to establish levels of activity and identify key participatory trends in recreation across the U.S.
Core versus Casual Participation
In addition to overall participation rates, SFIA categorizes active participants as either core or casual participants based on frequency. Core participants have higher participatory frequency than casual participants. The thresholds that define casual versus core participation may vary based on the nature of each individual activity. For instance, core participants engage in most fitness and recreational activities more than 50 times per year – while for sports, the threshold for core participation is typically 13 times per year.
In each activity, core participants are more committed and tend to be less likely to switch to other activities or become inactive (engage in no physical activity) than causal participants. This may also explain why activities with more core participants tend to experience less pattern shifts in participation rates than those with larger groups of casual participants.
Figure 2.7
Local recreation trends were gleaned from ESRI’s market potential index profile for the City of Durham specifically. The table below lists the parks and recreation activities most popular among Durham residents as indicated by having the highest Market Potential Index (MPI). Market Potential data provides details about what type of goods, services, activities consumers use and demand. The data includes consumer attitudes on topics such as spending,
The percentages included in the tables below indicate the estimated proportion of Durham residents that participate in the activities listed. Although some of the percentages may seem either high or low, when they are paired with their MPIs we can determine the level of demand for a particular activity among Durham residents. MPI values
that equal 100 represent demand in Durham that is equal to national demand. Values greater than 100 represent higher demand, while values less than 100 represent lower demand. For example, an index of 130 implies that demand in the area is likely to be 30 percent higher than the U.S. average; an index of 85 implies that demand that is 15 percent lower.
The contents of the first table include activities participated in by 10 percent or more of Durham residents and their associated MPI scores. The second and third table contains activities participated in by small percentages (<10%) of Durham residents yet are associated with a MPI score greater than 110 – indicating there is more demand for that activity in Durham than at the national level.
Highest Participation % Activities
Activities with MPI Scores Greater than
The MPI analysis shows that four of the seven most participated in recreation activities in the city are more popular in Durham than they are nationwide. The other three have MPI scores that are very close to 100. That means that these activities not only have high participation but that they are more popular at the population level than they are in the US. Activities that have both high participation rates and MPI are activities that should be supported and invested in by the city.
There are 12 activities in Durham, according to the MPI report, with MPI scores over 110 but participation rates less than 10%. This dynamic means that the activity is likely a niche activity that is more popular from an investment perspective but not from a participation perspective. Offering activities in this category would provide some amount of service to the community but wouldn’t necessarily be the most prudent investment.
Of the 38 recreation activities analyzed in ESRI’s MPI only 5 have a score under 90 and 24 have a score over 100
(see appendix). This indicates that generally, recreational activities are very popular in the city compared to the US.
National Recreation Trends
The current assessment gains context by understanding the popularity of fitness and recreational activities nationwide. In general, recreational activities will always experience varying degrees of momentum thereby affecting the type of leisure services provided at the local level. National trends also provide insight as to whether changes within a given year are local trends or part of a larger shift in recreational preferences.
The five fitness activities experiencing the largest growth by participants in the last year according to the Sports, Fitness, and Leisure Activities Topline Participation Report are Pilates, yoga, kettlebells, dance exercise, and barre.1 The top 5 fastest growing sports/activities according to the same report were skateboarding, camping, trail running, hiking, and bicycling.
Fastest Growing Fitness Activities
While playgrounds, park shelters, and restrooms remain the most common facilities located across parks and recreation systems nationwide, trending facilities, according to Recreation Management, are: outdoor fitness areas and fitness trails, splash play areas, and walking and hiking trails.
The National Recreation and Parks Association (NRPA) also issues an annual trends report. That report recognizes the increased integration of technology as well as a decline in youth sports participation.2 On technology, NRPA notes the increased use of drones for horticultural maintenance, a transition to electric maintenance vehicles and mowers, and a long-term future use of pedestrian robots using public paths in parks for deliveries and other services.
NRPA also provides commentary on a steady decline in youth sports participation, which purportedly has been happening since the late 2000s and has been exacerbated by the COVID-19 pandemic. Citing multiple academic studies, NRPA reports that youth participation in sports decreased 7 percent between 2008 and 2018 and that most kids between the age of 6 and 12 playing a team sport had quit by age 11. Since the onset of the pandemic, 30 percent of kids have reported that they are no longer interested in picking their pre-pandemic team sports back up. NRPA promotes parks and recreation organizations using sports sampling programs that allow kids to try a variety of sports in an effort to find something that aligns with their interest and skills with low commitment and investment required on the kid and family’s part. In addition, NRPA sees a return to community-based sports in the future and that parks and recreation agencies are the most ideally positioned to be multi-sports providers.
Intergenerational Recreation Trends
Fastest Growing Sports Activities
Children & Nature Programming
The Cities Connecting Children to Nature (CCCN) initiative offers local officials’ guidance for establishing new connections between children and nature.3 Children and Nature Network and other organizations have been
2 Doles, Richard J. “Top Trends in Parks and Recreation for 2022.” <i>National Recreation and Parks Association</i>, 2021. December 16. https://www.nrpa.org/parks-recreation-magazine/2022/january/toptrends-in-parks-and-recreation-for-2022/.
3 Cities Connecting Children to Nature, A municipal Action Guide”, CCCN-Municipal-Action-Guide.pdf (cityparksalliance.org)
pushing the efforts to provide the benefits of nature for all children. Parks and open spaces provide opportunity to highlight natural resources and enhance access to these areas. Nature based programming, after school, and summer camp programming in natural areas, as well as educational programming to raise environmental awareness are some of the strategies on the rise across the country.
Adult & Senior Programming
Many parks and recreation departments have expanded to provide adult and senior fitness, athletic, and enrichment programming. Healthy aging in parks is NRPA’S campaign to improve and maintain the health and wellbeing of older adults through parks and recreation.4 It is about preserving the health, independence, and social connections of older adults. NRPA’S healthy aging in parks initiative aims to improve the health and wellbeing of older adults through parks and recreation by the following strategies:
• Chronic Disease Prevention and Management: Dissemination and increased sustainable supports for evidence-based chronic disease prevention and management programs.
• Food Security: Improved access to healthy foods.
• Social Isolation: Increased opportunities to establish strong and healthy social connections.
4 “Healthy Aging in Parks”; https://www.nrpa.org/our-work/partnerships/initiatives/healthy-aging-in-parks/healthy-aging-in-parks-about/
NRPA first published its Inclusion Report in 2018, addressing the challenges for people with different backgrounds, races, ethnicity, income levels, physical ability, sexual orientation, gender, and cultural backgrounds to access high quality parks and recreation programming. NRPA defines Inclusion as removing barriers, both physical and theoretical, so that all people have an equal opportunity to enjoy the benefits of parks and recreation.5 40 percent of US agencies have adopted formal inclusion policies to maintain consistent guidelines and implementation standard across the Agency. Examples of programming for individuals with physical and cognitive disabilities include physical activity programming, volunteer and employment activities, and health and wellness programs.
Acknowledgment of demographic diversity through celebratory programs such as heritage and holiday celebrations, culturally sensitive program hours, and health and wellness programs that reflect cultural and ethnic practices helps bring the community together. Programs and activities geared towards diversity and inclusion include community gardens, women-only programs such as swimming and dedicated gym hours, language training, technology training, financial training, and health and wellness programs such as culinary skills classes, nutrition classes, etc.
Diversity, Equity & Inclusion Trends
The National Recreation and Parks Association (NRPA) recently issues a Diversity, Equity and Inclusion (DEI) in Parks and Recreation report which covers trends and best practices as it relates to DEI. NRPA recognizes that equal access to parks is a right, not a privilege.67 Their position statement on social equity states, “Our nation’s public parks and recreation services should be equally accessible and available to all people regardless of income level,
5 National Recreation and Parks Association. “Parks and Recreation Inclusion Report,” 2018. https://www.nrpa.org/contentassets/e38627 0247644310b06960be9e9986a9/park-recreation-inclusion-report.pdf
6 Kellogg, Michelle, and Julie Nelson. “Racial Equity in Parks and Recreation.” National Recreation and Parks Association, 2015. November 30. https://www.nrpa.org/parks-recreation-magazine/2015/december/ racial-equity-in-parks-and-recreation/.
7 Rouse, David. “Social Equity, Parks and Gentrification.” National Recreation and Parks Association, 2018. July 26. https://www.nrpa. org/parks-recreation-magazine/2018/july/social-equity-parks-and-gentrification/.
ethnicity, gender, ability, or age. Social equity is a critical responsibility borne by every public park and recreation agency and the professionals that operate them.”
According to NRPA’s DEI report, 42 percent of parks and recreation agencies have indicated they have some form of formal DEI programs, 22 percent indicate the creation of such programs is underway, and the remaining 36 percent indicate they do not have any DEI programs nor do they intend to launch any in the immediate future. While the report acknowledges that political tension related to the topic of diversity, equity and inclusion has certainly polarized the topic and thus made it trickier to address in many communities. Despite this, NRPA maintains that provision of resources related to parks and recreation whether that be money, facilities, parkland and/or programming should be equitable.
The National Recreation and Parks Association (NRPA) acknowledges that parks and recreation providers can be at the forefront of addressing racial equity due to their unique role as a public service provider of many quality-of-life programs and amenities. The NRPA recommends the following considerations for addressing racial equity in parks and recreation:
• Normalizing conversations about race is the only way to develop effective strategies for racial equity. One of the biggest challenges is the general discomfort many people experience in talking about race. This is a critical hurdle to overcome. Avoiding conversations about race means there is a greater likelihood that organizations will not develop appropriate strategies to address institutional and structural racism.
• Behavior drives attitude. It is a common misconception that attitude drives behavior and expecting people to “understand” racism can lead to desired behavioral changes. However, changing behavior changes understanding. Providing common understanding of racial equity terminology and tools to use helps employees develop an increased understanding of institutional and structural racism.
• Equity is a process. Embedding racial equity in the core operations of an organization takes continual learning and practice. It should be considered as an ongoing process of delivering business and not relegated to a checkbox or an additional step to an existing process.
NRPA first published its Inclusion Report in 2018, addressing the challenges for people with different backgrounds to access high-quality parks and recreation programming. NRPA defines inclusion as removing barriers, both physical and theoretical, so that all people have an equal opportunity to enjoy the benefits of parks and recreation and have made formal commitment through “parks for inclusion” pledge.8 Parks for Inclusion supports built environment enhancements, model policy development, and best practices for program implementation to increase access to health opportunities for the following populations:
• Those with physical and cognitive disabilities
• The LGBTQ community
• Racial and ethnic minorities and new Americans
Two in five parks and recreation agencies have adopted formal inclusion policy to maintain consistent guidelines and implementation standard across the agency. Examples of programming for individuals with physical and cognitive disabilities include physical activity programming, volunteer and employment activities, and health and wellness programs.
Acknowledgment of demographic diversity through celebratory programs such as heritage and holiday celebrations, culturally sensitive program hours, and health and wellness programs that reflect cultural and ethnic practices helps to bring the community together. Programs and activities geared towards diversity and inclusion include community gardens, women-only programs such as dedicated swimming pool and gym hours, language training, technology training, financial training, and health and wellness programs such as culinary skills and nutrition classes.
8 National Recreation and Parks Association. “Parks and Recreation Inclusion Report,” 2018. https://www.nrpa.org/contentassets/e38627 0247644310b06960be9e9986a9/park-recreation-inclusion-report.pdf
Examples of Inclusive Programs
• Volunteer or employment activities including work opportunities at local parks and special events
• Health and wellness programs such as cooking and nutrition programs
• Field trips
• Special Olympics or Paralympics
• Therapy and mentoring services such as therapy swimming, art/ music therapy
• Technology training
Environmental Sustainability Trends
Parklands in dense urban areas are credited for reducing heat island effects through tree canopy coverage and for helping mitigate stormwater runoff by allowing infiltration into pervious land. Increasingly, parklands have been recognized as a vital component of infrastructure development strategy to help mitigate the impacts of climate change.
According to a survey of parks and recreation organizations conducted by the NRPA, nearly 50 percent of parks and recreation agencies adopted a Sustainability Plan or would go through the process of developing and adopting one in the near future.9 The trends seen in this report relating to sustainability show that most agencies contributed to city, county, and/or state sustainability goals by providing healthy outdoor activities for residents, protecting and managing wildlife and wildlife habitat, responsibly managing natural land, reducing landfill waste, practicing environmentally friendly design such as green infrastructure, and fostering sustainability through public education and engagement.
The NRPA’s top trends of 2022 predicted that most new parks will be designed with environmental resiliency in mind. Parks are and will continue to be seen as landscapes providing a multitude of benefits including stormwater management, protection against flooding, mitigation of rising temperatures, and promotion of environmental and social resiliency. NRPA also predicted that, to address extreme heat and the emptying out of strip malls and big-box stores, park and recreation projects will increasingly include transformation of these vacant parcels into recreation amenities. Assessment of fallow land and highest and best use of existing developed land will be priorities for agencies looking to expand their impact and geographic presence and distribution. An additional noted trend is an increasing view of parks as critical infrastructure for the environment, the economy, and social and physical wellbeing.
In recent years, sustainability in parks and recreation has taken center stage, focusing on various sustainability features and programs including:
9 National Recreation and Parks Association. “Park and Recreation Sustainability Practices,” 2017. https://www.nrpa.org/contentassets/ f768428a39aa4035ae55b2aaff372617/sustainability-survey-report.pdf.
• Adoption of eco-friendly infrastructure, such as using recycled materials for park facilities and implementing green designs like rain gardens
• Natural landscaping with native plants, which require less water and support local wildlife.
• Energy efficiency, with parks incorporating renewable energy sources like solar panels and using LED lighting.
• Water conservation efforts include adopting drip irrigation and reusing rainwater, alongside choosing drought-resistant plants.
• Reducing waste by setting up recycling and composting systems and promoting ‘leave no trace’ principles. Sustainable transportation options like bike racks and pedestrian paths are being integrated, making parks more accessible while reducing carbon footprints.
• Environmental education, offering programs and signage about local ecosystems and sustainability.
• Community gardens and urban agriculture initiatives within parks, providing sustainable food sources and educational opportunities.
• Focus on climate resilience, conserving areas of ecological significance and designing spaces that can withstand climate-related challenges.
• Integration of smart technology, such as environmental monitoring sensors and informative apps, is enhancing both park management and visitor experiences.
Durham Parks and Recreation Centennial Celebration Photo Gallery
Summary of Findings
As Durham’s population grows and changes in the coming decade, the community’s recreation needs will grow and change.
• Population growth is happening rapidly compared to the State and the rest of the Country. Planning investments based on the Level of Service analysis should guide strategic growth and investments that can maintain service to the community today and provide service to the influx of new residents of the City.
• Stable growth rates within different age groups indicate that, generally, there isn’t a need for any large-scale diversification of offerings to accommodate for any age shifts on the horizon.
• Wages that are lagging a Living Wage and a widening wealth gap indicate that the City should continue to make efforts to provide services to those with lower wages to reduce financial burden for enriching activities.
• The analysis of wages also indicates that any new Cost Recovery or Fee strategy should be built with equity and the reality of wages in mind. Increasing average income means that there are certainly residents in the City who could afford to pay for value-added services.
• A low but significant portion of the population of Durham has a disability. Existing facilities should be evaluated for accessibility and new facilities should be appropriately planned for accessibility. A large proportion of this population segment includes cognitive difficulties revealing the need for specialized programs and trained staff that can accommodate neurodiverse populations.
• Market Potential Indices reveal that recreational programs are generally very popular in the City of Durham when compared to the United States.
• Durham’s already diverse racial demographics will continue to shift moderately during the next ten years, indicative of the need for equity, diversity, and inclusion efforts to ensure equitable provision of parks, facilities, amenities, and programs.
• In addition to Durham’s specific community context, emerging trends in parks and recreation include understanding the many far-reaching benefits of parks in pursuing equity and environmental sustainability.
3 CHAPTER
COMMUNITY ENGAGEMENT
Introduction
Community engagement and input is an essential part of any planning process. The most effective plans are firmly rooted in the realities and visions of the communities that created them. The City of Durham as well as the Parks and Recreation Department are particularly dedicated to ensuring that every individual has a voice in the planning process, going to extraordinary measures to ensure the inclusion of all residents. This plan uses a combination of input from Durham residents, the Recreation Advisory Commission and City Council to inform the community engagement portion of the information-gathering process.
Engagement Plan & Process
The Parks and Recreation Department and the project team designed the public engagement plan to maximize input. The City of Durham’s Community Engagement Blueprint informed the engagement process. The intention was to make it equitable and inclusive by offering a variety of opportunities where people feel comfortable offering input and expressing their needs and desires. A variety of engagement types were conducted to ensure engagement was inclusive and did not limit participation.
Intercept Engagements
Schedule May to August 2023
Estimated Participants 735
Intercept engagements are events where the project team aimed to reach community members by having a presence at local events such as festivals, park openings, holiday celebrations, etc. These local events provided the opportunity to meet community members where they are, reaching those that may not otherwise participate. This type of engagement helps lessen the barriers for participation.
At these events, participants could provide feedback through interactive boards and conversation with the project team. The interactive boards focused on what participants love about Durham Parks and Recreation, identify the community values and share their need for new park amenities.
Printed materials available in both English and Spanish were provided. Several of the intercept events had Spanish speaking interpreters available. When engaging with the Spanish speaking population, venues and occasions were carefully selected to ensure their voices and viewpoints were fully integrated into the process. The invaluable assistance of Durham Parks & Recreation’s Spanish speaking staff extended beyond mere translation services; they played a pivotal role in ensuring deliberate and effective engagement with the Spanish speaking community. Their involvement not only provided essential cultural context for newcomers seeking to explore DPR’s resources but also facilitated the planning process, making engagement more equitable and inclusive. Spanish speaking attendees stated their appreciation for this.
Engagement Meetings & Schedule
Schedule June to July 2023
Estimated Participants 89
The Partners Against Crime (PAC) program in the City of Durham is a community-based volunteer organization that promotes and executes safety strategies and works collaboratively among police officers, residents and city and county government officials to find sustainable solutions to community and quality of life issues. The city has five PACs based on the police districts and they each meet monthly.
The project team received feedback from each of the PACs during the initial engagement phase of the project. The first series of PAC meetings were held in June and July to introduce the project, receive feedback and share information on the first public meeting. A brief presentation was held during the PAC meetings and attendees had the opportunity to provide feedback at the end of the meeting about what participants love about Durham Parks and Recreation, identify the community values and share their need for new park amenities. Printed materials were provided in English and Spanish.
Public Meeting #1
July 18, 2023
There were three questions consistently asked across the three the types of engagement efforts – the results of which are noted below for comparison:
• What do you love about Durham Parks and Recreation?
• What are the values that you hold for the Durham community?
• What amenities would you like to see added or expanded?
Community Meeting #1 was held on July 18, 2023, from 5:30-7:30 pm at the Durham Armory. Approximately 50 attendees participated in the meeting. The meeting included eight stations to obtain feedback from participants. Free parking was provided for all participants and children’s activities were provided as well. Generally, the feedback sought was on what participants love about Durham parks, reasons for visiting parks, community values, barriers to park use and amenity and program needs. Additionally, participants could provide feedback on topics not covered by the engagement stations.
* Write in by Participants
In addition to the questions above, the public engagement meeting had additional stations to dive deeper into the discussion of what people currently like, what prevents them from using the parks and what would help bring more visitations.
Reasons for Visiting
It
It
Barriers
Table 3.3
Table 3.4
Table 3.5
There were five reasons that are more popular than the others. Their percentages were 11-19% of the responses. The remaining responses were all at 6% and below. The top five reasons include:
1. Lack of information/don’t know what is offered
2. Cost of Program
3. Lack of transportation
4. Lack of cleanliness
5. Lack of maintenance
There was also the option to select “nothing; I am actively using the City’s parks and facilities.” The table above does not include these responses in the percentages. There were nine votes for the response of “nothing” which is the same number for “cost of program.” This result identifies that a high number of meeting participants are actively using the parks and facilities.
It should be noted that there was a high percentage of skate park users that attended the public meeting and the results reflect this, with this amenity ranking at the top and with a margin. Following the skate park, there was not a significant drop of votes with the percentages having a steady decline.
Program Needs
Participants were asked what programs they would like to see added or expanded within in the City. Programs are categorized for specific age ranges.
• Youth programs, ages 0-12, included comments for soccer, summer camps and afterschool programs and education-based programs.
• Teen programs, ages 13-18, included teen focused community centers, hands-on activities, and adventure programs such as mountain-biking trails.
• Young adult programs, ages 18-39, also included volleyball, group fitness, skate park renovations, and planned walks or bike rides to parks.
• Adult programs, ages 40-65, included passive programs such as bird watching, socialization events, adapted programs for mobility restricted adults, wellness programs such as yoga and meditation, and inclusive active programs.
Miscellaneous comments
• Skate park improvements to allow extended use
• Growth and development concerns as it relates to parks
• Desire for 10-minute walk to a park to allow better access to parks and open space
Surveys
The community input process included two surveys; a statistically valid survey which polled a randomly selected sample of the city’s population and a web-based survey administered by the city which was open to anyone.
Scientific Survey
The scientific survey is an approved market research tool that provides an opportunity to reach the broad composition of a community’s population. This includes households from all areas of the jurisdiction and encompass the demographic make-up of the community. The survey also balances responses from other types of engagement efforts and special interest groups. It is a tool to solicit feedback on the recreational needs and wants of the Community.
The project team administered a scientific survey in the summer of 2023. A survey packet was mailed to randomly selected sample households within Durham city limits. Residents were given the option to return the survey response by mail or complete it online on DurhamParkSurvey.org. A total of 539 responses were returned with a precision of at least +/- 4.2% and the 95% level of confidence. A more detailed description of methodology for ensuring statistically valid results is contained in Appendices.
Use of Parks & Facilities
Use Overview
Most respondents (85%) said their household had visited Durham parks or facilities in the last year. The highest percentage of respondents (25%) reported visiting a few times a month followed by 2-3 times a week (23%) and every couple of months (22%). Respondents most often say they use parks and facilities to enjoy the outdoors (70%), because it is close to home (49%), and it adds to the quality of life (47%).
Quality of Parks & Facilities
Respondents who had visited parks/facilities in the last year were asked to rate the overall quality. Most respondents (75%) rated the parks and facilities as either good (58%) or excellent (17%).
Barriers to Use
Respondents most often list lack of information/not knowing what is offered (38%), distance from residence (27%), busy schedules (22%), and safety at facilities (22%) as their major barriers to use of parks and facilities. Accesibility was also a common community concern, the highest percentage of respondents (31%) said it would take 20 minutes or more to walk to the nearest park, facility, or greenway.
Recreation Programs or Special Events Participation
Program/Event Participation. Twenty-eight percent (28%) said someone in their household had participated in City recreation programs or special events in the last year. Of those who had participated, most (90%) rated the overall inclusivity and diversity as excellent (36%) or good (54%). The overall quality of recreation programs and special events was most often rated as good (59%) followed by excellent (31%).
How Long Would it Take Residents to Walk to the Nearest Durham Park, Facility, or Greenway?
16-20 Minutes (10%)
11-15 Minutes (17%)
Less than 5 Minutes (20%)
5-10 Minutes (22%)
20+ Minutes (31%)
Figure 3.2
Perceptions of Parks & Recreation
Overall Satisfaction
Most respondents (63%) say they are either somewhat satisfied (38%) or very satisfied (25%) with the value their household receives from the City of Durham Parks and Recreation Department. Most respondents (81%) say the existence of public parks and recreation is “very important” to the quality of life in Durham.
Communication Methods
The highest percentage of respondents learn about city parks, facilities, and special events via social media (62%), word of mouth (53%), the City of Durham website (40%), or a search engine (40%). Respondents would most prefer to receive information from social media and the City of Durham website.
Agreement with Aspects of Parks & Recreation
Respondents were asked to rate their level of agreement with 11 statements about Durham Parks and Recreation. Respondents most often agreed (selecting “agree” or “strongly agree”) that public parks add to the quality of life in the community (98%), recreation and parks are an essential service to the city (98%), and parks and recreation helps promote healthy and active lifestyles (93%).
Support for Improvements
Respondents were asked to rate their level of support for six potential actions to improve the parks and recreation system. Respondents were most supportive (rating “supportive” or “very supportive”) of investing in the look and quality of existing parks and facilities (94%), implementing sustainability measures to minimize the environmental impact of parks and recreation facilities (90%), and connecting existing trails to downtown neighborhoods and parks (89%). Respondents think the top three areas Durham Parks and Recreation should focus on improving are updating existing parks and facilities (66%), maintaining parks and facilities (64%), and protecting the environment (34%).
Funding for Improvements
Respondents said they would be most willing to support investing in the look and quality of existing parks and facilities (57%), connecting existing trails to downtown neighborhoods and parks (52%), and developing greenspace/parks in Downtown Durham (47%) with their tax dollars. Almost half of respondents (48%) say they are very supportive of paying additional taxes to improve existing parks in Durham. Thirty-nine percent (39%) say they are very supportive of paying additional taxes to construct new parks in Durham.
Parks & Recreation
Facilities & Amenities Needs & Priorities
Facility/Amenity Needs: Respondents were asked to identify if their household had a need for 37 parks and recreation facilities/amenities and to rate how well their needs for each were currently being met. Based on this analysis, ETC Institute was able to estimate the number of households in the community that had the greatest “unmet” need for various facilities/amenities.
The three parks and recreation facilities/amenities with the highest percentage of households that have an unmet need:
1. Year-round restrooms– 52,516 households
2. Park benches, tables with shade & solar-powered charging stations– 45,906 households
3. Public gardens – 44,632 households
The estimated number of households that have unmet needs for each of the 37 parks and recreation amenities assessed is shown in the chart to the right.
Estimated Number of Households Whose Facility/Amenity Needs Are Only “Partly Met” or “Not Met”
3.3
Facilities & Amenities Importance
In addition to assessing the needs for each parks and recreation facility and amenity, ETC Institute also assessed the importance that residents placed on each item. Based on the sum of respondents’ top four choices, these were the four facilities/amenities ranked most important to residents:
1. Natural surface trails (31%)
2. Natural open space (28%)
3. Paved greenway trails (24%) and aquatics center/swimming pool (24%)
4. Downtown parks and greenspace (23%)
The percentage of residents who selected each facility/amenity as one of their top four choices is shown in the chart on the following page.
Facilities/Amenities Most Important to Households
3.4
Figure
Priorities for Facility Investments
The Priority Investment Rating (PIR) was developed by ETC Institute to provide organizations with an objective tool for evaluating the priority that should be placed on recreation and parks investments. The Priority Investment Rating (PIR) equally weighs (1) the importance that residents place on amenities and (2) how many residents have unmet needs for the amenity. [Details regarding the methodology for this analysis are provided in Section 3 of this report.]
Based the Priority Investment Rating (PIR), the following parks and recreation facilities/amenities were rated as high priorities for investment:
• Year-round restrooms (PIR=173)
• Natural surface trails (PIR=172)
• Natural open space (PIR=159)
• Aquatics center/swimming pool (PIR=157)
• Paved greenway trails (PIR=152)
• Downtown parks and greenspace (PIR=132)
• Park benches, tables with shade and charging (PIR=131)
• Public gardens (PIR=125)
• Shaded playgrounds (PIR=106)
The chart below on the following page shows the Priority Investment Rating for each of the 37 recreation facilities assessed on the survey.
Program Needs & Priorities
Program Needs
Respondents were asked to identify if their household had a need for 34 programs and to rate how well their needs for each were currently being met. Based on this analysis, ETC Institute was able to estimate the number of households in the community that had the greatest “unmet” need for various recreation programs.
The three programs with the highest percentage of households that have an unmet need:
1. Outdoor movies and concerts – 37,423 households
2. Fitness and wellness programs – 33,350 households
3. Adult athletics – 28,183 households
The estimated number of households that have unmet needs for each of the 34 parks and recreation programs assessed is shown in the chart on the following page. Figure 3.6
Programs/Activities Most Important to Households
Programs Importance
In addition to assessing the needs for each program, ETC Institute also assessed the importance that residents placed on each item. Based on the sum of respondents’ top three choices, these are the three most important programs to residents:
1. Outdoor movies and concerts (29%)
2. Fitness and wellness programs (25%)
3. Swimming (21%)
The percentage of residents who selected each program as one of their top three choices is shown in the chart on the following page.
Priorities for Program Investments
The Priority Investment Rating (PIR) was developed by ETC Institute to provide organizations with an objective tool for evaluating the priority that should be placed on recreation and parks investments. The Priority Investment Rating (PIR) equally weighs (1) the importance that residents place on each program and (2) how many residents have unmet needs for the program. [Details regarding the methodology for this analysis are provided in Section 3 of this report.]
Based the Priority Investment Rating (PIR), the following Durham programs were rated as high priorities for investment:
• Outdoor movies and concerts (PIR= 200)
• Fitness and wellness programs (PIR=177)
• Swimming (PIR=140)
• Adult Athletics (PIR=132)
• Arts, dance, music and performing arts (PIR=126)
• Outdoor adventure programs (PIR=107)
• Environmental education (PIR=100)
• Senior Programs, activities, and trips (PIR=100)
The chart on the following page shows the Priority Investment Rating for each of the 34 programs assessed.
Public Opinion Survey
In addition to scientific survey, the City administered a web-based public input survey that was open to all residents. A total of 592 responses were received.
Use Overview
Most respondents (98%) said their household had visited Durham parks or facilities in the last year. The highest percentage of respondents (25%) reported visiting a few times a month followed by 2-3 times a week (34%) and once a week (15%). Respondents most often say they use parks and facilities to enjoy the outdoors (13%), improved physical fitness and health (10%), quality of life (10%) and program or facility offered (9%).
Quality of Parks & Facilities
Respondents who had visited parks/facilities in the last year were asked to rate the overall quality. Most respondents (70%) rated the parks and facilities as either good (60%) or excellent (10%).
Ease of Access
The highest percentage of respondents (40%) said it would take 20 minutes or more to walk to the nearest park, facility or greenway.
Recreation Programs or Special Events
Participation
Twenty-eight percent (28%) said someone in their household had participated in City recreation programs or special events in the last year. Of those who had participated, most (95%) rated the overall inclusivity and diversity as excellent (40%) or good (55%).
Overall Satisfaction.
Most respondents (70%) say they are either somewhat satisfied (50%) or very satisfied (20%) with the value their household receives from the City of Durham Parks and Recreation Department. A strong majority of respondents (92%) strongly agree that the existence of public parks and recreation is essential to the quality of life in Durham.
Communication Methods
The highest percentage of respondents learn about city parks, facilities, and special events via social media (18%), word of mouth (17%), the City of Durham website (13%), a search engine (10%) or direct mail (10%). Respondents would prefer to receive information from social media (30%), direct email (25%) and the City of Durham website (16%).
Agreement with Aspects of Parks & Recreation
Respondents were asked to rate their level of agreement with 11 statements about Durham Parks and Recreation. Respondents most often agreed (selecting “agree” or “strongly agree”) that public parks add to the quality of life in the community (99%), recreation and parks are an essential service to the city (99%) and parks and recreation helps promote healthy and active lifestyles (92%).
Support for Improvements
Respondents were asked to rate their level of support for six potential actions to improve the parks and recreation system. Respondents were most support (rating “supportive” or “very supportive”) of investing in the look and quality of existing parks and facilities (96%), implementing sustainability measures to minimize the environmental of impact of parks and recreation facilities (85%), and connecting existing trails to downtown neighborhoods and parks (89%). Respondents think the top three areas Durham Parks and Recreation should focus on improving are updating existing parks and facilities (28%), maintaining parks and facilities (25%) and promoting healthy and active lifestyles (10%).
Funding for Improvements
Respondents said they would be most willing to support investing in the look and quality of existing parks and facilities (96%), connecting existing trails to downtown neighborhoods and parks (89%) and building new parks and athletic fields (87%). Almost half of respondents (49%) say they are very supportive of paying additional taxes to improve existing parks in Durham. Forty-four percent (44%) say they are very supportive of paying additional taxes to construct new parks in Durham.
Parks & Recreation Facilities & Amenities Needs & Priorities
Facility & Amenity Needs
Respondents were asked to identify if their household had a need for 37 parks and recreation facilities/amenities and to rate how well their needs for each were currently being met. Based on this analysis, ETC Institute was able to estimate the number of households in the community that had the greatest “unmet” need for various facilities/amenities. The four parks and recreation facilities/amenities with the highest percentage of households that have an unmet need:
1. Year-round restrooms, 45, 195 households
2. Public gardens, 36,457 households
3. Aquatics center/swimming pool, 35,285 households
4. Park benches, tables with shade and solar powered charging stations, 34,165 households
Estimated Number of Households Whose Facility/Amenity Needs Are Only “Partly Met” or “Not Met”
Facilities & Amenities Importance
In addition to assessing the needs for each parks and recreation facility and amenity, ETC Institute also assessed the importance that residents placed on each item. Based on the sum of respondents’ top four choices, these were the four facilities/amenities ranked most important to residents:
1. Tennis courts, 28%
2. Natural surface trails, 27%
3. Year-round restrooms, 24%
4. Paved greenway trails, 24%
The percentage of residents who selected each facility/amenity as one of their top choices is shown in the chart on the following page.
Facilities/Amenities Most Important to Households
PIR Facility Investments (PIR)
The Priority Investment Rating (PIR) was developed by ETC Institute to provide organizations with an objective tool for evaluating the priority that should be placed on recreation and parks investments. The Priority Investment Rating (PIR) equally weighs (1) the importance that residents place on amenities and (2) how many residents have unmet needs for the amenity.
Based on the PIR, the following parks and recreation facilities/amenities were rated as high priorities for investment:
• Year-round restrooms, PIR 179
• Natural surface trails, PIR 168
• Paved greenway trails, PIR 149
• Aquatics center/swimming pool, PIR 146
• Natural open space, PIR 136
• Lighted amenities (fields, dog parks, courts, etc.), PIR 130
• Tennis courts, PIR 128
• Downtown parks and greenspace, PIR 123
• Shaded playgrounds, PIR 119
• Indoor athletic complex (multiuse courts), PIR 111
• Public gardens, PIR 110
• Park benches, tables with shade and solar powered charging stations, PIR 109
• Baseball/softball fields (youth and adult), PIR 103
The chart on the following page shows the PIR for each of the 37 recreation facilities assessed in the survey.
Top Priorities for Investment for Facilities/Amenities
Program or Activity Needs & Priorities
Program Needs
Respondents were asked to identify if their household had a need for 34 programs and to rate how well their needs for each were currently being met. Based on this analysis, ETC Institute was able to estimate the number of households in the community that had the greatest “unmet” need for various recreation programs. Program or Activity with the highest percentage of households that have an unmet need:
Number of Households Whose Programs or Activities are Only “Partly Met” or “Not Met”
Programs & Activities Most Important to Households
PIR Programs & Activities
Priorities for Facility Investments: The Priority Investment Rating (PIR) was developed by ETC Institute to provide organizations with an objective tool for evaluating the priority that should be placed on recreation and parks investments. The Priority Investment Rating (PIR) equally weighs (1) the importance that residents place on amenities and (2) how many residents have unmet needs for the amenity.
Based the Priority Investment Rating (PIR), the following parks and recreation facilities/amenities were rated as high priorities for investment:
• Tennis, PIR 175
• Outdoor movies and concerts, PIR 174
• Adult athletics, PIR 172
• Swimming, PIR 154
• Fitness and wellness programs, PIR 152
• Youth sports, PIR 134
• Baseball and softball, PIR 132
• Arts, dance, music and performing arts, PIR 132
• Outdoor adventure programs, PIR 126
• Disc golf, PIR 119
• Pickleball, PIR 103
The chart on the following page shows the Priority Investment Rating for each of the 34 programs assessed.
Focus Group Meetings
Focus group meetings provide a way to receive input from groups with interests that complement the agency. Guided discussions included opportunities to work toward a well-rounded park system that embraces a certain set of values. Participants for this exercise represented various age groups, all of which have unique and specific recreational needs. They responded from their unique positions, expressing their needs wants and concerns, and the needs of the people they represent. Each group added value to the overall community engagement effort representing varied roles in improving quality of life throughout the city and county of Durham.
Considering age and age groups is important when planning park and recreation amenities, programs, and services. Varied age ranges have distinct needs, interests, and preferences, making it essential to tailor offerings for relevance and participation. Different developmental stages, safety considerations, and social interaction dynamics further underscore the importance of age-sensitive planning. When considered collectively, this approach ensures operational efficiency for the parks department by optimizing resource allocation and ensuring the effectiveness of recreational initiatives.
Individuals representing mature adults, teens, schools, athletics, families and youth, healthcare partners, the Latino population, local organizations & boards, economic development & vitality, and persons with disabilities, participated in the discussions which took place throughout March and April of 2024.
The meetings began with an overview of what a Comprehensive Plan is, where in the process these meetings fall, as well as an explanation of where the information gathered from the meetings would live within the plan. The following questions were used to guide and prompt conversation, with a goal to develop an understanding of recreational needs across the community and how these needs can be supported by the updated plan:
1. What are the strongest assets in the Durham Parks and Recreation (DPR) system regarding your respective focus group?
2. What are some of the actions or steps needed to make these assets stronger?
3. Are there any missed opportunities with DPR as it relates to participation and engagement from your respective focus group?
4. What new recreational amenities and programs would strengthen DPR’s contribution to members of your focus group?
5. What are some key partnerships that you feel DPR could make or leverage to improve their offer ings and increase their contribution to Durham’s members of your focus group?
6. What is one outcome you would like to see from the plan?
Focus Group #1 - Local Organizations & Boards
Strongest Assets
The local organizations & boards focus group was made up of fellow recreation and afterschool providers who have similar and/or aligning visions with DPR. They highlighted the most positive aspect being that the pro gramming offered by DPR is affordable or free, making it accessible to a wide range of individuals. They noted that DPR staff is easily accessible and actively participates in the programming and activities with the Campus Hills Pool and Edison-Johnson Pool being highlighted as valuable resources within the community.
Opportunities for Improvements & Enhancement
Suggestions for improvements from this group cen tered around the need for increased accessibility, better information dissemination and continued community engagement. The group identified the department’s current challenges to educate the public on the various programming offered, leaving some folks without any knowledge of what is offered. They also noted the loca tional barriers which leave some people without having a park or program within a reasonable walking or driv ing distance. It was also noted that the preservation of natural habitats and integrating climate resilience goals is vital for long-term sustainability of park management and maintenance.
To correct these errors, they noted that the department should consider partnerships with organizations like the Durham County Library, Durham Partnership for Children, Museum of Life and Science, Duke University neighborhood associations, and Durham Public Schools. By combining staff, budgets, and supporters around like visions, partnerships can fill the gaps that have arisen within the department.
Focus Group #2 - Teens
The feedback from teens indicated that teens feel welcomed, particularly at the W.D. Hill and the Teen Center at Lyon Park community centers, where staff members have created a welcoming environment by building intentional relationships. They also noted that the former YouthGoPass program helped overcome transportation barriers for teens to access facilities and programs. Bringing this program or a similar program back online could improve accessibility. Lastly, the Police Athletic League (PAL) basketball games hosted throughout Durham were mentioned as they allow kids from different communities to safely experience other places and neighborhoods.
Opportunities for Improvements &
Much of the feedback and suggestions from the teen focus group centered on how to access and engage teens. Group members noted the challenges between engaging a 13-year-old versus a 17-year-old, who have different needs, wants, and lifestyles as it relates to recreation but fall within the same age group. Some programming ideas that were supported include ideas such as having teen social media ambassadors, providing additional mental health services, STEM-related programs, as well as just places to “be” or lounge. Now that spaces like the Southpoint Mall have age restrictions for those under 18 years old, teens are turning to parks and community centers for safe places to recreate without programming. Other spaces where teens feel they can just “be” were spaces like the libraries or the lawn area near DPAC and at the
Focus Group # 3 - Economic Development & Vitality
Strongest Assets
Across age groups and socioeconomic backgrounds, people love the American Tobacco Trail as an amenity, but there is a need for a larger venue for multi-sport activities in the downtown area. The Durham Bulls Athletic Park was also mentioned as an economic driver that should be cherished and enhanced over time.
Opportunities for Improvements & Enhancement
Much of the discussion within this group revolved around the need to identify how the County will address parks and recreation. The County stadium seems to have the most opportunity for date inventory and openings, but it is not run by Durham Parks and Recreation. It was also noted that the demand for recreation within the Research Triangle Park (RTP) is high, with three fields including cricket and volleyball, as well as a robust trail network throughout the park. “People love the American Tobacco Trail as an amenity, but there is a need for a larger venue for multi-sport activities in the downtown area,” was a direct quote from this group noting that the provision of spaces for recreation and recreation programming needs to be looked at holistically, throughout the county, to ensure that the economic value of parks is captured across Durham.
Focus Group # 4 - Youth
Strongest Assets
Feedback from the youth group noted that the diverse and inclusive programming offered by Durham Parks and Recreation is their greatest asset. This includes holiday-themed interactive programming for smaller kids, dances and field trips for seniors, and a wide range of activities for various age ranges. The availability of free amenities and swimming for residents 18 and under was also noted as an asset, although limited hours and staffing can be challenging. The department also has a positive reputation for its summer camps, cultural events, and community engagement. Overall, the variety of programs, dedicated staff, and involvement with other organizations make the department a valuable resource for the community.
Opportunities for Improvements & Enhancement
This group made suggestions about improving facilities and services in Durham. They mentioned the need to update and diversify facilities such as swimming pools, skating rinks, and parks with multiple offerings. They emphasized the need to maintain and improve bathrooms, align facility hours with community needs, and provide inclusive opportunities for children with disabilities. One member suggested that continuous education and training for staff in areas like challenging behaviors and inclusion should be a department standard, if not already so. This group touched on the impact of lead within the parks and the feeling that the issue could have been better communicated to the community They expressed that the department should aim for complete transparency in communications for such issues.
Focus Group # 5 - Schools
Strongest Assets
From this group, we gathered that Durham Parks and Recreation is highly recommended by the families of students within public and private schools who take part in summer and afterschool programming. The positive perception of these programs by families indicates their effectiveness in the school system.
Opportunities for Improvements & Enhancement
The primary issue noted with this group was the demand for programming being greater than the supply. There are hundreds of students who do not get to participate in programming due there not being enough spaces within the programming, few facilities that are of high quality, and the lack of transportation provided to and from. Durham Parks and Recreation only transports from two schools to their facilities, and there are 32 schools total within the Durham Public Schools System.
Increasing access to programs for school-aged children in Durham is the top priority of this group. Some suggested solutions included focusing on expanding afterschool program offerings, providing transportation from school to a facility until 6:00 p.m., and implementing specific programming such as STEM, Robotics, as well as middle school programming. For this group, they believe the common goal should be to create a safe and engaging environment for students, with an emphasis on increasing overall access and accommodating more students within programs.
Focus Group # 6 - Mature Adults
Strongest Assets
Durham has a robust senior games league and program, a result of the partnership with Durham Parks and Recreation staff, NC Senior Games, and the many ambassadors throughout the community who show up to support and play.
Opportunities for Improvements & Enhancement
Primary feedback from this group focused on increasing the number of quality facilities to ensure that Durham, like Cary and Apex, can become a hub for hosting competitions and league tournaments in the future. Durham Parks and Recreation should aim to collaborate with more organizations in the community to improve the stock of facilities. Currently, the NC Senior Games state finals are held in Greenville at East Carolina University due to the need for suitable facilities. The support for senior or mature adult games in Durham is deeply ingrained, with collaboration from various neighborhoods and government agencies sharing the common goal of creating a sports travel destination for seniors in Durham. The presence of a large recreational facility would enhance Durham’s reputation while also having a positive economic impact. The state senior games feed into the local senior games, which host large tournaments, all of which could bring hundreds of people to Durham throughout the year. Old Northern High School was identified as having potential as a facility, and the need for indoor and outdoor pickleball courts was mentioned as a growing sport.
Focus Group # 7 - Health Care
Partners
Strongest Assets
Like the Teens group, the strongest asset identified by healthcare partners is the staff. The staff is praised for being professional and welcoming. The facilities were described as “gorgeous”. Durham Parks and Recreation community centers are recommended as ideal locations for hosting meetings, with low to no cost to healthcare partners. W.D Hill Recreation Center is specifically mentioned as a great spot for meetings and events, offering a kitchen for collaborative initiatives like the “Hypertension Dinner”. Overall, DPR and its existing partners aim to provide health-related services and programming in a welcoming and convenient space for families through shared use agreements.
Opportunities for Improvements & Enhancement
Safety concerns around community centers, specifically the W.D. Hill area, particularly in the evenings, were mentioned as a primary area for improvement, along with the idea of creating a security presence during nighttime events. The community is nervous about crime and drug-related issues in the W.D. Hill area, with recent incidents such as an overdose at the Lincoln Clinic. Additionally, there was a mention of the health department utilizing facilities at DPR for cancer prevention classes and chronic illness management, but security costs would be their responsibility. Many of the suggestions for improvement centered around creating an infrastructure for public-private partnerships and streamlining contract management between the city and healthcare institutions.
Through partnerships with healthcare institutions, and by recognizing the relationship between healthcare and parks and recreation, Durham Parks and Recreation and its healthcare partners can make parks more accessible, foster collaboration across provision gaps, and enhance wellness programs within the community.
Focus Group # 8 - Persons with Disabilities
Strongest Assets
Overall, the consensus from the group is that the programming that targets the Intellectual and Development Disabilities (I/DD) is well advertised and attended. Durham Parks and Recreation supports the Special Olympics for participants aged 5 and up. The department also offers a variety of youth sports programs, most of which are skill-based, with a few competitive options. Additionally, they have a monthly drop-off program called Friday Fun Night. It was noted that families without children within the I/DD community also participate in this program. The consensus is that community centers provide a safe space for people of all abilities to gather and play.
Opportunities for Improvements & Enhancement
This group noted that the number one issue is the need for additional staff to expand community outreach and programming. Budget constraints have limited the department’s ability to fully utilize resources and provide intentionally inclusive programming. The department heavily relies on volunteers, including high school coaches, to support events and programs. While most programs are held once a month, there is a lack of consistency in youth/teen I/DD programming. Suggestions include reintroducing wheelchair basketball and visually impaired bowling, providing transportation services, and building alliances with other I/DD recreation providers to engage a wider audience.
Focus Group # 9 - Latino
Population
Strongest Assets
Positive feedback from the Latino Population focus group homed in on the variety of programs available for all ages and the efforts to increase accessibility to parks through Spanish-speaking staff with the Parks and Recreation department. Additionally, improvements to the language access program, such as the language line, was noted as a major asset, as it provides translation services throughout the city and departments. The mention of the Latino Festival and the utilization of outdoor spaces by families further showcase the engagement with the Latino population.
Opportunities for Improvements & Enhancement
Communication and information barriers were noted as the number one issue for the Latino population group. Though the department has made strides and has a relatively large staff who solely serve the Latino population, there are still gaps in the services provided that are outside of the scope of staff. Several members noted that the current registration practice that is solely online means that many people without computer proficiency or a computer of their own, are being excluded from programs. A suggestion was for the department to aid with online registration or allow for a few waitlist seats to be set aside for in-person registration. This will help make the registration process more accessible to the Latino community and expand opportunities for Latinx families to engage with parks and programs. The importance of immersing new community members, like those at the Durham Refugee Center, into Durham parks through education, recreation, and instruction. The idea of pick-up games with staff at parks throughout the community and engaging directly with the community through active events was mentioned, along with the concept of providing some open outdoor recreation programs without registration to reduce barriers.
Strongest Assets
The strongest asset to this group is the athletic programs offered by the department in Durham. The participants noted the wide variety of athletic programs available, the positive working relationship between DPR and the community, the strength of having multiple parks throughout the city, and the diversity of programming options for participants as major departmental assets.
Opportunities for Improvements & Enhancement
Like other groups, staffing and safety were noted as the primary areas of improvement. There is a need to foster safer environments surrounding parks and create safer spaces within parks. The lack of quality facilities is causing Durham to miss out on opportunities like the Showcase Tournament and USTA state championships, similar rhetoric mentioned by the Mature Adults focus group. Centralizing facilities, maintaining existing ones, and improving accessibility for broader groups are necessary to ensure that all in Durham have access to athletics.
Some suggestions included converting older tennis courts into pickleball courts and exploring the possibility of converting North Gate Park into separate tennis and pickleball courts. Old Northern High School was once again mentioned in this group, though they noted that the department should consider converting the old tennis courts into pickleball courts and activating the available gyms for league competitions and training time. Clear communication and maintenance plans for facilities are crucial and should take precedence over the idea of brand-new facilities.
Trends/Key Takeaways from Focus Groups
Across all ten focus groups, several themes were repeated. Feedback regarding the youth pool facilities was highlighted as areas for improvement, particularly from the Teen, Youth, and Schools focus groups. Concerns revolved around the limited staffing leading to irregular operating hours for open swimming and the quick filling of swimming class registration slots. This was especially highlighted as a barrier to access and a disadvantage to those with less computer proficiency, notably mentioned among the Latino Population focus group. Maintenance, especially of bathrooms, emerged as a recurring issue across different groups. Many residents expressed a need to travel to neighboring towns for park enjoyment or regional competitions due to inadequate facilities within Durham Parks & Recreation.
Despite these challenges, the variety and abundance of programming received praise from all groups, with staff being recognized as significant contributors to the recreation centers’ appeal to children and families. While numerous community organizations express interest in partnership and funding, the dispersion of resources across various initiatives poses challenges. Increased collaboration and a focus on public-private partnerships stand to allow external organizations and providers with similar visions to work alongside Durham Parks & Recreation to provide a better future where residents can play more. Although partnerships could alleviate staffing shortages and provide additional facilities and programming, it was mentioned several times across groups that bureaucratic hurdles and insufficient promotion of partnerships by Durham Parks & Recreation do limit their desire to work with the department.
4 CHAPTER
THE SYSTEM
Forecasted Needs Analysis
Introduction
Level of service, benchmarking, and parks and recreation industry standards provide important metrics for guiding future growth in parks and recreation. Considered together, these metrics provide a broad understanding of current parks and recreation conditions in the City, similar jurisdictions, and nationally by providing concrete comparative numbers. This analysis provides detailed metrics and statistics that should be considered within the full context of parks and recreation services the City of Durham is offering residents. For the purposes of national benchmarking, National Recreation and Park Association (NRPA) reporting has been utilized as this organization is the leading non-profit dedicated to the advancement of public parks, recreation and conservation. Their work draws national focus to the far-reaching impact of successes generated at the local level.
This plan does not adopt any standard wholesale, but considers the full analysis, staff input and community input to help identify standards and metrics that will be meaningful points of guidance as the City grows its parks and recreation services to meet an increasing population.
Measures the Department’s current offerings. Analysis is local.
Compares measures with selected peer communities. The analysis is with specific selected agencies across the US.
Compares measures among similar jurisdictions across the US. Analysis is national.
Measures the Department’s future offerings based on projected population and growth. Analysis is local.
This analysis asks: What do we offer?
The Level of Service analysis identifies what the City is currently offering, based on the current population at the time of the review. This metric forms a baseline standard that is population-based moving into the future. The analysis answers the questions, of what is offered and how much does the City of Durham offer to the current population?
This analysis asks: What do our peers offer?
This level of service analysis compares the City of Durham against selected peer communities’ specific measures. This data provides more granularity in comparison for the City to assess its position with similar agencies or the agencies the City would aspire to be in the future.
This analysis asks: What do others offer?
The NRPA benchmarking analysis relies on the annual NRPA Parks Metrics Report to compare Durham with communities across the US that share characteristics similar to those of the city. This generates an understanding of the department’s strengths and chosen areas of expertise. Shortcomings in benchmarking may represent deficiencies or areas that have been deprioritized in favor of other priorities.
This analysis asks: What should we offer or anticipate offering in the next ten years?
National standards and best practices serve as an “ideal state” for parks and recreation in a community. These standards may account for emerging trends communities are beginning to implement. When compared with the national standards, the City sets the achievable goal for the next ten years. This analysis answers the question, what and how much should the City of Durham provide over the course of the next ten years to satisfy the needs of the projected population?
Table 4.1
Current Level of Service
Proposed Level of Service
Level of Service –NRPA Park Metrics
The Level of Service (LOS) measures how much access to parks, greenways, and indoor facility space residents have based on the park system’s current inventory and the jurisdiction’s total population. Parks and Recreation LOS metrics cannot be used as absolute recommended standards, but they can help determine deficits or surpluses within Department provisions in anticipation of the growth the City will experience over ten years. The LOS, combined with benchmarking and best practices, will provide the foundation for this plan’s recommendations of how much parkland, trails and indoor facility space the department should acquire or construct to meet the recreation needs for the future, based on population growth.
The Durham Parks and Recreation Department benchmarking analysis was completed using the following information:
• 2023 Population – 295,843
• 2033 Population Projection – 340,798
• 2,015 Total acres in park system (1737 Developed Acres / 278 Undeveloped Acres)
• 104 Miles of trails
• Total indoor recreation space – 262,231 sq. ft.
• $20,185,686 total operating expenditures in parks and recreation budget
• 207 Full Time Equivalents (FTE’s) for all park operations (136 Full Time + 71 Full Time Equivalent)
• 52 FTE staff members dedicated to operations and maintenance.
Methodology
In this Level of Service Analysis, data was obtained from the 2023 National Agency Performance Review by NRPA , the leading not-for-profit organization dedicated to park agencies throughout the United States. The NRPA obtains data from thousands of park and recreation agencies nationally and shares their information to assist park
agencies in improving their park system and meeting the needs of the residents in the communities they serve.
This analysis utilized both Durham’s data and data from the National Recreation and Parks Association to compare the two using ten metrics. The population for the City of Durham and the NRPA Parks Metrics Data are compared by studying “per 1,000 residents” rather than the total population. Some data for residents are calculated per capita and in percentages, and the overall comparison must be viewed with this in mind. The benchmark analysis used the most up-to-date information possible and is a sample of operating metrics that factor budgets, staffing levels, sports fields, and parkland data. The population segment (250,000+) was chosen for the population of Durham to compare as closely as possible to NRPA’s population data.
The level of service is a ratio that includes the current offering of parkland, trails, and facility space, divided by a portion of the current population. Parkland and trails are calculated based on a rate per 1,000 residents, and indoor facility space is based on a per capita rate, or rate per one resident. This difference reflects reporting standards created by the National Recreation and Parks Association. Numbers have been rounded to two decimal places.
parks and recreation offering = Level of Service portion of population*
(*EITHER per 1,000 population OR per capita)
This formula is used to determine the current level of service for any given population number. The current level of service is determined using the current population, and the future level of service is determined based on future population projections. This plan determines the 2031 level of service using population projections determined in the Demographics and Trends chapter.
Current Level of Service
The Department’s current level of service is summarized in the table below for selected metrics to establish a baseline level of service standard for the Department’s current and future offerings, based on the existing and projected population. This benchmarking analysis summarizes data for the following categories:
• Parkland
• Trails • Indoor Facility Space
• Finances
• Capital Improvement Budget
Staffing
It is a common tendency to believe that numbers above the median indicate positive performance and numbers below the median, deficiencies. Another common tendency is to believe that numbers below the median must be increased to the standard, while numbers above the median indicate a jurisdiction is over-providing a service or a high-performing provider. A better interpretation is to consider metrics as a representation of services the jurisdiction has chosen to currently invest. A high metric may indicate a service particularly important to the City. A low metric may indicate an area in need of additional investment, or an area that is not considered a priority. A benchmarking and level of service analysis may identify areas where the department is excelling or falling behind, but it is essential to understand the context and connections between all metrics rather than focus on one isolated fact.
Table 4.2: City of Durham Parks and Recreation inventory and current level of service comparison with NRPA Park Metric Standards
Park Land
NRPA Parks Metrics calculates acres of park land per 1,000 residents. City of Durham’s level of service for parkland is calculated using the same ratio of total park acreage within the system to the number of residents. Durham currently has 5.87 acres per 1,000 residents. This places the City between the Lower and Median Quartile of agencies nationwide according to NRPA. The City currently has 2,015 total acres in park system (1,737 Developed Acres and 278 Undeveloped acres). It is anticipated that the 278 undeveloped acres could become future park development. If that current undeveloped parkland were to be removed from the acres per population calculation, the current level of service would be 6.81 acres/ 1,000 residents which is still in between the lower and median quartile.
Greenway Trail Miles
The residents in the City of Durham currently use of 104 (103.7) miles of trails in the park system compared to 88.5 miles per NRPA’s median quartile data. Greenway trails have grown in popularity as communities recognize the recreational, transportation, and quality-of-life benefits they provide. This analysis indicates that similar to many communities across the US that are undertaking the challenging task of constructing greenway trails, the City of Durham is also actively working to continue to develop trails and connect gaps in the current network.
Indoor Facility Space
Park and recreation agencies offer various indoor facilities to their residents. According to the 2023 NRPA Agency Performance Report, more than three in five agencies offer community centers and recreation centers. Also common are senior centers, performance amphitheaters and nature centers. NRPA Parks Metrics provides a recommended level of service based on the population served per facility.
As shown in the chart above, as the City of Durham continues to grow over the 10-year planning horizon, an additional 262.5 acres of parkland would need to be acquired to continue providing the current level of service of 5.87/ 1000 population, bringing the total parkland acreage to 2,000 acres. Notably, the conversion of the current inventory of undeveloped parkland to developed parkland would exceed this amount by 15 acres. If the City would like to increase the LOS to the NRPA median of 10.1/1000 population, that increases parkland needs to an additional 1,250.52 acres for the current population and 1,704 total acres for the 2033 projected population. Adding this amount of land is not practical given land acquisition and financial constraints, so developing an alternative goal that is responsive to growth, both volume and location and needs of residents would be more beneficial to the Department, the system, and the city. It is worth noting that in Durham there are many County Open Space Parks and State Parks which do add to the amount of total acreage accessible to residents.
It is necessary to emphasize the contextualization of existing conditions and resources readily available in the local environment to make an informed decision regarding the level of service standards. Every agency possesses its own unique set of realities that may present barriers to achieving a baseline level of service. This is particularly true of Durham is constrained by a limited availability of land overall, lack of reasonably priced property for sale and development site suitability where the land is in high demand for other types of land uses. It should also be considered that as Durham grows, the City will have more challenges to acquire new parkland and the level of service will start to decline as the population continues to grow beyond the next ten years. This plan recommends the City of Durham maintain a level of service of 5.87 acres of parkland per 1000 population which would require the acquisition of 262.5 acres of parkland within the ten-year planning horizon. The City of Durham’s Comprehensive Plan recommends that 30percent of Durham’s land area be open space, the Department should also keep in mind this goal when weighing land acquisition or acceptance.
Table 4.3
Senior
Based on the analysis shown in the chart above, the City will need to add a minimum of one community center and one senior center to meet the NRPA Median Level of Service by 2033 for the projected population levels. Based on population projections, the perspective of departmental staff and community voices expressed during the engagement process, there is no doubt additional indoor recreation space is in demand. The community has expressed interest in more access to nature and outdoor education, a desire that could be met with a Nature Center. Compared to jurisdictions of similar size, the City could add one Nature Center and would slightly exceed the NRPA Median Level of Service.
While NRPA does not provide benchmarking data for indoor facility space per population, the project team has developed an industry standard based on the experience gained through working with communities across the US. The City of Durham offers a variety of indoor recreation spaces including a community center, a cultural arts center, and a senior center. The City of Durham provides 0.89 square feet of indoor recreation space per capita, which is below the benchmark median of 2.0 square feet of indoor recreation space per capita.
Based on the calculations shown in the Table 4.5, Durham needs an additional 329,454.8 sq. ft. of indoor space for the current population and will need 419,364.8 sq. ft. of additional space by 2033 to serve the growing population. The types of indoor facilities could include the facilities covered above. The additional indoor space needed to meet the recommended LOS for both the current and future population would require more than doubling the amount of space currently provided. Given the challenges discussed previously with the parkland acquisition, the Department should look for opportunities for high-impact investments that provide new facilities that are highly responsive to the desires of residents and improve the level of service.
Sports Fields & Other Park
Amenities
The number of sports fields in Durham is benchmarked with NRPA Park Metrics data. Calculations are made from the 250,000 + population categories to create a ratio to that of the current and projected population of Durham for the fields and facilities listed in the chart below.
Durham exceeds the NRPA standards for all but 1 benchmarked amenity types: synthetic turf fields. Given the
Many times, the terms “recreation center” and “community center” are used interchangeably. While the services offered at these facilities can overlap, the primary purpose of a community center is more social gathering space compared to recreational services at a recreation center. For example, community centers offer amenities like meeting rooms, classrooms, conference rooms and spaces for large group gatherings for a larger community. They could include some indoor recreation amenities like gym, basketball court etc. Recreation centers focus on indoor recreation amenities and program offerings such as indoor fitness classes, art classes or even an aquatic facility in a safe, inclusive environment.
Table 4.5
Table 4.6
Operating Expenditures
Level of Service metrics can help assess if the Department is adequately funded to manage, operate, and maintain its parks and recreation facilities. Operating expenditure includes direct and indirect costs incurred by the Department to provide parks and recreation services to the community. This includes the staff salaries, benefits, tools and equipment, repairs and replacements of materials and the actual expenses of managing a facility.
Durham has $20,185,686 in operating expenditures while the National Recreation and Parks Association (upper quartile) reports $53,898,865 which is over twice that of City of Durham. Of note, the jurisdiction category that Durham falls into for NRPA National Benchmarking is a wider range than other categories (250,000 +), this means it is in the same category as jurisdictions with up to nearly 30x the population of Durham. The City of Durham is growing at a pace that can pose difficulties for the Department to provide appropriate level of service within approved budgets and it appears that the department is underfunded for the services it currently provides and the population it is intended to serve. This plan will recommend funding strategies to help the City increase their spending capacity.
$20,185,686
Total Operating Expenditure
Operating Expenditures per Full Time Equivalent
Another metric to demonstrate the adequacy of expenditures for a park system is a ratio of expenditures per full-time equivalent employee. This ratio shows the comparison for benchmarking other agencies, not only by the size of their park or population but the cost per employee for maintaining the system.
As the chart to the right shows, Durham’s operating expenditure is $97,515 per FTE. This amount is over $14,000 more than NRPA agencies are at for the dollars per FTE in the lower quartile but over $13,000 less than NRPA agencies in the median quartile. The National Recreation and Parks Association agencies operating expenditures per FTE in the median quartile is $111,770.
$28,878,054
Total Operating Expenditure
$97,515 / FTE
Operating expenditure per FTE is a metric that inversely relates total operating expenditures to the total FTE. This suggests that either the Department is overstaffed which, based on benchmarking at the National and Peer level, is not the case or that the Department is underfunded which is supported by other benchmarking data.
Operating Expenditures per Capita
Using the same ratio calculation and the population of Durham, the per capita spending ($68.23) is about $25 per capita less than that spent for operations expenditure per capita (upper quartile) as compared to National Recreation and Parks Association ($93.16). According to the NRPA Parks Metrics data, per capita operations spending is inversely related to the population of the served which means as the population of the City increases, the operating expenditure per capita ratio reduces if the operating budget number is constant. The funding strategies recommended in this plan can assist the City in increasing investment in the parks and recreation system. An increased budget for a growing population will help the Department maintain it’s above average standing for this metric and prepare for continued rapid population growth.
$111,770 / FTE
Operating Expenditure per Acre of Parkland
The City exhibits a significant difference between their per acre expenditure for parkland when compared to the National Recreation and Parks Association per acre expenditure for parkland. Durham spends $11,617 per acre of parkland, and NRPA Agencies in the upper quartile segment spend $10,629 per acre and median at $3,970. Durham is higher per acre than the NRPA upper quartile by $1,000 and almost $8,000 higher than the median. Given that Durham has fewer acres in its systems, this result is expected as the budget is spread across fewer acres than peer agencies contributing to parks metrics data. As the parks’ use continues to increase and new parks are added to the system, the Department should expect to see a rise in expenditures related to park maintenance, additional staff and resources, and program offerings. Durham
Figure 4.1: Total Operating Expenditures
Merrick Moore Art Installation Team
Figure 4.2: Operating Expenditure per FTE
$10,629 per Acre - NRPA
Total Budget: $20,185,686 Total Budget: $53,898,865
Staff Per 10,000 Residents
The number of staff per 10,000 residents indicates the population served by the staff operating the parks and recreation services at a per capita level. Staffing is measured in Full Time Equivalents which include both full-time employees as well as part-time employees. Durham has 207 FTEs, 136 are full-time and 71 are part-time FTEs. NRPA agencies in the upper quartile report 9 staff members per 10,000 residents while Durham is slightly less with 7 staff per 10,000 residents. Durham has just over 2 more staff per 10,000 residents than NRPA agencies in the median quartile. As Durham’s population is projected to increase to 340,798 by 2033, the Department will need an additional 22 staff members to maintain current staffing per capita ratios and ensure high-quality recreation services continue to be offered. It should be noted that NRPA Parks Metrics provides the data-driven objective baseline comparison at the national level which needs to be contextualized for Durham and measured against other subjective criteria such as staffing workload, interdepartmental collaborations, contracted services, jointuse agreements, and level of expectations for quality of service. Additional staffing recommendations are suggested in the recommendations chapter.
Staff Dedicated to Park Operations & Maintenance
Comparing the National Recreation and Parks Association agencies to Durham, 46 percent of staff members on the staff of agencies in the upper quartile of those with populations of 250,000+ are dedicated to Operations + Maintenance (O+M). Durham has 25.1 percent of staff dedicated to O+M which is significantly less than the national average. Aging facilities and growing maintenance
Durham Sta Members Dedicated to Operations & Maintenance
NRPA Parks Metrics Sta Members Dedicated to Operations & Maintenance needs mean that the O+M workload will only continue to increase and while acquiring funding to dedicate to O+M is a significant portion of the equation, having enough staff to meet day-to-day needs while also tackling deferred maintenance is critical in keeping the system functioning at a high level.
Figure 4.4: Operating Expenditures per Capita
Figure 4.3: Operating Expenditure per Acre of Park & Non-Park Sites
Figure 4.5: Percentage of Staff Dedicated to Operations & Maintenance
Staffing by Time Commitment
The National Recreation and Parks Association does not provide data for the upper quartile or lower quartile for the percent of staff dedicated to various parts of running a Department. This metric will use the median population for the comparison. According to the 2023 Parks Metrics report, on average, an agency’s full-time staff dedicated their time to the following general activities:
As seen in the graphs to the right, in the areas of Administration, Capital Development and others, Durham is in line with NRPA agencies nationwide in the allocation of staff to those functions. Where there is a large difference is Programming and Operations + Maintenance where Durham’s allocation between the two is basically swapped compared to the NRPA agencies with staff dedicated to programming making up 52 percent of total staff time compared to 30 percent at the national level. This indicates that Durham is currently heavily invested in providing programming for the community, while this is not inherently good or bad, the Department should consider increasing staffing in O+M to make sure that the facilities are able to continue to offer the programming expected of the community today and in the next ten years.
Level of Service - Peer
City Benchmarking
The peer city benchmarking analysis provides a sideby-side comparison of the City of Durham’s Parks and Recreation Department and those of the City’s peer communities. Peer communities are jurisdictions that share either common or aspirational characteristics for a meaningful comparison. Yet, it is important to note – as a rule – no two peers are carbon copies of one another. Each jurisdiction and representative parks and recreation department hold qualities suggestive of unique circumstances and situations. The project team identified peer communities based on the following characteristics:
• Cities that have a population size and demographics similar to the City of Durham
• Similar park system size and similar amenities
• In-house maintenance
• Equity focused
• Richmond, VA and Greensboro, NC are part of the City of Durham’s adopted benchmark cities
Time Commitment - NRPA
Not all cities match all the characteristics but were found to be similar to or aspirational parks and recreation departments. The City of Durham has adopted benchmark cities used for similar exercises to make comparisons at a higher level. Two of the adopted benchmark cities were used in this analysis, Richmond, VA and Greensboro, NC. Additional benchmark cities were used in this analysis because they provided more related comparisons specific to the parks and recreation department.
The analysis serves to illustrate how the Durham Parks and Recreation Department is operating in comparison to other jurisdiction’s departments. Looking at comparable departments is a valuable tool for decision-making, department evaluation and goal-setting.
Results from the benchmarking analysis will inform the level of service standards recommended as part of this plan. These standards determine Durham’s needs for parkland acreage, trails, programming, operations, and maintenance. Benchmarking data is one tool for informing recommendations but cannot alone determine what is best for an individual agency. Applying local context will also assist with determining the level of service recommendations specifically tailored to the City of Durham.
Methodology
Upon determination of the peer communities, the project team distributed a questionnaire via email to each department. Follow-up emails included links to a digital questionnaire. The project team received five responses from a total of six communities included in the analysis.
The current benchmarking analysis reports peer community information at a per-population rate to normalize the data among peer communities. Durham’s performance measures are compared to the median response for each measure. It is important to point to the shortcomings of this methodology. While the survey makes every attempt to ask clear questions to solicit consistent and accurate data, the data is self-reported and thus room for error or misinterpretation is a possibility. Peer comparison should be used as “a” data point, verses “the” data point, from which to make decisions. This information, combined with responses from the community engagement process, scientific survey, and inventory and analysis should be used collectively to inform the decision-making process.
Peer Communities
Parkland & Trails
Parkland
The rate of acres of parkland per 1,000 residents indicates how much access to parkland residents have. A higher number indicates more acres per resident, and therefore, more access to parks. This number can be used as one indicator of whether a department’s provision of parkland is keeping pace with population growth and helps forecast land acquisition needs over time based on population projections.
Durham provides 6.8 acres of parkland per 1,000 residents which is below the median value of 11.8 acres/ population for peer communities. From these results, it appears Durham does not have comparable parkland per resident as peer communities.
Table 4.8
Metric Richmond, VA Lawrence, KS Madison, WI Greensboro, NC Arlington, TX Durham, NC
Table 4.9: Acres of Parkland per 1,000 Residents Among Peer Communities
Figure 4.7
Trail Mileage
Trail mileage accounts for paved trail greenways and unpaved or natural surface trail mileage. The rate of trail mileage per 1,000 residents shows generally how much access to trails residents have. A higher number indicates more trail miles per resident, and therefore more access to trails. This number indicates whether a department’s provision of trail mileage is keeping pace with population growth.
The median for trail mileage is 0.4 miles of trail per 1,000 population and Durham and Greensboro are at that amount. In comparing the median at per 1,000, Arlington and Richmond are below at 0.2 and Lawrence (0.8) and Madison (0.7) are above.
The median of total trails is 94 miles. In comparing the median for total trail miles, Durham and Greensboro are just above with 104 miles. Madison is over fifty percent over this median with 183 miles. Arlington (84) and Lawrence (85) have similar total trail miles while Richmond is the lowest with 42 miles.
Programming
This master plan evaluates two metrics relating to recreation program delivery: cost recovery and percentage of full-time equivalent (FTE) programming employees among a department’s total parks and recreation FTEs. FTEs are calculated by the total hours worked by non-full-time employees by 2,080. The result is added to the number of fulltime employees. These metrics provide information on the amount of subsidy supported by the local government, and a unit cost per FTE. When taken together, it is possible to understand the cost of delivering a recreation service.
Cost recovery is calculated by dividing the total revenue by the total operating budget. Cost recovery is often used to determine the degree to which an agency is recapturing its financial investment in programs and services through revenue generation. The lower the percentage, the less the agency is recovering through revenue and the more they are subsidizing from their annual operating budgets.
There was a range for cost recovery among the peer communities, 1 to 41 percent, and a median of 18 percent. Durham is well below the median at 7 percent. This indicates there is an opportunity to establish higher cost recovery goals for programs and services. It should also be noted that cost recovery goals are dependent upon the agency’s philosophy and inclination to offer parks and recreation services as more quality-of-life services offered to taxpayers at an affordable rate or a way to generate revenue to support the Department’s operations.
Trail Mileage per 1,000 Population
Figure 4.9
Cost Recovery
Metric Richmond, VA Lawrence, KS Madison, WI Greensboro, NC Arlington, TX Durham, NC
Table 4.10: Trail Mileage
Figure
Metric Richmond, VA Lawrence, KS Madison, WI Greensboro, NC Arlington, TX Durham, NC
Table 4.11: Operating Budget as Percentage of Revenue (Cost Recovery)
Understanding the proportion of programming FTEs among a department’s total full-time staff is a way to analyze the amount of staff time dedicated to recreation programming. The proportion is calculated by dividing the total number of FTEs dedicated to programming by the total number of FTEs for the department.
Metric Richmond, VA Lawrence, KS Madison, WI Greensboro, NC Arlington, TX Durham, NC
Operational
Expenditures
One metric for understanding how Durham’s operating budgets compare with peer communities is to compare operating budgets per total acreage maintained. This analysis provides insight into budgets for parkland and programs, maintained parkland and undeveloped parkland that could be used for future park use.
Durham’s budget per total acreage maintained is $10,386, which is almost double the median of $5,675 per acre. Richmond is similar to Durham. The remaining benchmark cities follow with large gaps from Durham and Richmond.
4.12
At 52 percent, Durham is well above the median (11percent) for percent/proportion of programming FTE’s. There is a range of percent proportion of programming FTE’s among the benchmark cities with three of them below 10 percent, one just over 10 percent, at 12 percent, and the next closest is Richmond, VA at 29 percent.
Note: Percentages may not add up to 100%, some functions may be contained within a different department.
4.13 % of Programming FTEs of All FTEs
4.14 Operating Expenditures per Total Acre Maintained
Metric Richmond, VA Lawrence, KS Madison, WI Greensboro, NC Arlington, TX Durham, NC
Table
Figure 4.11
Another metric for understanding how operational budgets compare to peer communities is calculating operating budgets per FTE. Durhams’ operating budget is $97,515 per FTE. This is above the median, $88,047, and indicates Durham is just above peer communities.
Staffing
Park and recreation agencies differ by size and population served and staffing levels do as well. Using this metric among peer communities, Durham is below the median (11 FTE per 10,000 people) and is the lowest with 7 FTE per 10,000 people. City of Lawrence did not provide the information for this metric and is not included.
4.12
Expenditures per FTE
Staffing organization further provides insight into what a department may focus on. Benchmarked communities provided the numbers of staff for:
• Operations and maintenance
• Forestry
• Administration
• Programmers
• Capital Development • Other
Metric Richmond, VA Lawrence, KS Madison, WI Greensboro, NC Arlington, TX Durham, NC
Table 4.15
Figure
Table 4.16
Table 4.17
Durham is second from the bottom for percentage of operations and maintenance staff and below the median (50 percent). This, paired with FTE per acre maintained indicates Durham should increase operations and maintenance staff.
Durham is in line with most of its peers for forestry staff as half of them have no dedicated forestry staff. Lawrence, Madison and Arlington are the only cities with dedicated forestry staff within their parks department. It should be noted that Durham has dedicated urban forestry staff within the General Services Department.
Durham is above the median (13 percent) for administration staff. However, as with all benchmarking metrics, there may be variation in how cities counted their numbers. Durham’s administration staff includes those working the front desk at recreation centers and pools and managerial staff of special use facilities as administration.
Capital development staff are needed to plan and manage renovations to existing facilities and implementation of new facilities. Given Durham has a high percentage of aging facilities and a growing population to necessitate new facilities, capital development staff is necessary. Durham is at the median for percentage of capital development staff. However, Durham has almost 300 percent more than the median of deferred maintenance and this suggests the need for more capital development staff.
Key Takeaways
The benchmarking analysis indicates that Durham’s provision and operations of parks, trails and recreation programs is in line with many peer community departments. The Parks and Recreation Department is providing parkland, trails, programs and amenities comparable to cities of similar sizes.
• The City’s acres of parkland is substantially lower than peer cities and is above the lower quartile nationally.
• The City’s residents per park is lower than peer cities. However, this metric is only useful in context with acreage and overall amenities provided.
• Durham has a much lower percentage of undeveloped parkland.
• The City provides significantly more program offerings than peer cities with 96 percent being free; that is much higher than benchmarked peer cities. There is an opportunity to maintain program focus and increase revenue if the City wishes to move in that direction.
• Durham has a slightly below-average FTE per population. However, the allocation of FTEs by work function is on par with peer cities. There is one exception; programming FTEs are 22.5 percent higher than the next highest peer city and 47.8 percent higher than the lowest peer city. This could be due to variables in how programming FTEs were calculated by peer cities.
• Durham’s cost recovery is significantly lower than all peer cities except for Richmond, VA.
• Durham’s amount of money spent on deferred maintenance as a percent of the overall budget is much higher than the average of peer cities.
• Looking at staff responsibilities, metrics indicate that Durham is more oriented towards programming from a resource perspective.
Metric Richmond, VA Lawrence, KS Madison, WI Greensboro, NC Arlington, TX Durham, NC
Metric Richmond, VA Lawrence, KS Madison, WI Greensboro, NC Arlington, TX Durham, NC
Metric Richmond, VA Lawrence, KS Madison, WI Greensboro, NC Arlington, TX Durham, NC
Table 4.18
Table 4.19
Table 4.20
Metric Richmond, VA Lawrence, KS Madison, WI Greensboro, NC Arlington, TX Durham, NC
Table 4.21
Geographic
Distribution of Parks, Facilities & Amenities
Understanding the existing geographic distribution of parkland and facilities helps identify gaps in the current level of service provided and aims to offer more recreation opportunities to areas that appear underserved. This component of the Level of Service analysis looks at where parks, recreational amenities and indoor facilities are located across the City of Durham, identifies gaps, and speculates on why gaps occur to inform recommendations for enhancing the equitable distribution of recreation opportunities.
Parkland Distribution
Looking solely at distribution of parkland in the City, analysis of parks across the City reveals that parks are generally well distributed with some minor gaps in offerings. Southwest Durham and Southeast Durham stick out as areas where there are less parks and/or facilities compared to other parts of the City. When looking at Southwest Durham, there are a lot of established residential neighborhoods which makes acquisition of land that is central to residents difficult. There are quite a few environmental features such as streams and wetlands which presents the opportunity to create a new park that is geared towards conservation, stewardship and environmental education. When looking at Southeast Durham, there’s a mix of corporate campuses, office buildings, and newer residential neighborhoods. Proximity to RTP and intensity of development activity in this part of the City also poses a challenge to land acquisition. Given that so much of the area is occupied by 9 to 5 uses and pockets of residential development, a focus on smaller neighborhood parks as well as working closely with developers to make sure land dedication or fee-in-lieu is used strategically could be a beneficial approach in this area.
Access to Parks
The Trust for Public Land (TPL), Urban Land Institute and NRPA joined hands in creating a 10-minute walk to a park campaign with a goal that everyone should be able to reach the nearest park or open space within ten minutes or half a mile distance from their home. This initiative is being embraced by parks and recreation agencies across
the US to achieve equitable access to parks, recreation facilities and programs to help residents achieve positive health outcomes related to walkability and access to spaces that encourage physical activity.
The Trust for Public Land shares a database that tracks park-related data for communities around the country. The analysis is based on census data, and it provides metrics for community-wide walkability including demographic characteristics of those living within a 10-minute walk of a park. For each park, TPL created a 10-minute walkable service area using a nationwide walkable road network dataset provided by ESRI. The analysis identifies physical barriers such as highways, train tracks and rivers without bridges, and chooses routes without barriers.
According to the 2022 TPL report, 45 percent of Durham residents are within a 10-minute walk of a park, which is below the national average of 55 percent. If this deficit were to be addressed, the City of Durham would need a dual approach of prioritizing connectivity and targeting any future expansion of the system to currently underserved areas to make parks and facilities accessible by walking which provides the following benefits:
• Increased opportunities for exercise
• Enhanced quality of life
• Expanded access for at-risk youth and low-income families
• Improved connections and social relationships among community members
Figure 4.13: Walkshed 10, 15, 20 Minutes
As shown in the 10-minute walkshed maps above, the core of the City shows better connectivity to parks and open spaces. This is partly due to the density of the older City and well-developed roads and sidewalk connections to parks. There are some parks in the southwest and northern parts of the city that provide walkable access, but the maps also show pockets with no access.
Social Vulnerability & Access to Parks & Greenways
The equitable distribution of parks, open spaces and greenways can be analyzed through indicators of socially vulnerable areas of the City mapped against the location of parks. Government investment in parks is intended to create benefits for the whole community. For example, providing places to exercise in parks creates an individual benefit for those who use the space, but provides expanded benefit to the community by improving health outcomes and minimizing health care costs that individuals with sedentary lifestyle habits tend to incur. In areas with higher social vulnerability, a park may provide a valuable resource an individual may not otherwise have access to these resources. In Durham, there is a significant portion of the population who already or would have to rely on public parks or facilities for any recreational activity from a financial standpoint – focusing on providing access to those individuals, who need it the most, would improve the overall equity of the system.
This report uses two indicators of vulnerability, both provided by the United States Centers for Disease Control (CDC): The Social Vulnerability Index (SVI) and the Environmental Justice Index (EJI). The Social Vulnerability Index combines demographic characteristics commonly used as indicators for areas considered at risk of experiencing negative social or health outcomes. Social vulnerability includes an analysis of socioeconomic status, household composition and disability, minority status and language, and housing and transportation to determine the area’s vulnerability. The Environmental Justice Index (EJI) combines data related to socioeconomic status, environmental burden, and health vulnerability to show areas that are at the highest risk of facing adverse outcomes due to their environment. The dataset for this analysis was created by
the Center for Disease Control and Prevention to assist communities after a natural disaster. This data set also has applications for community planning because it allows for the visualization and analysis of the spatial distribution of vulnerable neighborhoods within a community. Parks Planning can also aid in determining which parts of the community are most in need of future expansion or improvement of the system.
This SVI analysis is shown in the maps above. It ranks each census tract within a certain percentile which expresses how vulnerable that tract is compared to the rest of the country. For example, if a tract is in the 60 percent to 80 percent range in the maps above, the subject census tract is as vulnerable or more vulnerable than 60 to 80 percent of all other census tracts in the United States. Social vulnerability in Durham varies across the city but generally the core of the city, particularly the eastern portion of central Durham has the highest SVI score. As you move away from the core of the city, vulnerability generally decreases with some exceptions. Distribution of parks, from a purely spatial perspective, when compared to SVI shows that there is room for improvement in providing access to more vulnerable areas, particularly in the north and southwest portions of the City.
The Health Vulnerability portion of the EJI analysis was isolated to get a better understanding of the distribution of parks compared to health vulnerability. The Health Vulnerability Index assesses how many of the five most common chronic health conditions the population within the Census Tract has. For a census tract to “qualify” for an indicator the prevalence of the condition must be higher than 66.66 percent of all other census tracts. The five chronic health conditions are asthma, cancer, high blood pressure, diabetes, and poor mental health. A majority of the City has two or fewer chronic health indicators at high enough prevalence to be considered vulnerable. When comparing parkland distribution to health vulnerability, there is significant room for strategic growth of the system to provide parks or recreation facilities in areas with high health vulnerability. It is also notable that for health concerns in particular, improvements to existing facilities that allow for diversification of program offerings centered around health and wellness can also provide significant benefits to the community.
Figure 4.14: 5, 10, 15 Minute Walk
Figure 4.15: Social Vulnerability
Figure 4.17: Health Vulnerability
Planning for Growth
With growth occurring at such a rapid rate, it’s also important for this plan to assess growth trends and patterns of growth to help the department understand where in the city it needs to add focus on to make sure that, while
they are also maintaining a high level of service to its existing assets, they are also being proactive in preparing to provide services to parts of the city experiencing growth or expanding.
Figure 4.18: Health Vulnerability
Outdoor Recreation Cave Trip 2024
There are two measures used to give current information on where growth is happening and at what intensity. The first is mapping up to 12 months of rezoning cases, the second is to map up to 12 months of annexation data. The rezoning data can indicate where development intensity, and subsequently population density, is increasing. The annexation data can indicate where, directionally, the city is expanding and bringing in new land and new community members. Both maps are seen below.
The map of rezonings can be seen on the right. This analysis indicates two primary things. The first is that there is intense development activity across the city, this isn’t surprising given the city’s growth rate. This means that while preparing for growth in new parts of the city is important, maintaining and modernizing current assets to serve a growing user base for existing facilities is also extremely important. The second takeaway of note is that there is a significant intensity of rezoning cases along the southern edge of the City’s current limits, especially in the area around the existing Southpoint Mall and NC-55
as well as areas around Research Triangle Park (RTP) and Raleigh Durham International Airport (RDU).
The map of annexations can be seen in Figure 4.20. An important factor to keep in mind with annexations is that the State of North Carolina has satellite annexation laws in place for municipalities which means that municipalities can only annex land that is contiguous to their existing City limits in most cases. This means that, generally, there should only be annexation activity on the periphery of the existing boundary of the City. The analysis of annexation activity shows that the two primary growth directions are to the south and southwest towards Chapel Hill and the northern edge of Chatham County, and to the east and northeast of the existing City limits. These are areas that the Department could look into proactively to begin planning for how to serve these areas of the City that are being brought in. It is noteworthy that the area along the eastern and northeastern edge of the City has the most potential to continue further because there is more land not already incorporated into another municipality available.
Figure 4.19: Rezonings
Summary of Findings
NRPA Benchmarking results indicate that, for many metrics, the City of Durham falls somewhere between the low quartile and median data sets. While the Department works hard to maintain a high level of service, spending more resources, both staffing and capital expenses, on expanding the system as well as modernizing the system will be critical to ensure that the Department remains successful and responsive to the community.
On the topic of access, while the distribution of parks is fairly well distributed across the City, there are improvements needed to be made when it comes to access for low-income and non-white populace. This is an area where all parts of the City will have to come together to improve the system. Partnerships with the Transportation Department and Planning Department to improve access to existing facilities will be the foundation of success.
This analysis reflects that while the City of Durham has staffing levels per capita and total FTEs that are somewhere between the median and upper quartile for the
given population range, there is a need for more staffing for departmental operations. The operations and maintenance staffing levels are below peer cities and, in an aging system like Durham’s, this is an area where more staff is needed to make sure that the system can modernize while maintaining high levels of service.
While many of the Level of Service metrics revealed needs for parkland acquisition, conservation lands, and staffing, these standards should not be considered absolute; but contextualized by the Department annually to ensure that they reflect the values and guiding principles identified in this plan. The standards are meant to provide a comprehensive understanding of the system and to help the Department make smart and data-driven decisions when taking into consideration other factors such as community needs and financial realities. The standards can be changed or updated based on the changing priorities or new projects to truly reflect the needs of the community and the Department’s capacity to deliver high-quality services.
Figure 4.20: Annexations
Parks Assessment
Introduction
A critical part of the comprehensive planning process is visiting parks within the system to get a stronger grasp on the look and feel of the facilities within the system as well as note consistent areas where the system is excelling or where more work is needed.
Due to the size of DPR’s system, the planning and staff team doing the reviews decided to visit a sample of parks that were geographically and programmatically diverse. DPR selected a representative sample of parks in their system that the project team could visit and evaluate to get a general understanding of the state of the system. DPR identified and visited with the team, over 20 parks and facilities. The team used the STARS rating system, seen in Exhibit #. A map of the facilities along with a list is included on the following page.
While on the visit members of the planning team were able to consult with staff about observations and work with them to develop key themes to address.
The themes included here are intended to be a summary of the realities, opportunities and challenges observed throughout the park system. They are a synthesis of reflections and are not intended to be discrete categories nor a comprehensive list of considerations. The identified themes were:
• Signage, Wayfinding, and Connectivity
• Park System Character
• Diversity of Amenities
• Consistency and Modernity
More in depth considerations for each theme are highlighted below:
Site Visit Locations
• West Point on the Eno
• Holt School Road Park
• Whippoorwill Park
• Edison Johnson Aquatics Center
• Oval Drive Park
• Duke Park
• Walltown Park
• Old North Durham Park
• Durham Central Park
• Rocky Creek Park
• Merrick Moore Park
• Sherwood Park
• Maplewood Park
• Orchard Park
• Cornwallis Road Park
• Forest Hills Park
• Hillside Park
• Sandy Creek Park
• Grant Street Park
• W.D. Hill Recreation Center
• Lyon Park
• Weaver Street Recreation Center
• Old Chapel Hill Road Park
• Leigh Farm Park
• Piney Woods Park
• Bethesda Park
• Campus Hills Park
As part of the early inventory and analysis, the project team asked DPR to select a representative sample of parks in their system that the project team could visit and evaluate to get a general understanding of the state of the system. DPR identified and visited with the team, over 20 parks and facilities. From this visit, key themes seen across the parks visited were noted and are summarized in this analysis.
The themes included here are intended to be a summary of the realities, opportunities and challenges observed throughout the park system. They are a synthesis of reflections and are not intended to be discrete categories nor a comprehensive list of considerations.
Signage, Wayfinding & Connectivity
The project team observed that there is a lack of signage and wayfinding in most of the parks visited. Parks in Durham hold a significant amount of history and cultural significance, offering a glimpse into the community’s past and providing spaces where people can gather and celebrate a shared heritage. These parks serve as important cultural and historical landmarks that contribute to the overall identity of the city. An absence of informative signage hinders visitors’ ability to fully appreciate the
historical and cultural significance of the parks. Therefore, the opportunity exists for DPR to integrate engaging educational signage to enhance the community’s understanding and appreciation of the historical and cultural value embedded within its parks and open spaces. This will further enable the City to create inclusive spaces where residents and visitors can connect with the past, appreciate diverse cultures, and create new memories.
The absence of signage and wayfinding within DPR’s parks can pose a challenge for visitors trying to navigate and fully appreciate the amenities available. By recognizing the importance of signage – whether it be directional, informational, or interpretive – and investing appropriately in it, park visitors are positioned to orient themselves with ease, find desired destination and enable their overall leisure experience.
Although DPR has made efforts to establish a greenway/ trail network and promote connectivity between parks and recreational spaces, the project team noted that there is opportunity to continue to work toward linking the City’s parks. The North-South Greenway connects several parks like Rock Quarry, Glendale Heights, Northgate, and Duke Parks – however, it appeared to the project team that the opportunity exists to connect parks located southeast of downtown Durham like Grant Street Park to W.D. Hill Recreation Center and on to Hillside Park
Figure 4.21: Parks Assessment Sites
Durham Parks and Recreation Centennial Celebration Photo Gallery
Park System Character
• City of Durham parks, from Lake Michie to Forest Hills Park to the Grant Street neighborhood park, and many others, are characterized by gently rolling open fields, mature hardwood trees and flowing streams and lakes. This appealing visual character is a strong unifying thread across the park system.
• Durham Central Park is a unique urban space that hosts a weekly farmer’s market, food truck rodeos, concerts, and other community events. It serves as a gathering place for the community and showcases the city’s commitment to promoting a vibrant public space within the urban environment.
• DPR’s parks balance the need for programmed and undeveloped open space, frequently providing a combination of these amenities in individual parks. However, this characteristic can be detrimental to the overall park system identity, as it can lead to the perception among park visitors that the City’s parks lack individual identities and are repetitive in the amenities provided.
• There is opportunity to shape the evolution of Durham’s park system by, for example, incorporating recreational amenities, public art, and unique landscape features into the parks – thereby creating distinct characteristics that differentiate them from one another. This has the likely potential to enhance individual park identity, creating distinct and vibrant recreational spaces that resonate with the local community and attract visitors.
• The overall park system has an opportunity to adopt standards to provide consistency among park furnishings such as trash receptacles, benches, water fountains, etc.
• Much of the City’s park system can be identified through its primary monument entrance signage. The typical entry signs observed at park properties were high-hanging signs on with the DPR logo and color scheme.
Diversity of Amenities
• The City of Durham’s park system is balanced and rich in resources, yet DPR’s urban parks visited by the planning team seem to mirror one another in terms of the amenities offered.
• There is opportunity to strengthen Durham’s park system by providing s a variety of amenities and to ensure diverse recreation opportunities are provided and community recreation needs are met.
• Providing the City’s residents with access to traditionally popular recreation facilities like playgrounds, athletic fields and courts has been demonstrated. Larger community parks like Forest Hills, Campus Hills and Hillside Parks provide amenities such as playgrounds and picnic shelters, and traditional athletic amenities like sport courts and baseball/softball fields.
• Some parks, such as Orchard Park, Leigh Farm Park, River Forest Park (Mountains-to-Sea and other trail connections) provide unique features but are underutilized.
• The City’s nature-based parks’ scenic vistas, fishing opportunities, boating options, hiking trails, picnic areas, and educational aspects make them distinct and valued assets for the community. However, there are some limitations in terms of the user experience due to a shortage of recreational amenities such as dedicated gathering spaces (covered shelters, group seating, etc.) at Lake Michie. Some park visitors may perceive the picnic shelter in the Wilkins Road area of the park as unsafe as it is situated in a wooded area with obscured sightlines. The project team also observed graffiti on the shelter pad, which appeared to have been done recently.
• Spruce Pine Lodge is a unique facility available to the public to reserve for events/special occasions.
Consistency & Modernity
• The City makes concerted efforts to ensure all parks, not just the high-performing ones, are clean, free of debris, and well-manicured.
• Although they are well-maintained and landscaped, the playground structures at most of the parks visited by the project team may be beyond their useful life.
• The project team observed inconsistent use of standard construction materials across the system. There is opportunity to standardize means and methods to ensure more efficient and cost effective.
• Some playground and splashpad surfacing was worn or had holes, presenting a safety hazard.
Sustainability Assessment
Introduction
The progression of climate change has led to worsening risks and impacts to communities across the world. In North Carolina, increasing frequency and intensity of severe weather events as well as increased duration and intensity of high temperatures has put a strain on communities. Politicization of climate change has led to inconsistent and fractured responses, leaving American cities to take matters into their own hands. Taking action to reduce impacts and prevent ongoing progression of the problems has become a paramount task for cities and has become not only an environmental issue but an equity issue as well. It has become clear that disadvantaged communities that have been historically neglected will continue to suffer more as climate change progresses. Parks can have a profound impact on both the mitigation of climate impacts as well as in building longer term resilience to reduce the worsening of the situation. From an environmental perspective, it is best to think of parks as a key piece of infrastructure to improve the environment.
The City of Durham is home to an extensive range of environmental resources and assets and has made concerted efforts to protect those resources over time to prevent degradation. The City has also made efforts to increase sustainable design practices within facilities to reduce the impact of park development on the environment. The need still exists to assess the role that Durham Parks and Recreation (DPR) plays in promoting equitable environmental resilience within the City. This assessment focuses on four dimensions of environmental resilience that are relevant to the City to understand what DPR is doing in those spaces currently and what they can do in the future to improve each dimension.
Four Dimensions:
• Flooding & Stormwater Management
• Air Quality & Pollution
• Heat Impacts
• Natural Resources & Biodiversity
It is important to understand each dimension through an equity lens. In each of these dimensions negative impacts are often strongly felt the most by disadvantaged communities. Tackling issues in each of these areas
requires a balance of strategic investment and focusing on communities whose needs are the greatest and have been neglected.
Methodology
This chapter relies heavily on data from the US Center for Disease Control and Prevention (CDC) and the Environmental Protection Agency (EPA) to understand the impacts of environmental burden and climate change geographically. This dataset is known as Environmental Justice Index (EJI) and the technical documentation for this dataset has been included in the Appendix of this plan due to repeated use of the data throughout the plan.
Within some sections, there are case studies included to give additional insight on how cities across the world are using parks to make progress on environmental resilience. While parks have always been valuable tools to improving the environment, concerted efforts to use parks as a form of infrastructure to combat climate change is still an evolving practice and many communities are learning by experimenting with new projects.
Flooding & Stormwater Management
An often felt impact, particularly in urban areas, of climate change is the increase of severe weather events that cause flooding. While some flooding can be simple nuisance, flooding associated with severe storms can cause safety hazards, property damage, and disruption of services. Historically, neighborhoods that are predominantly Black have less vegetation overall and more impervious surface meaning those neighborhoods have less defense against flooding.
Parks have been proven to be great potential assets in mitigation of flooding and improvement of stormwater management. They often contain a much higher amount of pervious surface and vegetation than other development types. Across the country, more cities are retrofitting and constructing new parks that are intended to manage flood events.
An opportunity exists to evaluate the fitness of existing parks to be retrofitted in such a way that they can improve stormwater management issues in neighborhoods across the City. This would not only benefit the neighborhoods these parks are in but would also benefit DPR in terms of ongoing maintenance costs. Parks that are thoughtfully designed to accommodate flooding tend to utilize materials and design strategies that are disrupted less by flood activity reducing the financial and staffing burden on the department after major storm events.
Common design strategies include:
• Use of flood tolerant plants
• Rainwater storage systems
• Use of engineered soils in flood prone areas
• Inclusion of retention areas
Additionally, in parks that are directly adjacent to streams or rivers design strategies that can improve the condition of the streambank and the stream itself can greatly bolster the ability of natural ecosystems to function optimally.
Common design strategies include:
• Stream restoration
• Stream daylighting
• Streambank stabilization
• Floodplain restoration
When designing parks that are in floodplains or are likely to be flooded, a few critical goals should guide the planning and design process:
• Maintain access and a high quality park experience
» Floodable parks or stormwater parks are often very sophisticated leading to an inclination to keep people out of them to preserve integrity and function. These are still public spaces and community assets and they should provide high-level environmental function and high quality experience.
• Recover quickly from both large and small storms
» Through thoughtful planning and design these parks should be able to bounce back quickly from all storms. Plant and material choices play a large role in achieving this goal.
• Anticipate all risks
» Long term success of these parks requires DPR to anticipate risks big and small to ensure that the park can actually meet the needs of the City.
• Strengthen urban ecosystems
» Floodable parks and stormwater parks have to incorporate elements that create functional ecosystems and utilize nature – based solutions.
• Improve resilience at the community scale
» Resilience efforts are often undertaken at the regional level or higher, overlooking the role of individual communities in the challenge of addressing climate change. Parks are perfect tools to allow communities to champion their own environment and improve their long term resilience.
Racial/Ethnic Minority
Status
Socioeconomic Status
Social Vulnerability
Household
Characteristics
Housing Type
Minority Status
Poverty
No High School Diploma
Unemployment
Housing Tenure
Housing Burdened Lower-Income Households
Lack of Health Insurance
Lack of Broadband Access
Age 65 and Older
Age 17 and Younger
Civilian with a Disability
Speaks English “Less than Well”
Group Quarters
Mobile Homes
Air Pollution
Potentially Hazardous & Toxic Sites
Environmental Burden
Health Vulnerability
Built Environment
Transportation
Infrastructure
Diesel Particulate Matter
Air Toxics Cancer Risk
National Priority List Sites
Toxic Release Inventory Sites
Treatment, Storage, and Disposal Sites
Risk Management Plan Sites
Coal Mines
Lead Mines
Recreational Parks
Houses Built Pre-1980
Walkability
High-Volume Roads
Railways
Airports
Water Pollution Impaired Surface Water
Asthma* Cancer*
Pre-existing Chronic Disease Burden
Blood Pressure*
Diabetes* Poor Mental Health*
Table 4.22
Currently 33/75 of DPR’s parks and facilities are at least partially within a floodplain. Those parks are denoted in Figure 4.23 below.
When overlaying parks within the floodplain with the Center for Disease Control’s (CDC) Environmental Justice Index (EJI), parks that are candidates for both environmental uplift and improving equity outcomes are denoted in Figure 4.24 below.
Figure 4.23: Parks in Floodplain
Figure 4.24: Parks in Floodplain w. EJI
The CDC publishes the EJI which uses data from the U.S. Census Bureau, the U.S. Environmental Protection Agency, the U.S. Mine Safety and Health Administration, and the U.S. Centers for Disease Control and Prevention to rank the cumulative impacts of environmental injustice on health for every census tract.1 Data used in the EJI can be seen in Table 4.22.
All new parks in or directly adjacent to floodplains should be designed to maximize environmental uplift using the strategies highlighted above. While these types of parks are often more sophisticated and require more funding and involvement, their benefits are well worth the additional investment. Funding strategies for environmental resilience projects are discussed at the end of this chapter.
The strategies discussed above apply primarily to parks that are either being newly designed and constructed or undergoing entire retrofits. There are opportunities to improve other parks using Green Stormwater Infrastructure strategies (GSI) that can pose less of a burden on the Department.
Green Stormwater infrastructure is a type of stormwater management that tries to protect, restore, or mimic the natural water cycle. Green stormwater infrastructure combines elements of the natural environment and traditional stormwater drainage systems to improve water quality and restore ecosystems.2 GSI can supplement or replace traditional gray stormwater infrastructure. These strategies vary in size and scale of impact and can easily be introduced into a park well after the initial design and construction of the park. Because the size of these can vary, design and installation of GSI can also be incorporated at various cost points, allowing the Department to realize benefits without having to overextend financially.
Common GSI elements in parks can include:
• Bioretention cells
• Stormwater Cisterns
• Native planting beds/areas
• Green roofs on structures
• Permeable pavement
• Installation of other stormwater control measures (SCMs)
While many of these strategies are similar to strategies seen in larger scale projects discussed before, these strategies don’t require large scale planning and design efforts and can be undertaken more spontaneously and with less funding. All existing DPR parks, regardless of their proximity to a floodplain should be evaluated for potential to install additional GSI measures within the park.
Case Study
The Mississippi Watershed Management Organization constructed a Stormwater Park and Learning Center in Minneapolis that serves as a living laboratory for green infrastructure3. This park provides numerous benefits both to users and the environment through intentional design and integration of GSI. The park features a short walking trail to the Mississippi River, a large landscape that is densely planted with integrated GSI features and a learning center that hosts educational programs and also serves as a community meeting space. The design goal for the park, one that it achieves, is to ensure that not a single drop of rain that falls on the site makes it into the adjacent Mississippi River. All of the water that falls on the site is captured, filtered, and absorbed into the ground.
The Learning Center Structure integrates the following sustainable design features:
• Solar Array
• Passive Solar Design
• SIP Panel Construction
• Geothermal System
• Green Roof
These features combined, reduce operating costs, dependence on non-sustainable energy sources, and increase long term resilience to climate change and its impacts. These features also serve an educational purpose and make the community more aware of sustainability while also promoting their benefits to parks in particular.
The grounds are also designed with sustainability at the top of mind and feature:
• 4,000 Gallon Cistern
• Tree trenches
• Permeable pavers
• Rain Gardens
• Test basins for water treatment
All of these features work hand in hand to reduce the sites development impact but also increase the site’s resilience in normal and harsh weather events. Developing sites in this way can reduce long term maintenance costs after storm events, especially for sites in a floodplain.
Air Quality & Pollution
A major impact felt by people worldwide as a result of climate change is worsening air quality due to pollution. While there are areas in the world that feel this impact much more acutely than others, the impact is global and parks can do a great deal to improve air quality within communities.
According to the EPA, over 100 million people in the US live in areas with poor air quality. This number is expected to rise as human impacts on the climate continue. Parks have a demonstrated capability to improve air quality in a multitude of ways, particularly in urban areas. Vegetation in parks can absorb pollutants and reduce emissions of pollutants and formation within the soil. This vegetation can also reduce air temperatures and building energy use in proximity to parks, this not only saves energy but reduces the burden of building systems to filter air and improve indoor air quality.
Careful consideration of planting palette remains important in this area as some trees can emit volatile organic compounds (VOCs) which contributes to the formation of ground level ozone and carbon monoxide. It’s also important to ensure that existing trees are kept healthy and properly cared for to maximize their benefit to the environment; large and established trees have the greatest positive impact on the environment. Including a variety of land cover, in terms of plantings, provides the greatest benefit to both improving air quality and providing the optimum physical comfort of visitors. A balance of deciduous and evergreen plantings can also provide for year-round benefit to air quality.
Looking specifically at Durham using data from the CDC, areas of the City that experience high levels of air pollution can be seen in Map 03 below. The CDC data reveals that aside from the northernmost and easternmost edges of the city, the entirety of the City is as or more vulnerable than 50-75 percent of all other census tracts in the Country in regard to air pollution. The highest areas of pollution according to this data are primarily within the core of the city between 85 and 147 as well as around Duke University and Research Triangle Park (RTP).
An additional indicator related to air pollution; Air Toxics Cancer Risk can be seen in Map 04 below. This indicator looks at lifetime cancer risk from inhalation of air toxics. Mapping this data shows highest vulnerability around Duke University and north of Hillsborough Rd. It also shows that most of the inner core of the City as well as
areas south along Hope Valley Road and east of RTP also have elevated levels of risk. In reviewing this data, it becomes clear that there is a two-pronged approach that could be taken to more effectively use parks as tools to improve air quality. The first is the evaluation and maintenance of existing parks in areas burdened with higher air pollution levels to increase the benefits of those parks to the community. The second is the strategic expansion of the system to include heavily vegetated parks in areas that have high pollution levels but no existing
parks. From a programmatic perspective these parks would be extensively vegetated and have more passive programming and environmental education.
An impact of climate change already felt often, particularly in the south and southeastern US is extreme heat impacts. Higher temperatures have extended to cover more of the year and temperatures, in general, have increased. Heat impacts, like so many other impacts of climate change, tend to impact disadvantaged communities more acutely.
Figure 4.25: Air Pollution Vulnerability
Figure 4.26: Air Toxic Cancer Risk
These communities tend to have older housing stock with less efficient cooling options and less vegetation in the form of street trees, parks, and other natural features that naturally reduce temperatures.
In communities like Durham, heat is intensified by the Heat Island Effect. Heat islands are urbanized areas that experience higher temperatures than outlying areas. Structures such as buildings, roads, and other infrastructure absorb and re-emit the sun’s heat more than natural landscapes. Daytime temperatures in urban areas are about 1–7°F higher than temperatures in outlying areas and nighttime temperatures are about 2-5°F higher.
In addition to creating an uncomfortable environment, sustained exposure to higher temperatures is associated with adverse health effects including such as heat stroke and heat exhaustion. Indirectly, heat also tends to keep people indoors more than outdoors which also reduces mental and physical health and wellness.
Once again, parks have a role to play in mitigating these negative impacts. Creating new parks can enhance and expand the urban tree canopy which is associated with a reduction in temperatures. Design features including
pools, spraygrounds, misting stations, and others can also help reduce impacts and make parks more comfortable for users during high heat periods. As with the other areas discussed in this report, realizing the benefits of parks in this area entails maintaining and upgrading existing parks to include more vegetation and design features that have cooling impacts. In this area, expansion of the system through the development of new parks can provide cooling impacts in more neighborhoods in the City. Targeting this expansion in neighborhoods that are lacking in open space and vegetation can also address inequities.
A metric that can help predict heat impacts is assessing urban canopy coverage. Durham’s Tree Land Cover can be seen in Map 05 below. As seen in the map tree cover is more sparce in Downtown and the areas northwest and directly east of Downtown. There are also noticeable gaps in and around Duke University’s campus as well as directly south of Downtown. While many of these gaps correspond with development activity, strategic expansion of the park system into some of these gaps, particularly in neighborhoods can have positive impacts on residents.
Figure 4.27: Urban Treen Canopy Cover
Durham Parks and Recreation Centennial Celebration Photo Gallery
Natural Resources & Biodiversity
Natural areas and open space are vital assets to communities both culturally and environmentally. For those living in urban areas like Durham, these spaces provide refuge from the more intensive aspects of urban life and have community-wide and regional draw.
From an environmental perspective, natural areas or conservation areas protect critical ecosystems and maintain biodiversity. These areas can reduce and mitigate strain that the urban environment can pose on the natural environment.
Durham is home to conservation areas that also function as parks including the Eno River State Park which is managed by the State Department of Parks and Recreation as well as West Point on the Eno which is managed by DPR. Both parks are highly valued destinations within the parks system and provide significant protection to natural resources like the Eno River.
Developing conservation focused parks and open space comes with many benefits for both the environment and parks and recreation agencies. As discussed above, these parks and open spaces can provide a buffer between urbanization and ecosystems. From an operational perspective, conservation focused parks and open space can require less planning and design efforts as well as less capital expenditures to turn the spaces into places for people. Many times the most appropriate program for parks and open spaces like these are a series of trails and some architectural infrastructure such as restrooms or maintenance facilities. That’s not to say these types of parks require no investment, rather that the magnitude compared to a Downtown park or a larger community park can be smaller.
Opportunities to expand conservation are found in a multitude of scenarios. Some communities acquire land piecemeal over time adjacent to natural areas to expand conservation areas. An additional consideration is to increase collaboration with the development community and have any dedicated or reserved land for open space within a development be adjacent to or near any on or off site sensitive environmental features. In the future DPR should maintain a seat at the table in reviewing de-
velopment plans where the opportunity exists to expand any City-owned conservation areas or conservation areas that the city has identified as prime for the expansion of DPR system.
Looking beyond the identification and protection of land, reducing strain on natural resources and improving biodiversity can also be accomplished in all DPR Park Projects. Establishing and maintaining sustainable planning and design best practices within the department can also make impacts in the areas of protecting natural resources. Reducing use of non-renewable resources and materials that cannot be sustainably harvested or produced can reduce DPR’s footprint. Establishing expectations related to the use of sustainable materials can reduce negative impacts locally and globally. Within these design standards, incorporating expectations regarding the use of native plants in DPR projects can also increase the positive impact of projects on biodiversity. The incorporation of larger quantities of native plantings has been shown to support biodiversity. Plants can provide food and shelter to pollinators and other small animals which in turn support other plant and animal life. Urbanization’s impact on biodiversity can be profound as natural areas are destroyed and large scale introduction of non-native or invasive plant species can occur. Ensuring DPR projects can mitigate these impacts to any extent can greatly increase the environmental benefit that DPR has on the community.
Brownfields & Contamination Mitigation
A challenge for parks, especially those in urban systems, is that land available for park development can have a history of uses, known and unknown, that have led to site contamination. Records regarding land use over time can vary in terms of quality and availability, making it difficult for agencies to have a full picture of the history of land they are developing on.
Durham, specifically, has encountered this issue during this planning process. In early 2023, five parks were identified as having potential lead contamination above EPA guidelines. All of these sites are referred to as pre-regulatory landfills, meaning they were likely contaminated by improper handling of waste. Sites like these are referred to as pre-regulatory landfills, meaning the sites were used as landfills before any regulation regarding what could be disposed of and how it was to be handled.
While instances like these are alarming to the community, encountering site contamination is not uncommon and doesn’t necessarily preclude park development on contaminated sites. In fact, parks can often remediate contamination through intentional planting strategies. This allows for expansion of the system using fallow land while also providing uplift to contaminated sites.
Following thorough site investigation, if contamination is identified there are a multitude of strategies that can allow the land to continue to be developed for parks purpose. These strategies include excavation, dredging, removal and treatment, and phytoremediation. The first three strategies allow for removal of contamination immediately and new soil is brought in or the contaminated soil is treated and returned to the site. The final
option, phytoremediation, is unique because in addition to allowing for the removal of contamination it can also provide unique placemaking and education opportunities.
Phytoremediation is a strategy that utilizes plants and their natural processes to remove contamination from the soil, break it down, and dispose of it through. Plants can fix heavy metals, such as lead, in their roots and their tissues to break it down. This strategy works best with low to medium amounts of contamination. A diagram highlighting the phytoremediation process can be seen in Figure 4.28 below.
A notable example of phytoremediation in a public park context is Gas Works Park in Seattle, WA. Gas Works Park is a 19 acre park on the site of the former Seattle Gas Light Company gasification plant. The City of Seattle and Washington State, through the master planning efforts, decided to promote and invest in phytoremediation strategies to clean up on site contamination in both soil and along the shoreline. Contaminants that will be treated by this process include arsenic, carbazole, dibenzofuran and nickel. Once completed, the State and Federal Governments have determined that these areas of former contamination, including water adjacent to the site, should be safely accessible.
Figure 4.28
Funding Strategies
A challenge to the development of any park project regardless of whether or not they seek to address specific environmental issues is funding. Luckily, for parks that do seek to provide environmental uplift, additional funding sources do exist that DPR can apply for to reduce the strain on their budget. Several major funding sources are highlighted below.
• Safeguarding Tomorrow through Ongoing Risk Mitigation (STORM) Act Funding
» This federal funding source is made available by FEMA and is intended to fund projects that can mitigate identifiable risk and improve resilience. The funds can support low-impact development, wildland-urban interface management, conservation areas, reconnection of floodplain and open space projects. These are low interest funds that give states and local governments to respond to environmental risk without having to wait for a disaster to strike first. This funding can be accessed by the state and distributed to local governments, so projects seeking this funding would likely entail partnership with the State.
• Clean Water Section 319
» This is also a federal funding source that supports the implementation of programs that manage nonpoint source pollution. This funding source does require a match (40%) but can significantly reduce financial burden. Similarly to the STORM Act Funding, this funding is given to the state and disbursed to local government through a project solicitation process. In each state, a significant portion of funding goes to local watershed projects that control stormwater runoff. Many projects feature green and nature-based approaches such as rain gardens, bioswales, permeable pavement, and streambank restoration.
• Building Resilient Infrastructure and Communities (BRIC)
» BRIC funding is intentional in shifting focus away from reactive disaster spending to funding resilience improvements through nature-based solutions. BRIC is particularly interested in evidence-based investment and innovation approaches with enhanced partnerships. This funding stream is made accessible to state governments, unlike
the previous sources reviewed, however, local governments can be sub-applicants for the review process.
• Five Star and Urban Waters Restoration Program
» This funding is offered by co-sponsors, the EPA and the Urban Waters Federal Partnership, to develop community capacity with modest financial and technical assistance to diverse local partnerships for urban restoration and education programs. This program requires higher match from communities (50-75%) but can allow access to technical assistance as well as funding. Previous projects have focused on streambank stabilization, stormwater management, urban tree canopy restoration, and projects to prevent waste in waterways.
• EPA Brownfield Grants Program
» This multi-faceted grants program administered by the EPA provides funding to support communities in efforts to prevent, assess, safely cleanup, and sustainably reuse brownfield sites. Grants are provided for assessment, cleanup, revitilization, and job training.
• North Carolina Parks and Recreation Trust Fund (PARTF)
» While not entirely focused on environmental resilience, the State PARTF grants provide much needed funding to local parks and recreation agencies for the improvement of parks systems statewide. Durham has successfully applied for two PARTF grants in the past.
• Land and Water Conservation Fund (LWCF)
» LWCF Funding is federal funding intended to protect natural areas, water resources and cultural heritage, and to provide recreation opportunities to all Americans. The LWCF State and Local Assistance Program has funded more than 46,000 projects and has provided funding to every county in the country. In 2020, the LWCF was awarded with $900 million annually to continue to fulfill their mission. While grants are not limited to projects focused on resiliency, these types of projects are eligible for LWCF funding.
Gas Works Park, Seattle
Introduction
Durham’s 154-year history has been rich with innovation and advancement, from its agricultural and industrial period in the early 1800s to its present-day title of the “City of Medicine” with a bustling healthcare industry. The City is also known for its higher education community and proximity to Research Triangle Park, a premier high-tech research and development park. Despite the rise of Durham as a hub of innovation in health and life sciences, the City’s history like many U.S. cities, reflects a history of systemic racial discrimination.
The City of Durham Parks and Recreation Department is celebrating 100 years at the time of this report. Over the course of its lifespan, the Department has grown in the amount of land it activates and maintains, the full-time and part-time staff members, the thousands of programs and facilities it offers, and the hundreds of thousands of community members it serves. As Durham continues to grow, so does the diverse needs and desires of its residents. The Department is in a prime position to build upon its legacy by making intentional steps to repair any past harms and plan its growth and development in a way that it creates no new harms. It is important to note that the Department is not going through a unique scenario.
Urban areas and cores around the country are growing at a substantial rate, many of whom have still not begun to address previous discriminatory practices. The benchmark and example communities provided within this chapter give insight into how others are putting policy and action into place. These examples all show one incredibly important part of building a truly equitable community: interdepartmental and public-private partnerships are essential to assuring that the community progresses forward together with no one getting left behind.
Hayti, a historically Black neighborhood, was heavily impacted by redlining and later urban renewal projects, which displaced many residents and dismantled thriving Black businesses. The Durham Freeway construction in the 1960s further disrupted redlined Black communities, leading to displacement and loss of generational wealth.
Redlining, the national practice of banking institutions unfairly designating neighborhoods that housed Black, brown, and low-income people as “undesirable”, also occurred in Durham.1 Redlining has had lasting effects on housing segregation, wealth inequality, and access to resources in Durham, issues that are still being addressed
Figure 4.30
Figure 4.31
today. When placing a map of available park places on top of the redlining maps, these neighborhoods also have fewer parks and recreational facilities than other areas deemed as “desirable”. Even today, very few parks are located within an area that was deemed a “Fourth Grade” neighborhood and many parks are near or right on the line of where another, higher grade neighborhood begins. Though the practice is now outlawed, dsciminatory planning practices like redlining have a lasting effect on today’s park system.
When planning, it is essential to look to history to assess what has built the foundation of the community. Since its inception in 1924, the Department has seen several societal changes regarding race, housing, recreation, and transportation throughout the County. It has also seen changes within its programming and history over the past 100 years. Twenty-three years passed between the Department’s founding and the building of the first African American Recreation Center, W. D. Hill, in 1947. It was not until 1954 that Director C.R. Woods stated, “The Recreation Department’s activities now cover all sexes, races, and ages.”2 For the first thirty years of the Department’s operations, events, programming, and services were not provided fairly to all people. However, since acknowledging and understanding past harms, the City and the Department have ensured that Durham Parks are for all. The Bimbé Cultural Arts Festival is nationally recognized and has just celebrated its 54th anniversary. Fiesta Latina brought hundreds of residents to Durham Central Park this year to dance, eat, and celebrate Latin culture. Specialized Recreation programs like Let’s Go to the Movies! and the Buddy Sports programs are for residents with disabilities to come together in recreation and fellowship.
From newborns and toddlers to active seniors, programming is available and intentional across all age groups. The Department has taken measures across the board to ensure that the past 70 years have been inclusive and evolving as the community continues to grow more and more diverse. The Department has also unveiled language support software that has assisted in providing translation services for all those who engage in parks and recreation. Additionally, the Department has also invested in personnel specifically for outreach, engagement, and language translation services.
Discrimination and unfair practices can create “gaps” in the social framework of a community. Previous inequitable planning practices were wrong, and new practices can
2 “History of Durham Parks and Recreation .” Durham Parks and Recreation Department n.d. https://www.dprplaymore.org/442/History-ofDurham-Parks-and-Recreation.
help to build strong framework, that repairs past harms through intention and fairness. Durham’s history has been many things to many different people and groups; some members have experienced great wealth and others, great hardship. Knowing this, how can we create this plan to ensure that now and, in the future, the Durham Parks & Recreation experience is truly fair and equal for all?
Definitions Equity
The City of Durham’s Equity & Inclusion Department defines equity as “Justice, fair treatment, and opportunity for the advancement of all people across all systems (workforce, housing, education, economics, healthcare, environment, social and community)”. When examining equity through a parks and recreation lens, the Durham Parks and Recreation Department aims to understand its existing system, including the facilities and programs it provides, the quality of those offerings, and who has access to and can participate in them.
Inclusion
The City of Durham’s Equity & Inclusion Department defines inclusion as “authentically bringing traditionally excluded individuals and/or groups into processes, activities, decision making and policy making creating a true sense of belonging and the ability of everyone to engage and contribute authentically.” When applying this definition to the Department’s mission of connecting our whole community to wellness, the outdoors, and lifelong learning, the Department aims to be intentional with creating programs that cross barriers and build connections amongst its staff and the community as a whole.
Displacement
Although it may be more typically associated with housing, the topic of displacement is important to be addressed within this plan. Displacement is defined by Planetizen as the involuntary relocation of current residents.3 It can result from several possible scenarios: foreclosure, eviction, rent increases, property tax increases, and negligent landlords. In the past, slum clearance, urban renewal, interstate highway system construction, like Durham’s own Interstate 147, and stadium construction created waves of displacement, sometimes as the direct intention of urban planning projects. So, how does displacement 3 “What Is Displacement?” Planetizen n.d. https://www.planetizen. com/definition/displacement.
relate to parks and recreation? It has been proven through numerous scholarly review articles that public infrastructure improvements like highways, sidewalks, roads, and parks, can inadvertently cause displacement. In the recently approved Charlotte Future 2040 Comprehensive Plan, the City of Charlotte notes that “The creation of new local roads, trails, parks and open space in an area that lacked them can also signal to the private sector (individuals, families and the development community) that an area is ripe for investment. This can also lead to gentrification and potential involuntary displacement.”4 This does not suggest nor mean that desperately needed public improvement and park facility projects should be neglected or canceled, but instead provides insight on the need for intentional public-private partnerships and community outreach around the common goal of increasing quality of life while ensuring residents maintain the ability to reside in their community without burden.
Displacement Trends
Displacement is occurring around the world. On a global scale, the UN High Commissioner for Refugees notes that one in every sixty-nine people are now being forcibly displaced, whether through weather events, economic means, or militarized conflict.5 Focusing in more locally, during the 2022 presentation of MDC’s State of the South , it was noted that from 2012 to 2022, Durham’s predominantly Black neighborhoods saw Black displacement rates of 10 - 37%.6 Durham’s rental listings increased in price by 35% since 2017 and at least 75% of evicted tenants within the City were Black, Indigenous, or people of color. The remainder of this chapter will go into the details of how parks and recreation can increase a community’s equitable experience and provide a space for fellowship, fairness, and unity.
The Role of Parks
The role for parks and recreation in furthering equity and inclusion is unique in that access to the great outdoors and green areas has been proven to be essential to a healthy lifestyle. The Department is in the fortunate position to be providing a valuable resource, and therefore
4 “Anti-Displacement Tools and Strategies.” Charlotte FUTURE | City of Charlotte 2040 Comprehensive Plan n.d. https://www.cltfuture2040plan. com/content/5-anti-displacement-tools-and-strategies.
5 “Global Trends .” United Nations High Commissioner for Refugees UNHCR USA n.d. https://www.unhcr.org/us/global-trends.
6 “Framing Conversations of Gentrification in Durham .” Dataworks NC n.d. https://dataworks-nc.org/wp-content/uploads/Framing-Conversations-of-Gentrification-in-Durham-MDC-State-of-the-South-2022.pdf.
has the responsibility to ensure that everyone can access that resource. No matter their economic or cultural background, in an inclusive and equitable society, everyone should have access to green spaces and recreational programming.
DPR’s Role in Creating an Inclusive Environment
As a National Recreation and Park Association (NRPA) Commission for Accreditation of Park and Recreation Agencies (CAPRA) accredited department, Durham Parks and Recreation has met and exceeded national standards for how a parks and recreation department and overall system should operate. To be awarded CAPRA accreditation, the Department demonstrated compliance with many national standards, including fostering an inclusive environment. Specifically, the accreditation process required the Department to demonstrate their outreach to diverse, underserved populations. According to CAPRA the agency:
The agency shall proactively extend programs and services to residents who may be underserved in the community. To encourage participation in parks and recreation programs and services, agencies shall identify and address barriers that may limit access as demonstrated by the demographic profile of the community. Agencies should offer inclusionary support services to ensure access to programs and services for people of all abilities and all socioeconomic status.
The Department has instituted and maintained hundreds of programs at a low cost, removing a cost-barrier to allow for inclusive play across socioeconomic backgrounds. Several mature adult sport leagues are provided throughout Durham, including some walking clubs and sports leagues led by partner agencies at Durham Parks and Recreation facilities. The department has also created several programming opportunities to allow for children and adults with disabilities to congregate and play. These include:
Buddy Sports Programs
• This is a basic sport skills program offering opportunities for children with and without disabilities to learn and play together. Social skills, teamwork, coordination, and balance are promoted while sport skills are taught.
Challenger Flag Football
• The Challenger athletic programs offer opportunities for athletes with diverse disabilities to gain important skills while participating in sports. The program focuses on improving social skills, teamwork, and athletic skills through practices and games. This program is supported by a grant from Carolina Panthers charities.
Bingo
• Bingo is offered on Mondays and Thursdays at noon in a hybrid format. Residents can play online or in person at the Community Family Life & Recreation Center at Lyon Park.
Name that Tune
• Virtual Tuesdays This program is designed for individuals with disabilities, but all are welcome to participate. Residents are asked to show up ready to play by listening, guessing, and singing along to their favorite songs.
Dance the Night Away!
• On the first Friday of each month, the Department hosts a dance party . This program is designed for individuals with disabilities, but all are welcome to participate.
Let’s
go to the Movies!
• On the third Friday of each month, the Department hosts a movie night. This program is designed for individuals with disabilities, but all are welcome to participate.
The Department also goes out of its way to create an inclusive environment for Spanish residents. Through intentional hiring, the Department has created a diverse staff with Spanish speaking staff assisting with various matters including daily operations, swimming lessons, customer service, outreach, and community engagement.
From the focus groups, it was made clear that there are still areas for improvement regarding equity. Members of the community mentioned that although there are Spanish speaking staff members to assist with language interpretation in person, many of the program registrations are online and can be confusing to navigate. This has caused the Spanish speaking population to feel excluded
from some of the more popular programs like swimming lessons. The focus group meetings also revealed that although there are inclusive special programming efforts, they are often primarily attended by able-bodied children, meaning there is a disconnect in sharing these services and events outward to the populations that need them. Although the programming offered by the Department is incredibly affordable for many, staffing and operations shortages mean that the offerings have limitations and capacities that are often met quickly, leaving many children and adults without recreation opportunities within their price range.
From an operational standpoint, the Department may also want to increase its training opportunities for staff to engage with diverse populations with a variety of needs. This can include adding language training, accessibility training, conflict resolution training, and other opportunities to create a more well-rounded staff.
DPR’s P.U.L.S.E. Board
In 2023, DPR created an internal staff advisory board comprised of employees who are below the Manager level. This board, P.U.L.S.E. (Peers United in Leadership, Service, and Equity) Board, brings a unique perspective to DPR management on ongoing strategies and challenges.
The Board’s three mission pillars are Personal and Professional Development, Sharing Perspective, and Demonstrating Impact. Through these focus areas, P.U.L.S.E. seeks to embrace and take action on diversity and inclusion throughout all of DPR’s work. P.U.L.S.E. provides personal and professional development and encourages innovation to deter complacency and resist the status-quo while strengthening the culture of diversity and inclusion within DPR.
Thus far, the P.U.L.S.E. board has focused on establishing engagement guidelines, developing ways to acknowledge and elevate staff, and refining and sharpening DPR’s brand to improve perception within and outside of the organization.
DPR’s Role in Creating an Equitable Environment
To continue to create a more equitable Durham, the Department must ensure that they continue to plan for all groups to be able to access their facilities and pro -
grams without any barriers (physical, location, regulatory or financial). It should be noted that the Department of Parks and Recreation (DPR) is one of Durham’s 29 departments that provide services to the community. The Department’s approximate $21 million budget for FY2024-2025 is roughly 3% of the overall $668 million City budget. Of that budget, $16,627,301, or 79.15% is appropriated to Personnel Services, while $3,331,785, or 15.9%, is appropriated to the Operating budget.
This chapter will delve into concepts and examples regarding anti-displacement strategies that may seem lofty and broad for a singular department within a complex organization to accomplish. Budget constraints and limited staffing can create significant challenges in providing equitable and inclusive parks and recreation services. Furthermore, initiatives such as anti-displacement strategies can only succeed when embraced as a collective responsibility across all departments, political affiliations, and decision-makers. This collaborative approach must ensure that inclusion and equity are integral to Durham’s broader vision and shared commitment.
Assessment Tools
Creating a metric to assess the equity of a proposed project is essential to ensure that the Department can determine which processes have met, fallen below, or exceeded its goals of creating a just and fair community. Creating tools for assessment is also essential for the community to be able to hold the Department accountable to the promises that it has made. In 2021, the City Manager’s Office approved of the City of Durham’s Racial Equity Action Plan, which aims at ensuring racial equity throughout all City plans, initiatives, programming, and funding. Within the plan, Goal Number Three is to introduce methods that support equitable decision-making. The Racial Equity Decision Making Tool poses a series of eleven questions that should be asked when embarking on new development and investment. When reimagining this tool through a parks and recreation lens, it is not to revise the questions within the Racial Equity Decision Making Tool, but to further question and assess the equity of new green development through a series of questions that look directly at the equity of Parks and Recreation programming and facilities.
Recognized as a credible and extensive study by the National Recreation and Parks Association (NRPA), the Greening in Place: Protecting Communities from Dis-
placement Nationwide Toolkit, published in October 2020, provides public agencies and developers with the tools needed to initiate equitable green development and combat the displacement impacts that green investments like public parks and open spaces can raise.7 Greening in Place provides an assessment of the displacement risks associated with green investment, offers a framework for equitable green development, presents case studies, and provides a range of policies and strategies that public agencies can implement.
Many of the proposed strategies are outside of the scope of the Durham Parks and Recreation Department but provide a holistic view of how vital it is for every department, every public-private partnership, and every adjacent non-government organization to take part in creating an equitable and inclusive community.
Also recognized by the NRPA are the Parks-Related Anti-Displacement Strategies (PRADS) established within the Greening without Gentrification: Learning from Parks-Related Anti-Displacement Strategies Nationwide report which analyzed 27 major park and open space projects around the country to see what, if any, anti-displacement strategies were put in place.8 These projects included the BeltLine in Atlanta, Georgia, Unity Park in Greenville, South Carolina as well as the 11th Street Bridge Park in Washington, DC. The report divided the duties of these strategies amongst the community which they labeled as beneficiaries (homeowners, renters, businesses, and jobs) and implementers (private sector housing developers, non-profit and public housing organizations, and public park funding agencies).
Many of the PRADS are inapplicable to Durham Parks and Recreation as they are broad in nature. The following PRADS, however, can be implemented within the recommendations of this plan and possibly for the proposed redevelopment projects at Long Meadow, East End, and Merrick Moore:
7 “Introducing ‘Greening in Place: Protecting Communities from Displacement’ An Anti-Displacement Guide for Green Infrastructure Development.” Audubon Center at Debs Park n.d. https://debspark. audubon.org/news/introducing-greening-place-protecting-communities-displacement.
8 Rigolon, Alessandro, and Jon Christensen. “Greening without Gentrification: Learning from Parks-Related Anti-Displacement Strategies Nationwide.” UCLA Institute of the Environment and Sustainabilityn.d. https://www.ioes.ucla.edu/wp-content/uploads/Greening-without-Gentrification-report-2019.pdf.
Racial Equity Decision-Making Tool Parks and Recreation Equity Assessment Tool
1. What is being considered? What are the desired results and outcomes?
What is the intention of this park project? Is it to bring a new facility or program to an area that hasn’t experienced it before? Is this an improvement unto an existing program or facility?
Who has participated in this program/facility before? Are there any new groups who will be able to participate in this program/ facility with this project?
2. What is the data? What does the data tell us? Who will this benefit? Who will it burden?
What do we know to be true of this area? Are there any other projects where engagement occurred within this community? Can we access the feedback given?
Who will benefit from this project? Is there sustainable staffing and budget to provide care for the project with a continuous funding stream?
Have we tried to remove barriers from the engagement process?
3. Have we heard from the whole community? What does the community want?
Have we heard from communities that we know are disadvantaged or have not been heard from in the past?
Does this decision align with broader organizational or community equity goals?
Does this decision support our long-term vision for racial equity?
4. What are the unintended consequences? What are our strategies to mitigate harm?
How have we worked to understand all unintended consequences of park development, including a displacement scenario?
How will we ensure transparency in how decisions are made and who is making them?
How do we measure or track impact after a project has been completed?
5. How will we hold ourselves accountable?
4.23 Strategies Throughout the Development Process
How do we share our findings with the community, especially when they result in changes?
What went well, what went right, what went wrong, so we can know what to do next time and get better?
Pre-Development Strategies
Align Funding with Equitable Outcomes
• Incentivize project applicants to partner with affordable housing, tenant rights, and economic development agencies/organizations Require good hiring practices, e.g., local/targeted hire, project labor agreements, prevailing wages
• Require good economic development strategies, e.g., local procurement, small business interruption funds
Research + Data Collection
• Produce a displacement impact report as a component of due diligence
• Conduct a neighborhood assessment to identify who currently lives, works, and attends school in the area and is likely user of the park.
• Work with local organizations to create population-specific outreach and engagement strategies, for example seniors, youth, etc.
• Identify potential local community partners and partner with housing/tenant rights, economic development expertise.
Technical Assistance Programs
• Provide training and technical assistance workshops to help project applicants create displacement impact reports and displacement avoidance strategies for their projects
• Maintain transparency with the community by providing updates on construction via webpage, social media updates, and community check ins.
During Construction
• Provide a direct link from the DPR website to the City’s Capital Improvement Project tracker to inform the status of current and proposed park development.
Potential Partnerships/ Responsible Party
Board of County Commissioners and City Council are engaged as the decision-makers. Neighborhood Improvement Services and the Community Development Department may be engaged to conduct research for the displacement impact report and the neighborhood assessment. Throughout this period, the Planning Department and DPR will review and approve site plans based on the Ordinance.
Building Inspections & Permitting with assistance from the Planning Department and Parks and Recreation sharing updates
4.24
Table
Table
Strategies Throughout the Development Process
• Engage in periodic monitoring of neighborhood change
• Develop community stewardship programs
• Partner with housing agencies and organizations to host regular tenants’ rights workshops and clinics.
• Develop community programs that support local economic development (for example night markets with local street vendors, incentivize event hosts to utilize local businesses for catering)
Potential Partnerships/ Responsible Party
Post construction, the Parks and Recreation department may work along Neighborhood Improvement Services to conduct assessments of the resources and catalog who uses the services and any economic or other impact.
Implementation Strategies Task Action Items
• Determine housing vulnerability and who is affected
• Determine neighborhood institutions, organizations, and leaders. Who do they represent/ who are they not representing? Are there community stakeholders whose voices are not being represented by the groups you are reaching? What is your plan to bring their voices to the conversation?
Fund
Establish
• Community Outreach & Education that includes tenant’s rights, housing counseling, economic development, and employment opportunities and add specifically to guidelines
• Local and targeted hire
• Local procurement and vending
• Identify surplus land/affordable housing joint development opportunities
• Work with housing agencies and organizations to target community stabilization resources in areas at high risk
• Invite housing agencies and organizations to do a presentation at community meetings you are hosting
• Cross agency land acquisition/housing preservation strategy
• Cross agency commission to coordinate collaboration
• Internal staff to support implementation within each agency
• Require implementation of community outreach as established in grant guidelines
• Advocate for sister agencies to adopt similar policies
Advocate
• Elected officials to adopt tenants’ rights, rent control, and other equitable development policies
• Implement PRADS at the very early stages of park planning and development. This means that for large park projects in low-income neighborhoods planning for PRADS needs to begin at the same time as planning a park, before investors recognize the potential of new park projects. Designing a park and designing anti-displacement strategies should go together in a planning process involving meaningful dialogue and collaborations between parks organizations and housing organizations.
• Engage communities in developing approaches to avoid displacement near new parks. Community engagement can create opportunities for residents and community-based organizations to educate local governments about the challenges and opportunities for solutions.
• Create collaboratives that include park and housing advocates, which can advocate locally for policy change, provide tools, and share lessons with other organizations in a wider network than the Department may have access to.
• Measure, evaluate, and report the successes and failures of PRADS for park projects, maintaining transparency with the community from beginning to end. The Department should engage third-party independent researchers in this process and publicly share data, results, and lessons learned.
Equity Investment Priority Index
As part of this assessment, an Equity Investment Priority Index was created. This tool took several indicators that, in combination, can reveal areas that would be priority areas for investment to improve equitable outcomes. These indicators were mapped at the census tract level and if a tract met the criteria set for the indicator it received 1 ‘point’. At the conclusion of the analysis, the ‘points’ were tallied and distributed along a scale of ‘Low Priority’, ‘Medium - Low Priority’, ‘Medium-High Priority’, and ‘High Priority’.
Score cutoffs were:
• High Priority: More than 6
• Medium-High Priority: More than 3, less than 6
• Medium-Low Priority: More than 1, less than 3
• Low Priority: 1 or less
The indicators were all gathered from Federal Agencies including the US Census Bureau, US Department of Justice, Centers for Disease Control, and the US Department of Housing and Urban Development. The indicators used are listed below with the source noted in parentheses.
• High Poverty Index (HUD)
• Racially or Ethnically Concentrated Areas of Poverty [R/ECAP] (HUD)
• High percentage of nonwhite population (Census)
• High percentage of population without a High School Diploma (Census)
• High percentage of population with a disability (Census)
• High percentage of population without health insurance (Census)
• High percentage of population without access to a vehicle (Census)
• High population density (Census)
• High percentage of population under 18 (Census)
• High crime rates (US DOJ)
• High environmental burden (US CDC)
Table 4.25
Table 4.26
The results of the analysis were then visualized on a map of the City’s Census Tracts and can be seen in Figure 4.32 and Figure 4.33.
Figure 4.32: Fairness Priority Index
Figure 4.33: Fairness Priority Index Overlaid with DPR Parks
This analysis revealed high priority areas east and south of Downtown and larger medium-high priority areas along the Roxboro St Corridor and the Alston Ave/NC55 corridor.
Recommendations included in this plan reference these maps as guidance for areas that have higher priority due to equity indexing. These analyses are undertaken at the tract level so they are not intended to imply that there are not needs throughout the City, rather they should serve as guidance to understand where the greatest need is at a population level. The Department should continue to balance indicators such as these with their own information as well as community feedback.
Case Studies Around Displacement
Assessing projects from an equity lens has been a growing priority for municipalities across the country. Many municipalities are adopting anti-displacement strategies and action plans as they too experience rapid population growth, private investment and interest, as well as increased funding opportunities for public investment and
infrastructure improvements. To provide inspiration as well as create a benchmark for what Durham is capable of accomplishing, the following examples were selected as anti-displacement policies and plans that have a specific park and recreation anti-displacement strategy. The list of examples here is not exhaustive and there are several other resources around the world regarding this topic, however, these provide further guidance and motivation to the Department of what is feasible as anti-displacement strategies and equitable green development.
Portland Anti-Displacement Action Plan (Adopted 2021)9
Not specifically related to Parks and Recreation, the Portland Anti- Displacement Action Plan takes a great look at understanding how housing and parks are related. The plan provides an Opportunity and Risk Map that places the community into areas of low and high opportunity, and areas of low and high vulnerability. In this scenario, opportunity is defined as having safe, convenient, and walkable access to schools, parks, grocery stores, and transit. Vulnerability refers to the communities that are at risk of economic displacement. Based upon these
distinctions, the City was then able to understand what should be within its equitable and investment matrix.
Areas within quadrant one that have low opportunity but high vulnerability, indicate a need to have investment within these areas to increase opportunity. Areas that are in quadrant two indicate high opportunity and high vulnerability, or a need for an investment in affordable housing to offset displacement that can occur once private investment into the area begins. By acknowledging areas within the community that are experiencing interest and are known to be vulnerable, the City can determine best practices for implementing anti-displacement strategies in those areas.
Another concept that is important to note from this plan as it clarifies that projects do not happen within a vacuum. The plan notes that there should be a shared analysis through a coordinated effort across departments to ensure that there is transparent decision making. This included the Opportunity and Risk Mapping as noted previously but also a Public Investment Impact Analysis. The impact analysis ensures that city leadership and department staff gain a stronger understanding of how different public investments and actions impact nearby land values and signal the private market. This is specifically relevant to the Durham Parks and Recreation Department because as noted, many of the decisions that result in displacement are made across the board and not within a vacuum that just the Parks Department controls. The Parks and Recreation Department does not necessarily have a stance or a say in new sidewalks, new bike line infrastructure, or new stormwater infrastructure. However, neither do other departments have a say in new park facilities or new recreation programming. Total transparency is a result of a well-working machine across all departments especially as it relates to decision-making on new investment opportunities.
Seattle Anti-Displacement Framework
The proposed One Seattle Plan: Anti-Displacement Framework is a multi-departmental effort with a primary focus on affordable housing.10 However, the One Seattle Plan does take time to note an initiative to ensure equitable benefits from public investments. The plan acknowledges that by making nearby land more desirable through public and private investments that bring services and
amenities to communities, displacement of low-income residents who are intended to benefit from these services and amenities may occur. It gives the example of how a transit station, or a new park, or a neighborhood’s rising desirability brings real estate speculation and housing demand that drives up house prices and pushes out current residents. The One Seattle Plan notes establishing equitable benefits for their communities through Equitable Transit-Oriented Development, the Transportation Equity Framework, Seattle’s Green New Deal, and Outside Citywide.
Outside Citywide is a collaborative initiative to create an equitable and well-connected network of public green spaces across Seattle that addresses a history of racial inequities in open space access and environmental harms. The initiative focuses on ensuring that the City makes green investments to address these inequities and make the investments that improve the health and safety of frontline communities, while at the same time taking action to avoid the heightened displacement risk these investments can produce when they raise property values and push out existing residents.
Another initiative of the plan is to intentionally foster community connection and belonging. Of these, the Arts in Parks initiative is an example of a well-planned interdepartmental partnership around a common goal.
“Anti-Displacement Action Plan Foundation Report.” City of Portland Bureau of Planning and Sustainability, 2021. April 1. https://www. portland.gov/bps/planning/adap/documents/anti-displacement-action-plan-foundation-report/download. 9
10 “One Seattle Plan Comprehensive Plan Update - Anti-Displacement Framework DRAFT.” Seattle Office of Planning and Community Development n.d. https://www.seattle.gov/documents/Departments/OPCD/ SeattlePlan/OneSeattlePlanAntiDisplacementFramework.pdf.
Arts in Parks is a partnership of the Seattle Office of Arts and Culture and Seattle Parks and Recreation that offers grants to increase arts and community events in City parks by investing in the vibrant cultural work being done in and by diverse communities throughout Seattle. The grant supports new and established festivals and events that promote arts and cultural participation, celebrate diversity, and activate parks while connecting with communities most impacted by systemic oppression including low-income, people with disabilities, immigrant and refugee communities, and communities of color.
Charlotte Anti-Displacement Strategies
(Adopted 2023)
A little closer to home than Portland and Seattle, the Charlotte Anti-Displacement Strategies were noted within the 2040 Charlotte Future Comprehensive Plan. As the largest municipality in the state of North Carolina, Charlotte has experienced immense growth over the years as well as many stories of displacement and the issues of housing affordability. From a Parks and Recreation perspective, Charlotte has led the way with their rail trail that replaced the previous railroad right of way with new activated public park spaces.
The Charlotte Comprehensive Plan notes several different displacement tragedies to establish a more equitable Charlotte. Specifically, as it relates to park and recreation, the plan notes that public improvement projects can contribute to gentrification and involuntary displacement in the most vulnerable communities in need of investment. Any new planned public improvement project, including parks, should include improvements to existing infrastructure, new local infrastructure, and new community and regional infrastructure. The project should also acknowledge any market pressure in housing and commercial property rising costs
Proposed tools for anti-displacement include creating an affordable housing database, community land trusts, and other municipality-wide initiatives. Another initiative could be that of a Community Benefits Agreement, which are “agreement executed between community-based organizations and one or more developers.” Like Developer’s Agreements between the City and a private developer, these agreements are intended to outline the developers’ commitment to provide public benefits to the community to offset any potential impacts associated with the proposed development.
Key Findings
What is DPR currently doing?
• Putting forth intentional programming that caters to a diverse group of ages, abilities, and cultures.
• Inclusive programming options through Special Programs like Buddy Sports, Challenger Flag Football, Bingo, Name that Tune: Virtual Tuesdays, “Dance the Night Away!”, and “Let’s go to the Movies!”
• Creating spaces for fun, family, and fellowship by hosting and partnering on festivals like the Bimbe Cultural Arts Festival, Earth Day Festival, as well as the summer concert series in the park.
• Providing quality programs that are inclusive and accommodating to various abilities, beliefs, and economic backgrounds.
• Maintaining transparency through a robust social media presence, an active website, and reaching thousands of residents through equitable community engagement for park development projects.
• Provide language access through translations of important documents and messaging, as well as interpretation in real time at front desks and recreation centers through their customer service staff and at community engagement opportunities with Engagement and Latino Outreach staff.
• Utilizing the City’s Racial Equity Decision-Making Tool to ensure that the outcome of new park and open spaces does not have a negative effect on the adjacent community.
What can DPR do moving forward?
• Assess the various neighborhoods they serve to determine each neighborhood’s individual parks and recreation needs. The results of this assessment can then be used to prioritize investment based the level of need.
• Continue efforts to incorporate inclusive playground design principles into new projects and renovations. Thoughtfully designed playground can help bring together diverse groups and improve overall accessibility of DPR parks and facilities.
• Provide more training opportunities for staff regarding inclusion and equity.
• Work with the Planning Department to update the Unified Development Ordinance regarding the need for community buy-in on new development containing public parks and open spaces.
• Collaborate across other City departments to implement anti-displacement strategies.
• Continue to evaluate CIP funding proposals using City approved equity metrics and make suggestions for revisions or additions to equity metrics based on project experience and community feedback.
• Ensure that staff are trained on DPR’s policies and procedures as it relates to equity and provide training that clarifies how individual positions are part of establishing a Department that operates equitably.
• Continue targeted outreach to communities that do not use DPR facilities or are distrustful to gain a better understanding of community needs.
• Continue to produce multilingual assets for both engagement and wayfinding.
• Ensure that any partnerships with County Open Space is in alignment with DPR equity goals and policies.
Program Assessment
Overview
As part of the Durham Parks and Recreation Master Plan the consulting team conducted a Recreation Program Analysis of the services offered by the City’s Parks & Recreation (“DPR”). The assessment offers an in-depth perspective of program and service offerings and helps identify strengths, challenges, and opportunities regarding programming. The assessment also assists in clarifying Core Program Areas and identifying program gaps within the community, key system-wide issues, areas of improvement, and future programs and services for residents and visitors.
This report provided by the consulting team articulates the program findings and recommendations based on a review of information provided by DPR including program descriptions, financial data, website content, and discussions with staff. This report addresses the program offerings from a systems perspective for the entire portfolio of programs.
Framework
The Mission of the DPR is as follows: “Play More: Connecting our whole community to wellness, the outdoors, and lifelong learning”. In order to help achieve its mission, DPR provides a broad range of youth, adult, and family public recreational activities that activate dedicated park and recreation spaces across the city including parks, trails, lakes, indoor recreation facilities, a teen center, indoor and outdoor pools, athletic fields and courts, and more.
Program Assessment
Overview
Below are some overall observations that stood out when analyzing the program assessment worksheet:
• DPR has well established and defined Core Program Areas that are known and used as the basis for programming throughout the department.
• Overall, the program descriptions/goals do an excellent job of effectively communicating to the public key benefits and desired outcomes of each Core Program Area.
• DPR’s age segment distribution is aligned with Durham’s current population but needs to be monitored annually to ensure program distribution continues to match evolving age demographics of the community.
• Regarding program lifecycles, approximately 78% of the system’s current programs are categorized in the early programming stages, while much fewer (22%) of the programs fall into the late lifecycle stages. A more complete description of Lifecycle Stages can be found later in this analysis.
• Pricing strategies vary across the board. Currently, the most frequently used approaches are pricing based on residency, pricing based on the ability of the customer to pay, and group discounts which are based on the ability of groups to pay. Program pricing is especially sensitive in Durham. The city is to be commended for ensuring residents financial resources do not prohibit them from participating in DPR programs. It is important that this strategy continues to ensure access for all. This critical strategy can and should continue along with some new and additional pricing strategies. There are no cost recovery goals, and as a result, no understanding of the cost of services. Understanding the current cost of services is essential to develop effective and appropriate cost recovery goals for Durham. More details on cost of services and pricing strategies can be found later in this report.
• Financial performance measures such as cost of services and cost recovery goals are currently not being utilized across any of the Core Program Areas. Moving forward, it is recommended that staff track cost of services and cost recovery for all programs and Core Program Areas. When doing so, all direct and indirect costs need to be calculated for each program and Core Program Area. Additionally, it is recommended that DPR develop intentional and consistent strategies that ensure a resident’s financial means does not prohibit them from participating in DPR programs while also developing consistent and fair earned income strategies for residents who have the financial means to pay for programs and services. This approach would provide a factual and data based financial performance approach for DPR that supports the overall goals of the City and community.
Core Program Areas
To help achieve DPR’s mission, it is important the Core Program Areas are based on current and future needs to create a sense of focus around specific program areas of greatest importance to the community. Public recreation is challenged by the premise of being all things to all people. The philosophy of a Core Program Area is to assist staff, policy makers, and the public to focus on what is important to the community. Program areas are considered Core if they meet most of the following criteria:
• Program area has been provided for a long period of time (over 4-5 years) and/or is expected by the community.
• Program area consumes a large portion (5% or more) of the agency’s overall budget.
• Program area is offered 3-4 seasons per year.
• Program area has wide demographic appeal.
• There is a tiered level of skill development available within the program area’s offerings.
• There is full-time staff responsible for the program area.
• There are facilities designed specifically to support the program area.
• The agency controls a significant percentage (20% or more) of the local market.
Existing Core Progam Areas
DPR has sixteen (16) Core Program Areas with programs offered in 15 of the 16 program areas. These programs are featured on the following page.
Bimbe Cultural Arts Festival 2023
Figure 4.35
Major Program Type Descriptions, Goals & Example Programs
Across and within each of the Core Program Areas there are major program types that are designed to meet current and emerging needs of Durham residents. Overarching descriptions of each Core Program Area are described in the table below and on the following pages.
Description: The Aquatics Program provides the community with a safe and positive aquatic experience that will benefit them physically, emotionally, socially, and increase their knowledge and awareness of water safety.
Aquatics
DPR Goals and Desired Outcomes:
• Provide a clean and enjoyable pool space for people to swim.
• Ensure the safety of all persons at swimming facilities.
• Offer swimming classes for various ages and ability levels.
Description: Provides programs and league play for a variety of sports and ages. Athletics are offered year-round in a variety of formats, including recreation, competition, and instruction.
Athletics
Canine Recreation
DPR Goals and Desired Outcomes:
• Contribute to health and well-being through diverse sports programs.
• Provide participants opportunity to evaluate their individual skill
Description: Includes a variety of events for residents and their canine family members to interact in a social setting.
DPR Goals and Desired Outcomes:
• Provide participants an opportunity to create a stronger bond with their canine companions.
• These opportunities aim to provide canine companions exercise and social interactions that make them healthier and strengthens their bond with their families.
Description: Participants engage with local and regional cultural heritage through active and passive interpretation, hands-on learning opportunities, programs, and classes to gain an understanding of how the history of the area has shaped our past, present, and future.
DPR Goals and Desired Outcomes:
• Provide quality experiences for the public that expand knowledge, awareness, and appreciation of the natural world and local history.
• Utilize a variety of offerings including picnicking, fishing, hiking, outdoor nature study, and cultural history programming.
Description: The enrichment and education core program area aims to provide leisure opportunities for our community to learn, engage, and acquire new life skills in a safe space.
DPR Goals and Desired Outcomes:
• To provide learning opportunities which foster the growth and skill development of individuals and/or groups.
• Swim Lessons
• Deep Water Exercise
• Lifeguard Training
• DPR Marlins
• Aqua-Babies
• Aqua-Tots
Facility Rentals & Reservations
Description: Facility rentals and reservations consists of athletic fields, athletic courts, campsites, event fields and trails, mobile stages, outdoor plazas, picnic kits, picnic shelters, pool and lap lanes, recreation centers, score boards, and special use facilities.
DPR Goals and Desired Outcomes:
• To rent clean, affordable spaces and resources that satisfy the needs of our clients.
Description: Provides community with exercise programs that include yoga, aerobics, Zumba, chair exercise, anti-aging workshops, and outdoor fitness.
Fitness & Wellness
• Basketball
• Volleyball
• Pickleball
• Soccer
• Tournaments
• Academies/Clinics/ Lessons
• Adult/Youth Sports
• Dog Park Tags
• Barktoberfest
• Santa Paws
• Dog Gone Egg Hunt
• Canine Field Day
DPR Goals and Desired Outcomes:
• To provide clean, safe fitness equipment.
• To provide a variety of fitness and exercise opportunities at all levels to enhance aerobic fitness, strength, flexibility, and overall health of participants.
Description: Provides recreational opportunities and trips for mature adults (ages 55+) that promote socialization, skill development, and new experiences.
• Fitness Equipment
• Facility Rentals
• Outdoor Facility Reservations
• Special Use Facilities
• Adult and Teen Open Gym
• Bigger, Faster, Stronger
• C.A.B.A.
• Core Fitness
• Yoga and Zumba
• Spin Fitness
• Arts & Crafts
• Exercise Your Brain
• Mature Adult Field/ Game Days
Mature Adults
DPR Goals and Desired Outcomes:
• To provide fitness and learning programs, social activities, trips, and outings.
• Create opportunities for relationship building and the cultivation and improvement of social skills through classes, programs, special events, and volunteering.
Outdoor Recreation
Description: Provides community with positive outdoor experiences to connect to natural spaces that benefits participants emotionally, socially and/or educationally. Programs developed for five age-based groups: preschool, youth and family, teen, adult, and mature adult.
DPR Goals and Desired Outcomes:
• Hallow-Eno
• History Hike
• Leigh Farm History Park Tours
• West Point Park Tour
• Cane Pole Fishing
Performing Arts
• Hands-on-History
• Workshops
• DIY Designs
• Homeschool Fun
• Nature & History Hikes
• STEAM Creations
• Health Expo
School - Age Care
• To provide environmental education and outdoor experiential programs that inspire a lifelong connection to the outdoors.
Description: Provides a variety of programs for all ages to give participants opportunities to enhance artistic expression and social interaction through music, dance, and drama.
DPR Goals and Desired Outcomes:
• To provide a variety of programs that give participants a space to express themselves through art.
• To provide a space to develop and improve artistic skills.
Description: Provides safe, fun, and educational program environments through DPR at a variety of sites. Each program offers enrichment opportunities exposing children to arts and crafts, health and fitness, STEAM, and other activities.
DPR Goals and Desired Outcomes:
• To provide access to high quality and affordable programs for children and families in Durham County.
• Self-Care Days
• Senior Games
• Technology Made Easy: Microsoft Word & Smart Phone/ Computer
• Summer Adventure Programming
• Fourth Friday Fires
• Family Lake Days
• River/Lake Cleanups
• Modern Dance for Youth
• Tiny Tot Ballet
• Youth Dance
• Adventures with Legos
• Fun Days
• Movie Mania
• Familytines Dance
• Summer Camp
• Teen Connect
Small
Events
Social Activities
Description: Provides programs for all ages that in a friendly and fun environment for the community to come together. Offered throughout the year at recreation centers and in parks throughout the city.
DPR Goals and Desired Outcomes:
• To provide a family friendly environment for the community to come together and enjoy a variety of activities.
• To provide the community with a safe place to celebrate holidays and cultural events.
Description: Provides the community with positive experiences that benefit them emotionally, socially, and educationally. Offered at a variety of recreation sites throughout the city for these age-based groups: preschool, youth and family, teen, adult, and mature adult.
DPR Goals and Desired Outcomes:
• To provide enjoyable social opportunities and experiences that encourage fitness and personal skill development to people of all ages.
Special
Events
Special Programs
Description: Creates programs that bring large groups of people together to celebrate culture, music, and art. Experiences offered through these programs are appropriate for all ages and are spread across the year.
DPR Goals and Desired Outcomes:
• To create a friendly and fun environment for the community to come together and enjoy a variety of activities for entertainment, enrichment, and education.
Description: Provides programs for individuals with disabilities that focus on participant abilities (rather than disabilities) and encourage people to attain their optimal level of independent leisure functioning.
DPR Goals and Desired Outcomes:
• To promote physical health and well-being, stimulate and enhance cognition and the development of social skills.
• To raise awareness of recreational opportunities, promote and enhance inclusion, and promote psychosocial well-being and independence.
Description: Provides opportunities for ages 13 through 18 to participate in safe, fun, and captivating activities. Offers several programs at a variety of locations throughout the city where teens can participate in both instructor-led activities and peer-guided activities.
DPR Goals and Desired Outcomes:
• To provide safe, enriching experiences that promote education, socialization, and physical activity.
• Back-to-School Bash
• Fright Night
• Resource Center
• Ties and Tiaras
• Egg Hunts
Core Program Area Recommendations
• Afternoon in the Park
• Bingo
• Chill & Paint
• Cookies with Santa
• Dias de los Muertos
• Total Tot Time
• Earth Day Festival
• July 4th Celebration
• Rock the Park Concert and Movie Series
• Senior Holiday Party
• Buddy Sports
• Dance the Night Away
• Hybrid Virtual Bingo
• Special Olympics
• Virtual Name That Tune
• Teen Nights
• Teen Summer Connect
• Car Maintenance 101
• Night Flight
• Teen Strength Training
The existing Core Program Areas and Program Types provide a well-rounded and diverse array of programs for the community. Ninety percent (90%) of respondents of the statically valid community survey rated the overall quality of recreation programs or special events as good (59%) and excellent (31%), however, thirty-one percent (31%) of respondents indicated that the lack of information/not knowing what is offered as the biggest barrier to using Durham parks and facilities. It is important that the Core Program Areas and individual programs be evaluated on an annual basis to ensure offerings are relevant to evolving demographics and trends in the local community. Furthermore, based on the observations of the consulting team, key leadership input, discussions with DPR staff, site visits, statically valid survey results, and demographic and recreation trends, the following overarching recommendations are provided for the Core Program Areas.
Communications & Marketing of DPR Programs
Twenty-eight percent (28%) of the respondents of the statically valid community survey said someone in their household had participated in City recreation programs or special events in the last year. Of those who had participated in DPR programs, most (90%) rated the overall inclusivity and diversity as excellent (36%) or good (54%). The overall quality of recreation programs and special events was most often rated as good (59%) followed by excellent (31%). Yet, the respondents listed the lack of information/not knowing what is offered (38%) as the biggest barrier to participating in DPR Programs. Additionally, respondents noted distance from residence (27%), busy schedules (22%), and safety at facilities (22%) as the other barriers to use of parks and facilities. Given the lack of information/not knowing what is offered as the number one barrier for using parks and facilities, the consultant team urges DPR to develop communications and marketing strategies and tools to more proactively inform the public about DPR programs and services.
Core Program Areas
Currently, DPR provides its residents with a variety of programs within sixteen Core Program Areas. Fifteen of the sixteen Core Program Areas are diverse and
varied. Included in the sixteen Core Program Areas is “Facility Reservations and Rentals”. This was added as a Core Program Area to track data in ActiveNet. While it is important to track data for facility reservations and rentals, it is not a program area and should be removed as a Core Program Area. Also, as DPR builds upon its current program offerings to ensure they are relevant to Durham’s evolving demographics and trends, DPR may need to revise, update, or expand its current Core Program Areas.
Core Program Area Descriptions, Goals & Outcomes
It is important to note that the DPR Core Program Area descriptions and goals and outcomes reviewed by the consultant team are the first set of program descriptions and goals and outcomes developed by DPR. DPR is to be commended for establishing these program descriptions and goals and outcomes for their Core Program Areas. Continuing to build on and refine these initial descriptions and goals and outcomes will only strengthen the program offerings DPR provides to the Durham community. Overall, the Core Program Area descriptions are well written and provide a good overview of each. The goals and outcomes, however, need strengthening. As DPR continues to strengthen the existing goals and outcomes, they should focus on making them measurable, both quantitively and qualitatively. Additionally, the Core Program Areas and their descriptions and goals and outcomes should connect to the overarching goals and demographics of the City of Durham and DRP’s department goals. There should be direct cascading connections from the City of Durham goals to DPR’s department goals and finally to the Recreation Program goals. The Core Program Area goals and outcomes should ensure that DPR’s programs address gaps and disparities in recreation programs while also increasing the social, emotional, and physical well-being of Durham residents in general as well as addressing the needs of various demographic groupings across the city including gender, race/ethnicity, income, household type, geographic differences. DPR should also consider the climate change impacts on program offerings, adapting to and mitigating for the changing climate conditions, paying particular attention to heat and extreme weather conditions.
Performing Arts Programming
The Durham community is highly diverse and expresses strong interest in outdoor movies and concerts (ranked first in the community survey) and arts, dance, music, and performing arts (ranked fifth highest interest in the community survey). Looking within the State of North Carolina, the Market Potential Index (MPI) measures the probable demand for a product or service within defined service areas, using data provided by ESRI. The MPI shows the likelihood that an adult resident will participate in certain activities when compared to the U.S. national average. The national average is 100; therefore, numbers below 100 would represent lower than average participation rates, and numbers above 100 would represent higher than average participation rates. Attending a country music performance (106) was the only performing arts activity within the North Carolina service area with an MPI score above the national average. It should be noted that MPI metrics are only one data point used to help determine community trends; thus, programmatic decisions should not be based solely on MPI metrics. It is recommended the DPR continue to provide the current high-quality events and programs in th the performing arts area of focus, as well as explore additional events or programs that meet these interests and needs.
Aquatics, Fitness & Wellness, and Athletics
Fitness and wellness programs and adult athletics were the second (2nd) and third (3rd) program areas, respectively, with the highest percentage of unmet need from the community survey. Additionally, fitness and wellness programs (25%) and swimming (21%) were the second and third most important programs for Durham residents. Through the combination of unmet need and level of importance, fitness and wellness programs, swimming, and adult athletics were rated as the second, third and fourth priorities respectively for priorities for program investment. These results are consistent with trends across the United States, with Americans continuing to make physical activity more of a priority in their lives. The Sports & Fitness Industry Association’s (SFIA) Sports, Fitness & Leisure Activities Topline Participation Report 2023 documented approximately 236.9 million people ages six and over reported being active in 2022, which is a 1.9% increase from 2021 and the greatest number of active Americans in the last 6 years. Fitness sports continue to be the go-to means of exercise for Boomers (1945-1964, Gen X (1965-1979), and Millennials (1980-1999). Assessing
MPI scores for the general sports category reveals that overall State residents are most likely to participate in sports such as softball (103), golf (101), and football (101) when compared to the national average. Swimming (104) was the only fitness activity for the State with an MPI score above the national average. It should be noted that MPI metrics are only one data point used to help determine community trends; thus, programmatic decisions should not be based solely on MPI metrics.
Potential New Areas of Programming
DPR should explore providing additional programs within its Core Program Areas to assist in fulfilling existing/future unmet needs. In addition to the findings noted above from the community survey, several key programming themes emerged including outdoor movies and concerts, outdoor adventure programs, small watercraft/boating, pickleball, life skills programs, and fishing. All these programs ranked in the high and medium priority in the community survey.
Program Strategy Analysis
Age Segment Analysis
For this report, an Age Segment Analysis was completed by Core Program Area, exhibiting an over-arching view of the age segments served by different program areas, and displaying any gaps in segments served. It is also useful to perform an Age Segment Analysis by individual programs, to gain a more nuanced view of the data. The below table depicts each Core Program Area and the most prominent age segments that each serve. Under each Core Program Area, a ‘P’ or ‘S’ was indicated if that program serves a certain age segment; ‘P’ indicates Primary usage, while ‘S’ indicates Secondary usage.
Based on the age demographics of the Durham community, current program offerings seem to be well-aligned with the community’s age profile. Durham does a great job of having offerings for all ages, as well as offering programs for more specific age groups. With a growing population of seniors, is crucial to serve that population not only in the Mature Adult Core Program Area, but to in other Program Areas.
Age Segment Analysis
DPR has also done a great job catering to the remainder of the community, by ensuring all age segments have dedicated programming geared towards them. Moving forward, it is recommended that DPR continues introducing new programs to address any potential unmet needs in the future. Staff should monitor demographic shifts and program offerings to ensure that the needs of each age group are being met accordingly. It would be best practice to develop a plan that includes what age segments to target, determine what and how to measure impacts, establish messaging, identify marketing method(s) to utilize, and create a social media campaign before allocating resources towards particular efforts.
Program Lifecycle Analysis
The Program Lifecycle Analysis reviews each DPR program to determine the stage of growth or decline for each. This analysis provides important data to DPR for strategic decision making about the overall mix of programs they manage to 1) ensure an appropriate number of programs are “fresh” and 2) ensure relatively few programs, if any, need to be discontinued. This analysis is not based on strict quantitative data, but rather, is based on staff members’ knowledge of their programs. The following table
shows the percentage distribution of the various lifecycle categories of DPR’s programs. These percentages were obtained by dividing the number of programs in each individual stage with the total number of programs listed by staff members.
Overall, the Lifecycle Analysis depicts an uneven spread of programs in different lifecycle stages, with an overwhelming focus of the beginning stages (Introduction, Take-Off, and Growth). Approximately 78% of all programs fall within the beginning stages, with 33% of programs specifically in the Growth stage. It is generally recommended to have 50-60% of all programs within these beginning stages as they provide DPR an avenue to energize its program offerings. Given that we are recovering from COVID-19 and have the ability encourage social gathering in safe environments, DPR is to be commended that the program offering percentages are higher in the early stages of program lifecycles. This strategy allows the DPR to reengage, test, and evaluate what program offerings Durham residents want provided through this post COVID-19 transition. This approach will ensure that offerings will be responsive to the post-COVID-19 changes in the community while providing a pipeline for several new program offerings to transition into the Mature stage. The flip side of the current lifecycle distribution, however,
Lifecycle Analysis
is that only 8% of current program offerings are in the Mature Stage. With the very high percent of current program offerings in the Introduction, Take-Off, and Growth Stages DPR staff will need to ensure they conduct regular review and evaluation of program offerings and be able to quickly respond to program demand, which may require quick changes in program offerings in the coming one to three years until this post-COVID-19 environment settles down and DPR is able to re-establish a stable foundation of program offerings with distribution of 50-60% of programs in the Introduction-Take-Off-Growth Stages and 40% of programs in the Mature Stage.
Only 9% of the assessed programs are identified as being Saturated or Declining and 5% (or 14 total) of programs were considered a no-go, or outright cancelled moving forward. It is a natural progression for programs to eventually transition into Saturation and Decline Stages. However, if programs reach these stages rapidly, it could be an indication that the quality of the programs does not meet expectations or there is not as much of a demand
Value Added Services
DPR Could Provide with additional resources. It adds value to community, it supports Essential & Important Services, it is supported by the community, it generates income, has an individual benefit, can be supported by user fees, it enhances the community, and requires little to no subsidy.
for those programs. As programs enter the Decline Stage, they must be closely reviewed and evaluated for repositioning or elimination. When this occurs, DPR should modify these programs to begin a new lifecycle within the Introductory Stage or replace the existing programs with new programs based upon community needs and trends. As articulated above, given DPRs post-COVID-19 efforts at establishing program offerings, this review, evaluation, repositioning and/or elimination of programs will be more intense and require more attention over the next one to three years as Durham fully transitions out of a post-COVID-19 environment.
Staff should complete a Program Lifecycle Analysis on an annual basis and ensure that the percentage distribution closely aligns with desired performance. Furthermore, DPR could include annual performance measures for each Core Program Area to track participation growth, customer retention, and percentage of new programs as an incentive for innovation and alignment with community trends.
Important Services Essential Services
DPR Should Provide if it expands & enhances core services, is broadly supported & used, has conditional public support, there is a economic / social / environmental outcome to the community, has community importance, and needs moderate subsidy.
DPR Must Provide if it protects assets & infrastructure, is expected and supported, is a sound investment of public funds, is a broad public benefit, there is a negative impact if not provided, is part of the mission, and needs significant to complete subsidy.
Figure 4.36
Program Classification
Conducting a classification of services analysis informs how each program serves the overall organization mission, the goals and objectives of each Core Program Area, and how the program should be funded regarding tax dollars and/or user fees and charges. How a program is classified can help to determine the most appropriate management, funding, and marketing strategies.
Program classifications are based on the degree to which the program provides a public benefit versus a private benefit. Public benefit can be described as everyone receiving the same level of benefit with equal access, whereas private benefit can be described as the user receiving exclusive benefit above what a general taxpayer receives for their personal benefit.
For this exercise, DPR used a classification method based on three categories: Essential Services, Important Services, and Value-Added Services. Where a program or service is classified depends upon alignment with the organizational mission, how the public perceives a program, legal mandates, financial sustainability, personal benefit, competition in the marketplace, and access by participants. The following graphic describes each of the three program classifications.
With assistance from staff, a classification of programs and services was conducted for all the recreation programs offered by DPR. The results presented in the following table represent the current classification distribution of recreation program services with 29% of programs deemed essential, another 30% deemed important, and 41% considered value-added.
Program Classification Distribution
Cost of Service & Cost Recovery Recommendations
Programs should be assigned cost recovery goal ranges within those overall categories. As DPR continues to evolve to better meet the community’s needs, there could be added benefits to managing the services if they all were classified according to the Cost Recovery Model for Sustainable Services depicted below.
Individual Benefit: Exclusive benefit received by individuals and not the general public; individual pays at least 80% of the cost of service.
Considerable Individual Benefit: Nearly all benefit received by individuals, benefit to community in a narrow sense.
Balanced Community & Individual Benefit: Benefits accrued to both individual and general public interests, but to a significant individual advantage.
Considerable Community Benefit: Recreation services benefits accrued to both the general public and individual interests, but to a significant community advantage.
Community Benefit: Recreation services to be accessible and of benefit to all, supported solely or significantly by tax dollars.
Given the broad range of cost recovery goals (i.e., 0%40% for Essential Services or 40%-80% for Important Services), it would be helpful to further distribute programs internally within sub-ranges of cost recovery as depicted above. This will allow for programs to fall within an overall service classification tier while still demonstrating a difference in expected/desired cost recovery goals based on a greater understanding of the program’s goals (e.g., Pure Community Services versus Mostly Community Services or Community and Individual Mix versus Mostly Individual Mix).
At a minimum, cost recovery targets should be identified for each Core Program Area and for specific programs or events when realistic. The identified Core Program Areas would serve as an effective breakdown for tracking cost recovery metrics including administrative costs. Theoretically, staff should review how programs are grouped for similar cost recovery and subsidy goals to determine if current practices still meet management outcomes.
Determining cost recovery performance and using it to make informed pricing decisions involves a recommended three-step process:
1. Classify all programs and services based on the public or private benefit they provide (as completed in the previous section).
2. Conduct a Cost-of-Service Analysis to calculate the full cost of each program, including direct and indirect costs.
3. Establish a cost recovery percentage, through DPR policy, for each program or program type based on the outcomes of the previous two steps and adjust program prices accordingly.
The following section provides more details on steps 2 & 3.
Figure 4.37
Table 4.30
Figure 4.38
Understanding the Full Cost of Service
To develop specific cost recovery targets, full cost of accounting needs to be created on each class or program that accurately calculates direct and indirect costs. Cost recovery goals are established once these numbers are in place, and DPR’s program staff should be trained on this process. A Cost-of-Service Analysis should be conducted on each program, or program type, that accurately calculates direct (i.e., program-specific) and indirect (i.e., comprehensive, including administrative overhead) costs. Completing a Cost-of-Service Analysis not only helps determine the true and full cost of offering a program, but it also provides information that can be used to price programs based upon accurate delivery costs. This illustration documents the common types of costs that must be accounted for in a Cost-of-Service Analysis.
The methodology for determining the total Cost-of-Service involves calculating the total cost for the activity, program, or service, then calculating the total revenue earned for that activity. Costs (and revenue) can also be derived on a per unit basis. Program or activity units may include:
• Number of participants
• Number of tasks performed
• Number of consumable units
• Number of service calls
• Number of events
• Required time for offering program/service
Agencies use Cost-of-Service Analyses to determine what financial resources are required to provide specific programs at specific levels of service. Results are used to determine and track cost recovery as well as to benchmark different programs provided by DPR between one another. Cost recovery goals are established once Cost-of-Service totals have been calculated. Program staff should be trained on the process of conducting a Cost-ofService Analysis and the process should be undertaken on a regular basis.
Actual cost recovery can vary based on the Core Program Type, and even at the individual program level within a Core Program Area. Several variables can influence the
cost recovery target, including lifecycle stage, demographic served, and perhaps most important, program classification. It is normal for programs within each Core Program Area to vary in price and subsidy level. The program mix within each Core Program Area will determine the cost recovery capabilities.
With approved cost recovery goals, annual tracking, and quality assurance, actual cost recovery will improve. Each Core Program Type can be benchmarked against itself on an annual basis.
Cost Recovery Best Practices
Cost recovery targets should reflect the degree to which a program provides a public versus individual good. Programs providing public benefits (i.e., Essential programs) should be subsidized more by DPR; programs providing individual benefits (i.e., Value-Added programs) should seek to recover costs and/or generate revenue for other services. To help plan and implement cost recovery policies, the consulting team has developed the following definitions to help classify specific programs within program areas.
• Essential programs category is critical to achieving the organizational mission and providing community-wide benefits and therefore, generally receive priority for tax-dollar subsidization.
• Important or Value-Added program classifications generally represent programs that receive lower priority for subsidization.
» Important programs contribute to the organizational mission but are not essential to it; therefore, cost recovery for these programs should be high (i.e., at least 80% overall).
» Value-Added programs are not critical to the mission and should be prevented from drawing upon limited public funding, so overall cost recovery for these programs should be near or in excess of 100%.
Classifications of Programs & Cost Recovery Expectations
Essential Programs
Important Programs Value-Added Programs
User Fees/Private Good
Pricing
Pricing strategies are one mechanism agencies can use to influence cost recovery. Overall, the degree to which DPR uses various pricing strategies is rather sporadic. However, pricing tactics are primarily concentrated in residency, customer’s ability to pay, age segments, and to a much lesser degree in group discounts and by location. Currently, the Core Program Area that utilizes the largest variety of pricing strategies is Education and Enrichment (five different strategies used), followed by Fitness and Wellness and Social Activities (four different strategies used), and Athletics (three different strategies used).
Durham’s progressive pricing approach ensuring access to programs no matter a resident’s ability to pay is extremely important to ensure equitable access to parks and recreation services and the City is to be commended for that strategy. That approach can and should continue and it can be easily coupled with ensuring those who can afford to pay are paying appropriately for important
and value-added programs. Expanding the fee for service approach for those who can afford to pay for programs and services will provide additional resources to DPR to expand programs and services and help fund infrastructure improvements while also leveling the playing field for all residents. Recognizing and valuing the intent to ensure all residents have access to DPR programs, DPR should consider implementing some additional strategies, where deemed appropriate, to ensure all income levels in Durham are accessing and benefiting from DPR programs. Maintaining a variety of pricing strategies is also useful to help stabilize usage patterns and help with cost recovery for higher quality amenities and services.
Additionally, staff should monitor the effectiveness of the various pricing strategies they employ and adjust as necessary. It is also important to regularly monitor for local competitors and other similar service providers as an increase in competition may alter program pricing.
Figure 4.39
Mini Business Plans
The consulting team recommends that Mini Business Plans (2-3 pages) for each Core Program Area be created and updated on a yearly basis. These plans should evaluate the Core Program Area based on meeting the outcomes desired for participants, cost recovery, percentage of the market and business controls, Cost-of-Service, pricing strategy for the next year, and marketing strategies that are to be implemented. If developed regularly and consistently, they can be effective tools for budget construction and justification processes in addition to marketing and communication tools.
Program Development & Decision-Making Matrix
When developing program plans and strategies, it is useful to consider all the Core Program Areas and individual program analysis discussed in this Program
Assessment. Lifecycle, Age Segment, Classification, and Cost Recovery Goals should all be tracked, and this information, along with the latest demographic trends and community input, should be factors that lead to program decision-making. Community input can help staff focus in on specific program areas to develop new opportunities for various target markets including the best marketing methods to use.
A simple, easy-to-use tool similar to the figure below will help compare programs and prioritize resources using multiple data points, rather than relying solely on cost recovery. In addition, this analysis will help staff make an informed, objective case to the public when a program in decline, but beloved by a few, is retired. If the program/ service is determined to have strong priority, appropriate cost recovery, good age segment appeal, good partnership potential, and strong market conditions the next step is to determine the marketing methods by completing a similar exercise as the one seen below.
Program Evaluation Cycle (with Lifecycle Stages)
Using the Age Segment and Lifecycle analysis, and other established criteria, program staff should evaluate programs on an annual basis to determine program mix. This can be incorporated into the Program Operating/Business Plan process. A diagram of the program evaluation cycle and program lifecycle is found on the following page. During the Introductory Stages, program staff should establish program goals, design program scenarios and components, and develop the program operating/business plan. Regular program evaluations will help determine the future of a program.
Program Development Stage
Beginning Establish Program Goals
Design Program Scenarios & Components
Conduct/Operate Program
If participation levels are still growing, continue to provide the program. When participation growth is slowing (or non-existent) or competition increases, staff should look at modifying the program to re-energize the customers to participate. When program participation is consistently declining, staff should terminate the program and replace it with a new program based on the public’s priority ranking and/or program areas that are trending nationally/ locally, while taking into consideration the anticipated local participation percentage.
Program Evaluation Stage
Conduct Regular Evaluation Based on Established Criteria Slow to No Participation Growth Declining Participation
Develop Program Operating/Business Plan
Mature/Saturated Stages
Look at market potential, emerging trends, anticipated participation, priority rankings & evaluations to Modify Program
Update Program Goals/Business Plan & Implement
Sustained/Growing Participation
Decline Stage
Terminate program & replace with a new program based on public priority ranking, emerging trends & anticipated local participation percentage
Figure 4.41
Maintenance Assessment
PROS Consulting reviewed with the Park Maintenance staff their overall approach to park maintenance in Durham parks. Currently all maintenance operations operate out of one maintenance shop for the entire city. Staff indicated they are working on substations, but these were not created at the time of this review. The maintenance staff indicated they manage 1,940 acres of park land. This includes the total acreage of parks and trails. They passively manage the acreage in the forested areas of the parks and intensely manage the higher use activity areas of the parks and trail from March 1st to October 31st. The rest of the year is dedicated to leaf and snow removal, facility repairs, maintenance projects and tree and bed prep and planting. The major park maintenance season is March 1st to October 31st. Staff indicated the money to maintain parks comes for a voter approved ½ penny sales tax is renewed every year and monies from the general fund budget. The funds are split between maintenance staff and maintenance projects.
The one maintenance shop the maintenance staff operate out of is large enough to support the southern area of the city with indoor workspace and outside spaces to store equipment but is inadequate to serve the entire city. In addition to the shop space, the maintenance staff are challenged significantly with the amount of time the crews spend driving to northern parks in the city from this southern location. It is not efficient if the city calculates the time that staff drive from one park to the next across the city. Staff indicated they spend up to two hours a day driving.
Staff indicated they have the right amount of equipment to do their jobs in the field. They are behind however in newly authorized and replacement vehicles due to the backlog created because of COVID for automotive manufacturing suppliers and associated supply chain issues.
Key maintenance leadership staff indicated that appropriate staffing is a major issue, especially for part-time and seasonal staff. Staff noted that they struggled to fill part-time staff positions during COVID. They are not having that issue this year. Further, the Maintenance Supervisor has been submitting requests to convert 5-6 part-time staff positions that are funded March-October to year-round full-time positions for some time, citing efficiencies in hiring, training, retention, and expanding use of parks in
the winter season due to warmer temperatures. The focus now is to do year-round general park clean-up which used to slow in the winter. The maintenance division is broken up into four districts with little coordination across each district in sharing resources, equipment, and training.
The maintenance division does use some volunteers to help with workload, but it is limited based on the staff ability and time to train the volunteers. Staff indicated to the Consulting team that no formal training program is in place within DPR or within the city for new park maintenance employees before they start their work in the field. It is all learned in the field as they start their work. There is however risk management training for all employees. A wholistic training and onboarding process needs to be established for park maintenance staff, both full-time and part-time and for seasonal staff so they can operate in the most efficient manner.
No Wi-Fi exists in their maintenance facility which limits communication for the maintenance staff and with the rest of the DPR staff. Staff have cell phones with unlimited data plans, however, the supervisors indicated that the Wi-Fi signal is very low, and staff have to go outside to make a call on their cell phone.
The staff has been working on a park-by-park maintenance plan that has not yet been finalized. Maintenance standards are loose in relationship to consistency across the park system. The maintenance staff indicated that they classify their parks as level 1 and level 2 parks and facilities. The staff noted they do follow maintenance standards for paint pallets for outside of park related buildings. They also follow standards based on frequency of use for DPR programming and resident use.
In level 1 parks the biggest issue is dealing with irrigation on sports fields, fencing issues, and controlling access to sports fields. Staff indicated that they have Bermuda grass on their sports fields that works well until they get frost.
Homeless individuals in parks are a major problem in 25% of the parks and staff are challenged with how to manage homeless encampments. The staff does not have training in how to deal with homelessness in the parks. Approximately 25% of the parks have homeless individuals living in the parks, which limits the public’s
use of these parks. Clean up time is unpredictable based on what occurred the night before. Staff have a lot of fear in working in these parks as well as how to deal with aggressive dogs the homeless folks have where they live in the parks. Animal Control handles off leash dogs in the parks. Maintenance staff do not feel park and recreation leadership is concerned about their safety and feel that the safety of homeless individuals is more important than their safety. The City utilizes the Heart team and CIT Team for addressing homelessness issues and they have issued letters of trespassing for repeat offenders.
The city does have an encampment policy to deal with homelessness in parks, but they have repeat offenders. There are also areas where repeated policing does not work with the returning population. In two places DPR is planning for landscape changes to make the facilities more conducive to positive activities and restrict negative activities in the parks. The staff do not track the costs to manage the problems and the impact on the park and the users of the parks.
Leadership in parks, social service organizations, the police department, the city manager’s office, elected officials, and judges all need to create a strategy on how
to manage homelessness in parks as a collective group and to support each other. Staff indicated that the police department is understaffed with lots of vacancies. The DPR used to have park rangers through the late 90’s but they were absorbed into the city police department and are no longer available to work in parks unless there is a problem. Staff feel the park ranger program should never have gone away.
Staff listed thirteen parks that have high levels of homelessness and noted they have difficulty working in and cleaning up the messes that are created by the individuals who live in these parks. Maintenance staff also feel that the public is not using these parks for their intended purpose and that some of the trails are not safe either for people to use because of homeless individuals in the parks. The maintenance staff indicated that DPR hires off duty police officers in hot spots in the parks on weekends when most of the public is in the parks to protect them when using the parks. Staff indicated that they should receive hazardous duty pay for cleaning up these encampments in the parks. These parks have become places where social ills of society are playing out in the city.
Maintenance supervisors indicated they do park maintenance inspections on the maintenance standards they do have in place. The city has Citiworks Asset Management software to track work orders and their inventory. However, they do not track the maintenance cost as part of their budget process. They do not have a data analyst on staff to track costs and improve maintenance practices and service delivery. Staff indicated they know their budgets well. They indicated that the city council has been good to the department, but more is needed.
Planning staff indicated they do their best in tracking ADA compliance and connectivity but more needs to be done in this area of the park system.
Maintenance staff reported that design principles have not been adopted for neighborhood parks, community parks, trails and special use parks but should be incorporated into this Master Plan.
Maintenance staff indicated that they are good at the technical side of managing parks such as mowing, weed control, forestry, managing trash, cleaning of facilities, repairing of park related equipment, managing graffiti, and managing landscaping in the parks. It is the social issues that they struggle with and need help with in overcoming the obstacles they face in the parks. The staff indicate they have a graffiti removal standard in place and work with a graffiti impact team. They do have designated places for graffiti placement in parks at Central Park and Walltown Park.
The staff indicated they do not track lifecycle maintenance in the parks of the various equipment and replacement needs of amenities located in parks. They do have an Asset Management Plan in place. Their requests are made through CIP although ½ penny is allocated on a yearly basis. Indoor facilities are requested through MR plan managed by General Services. Staff indicate there are two ½ penny trail maintenance workers assigned to trail maintenance. One half penny is also available for trail maintenance. These standards are laid out in the Trail Condition Assessment. Three million dollars was allocated and spent from CIP dollars renovating seven miles of trail. There are no maintenance endowments in place for rehabbing facilities when needed in the parks system.
Park inspections are conducted by Maintenance staff each month. Playgrounds are inspected by non-maintenance staff three times a year.
The landscape division was transferred from general services a couple of years ago and has been doing a good job for the department and the city as a whole.
The Urban Forestry Division is short-staffed in the General Services Department, and they only have (3) arborists on staff for the whole city with (2) vacant positions at the time of this assessment. Staff indicate that the city contracts with external vendors for much of their three-related work. The city has a tree canopy ordinance, but it has been difficult to enforce with the amount of development occurring in the city.
Other issues that the staff is reeling from are how to deal with climate issues, impacts from hurricanes, flooding problems in parks, heat and ice storms all affecting their time to keep parks safe and inviting to users of the system. Natural areas in the city are primarily managed by the park and recreation system and some are managed by the Stormwater Division. The city does not have an overall natural areas management approach and some elements are managed by individual departments that are responsible for managing individual areas by designated departments in the city. The city should allow all interdepartmental collaboration efforts to be coordinated through parks.
Key Findings
• Establish written maintenance standards for each park, trail, sports complex and indoor facility and tie staff time to the standards based on what is required for full-time employees, part-time employees, seasonal staff, and contractors. Tie equipment needs to people as it applies to each specific crew.
• Match equipment needs to park functions and crews along with equipment that is shared by everyone.
• Acquire a maintenance technology champion in the system to track work orders that can be tied to what it costs to maintain the system. Add Wi-Fi to the maintenance facilities to allow for better communication with all staff in the department and the police department. Add tablets in maintenance trucks to record issues in the field and document safety concerns in parks and the daily costs to articulate the maintenance needs of staff working in the field.
• Develop staffing needs based on functional hours tied to operational standards and type of employee classification to be as efficient as possible.
• Develop an additional maintenance shop operation north of downtown that can cover the parks on the north side of the city, downtown parks, and northern trails to reduce driving time cost and increase the number of staff hours maintaining existing parks versus driving.
• Develop a lifecycle replacement schedule based on the current parks infrastructure that needs to be updated to keep parks safe and that can provide a quality experience for people of all ages.
• Look to balance the park system location of parks and recreation amenities across the city to address underserved areas of the city by a park. This should be completed in the Cityworks/GIS system the city has in place. Apply maintenance standards to all parks and amenities in the system.
• Update the design of some parks so they accommodate greater use and needs in the city by referring to the Asset Management Plan needs assessment.
• Work with safety forces within the city to allow greater safe access to park maintenance staff in encampment parks that allows them to cleanup of these park sites and to make it safe for the neighborhoods and the community to be able to use these parks in a safe manner.
• Establish a pricing policy for revenue producing sports fields to create enough revenue to keep these sports fields in a quality level of condition for league games and tournaments across the city.
• Create a strong brand for each city park through appropriate signage, color schemes and how to use the parks in a safe manner.
• Right size the park staff in specialty areas such as urban forestry, landscape design, natural areas management and general park maintenance across the city under parks control.
• Update existing recreation facilities and amenities in parks by modernizing them such as pools, sports fields, neighborhood playgrounds, trails, to meet the demand for parks in the city and meet new design standards for a quality park experience in the city.
• Develop a natural resources management plan for the park and recreation system and how to manage these natural areas to provide a quality experience for hikers, mountain bike users looking for a natural experience without degrading the natural areas of the park they are using.
• All program staff within the Department and the parks maintenance staff need to plan together the maintenance standards both desire for a quality experience in the parks.
• Update Durham Central Park to accommodate more special events, farmers market and positive resident usage with Durham Central Park, Inc.
• Create more operational funding for parks through increased impact fee to reflect the impact of development on parks, as well as exclusive access fees for sports fields and picnic shelter reservations, and entrance fees to cover some operational costs at pools, recreation centers, and special event sites in the city.
• Develop Key Performance Indicators (KPI’s) for all aspects of park maintenance so the leadership in the system can accurately articulate what is working well in park maintenance and what is not working well.
• Send at least two park management staff to NRPA Maintenance Management Schools to learn best practices in all aspects of park maintenance work and teach and train the existing staff on these principles in their daily work.
Technology Assessment
PROS Consulting reviewed the DPRs current technology situation, examining its use and needs for hardware, software, and internet access. Technology is critical to the Department’s ability to function effectively; as stated by staff, the Department is entirely reliant on technology. The Department relies on the City’s IT Team to serve and meet DPRs technology needs. Currently the DPR technology needs are managed by the Department’s Business Services Manager. There is not a DPR staff position solely dedicated to managing the park and recreation systems technology needs. The city uses Cityworks and GIS databases for tracking lifecycle management of assets and for data mapping. This system should incorporate all parks, facilities, and amenities in the system.
During COVID, DPR phased out all its paper processes. Being cognizant of the need to ensure access for all residents, DPR has many tools in place to serve residents who do not have access to the internet or technology, those who are not computer savvy, and residents with visual or physical limitations. The Department has word/ pdf versions of its documents, Chrome books and computers available for use at recreation centers and the administration office, and provides technical assistance as needed to Durham residents.
Currently, the city is rolling out updates to devices citywide. This process includes phasing out older devices and upgrading staff to new devices, and giving most staff the capability to be mobile, phasing out most desktops for laptops and tablets, except for administration staff at buildings and centers. All older devices are on a replacement schedule such that all upgrades should be completed within the next 1.5 years. Administrative, office, and field staff have the tools they need to perform their work. All maintenance staff are issued city cell phones to log their work in the Cityworks maintenance management software. Some staff cell phones can be used as Wi-Fi hot spots and some of the tablets have WiFi enabled credit card readers. The staff indicated there are no major concerns with hardware.
The Department uses a variety of software systems to manage and operate the parks and recreation system including Microsoft Office 365 to perform office operations; Enpira to conduct energy analysis; Lenel S2 for door/facility access and building security; Kronos for
timekeeping and payroll; Adobe Creative Suite for graphic design, video editing, web development, photography; Eco-Counter for cyclist and pedestrian counting and data analysis; ACTIVENet for recreation registration and facility reservations. The software systems are meeting DPRs needs, however the full capacity of some of the systems are not being utilized. The Department is preparing to transition to a web-based version of Kronos, providing the mobile application for staff who work outside of the centralized office. DPR is piloting software that remotely manages restroom locks to reduce or eliminate vandalism and homeless camping out in the restrooms. There are mixed results in this pilot and DPR has yet to determine whether it will be beneficial to purchase this software.
The software systems are managed by teams within the Department which work well for all the software systems except ACTIVENet. Given the complexity and expansiveness of the ACTIVENet software, DPR needs a dedicated staff position to manage ACTIVENet and its features and updates, aligning ACTIVENets capabilities with the needs of the Department, keeping staff up to date on the software’s features, and providing staff training on the software. While ACTIVENet meets DPR needs, staff reported several other challenges the Department experiences with ACTIVENet including:
• ACTIVENet is capable of documenting long range activities/programming but the Department does not forecast out too far ahead.
• ACTIVENet can create schedules for leagues, however, Department staff do not necessarily want to use this component because of special, nuanced scheduling preferences staff want to preserve that are not able to be accounted for in the software. The software lacks the “personal touch” that recreation staff prefer.
• The Department is challenged with retrieving ACTIVENet data because often there are not links to the data.
• The Department does not use the full capacity of the software, some of which are driven by policy, some by staff, and some because the Department does not have dedicated staff to focus on the software.
The city and DPR have implemented a file sharing system from an old SharePoint system and network drives and the city will be rolling out an entirely cloud based system over time. Within DPR, staff indicated that there is quite a bit of inconsistency of use of the file sharing system. Many staff are still using their own filing systems and not integrating those files into the DPR file sharing portal.
There is free Wi-Fi that is officially sanctioned at one recreation center. It was reported that other centers may be using unsanctioned Wi-Fi. The City IT Department is committed to providing Wi-Fi in the centers, but the installation keeps getting pushed back. The most recent delay is due to the City’s switch to fiber. It has been communicated that Wi-Fi will not be installed at the recreation centers until the conversion to fiber is completed. Staff
have a wired connection and should not be using any Wi-Fi that may exist.
With technology being such a foundation for how society and the Department functions and operates, the Department needs to continue to make investments in technology. Staff communicated several additional technology needs for DPR including internal technology testing, research and development, and staff training, all separate from the current data and reporting roles within the Department; fully functioning Wi-Fi for staff in recreation centers; Wi-Fi for public use in the recreation centers and parks; and the evaluation and updating of Department policies ensuring processes and workflow are compatible with software systems.
Key Findings
• Support the IT staff position within DPR that manages DPRs technology needs (i.e., data management, hardware management, software management, IT training, and integration and alignment of the technology with Department policies and practices) and serves as the liaison with the City’s IT Team.
• Creation of a dedicated staff position to manage the recreation registration and facility reservation system is needed to manage ACTIVENet. This position would be responsible for managing the software, its features and updates, integrating use of the full capacity of the software within DPR, aligning ACTIVENets capabilities with the needs of the Department, keeping staff up to date on the software’s features, providing staff training on the software, integrating and aligning policies and practices with the software, and keeping current with recreation software advancements for evaluation of updates or implementation of a new software system for the Department.
• Continue to support a fully functioning Wi-Fi system at community centers and park locations where staff work to ensure consistent, quality WiFi to allow staff and guests to perform their work productively and in a timely manner.
• Installation of fiber for Wi-Fi at recreation centers and parks with installation of Wi-Fi at recreation centers first then a rollout plan for installation in city parks, with initial focus on the City’s larger parks.
• Develop file sharing protocols for DPR staff with a timeline for transitioning Department files to the Department file sharing portal.
• Develop and implement ongoing and comprehensive technology training for DPR staff with particular focus on employees who are less comfortable/savvy with technology.
• Examine expanded use of the existing software systems to maximize the benefits to DPR while integrating and aligning technology, policies, and practices.
• Within the next 4 – 6 years, conduct research for, and develop and issue an RFP for a new recreation software system to keep current with software advancement.
Communication Assessment
DPR has made significant investment in their abilities to effectively engage with the community. The department has an internal communications team dedicated to quality communication efforts internally and externally. The communications team also leads and assists departmental and organizational efforts in culture building. The communications assessment is intended to gain a better understanding of the work the communications team does and what challenges, if any, they face in executing their critical work for the department.
has begun meeting to discuss department issues. Staff reported that they believe the P.U.L.S.E. Advisory Group is being received positively within the Department.
Staff shared that effective communication has proved to be a challenge for DPR. Staff, for example, have believed that digital communication is the best way for people to access information, but not everyone they are trying to reach is savvy with technology and different groups prefer other communication approaches. Staff shared their observations of a communication difference within Durham. Durham staff shared that some portion of the communityprefers in-person communication. Since DPR has embraced technology platforms some community members, notably members of the Latino community, will often miss deadlines for registering for programs and this is particularly an issue with DPRs most popular programs, like swimming lessons. DPR has provided solutions to this, including allowing for over-the-phone registration, but are aware that there is an awareness gap for these workarounds that still need to be addressed.
Internal communication has also posed challenges for DPR. DPR provides a variety of services, with staff working at multiple locations at various times of the day and week, thus creating daily communication challenges across the department. Staff work in silos, often focused within their own individual work groups. Also, many staff who work in the field feel they are not as involved and not included in decision making. The DPR Director wanted to create the opportunity for 2-way communication within the department to improve communication, improve decision making, and address department practices and policies that need to be improved. The P.U.L.S.E. Advisory Group, a staff advisory board that does not include management, was created in 2023 to help address these internal communication challenges. The DPR director selected the inaugural group of staff to be part of the Advisory Group.
P.U.L.S.E. has been in place for a couple of months and
There is an inherent assumption within DPR that information flows up, down, and across the department, but staff noted the reality is that information flow does not happen. To address these concerns regarding flow of information, the Communications team has transitioned from a quarterly staff newsletter produced manually as a PDF to a bi-monthly e-newsletter. This allows for linked information, external resources, calendars, etc. to be included and shared easily across the department. The newsletter generally includes program highlights, employee development, upcoming events, staff recognition, new staff announcements, photos, and links to DPR’s blog. The e-newsletter is intentionally formatted for ease of use and access across various devices and allows for more timely information sharing.
Staff reported as well that they are impressed and amazed at how they “get stuff done.” Every year the department develops an annual work plan which at the time seems impossible to achieve, yet when the year ends, and they look at what was accomplished during each year, they are amazed with how much they accomplish. Staff also reported a high level of self-accountability within the department and that people are about getting the work done. A good example of this level of commitment and work is the department’s approach and effort in going through the CAPRA re-accreditation process. Not only did they take on this multi-year effort, but they noted that it truly was a team effort, and, in the end, they met every CAPRA standard. Staff were clear in recognizing that they come together well – they have their squabbles and disagreements, but they come together and do a good job for their customers.
DPR has several reports that staff are responsible for completing, and the varying reports have different deadlines and different audiences with often much of the same information. To streamline the reporting process and improve operating efficiencies, DPR has established a collaborative process that involves submitting reporting needs to a cross-departmental Microsoft List where multiple staff members can pull and submit data. This
has streamlined the information gathering process so that multiple staff members aren’t having to issue duplicative requests for the same information to complete reporting tasks.
Staff noted that DPR is doing much around community engagement to build trust within the community, especially in communities and neighborhoods that have been historically underserved and under resourced. They noted that more resources are needed to do this work - more people and more funding - to effectively break down barriers and build trust before any productive work can be done to discuss park and recreation projects, programs and initiatives in these neighborhoods and communities.
As part of their efforts in building a positive and cohesive culture, DPR embarked on a re-branding process to understand how the department wanted to be perceived by those they serve and how the community views DPR as an organization. DPR’s defined purpose in this exercise was to create a strong culture of servant leadership, build trust with the public, and better serve the community. Through internal and external engagement DPR sought to understand their external brand, how the public perceives the department; internal brand, how the department is perceived by staff; and aspirational brand, how the department wishes to be perceived moving forward. DPR continues to work on enhancing their internal/external brand to meet their aspirations. These efforts are prioritized as part of the department’s work plan, strategic plan, and ongoing engagement activities.
Key Findings
• Create a Communications work team that includes DPR staff and members of diverse communities in Durham to learn about and develop and implement strategies to meet the various communication needs of Durham residents to ensure equitable and community centric communication approaches.
• Continue to advance the work of the P.U.L.S.E. Advisory Group – supporting their efforts and time commitment to the Group; ensuring their issues, ideas, and solutions are discussed across the organization and brought forward to management to improve how the department operates; and ensuring all voices are heard in creating a positive and fulfilling work environment for employees.
• Conduct benchmarking of other parks and recreation agencies on their production of employee newsletters – how they are produced, how often they are produced, the staff time it takes to produce them, and the content areas included in the newsletters – to inform and guide the development of long-term approaches for DPR.
• Support the “we get stuff done” attitude and commitment of employees by recognizing individual and team efforts that staff undertake to “get stuff done.”
• Conduct benchmarking of other park and recreation agencies and cities on their production of reports for their organizations – what reports and content that are produced, how often are they produced, and whether they have a streamlined approach for producing the reports – to inform and guide development of a streamlined approach for DPR.
• Conduct benchmarking of park and recreation agencies that have integrated diverse community engagement strategies ensuring they are engaging and building trusting relationships with historically underserved and underrepresented communities. Learn about the engagement journeys of these departments, strategies they tried that did not work, strategies they have employed that are working, and understanding the level of financial and staff commitment to this effort. This work will inform and guide development of a strategy for DPR to implement.
Durham Parks and Recreation Centennial Celebration Photo Gallery
Introduction
To help Durham Parks and the Recreation Department achieve financial sustainability, there are two identified approaches. The first is to incorporate sustainability principles and the second is to create more funding options. This assessment is a guide for moving forward in a positive manner to continue to maintain a great park and recreation system that the community is expecting from this master plan process.
The sustainable principles are broken down into priority one, two, and three, so staff can make changes that will benefit the budget more quickly.
To professionally manage the business elements of a park and recreation agency there are areas of emphasis in which the park system must be proficient. These areas include the following:
• Government Finance
• Cost Recovery
• Enterprise or Revenue Management
• Operations Management
• Fundraising
• Partnering
No two park and recreation agencies are alike. Their differences stem from how they are governed to how they are funded and operated. The purpose of this finance assessment is to assist Durham park and recreation leaders and managers to identify the things that they will need to address to ensure future financial sustainability for their park and recreation system.
If an agency is familiar with how they resolve these important issues, the future sustainably of their agency will be successful.
The following information provides suggested sustainability practices for Durham Parks and Recreation.
Topics of Sustainability Importance
Government Finance
• Priority 1: Currently Durham Parks and Recreation owns and manages a multimillion dollar system, not including the cost of the land. The city is working on where those assets are in their lifecycle. This will allow the Department to determine where capital improvements need to be made and the cost benefit of those improvements to the system. Best practice agencies are investing at a minimum of 3-5% of total asset value each year to protect the assets they own.
• Priority 1: The Department needs to increase their dedicated ½ penny for parks to 2 cents for parks. This increase in dedicated funding sources they can count on annually to support their operational and capital needs.
• Priority 1: The Business Development office /staff should pursue grants, establish alliances, create partnerships and sponsorship including earned income opportunities. This office should also help write mini business plans for recreation centers, aquatic centers, skate centers, special events and core program areas.
• Priority 1: Develop a cost benefit analysis on all capital improvement projects prior to developing these future parks or facility sites to determine if it is financially feasible and whether operational dollars will be available to support it.
• Priority 2: Understand the real details of “Capital.” What are the carrying costs of land, facilities, and equipment? Do not burden the Department with capital projects that cost the agency more to own than the land is worth.
• Priority 2: Consider setting up a specific revenue fund for each revenue producing park or facilities to allow the staff to manage in a government business model like a convention center, airport, or fieldhouse can operate in most communities.
Cost Recovery
• Priority 1: Replace revenue-producing equipment every 5 years to keep the user’s experience relevant and competitive with other service providers.
• Priority 1: Include senior management staff in all design decisions. Force landscape designers and facility architects to outline the maintenance costs on all parks and facilities they design to ensure their design is aligned with the Department’s maintenance and recreation operating budgets.
• Priority 1: Know your true costs to deliver program services, maintain parks, trails, and facilities, both direct and indirect costs so that the Department can determine the true costs of services on a unit cost basis. This helps to determine how to establish equitable partnerships and when to outsource tasks that are too expensive to provide for public employees.
• Priority 1: Develop mini business plans on any program service or facility that the Departments operates that costs more than $100,000 a year to operate with a goal to deliver a cost recovery goal of 50% at a minimum.
• Priority 1: Classify services based on core essential, important, and value-added criteria and then price services that are furthest away from their mission at full cost recovery levels. This requires a pricing policy that is updated every five years. Durham needs an update to their pricing policy.
• Priority 3: Consider acquiring additional land along trails to set up the potential for land leases for concession operations for a land lease to help support operational costs of the trails system.
Enterprise or Revenue Management
• Priority 1: Set up specific revenue producing facilities and program budgets to maximize the use and ability to earn revenue to offset operational cost where appropriate. This could include aquatic centers, the new skate center, sports complexes, rental centers, and appropriate community centers.
• Priority 1: Develop an annual revenue plan. This helps staff to learn how to manage revenue and costs collectively together.
• Priority 1: When building a park or trail system, require an agreement from the elected officials that you will receive the appropriate amount of operational funding to ensure that the Department can maintain these facilities once developed so you do not put undue pressure on the agency’s budget. This requires that the staff develop an operational impact cost for each capital improvement developed for the system.
• Priority 1: Budget for marketing and branding of revenue producing facilities at 3-5% of total operational costs.
• Priority 1: Do not give any group in the community a larger than necessary discount because of their age, their occupation, their military service etc. All citizens are valuable and should be treated the same. Understand the size of the market for core programs and facilities and how much of the market the Department controls. Is there an opportunity to penetrate the market further?
• Priority 1: Track user analytics to understand who and how often patrons are using the system. Putting in Placer AI, which is a great tool to measure the economic impact of special events and tournaments in the city, should be considered.
• Priority 2: Every three years, bid out services where the costs are higher than in the private sector to keep cost low for users. Know the demographics of users to determine their needs and capability of supporting programs and capital costs.
• Priority 2: Develop a financial process that allows the Department to keep some of its earned income revenue in their operating budget without lowering the tax dollars received to be able to improve the service provided. The Department should not be penalized for generating revenue to keep the system well positioned for the future.
• Priority 2: Find dedicated funding sources that the Department can count on annually. Currently the city has a dedicated sales tax for parks, but staff seem confused about how it truly works in the city.
• Priority 2: Design parks and recreation facilities for efficiency, productivity and to produce revenue that will offset operational costs at a predetermined cost recovery goal.
• Priority 2: Inform users and partners of what the Department’s costs are so they appreciate the value the Department is putting in place for the facility or service. This strategy will help to reduce the entitlement of users.
• Priority 3: Keep the Department’s costs competitive in the marketplace.
• Priority 3: Study and understand market strategies that will make a measurable difference and improve the economic positioning of the program or facility the system is targeting.
Operational Management
• Priority 1: Train staff regularly on business principles, cost recovery, cost of service and customer service.
• Priority 1: Hold staff accountable to cost recovery goals for programs, facilities and parks the Department maintains with revenue to support those services. This includes tracking performance outcomes.
• Priority 1: Develop sustainability performance outcomes to hold all divisions accountable.
• Priority 1: Hold employees accountable to productivity standards of facilities and programs and cost recovery levels and give them measurable outcomes to manage to and report out quarterly or every six months.
• Priority 2: The Department needs to consider not maintaining things in the park system that nobody uses and remove them from the park system or provide these facilities or amenities to another agency to manage that has a need for it to limit the stress on the Department’s budget.
• Priority 2: Manage by standards and track the costs to implement each type of maintenance standard for park maintenance and program services.
• Priority 2: Track population trends and figure out how demographic changes in the city or area of the city will affect the Department in the future.
• Priority 2: Track employee costs of similar sized park systems. Review the wages and benefits for all positions every five years to understand how competitive the Department wages are with other systems. Judge if the city is below an acceptable level with or above the standard desired for wages and benefits. The goal for total wages including salaries and benefits should be no more than 55-60% of total operational budget costs.
• Priority 2: Employ the right people for the right job, for the right pay, to achieve the right outcome and benefits to the agency. Learn and apply the correct functionality and desired productivity of key positions within the system so that it is not personality driven but functionally driven.
• Priority 2: Reward employees for efficiency and productivity.
• Priority 2: Develop annual revenue and efficient work sessions with your staff.
• Priority 2: Professionally train staff in business management of concession operations.
• Priority 3: Train staff to understand the management strategies of their supervisors as one way to prepare them for positions at the next level of responsibility.
Fundraising
• Priority 1: Find philanthropists and use the Park Foundation to support users that do not have the ability to pay for services and have them invest in these users through the park foundation or friends group established for this purpose. These are typically done through some form of a scholarship program offered by the agency.
• Priority 2: Teach and train your key park and recreation related boards or city leaders that Friends Groups, Conservancy’s, and the Park Foundations are not in competition with them but need to function as your advocate. Placement of the right types of people on these boards is a particularly important process that needs to be taught and put into practice. These types of boards can meet the level of fundraising desired by the agency if the right people are on the board. Management agreements between each fundraising group need to be completed each year with goals and dollars to be raised for what purpose and benefit to the Department.
• Priority 3: Departments should consider establishing more park-related Friends Groups, or the development of a future Park Conservancy to help raise money for the system or a specific park as needs to continue grow. Example. Average Park foundations in cities the size of Durham typically raises 1-2 million a year for the parks system they represent. Being in a university town people recognize that fundraising is an important element of how government can support its capital development and operational costs. Some cities like Durham also create a Park Conservancy’s for a specific large park or attraction. Example: The city of St. Louis has a Park Conservancy for Forest Park called Forest Park Forever that has raised over 200 million dollars for updating Forest Park and it manages elements of the park on a yearly basis to keep their investment working for the long term. They raise on average approximately 4 million a year for operations of that park. There are more than 2,000 conservancies across the United States helping to manage elements of parks in their city. Conservancies typically manage signature parks in cities across the United States based on Trust for Public Lands.
Partnering
• Priority 1: Departments the size of Durham, typically have an approved partnership policy that is written to support public/public partnerships, public/not-for-profit partnerships and public/private partnerships which is extremely limited now in the department. When there is not a working agreement in place, entitlement gets established by a well-meaning partner that makes it difficult for the park system to manage them in the future. This requires separate operational policies for each type of partnership that is established. Establish partnership principles that the Department will manage so as not to entitle the partner in any way.
• Priority 1: All partnerships must have working agreements with measurable outcomes. They are to be reviewed at least every two years as one means to hold each partner accountable.
• Priority 1: Never allow a private or a not-for-profit group to make money off Durham’s Parks and Recreation Department owned facilities without the Departments receiving a share of the gross revenue. Make sure the Department’s split covers the true costs and then the revenue desired is based on operating pro-forma from the event they are creating in the recreation or park facility it is being provided in. This can be in the form of sports tournaments, special events, and special fundraisers that are held on park system property that require a host of organizational and maintenance support.
• Priority 1: Contract out services where the Department does not have the capital dollars to operate and maintain the facility, park, or service that the system owns to a competitive cost per acre level. This could include concessions, revenue producing facilities and events.
• Priority 2: Do not partner with any single group unless the Departments have their own direct and indirect costs determined. Understand the equitable investment the potential partner or partners are putting into the relationship as well as what the city costs are to be in the partnership.
• Priority 2: Determine sponsorship opportunities and levels of sponsorships for the Departments system every five years. Hire a business development staff person who knows the value of sponsorships to organize and put into practice the partnership program. Most revenue producing government facilities sells sponsorships and advertising for facilities and events they manage.
• Priority 3: Ask the private sector to develop team building days in the Departments’ parks and facilities by creating cleanup and fix up days. This builds community support, and it will enhance the Departments’ parks or facilities to a much higher level, and it gives the corporate partner a selling point to their value in the community.
CHAPTER THE FUTURE
Introduction
The recommendations in this Plan emphasize goals and action items to enhance Durham’s parks and recreation offerings. There is a focus on maintaining and modernizing existing facilities while also preparing to grow the system strategically to accommodate the rapidly growing population and diverse community interests. As the City carries out the implementation process over the next ten years, many projects will evolve based on changing trends, availability of funding, and the evolving needs of a growing community. With emergence of needs come challenges related to prioritizing and implementing new projects in the community. The recommendations and action items in this Plan are rooted in community values and the identified Guiding Principles to help meet these opportunities and challenges and serve as a valuable decision-making tool for staff and elected officials.
When implementing the items in this plan and addressing any new needs identified in the future, the following criteria should be used to make strategic decisions regarding implementation prioritization.
Guiding Principles Compatibility
These criteria will ensure that the projects and initiatives considered for implementation are consistent with the guiding principles of the plan. The following questions can help evaluate these criteria:
• Does this project provide or improve equitable access to parks and facilities for residents of Durham?
• Is this project responsive to the established needs of the community?
• Does this project respond to future growth patterns and pressures?
• Will this project provide improved organizational performance and allow DPR to better respond to community needs?
• Is this project improving the resilience of DPR’s system or the City of Durham?
Community Needs
The community needs criteria leverage findings form the community engagement process, primarily findings from the scientific survey and the public opinion survey as well as feedback received from DPR Staff and focus groups. These criteria ensure that the actions are validated regularly against what the community has expressed as their needs and desires. The following questions can help evaluate these criteria:
• Is this project in alignment with the priority investment rating scales found in the scientific survey?
• Is this project in alignment with the feedback received from the public in meetings and on the public input survey?
• Does this project address findings from the forecasted needs analysis?
• Does this project align with other city-wide plans and their goals?
Parks System Advancement
Parks system advancement criteria are related to providing an excellent parks and recreation service and high-quality amenities and programs by addressing the detailed technical project implementation questions. These questions are divided into the following three categories:
• Degree of Urgency
» Does this project need attention to ensure public health, safety, and welfare?
» Does this project need attention to comply with current building codes and regulations?
» Will this project protect natural resources which otherwise may be lost if not addressed immediately?
» Is this project a unique opportunity resulting from other projects that may be lost if not prioritized?
• Financial Impact
» Will this project create long-term operational efficiency and financial loss if not addressed promptly?
» Does this project generate revenue for the parks and recreation department?
» Does this project generate revenue through strategic partnerships or time-sensitive grant funding opportunities?
• Compatibility with City Policies and Planning Efforts
» Is this project compatible with the Comprehensive Plan and Future Land Use Map?
» Does this project build upon other regional planning efforts to connect Durham residents to regional and state-level recreation opportunities?
» Does this project address existing gaps in the system to achieve a cohesive parks and recreation system?
Degree of Urgency
Guiding Principles
A vision for Durham’s parks and recreation system is founded on guiding principles that were established through active engagement with the public, DPR staff, stakeholders, and appointed officials. Guiding principles are further refined through various analyses of the City’s parks and recreation system. This plan has established five guiding principles:
• Durham Parks and Recreation puts Fairness First
• Durham Parks and Recreation is Rooted in the Community
• Durham Parks and Recreation has Foresight
• Durham Parks and Recreation will be Bull City Great
• Durham Parks and Recreation prioritizes Stewardship
Fairness First
This guiding principle illustrates a commitment to putting fairness first in all that DPR does. The future of Durham is one where all community members, regardless of socioeconomic status, race, age, or ability, have equal opportunities to benefit from the parks and recreation services that DPR o ers. Recommendations stemming from this principle focus on creating inclusive, accessible, and well distributed parks that contribute to the overall well-being of the population. Recommendations also focus on reinvesting in parks in a way that prioritizes historically underserved communities and telling the long histories of Durham’s community.
Rooted In The Community
This guiding principle centers DPR in the community to make sure that what is being o ered to the community is clearly in line with their wants, needs, and expectations. Recognizing that parks and recreation are a significant component of the community’s culture necessitates that future o erings are relevant, and that decision making is clear and transparent to the community. Recommendations stemming from this principle focus on maintaining the responsiveness of the department, increasing transparency, and making sure that engagement e orts continue to be thoughtful and impactful.
Foresight
This guiding principle acknowledges the rapid growth of Durham and shows a commitment to being proactive when it comes to coping with growth. Rapidly growing communities like Durham often struggle to balance providing for existing residents while also preparing to extend high quality services to new areas of the community. Recommendations related to this principle seek to ensure the Department is maintaining an understanding of growth trends, is providing a high level of service to the community and has plans in place regarding future expansion as the city grows.
Bull City Great
This guiding principle recognizes that providing a high-quality experience to the community starts with having a strong organization that is committed to continuous improvement of themselves and the services they are providing. Providing diverse and meaningful experiences to the community requires a lot of internal work and coordination. Recommendations related to this principle seek to ensure that the department has adequate technology resources, critical training, and collaboration across the organization. These recommendations also focus on ways to elevate operations and maintenance system wide.
Stewardship
This guiding principle acknowledges that climate change and its impacts are real and have an impact on the community and that parks play a vital role in improving the environment and mitigating impacts of climate change. The community already recognizes parks as a major component of their quality of life in terms of social, physical, and mental wellbeing. Parks can also be critical pieces of environmental infrastructure that can mitigate numerous environmental challenges and impacts. Recommendations related to this principle are centered around how to leverage parks as gamechangers in addressing stormwater runo , air quality, excessive heat, biodiversity, and site contamination.
first in all that DPR does.
Maintain a commitment to putting
FFA
1.1: Develop a 15-year plan to increase Durham’s park acreage and number of park sites throughout the city balancing investment in high priority equity areas and new growth areas without access. Focus on trail acquisition, park proffers, and land acquisition opportunities.
FFA 1.2: Incorporate recommendations and priority actions from the current Open Space Plan into plan identified in
x FFA 1.3: Audit all parks for quality of experience. Select low-scoring parks in high priority equity investment zones for developing or updating site specific concept plans.
EFA 1.1.
FFR 1: Grow and maintain the parks and recreation system equitably.
FFA 1.4: Identify priority parks and facilities for implementing year round restrooms.
DPR, City Management, Finance, City Council
FFA 1.5: Increase ½ penny for parks allocation. Prioritize new funding for equity focused addressing of deferred maintenance.
FFA 1.6: Increase investment and modernize parks in all areas to provide consistent high-quality experiences across the system.
DPR x
FFA 1.7: Define and utilize minimum inclusivity and comfort standards (available facilities such as shade structures, restrooms, etc.) for developing parks in the priority equity investment areas. Incorporate universal design principles for all new playgrounds and inclusive design principles in these standards.
FFR 1: Grow and maintain the parks and recreation system equitably.
DPR, Planning, Equity and Inclusion, Community Development, Office of Economic and Workforce Development, External Partners
FFA 1.8: Develop an equity and anti-displacement strategy for all new projects as part of project initiation.Collaborate with Planning, and Equity and Inclusion Departments to deploy equity and anti-displacement strategies.
DPR x
DPR, Equity and Inclusion, Government Alliance on Race and Equity (GARE) x
FFA 2.1: Continue to map equity indicators every two years to identify priority areas for expanded or improved service.
FFA 2.2: Develop a DPR specific Racial Equity Action Plan and partner with Equity and Inclusion for implementation.
FFR 2: Create and maintain internal policies that promote equitycentric decision making.
DPR, Budget Office, City Manager’s Office x
FFA 2.3: Continue to advise and support in Participatory Budgeting and Equitable and Green Infrastructure programs.
FFA
3.1: Create opportunities to promote the unique stories of Durham’s history focusing on underrepresented communities and neighborhoods.
3.2: Continue to integrate historic interpretation in parks design in consultation with the community, historians, and experts.
FFR 3: Highlight underrepresented stories and history of Durham’s community.
FFR = Fairness First Recommendation FFA = Fairness First Action
Ensure that decision making and expansion of the system’s offerings are
RCA 1.1: Continue park audits with staff and community members as an engagement strategy during the planning process for major upcoming park renovations.
x RCA 1.2: Create a communications work team that includes DPR staff and community representatives to perform a consistent annual review of communications techniques. Conduct annual focus groups with residents in high priority equity investment areas to understand needs and concerns.
x RCA 1.3: Establish an annual DPR Town Hall to share annual work plan with the community. DPR x x
RCR 1: Maintain transparency in DPR decision making and communications to build trust with the community.
RCA 1.4: Develop an online dashboard of annual work plan action items to show progress.
RCA 2.1: Continue to use Durham’s “Equitable Engagement Blueprint” to develop appropriate engagement efforts at the project onset.
RCR 2: Continue robust engagement that meets the community where they are in ways they are most comfortable.
RCA 2.2: Develop a language access plan for marketing materials, wayfinding, and programming to better serve non-English speaking residents. DPR, Equity and Inclusion x RCR = Rooted in the Community Recommendation RDA = Rooted in the Community Action
x
x
x
RCA
2.3: Develop project-specific engagement campaigns to reach non-traditional park users. Prioritize engaging in community spaces such as faith-based spaces, markets, etc. to increase reach.
RCA 2.4: Complete an annual evaluation of social media strategies to assess effectiveness and adapt to increase reach.
RCA 2.5: Create a programming marketing strategy that includes an e-newsletter and social media to highlight program offerings
RCR 2: Continue robust engagement that meets the community where they are in ways they are most comfortable.
DPR x RCA 2.6: Develop a ‘Welcome to DPR’ guide targeted at new residents.
DPR, Planning, Neighborhood Improvement Services (NIS) x
RCA 3.1: Develop an internal and external engagement campaign focused on real and perceived safety to understand which parks have safety concerns.
DPR, NIS, Durham Police x
DPR x RCA 3.2: Develop Safety Action Plans to address safety concerns brought forward by the community and staff during the engagement campaign on safety (RCA3.1) that outlines safety issues and resolutions.
RCR 3: Adopt a community rooted approach to improving safety for users at DPR Parks and Facilities.
RCR = Rooted in the Community Recommendation
RCA = Rooted in the Community Action
DPR, NIS x
RCA 3.3: Establish a park ambassador pilot program to increase community investment in parks and improve safety.
DPR, Durham Police x
RCA 3.4: Work with the community to identify comfort levels with increased security measures such as expanded use of security cameras, sensor lights, and/or emergency call boxes.
RCR 3: Adopt a community rooted approach to improving safety for users at DPR Parks and Facilities.
DPR, Community Safety x
RCA 3.5: Continue CPTED audits and upgrades to existing parks and facilities.
RCA 3.6: Continue to support and advance the work of the HEART program.
DPR x
DPR x
RCA 4.1: Continue to identify ways to improve awareness and participation in DPR programs such as allowing for cross marketing at all DPR facilities.
RCA 4.2: Continue identifying barriers to program registration and explore tactics to reduce barriers such as setting aside registration slots for in person registration and/ or in-person registration fairs.
RCR 4: Expand communication efforts to connect residents to recreation programs.
RCR = Rooted in the Community Recommendation
RCA = Rooted in the Community Action
DPR x
DPR x
DPR x x
RCA
5.1: Revisit park rules and ordinances to ensure that they are promoting activation.
RCA 5.2: Create unique pop-up events at underutilized parks in the system to increase awareness and use.
DPR x RCA 5.3: Explore extending lighting hours at parks with highly desired amenities.
RCR 5: Build on amenities and programs the community loves.
RCA 5.4: Expand offerings of outdoor movies and concerts in parks throughout the city.
RCA 6.1: Continue producing and distributing DPR-branded merchandise at events to increase DPR visibility and create a sense of pride around parks and rec.
DPR, Parks Foundation x
DPR x RCA 6.2: Partner with local artists and park ambassadors to develop unique collateral that can be distributed annually. Consider allocation a portion of proceeds to the Parks Foundation.
RCR 6: Increase pride in DPR’s system and increase the department’s brand visibility.
RCR = Rooted in the Community Recommendation
RCA = Rooted in the Community Action
Proactively prepare for continued population growth to make DPR’s
FA 1.1: Update Level of Service Standards to prioritize equity and growth patterns.
Urban10 minute walk/5 minute drive
Suburban10 minute drive
Rural15 minute drive"
FA 1.2: Partner with city county/ planning to maintain an understanding of growth trends and opportunities for connecting new developments to existing parks and facilities. DPR,
FA 1.3: Develop a Close the Gap work plan in collaboration with Transportation to fill in the critical gaps in connectivity and prioritize connectivity between parks and open spaces and major destinations such as neighborhoods, schools, and mixed-use centers.
FR 1: Plan for growth and work across the organization to ensure all residents have access to the system.
DPR,
FA 1.4: Work with planning and transportation to strategically extend the pedestrian and bicycle network as part of private development projects or other capital investments to overcome barriers to access.
Foresight
DPR, Planning
FA 1.5: Explore opportunities to mandate connections to adjacent public greenways and trails within private development. Develop clear greenways and trails design standards that the private development community can use to ensure consistency.
DPR, Equity and Inclusion
FA 1.6: Work with other City departments to develop regular mapping of barriers to park access. Use this inventory in annual work planning efforts and budgeting.
FR 1: Plan for growth and work across the organization to ensure all residents have access to the system.
DPR, GoTriangle x x
DPR, Regional Partners x x
x
DPR, City Management, County Management
FA 1.7: Explore partnership opportunities with GoDurham to couple public transit passes with program registration.
FA 2.1: Work with neighboring municipalities and counties to identify regional connection opportunities.
FA 2.2: Using Comprehensive Plan LOS Mapsidentify land along the Eastern and Southeastern edges of the city where growth is high to bank land for future system expansion.
FA 2.3: Explore combining Durham Parks and Recreation and Durham County Open Space to create a single department in order to increase efficiency in providing services along high growth areas between the City and County.
FR 2: Work with county and municipal partners to deliver high impact projects in regional growth areas along municipal and county borders.
= Foresight Recommendation
= Foresight Action
DPR, Durham County
FA 2.4: Develop site concept plans for any identified publicly owned land in high growth areas along the City and County edge.
FA 2.5: Identify partnership opportunities with third party providers for indoor facilities until DPR has the capacity to build new indoor facilities throughout the city.
FR 2: Work with county and municipal partners to deliver high impact projects in regional growth areas along municipal and county borders.
FA 3.1: Maintain integration with the development review process.
DPR, Planning
DPR, Planning x
FA 3.2: Evaluate and revise as needed detailed requirements in the UDO for subdivision standards for open space to ensure that open space dedications are useable, relevant to community desires, and sustainable.
FR 3: Maintain an active role in the development process and seek out opportunities to take advantage of development activity.
FA 4.1: Identify opportunities for expansion of Downtown Open Space focusing on use of smaller pieces of land to create a network of green space.
FR 4: Continue to deliver high-quality experiences in Downtown Durham.
DPR, Downtown Durham Inc. x
FA 4.2: Support parks, recreation, and open space goals identified for Downtown in the Downtown Open Space Plan, DDI plans, and others.
FR = Foresight Recommendation
FA = Foresight Action
FA 4.3: Develop and add ‘Downtown Park’ to existing park classifications framework. The Downtown Park classification should emphasize flexibility in terms of size to allow for smaller unique open space in Downtown.
FA 4.4: Implement Durham Central Park concept plan. DPR, Downtown
FR 4: Continue to deliver high-quality experiences in Downtown Durham.
Downtown
Inc.
FA 4.5: Partner with Downtown Durham Inc. to find innovative opportunities for public recreation programs and special events.
FR = Foresight Recommendation FA = Foresight Action
Improve internal processes and operations and seek out opportunities
projects, programs, and
BCGA 1.1: Develop a plan for implementing Wi-Fi access at key parks and facilitiesprioritize parks in close proximity to schools and in High Priority Equity Areas.
BCGA 1.2: Investigate smart parks technology advancements to manage park operations such as irrigation sensors, park visitation counts, need-based trash pick up, etc.
BCGA 1.3: Conduct a technology audit to identify ways to enhance operational efficiencies.
BCGA 1.4: If need is identified upon completion of BCGA 1.3, create a dedicated IT staff position within DPR to manage IT needs and technology training for staff manage recreation registration and facility reservation system.
BCGR 1: Invest in expansion of technology internally and externally to improve efficiency in the department.
x BCGA 1.5: Prepare to develop and issue an RFP/RFQ for a new recreation software system.
x BCGA 1.6: Standardize internal reporting methods and responsibilities to gain operational efficiencies.
x
x
x
x
x
BCGA
2.1: Continue staff training on equity topicscitywide and department initiatives/goals and position specific training.
BCGA 2.2: Continue program for providing training to gain professional development and certifications to all staff. Including national programs and schools.
BCGA 2.3: Encourage employees to attend professional conferences and training sessions to enhance customer service experience.
BCGA 2.4: Provide staff training to empower the staff to handle de-escalation and challenging customers/ park users in respectful ways.
BCGA 2.5: Educate staff on the citywide resources available for people in need. Staff should also be trained to identify these situations such as need for food, shelter, medicines etc.
BCGA 3.1: Develop an additional maintenance shop north of Downtown that can cover parks on the north side of the city.
BCGA 3.2: Match equipment needs to park functions and crews along with equipment that is shared by everyone.
BCGR
2: Provide appropriate level of professional training for DPR Staff.
BCGR 3: Increase Maintenance and Operations staffing and invest in Operations and Maintenance assets to better meet system maintenance needs.
BCGR = Bull City Great Recommendation
BCGA = Bull City Great Action
BCGA 3.3: Develop maintenance KPI’s for all aspects of park maintenance to make tracking and problem solving easier.
BCGA 3.4: Update staff safety standards to address current safety concerns identified in RCA 3.1. Assess work locations and monitor crime activity to ensure all staff feel safe in their workplace.
BCGA 3.5: Provide training opportunities for hiring and interviewing processes for both supervisory and non-supervisory staff. Also, when feasible, provide professional development opportunities.
BCGR 3: Increase Maintenance and Operations staffing and invest in Operations and Maintenance assets to better meet system maintenance needs.
BCGA 3.6: Establish a pricing policy for revenue producing sports fields to create enough revenue to keep these sports fields in a quality level of condition for league games and tournaments across the city.
BCGA 3.7: Develop staffing needs based on functional hours tied to operational standards and type of employee classification to be as efficient as possible.
BCGA 4.1: Undertake a comprehensive fee study to improve cost recovery for DPR programming while maintaining equitable access to programming.
BCGA
4.2: Create mini business plans for each core program area and update them annually. These should evaluate if the program area is meeting desired outcomes, cost recovery goals, and pricing and marketing strategies for the next year.
BCGA 4.3: Implement an annual review cycle for programs to determine appropriate programming mix for the next year.
BCGA 4.4: Continue to test new programs identified in national and regional trends to maintain a fresh slate of programming that could become long-term programs for DPR.
BCGR 4: Continue delivering high quality programming while exploring new offerings and cost recovery.
BCGA 4.5: Partner with local healthcare agencies and health related non profits by providing access to DPR facilities to offer health and wellness related programming.
BCGA 5.1: Continue development of annual work plan to assess progress and set incremental goals in achieving long term recommendations outlined in this plan.
BCGA 5.2: Continue to invest in recruitment efforts to ensure that staffing levels and qualifications are adequate as the system continues to expand.
BCGR 5: Continue to strengthen internal organization and strategy to maintain high levels of customer service.
BCGA 5.3: Implement DPR University program that will allow staff to get training on offerings department wide and go to different centers to understand offerings and operations.
BCGA 5.4: Continue DPR partnership with the Durham Parks Foundation and provide staff support as needed to supplement Parks Foundation efforts.
BCGA 5.5: Continue efforts to maintain CAPRA accreditation compliance.
BCGA 6.1: Develop clear partnership guidelines that establish different levels of partnership and levels of DPR support and engagement.
BCGA 6.2: Create a wish list to prioritize the most valuable partnerships and funding opportunities for maximizing community impact and resource development.
BCGA 6.3: Explore partnership opportunities with RTP to expand the system in or around RTP.
BCGR 6: Identify and leverage partnership opportunities for programming, funding, and volunteerism.
BCGA 6.4: Develop and maintain partnerships with conservation focused organizations to identify and protect lands and educate regarding existing conservation efforts.
x
DPR, Duke Health x
DPR, Regional Universities x
DPR, Durham Public Schools x
x
BCGA
6.5: Implement youth volunteering program to provide volunteering hours for high school curriculum requirements.
BCGA 6.6: Partner with Duke Health to expand access to exercise amenities within parks or facilities.
BCGA 6.7: Partner with regional institutions to complete a comprehensive inventory to assess the ecological value of DPR and the County’s parks and conservation areas.
BCGR 6: Identify and leverage partnership opportunities for programming, funding, and volunteerism.
BCGA 6.8: Explore partnership opportunities with Durham Public Schools to increase access to field space.
BCGA 7.1: Audit open space currently held by General Services and create a transition plan to incorporate them formally into the DPR system.
BCGA 7.2: Assess additional maintenance needs created by taking in any new open space and adjust resource allocation accordingly.
BCGA 7.3: Explore creative means to expand parks system, rooftop parks with public access in mixeduse developments, decked parks over roads, and linear parks adjacent to or part of right-of-way.
BCGR 7: Collaborate cross-departmentally to identify existing assets or potential assets that can be integrated into DPR’s system.
BCGA 7.4: Identify duplicative efforts related to operations and programming with other City Departments and work to streamline those efforts within DPR.
Embrace and highlight the role parks play
SA 1.1: Work with the Stormwater Division to develop GSI standards and performance metrics for park projects that sets a minimum amount of treatment to be accomplished using GSI. DPR, Stormwater x
SA 1.2: Develop GSI maintenance standards and train staff appropriately in maintenance of GSI features in DPR parks and facilities.
SA 1.3: Develop a policy that sets forth design guidelines for any new parks or facilities adjacent to floodplains.
SR 1: Investigate and invest in best practices regarding stormwater management to improve parks as vital pieces environmental infrastructure.
SA 1.4: Consider renovating parks that suffer from recurring flooding into stormwater parks that are intentionally designed to provide environmental uplift. DPR, Stormwater x
x
SA 2.1: Establish a new landscape maintenance plan that prioritizes environmentally friendly maintenance practices.
SA 2.2: Explore integrating standards set in the Sustainable Site Initiative (SITES) into DPR Park Design Standards.
SR 2: Increase biodiversity and use of native and sustainable landscapes across the system.
x
x
x
DPR, Planning x
SA 2.3: Increase biodiversity by establishing biodiverse planting areas within all DPR Parks, focused on incorporation of native plantings and conversion to meadows where feasible.
SA 2.4: Continue use of established planting guide and seek opportunities to innovate with inclusion of resilient native plants in all new park planting areas.
SR 2: Increase biodiversity and use of native and sustainable landscapes across the system.
DPR, Planning x x
SA 2.5: Explore opportunities to utilize alternative funding sources to reduce resource strain in improving environmental benefits of parks.
SA 3.1: Identify ways to amend the UDO to protect natural areas, sensitive habitats, and encourage compatible development along the perimeter of parks.
SA 3.2: Continue to be a partner with Planning to identifies ways to maintain 30% of land in conservation per the Durham Comprehensive Plan.
SR 3: Identify opportunities to increase conservation efforts and introduce more natural open space into the system.
DPR x
SA 3.3: Identify funding mechanisms that are dedicated to sustainability practices. Change from nice to have to need to have.
SR = Stewardship Recommendation
SA 3.4: Protect, enhance, and restore key areas of high ecological value and biodiversity identified in the ecological inventory recommended in OEA 6.10. DPR x x
SR 3: Identify opportunities to increase conservation efforts and introduce more natural open space into the system.
SA 4.1: Coordinate with General Services and Planning to identify opportunities for coordinated reforestation efforts with parks planning exercises.
SR 4: Protect and expand Durham’s Urban Tree Canopy.
DPR x
SA 5.1: Assess all activity areas within DPR parks including playgrounds and fields for implementation of cooling features such as shade structures, misters, etc. Integrate cooling features into DPR parks, focused first on parks in the urban core of the city.
SR 5: Equip parks to deal with escalating extreme heat events and keep users safe.
CRA 6.1: Develop an environmental education plan that addresses how to integrate passive and active education opportunities in DPR parks and facilities. DPR x
SR 6: Integrate educational opportunities to highlight DPR’s sustainability efforts and expand climate awareness.
SR = Stewardship Recommendation
SA = Stewardship Action
APPENDIX
Equity Index Map Methodology
For each of the below indicators, if a census tract satisfied the indicator it was given 1 point. After all indicators had been assessed the tracts were identified as Low Priority, Medium-Low Priority, Medium-High Priority, or High Priority depending on their total score. Score cutoffs were:
• High Priority: More than 6
• Medium-High Priority: More than 3, less than 6
• Medium-Low Priority: More than 1, less than 3
• Low Priority: 1 or less Indicators used, source is indicated in parentheses*
• High Poverty Index (HUD)
• Racially or Ethnically Concentrated Areas of Poverty [R/ECAP] (HUD)
• High percentage of nonwhite population (Census)
• High percentage of population without a High School Diploma (Census)
• High percentage of population with a disability (Census)
• High percentage of population without health insurance (Census)
• High percentage of population without access to a vehicle (Census)
• High population density (Census)
• High percentage of population under 18 (Census)
• High crime rates (US DOJ)
• High environmental burden (US CDC)
*All data was pulled prior to Federal action removing some data from public access.
Park in Floodplain Analysis: List of Identified Parks & Facilities
As part of the Sustainability Assessment, a GIS analysis was performed to identify DPR parks and facilities within the floodplain. The result and analysis are included in the Plan document in the Sustainability Assessment. These parks were also overlaid on the CDC’s Environmental Justice Index to identify parks that were in the floodplain AND in an area of high environmental burden. The map is included below for reference and the following page contains a list of parks and facilities identified.
Parks and Facilities in the Floodplain (Parks bolded with an asterisk are also in areas with high envrionmental burden):
• Birchwood Park*
• Campus Hills Park*
• Drew/Granby Park*
• East End Park*
• Elmira Avenue Park*
• Glendale Heights Park
• Indian Trail Park
• Leigh Farm Park
• Long Meadow Park*
• Northgate Park
• Old Chapel Hill Road Park
• Rockwood Park
• Sandy Creek Park
• Sherwood Park*
• Weaver Street Park*
• Westover Park
• Whippoorwill Park
• White Oak Park*
• Little River Fishing Facility
• Twin Lakes Park*
• Forest Hills Park
• River Forest Park
• Rock Quarry Park
• Southern Boundaries Park
• Walltown Park
• Snow Hill Road Park
• Old Farm Road Park
• Lake Michie Recreation Area
• Holly Grove Campground
• Wilkins Road Park
• Spruce Pine Lodge
• Lake Michie Boating Area
• West Point On The Eno Park
STARS Score Park Assessment Worksheet
PARK OR FACILITY NAME:
TIME OF DAY:
WEATHER:
APPROXIMATE NUMBER OF USERS
OBSERVED:
Physical Assessment
Connectivity
• Does the park have multimodal access?
» Transit or close by transit stop
» Greenway trail / MUP / Bike + Ped
» Sidewalk access to park (external)
Structures/Architecture
• Physical appearance, materiality, age of the building
• Ease of access from park amenities
• Adjacency to park amenities
• Restroom / bathrooms / water fountains
• Aquatics / pools
Score Notes
Score Notes
Figure A.1: DPR Parks and Facilities Within the Floodplain
Recreation Score Notes
• Play Areas
» Play structures
» Safety surface
» Evidence of inclusive design elements
» Evidence of any safety hazards
• Courts and Fields
» Play surface condition
» Safety
• Other
» Splash pads
» Zip lines / ninja
» Skate parks
Furnishing & Signage Score Notes
• Benches, trash receptacles, umbrellas, etc.
• Fences - alignment with the function they serve as barrier or safety boundary
• Seat walls
• Lighting
• Wayfinding
Landscape Score Notes
• Overgrowth
• Presence of exotic, poisonous or invasive species
• Safety hazards with trees
• Overall vegetation health
• Focus on native and drought tolerant species
• Natural areas / open space
Infrastructure Score Notes
• Parking
• Utilities
• Stormwater
• Grading / drainage
• Paths and sidewalks (internal circulation)
Cleanliness (Adapted from NYC Parks PIP) Score Notes
• Lack of litter
• Pet waste
• Graffiti
• Broken glass
Human Experience
Arrival Score Notes
• Is the park easily noticeable from the street? Visibility of the park
• Are there signs, monuments that direct visitors to the park?
• Is the pedestrian experience pleasant and welcoming while arriving at the park?
• Level of care reflected through well-kept amenities, cleanliness, vegetation, and furnishings
• ADA Accessibility to and between amenities
Perception of Safety Score Notes
• Presence of comfortable places to sit or engage with amenities for longer timeframe
• Shaded areas (structures or vegetation)
• Proximity to rest rooms and water
• Proximity to weather shelters
• Presence of clean and functioning restrooms
Sense of Belonging/Feeling Welcome Score Notes
• Signage and rules - policy, bilingual
• Amenities align with cultural preferences and surrounding communities
• Opportunities for all ages and ability levels
Community Connections Score Notes
• Diverse amenities/ things to do
• Presence of different age groups and abilities
• Places for people to gather and socialize
• Flexible spaces to accommodate small groups or larger events
• Places for solitude and contemplation
DURHAM CENTRAL PARK VISION PLAN
SITE CONTEXT + ANALYSIS THE PLAN
01 03 05 02 04 INTRODUCTION
COMMUNITY ENGAGEMENT
APPENDICES
CITY OF DURHAM
ACKNOWLEDGMENTS
DPR Leadership
Wade Walcutt, Director
Tom Dawson, Principal Planner
2022 Board of Directors
Executive Committee
Kharmika Alston, President
Allie Jaarsma, Vice President
Becky Hacker, Secretary
Michael Shiflett, Treasurer
Nil Ghosh, Past President
Chantal Winston, At-Large
Helena Cragg, At-large
Courtney James, At-Large
General Board
Ann Alexander
Martha Arango Lopez
Kaitlyn Breedlove
Ellen Cassilly
Javiera Caballero
Ann Evans
Dan Jewell
Jose Santibanez
Connell Smallwood
Allen Wilcox
Curt Eshelman
DCP Inc. Staff
Erin Kauffman, Executive Director
Bryce Brooks, Development & Communications Coordinator
Ben Weber Ex-Officio/Emeritus
Hayley Thompson
Lee Ann Tilley
Alexandra Valladares
Hank Majestic
McAdams - Project Prime
INTRODUCTION
Durham Central Park is a prominent urban park located in downtown Durham, North Carolina. Its history dates back to the late 19th century when it was established as a railway hub. Originally, the area was occupied by a bustling railroad depot and various industrial facilities. However, as the railway industry declined, the area fell into disuse and became an abandoned space.
In the early 2000s, community members and local organizations recognized the potential of this neglected area and began advocating for its transformation into a vibrant public space. The nonprofit organization Durham Central Park, Inc. was formed in 2001 with the mission of developing and managing the park. Through grassroots efforts, fundraising campaigns, and collaborations with the city government and private donors, Durham Central Park gradually took shape.
Today, Durham Central Park spans approximately five acres and serves as a cultural and recreational hub for residents and visitors alike. The park features walking trails, open green spaces, playground, public art, and a skate park. It hosts a variety of events throughout the year, including concerts, festivals, farmers’ markets, and community gatherings. Additionally, the park showcases public art installations and serves as a venue for outdoor fitness classes, food trucks, and other activities. It welcomes visitors of all ages and diverse backgrounds and serves as a community magnet to bring people together. The diversity of amenities within Durham Central Park serves to reinforce shared experiences and forge new connections within the growing and changing community of Durham. By offering a wide range of recreational, cultural, and social opportunities, the park becomes a dynamic gathering place that appeals to people of all ages, backgrounds, and interests. Durham Central Park plays a vital role in enhancing the quality of life in Durham by providing accessible green space, fostering community engagement, and supporting local arts and culture. Its success is a testament to the power of grassroots activism and collaborative urban revitalization efforts.
Why New Vision Plan?
The City of Durham’s decision in 2023 to commission McAdams, to update its system-wide parks and recreation vision plan demonstrated the city’s commitment to enhancing its public spaces and recreational facilities. Concurrently, the city, in collaboration with Durham Central Park Inc., recognized the importance of updating the vision plan for Durham Central
Durham Central Park
Durham Central Park Logo
Park to ensure its continued relevance and effectiveness in serving the community’s needs. The following factors contributed in updating the park vision plan and proactively plan for its future:
1. Changing Needs + Priorities – Over time, the needs and priorities of the community evolve. A new plan provides an opportunity to reassess these needs and ensure that the park’s design and amenities align with current community preferences.
2. Population Growth + Urban Development – Durham, like many cities, is experiencing population growth and urban development. As the city evolves, there is an increased demand for public spaces like Durham Central Park in the urban core. A new vision plan allows for strategic planning to accommodate growth and changing demographics.
3. Infrastructure + Maintenance Requirements – As parks age, infrastructure requires upgrades or maintenance. A new plan will identify areas where improvements are needed and outline strategies for ensuring the long-term sustainability of the park.
4. Incorporating Innovation + Best Practices – The field of urban planning and park design is constantly evolving, with new technologies, design trends, and best practices emerging. A new plan provides an opportunity to incorporate innovative ideas and approaches to enhance the functionality, accessibility, and sustainability of the park.
5. Community Engagement + Input – Engaging the community in the planning process is essential for ensuring that the park reflects the desires and aspirations of residents. Developing a new plan allows for opportunities to gather input from stakeholders and incorporate their feedback into the park’s design and programming.
Project Process
The process began with McAdams’ design team conducting a site visit to Durham Central Park to assess its existing conditions. This involved evaluating the park’s layout, circulation, amenities, infrastructure, and overall functionality. These observations provided valuable insights into areas that may require improvement or enhancement.
open house. This intensive collaborative effort brought together planners, designers, stakeholders, and community members to brainstorm ideas and concepts for the park’s revitalization. Through interactive exercises and design charrettes, participants had the opportunity to contribute their creativity and expertise to shape the vision for Durham Central Park’s future. Focus group meetings were organized to gather input from various stakeholders, including city officials, community members, and local organizations. These discussions allowed for the identification of key priorities, concerns, and aspirations related to the park’s future development. Input from diverse perspectives ensured that the updated vision plan would reflect the needs and desires of the broader community.
The culmination of this process was a community open house, where three options for the proposed vision plan for Durham Central Park were presented to the public for feedback and review. This event served as an opportunity for community members to provide additional input, ask questions, and express their support or concerns regarding the proposed changes.
Overall, the collaborative effort between the City of Durham, Durham Central Park Inc., and the McAdams design team exemplifies a proactive approach to urban planning and community engagement. By involving stakeholders at every stage of the process and soliciting input from the broader community, the updated vision plan for Durham Central Park is poised to reflect the collective vision and aspirations of Durham residents for a vibrant and inclusive public space.
A 3-day design workshop was conducted by the McAdams team that included site visits, focus group meetings, a design charrette, and a community
Key Themes
The project team established a strategic approach to understanding the diverse needs and priorities of the community by focusing on four key themes. These themes—history, nature, connectivity, and evolving community uses—provide a framework for exploring different aspects of the park’s existing conditions and identifying opportunities for improvement.
Telling Our StoryHistory
This theme emphasizes the importance of preserving and celebrating the historical significance of Durham Central Park. It involves acknowledging the park’s past, including its origins as a railway hub, as well as recognizing the diverse communities and cultures that have shaped its identity over time. By honoring the park’s history, the vision plan can ensure that its heritage is preserved and integrated into future developments.
Engage with NatureNature-Based Connections
Nature-based connections highlight the integration of natural elements within Durham Central Park. This theme underscores the importance of green spaces, trees, plantings, and ecological features that contribute to biodiversity and enhance the park’s environmental sustainability. By prioritizing nature-based design principles, the vision plan can promote ecological stewardship and provide opportunities for visitors to engage with the natural world.
Evolving Community Needs - Growth
This theme recognizes the dynamic nature of Durham’s community and the evolving needs associated with growth and development. It involves anticipating demographic changes, population growth, and shifting trends in recreational preferences. By engaging with the community to understand their evolving needs and aspirations, the vision plan can adaptively respond to changing circumstances and ensure that Durham Central Park remains relevant and responsive to the needs of its users.
A Welcoming Place -
Connectivity & Mobility
Connectivity and mobility focus on enhancing accessibility and ease of movement within Durham Central Park. This theme addresses the need for well-designed pathways, pedestrian-friendly infrastructure, and inclusive amenities that accommodate diverse users, including pedestrians, cyclists, and individuals with disabilities. By prioritizing connectivity and mobility, the vision plan can create a welcoming and inclusive environment that encourages and fosters social interaction.
Site Context
Durham Central Park is 4.4 acres in Downtown Durham and is located between Interstate 85 and Highway 147. Hunt Street borders it to the south, Rigsbee Ave to the east, West Corporate Street to the north, bisected by Foster and Roney Streets and a portion of the western edge is west of Roney Street. It is south of the Historic Durham Athletic Park and Durham Food Hall, north of Durham Bulls Athletic Park and Durham Performing Arts Center and surrounded by many other downtown landmarks within a twenty-minute walk. The park’s significance in the history of Durham is evidenced by its proximity to several historic districts and landmarks.
The American Tobacco Trail runs through the park to provide connectivity within Durham and to the south, ending at Jordan Lake. The American Tobacco Trail is 11 miles of paved trail that follows an old CSX railroad. Additionally, the future Durham Rail Trail will provide 1.8 miles of connectivity in downtown and to North Durham and is a five-minute walk from the park.
Ellerbe Creek runs through Durham Central Park. Water from Ellerbe Creek flows into Falls Lake, then to the Neuse River to the Albemarle-Pamilco Sound before emptying into the Atlantic Ocean. The site is part of the Ellerbe Creek watershed which has the highest population density of the watersheds in Durham.
SITE CONTEXT + ANALYSIS
Since the park’s inception, this area of downtown Durham has experienced significant investment and growth and this growth is anticipated to continue. The growth and successes of Downtown will further continue the impact on Durham Central Park justifying the need for this vision plan and a more durable park in the future.
Durham Central Park- Surrounding Context
Park History
• Railroad Origins – Durham Central Park’s history traces back to the late 19th century when Durham was a burgeoning railway hub. The area where the park now stands was initially occupied by railroad depots and related industrial facilities. The railroad played a crucial role in Durham’s early growth and prosperity, facilitating transportation of goods and connecting the city to broader markets.
• Industrial Decline – As the railway industry declined in the mid-20th century, many of the industrial facilities around the park became obsolete or abandoned. This led to a period of disuse and neglect in the area.
• Community Revitalization Efforts – In the late 20th and early 21st centuries, community members and local organizations recognized the potential of the abandoned space and began advocating for its transformation into a public park. This marked the beginning of efforts to revitalize the area and create a vibrant community space for residents to enjoy.
• Formation of Durham Central Park, Inc. – In 2001, Durham Central Park, Inc., a nonprofit organization, was formed with the mission of developing and managing the park. This marked a significant milestone in the park’s history, as it represented a concerted effort by the community to reclaim the space and repurpose it for public use.
• Creation of Durham Central Park – Through grassroots efforts, fundraising campaigns, and collaborations with the city government and private donors, Durham Central Park gradually took shape. The park was officially established as a public space, spanning approximately five acres in downtown Durham.
• Park Development + Programming – Over the years, Durham Central Park has evolved into a cultural and recreational hub for the community. The park features walking trails, open green spaces, playgrounds, a performance pavilion, and hosts a variety of events throughout the year, including concerts, festivals, farmers’ markets, and community gatherings.
Durham Station (December 1941)
Open Durham
Durham Over the Decades
Curt Eshelman and Allen Wilcox walk the area. City bond referendum approved with $1.2 million for property acquisition. Property acquisition completed. DCP, Inc was established as a nonprofit.
Initial fundraising campaigns and community engagement initiatives.
• Butterfly Garden
•First annual July 4th Parade
•Magnolia Mural
• New plantings through volunteering efforts Liberty Arts Pavilion Constructed
Durham Central Park opens to the public. DCP Emerged as a vibrant cultural and recreational destination . Ongoing efforts focused on further improving and expanding DCP.
Park Master Plan Update Process Begins.
Site Assessment
At the beginning of the vision planning process, a thorough inventory and analysis were completed to understand the existing conditions and opportunities for the park. The inventory and analysis phase served as a crucial first step in the vision planning process, laying the groundwork for subsequent stages of design, community engagement, and implementation. By gaining a comprehensive understanding of the park’s existing conditions and opportunities, planners and stakeholders were better equipped to develop a vision and strategy that aligned with the needs and aspirations of the community while respecting the park’s natural and cultural heritage. These observations are noted below.
Zoning + Land Use
All parcels in the project area are zoned DD-C, Downtown Design – Core. This is one of the City’s Design Districts. The Downtown Design (DD) District is established to encourage bicycling, pedestrian, and transit-oriented development through regulations appropriate to the downtown area. It focuses on the form of the private and public realm instead of on use and intensity. The DD Districts are regulated by sub-district, DCP is in the Core sub-district.
Site Organization
The site of Durham Central Park is characterized by its division into three distinct parcels, each serving a specific purpose:
1. Recreational Parcel – This area is dedicated to recreational activities and amenities. It is situated between Rigsbee, Hunt, and Foster Streets, housing the majority of recreational facilities for visitors to enjoy.
2. Social + Cultural Parcel – Positioned along Foster, Hunt, and Roney Streets, this parcel hosts the Farmers Market Pavilion, providing a space for social gatherings, cultural events, and community engagement.
3. Environmental Parcel – Located on the western side of the park, bounded by W Corporate and Roney Streets, this wooded area serves as an environmental sanctuary, offering a natural habitat for wildlife and opportunities for passive recreation and ecological exploration.
Access + Connectivity
• Transportation Infrastructure + Pedestrian Access – Durham Central Park, nestled within the bustling urban heart of the city, benefits from a well-developed transportation infrastructure and pedestrian access points. Sidewalks flank all sides of the park, ensuring pedestrian safety and connectivity. Notably, Foster Street and W Corporate Street, serving as major thoroughfares with bustling traffic, require clearly delineated pedestrian access points to accommodate the flow of foot traffic.
» The layout of sidewalks along all streets, except for Roney Street, facilitates pedestrian movement and connectivity throughout the park. Roney Street, designated as a fire access road, adopts a woonerf approach, prioritizing pedestrian safety and a shared street concept over vehicular traffic.
» Foster Street serves as a prominent thoroughfare and a significant divider within the park, experiencing the most impact during special events through road closures. This division underscores the dynamic nature of the park, where social, cultural, and recreational activities intersect, creating a vibrant and inclusive community space.
» However, it’s noteworthy that designated bike lanes are currently absent along these roads, presenting an opportunity for future enhancement of alternative transportation options.
• Parking – In terms of parking, ample street parking is available along the roads encircling the park, including designated spots for ADA parking. Additionally, a public parking deck conveniently located at the intersection of Morgan and Foster Street, merely two blocks away, provides further parking options for visitors.
• ADA compliance – Regarding ADA compliance, the majority of sidewalks surrounding the park offer accessible entry for individuals using wheelchairs and strollers. However, entry from Hunt Street presents challenges due to steeper slopes into the site, requiring attention to ensure compliance with ADA standards. While the Farmers Market Pavilion area adheres to ADA standards, accessibility in the Woodlands area (Environmental Parcel) poses challenges due to its steep slopes, necessitating efforts to ensure compliance across all parts of this parcel.
• Connectivity to Surrounding Destinations – Durham Central Park enjoys strong connectivity to surrounding destinations, including the food hall, historic Durham Athletic Park, and Old Durham Park. The proposed Downtown Greenway project promises to further enhance connectivity, attracting more visitors to the city center and highlighting Durham Central Park as a premier destination within the urban landscape.
• Safety + Security – In terms of safety and security, the park’s central location and vibrant recreational activities, coupled with frequent special events, contribute to a sense of safety for visitors. The presence of high-rise buildings along the periphery acts as a natural surveillance mechanism, providing added security. However, attention should be paid to areas obscured from public view due to overgrown vegetation, ensuring visibility and safety throughout the park.
Landform, Landscape + Ecology
• Landform - Durham Central Park features a distinctive and varied landform characterized by undulating topography. The park’s terrain begins at a higher elevation on the environmental parcel, offering views of the surrounding area. From this elevated point, the land gently slopes downwards toward Foster Street, creating a natural gradient that frames the farmers market pavilion.
» As you approach the creek, the slopes become steeper, adding to the park’s dense woodland landscape and creating a natural boundary that separates different sections of the park. This steeper incline at the creek not only contributes to the park’s visual appeal but also plays a role in managing stormwater and supporting local ecology.
» Beyond the creek, the land rises again towards Rigsbee Avenue, reaching another higher elevation. This rise in topography helps to frame the park and provides a sense of enclosure, while also offering potential vantage points for visitors to enjoy views of the park.
» This varied topography contributes to the park’s unique character, creating a series of natural terraces that enhance both the aesthetic and functional aspects of the space. The rolling landscape encourages exploration, supports diverse plantings, and provides natural opportunities for seating, play, and social gathering.
• Vegetation – Vegetation within Durham Central Park presents a diverse landscape, blending natural urban forest areas with intentionally planted sections in the active park core. The natural landscape features a mix of indigenous trees such as pines, oaks, and poplars, characteristic of the Piedmont region of North Carolina. Complementing this, the planted landscape incorporates a palette of ornamental trees, shrubs, and grasses, creating a harmonious blend of native and cultivated greenery. Furthermore, numerous gardens dispersed throughout the park are dedicated to edible and native landscapes, offering both aesthetic appeal and ecological value.
• Urban Wildlife + Ecological Connectivity – The park serves as a haven for urban wildlife, providing essential habitat and serving as an ecological corridor for their movement, particularly within the riparian buffer. However, the connectivity of this corridor is disrupted by the piping of the stream underneath Foster Street. Despite this, visitors to the park can still expect to encounter typical urban wildlife such as birds, squirrels, and rabbits, enhancing the natural ambiance of the surroundings.
• Stream/ Riparian Corridor – The presence of a stream and riparian corridor within Durham Central Park showcases the significance of the protected Piedmont landscape and its crucial role within the Neuse River watershed. This area not only serves as a scenic feature but also offers a vital respite from the dense urban environment, allowing urban dwellers to reconnect with nature. It underscores the park’s commitment to preserving and highlighting the natural heritage of the region while providing valuable ecological benefits for both wildlife and humans alike.
Recreation Amenities
• Skate Plaza – The Skate Plaza stands as one of the park’s premier attractions, drawing enthusiastic skaters from near and far. It has become a beloved destination within Durham Central Park, thanks in part to the dedicated efforts of the skate park group. Over the years, this group has undertaken numerous enhancements to ensure the plaza’s upkeep and to introduce fresh challenges for skaters, thereby maintaining its appeal as a welcoming and dynamic space for skating enthusiasts.
• Open Lawn – At the heart of the recreational parcel lies the Open Lawn, offering a spacious expanse for leisure activities. Though its sloping terrain limits certain uses, visitors often find themselves
reclining for book reading sessions or engaging in lively games of tag, particularly enjoyable for children seeking outdoor play opportunities.
• Mount Merrill Playground – The Mount Merrill Playground stands out as another popular spot, especially frequented by young visitors. This vibrant playground sees continuous use, particularly during afternoons and around the time when elementary school children are released from their classes, providing a hub of activity and laughter.
• Park Trails – Traversing through the park are several meandering pathways that interconnect the various amenities spread across its three parcels. These looped paths not only facilitate movement but also offer an opportunity for leisurely strolls, allowing visitors to explore the park at their own pace. The natural surface trails within the environmental parcel provide a serene retreat, immersing visitors in nature and offering a welcomed respite from the stresses of urban life.
• Public Art – Durham Central Park serves as a canvas for an array of captivating public art pieces, each contributing to the park’s unique identity and enriching its cultural landscape. From the striking magnolia mural to the intricate leaf sculpture and the captivating pixel wall, these art installations not only enhance the park’s aesthetic appeal but also forge meaningful connections to Durham’s vibrant art and culture scene, further cementing the park’s status as a cultural hub within the community.
Cultural + Social Amenities
• Pavilion – The Pavilion at Durham Central Park, inaugurated in 2007, has since become a cherished cornerstone of the park. Its versatile space has played host to a myriad of memorable occasions, ranging from weddings and educational classes to lively festivals and community events. Most notably, the Pavilion serves as the bustling epicenter of the Durham Farmers’ Market, drawing locals and visitors alike to gather, socialize, and celebrate the vibrant local food scene. Serving as a hub of activity and connection, the Pavilion stands as a symbol of community spirit, fostering social bonds and nurturing a sense of belonging among park-goers.
• Gardens – Within the park’s lush landscape, various gardens have been cultivated by the dedicated members, partners, and volunteers of Durham Central Park, Inc., a 501(c)3 non-profit organization. These gardens are thoughtfully designed to showcase edible landscapes, native flora, and pollinator habitats, serving as both a sustainable food
resource and a communal space. By fostering a sense of ownership and stewardship among community members, these gardens not only contribute to the beauty and ecological diversity of the park but also cultivate a shared appreciation for its preservation and care. They serve as living testaments to the power of collaboration and collective action in nurturing both the land and the community it serves. Following is a list of gardens spread across all three parcels:
» Garden of Eatin’ - managed and maintained by SEEDS (South Eastern Efforts Developing Sustainable Spaces, Inc).
» Terrace Garden
» Grace Garden
» Sister Cities Grove
» Butterfly Garden
» Burkshire Hathaway Garden
COMMUNITY ENGAGEMENT
Overview
In August 2023, a series of engagements was held over three days to guide the development of the Durham Central Park Vision Plan. From August 13th to 15th, 2023, there were four focus group meetings, two workshops with the board and staff of Durham Central Park (DCP), three public meetings and a pop-up in Durham Central Park to engage with elementary age school children. There were over one hundred participants.
Public Meetings
Dream Big
There were three public meetings over the course of the engagement. Participants were given the opportunity to share their biggest dream or greatest wish for Durham Central Park by writing it on a tag and attaching it to a lantern. This activity was at all public meetings.
Love
Participants
Following the three-day engagement series, three pop-up engagements were held in the park. The project team connected with over 200 participants through various engagement events.
Evolving Community Uses Engaging With Nature
Today, Durham Central Park offers a venue for cultural activities and is part of a year-round, authentic, walkable neighborhood for arts, recreation, and locally-owned businesses. This vision plan can strengthen the role of the park as a hub to a changing and growing city, and help confirm and evolve desired uses and activities.
Nature-based Connections
Durham Central Park offers more than just a human-centric experience. The park’s tree canopy, understory plantings and the creek all play a role in the city’s ecological health. Durham Central Park plays an important role as a green oasis in an urban downtown. This vision plan aims to strengthen both the health of these natural systems and the role they can play in offering nature-based programming and engagement.
History
Telling Our Story
Founded in 1994, Durham Central Park is part of a larger vision to revitalize and provide a heart to the changing Warehouse District. Today, it is managed and maintained by Durham Central Park, a nonprofit Organization that aims to create and sustain a unique 5-acre urban park to engage the Durham community.
A Welcoming Place
Connectivity + Mobility
Great parks are welcoming and accessible to a wide variety of users who may arrive via diverse modes of travel - on foot, by car, by public transit or by bicycle. The vision plan aims to understand and strengthen connectivity between the park, its users and other city systems.
Public Meeting 1
The first public meeting sought feedback on participants’ ideas, concerns and hopes for the park as it currently exists.
Engagement Boards
Four engagement boards were used at the first public meeting to provide information on the park and gather preferences on four focus areas. Participants expressed their preferences by placing a dot on the boards.
Public Meeting 2
The second public meeting included the opportunity to sketch ideas for the future of the park. There were several stations for drawing and dreaming. The engagement boards were available and referenced as part of the drawing exercise.
Dig-In
The Dig-In Activity was at the first and second public meetings. Participants were asked to use a colored flag and place it on a map of the park to indicate what is working, areas of concern and areas of the park that need improvement. As part of this, they could use a sticky note to expand on why they feel this way.
Focus Groups
Four focus groups were conducted to take a deeper dive into the following topics:
• Events + Partners
• History + Heritage
• Ecology + Natural Systems
• Transportation, Connectivity + Parking
History Focus Groups
The initial idea for what is currently Durham Central Park was for it to be a great resource for the City of Durham with a neighborhood for people to live and work. The first charrette, in 1995, produced three designs and all of them included a park and the focus shifted to creating a park. The park was created through a public private partnership between the City of Durham and Durham Central Park, Inc (DCP Inc.). The site was purchased for $1.2 million by the City of Durham with money from a bond.
DCP Inc. is a 501c3 nonprofit organization run by a small staff and governed by a Board of Directors. DCP Inc. developed and built the park through an incredible amount of sweat equity. Additionally, DCP Inc. is the operator of the park. The Board has always been a great community board, ensures that things happen in the park and has a great relationship with the city.
The Board feels they are in a good place and have come a long way from the early days of not knowing how to make financial ends meet. There was share sentiment that the creation of endowment is desired to relive the time and efforts needed currently for fundraising. While the organization currently operates successfully, the next challenge will be to raise the money to build the next big thing.
It is viewed as a need for a strong public private partnership to occur to take the park to the next level. Making the park more durable, increasing funding and maintenance will need stronger support from the city.
Participants share some incredible memories and moments for the park and its development such as:
• Seeing the park full of people for the first time.
• Going to the park on Saturdays to see what volunteers showed up as well as community members and getting to know them.
• The growth of the market; it is not just a market, but a block party.
• Earth, Wind and Fire contribute concerts and seeing the diversity of people attending.
• The development and addition of the skate park.
Ecology + Natural Systems Focus Group
This focus group was conducted during a site walk in the park. Participants and conversation included the desire to highlight the existing functioning bioretention area in the park through the addition of educational signage. There is a need to regularly remove invasive plants along the stream edges in several areas to improve ecological health, sight lines from Foster Street and access to the stream.
The desire to maintain continuity between parts of the park and the idea of creating a stormwater walking tour was explored. Additionally, connections to the Durham Rail Trail and South Ellerbe Wetland project are desired. These connections could include educational signage on the watershed and stream health.
Participants identified DCP as one of the few natural areas with canopy cover in downtown and want to preserve and enhance the experience in the future of the park.
Events + Partners Focus Group
DCP Inc. hosts four major events per year, a playlist concert series and a weekly story time during the week that runs for several months twice a year. There is a strong desire to provide additional intentional programming but human capacity is a limitation.
There is a desire to have smaller spaces for programming in the future of the park. There is also a desire to have better infrastructure for programming and events such as access to power and water, occasional fencing for limiting points of access, better ADA accessibility and expanded staff to plan and run programs and events to support DCP Inc.’s mission of “providing space for community” as well as the vision, “a vibrant, urban park where everyone feels welcome.”
Additional staff resources are needed to expand programming in an intentional way that provides programs that bring in a variety of cultures and demographics to further the current demographics of park users.
Transportation, Connectivity + Parking
Focus Group
Discussion began with reviewing projects and planning efforts in the area that will impact the park or have a potential benefit or connection to the park. In recent years, several current and upcoming projects have impacted the demand for parking in the area. Nearby surface parking lots are being replaced by development and the immediate parking lot to the east of the park is likely to also be replaced with development. There was an expressed interest in a public private partnership to fund a parking deck that could be utilized by park visitors.
There was a desire to make Foster Street into a commercial shared street. Closing Foster Street to vehicles was discussed and it was shared that there are challenges with doing so through the City’s Unified Development Ordinance (UDO). The UDO is beginning an update in the near future and this update could be an opportune time to address the challenges with closing streets to vehicles. While the future design of Foster Street is not determined, there is a strong desire to include designated bike lanes.
The bus route closest to the park is on Rigsbee Avenue and is not anticipated to change in the near future. The Rail Trail project is currently in development and connecting to it is a desired opportunity. Future bike pedestrian amenities are desired such as more bike parking, an electric scooter station and bike fix it stations.
Next steps such as following up with the city if there is any utility work on the horizon. Any utility construction on neighboring streets should include coordination and exploration of opportunities for the park.
DCP Board + Staff Workshops
The first workshop with DCP Board and Staff discussed and established their desires for the process. It established that the vision plan process will launch a consolidated big picture for the park, will be a sustainable plan, include cost estimates and the vision plan will be completed in ten years.
The second workshop with DCP Board and Staff was held on the second day of engagement and began with an overview of the engagement received on Sunday. Early sketches and ideas for the park were shared and feedback was received.
Youth Engagement
Youth were engaged in Durham Central Park with a pop-up style intercept. They were asked to write their wish for the future of the park on a tag.
Additionally, youth were engaged at the public meetings by being asked to draw their dream for the park and participate in the activities.
Pop up Booth Results at Farmers
Pop Up Booth at Farmers Market Pavilion
DCP Board + Staff Workshop
DCP Board + Staff Workshop
Key Themes
Create Unity & Cohesion
Currently, the park does not feel as it if it functions as one park. Foster Street creates a division in the park. Additionally, the very northern area of the park feels disconnected.
Take it to the Next Level
Embrace decision-making grounded in a proactive strategy and unifying vision.
Preserve the Idea,
Brand & Story
The creation and mission of Durham Central Park is important to the future of the park.
Make it Welcoming, Safe & Lasting
Durham Central Park is well loved and it shows. Future improvements to the park should be durable and built to withstand high traffic. Design of the park should feel safe and accommodate all needs. Sight lines, lighting and enhanced crosswalks are some of the ways design can make people feel safe and welcome in the park.
Connect to Nature
Improvements around the stream should be done in a way to encourage park users to engage with the stream in a safe way. Additionally, opportunities to connect to nature can be created through gardens and providing safe and comfortable experiences in the park.
Estlin Haiss
The third public meeting shared a summary of engagement that was heard to date, presented three conceptual designs and received feedback on the three options.
Following the presentation on the three concepts, participants provided feedback on each concept with a score card and through conversation with the design team. Average scores for each concept, for each element and comments are summarized and presenting on the following pages.
Additionally, DCP staff and board members along with City of Durham staff conducted engagement in Durham Central Park in August. The three conceptual designs were on display and feedback was received by score cards and through conversations.
Eat, Play, Love
Tree complementary park zones centering play, market and community gathering spaces. Overall Score 3.76 Improved + expanded market event space.
Open House Feedback Session
Open House Presentation
A Creek Runs Through It
A clear, unifying trail offers a journey through a re-imagined linear park.
Foster of Dreams
Re-imagines Foster Street to offer new
Each concept had five elements highlighted for scoring. The park theme is indicated in parentheses.
• Foster of Dreams (F)
• Eat, Play, Love (EPL)
• A Creek Runs Through It (C)
The average score for elements ranks as the following, from highest to lowest:
There is a strong correlation between the top two concepts, Foster of Dreams and Eat, Love, Play and elements of those concepts generally ranking in the top two thirds. The elements of A Creek Runs Through It generally ranked in the bottom half.
Based on scoring and discussions, the top two designs are Eat, Play, Love and Foster of Dreams. The elements from both of those concepts received higher scores (above 3.7) and were favored. One exception to this is the Pop Up Children’s Play element in Eat, Play, Love with a score of 3.3. Another exception is the Children’s Water Play Feature in A Creek Runs Through It being a top ranked element with a score of 3.8. Engagement results suggest Foster of Dreams as a preference or a combination of Foster of Dreams and Eat, Play, Love.
Engagement revealed that Durham Central Park is well loved. Volunteers, staff and board members of DCP Inc., city staff and citizens all expressed a great fondness for the park and a strong desire for it to be elevated in the future while continuing to succeed. The willpower of those behind Durham Central Park will provide the impetus to reach these aspirations through the implementation of the proposed vision plan.
THE PLAN
First Date, A Walk in the Park
Durham Central Park began as a walk in the park by Curt Eshelman and Allen Wilcox, back in 1994. This walk was a beginning of a daydream to build a downtown park set within the under-valued and under-utilized warehouse district. As time passed, Curt and Allen gathered support in collaboration with Downtown Durham, Inc., and thus began the love story of Durham Central Park.
Falling in Love
Eshelman and Wilcox did not let this idea stop at a daydream. Community garnered support to develop the park that would provide a place for public art, picnics, concerts, and community gatherings – a catalyst for the neighborhood, and a venue that would serve the whole city. Over the years, the partnership between the City of Durham (which purchased the land), Durham Central Park, Inc., a nonprofit volunteer organization responsible for developing the park, local businesses, non-profit organizations, and thousands of volunteers made Curt and Allen’s dream a reality. Durham Central Park now stands on the foundation of that dream and love – a catalyst for downtown Durham revitalization.
Loved to Death
The park is over twenty years old and has found a soft spot in the heart of the Durham community. The diversity of amenities, programs, events, festivals, adjacent destinations, and proximity to multi-modal transportation network are some of the contributors to its lovability. During the lifetime of the park, the immediate area of downtown and downtown as a whole has seen a great influx in population. The popularity over the years is evident in aging amenities and the natural wear and tear. It is time to bring in a new level of care to this beloved destination and the first step is to develop a new vision plan for the park renovations.
Happily, Ever After, The Vision
The time has come for the next phase of development of this love story: this vision plan and its implementation. Durham Central Park Inc. and the City of Durham are taking that step together to create this vision. The plan will guide the future of Durham Central Park in continuing its successes and becoming the recreation destination for the new generation of downtown
1 https://durhamcentralpark.org/about/history/
Durham residents and beyond. The plan re-envisions the park through a unifying visual vocabulary, providing connections and reinforcing the park as a durable and welcoming space. The updated goals of the vision plan are to:
• Create unity + cohesion – The goal is to weave together the park’s diverse elements into a seamless and harmonious whole. By enhancing pathways, visual continuity, and consistent design features, the park can feel like a unified space where all amenities and areas are connected, encouraging a stronger sense of community and shared experience.
• Take the park to the next level – This goal focuses on elevating the park’s offerings and infrastructure, making it a destination that meets the needs of today’s users while anticipating future demands. Through innovative upgrades, enhanced amenities, and modern facilities, the park can become a leading example of urban recreation and community space.
• Preserve the idea, brand + story of the park – Maintaining the park’s unique identity is crucial. This goal emphasizes protecting and celebrating the park’s history, cultural significance, and core values. By staying true to its original vision while allowing for thoughtful evolution, the park can continue to resonate with current and future generations.
• Make the park welcoming, safe + lasting – Creating an inviting and secure environment is key to ensuring that the park remains a beloved space for all. This goal focuses on enhancing accessibility, safety features, and sustainable design to provide a welcoming atmosphere where visitors feel comfortable and confident that the park will endure for years to come.
• Connect to nature – This goal aims to strengthen the park’s role as a natural oasis within the urban landscape. By integrating green spaces, natural habitats, and opportunities for environmental education and interaction, the park can foster a deeper connection between visitors and the natural world, promoting well-being and ecological awareness.
To implement these overarching goals through the vision plan, the project team organized the plan scope into the following seven recommendations framework:
• Amenity Connectivity – Roney Street separates the Grace, Butterfly, and Berkshire Hathaway Gardens from the other park amenities. Similarly, Foster Street acts as a barrier between the farmers’ market pavilion area and the amenities on the eastern parcel, including the playground, open play lawn, and skate park. Enhancing pedestrian connectivity and site circulation should be considered to better link these disconnected amenity spaces.
» Create a unified east/west flow of people and places, including accessible connection at Rigsbee Avenue.
» Reimaging Foster Street as a pedestrian friendly street that can close more easily for events and programming
» Simplify and open up the connection between the Southwest entrance and the park
• Enhance Everyday Use – The area just south of Foster on the Park, home to the Sister Cities Grove, is currently underutilized. It is worth considering a redesign to support new programs and flexible uses.
• Honor Farmers’ Market – the farmers’ market pavilion and its surrounding open space are crucial to the community, not just as a physical location but as a place with deep emotional and cultural significance. Enhancing this space could focus on improvements that respect its sentimental and sacred value while also increasing its functionality as a hub for social connections.
• Open up Foster Street Entry – The entrance south of The Foundry should be opened up. Existing mature trees obstruct the clear sight lines into the park and removing these will help visually connect the park spaces on each side of the Foster Street.
• Reimagine Mount Merrill – The Mount Merrill playground area has the potential to be transformed into an upgraded play space, potentially including some type of interactive water play component. The play environment could also expand and include creek-side play, offering children and adults a unique opportunity to connect with urban nature.
• Flexible Open Space – The Great Lawn can be regraded and leveled to improve its use and flexibility for small events and social gatherings.
• Accessibility – The entrance along Rigsbee Avenue currently does not have ADA-accessible entrance into the park spaces. A new entryway should be proposed to ensure it is wheelchair accessible and dignified.
Based on the planning goals and the framework of the recommendations, the project team identified ten design opportunities within this aspirational vision for the park.
Framework Ideas: Park Places
Connect this space seamlessly to the rest of the park
Connect this space better to the park
Enhance the everyday use of this space
Enhance the everyday use of this space
Honor the functions of the Farmers’ Market
Honor the functions of the Farmer’s Market
Open this area to connect the park spaces across Foster Street
Open this up to connect the park spaces
Reimagine Mount Merrill with expanded play opportunities
Reimagine Mount Merrill as creek hillside for nature play
Level the lawn to improve its use and flexibility
Level the lawn to improve its use and flexibility
Create an accessible and dignified overlook entrance from the east
Create an accesible and dignified overlook entrance from the east
Framework Ideas: Park Connectors
Create a unifying east/west
flow of people and places, including accessible connection at Rigsbee
Reimagine Foster as a festival street that can close more easily for events and programming
Simplify and open up the connection between Southwest entrance and park
1. West + South Terraces
» Currently, home to the beautiful Grace, Butterfly, and Berkshire Hathaway Gardens, as well as the Garden of Eatin’, the steep slopes along Roney Street in the west and south of the park make navigating the gardens difficult and pose challenges for vegetation management. By terracing this area, the park could visually connect from the western to the eastern edge, opening up sight lines and creating a more welcoming entrance from the west. This design would enhance access, inviting visitors to enter, linger, or continue exploring other areas of the park. The terraces would also offer spaces for gathering, whether in small or large groups and create intimate spots for pausing and people-watching. Additionally, the terraced area could serve as a venue for small performances, with an informal stage at the base of the terraces.
2. Farmers’ Market Pavilion + Event Space
» The farmers’ market pavilion and the event space are the centerpiece attractions of Durham Central Park. Each week, hundreds of visitors gather here to purchase fresh produce at the farmers market or enjoy a Friday evening concert with dinner and local brews. This plan recommends upgrading the pavilion to include staff offices for DCP Inc., as well as implementing general maintenance to preserve the building’s quality.
» The event space in front of the pavilion experiences significant wear and tear due to frequent events. It is recommended to explore the possibility of installing artificial turf in this area or, if natural turf is preferred, to consider substantial soil amendments. Additionally, it should be recognized that the natural turf may need to be periodically closed off for use to allow the grass time to rejuvenate.
3. Canopy Plaza/Sister Cities Grove
» The canopy plaza, also known as the Sister Cities Grove, is a flexible open area adjacent to the farmers’ market pavilion. Redesigning this currently underutilized space will accommodate additional vendors on market days. Introducing hardscaping will create versatile spaces for picnics, pickup games, or simply relaxing in the park. The existing trees, which honor Durham’s sister cities, can be replanted following the
West + South Terraces: Swarthmore University
Market Pavilion + Event Space
Canopy Plaza: RIOS
renovations. This area will be shielded from vehicular traffic with the addition of seat walls and special pavement markings.
4. Festival Street
» A festival street is an urban design concept that converts a street into a space tailored for events and gatherings. It typically features elements that facilitate easy closure to vehicle traffic, making it ideal for festivals, markets, parades, and other public events.
» Foster Street will be designed as a vibrant space for people and activities. It will include a tabletop mid-block crossing to seamlessly connect the park across the street. The use of distinctive surfacing, such as pavers, will signal to drivers, pedestrians, and cyclists that the priority here is on people and park users.
» Transforming Foster Street into a festival street will offer the following benefits:
› Flexible Design: The street will be equipped with features that can be adapted for different types of events, such as removable bollards, temporary stages, or modular seating.
› Pedestrian-Friendly: The design prioritizes pedestrians over vehicles, creating a safe and inviting environment for people to gather and interact.
› Public Space Enhancements: The street may include amenities like outdoor seating, landscaping, lighting, and art installations to enhance the overall experience.
› Event Infrastructure: Infrastructure such as power outlets, water access, and spaces for food and beverage vendors will be incorporated to support events.
5. Entry Plaza + Performance Stage
» An entry plaza at the Foster Street entrance will enhance both visual and physical connectivity across the park, seamlessly extending the feel of Foster Street into the park itself. This plaza will guide visitors into the park and create a welcoming sense of arrival. Adjacent to the entry plaza, a small at-grade stage area is proposed. This versatile space will serve as a daily seating area and host occasional performances, providing a dynamic spot for relaxation and entertainment.
6. Mount Merrill V-2 + Expanded Play
» The entry plaza will lead visitors into a vibrant and engaging play area. The current Mount Merrill playground is a cherished spot for children, but as it ages, the plan proposes an upgraded Mount Merrill Version-2. This new version will incorporate the latest trends in play environments, offering a blend of fun and adventure.
» In addition to the upgraded play structures, a new interactive water feature or spray ground is suggested. This feature will add visual interest, create soothing white noise, provide relief during hot summer months, and offer water play opportunities for all ages and abilities. Designed to be flush with the pavement, the water feature will also serve as flexible hardscape for various uses when not in operation.
» Visitors will be welcomed at the corner of Foster and Hunt Streets with improved sight lines, nature play elements, the creek, and an accessible bridge crossing. This space will enhance the experience of the creek and foster a connection with urban nature. Nature play elements, such as felled trees, boulders, and specific plants, will provide a variety of textures and sensory experiences through sight, touch, and smell. Educational signage will offer insights into local flora and fauna, stream health, water quality, and more. Integrating these nature play features will provide holistic and enriching experiences, allowing visitors to explore, learn, and play in a natural environment.
7. Great Lawn Upgrades
» Community feedback has highlighted the need for a central open space in the park, providing a flexible, social gathering space in downtown. The existing Great Lawn is underused due to its sloping terrain. Re-grading and leveling the lawn will enhance its functionality for daily activities such as picnics, playing ball, or flying kites, as well as for events like performances and movie nights. The design features terraced seating along the eastern and southern edges, offering comfortable spots for both everyday use and special occasions. The terraces and pathways will wrap around this central open space with an accessible entrance from Rigsbee Avenue.
Expanded Play: Downtown Cary Park
Great Lawn Upgrades: Hunters’ Point Park
Performance Stage: Powders Spring Park
Festival Street: Raleigh
8. ADA Access
» Currently, the accessible entrance from Rigsbee Avenue is located at the southern edge and is not well integrated into the overall park layout. The proposed vision plan relocates the accessible entrance to the central part of this edge, aligning it with the stair entrance. This design will allow people using the stairs and those using the accessible entrance to have a more cohesive and inclusive experience as they enter the park.
9. Skate Park Upgrades
» The current skate park is heavily utilized and enjoys strong support from its users. Planned improvements will include comfortable seating, shade from trees or possibly shade structures, and enhanced lighting. It is recommended that the City and DCP Inc. collaborate closely with the skate park community to develop the upgrade and improvement plan.
10. East Overlook
» The experience of entering the park from Rigsbee Avenue is enhanced by the east overlook, which functions as a twentyfoot-wide sidewalk or a linear plaza space. The overlook creates a buffer from the street, offers seating, and provides views into and across the park. The park entrances include both stairs and an accessible ramp.
» The overlook is elevated 10 to 15 feet above the Great Lawn. This elevation allows for the inclusion of restrooms and storage space beneath the overlook, accessed from within the park. The restrooms will serve daily visitors and events, enhancing user comfort, while the storage area will support park staff and facilitate events and daily activities.
The Love Story Continues
The proposed vision plan for Durham Central Park aims to create a unified and cohesive space where diverse elements seamlessly blend. By elevating the park’s features, preserving its unique identity, and ensuring it is welcoming and safe, the plan seeks to enhance the park’s appeal and functionality. Additionally, connecting the park to nature will enrich visitors’ experiences and promote environmental engagement, ensuring the park remains a valued community asset and a beloved recreation destination for the future.
Parks
1 Executive Summary
2023 City of Durham Parks and Recreation Needs Assessment Survey
Executive
Summary
Overview
ETC Institute administered a needs assessment survey for the City of Durham Parks and Recreation Department during summer months of 2023. The survey will help Durham Parks and Recreation determine park and recreation priorities for the community.
Methodology
ETC Institute mailed a survey packet to a random sample of households in Durham. Each survey packet contained a cover letter, a copy of the survey, and a postage‐paid return envelope. Residents who received the survey were given the option of returning the survey by mail or completing it online at DurhamParkSurvey.org.
After the surveys were mailed, ETC Institute followed up with residents to encourage participation. To prevent people who were not residents of Durham from participating, everyone who completed the survey online was required to enter their home address prior to submitting the survey. ETC Institute then matched the addresses that were entered online with the addresses that were originally selected for the random sample. If the address from a survey completed online did not match one of the addresses selected for the sample, the online survey was not included in the final database for this report.
The goal was to collect a minimum of 500 completed surveys from residents. The goal was met with 539 completed surveys collected. The overall results for the sample of 539 households have a precision of at least +/‐4.2 at the 95% level of confidence.
This report contains the following:
Charts showing the overall results of the survey (Section 2)
Priority Investment Rating (PIR) that identifies priorities for facilities and programs (Section 3)
Benchmarks comparing data from Durham to national averages (Section 4)
Tabular data showing the overall results for all questions on the survey (Section 5)
Answers to open‐ended questions (Section 6)
A copy of the cover letter and survey instrument (Section 7)
The major findings of the survey are summarized on the following pages.
Use of Parks and Facilities
Use Overview. Most respondents (85%) said their household had visited Durham parks or facilities in the last year. The highest percentage of respondents (25%) reported visiting a few times a month followed by 2‐3 times a week (23%) and every couple of months (22%). Respondents most often say they use parks and facilities to enjoy the outdoors (70%), because it is close to home (49%), and it adds to the quality of life (47%).
Quality of Parks and Facilities. Respondents who had visited parks/facilities in the last year were asked to rate the overall quality. Most respondents (75%) rated the parks and facilities as either good (58%) or excellent (17%). The highest percentage of respondents (31%) said it would take 20 minutes or more to walk to the nearest park, facility, or greenway.
Barriers to Use. Respondents most often list lack of information/not knowing what is offered (38%), distance from residence (27%), busy schedules (22%), and safety at facilities (22%) as their major barriers to use of parks and facilities.
Recreation Programs or Special Events Participation
Program/Event Participation. Twenty‐eight percent (28%) said someone in their household had participated in City recreation programs or special events in the last year. Of those who had participated, most (90%) rated the overall inclusivity and diversity as excellent (36%) or good (54%). The overall quality of recreation programs and special events was most often rated as good (59%) followed by excellent (31%).
Q3. How long would it take residents to walk to the nearest Durham park, facility, or greenway?
Perceptions of Parks and Recreation
Overall Satisfaction. Most respondents (63%) say they are either somewhat satisfied (38%) or very satisfied (25%) with the value their household receives from the City of Durham Parks and Recreation Department. Most respondents (81%) say the existence of public parks and recreation is “very important” to the quality of life in Durham.
Communication Methods. The highest percentage of respondents learn about city parks, facilities, and special events via social media (62%), word of mouth (53%), the City of Durham website (40%), or a search engine (40%). Respondents would most prefer to receive information from social media and the City of Durham website.
Agreement with Aspects of Parks and Recreation. Respondents were asked to rate their level of agreement with 11 statements about Durham Parks and Recreation. Respondents most often agreed (selecting “agree” or “strongly agree”) that public parks add to the quality of life in the community (98%), recreation and parks are an essential service to the city (98%), and parks and recreation helps promote healthy and active lifestyles (93%).
Support for Improvements. Respondents were asked to rate their level of support for six potential actions to improve the parks and recreation system. Respondents were most support (rating “supportive” or “very supportive”) of investing in the look and quality of existing parks and facilities (94%), implementing sustainability measures to minimize the environmental impact of parks and recreation facilities (90%), and connecting existing trails to downtown neighborhoods and parks (89%). Respondents think the top three areas Durham Parks and Recreation should focus on improving are updating existing parks and facilities (66%), maintaining parks and facilities (64%), and protecting the environment (34%).
Funding for Improvements. Respondents said they would be most willing to support investing in the look and quality of existing parks and facilities (57%), connecting existing trails to downtown neighborhoods and parks (52%), and developing greenspace/parks in Downtown Durham (47%) with their tax dollars. Almost half of respondents (48%) say they are very supportive of paying additional taxes to improve existing parks in Durham. Thirty‐nine percent (39%) say they are very supportive of paying additional taxes to construct new parks in Durham.
Parks and Recreation Facilities and Amenities Needs and Priorities
Facility/Amenity Needs: Respondents were asked to identify if their household had a need for 37 parks and recreation facilities/amenities and to rate how well their needs for each were currently being met. Based on this analysis, ETC Institute was able to estimate the number of households in the community that had the greatest “unmet” need for various facilities/amenities.
The three parks and recreation facilities/amenities with the highest percentage of households that have an unmet need:
1. Year‐round restrooms– 52,516 households
2. Park benches, tables with shade & solar‐powered charging stations– 45,906 households
3. Public gardens – 44,632 households
The estimated number of households that have unmet needs for each of the 37 parks and recreation amenities assessed is shown in the chart below.
Q10c. Estimated Number of Households Whose Facility/Amenity Needs Are Only “Partly Met" or “Not Met”
Facilities and Amenities Importance: In addition to assessing the needs for each parks and recreation facility and amenity, ETC Institute also assessed the importance that residents placed on each item. Based on the sum of respondents’ top four choices, these were the four facilities/amenities ranked most important to residents:
1. Natural surface trails (31%)
2. Natural open space (28%)
3. Paved greenway trails (24%) and aquatics center/swimming pool (24%)
4. Downtown parks and greenspace (23%)
The percentage of residents who selected each facility/amenity as one of their top four choices is shown in the chart below.
Q11. Facilities/Amenities Most Important to Households.
by
Park benches, tables with shade & chargers
Lighted amenities (fields, dog parks, courts, etc.)
Priorities for Facility Investments: The Priority Investment Rating (PIR) was developed by ETC Institute to provide organizations with an objective tool for evaluating the priority that should be placed on recreation and parks investments. The Priority Investment Rating (PIR) equally weighs (1) the importance that residents place on amenities and (2) how many residents have unmet needs for the amenity. [ Details regarding the methodology for this analysis are provided in Section 3 of this report.]
Based the Priority Investment Rating (PIR), the following parks and recreation facilities/amenities were rated as high priorities for investment:
Year‐round restrooms (PIR=173)
Natural surface trails (PIR=172)
Natural open space (PIR=159)
Aquatics center/swimming pool (PIR=157)
Paved greenway trails (PIR=152)
Downtown parks and greenspace (PIR=132)
Park benches, tables with shade and charging (PIR=131)
Public gardens (PIR=125)
Shaded playgrounds (PIR=106)
The chart below shows the Priority Investment Rating for each of the 37 recreation
assessed on the survey.
Top Priorities for Investment for Facilities/Amenities Based on Priority Investment Rating
Program Needs and Priorities
Program Needs: Respondents were asked to identify if their household had a need for 34 programs and to rate how well their needs for each were currently being met. Based on this analysis, ETC Institute was able to estimate the number of households in the community that had the greatest “unmet” need for various recreation programs.
The three programs with the highest percentage of households that have an unmet need:
1. Outdoor movies and concerts – 37,423 households
2. Fitness and wellness programs – 33,350 households
3. Adult athletics – 28,183 households
The estimated number of households that have unmet needs for each of the 34 parks and recreation programs assessed is shown in the chart below.
Q12c. Estimated Number of Households Whose Program/Activity Needs Are Only “Partly Met" or “Not Met”
Arts, dance, music and performing
Environmental
Senior programs, activities, and trips
Small watercraft/boating (canoes, kayaks, etc.)
Canine recreation activities and events
Life skills programs (e.g., cooking, budgeting)
Tennis (e.g., lessons and clinics) Archery Youth programs (non‐athletic)
BMX,
Programs Importance: In addition to assessing the needs for each program, ETC Institute also assessed the importance that residents placed on each item. Based on the sum of respondents’ top three choices, these are the three most important programs to residents:
1. Outdoor movies and concerts (29%)
2. Fitness and wellness programs (25%)
3. Swimming (21%)
The percentage of residents who selected each program as one of their top three choices is shown in the chart below.
Q13. Programs/Activities Most Important to Households.
Arts,
Adult athletics
Senior programs, activities, & trips
Small watercraft/boating (canoes, kayaks, etc.)
Canine recreation activities & events
Environmental education
Outdoor adventure programs Pickleball Disc golf Special events
Priorities for Program Investments: The Priority Investment Rating (PIR) was developed by ETC Institute to provide organizations with an objective tool for evaluating the priority that should be placed on recreation and parks investments. The Priority Investment Rating (PIR) equally weighs (1) the importance that residents place on each program and (2) how many residents have unmet needs for the program. [ Details regarding the methodology for this analysis are provided in Section 3 of this report.]
Based the Priority Investment Rating (PIR), the following Durham programs were rated as high priorities for investment:
Outdoor movies and concerts (PIR= 200)
Fitness and wellness programs (PIR=177)
Swimming (PIR=140)
Adult Athletics (PIR=132)
Arts, dance, music and performing arts (PIR=126)
Outdoor adventure programs (PIR=107)
Environmental education (PIR=100)
Senior Programs, activities, and trips (PIR=100)
The chart below shows the Priority Investment Rating for each of the 34 programs assessed.
Top Priorities for Investment for Programs/Activities Based on Priority Investment Rating
Charts & Graphs
Q1. Including yourself, how many people in your household are in the following age groups?
Q2. Have you or your household visited Durham parks or facilities in the past year?
by percentage of respondents
Q2a. Rating the overall quality of Durham parks and facilities used in the past year
by percentage of respondents (excluding “not provided")
Q2b. How often parks or facilities in Durham have been visited over the past year
Q3. How long would it take residents to walk to the nearest Durham park, facility, or greenway?
by percentage of respondents (excluding “not provided")
Q4. Have you participated in any City recreation programs or special events in the past 12 months?
by percentage of respondents (excluding “not provided”)
Q4a. Rating the overall inclusiveness and diversity of recreation programs or special events.
by percentage of respondents (excluding “not provided")
Q4b. How would you rate overall quality of recreation programs or special events?
by percentage of respondents (excluding “not provided")
Q5. Ways residents learn about city parks, facilities, and special events.
(e.g., Facebook, Twitter,
Signage
Q6. Preferred Sources of Information for Parks, Facilities, and Special Events
Social media (e.g., Facebook, Twitter, Instagram)
Q7. Reasons that prevent residents from using Durham parks and facilities.
Lack of information/don't know what is offered
Facilities are too far from home
Not enough time/too busy
Safety at facilities
Lack of maintenance
Nothing. I am actively using the city's parks and facilities
Lack of cleanliness
Lack of parking
Overcrowding
Not interested in what is provided
Other
Inconvenient hours of operation
Lack of transportation
Lack of access for people with disabilities
Cost of participation
Q8. Reasons that residents use Durham parks and facilities.
Enjoyment of the
outdoors
Close to our home/residence
Quality of life
Improved physical fitness & health
Program or facility offered
Socializing/meeting people
Facilities are well maintained
Fees are affordable
Availability of parking
Facilities have the right amenities
Safety of parks & facilities
Programs are interesting
None. I do not use parks, recreation facilities, or programs
Quality of programs
Facility operating hours are convenient
Good customer service by staff
Registration for programs is easy
Quality of instructors Other
Q9. Satisfaction with value households recieved from the City of Durham Parks and Recreation Department.
by percentage of respondents (excluding “not provided")
Q10. Need for Recreation Facilities or Amenities.
Natural open space
Natural surface trails
Year‐round restrooms
Paved greenway trails
Public gardens
Downtown parks & greenspace
Aquatics center/swimming pool
Recycle options in parks
Shaded playgrounds
Water access (boating, kayaking, canoeing)
Nature play area
Lighted amenities (fields, dog parks, courts, etc.)
Reservable picnic shelters
Outdoor water feature or splash pad
Dog park
Accessible & inclusive playground & play spaces
Campsites
Senior citizen/active adult center
Indoor athletic complex
Outdoor fitness equipment
Multipurpose field
Pickleball courts (outdoors)
Tennis courts
Spray grounds
Indoor track facility
Disc golf course
Indoor special event venues
Indoor pickleball complex
Fishing facilities
Skate park
Baseball/softball fields (youth & adult)
Classroom/meeting space
Driving range
Sand volleyball courts
Community kitchen
Cricket field/pitch
Park benches, tables with shade & solar powered charging stations
Q10. Estimated Number of Households Who Have a Need for Amenities/Facilities
Natural open space
Natural surface trails
Year‐round restrooms
Paved greenway trails
Public gardens
Downtown parks and greenspace
Park benches, tables with shade and solar powered
Aquatics center/swimming pool
Recycle options in parks
Shaded playgrounds
Water access
Nature play area
Lighted amenities
Reservable picnic shelters
Outdoor water feature or splash pad
Dog park
Accessible and inclusive playground and play space
Campsites
Senior citizen/active adult center
Indoor athletic complex
Outdoor fitness equipment
Multipurpose field
Pickleball courts (outdoors)
Tennis courts
Spray grounds
Indoor track facility
Disc golf course
Indoor special event venues
Indoor pickleball complex
Fishing facilities
Skate park
Baseball/softball fields (youth and adult)
Classroom/Meeting space
Driving range
Sand volleyball courts
Community kitchen Cricket field/pitch
Q10b. How Well Needs Are Being Met for Recreation Facilities or Amenities
Natural open space
Paved greenway trails
Downtown parks & greenspace
Reservable picnic shelters
Natural surface trails
Tennis courts
Disc golf course
Baseball/softball fields (youth & adult)
Accessible & inclusive playground & play spaces
Dog park
Classroom/meeting space
Indoor athletic complex
Multipurpose field
Nature play area
Indoor special event venues
Campsites
Public gardens
Skate park
Pickleball courts (outdoors) Year‐round restrooms
Lighted amenities (fields, dog parks, courts, etc.)
Water access (boating, kayaking, canoeing)
Aquatics center/swimming pool
Senior citizen/active adult center
Fishing facilities
Park benches, tables with shade & solar powered charging stations
Recycle options in parks
Sand volleyball courts
Shaded playgrounds
Community kitchen
Outdoor water feature or splash pad
Spray grounds
Indoor track facility
Cricket field/pitch
Outdoor fitness equipment
Driving range
Indoor pickleball complex
Q10c. Estimated Number of Households Whose Facility/Amenity Needs
Are Only “Partly Met" or “Not Met”
Year‐round restrooms
Park benches, tables with shade & solar powered charging stations
Public gardens
Aquatics center/swimming pool
Recycle options in parks
Natural surface trails
Natural open space
Shaded playgrounds
Paved greenway trails
Water access
Outdoor water feature or splash pad
Downtown parks and greenspace
Lighted amenities
Nature play area
Outdoor fitness equipment
Dog park
Senior citizen/active adult center
Campsites
Reservable picnic shelters
Spray grounds
Indoor pickleball complex
Accessible and inclusive playground and play space
Indoor athletic complex
Indoor track facility
Multipurpose field
Pickleball courts (outdoors)
Fishing facilities
Indoor special event venues
Driving range
Tennis courts
Skate park
Disc golf course
Classroom/Meeting space
Sand volleyball courts
Baseball/softball fields (youth and adult)
Community kitchen Cricket field/pitch 0 15,00030,000 45,00060,000
Not MetPartly Met
Q11. Facilities/Amenities Most Important to Households.
Natural surface trails
Natural open space
Paved greenway trails
Aquatics center/swimming pool
Downtown parks & greenspace
Year‐round restrooms
Park benches, tables with shade & chargers
Dog park
Shaded playgrounds
Accessible & inclusive playground & play spaces
Water access (boating, kayaking, canoeing)
Outdoor water feature or splash pad
Public gardens
Lighted amenities (fields, dog parks, courts, etc.)
Pickleball courts (outdoors)
Indoor athletic complex
Disc golf course
Recycle options in parks
Nature play area
Skate park
Tennis courts
Indoor pickleball complex
Outdoor fitness equipment
Senior citizen/active adult center
Multipurpose field
Indoor track facility
Fishing facilities
Indoor special event venues
Driving range
Baseball/softball fields (youth & adult)
Campsites
Spray grounds
Community kitchen
Classroom/meeting space
Reservable picnic shelters
Sand volleyball courts
Q12.
Need for Programs/Activities
Outdoor movies and concerts
Fitness and wellness programs
Adult athletics
Swimming
Arts, dance, music and performing arts
Outdoor adventure programs
Environmental education
Small watercraft/boating (canoes, kayaks, etc.)
Special events
Senior programs, activities, and trips
Canine recreation activities and events
Pickleball
Fishing facilities
Life skills programs (e.g., cooking, budgeting)
Disc golf
Tennis (e.g., lessons and clinics)
Climbing
Youth sports
Summer camp
Basketball
Youth programs (non‐athletic)
Soccer
Baseball and softball
After‐school programs
Archery
Pre‐school programs
Martial arts
Volleyball
Teen programs
Action sports (e.g., BMX, skateboarding)
Special needs programs
Racquetball E
and cyber sports
Flag football
Q12. Estimated Number of Households Who Have a Need for Programs/Activities
Outdoor movies and concerts
Fitness and wellness programs
Adult athletics
Swimming
Arts, dance, music and performing arts
Outdoor adventure programs
Environmental education
Small watercraft/boating (canoes, kayaks, etc.)
Special events
Senior programs, activities, and trips
Canine recreation activities and events
Pickleball
Fishing facilities
Life skills programs (e.g., cooking, budgeting)
Disc golf
Tennis (e.g., lessons and clinics)
Climbing
Youth sports
Summer camp
Basketball
Youth programs (non‐athletic)
Soccer
Baseball and softball
After‐school programs
Archery
Pre‐school programs
Martial arts
Volleyball
Teen programs
Action sports (e.g., BMX, skateboarding)
Special needs programs
Racquetball E‐Sports and cyber sports
Flag football
Q12b. How Well Need for Program/Activity is Currently Being Met
Q12c.
Estimated Number of Households Whose Program/Activity Needs
Are Only “Partly Met" or “Not Met”
by
Outdoor movies and concerts
Fitness and wellness programs
Adult athletics
Outdoor adventure programs
Swimming
Arts, dance, music and performing arts
Environmental education
Senior programs, activities, and trips
Small watercraft/boating (canoes, kayaks, etc.)
Canine recreation activities and events
Life skills programs (e.g., cooking, budgeting)
Pickleball
Special events
Climbing
Fishing facilities
Tennis (e.g., lessons and clinics)
Archery
Youth programs (non‐athletic)
After‐school programs
Youth sports Soccer
Disc golf
Summer camp
Baseball and softball
Basketball
Pre‐school programs
Martial arts
Volleyball
Teen programs
Action sports (e.g., BMX, skateboarding)
Special needs programs
Racquetball
E‐Sports and cyber sports
Flag football
Q13. Programs/Activities Most Important to Households.
Outdoor movies & concerts
Fitness & wellness programs
Swimming
Arts, dance, music & performing arts
Adult athletics
Senior programs, activities, & trips
Small watercraft/boating (canoes, kayaks, etc.)
Canine recreation activities & events
Environmental education
Outdoor adventure programs
Pickleball
Disc golf
Special events
Tennis (e.g., lessons & clinics)
Youth sports
Life skills programs (e.g., cooking, budgeting)
Preschool programs
Youth programs (non‐athletic)
After‐school programs
Climbing Archery
Basketball
Baseball & softball
Teen programs
Martial arts
Action sports (e.g., BMX, skateboarding)
Special needs programs
Volleyball
Q14. Level of agreement with the following statements:
Public parks add to quality of life in the community
Recreation & parks are an essential service to City
Parks & recreation helps promote healthy & active lifestyles
I feel safe when visiting parks in Durham
I am aware of parks, facilities & events that are offered
I am satisfied with recreation opportunities I receive for my tax dollars
I am satisfied with variety of parks, facilities & events City offers
I am satisfied with recreation opportunities for seniors & active adults in Durham
I am satisfied with amount of inclusive playgrounds, parks, features & amenities
I am satisfied with recreation opportunities for youth (ages 12 & under) in Durham
I am satisfied with recreation opportunities for teens (ages 13‐18) in Durham
Q15. Support for the following actions in Durham:
Investing in look & quality of existing parks & facilities
Implementing sustainability measures to minimize the environmental impact of parks and recreation facilities
Developing greenspace/parks in Downtown Durham
Q16. Items willing to be supported by tax dollars.
by percentage of respondents who selected the items as one of their top three choices
Investing in look & quality of existing parks & facilities
Connecting existing trails to Downtown neighborhoods & parks
Developing greenspace/parks in Downtown Durham
Implementing sustainability measures to minimize the environmental impact of parks and recreation facilities
Building an indoor/outdoor athletic complex
Building new parks & athletic fields
Q17. Support of paying additional taxes to improve exisiting parks in Durham.
by percentage of respondents (excluding “not sure")
Somewhat supportive
Not supportive
Q18. Support of paying additional taxes to construct new parks in Durham.
by percentage of respondents (excluding “not sure")
Q19. Top
three areas Durham Parks and Recreation should focus on improving.
Maintenance
Protecting
Promoting
Q20. Importance of the existence of public parks and recreation to the quality of life in Durham.
Q21. What is your age?
by percentage of respondents (excluding “not provided")
Q22. How many years have you lived in Durham?
percentage of respondents (excluding “not
Q23. What is your gender?
by percentage of respondents (excluding “not provided")
Q24. Selection of best description of race/ethnicity.
Priority Investment Rating
Priority Investment Rating
Durham, NC
The Priority Investment Rating (PIR) was developed by ETC Institute to provide governments with an objective tool for evaluating the priority that should be placed on parks and recreation investments. The Priority Investment Rating was developed by ETC Institute to identify the facilities and programs residents think should receive the highest priority for investment. The priority investment rating reflects the importance residents place on items (sum of top 4 choices) and the unmet needs (needs that are not met or only partly met) for each facility/program relative to the facility/program that rated the highest overall. Since decisions related to future investments should consider both the level of unmet need and the importance of facilities and programs, the PIR weights each of these components equally.
The PIR reflects the sum of the Unmet Needs Rating and the Importance Rating as shown in the equation below:
PIR = UNR + IR
For example, if the Unmet Needs Rating for Community Gardens were 98.9 (out of 100) and the Importance Rating for Community Gardens were 21.6 (out of 100), the Priority Investment Rating for the Farmer’s Market would be 120.5 (out of 200).
How to Analyze the Charts:
High Priority Areas are those with a PIR of at least 100. A rating of 100 or above generally indicates there is a relatively high level of unmet need and residents generally think it is important to fund improvements in these areas. Improvements in this area are likely to have a positive impact on the greatest number of households.
Medium Priority Areas are those with a PIR of 50‐99. A rating in this range generally indicates there is a medium to high level of unmet need or a significant percentage of residents generally think it is important to fund improvements in these areas.
Low Priority Areas are those with a PIR below 50. A rating in this range generally indicates there is a relatively low level of unmet need and residents do not think it is important to fund improvements in these areas. Improvements may be warranted if the needs of very specialized populations are being targeted.
The following pages show the Unmet Needs Rating, Importance Rating, and Priority Investment Rating for facilities and programs.
Unmet Needs Rating for Facilities/Amenities
Public gardens
Aquatics center/swimming pool
Recycle options in parks
Natural surface trails
Natural open space
Shaded playgrounds
Paved greenway trails
Water access
Outdoor water feature or splash pad
Downtown parks and greenspace
Lighted amenities
Nature play area
Outdoor fitness equipment Dog park
Senior citizen/active adult center
Campsites
Reservable picnic shelters
Spray grounds
Indoor pickleball complex
Accessible and inclusive playground and play space
Indoor athletic complex
Indoor track facility
Multipurpose field
Pickleball courts (outdoors)
Fishing facilities
Indoor special event venues
Driving range
Tennis courts
Skate park
Disc golf course
Classroom/Meeting space
Sand volleyball courts
Baseball/softball fields (youth and adult)
Community kitchen Cricket field/pitch
Importance Rating for Facilities/Amenitites
the rating for the item rated as the most important=100
the rating of all other items reflects the relative level of importance for each item compared to the item rated as
Natural surface trails
Paved greenway trails
Natural open space
Aquatics center/swimming pool
Downtown parks and greenspace
Year‐round restrooms
Park benches, tables with shade and solar powered
Shaded playgrounds
Public gardens
Dog park
Accessible and inclusive playground and play space
Water access
Lighted amenities
Outdoor water feature or splash pad
Indoor athletic complex
Disc golf course
Nature play area
Recycle options in parks
Tennis courts
Indoor pickleball complex
Senior citizen/active adult center
Pickleball courts (outdoors)
Multipurpose field
Indoor track facility
Reservable picnic shelters
Fishing facilities
Indoor special event venues
Driving range
Baseball/softball fields (youth and adult)
Campsites
Outdoor fitness equipment
Spray grounds
Skate park
Community kitchen
Classroom/Meeting space
Sand volleyball courts Cricket field/pitch
Top Priorities for Investment for Facilities/Amenities Based on Priority Investment Rating
‐round restrooms
Natural surface trails
Natural open space
Aquatics center/swimming pool
Paved greenway trails
Downtown parks and greenspace
Park benches, tables with shade and charging
Public gardens
Shaded playgrounds
Recycle options in parks
Water access
Outdoor water feature or splash pad
Lighted amenities Dog park
Nature play area
Accessible and inclusive playground and play space
Indoor athletic complex
Senior citizen/active adult center
Indoor pickleball complex
Reservable picnic shelters
Outdoor fitness equipment
Pickleball courts (outdoors)
Multipurpose field
Indoor track facility
Campsites Disc golf course
Tennis courts
Spray grounds
Fishing facilities
Indoor special event venues
Driving range
Skate park
Baseball/softball fields (youth and adult)
Classroom/Meeting space
Community kitchen
Sand volleyball courts
Cricket field/pitch
Unmet Needs Rating for Programs/Activities
Environmental
Senior programs, activities, and trips
Small watercraft/boating (canoes, kayaks, etc.)
Canine recreation activities and events
Life skills programs (e.g., cooking, budgeting)
Climbing
Fishing
Tennis (e.g., lessons and clinics)
Importance Rating for Programs/Activities
Small
Top Priorities for Investment for Programs/Activities Based on Priority Investment Rating
Canine
Life
Benchmarks
Use of Parks/Facilities
by percentage of respondents
Durham (2023)National Average
Have visited parks/facilities in the past year
Rated quality of parks as "Excellent"
Rated quality of parks as "Excellent" or "Good"
Recreation Program Participation
by percentage of respondents
Durham (2023)National Average
Have participated in programs in last year
Would rate programs as "Excellent"
Would rate programs as "Excellent" or "Good"
Barriers to Facilities/Amenities Use
Do not know what is offered
Use of Sources for Information About Parks and Recreation
Respondents with Need for Facilities and Amenities
Respondents with Need for Recreation Programs
Tabular Data
Q1. Including yourself, how many people in your household are...
Ages
Q2. Have you or members of your household visited any City of Durham parks or facilities during the past 12 months?
Q2. Have you visited any City parks or facilities during past 12 months
Q2a. How would you rate the overall quality of all the parks or facilities offered by the City of Durham you or members of your household have used during the past 12 months?
Q2a. How would you rate overall quality of all City parks or facilities
WITHOUT NOT PROVIDED
Q2a. How would you rate the overall quality of all the parks or facilities offered by the City of Durham you or members of your household have used during the past 12 months? (without "not provided")
Q2a. How would you rate overall quality of all City parks or facilities
Q2b. In the past 12 months, approximately how often have you or members of your household visited any City of Durham parks or facilities?
Q2b. How often have you visited any City parks or facilities in past 12 months
WITHOUT NOT PROVIDED
Q2b. In the past 12 months, approximately how often have you or members of your household visited any City of Durham parks or facilities? (without "not provided")
Q2b. How often have you visited any City parks or facilities in past 12 months
Q3. Based on your current perception, about how long would it take you to walk from your home to the nearest City of Durham park, facility, or greenway trails?
Q3. How long would it take you to walk from your home to nearest City park, facility, or greenway trails
than 5 minutes
5‐10 minutes
WITHOUT NOT PROVIDED
Q3. Based on your current perception, about how long would it take you to walk from your home to the nearest City of Durham park, facility, or greenway trails? (without "not provided")
Q3. How long would it take you to walk from your home to nearest City park, facility, or greenway trails
than 5 minutes
5‐10 minutes
Q4. In the past 12 months, have you or any members of your household participated in any recreation programs or special events (Summer camps, Earth Day Festival) offered by the City of Durham?
Q4. Have you participated in any City recreation programs or special events in past 12 months
WITHOUT NOT PROVIDED
Q4. In the past 12 months, have you or any members of your household participated in any recreation programs or special events (Summer camps, Earth Day Festival) offered by the City of Durham? (without "not provided")
Q4. Have you participated in any City recreation programs or special events in past 12 months
Q4a. How would you rate the overall inclusiveness and diversity of recreation programs or special events you and members of your household have participated in?
Q4a. How would you rate overall inclusiveness & diversity of recreation programs or special events
WITHOUT NOT PROVIDED
Q4a. How would you rate the overall inclusiveness and diversity of recreation programs or special events you and members of your household have participated in? (without "not provided")
Q4a. How would you rate overall inclusiveness & diversity of recreation programs or special events
Q4b. How would you rate the overall quality of recreation programs or special events that you and members of your household have participated in?
Q4b. How would you rate overall quality of recreation programs or special events
WITHOUT NOT PROVIDED
Q4b. How would you rate the overall quality of recreation programs or special events that you and members of your household have participated in? (without "not provided")
Q4b. How would you rate overall quality of recreation
Q5. From the following list, please CHECK ALL of the ways you learn about City of Durham parks, facilities and special events.
Q5. All the ways you learn about City parks, facilities & special events
(e.g., Facebook, Twitter, Instagram)
(e.g., Google, Yahoo, Bing)
Q6. Which TWO of the sources of information listed in Question 5 do you most prefer to use to learn about City of Durham parks, facilities, and special events?
Q6. Which TWO of the sources of information listed in Question 5 do you most prefer to use to learn about City of Durham parks, facilities, and special events?
Q6. 2nd choice
SUM OF TOP 2 CHOICES
Q6. Which TWO of the sources of information listed in Question 5 do you most prefer to use to learn about City of Durham parks, facilities, and special events? (top 2)
Q6. Sum of Top 2 Choices
Q7. Please CHECK ALL of the following reasons that may prevent you or other members of your household from using the parks and facilities offered by the City of Durham Parks and Recreation Department (or, if you currently use them, what prevents you from using them more often).
Q7. All the reasons that may prevent your household from
I am
Q8. Please CHECK ALL of the following reasons you and members of your household use the parks and recreation facilities offered by City of Durham Parks and Recreation Department.
Q8. All the reasons your household uses City's parks & recreation facilities
Q9. How satisfied are you with the overall value your household receives from the City of Durham Parks and Recreation Department?
Q9. How satisfied are you with overall value your household receives from City Parks & Recreation Department
know
WITHOUT DON’T KNOW
Q9. How satisfied are you with the overall value your household receives from the City of Durham Parks and Recreation Department? (without "don't know")
Q9. How satisfied are you with overall value your household receives from City Parks & Recreation Department
Q10. Please indicate if you have a need for each of the following recreation facilities or amenities. (N=539)
Q10‐1. Accessible & inclusive playground & play spaces
Q10‐2. Aquatics center/swimming pool
Q10‐3. Baseball/softball fields (youth & adult)
Q10‐17. Lighted amenities (fields, dog parks, courts, etc.)
Q10‐18. Multipurpose field (e.g., football, lacrosse, rugby, soccer)
Q10. Please indicate if you have a need for each of the following recreation facilities or amenities.
Q10‐24. Park benches, tables with shade & solar powered charging stations
Q10‐25. Paved greenway trails
Q10‐26. Pickleball courts (outdoors)
Q10‐33. Skate park
Q10. If "Yes," how well are your needs being met? (N=527)
Q10‐18. Multipurpose field (e.g., football, lacrosse, rugby, soccer)
Q10. If "Yes," how well are your needs being met?
‐24. Park benches, tables with shade & solar powered charging stations
Q11. Which FOUR of the facilities or amenities from the list in Question 10 are MOST IMPORTANT to your household?
Q11. Which FOUR of the facilities or amenities from the list in Question 10 are MOST
to your household?
2nd choice
Q11. Which FOUR of the facilities or amenities from the list in Question 10 are MOST
to your household?
3rd choice
Q11. Which FOUR of the facilities or amenities from the list in Question 10 are MOST
to your household?
4th choice
SUM OF TOP 4 CHOICES
Q11. Which FOUR of the facilities or amenities from the list in Question 10 are MOST IMPORTANT to your household? (top 4)
Q11. Sum of Top 4 Choices
Q12. Please indicate if you have need to participate in each of the following recreation programs or activities.
(N=539)
Q12‐23. Senior programs, activities, & trips
Q12‐24. Small watercraft/boating (canoes, kayaks, etc.)
Q12. Please indicate if you have need to participate in each of the following recreation programs or activities.
Q12‐26. Special events
Q12‐27. Special needs programs
Q12‐28. Summer camp
Q12‐29. Swimming
Q12‐30. Teen programs
Q12‐31. Tennis (e.g., lessons & clinics)
Q12‐33. Youth programs (non‐athletic)
Q12‐34 Youth sports
Q12‐35. Other
Q12. If "Yes," how well are your needs being met?
(N=482)
Q12. If "Yes," how well are your needs being met?
Q13. Which FOUR of the programs and activities listed in Question 12 do you think are MOST IMPORTANT to your household?
Top choice
Q13. Which FOUR of the programs and activities listed in Question 12 do you think are MOST IMPORTANT to your household?
2nd choice
Q13. Which FOUR of the programs and activities listed in Question 12 do you think are MOST IMPORTANT to your household?
3rd choice
Q13. Which FOUR of the programs and activities listed in Question 12 do you think are MOST IMPORTANT to your household?
4th choice
SUM OF TOP 4 CHOICES
Q13. Which FOUR of the programs and activities listed in Question 12 do you think are MOST IMPORTANT to your household? (top 4)
Sum of Top 4 Choices
Q14. Please indicate your level of agreement with each of the following statements regarding the City of Durham parks and recreation, where 5 is "Strongly Agree" and 1 is "Strongly Disagree."
(N=539)
Q14‐4. I am satisfied with recreation opportunities I receive for my
‐6. I feel safe when visiting parks in Durham
Q14
Q14‐11. I am satisfied with amount of inclusive playgrounds, parks, features & amenities
WITHOUT DON’T KNOW
Q14. Please indicate your level of agreement with each of the following statements regarding the City of Durham parks and recreation, where 5 is "Strongly Agree" and 1 is "Strongly Disagree." (without "don't know")
(N=539)
Q14‐4. I am satisfied with recreation opportunities I receive for my
Q14‐5. I am
Q14‐7. Parks & recreation helps promote healthy & active lifestyles
Q14‐8. I am satisfied with recreation opportunities for youth (ages 12 &
Q14‐10. I am satisfied with recreation opportunities for seniors & active adults in Durham
Q14‐11. I am satisfied with amount of inclusive playgrounds, parks, features & amenities
Q15. Please indicate how supportive you would be of the City of Durham taking the following actions to improve the parks and recreation system.
WITHOUT DON’T KNOW
Q15. Please indicate how supportive you would be of the City of Durham taking the following actions to improve the parks and recreation system. (without "don't know")
Q16. Which THREE of the items in Question 15 would you be most willing to support with your tax dollars?
Top choice
Q16. Which THREE of the items in Question 15 would you be most willing to support with your tax dollars?
2nd choice
Q16. Which THREE of the items in Question 15 would you be most willing to support with your tax dollars?
Q16. 3rd choice
SUM OF TOP 3 CHOICES
Q16. Which THREE of the items in Question 15 would you be most willing to support with your tax dollars? (top 3)
Q16. Sum of Top 3 Choices
Q17. How supportive would you be of paying additional taxes to improve existing parks in Durham?
Q17. How supportive would you be of paying additional taxes to improve existing parks in Durham
WITHOUT NOT SURE
Q17. How supportive would you be of paying additional
to improve existing parks in Durham? (without "not sure")
Q17. How supportive would you be of paying additional
Q17a. If you answered "Not Supportive" or "Not Sure" to Question 17, please indicate why you answered this way.
Q17a. Why did you answer not supportive or not sure to Question 17
I need more information before I can answer
I do not use any Durham parks
park
Q18. How supportive would you be of paying
Q18. How supportive would you be of paying
Q18. How supportive would you be of paying additional taxes to construct new parks in Durham? (without "not sure")
Q18. How supportive would you be of paying
Q18a. If you answered "Not Supportive" or "Not Sure" to Question 18, please indicate why you answered this way.
Q18a. Why did you answer not supportive or not sure to Question 18
I need more information before I can answer
I do not use any Durham parks
I believe Durham
park
Q19. Please check the top THREE areas you believe Durham Parks and Recreation should focus on improving.
Q19. Top three areas should Durham Parks & Recreation focus
Q20. In your opinion, how important is the existence of public parks and recreation to the quality of life in Durham?
Q20. How important is the existence of public parks & recreation to quality of life in Durham
WITHOUT NOT PROVIDED
Q20. In your opinion, how important is the existence of public parks and recreation to the quality of life in Durham? (without "not provided")
Q20. How important is the existence of public parks & recreation to quality of life in Durham
Q21. What is your age?
Q22. Approximately how many years have you lived in the City of Durham?
Q22.
WITHOUT NOT PROVIDED
Q22. Approximately how many years have you lived in the City of Durham? (without "not provided")
Q22. How many years have you lived in City of Durham
Q23. Your gender: Q23.
WITHOUT NOT PROVIDED
Q23. Your gender: (without "not provided")
Q23. Your gender
Q24. Please CHECK ALL of the following that best describe your race/ethnicity.
Your race/ethnicity
Q24‐7. Self‐describe your race/ethnicity:
Q24‐7. Self‐describe your race/ethnicity
Open-Ended Responses
Open‐Ended Ques on Responses
Q2c—"What improvements or addi ons would you like to see made to the parks you and the members of your household visit most o en?”
A be er online directory of what each park has by searching for ac vity. Example where to find a pickleball court.
A BIT MORE TRASH REMOVAL WOULD BE NICE. A COAT OF PAINT ON THE TENNIS COURTS AT DUKE PARK PLEASE. WE GIFTED THE MURAL
A dog park in Old West Durham, splash pads, adult athle c leagues (or more communica on about exis ng ones).
A larger park in our neighborhood would be nice, right now it is only nice for the small children.
A lot of new housing developments but no new full facility parks? In outdoor parks only no workout areas. Edison Johnson pool. No bathing suit water extractors?
A lot of the play equipment for children is out of date, cracked, or dangerous. The ground is usually a hot asphalt or mulch. There are be er op ons. Durham has great disc golf community and layouts. However the equipment(tee pads and baskets) are the worst in the area. Durham Parks and Rec is a laughing stock amongst the disc golf community
A PLAY STRUCTURE AT OLD FARM PARK. ALSO, GENERALLY, MORE DOG WASTE DISPOSAL RECEPTICLES AT ALL PARKS‐PRIORITIZE THOSE WITHOUT
Access to be er parking.
Accessibility. Our daughter used a wheelchair and visi ng parks is very challenging for us. She is segregated and excluded
Add greenway near Bethesda area.
Add more Hiking trails, addi onal dog parks
ADDING A DOG PARK
Adding more shaded play areas. Some mes slides or swings are too hot for kids to play and get burned. Also adding new and more trash cans closer highly transit areas. Power washing all areas once in a while to help maintain clean.
Addi onal baseball fields
Addi onal picnic facili es/shelters for gatherings
An hot tub to sooth aching joints would be therapeu c. During the summer months facili es open at 6a to avoid the heat when exercising outdoors.
Areas besides dog parks where dogs can run off leash. Dog parks can be crowded and large parts of the city are not close to them.
BASKETBALL COURTS AND OTHER OUTDOOR ACTIVITIES AND FACILITIES
Bathroom maintenance at Southern Boundaries Park, smells like pee and has a water leak, floor is always wet.
Bathroom upgrades, more shade, more climbing structures
Bathrooms
Bathrooms
Bathrooms are aged, baseball fields overgrown, not maintained, old play equipment
Bathrooms in every park, more swings (Northgate)
Bathrooms near playgrounds, more benches at Duke Park
Bathrooms need doors to lock and cleaned on a regular basis.
Bathrooms open consistently
Bathrooms open more o en; gender‐neutral bathrooms at all facili es; pools open longer hours and for a longer season (they seem to only be open for kids on summer vaca on and not be targeted to anyone else); pathways to walk across the grass a er the rain when the ground is soggy; more pickleball courts; shaded courts; more water fountains; a water source at the downtown dog park; a climbing wall; outdoors skills workshops; more comfortable sea ng (picnic tables are hard for my back)
Bathrooms repaired and open during park hours.
Bathrooms were closed at Piney Wood park during two separate visit in June 2023. I would love for this park to have open bathrooms.
Bathrooms!!! And if there are bathrooms, clean ones that aren’t scary to use. And open all year round would great!!!! And more baby/kid swings!
bathrooms; security at night
Beau fica on of grounds. Be er programs.
Be er and more disc golf courses. More upkeep on the ones that are currently available.
Be er and more picnic tables and shelters. The ones at my nearest park are broken down and beside the playground.
Be er and more playgrounds. Cary playgrounds kick the shit out of Durham ones. Also, keeping creeps out of parks like Solite. I can't go there alone during the week.
Be er and more tennis courts! The courts we have are o en crowded and the nets and court surface need some serious TLC. With so much demand (there are o en people wai ng to use the courts, especially when the weather is nice) it makes sense for Durham to spend the money to keep the courts in good shape. There are trip hazards on the Southern Boundaries and East End courts, and large cracks at Forest Hills and Elmira that affect the bounce of the ball. Also, the courts at Rock Quarry, Elmira, and Forest Hills receive so much shade and water than mildew growth has made the courts slippery and dangerous to play on when there's any moisture on the courts.
Be er bathroom facili es
Be er bathrooms. More covered shelters
Be er bathrooms, be er playground equipment.
Be er bathrooms, increased access for individuals with disabili es, updated play structures
Be er care of the road into the park. It had many potholes
Be er drainage in low spots of trails ‐ flooding is o en a concern even several days or week a er rain at some parks. Be er bike paths and protected bike lanes to access parks.
Be er equipment and less sketchy people hanging out at the parks.
Be er facili es, cleaner, be er equipment, be er ligh ng
Be er incorpora on of na ve plants
be er landscaping and having no homeless campers
Be er landscaping, cleanliness, some pl ayground structures could be updated.
Be er maintenance (especially playgrounds and parking lots), more innova ve playgrounds
Be er maintenance of walking trails and improve security.
be er means of biking and walking to parks. Protected bike lanes.
Be er park management or trees and invasive species, ivy and wisteria
Be er parking
Be er parking lot ligh ng, repaved tennis courts, enforcement of city open container and drug ordinances.
Be er plan ngs, maybe na ve gardens, general clean up, updated equipment for children, more equipment for children 1‐3
Be er pool maintenance. Clean graffi more o en.
Be er resources for the community garden
Be er restrooms
Be er restrooms
Be er restrooms, baby swings
Be er security in those parks where serious incidents have occurred. Durham needs a couple of larger parks instead of all the vest pocket parks they now have, most of which are not very a rac ve and lack much in the way of ameni es (i.e., picnic tables, playgrounds, nicer walking trails). See Carrboro Community Park for an example of a well‐used park containing walking trail around the pond perimeter, ball fields in the back areas, a dog park, playground area and picnic area.
Be er showers at Edison and Johnson Park. More infant swim classes. Higher fences at dog parks.
Be er sidewalk and bike lane system connec ng parks to schools or other major areas. Tennis courts resurfaced and separate gated pickleball courts instead of lines on tennis courts. Be er cleaning of bathrooms, some are unusable. Be er ligh ng and safer monitoring like cameras. Many instances of guns/shoo ngs like the one on Moreene Rd.
Be er tennis court maintenance and drainage.
Be er/newer climbing features; more splash/spray pads
Bike racks, more informa on about how good biking is for the environment and health. Promote more biking please, in any way that is possible. Also promote respect for all cyclists.
Bike trails connec ng them to each other :)
Build Interna onal level disc golf courses to bring world class athletes and their economic bounty to Durham.
Bull City needs bathroom
Clean and update the bathrooms. All parks should have bathrooms.
Clean bathrooms, and water features.
Clean open restrooms, more community gardens, more comfortable sea ng.
Clean restrooms. Working Clean water fountain. Safe walking areas. Clean and safe pet areas
Clean up the lead in the soil
Clean up trash. More picnic tables BBQ grills
Cleaner and in some parks be er ven lated bathrooms.
Cleaner restrooms and tables cleared of spider webs and bee nests.
Cleaner streams
Cleaner, be er kept, be er signed and marked trails at West Point on the Eno, renova ons to start being made to Old Farm Park. In general, cleaner parks.
Cleaning and people picking up a er their dogs.
Cleanliness as well as overall func onality; the parks are also not very plen ful in all areas. I live near Brier Creek and we have no parks in our immediate area. We usually go to parks in Wake County simply because they are so much nicer and definitely more plen ful.
Cleanliness of parks, no trash le behind.
Cleanliness, more ameni es including pickleball.
Condi on of tennis courts could be improved.
Connect park system so we can walk further
Consistent presence and quality of restrooms. More diverse experiences/offerings
Cook road park needs a en on! The slides have been boarded up and it’s been disappoin ng.
Current ac vi es are great, would love more opportuni es for dancing ac vi es, music
CUT BACK OVERGROWN BRUSH IN ORCHARD PARK WHICH I USE TO WALK MY DOGS EVERY DAY
Dog Park in Sandy Creek area
Dog poop bags and more dog parks.
Drinking water
Duke Park desperately needs a major overall. I've lived near it for almost 30 years and the only real improvements over this me period have been a new playground and restrooms. Also there have been several demoli ons with no replacements. Clearance of unchecked vegeta on, new grading, sidewalks, trees, benches and tables are desperately needed. Central Park is wonderful, but all ameni es have been made by private investment.
DURHAM NEEDS MANY MORE SWIMMING FACILITIES‐WE NEED POOLS‐SWIMMING POOLS
Each park should have a water/ spray park for those under the age of 10 yrs. of age
Easier parking. More shaded areas. More sea ng areas
Ellerbee Creek trail
i85 underpass floods with every rain storm and it takes some mes a week for the sand to get cleaned out.
There are people sleeping in the woods along the trail. I think it’s ok and they are not affec ng the trail but the number has been growing this year.
Markings should be more clear to connect the trail from Broad street to where it connects back up by the stadium.
I’m as that part of the forest by the rock creek preserve was cut down for the new juvenile jail."
Emphasis on shade and safety at playgrounds.
Enforce the dogs being on leash law.
Expand the disc golf course at Forest Hills Park to a full 18 hole course
Expansion of gym op ons
Expansion of trail systems
Extend the Greenways, especially around the Riddle, 55, RTP areas
First and foremost, I would like Bethesda park disc golf cleaned up and repaired. It's horrible and disgraceful!!! Durham NEEDS some NICE parks!! Preferably with a disc golf course.
Fix and improve Rocky Creek Trail near Shepard Magnet Middle School.
Fix broken playground equipment, empty trash cans, make more trash cans available, clean up trash (should be everyone’s job, but people don’t do it), splash grounds that func on, more splash grounds.
Fix the collapsed drainage pipes in Forest Hills park. This is an ongoing issue for decades and poses a serious issue as Forest hills park is a flood plain, and new holes open all the me.
For Lake Michie, an annual launch pass for personal equipment if not ren ng. For Li le River Lake, the op on to launch non ‐ motorized personal equipment as opposed to ren ng (e.g. Kayaks and paddleboards).
Forest Hills Park: more bullpens. Sandy Creek: walkways are very o en flooded and could benefit from bridges or other infrastructure to avoid slipping/injuries in the mud. We would both really appreciate at least one of the parks (maybe Herndon Park) adding a running/walking track. We have always had access to tracks via local universi es or parks un l moving here. None of the universi es or schools provide public access and there are none available at any of the city parks.
General maintenance to playgrounds and more shade at playgrounds!
Get rid of lead (mul ple sites) or open lead free parks and close the sites with lead
Grounds upkeep, clearing pathways, stopping over growth.
HANDICAP ACCESSIBILITY, FLEXIBLE SEATING
HAVE TRAIL MAP AND LENGTH OF TRAIL. FOR SARAH P DUKE GARDENS FREQUENT MAPS AND DIRECTIONS
Hiking trails tended/cleared more o en.
I am very concerned about the lead reports so that must be resolved. The speed in which faulty equipment is replaced should really be improved as well.
I am very happy to see the pickleball equipment at Bethesda. I would like to see more mes when all of the courts are open play, and fewer courts are reserved by people who are teaching private lessons.
I feel that the downtown dog park needs to grow.
I like to walk my dog at the parks, so any improvements I would recommend would be pet‐related. More trash receptacles and poop bags?
I live in walking distance of Long Meadow Park and Oakwood Park. The play equipment at these parks is nice but these parks also have large numbers of adults without children hanging out all day every day at the picnic tables. It would be nice if the children's play area had a fence around it to clearly separate the areas where children play from the area where adults hang out.
I live near twin lakes. I would like to see more walking trails in the woods. Addi onally, I would like direct access from my neighborhood.
I love that you have been upgrading some parks, but wish we had more neighborhood parks up here in North Durham, especially with the rate of development going on! Ask developers to include playgrounds in plans
I love the Campus Hills pool.
I mainly go to twin lakes park. my main complaint is that the gravel road has many, many deep potholes and ruts that can really damage ones car unless you go very, very slowly, like way less than 5 miles an hour. I always worry about damage to my car. the entrance is the worst but really it is the whole road in the park. new gravel was put down last year or the year before but it doesn't last but a few months. I meet some frie nds at one of the shelters to do tai chi and we o en see the maintenance folks there ge ng trash and they are very cordial with us old ladies. we appreciate them. its a nice li le park and the soccer fields are always in use.
I use the third fork Creek trail to get to work and it's awesome as is
I would like more indoor swimming facili es ‐ the closest to me is 20 minutes away and there’s never a lane open.
I would like Parks & Rec to finish the Beltline Trail project and turn Durham School of the Arts grounds into a public park once the school relocates to North Durham.
I would like the park service to address the mud problems at the dog parks. The water run‐off from the water pumps at the parks cause mud to gather several feet around the area. I have to hose my dog off a er every visit. The new dog park at Rock Quarry in par cular is annoying.
I would like to see a comprehensive map of the greenways with distances listed and whether there is traffic nearby.
I would like to see a LOT more na ve plants in the landscaping and fewer exo c invasive like English ivy and nandina. I’ve been pulling English ivy o ff the trees at every opportunity.
I would love to see Duke Park upgraded. It’s a great large park and a dog park was added but nothing was done to update the play structure. I’d love to see that. Parks in Raleigh, Apex and Graham have parks with obstacle courses, shade and other unique features. I think it’d be cool to have that and Duke Park is large enough to accommodate. Other parks have been making small changes over me. Forest Hills park could also be an op on considering the size of the lot. A larger spray ground and never play area would be great. Our family loves to go outside but we find ourselves going outside of Durham for our family’s favorite parks.
I’d like to see the park near me (off of bacon and Capps st near heartside) improved by see new safer equipment, covered picnic areas, improved playground equipment and updated basketball courts.
I’m happy with the parks
I'd like to see pruning, mowing, cu ng on Third Fork Creek Trail be more a uned to maintaining beauty and nice vistas, and mindful about best ecological prac ces.
I'd love to see more fields available and open. There seems to be a huge need for more field space. I think sports are a great way for people to stay healthy and out of trouble. In order to have more opportuni es to play sports there should be more access to free fields.
I'm an avid disc golfer and I'd like to see more engagement between the parks o ffice and Bull City Disc Club. The club is willing to provide me and manpower to greatly improve the courses in Durham. This will benefit the players, but also the safety and experience of other park visitors.
Improve drainage around bball courts at Solite so less muddy
Improved bathroom facili es.
Improved playground equipment, more pickleball courts not just in south Durham, there is trash everywhere in Durham and the parks.
Improved restrooms, more shade in full sun areas, more shaded sea ng. Be er and more play equipment at Garre Road Park.
Improved roads, maintained turf and soccer nets,
improved trash collec on
Improvements to the soccer fields, both grass and turf.
In Sandy Creek a be er solu on to emptying garbage of dog poop; the path to Picket Rd. needs a en on due to flooding.
increase parking, larger basketball/tennis courts , increase electronic security day and night.
Increased hours, early or late in the day.
Investment in the disc golf courses on Durham parks to include: Be er tee pads and signage on all exis ng courses. Maintenance of Bethesda Park's course, to include foliage clearing and bridge repair. Expand Forest Hills course to a permanent 18 holes. Addi onal disc golf courses in Durham County. More community pools would be nice. Downtown YMCA will close for several years soon thereby removing one more pool from the community. Durham needs a compe on‐level natatorium like Greensboro, Raleigh, Cary, Chapel Hill...
It is a small thing, but could the signage in the parking lot at Sandy Creek Park be improved? We didn't know which was the direc on to go in for the main paved walking trail and walked to the old treatment plant ruins before we realized it was a dead end (we did want to see that end, but we were just confused).
It is great to have more wheelchair accessible facili es.
It would be great if it were easier to get to parks with be er biking infrastructure.
It would be nice if they were cleaner (less garbage), maybe more garbage cans and cleaner bathrooms.
It’s already been done, y’all just repaved the Ellerbe creek greenway and it’s so nice now! Would love to see more soccer fields!
Just general maintenance, more play equipment and programming.
Keep garbage cans empty, do some pruning of trees, add trails.
keep Sandy Creek Park free from development as threatened this spring. that development will severely compromise the open and soul refreshing space it currently presents
Keep up the restrooms be er, they are usually fairly dirty.
Larger Picnic areas
Larger space or ability to add onto the area. More picnic tables with all kept in good shape.
Let’s start by addressing that Durham popula on ra o of the amount of parks and area where children can play or exercise is LOW.
‐ Exercise areas needs to be constructed. Ex: running track/ green trails.
‐ Bathrooms needs to be improve.
‐ Water fountain need to be improve.
‐ Playgrounds need to be improve.
‐ Parking areas need to be improve.
Ligh ng for early and evening hours.
Li er removal.
Loca on
Longer bike trails, connec ng trails, mul ‐genera onal ac vi es, restaurants on the lake (that you can also access by boat), more adult sea ng at children's play areas.
Lyon Park needs addi onal trash cans there aren’t nearly enough and they are frequently overflowing
Maintain racquetball courts. There's o en lots of dust bunnies, peeled paint, and the doors don't close some mes.
Maintain the restrooms be er.
Maintaining the trail along New Hope Creek behind Githens Middle School.
Maintenance on some of the Eno trails where there is erosion
Make sure any toxic materials are removed.
Make sure the greenway/walking paths are clear of mud and overgrown plants.
Maureen road park, tennis backboard wall needs to be repaired. It is bent. Otherwise, it is nicely kept
Maybe more shaded spaces. And definitely ge ng ska ng rink at Merrill‐Moore Park up and running.
McCormick ‐ fix some plumbing infrastructure. I play disc golf, but even I as a disc golfer would welcome a soccer goal or something in big open field. Playgrounds at Durham parks in general need more shade, though I guess maybe it is just the case that outside is unlivable in peak summer! Would love more mtb trails, generally.
More accessibility for people with disabili es.
More accessibility included into the parks. Gates for younger kid playgrounds. More water feature op ons.
More accessible for people with limited mobility. Safer for smaller kids.
More accessible, updated and safe playgrounds for li le and big kids.
more ac vi es for ages 2‐5. water park
More areas for bicycles. More trails would be great.
More art.
More athle c fields and more nature parks.
More a en on to disc golf
more available lap swim mes
More basketball courts, more volleyball courts, more bike lanes.
MORE BATHROOMS AND MORE TREES
More bicycle repair stands.
More bike access from suburbs.
More bike op mized trails and natural surface mul ‐use trails throughout the city so we can recreate without having to drive and park a car.
More bike trails
More connec vity by sidewalks and bike lanes.
More courts for pickleball, please. Fastest growing sport in the country. We need to keep up with demand.
More Disc Golf permanent baskets at Forest Hills
More educa onal events for all ages.
More equipment for younger kids! More sea ng for older people who take the young ones! Cleaning up the park area and repain ng
More equipment of ac vi es and not just open fields. I’m referring to Merrick Moore park.
More extensive trail system that connects different parts of Durham and enables bikers to safely pedal around town
More field and courts available for pick up games without club rental
More flowers. Some fruit trees
More greenspaces, more tennis
More greenway trails that connect the parks to other parks and/or other parts of the city.
More greenways!!
more grills
More indoor aqua cs facili es, addi onal parks in northern Durham
more indoor pool op ons throughout the city
More informa on at the park about the facili es ‐ i.e. a sign that says if there is a walking trail; if so, a map and distance and accessibility. Or, if there are courts, what are they for and what is the process for signing up for mes. I think this is all online but it isn't obvious at the parks, at least the ones I've been to recently.
More jungle gym equipment for toddlers.
More landscaping and be er maintenance.
more li le parks near us. Doesn’t feel like there’s much besides a playground in American Village. I’d love one open space for gathering or throwing a frisbee
More loop trails
More maintenance of exis ng facili es, a larger variety of park ameni es, be er fitness equipment, rock climbing wall, more spray grounds, an amphitheater that could accommodate 15,000 a endees
More na ve plant plan ngs.
more na ve plants and grasses, disc golf course, parts of Ellerbe Creek greenway could be repaved
More na ve plants/areas for na ve wild life
More op ons for kids under 5. Most of the playgrounds are too advanced for their age.
More parks and ameni es in East Durham. More cooling sta ons as global warming increases. Electrical outlets at most shelters.
More parks, more space, and more shade structures.
More paved walking trails
More pickleball courts. Be er lit at night.
More picnic shelters, more open air swimming pools.
More picnic table coverage. More recyclable collec on containers.
More plants. Duke park needs some upgrading. We love parks and trails!
More pool hours or op ons. More outdoor ac vi es available like fishing.
More programs u lizing the parks such as athle cs.
MORE PUBLIC TENNIS COURTS SHOUDL BE AVAILABLE. PICKLEBALL IS FINE TOO BUT KEEP A BALANCE
More recrea onal equipment updated children play area shelters for family gatherings
more reliable restroom experiences
More restrooms and sea ng areas
More running paths throughout the city, especially in the eastern half. I o en get in a car to go run because the area around me doesn’t have consistent sidewalk access
More safety features.
More security features (ligh ng, gates, signage) and more trees.
More security, less homeless people, more bathrooms.
More senior ac vi es. Need safe bike riding areas
More shade and sea ng around some playgrounds and play structures. Expansion/ upgrades to splash pads. Longer evening hours for pools. More ameni es for adults like walking/biking trails, landscaped shaded sea ng areas.
More shade for outdoor play areas.
More shade near playgrounds. More water features. More community efforts to pick up trash in the parks, especially small pieces. I would LOVE to have juice boxes with plas c wrapped straws banned a er the number of straw wrappers I have picked up near park shelters!
More shade on playground areas, increased playground equipment for toddlers, more open play playground equipment, more rest areas/pavilions
More shade or sun protec on, especially on the playground. Separate equipment for toddlers.
More shade over playground equipment
More shade trees and benches in Central Park, Old North Durham Park, Bay Hargrove park, Duke Park, specifically near the playground. I’m a very hot parent watching a kid who just wants to be outside, who doesn’t care that it’s hot, but we all know it’s hot. Also some sort of shade structure at Rock Quarry Park, it was just renovated , but take a cue from Charlo esville, VA or Tallahassee , Fl with a covered concert area. A Func onal splash pad at East End park, probably more splash pads in general, put one in Central Park. Burch Ave and Trinity park are nice.
More shade, open space, quiet areas, nature based play, shorter natural surface trails within parks, pollinator meadows or areas
More shade.
More shaded play areas for kids.
MORE SHADY SPOTS TO SIT IN WHEN ITS HOT
More shelters and benches for parents.
More sidewalk and bike lanes to access parks! I feel like many parks have no sidewalk or no internal sidewalk to safely enter the park, or they're completely inaccessible if you don't have a car (e.g., Red Maple Park, Lakeview Park, some entrances of West Point on the Eno, Whippoorwhill Park, and Old Chapel Hill Rd Park.) Upgrade bathroom facili es at Northgate Park ‐ they're so old, have poor ligh ng inside, and dingy and gross; my niece and nephew are terrified to use them. General to all parks: more sea ng at parks and repair/replace playground equipment. General to all greenways: more greenways/extension of exis ng greenways, cut back greenway landscaping more frequently, more ligh ng on greenways, be er connec ons between greenways and bike lanes (preferably protected bike lanes, bike share sta ons and interac ve art along all greenways would be fun (similar to the Charlo e rail trail, Indianapolis cultural trail and Monon trail).
More signage for entrances and park maps.
MORE SIGNS FOR ALL ENTRANCES
More spaces toddler friendly.
More swimming pools. An outdoor 50m pool would be a great investment!
More tennis, pickleball facili es, be er, safer walking trails
More tourist a rac ons and photo ops, bathrooms, food and beverage.
More trails for hiking.
More trails for walking/hiking
More trails to walk safely. Maybe safe paths to connect parks, or parks with other op ons, like coffee shops or ea ng a er a walk?
More trash cans, water fountains and trail maintenance.
More trash containers and calisthenic equipment.
More trashcans and pet waste cans, especially along the greenway/trails.
More updated climbing structures, splash pads
More upkeep and cleaning.
More u lity space or open fields for kids to throw a frisbee, baseball, or kick a soccer ball in small 5 person group
More walking trails.
More walking/biking paths
More water features / spray grounds
more water sources for humans and pets. more trails.
More well draining fields and/or turf fields (and lights would be nice)
More well kept sports fields
more working water fountains
More young child playgrounds. Cary and Raleigh have much be er playgrounds. Structured kids ac vi es/ events.
More youth baseball fields, please! In ci es and towns throughout the Triangle, there are 3‐4 field baseball/so ball complexes that host travel baseball and so ball tournaments every weekend. These tournaments bring in dozens of families from all over the state, and other states, to spend money at hotels and restaurants in the community. It's a smart investment! Not to men on that South Durham Li le League and Bull City Li le League so ball/baseball have grown rapidly and are advancing to state and regional tournaments (on ESPN), bringing notoriety to our city.
Mostly we need way more of them! West Point on the Eno is great but it is a long way from South Durham. Where are the nature parks down here? Where are the soccer fields, etc.? We have the 3rd Fork greenway trail and that is it ‐ and whoever manages that doesn't do a great job. It is like they have no idea what goes on in the trail, they mow down all the wildflowers but leave all the dead trees leaning right over the trail. Assuming there is any natural land le in south Durham to make parks out of, please buy more! Also, see your Aqua cs Master plan, and implement it! It has been 7 years since it was published. Our kids went from young to high school, s ll no decent pools in Durham.
MOVE SHADE‐TREES AND SHADE SAILS. BETTER EQUIPMENT FOR PLAY. MORE OUTDOOR SWIMMING POOLS IN N DURHAM
Na ve plan ngs and dedicated pollinator spaces
natural play areas, addi on of more outdoor parks
Need dog waste disposable bins.
Need more baseball fields and would like to see aqua c water slide parks like City of Raleigh.
New parks. Like the city of Graham. Big circular paths for kids to ride bikes. Zip lines. Climbing toys. Swing arounds. Clear view of all your kids at one me. Splash pads.
New playground equipment, Landscaping
NEW PLAYGROUND EQUIPMENT, EXPAND SKATEPARK, PLEASE WORK ON RIVER FOREST PARK
Newer equipment, those squishy floors instead of wood chips or mulch.
Newer facili es, more shade structures. More pools or ska ng facility
Newer playgrounds with climbing equipment and specifically playgrounds designed for slightly older children (7‐10)
No homeless living in the parks. Every park should have running water via fountains which include bo le fillers and dog sta ons and bathroom facili es. More dog parks (Forest Hills or Lyon should have one). Flowers, flowering bushes, and/or trees blooming so something is flowering or crea ng interest/fragrance year round. Be er children playgrounds ‐ the dispari es between the facili es at Duke Park or Forest Hills vs. Orchard Park or Central Park is appalling.
None, I think mine is great!
Oakwood Park is a dump. Need to add port‐a‐po y.
Oakwood Park is overwhelmed with un‐housed people and trash. Need more help for these people.
Old Chapel Hill Road‐new turf. Love this park for soccer but turf is in poor shape and risks injury for users. Would love to see this park get new turf. Pineywood ‐ be er ligh ng in parking area
Op ons for recycling cans and in some cases more trash cans. Some parks don’t offer great shade so that would be nice I. The warmer months.
Outdoor fitness equipment for adults. Ant hills need to be addressed.
Parks could use a faceli .
Parks don't always feel safe. Parks need more flowers and beau ful landscaping. Parkins need benches under shade trees
pick up garbage from contained at bridge at Sandy Creek
Pickleball courts
PICKLEBALL COURTS, FRESH LANDSCAPING
Pickleball courts, playgrounds with shade, swings for children under 2 year, connec ng trails to schools and businesses.
Piney Wood parking needs to be improved by courts. Too many break ins.
Pineywood needs to reduce the crime. I'm always hearing gunshots in that direc on. I always make sure we are gone by 4pm. The south part of Durham has way less park and recrea on resources. For example, north Durham has an indoor pool. South Durham doesn't seem to have splash pads or pools. North Durham also obvi ously has the museum of life and science but we have so li le in the south part. We o en got to umstead park in chapel hill because it's an awesome playground with nature, the river, the trail, and covered picnic tables. We also drive to burlington splash pad o en.
Play ground equipment needs to be kept up be er. Repair the old and install new as needed.
Playground equipment for older kids, swings
"Please make a splash pad.
Every other town seems to have one and we have so many pocket park spaces downtown that are underu lized that could become so vibrant with a splash pad! "
POOL
Pools with stairs into water and upgraded area of pool, more barbecue areas, picnic tables, shelters
Protect tennis courts from local neighbors using for their dog runs. Cut back invasive species and poison ivy.
Add benches and/or picnic benches. In others repair benches.
Add climbing structures for older primary age children."
PUBLIC ART EVERYWHERE! LOVE THE NEW MURAL AT DULHE PARK‐SHADE AT BAY HARGROVE PARK
PUBLIC RESTROOMS, MORE INFORMATION ABOUT THE SPACE OR NATURAL STUFF THERE‐EG PLATE ABOUT HISTORY OF PARK OR PLANT LIFE THERE
RECALIM AREAS OVERGROWN WITH WISTERIA. MAINTAIN TRAILS BY MOWING. REMOVE SAGGING BRIDGE
Recycle facili es at all parks to prevent City and County residents from "breaking the law" by disposing of their cans and bo les in the trash cans when the ordinance requires that all recycles be kept out of the trash cans.
Refinish tennis courts. Add addi onal bike paths.
Renovated restrooms.
Repairs made to the pool (Long Meadow). Improved security and less an social behavior.
Repave Durham tobacco trail.
Restroom improvements and cleaning.
Restrooms can be very hit or miss (cleanliness, safety, availability). Wish there were more tennis facili es!
RESTROOMS SOMEWHERE ALONG TOBACCO TRAIL NEED INDOOR SWIMMING POOL
Restrooms would be nice at one of the li le parks on broad st.
Restrooms. ADA ramp.
Rockwood has a flooding problem. Forest Hills Park consistently has people smoking cigare es, marijuana, and trash le all around. Duke Park slides are dangerous!! My daughter got a large blister on her arm just last week from sliding down the big blue slide and the fric on it caused to her skin actually made it blister
Safer equipment‐ a lot of the equipment is wearing and damaged or hazardous (no old school jungle gyms where kids can fall) and more equipment. Interac ve aspects (zip lines, stages for “performances” etc.) and more shade. Also, ensuring there is no lead. More Accessible and inclusive for those with disabili es.
Safety
Safety cameras, police presence
Sea ng spots in the shade encourages older people to accompany other family members.
Security
Security
Shaded canopies, ac vi es to rent (bikes, scooters, toys for smaller children) and more water play areas available for summer play.
Skatepark or pedestrian path
Small 4 lane running. Rubber Walking track. More restrooms. Trash pick up increased in summer. Picnic areas.
Soil tes ng at parks found to have lead in samples. Addi onal areas for enclosed dog parks
Some parks are overcrowded.
Stabilizing well traveled trails.
Stop cu ng down trees if you can help it. Adding restrooms at some point could be nice. Maybe more gardens or na ve plants to encourage bees.
Strategically placed trash bins that are convenient for the visitors and not just for the maintenance crews.
tennis court improvements! southern boundaries needs it the most
Tennis courts need a en on. Cracks, frayed and sagging nets.
Tennis courts need re‐surfacing. More enclosed dog parks. Splash parks and pools
Tennis courts, be er ligh ng.
THE AQUATIC CENTER‐EDISON JOHNSON‐NEEDS MACHINE TO REMOVE SWIMSUIT WATER AND BETTER CLEANING AND FLOORS SLIPPERY IN LOCKER ROOM
The disc golf course at Valley Springs Park needs new tee pads. The current ones have become quite dangerous to play on. One member of my household has been injured twice due to falling off tee pads at this course. Both occurrences resulted in trips to the ER, one requiring surgery to repair a broken wrist.
The park I frequent always needs repairs. We report via one call and things o en are marked as completed and aren’t done. Especially plumbing issues.
The parks are usually maintained well. I would love to see some fruit trees like persimmons, figs, raspberries and paw paws. It would be nice for the community to pick fruit at the park.
The tennis courts and program have bern a real life safer during the pandemic. I've seen the parks department resurface and restripe some if the court. Many are s ll cracked, northgate and oval park are unusable without resurfacing. It's courts should be reserved for tennis. Pickleball should be kept off the courts. The sound is obnoxious and keeps tennis players from using the tennis courts at mes. I believe of pickleball becomes more than just a pandemic fad, it would be smart for the city to create dedicated pickleball courts where the sound won’t disturb residents. I also saw some dance roller skaters use the courts which was lovely to watch…it would be nice to see a places for people to inline and rollers skate. I’d live to see more green space through downtown. Places that feel like they are more for use, to sit and enjoy. The city, state, na on needs to help people who don’t have shelter.
The tennis courts are in desperate need of repair. The surfaces are either dangerous or unplayable in almost every park.
The tennis courts are not in good condi on. They need resurfacing and in some cases new lights for night me play.
The tennis courts at Forest Hills, Elmira, East End, and Sob need some repairs.
They could be cleaner. There are always people leaving trash around
They should put sta onary bikes or exercise equipment in the parks.
Third Fork Creek Trail, the area near the public works and MLK feels unsafe so I rarely walk to southern boundaries park, but I want to.
Timely maintenance of tennis courts, conversion of under‐u lized tennis courts to dedicated pickleball courts (Duke park, Northgate park)
Trail maintenance and pickle ball courts
Trash cans at parks need to be emp ed more o en.
Trash clean up; be er upkeep of vegeta on overgrowth
Trash management. Safe pedestrian routes to the parks/facili es (sidewalks!)
Unlocked, open fields at Valley Springs
Upgrade the swimming facili es
Upgraded equipment, more ligh ng, electronic charging sta on
UPGRADES BY ADDING MORE SEATING AREAS
Upkeep
Usually swing maintenance, but overall they are awesome.
WATER BOTTLE FILL STATIONS‐ESPECIALLY ALONG THE TOBACCO TRAIL‐GREENWAYS
Water faucets working and clean. Sanitary bathroom facili es
Water fountains and public restrooms
Water fountains and water quality.
WATER PARK‐INDOOR OR OUTDOOR
Water play features and shade.
Water sta ons, hiking trails
We could use a be er aqua c facility.
We mostly use the dog park.
We need to keep our parks like Duke keeps their grounds and raleigh
We use the American Tobacco Trail daily, love it, feel safe on it. Downed trees and debris are promptly addressed when I submit to One Call. Happy to finally see a trash bin at the Briggs Ave end of the Riddle Road Spur Trail.
Well maintained walking trails are the most import to my household
West Point on the Eno needs work. The trails could use some upkeep and signage. The park needs be er signage overall and most maps are from years ago and no longer are correct. Also the bathrooms are terrible and do not work many mes, the porta po ys are also always locked. We like the park, and it used to be great; but it seems like the pride of the city park system has been slowly forgo en.
When child was younger, would find damaged playground equipment. At same park, tennis courts were neglected but we s ll tried to use them despite the dog walkers using them as addi onal dog park. I believe they are now pickle ball, so there is nothing at our neighborhood park for us.
WOULD LOVE TO SEE TURF OR RUBBER GROUND AT MORE PLAYGROUNDS
Q4c—" If you selected "fair" or "poor" to Ques on 4a or 4b, what is the reason?”
DPR seems to put in half effort into their events.
Durham is lagging behind the other triangle ci es in terms of available ac vi es, quality of facili es, trees and green space.
Events can happen more o en and be a li le more diverse
My main experience is tennis. There are many white and black players and some Asian players, nit so many La n players. That being said, it feels like the white and black players’ teams are mostly separate…and the white teams are more plen ful which feels like a bit if a shame par cularly when playing at places like Elmira. That being said the park and sport does connect people via teams and the parks themselves to people outside of their easily familiar social network…the parks are opening those rela onships which is healthy and frui ul fir our city and the people connec ng, including me.
Not enough publicity for programs by media and online
NOT ENOUGH SPACES‐SLOTS IN THE SWIMMING FACILITIES. WE HAVE TRIED MANY TIMES BUT MY KIDS COULD NOT FIND A CITY FACILITY TO LEARN TO SWIM
Officia ng was lackluster. Program design could be be er. More seasons/leagues throughout the year could be offered.
One program needed a li le more structure.
Right wing protestors need to be kept in line.
Some of the programs are run be er than others
Some special events are be er than others but overall seems reliant on neighbors to produce.
Took swim lessons, very hard to get into but they were excellent
We most regularly a end Muddy Boots at the Educa on Pavilion at the Eno & the program is just wonderful. The guides are kind & prepared. The ming is perfect. And my son & I get to experience nature without any hassle.
We went to the Strawberry Fes val. I felt there was not diversity in entertainment.
Q5—" From the following list, please CHECK ALL of the ways you learn about City of Durham parks, facili es and special events.
Catalog
Discovering myself.
Do not hear about any.
Drive by
Drive by
Driving past them.
From disc golf sites.
Independent
Indie Weekly. Durham magazine email
Indy newspaper
Indy weekly
Indy weekly
Library
Library
Local news
Local news
Long me resident
Neighborhood listserv
Neighborhood listserv
Neighborhood listserv and Discover Durham. Social media should list Nextdoor which is how we ever know about the take back the night events. More yard signs.
Newspaper
Newspaper and TV
Online newspaper
Out and about on WRAL TV
Play More Guide online
Play More Guide mailing
Radio
Radio and/or TV adver sement
Stumbling upon them while walking or driving around
To be clear, all of my choices, social media, signage, word of mouth is from organized neighborhood efforts and not from the city. Our neighborhood listserv is most informa ve.
TV
TV
UDisc app
Weekly newsle er of free events across the triangle
WRAL OUT AND ABOUT IN NEWS APP
Q7—“Other”: Please CHECK ALL of the following reasons that may prevent you or other members of your household from using the parks and facili es offered by the City of Durham Parks and Recrea on Department (or, if you currently use them, what prevents you from using them more o en).
All of the workout facili es are outdated and need work.
bike ability
car totaled. temp w/out transporta on.
Central Park is a hazardous park with steep rocks and steep slides‐ it has no addi onal things to play on (except a creo bed that kids can easily fall in??). Slides can get burning hot too. And yet it gets very crowded bc so many families par cipate in your events. We wish we could stay and lounge at the park while the kids play But impossible bc the park is so terrible at this point. If you could improve and expand that park specifically, that would enrich downtown Durham beyond comparison‐ you would watch it THIRVE. Takes notes (both good and bad) from Cary’s park project. Ensuring the parks that have been iden fied as having unsafe levels of Lead need to be made safe and then build bigger and be er‐ immediately! That should be the HIGHEST priority! The surrounding communi es are owed at least that much. "
Classes fill up quickly.
Classes for kids fill up too quickly‐ not enough capacity (i.e.: tennis, soccer)
Climate change ‐ outdoors facili es are some mes too hot or the air quality is poor
Covid Pandemic concerns.
Difficulty with registering for programs ‐ hard to find deadlines and some mes too few spots that go fast.
Get rid of the sketchy people.
Green way access is far from home.
Have facili es in my community.
Health concerns
Health prevents me from doing much.
Heat! It’s Durham! It’s been hot, why the play structures and events don’t account for this is mind numbing.
I always find out about events a er they've happened or while they're happening but about to end, when I see other people post about them on social media. I wish I knew about events in advance so I could plan to go.
I do not know what is available.
I had Covid, I stay away from large groups of people.
I'm s ll mindful of COVID and not par cipa ng in some indoor ac vi es that I might have pre‐pandemic. For example, I was par cipa ng in and enjoying adult swimming lessons through the city just as the pandemic began. The class was cancelled a few weeks in, and I haven't yet felt comfortable returning in par cular, because I wouldn't be able to wear a mask like I do for most other indoor ac vi es.
In the past it has been difficult to get into some of the programs. Swim lessons are very popular and ideally the parks could do more of them. My child really benefits from the lessons. (It's difficult for us to afford them elsewhere as we are both teachers living in a city that is becoming much more expensive while our salaries are stagnant.)
It would be great if DPR would 1) answer the phone or 2) reply to emails regarding events or rental informa on. Customer service is appalling.
Just moved here.
Lack of bike paths.
Lack of communica on.
Lack of fields
Lack of knowledge. I don’t find the website to be par cularly helpful. An interac ve map feature may be useful here.
Lack of restroom facili es
Lack of shade
Lack of sidewalks and bike trails connec ng them to my home. The closest park to me (sandy creek) has no sidewalks going to it.
Lack of walkways or reliance on non ‐tended walkways that can be muddy. People with dogs o ff‐leash. The way facili es feel run down. Lack of programs that are focused on my age group besides tennis.
Locked and gated facili es at Valley Springs
Mud puddle‐dog dirty.
NOT ENOUGH FACILITIES, SO ONLY A FEW KIDS CAN PARTICIPATE
NOT ENOUGH INDOOR POOLS
not enough of them! Not enough pools, not enough natural parks with trails. WAYYY too much housing developments and luxury apartments. Not enough soccer fields and tennis courts.
Not enough shade!!!
Not enough variety of playgrounds.
Open restrooms.
Our closest park needs upda ng.
OVERGROWN TRAILS
Park entrance blocked by construc on
Park faculty at Old farm (North Durham) has been closed since the pandemic (they removed the playground) . It will be great if we can hear back from the City on what they’re going to do about it.
Put bathroom at Bull City
Ques ons over lead contamina on
Registra on is confusing.
Rehabbing knee replacement.
SHADE
Soccer fields are fenced off and not usable , we live right next to park
Some mes lights don’t go in when supposed to. Downtown our city needs more density and walkability. Safety is a bit of a ques on. I’d love parks to have a use / urban oasis feel more similar to places like NYC, Paris, Mexico City.
The heat, needing shade
There are no parks within walking distance of my house. I might be able to walk to rock quarry (or is it rock creek?) but it involves crossing very busy roads and walking paths with not much shade. In the summer it’s just not prac cal to get there on foot. We need be er support for pedestrians!!
Too dang hot!
Unleashed dogs.
Unleashed pit bulls.
We are an easy walking distance (10 mins) to Sandy Creek but the sidewalk stops right outside our house and the road is frequently busy with high traffic. It’s frustra ng to drive somewhere you could easily walk or bike to if only the infrastructure existed to do so.
Q8—“Other”: Please CHECK ALL of the following reasons you and members of your household use the parks and recrea on facili es offered by City of Durham Parks and Recrea on Department.
American Tobacco Trail managed by city is near by and fantas c.
Being in nature, biking or walking on Third Fork Trail, feeds and nourishes my spirit and mental health. Love seeing the flora and fauna and watching the seasons change.
Birdwatching. And other wildlife, but mostly birds.
Dog park.
Dog walking.
I meet 4‐5 other folks to prac ce tai chi at one of the covered shelters. we move one or two tables so we have enough space [and then we move them back into place]. it is a place we can regularly meet that seems to be available on a Sunday morning.
Play me with my kids.
Something to do, when in town
Ul mate Frisbee
Use Piney Woods dog park a couple of mes a month, depending on weather.
walk the dog, birding
WALKING THE DOG
Walking trails.
Walking trails.
Q12—“Other”: Please indicate if you have need to par cipate in each of the following recrea on programs or ac vi es
A quarter mile walking/running track around all athle c fields for walkers and runners to use.
Adult Educa on
Baby swim classes.
Bicycle paths and trails
Biking, cycling
Compe ve indoor badminton
Compos ng , Gardening
Environmental ac vi es "
keeping Sandy Creek Park free from nearby development
Mountain biking
Mountain biking
Mul ‐genera onal ac vi es
Natural preserves.
OUTDOOR POOLS
Please include more cycling.
Programs for young kids (under 5) offered on weekends!
safe bike trails
Shelter for gatherings, More sidewalks
Social dances, par cularly swing era dances like Lindy Hop, Balboa, Charleston, etc. which need medium‐large affordable spaces with wood floors.
TEEN JOBS FOR SUMMER LIKE LIFEGUARD
The spaces should be kept neutral of poli cal bias or religion to be useful.
There is no NEED to par cipate in any of these.
Trade programs for middle / high school students. For that we need several indoor facili es for the city of Durham. It’s seems as all the city does is allow builder companies to build homes. The community wonders where are children supposed to exercise and release stress. The builders aren’t building greed spaces within their projects, and the city officials do not care about the health of the community.
Ul mate Frisbee
Ul mate Frisbee
Ul mate frisbee fields, lighted, with safe/flat surfaces
Volunteer opportuni es.
Walking
Walking. Cycling
Yoga & Pilates
Yoga, Pilates, and fitness classes
Q17a—"Other”: If you answered "Not Suppor ve" or "Not Sure" to Ques on 17, please indicate why you answered this way.
All improvements would occur downtown and not where I live in South Durham.
I am willing to pay the Play more Card registra on and fees for certain ac vi es like swimming, but I do not wish to be taxed extra. We are already taxed extra for Free Bus Service Transporta on.
I don't feel safe at most of the city parks. Connec ng trails would be a mistake with the amount of crime in Durham. I'm from Chicago where they have wonderful parks. One major thing that is lacking in Durham parks are trees and shrubbery, especially though ully placed. Durham Central Park is a joke. Parks need trees!!
I think our tax dollar is not spent effec vely now and would prefer that maintenance and improvement factor in to the exis ng budget. The area is growing rapidly, bringing in more taxes.
I would rather re‐allocate money from Durham Police Department before raising taxes.
I would support natural related ameni es.
MAINTAIN WHAT WE HAVE. THE PARK NEAR ME IS OVERGROWN WITH POISON IVY AND WISTERIA. IT WAS WIDE OPEN IN THE 1980S‐THE BRIDGE IS FALLING OVER
My family's teachers salary has not increased enough to be able to pay more taxes without decreasing our budget for basic necessi es. Please consider a tax break for teachers so we can con nue to afford to live in the community.
need more park/playground in South Durham before improving parks elsewhere
Our taxes are already high. I would want to see a master plan and a cost figure. Usage fees would be a good solu on.
Rather more parks as higher priority
Taxes already too high.
The city makes poor decisions around tax payer dollars. I do believe that if we could make do with what we have and stretch the money we wouldn’t need to increase taxes.
Q18a—“Other”: If you answered "Not Suppor ve" or "Not Sure" to Ques on 18, please indicate why you answered this way.
Durham cannot/does not do the required maintenance to exis ng parks. The infrastructure is crumbling in older parks that are heavily used. I don’t trust new parks will solve deferred maintenance issues. Parks and Rec point to general service to fix probs and nothing ever gets done. Volunteers take care of almost everything in Forest Hills Park, just as it’s always been. It’s disheartening.
I believe focusing on improving exis ng parks would provide more bang for our buck than developing new parks.
I believe the funding they currently have needs to be used to improve exis ng resources and build on the exis ng programs before spreading out funding and resources even more.
I think we should invest in our current spaces before building new parks.
I would rather re‐allocate money from Durham Police Department before raising taxes.
If it were built near my home then it would be posi ve.
I think Durham already has sufficient funding, the money is not always used as it should be. Take a good look at what we already have and improve and perfect those. I'm not familiar with park rules but I wonder, Do they close before 9 PM, Is there sufficient ligh ng? What about security? People need to feel safe. I voted for that 95 million dollar bond a few years back and they didn't do what they had proclaimed.
Improve the parks we already have by making them look appealing. Parks need trees and shrubbery!! They're Aldi not very safe because the crime is constantly rising here.
Just what we need is another drug area and thugs ll DURHAM gets there younger popula on under control we do not need to give them another place to ruin and use as their turf for dealing drugs and crime
Other than the ska ng rink (which has been absent from this survey), I think we have sufficient parks, that just need to take in to account the climate, needs for sea ng, need for restrooms , and beauty. New parks probably not that necessary
Please con nue to apply and use grant money.
The city needs to take be er care of their parks (West Point). Before they spend money on new ones.
We have enough parks in Durham, but the exis ng parks need improvements. I would prefer improvements to the exis ng parks over the addi on of new parks.
Q19—“Other”: Please check the top THREE areas you believe Durham Parks and Recrea on should focus on improving.
Addressing the toxic solic discovered by Duke student. Tes ng all parks for hazardous condi ons.
Awareness of what is available.
Bethesda Disc Golf course cleaned and REPAIRED. New disc golf courses."
Boys, girls and senior so ball leagues.
Build more paved trails
Build mountain bike trails.
Building new bicycle paths.
Canine spaces. I don't think there should be a dog park license, but that rabies and DAP proof should be on the dog/with the person when they a end dog parks. If there are fees, they should go to dog parks.
Communica on to under‐served popula ons.
Communica on. Publicizing what Durham has to offer.
Connec ng exis ng trails for be er park access
Connec ng sidewalks and bike lanes, safety on greenways to/from downtown, parks are all hidden
Environmental educa on, pollinator spaces and na ve plan ngs
Facili es closer to where I live. Be er communica on of what is available.
Indoor track facili es
Informa on on events and services.
LOCK PARK ENTRANCE AFTER DARK‐GUN PLAY
Marke ng
More disc golf
More downtown spaces, use small building area.
More par cipant capacity for programs
More trail ways for biking/hiking to points of interest
More trails near my neighborhood.
Need bike lanes.
Pickleball for adults with chronic illnesses such as Parkinson's.
Providing green spaces and tree canopy to help combat heat islands.
Restrooms
safe bike trails
Safety
Safety
Safety
Safety
Safety
Safety! Cameras and police presence
safety, monitor park
Safety, security and noise limits.
Safety
Security.
Sharing exis ng programs and making it simpler to sign up for these programs would be a plus. The site is not easy to navigate and search. It has proven to be complicated for me and friends will not join us because of the complex sign up process to register for things.
Take responsible ac on immediately at parks where lead levels are high and test for other toxins at these sites. Close these areas NOW un l test results deem them safe. Begin free lead tes ng clinics for young people in areas near those parks and adver se widely for all residents to take advantage of. Do an about face on how city has handled this situa on to be TRANSPARENT and take responsibility ASAP.
TEEN JOBS IN YOUTH PROGRAMS FOR SUMMER CAMPS‐AT POOLS
2023 City of Durham Parks and Recreation Needs Assessment Survey
Your input will be used to assess community parks and recreation needs and priorities for the City of Durham. If you prefer, you may complete the survey online at Durhamparksurvey.org
1.Including yourself, how many people in your household are...
Under age 5: ____
Ages 5-9: ____
Ages 10-14: ____
Ages 15-19: ____
Ages 20-24: ____
Ages 25-34: ____
Ages 35-44: ____
Ages 45-54: ____
Ages 55-64: ____
Ages 65-74: ____
Ages 75-84: ____
Ages 85+: ____
2.Have you or members of your household visited any City of Durham parks or facilities during the past 12 months?
____(1) Yes [Answer Q2a-c.]
____(2) No [Skip to Q3.]
2a. How would you rate the overall quality of all the parks or facilities offered by the City of Durham you or members of your household have used during the past 12 months?
____(4) Excellent ____(3) Good ____(2) Fair ____(1) Poor
2b. In the past 12 months, approximately how often have you or members of your household visited any City of Durham parks or facilities?
____(1) Every couple of months ____(2) Once a month ____(3) A few times a month ____(4) Once a week ____(5) 2-3 times a week ____(6) Daily
2c. What improvements or additions would you like to see made to the parks you and the members of your household visit most often?
3.Based on your current perception, about how long would it take you to walk from your home to the nearest City of Durham park, facility, or greenway trails?
____(1) Less than 5 minutes ____(2) 5-10 minutes
____(3) 11-15 minutes ____(4) 16-20 minutes ____(5) More than 20 minutes
4.In the past 12 months, have you or any member of your household participated in any recreation programs or special events (Summer camps, Earth Day Festival) offered by the City of Durham? ____(1) Yes [Answer Q4a-c.] ____(2) No [Skip to Q5.]
4a. How would you rate the overall inclusiveness and diversity of recreation programs or special events you and members of your household have participated in?
____(4) Excellent ____(3) Good ____(2) Fair ____(1) Poor
4b. How would you rate the overall quality of recreation programs or special events that you and members of your household have participated in?
____(4) Excellent ____(3) Good ____(2) Fair ____(1) Poor
4c. If you selected "fair" or "poor" to Question 4a or 4b, what is the reason?
5. From the following list, please CHECK ALL of the ways you learn about City of Durham parks, facilities and special events.
____(01) Bulletin boards
____(02) Conversation with staff
____(03) Direct email
____(04) City of Durham website
____(05) City newsletter
____(06) Social media (e.g., Facebook, Twitter, Instagram)
6. Which TWO of the sources of information listed in Question 5 do you most prefer to use to learn about City of Durham parks, facilities, and special events? [Write in your answers below using the numbers from the list in Question 5.]
1st: ____ 2nd: ____
7. Please CHECK ALL of the following reasons that may prevent you or other members of your household from using the parks and facilities offered by the City of Durham Parks and Recreation Department (or, if you currently use them, what prevents you from using them more often).
____(01) Cost of participation
____(02) Facilities are too far from home
____(03) Inconvenient hours of operation
____(04) Lack of transportation
____(05) Lack of cleanliness
____(06) Lack of access for people with disabilities
____(07) Lack of information/don't know what is offered
____(08) Lack of maintenance
____(09) Lack of parking
____(10) Information is only available in English
____(11) Lack of diversity
____(12) Not enough time/too busy
____(13) Not interested in what is provided
____(14) Overcrowding
____(15) Safety at facilities
____(16) Other:
____(17) Nothing; I am actively using the City's parks and facilities
8. Please CHECK ALL of the following reasons you and members of your household use the parks and recreation facilities offered by City of Durham Parks and Recreation Department.
____(01) Program or facility offered
____(02) Safety of parks and facilities
____(03) Quality of instructors
____(04) Facilities have the right amenities
____(05) Quality of programs
____(06) Facilities are well maintained
____(07) Close to our home/residence
____(08) Enjoyment of the outdoors
____(09) Programs are interesting
____(10) Fees are affordable
____(11) Good customer service by staff
____(12) Facility operating hours are convenient
____(13) Registration for programs is easy
____(14) Availability of parking
____(15) Improved physical fitness and health
____(16) Quality of life
____(17) Socializing/meeting people
____(18) Other:
____(19) None; I do not use parks, recreation facilities, or programs
9. How satisfied are you with the overall value your household receives from the City of Durham Parks and Recreation Department?
____(5) Very satisfied
____(4) Somewhat satisfied
____(3) Neutral
____(2) Somewhat dissatisfied
____(1) Very dissatisfied
____(9) Don't know
10. Please indicate if you have a need for each of the following recreation facilities or amenities by circling either "Yes" or "No." If "Yes," answer the question in the shaded area to the right.
Facilities and Amenities
Do you have a need for this facility or amenity? If "Yes," how
11. Which FOUR of the facilities or amenities from the list in Question 10 are MOST IMPORTANT to your household? [Write in your answers below using the numbers from the list in Question 10, or circle "NONE."]
12. Please indicate if you have need to participate in each of the following recreation programs or activities by circling either "Yes" or "No." If "Yes," answer the question in the shaded area to the right.
Programs and Activities
Do you have a need to participate in this activity? If "Yes," how
13. Which FOUR of the programs and activities listed in Question 12 do you think are MOST IMPORTANT to your household? [Write in your answers below using the numbers from the list in Question 12, or circle "NONE."] 1st: ____ 2nd: ____ 3rd: ____ 4th: ____
14. Please indicate your level of agreement with each of the following statements regarding the City of Durham parks and recreation, where 5 is "Strongly
and 1 is "Strongly
16. Which THREE of the items in Question 15 would you be most willing to support with your tax dollars? [Write in your answers below using the numbers from the list in Question 15, or circle "NONE."]
17. How supportive would you be of paying additional taxes to improve existing parks in Durham?
____(3) Very Supportive ____(2) Somewhat Supportive ____(1) Not Supportive [Answer Q17a.]
Not Sure [Answer Q17a.]
17a. If you answered "Not Supportive" or "Not Sure" to Question 17, please indicate why you answered this way. [Check all that apply.]
____(1) I need more information before I can answer
____(2) I do not use any Durham parks
____(3) I believe Durham currently has sufficient park opportunities and does not need additional funding
____(4) I do not support any increase of taxes
____(5) Other:
18. How supportive would you be of paying additional taxes to construct new parks in Durham?
____(3) Very Supportive
____(2) Somewhat Supportive
____(1) Not Supportive [Answer Q18a.]
____(9) Not Sure [Answer Q18a.]
18a. If you answered "Not Supportive" or "Not Sure" to Question 18, please indicate why you answered this way. [Check all that apply.]
____(1) I need more information before I can answer
____(2) I do not use any Durham parks
____(3) I believe Durham currently has sufficient park opportunities and does not need additional funding
____(4) I do not support any increase of taxes
____(5) Other:
19. Please check the top THREE areas you believe Durham Parks and Recreation should focus on improving.
____(01) Accessibility
____(02) Maintenance of parks and facilities
____(03) Customer service
____(04) Promoting healthy, active lifestyles
____(05) Updating existing parks and facilities
____(06) Special events
____(07) Aquatic facilities/programming
____(08) Volunteer opportunities
____(09) Protecting the environment
____(10) WiFi
____(11) Other:
20. In your opinion, how important is the existence of public parks and recreation to the quality of life in Durham?
____(5) Very important
____(4) Important
____(3) Neutral ____(2) Not important
21. What is your age? ______ years
____(1) Not at all important
22. Approximately how many years have you lived in the City of Durham? [Write "0" if less than 1 year.] ______ years
23. Your gender: ____(1) Male ____(2) Female ____(3) Non-binary
24. Please CHECK ALL of the following that best describe your race/ethnicity.
____(01) Asian or Asian Indian
____(02) Black or African American
____(03) American Indian or Alaska Native
____(04) White or Caucasian
____(05) Native Hawaiian or other Pacific Islander
____(06) Hispanic, Spanish, or Latino/a/x
____(99) Other:
25. Would you be willing to participate in future surveys sponsored by the City of Durham Parks and Recreation Department?
____(1) Yes [Please answer Q25a.] ____(2) No
25a. Please provide your contact information.
Mobile Phone Number:
Email Address:
This concludes the survey. Thank you for your time!
Please return your completed survey in the enclosed postage-paid envelope addressed to: ETC Institute, 725 W. Frontier Circle, Olathe, KS 66061
Your responses will remain completely confidential. The information to the right will ONLY be used to help identify the level of need in your area. Thank you!
Sports and Leisure Market Potential
Data Note: An MPI (Market Potential Index) measures the relative likelihood of the adults or households in the specified trade area to exhibit certain consumer behavior or purchasing patterns compared to the U.S. An MPI of 100 represents the U.S. average. Source: These data are based upon national propensities to use various products and services, applied to local demographic composition. Usage data were collected by MRI-Simmons in a nationally representative survey of U.S. households. Esri forecasts for 2023 and 2028
Sports and Leisure Market Potential
Data Note: An MPI (Market Potential Index) measures the relative likelihood of the adults or households in the specified trade area to exhibit certain consumer behavior or purchasing patterns compared to the U.S. An MPI of 100 represents the U.S. average.
Source: These data are based upon national propensities to use various products and services, applied to local demographic composition. Usage data were collected by MRI-Simmons in a nationally representative survey of U.S. households. Esri forecasts for 2023 and 2028
Sports and Leisure Market Potential
Data Note: An MPI (Market Potential Index) measures the relative likelihood of the adults or households in the specified trade area to exhibit certain consumer behavior or purchasing patterns compared to the U.S. An MPI of 100 represents the U.S. average. Source: These data are based upon national propensities to use various products and services, applied to local demographic composition. Usage data were collected by MRI-Simmons in a nationally representative survey of U.S. households. Esri forecasts for 2023 and 2028