

This presentation intends to help the City of Austin consider two questions when weighing how many segments of the planned Our Future 35 Cap and Stitch program to fund.
1 What economic and fiscal benefits should Austin expect from Our Future 35 Cap and Stitch and how does the project support longterm economic development?
2 What can Austin learn from how other cities have invested in transformative public spaces to seed philanthropic, private, and other public funding?
We developed several takeaways based on an analysis of precedent projects and assessment of the opportunities for Our Future 35:
1. Public space, especially signature spaces, generate localized value around the space, and have short-term and long-term ripple effects throughout regional economies. Austin can expect the caps to create similar effects.
2. Public space investments of this magnitude are almost always partnerships among multiple public and private partners but are often seeded and initiated by city governments.
3. Large-scale infrastructure projects such as caps can take years to come to fruition, taking advantage of shifting opportunities over time and delivering long-term benefits.
4. With the right design and programming, the cap and stitch program can re-stitch East Austin and Downtown and connect and amplify the impact of other investments in east Downtown.
The Our Future 35 Cap and Stitch program proposes creating a string of signature public spaces that bridge over I-35, turning a gap in the urban fabric that drains local vitality into a catalyst for economic activity.

As the Capital Express Central project advances, the City of Austin must determine how much of the planned Our Future 35 Cap and Stitch program to fund.

This decision comes at an uncertain time, when federal funding may be unreliable, City budgets are facing shortfalls, and recent and proposed legislation create challenges for cities to generate revenue.

Source: City of Austin
Active, programmed, signature open spaces in general, and highway caps in particular, have a proven return on investment.


Public space infrastructure leads to economic development in terms of surrounding real estate, but also long-term regional competitiveness. Public Space

Signature urban public spaces generate outsized fiscal, economic, and quality-of-life impacts.


Signature urban public spaces deliver returns including increased visitation, property value appreciation, accelerated pace of real estate development, and more.

1.5-mile long elevated park built on top of abandoned freight rail line.
Year Built: 2011 (Sec. 1 and 2)
Investment: $152M (Sec. 1 and 2)
Impacts:
• $1.4B tax revenue generated or projected to be generated by High Line (2007-27) ($65M annually)1
• $2B in new development including 3,000 net new homes (33% rent regulated) (2007-17)2
• 7M annual visitors (2024)3

22-mile trail loop built on former railway encircling central Atlanta.
Year Built: Ongoing (85% complete in 2023)
Investment: $776M (as of 2023)
Impacts:
• $9.0B in new development (2023)
• Office rents within ¾ mile of trail are 61% higher in Eastside and 16% higher in Westside vs. citywide average (2012-22)5
• 2M+ visitors per year (2024)6

12-acre park built on former parking lots next to Houston’s Convention Center.
Year Built: 2008
Investment: $125M
Impacts:
• $2.0B+ in new development around the park (2008-24)7,8
• 2M+ annual visitors (2023)9
• 1.3X faster hotel inventory growth within a quarter mile vs. Houston Central Business District overall (2008-24)10
Public space caps are a proven way to turn uses that divide or disrupt urban connectivity (like a freeway, parking lot, or railyard) into uses that catalyze positive impacts.
Chicago’s Millennium Park opened in 2004 with a total project cost of $490M.1 It capped parking lots and rail yards to link downtown Chicago to the lakefront. Upon opening, the park was an economic boon to the area:
• Catalyzed $10B in private real estate development (2004-14)2,
• Encouraged construction of 4,800 apartment and condo units (+71% residential population) in areas adjacent to park (1998-2011).3
Millennium Park’s impacts to Chicago are ongoing:
• Directly contributes $200M annually in tax revenues to the City of Chicago through sales and hotel-motel taxes2
• 20M+ annual visitors2
• 200 free public programs annually2


Overcoming divisive infrastructure to reconnect communities also has proven economic and fiscal benefits.
Rochester’s Inner Loop East Transformation
Project converted a ⅔-mile sunken highway segment into an at-grade boulevard with bike and walking paths, reconnecting neighborhoods and catalyzing development:

• Six acres of land freed for real estate development1
• Created 170 permanent jobs and over 2,000 construction jobs1
• Allowed 100,000 square foot expansion of The Strong National Museum of Play1
• $200M in new investment since expressway filled in (2017-24)2

Public space caps are a particular iteration of this phenomenon, where reconnecting communities via a signature public open space can transform a locally negative land use into a catalytic positive.


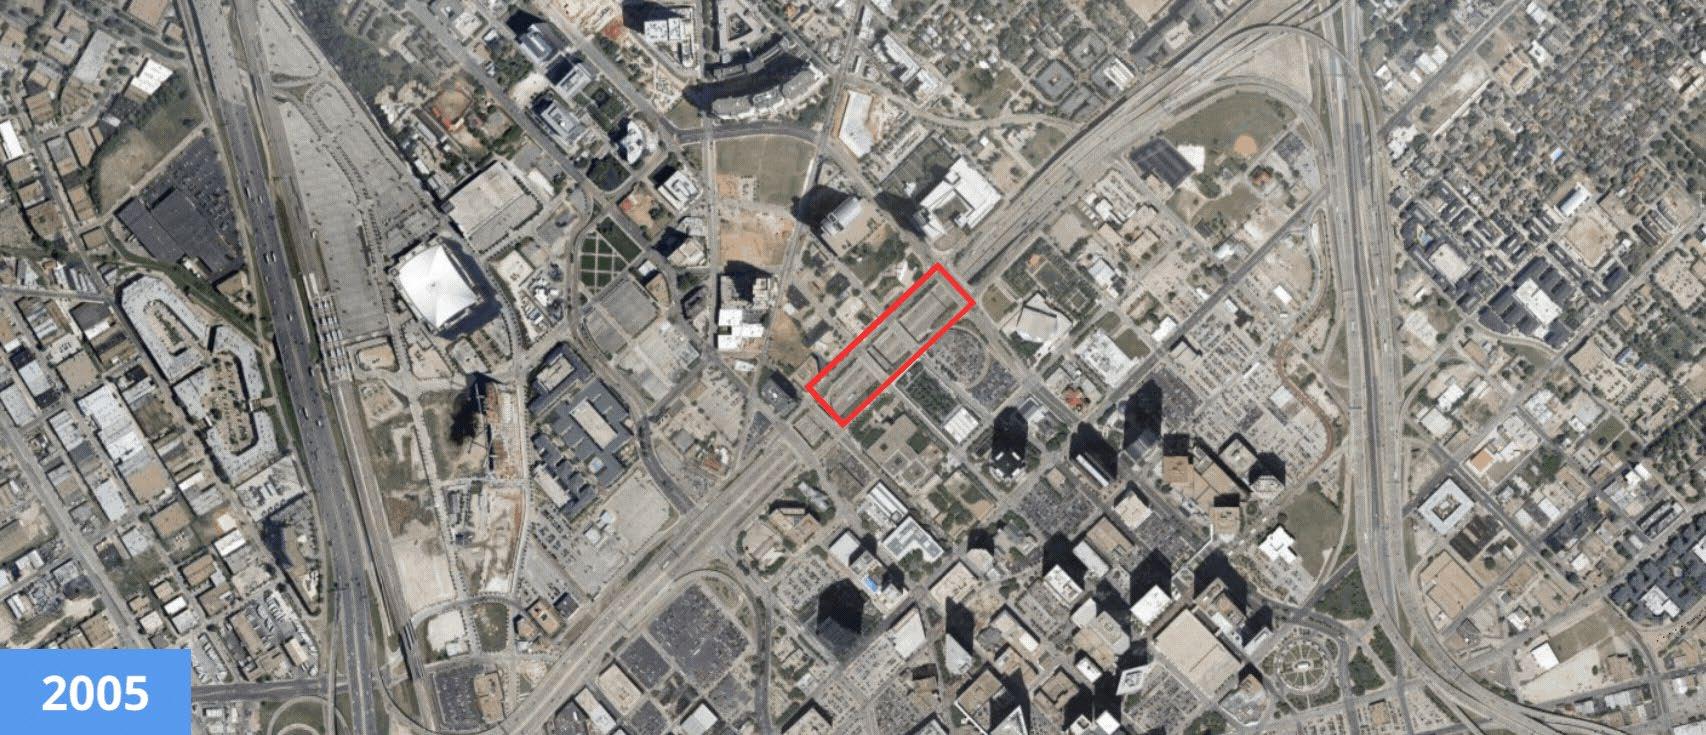
Klyde Warren Park (KWP) is a 5.4-acre public space cap that reconnected Dallas’ Uptown and Downtown neighborhoods and has been a critical part of their revitalization.
Klyde Warren Park and Revitalization of Downtown Dallas (2005-2022)

Klyde Warren Park (KWP) is a 5.4-acre cap park that reconnected Dallas’ Uptown and Downtown neighborhoods and has been a critical part of their revitalization.
Klyde Warren Park and Revitalization of Downtown Dallas (2005-2022)


KWP created a new public space over the ten-lane Woodall Rogers Freeway, catalyzing real estate development in an area that had been underinvested in. +212%
Increase in property values within KWP Public Improvement District 2013-24 ($2.57B to $8.04B)1 $700M
Additional tax revenues generated 2013-24 (to City, County, DISD, Dallas College, Parkland Hospital District)1

Klyde Warren Park continues to attract new real estate development nearby more than a decade after opening in 2012.
Bank of America’s Dallas President told the Dallas Business Journal about their forthcoming space, “The site overlooking Klyde Warren Park, amid an abundance of walkable Uptown Dallas amenities, is an ideal space to bring our team together in a central location.”


Bank of America Tower at Parkside1
• 500K SF office tower
• Broke ground: 2023
• Expected completion: 2027

New Goldman Sachs Campus2
• 800K SF office campus
• Broke ground: 2023
• Expected completion: 2027
KWP’s amenities and programming have created a destination for locals and tourists alike, attracting over a million visitors and associated spending to the city.
1.3M
Annual visits to KWP1 (est. 90% Dallas residents)2
+335%
Growth of mixed beverage sales within ¼-mile of KWP (2012-2024)3 (compared to +109% in Downtown/Uptown, +97% citywide)


$1.3B
Overall economic impact to Dallas (2009-2015)2


KWP’s resounding success has fueled efforts and funding for the park’s expansion.
KWP Phase 2 will expand the park by 1.7 acres, capping the remaining sunken portion of the Woodall Rogers Freeway.
Nearby property owners continue to be willing to pay for the benefits of KWP and its expansion through special assessments.
• Consented to PID creation in 2014 and renewal in 2021, despite overlap with Uptown and Downtown PIDs
• Assessment increase to finance $20M in KWP Phase 2 costs petitioned for and currently under City Council review
Rendering of KWP Phase 2

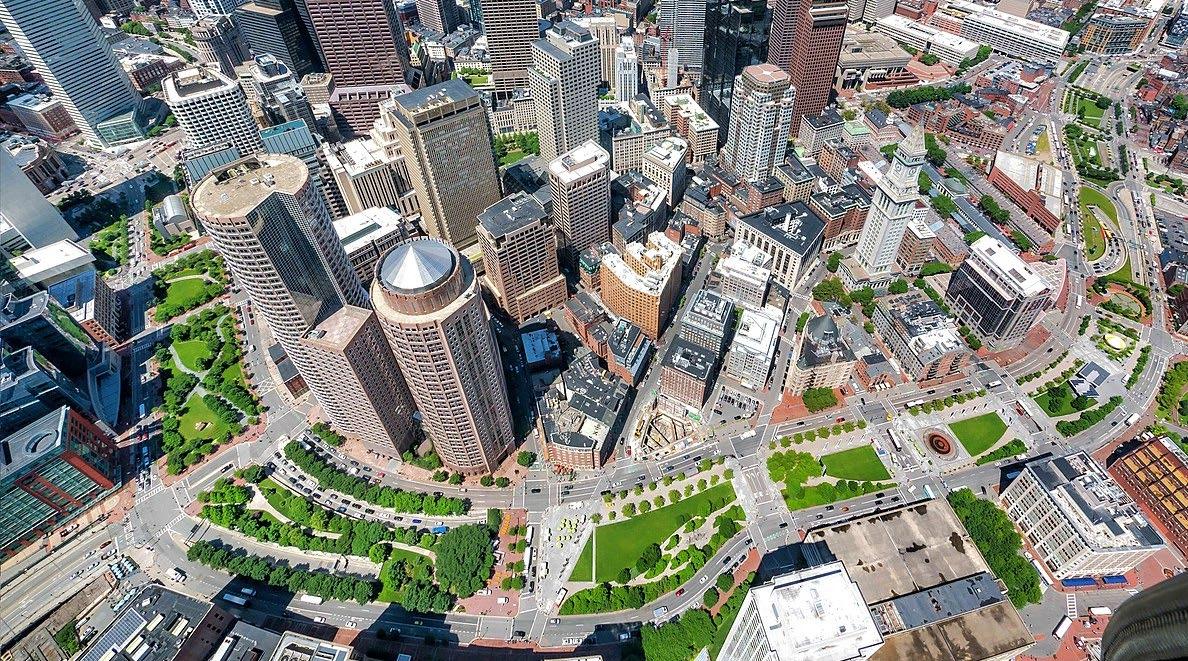
Boston’s Rose Kennedy Greenway is a 17acre green space stretching across 1.5 miles that illustrates the benefits of a large-scale linear park created from capping a highway.
• 1991: “Big Dig” project breaks ground
• 2000-05: Heavy construction in future Greenway area
• 2005-08: Greenway improvements installed
• 2008: Rose Kennedy Greenway opens

The Greenway was created from land freed up by tunneling a portion of I-93, reconnecting downtown Boston to its waterfront.


By moving the highway underground and placing a series of parks at street level, the Rose Kennedy Greenway unlocked real estate potential in several Boston neighborhoods.
1.9X
Growth in apartments/condos ¼ mile from Greenway vs. Downtown Boston overall (from Greenway opening in 2008 to 2024)1
+11%
Office rent premium ¼ mile from Greenway vs. downtown Boston overall (2024)1
$84M
Incremental property tax revenue from commercial real estate growth near the Greenway (2005-2009)2

By moving the highway underground and placing a series of parks at street level, the Rose Kennedy Greenway unlocked real estate potential in several Boston neighborhoods.

The Rose Kennedy Greenway draws visitors and visitor spending downtown – an economic benefit nearby property owners were willing to pay for. In 2018, the Greenway BID was formed, and its assessment revenues contribute substantially to the Greenway’s operations and maintenance.
1.6M
Annual trackable Greenway visitors (2019) (Millions more visit the Greenway without signing up for or purchasing something)
$1M
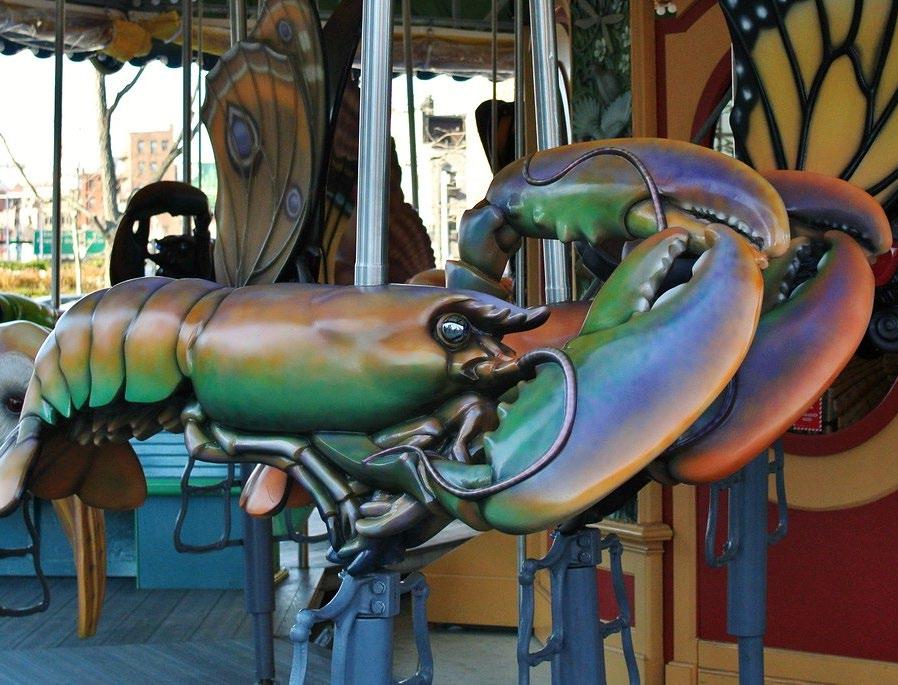
In Greenway earned revenue in FY2024 from beer gardens, carousel, promotional fees (16% over 2023)
22% Of Greenway’s FY24 operating budget funded by Greenway BID assessment revenues ($1.7M)


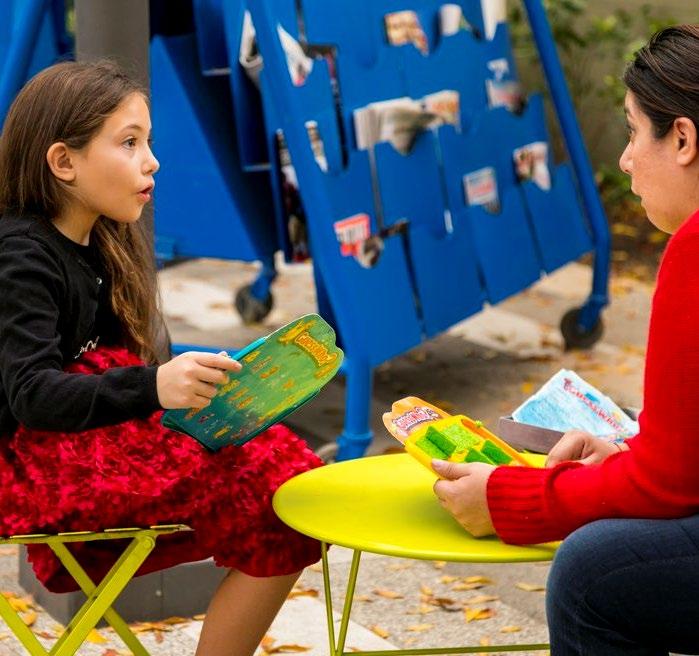
The Rose Kennedy Greenway is not just physical infrastructure – it is a public asset that supports locals and tourists alike with its rigorous programming and other initiatives. In 2024 alone, the Rose Kennedy Greenway:
Hosted 400+ free events including markets, fitness classes, movies, and performances.
Served as an incubator to 100+ small businesses through food truck program, fitness series, beer gardens, and artisan markets.
Provided 600+ volunteers opportunities to contribute 3,000+ hours to Greenway beautification.

Other completed and ongoing public space cap projects offer examples of how their construction, as well as operations and maintenance, can be funded.


Klyde Warren Park was built with support from public and private funders. Nearby property owners pay special assessments to support park operations and maintenance.
$107M
Funded park amenities

In 2006, Dallas Mayor Laura Miller pledged to provide $20M in city bond funding for KWP if the park’s foundation could raise $10M in private funding commitments. The foundation did so, mostly from real estate interests abutting the park, along with secured $20M in State funding that year, securing $50M in funds in just a few months.
Funded deck infrastructure
In 2014, a Klyde Warren Park/Dallas Arts District PID was established to fund programming, security, beautification, and other district operations and maintenance. In 2024, the PID had a $1.9M budget.
Building on KWP’s initial success, public and private funders are supporting an ongoing effort for its expansion, expected to start construction in 2027.
Total: $155M
Private, $74M
Funded park amenities

North Central
TX COG, $43M
City Bonds, $17M
County, $2M
Federal, $20M
Funded deck infrastructure
The expansion of Klyde Warren Park will include a new 50,000 square foot pavilion, allowing the park to host events like weddings. Rental revenue from the pavilion will support park operations including over 1,300 annual free events and programs.
Funding from the City of Dallas and the NCTCOG supported Southern Gateway’s Phase 1 deck infrastructure; private sources provided the bulk of funding for park amenities.
Southern Gateway Phase 1 Capital Stack
Total: $112M
State, $5M
Other, $17M
Funded park amenities
Private, $43M
City Bonds, $7M
North Central
TX COG, $40M
Funded deck infrastructure

The Southern Gateway Public Green Foundation has been an active private partner in the design and construction of the cap park, raising funds, contracting for design and engineering, and more. They will also operate and maintain the future park. This model has been used for other highway caps like Klyde Warren Park and the Rose Kennedy Greenway.
The Park at Penn’s Landing will reconnect Philadelphia to the Delaware Riverfront by capping I -95.
The Pennsylvania Department of Transportation is funding the cost of the cap infrastructure, whereas a combination of City and philanthropic funds will pay for the park amenities.

In 2022, the City of Philadelphia transferred city-owned land to the Delaware River Waterfront Corporation (DRWC), a nonprofit that manages the publicly owned land on the Delaware Riverfront on behalf of the City and State. It is managing the construction and will manage operations and maintenance of the future park. The DRWC funds its operations through a combination of government grants, philanthropic contributions, and earned revenue.
The Stitch will connect Downtown Atlanta across Interstates I-75 and I-85. While the bulk of Phase 1 was funded federally, this required local matching funds from a variety of sources. Moreover, a new special assessment district will provide regular funding for operations and maintenance.
Total: $200M
City Bonds, $10M
City (Value Capture), $20M
City (Value Capture)
• Eastside Tax Allocation District: $10M
• Atlanta Downtown Improvement District: $10M
Federal, $170M
Federal
• Neighborhood Access and Equity Grant: $158M
• Other Federal: $12M

Georgia’s SSDs are like Texas’ Public Improvement Districts – special assessments from area property owners pay for extra services and improvements. In April 2025, Atlanta City Council approved an SSD for the Stitch. It is expected to raise $3.5M annually for specialized cap park operations and maintenance as well as community benefits like an anti-displacement fund.
Precedent and ongoing public space cap projects offer a few takeaways for funding
Austin’s Our Future 35 Cap and Stitch program.
1 Highway cap projects usually require a mix of public and private funding.
2
3
Value capture tools like Public Improvement Districts and Tax Increment Reinvestment Zones have been used to finance highway cap park projects.
4
Nearby landowners and businesses are often willing to support cap projects (through donations or special assessments) because they realize the economic benefits of cap parks.
Public funding for highway cap projects often comes first before private funding, often supporting cap infrastructure and creating the certainty necessary for philanthropies and other private donors to then support park amenities.


How might these impacts translate to the opportunity before Austin?
Investing in Our Future 35 Cap and Stitch will strengthen the contributions Downtown Austin already makes to the city’s overall success.


of citywide assessed value (but only 0.5% of citywide land area) 10% employees (17% of employment citywide) 132K hotel rooms (27% of citywide total) 15K annual visitors 9M annual transit ridership 2.8M office space (19% of citywide total)
Acquiring an equivalent amount of property in Downtown Austin would cost about the same as creating new real estate via the caps. Further, building on downtown land comes at the opportunity cost of future development with higher assessed value and property taxes.
$1,297 Property Value Per Land SF1 +$26 PSF Annual Foregone Property Tax2
PSF Structures
$15 PSF Annual Structures O&M
1 Averages of land and improvement value from Travis County Tax Assessor Data, 2023.
2 $1.981814 (per $100 Assessed Value) total property tax rate for Downtown Austin for FY2024-25.
3 Assuming 4% discount rate and no inflation in annual costs. The discount rate is based on the coupon rate for Austin Texas Public Improvement
A municipal bonds maturing on 2028-09-01.
HR&A assessed the potential development opportunity in the vicinity of the Downtown cap and stitch segments.
What this analysis does:
• Demonstrates the magnitude of potential development value downtown that the caps could help unlock
• Propose a parcel-by-parcel analysis of development capacity
• Considers recent development patterns downtown and recognizes existing development constraints
• Explore opportunity cost tradeoff between building caps vs. acquiring other land downtown
• Isolate net new fiscal impacts attributable to the caps from other Downtown catalysts
• Conduct a comprehensive 'value capture' analysis
Areas surrounding the caps are currently underdeveloped, including areas of downtown next to I-35. Therefore, the caps have the potential to unlock development and densify these areas which may not undergo development otherwise under market forces. Average Prevailing Densities in FAR
All Parcels within ¼ mile of I-35 Caps in Downtown

Source: Travis County Tax Assessors Data, 2023
OPPORTUNITY FOR AUSTIN
Areas surrounding the caps are currently underdeveloped, including areas of downtown next to I-35. Therefore, the caps have the potential to unlock development and densify these areas which may not undergo development otherwise under market forces.
Development is Visibly Less Dense Approaching I-35

Source: Travis County Tax Assessors Data, 2023
Austin can expect development on soft sites to happen more quickly, with greater density, and higher values because of the caps.
of Undeveloped/Underdeveloped Land within ¼ mile of I-35 Caps in Downtown
Value Potential on Undeveloped/Underdeveloped Land w/in ¼ mile of I-35 Caps, Downtown Only
Category Conservative Moderate Optimistic Potential FAR
The scenarios assume that all identified soft-site are developed to achieve an average FAR mentioned under “Potential FAR” based on the existing gross (conservative), 2010-onwards built (moderate), and 2015-onwards built (optimistic) development, with their corresponding average assessed values.
If signature open spaces on the caps perform similarly to precedents, one-time premiums to the value of already developed sites will generate ongoing tax benefits.
~50
of Privately-owned Developed Land within ¼ mile of I-35 Caps in Downtown
Value Premium on Privately-owned Developed Land w/in ¼ mile of I-35 Caps, Downtown Only
HR&A consulted with the following literature for the Park Premium analysis: Crompton, J and Nicholls, S. “The Impact of Greenways on Property Values: Evidence from Austin, Texas.” among other sources, including additional precedents. Values calculated using Travis County Tax Assessor Data, 2023.
OPPORTUNITY FOR AUSTIN
Which will translate into greater property tax revenue which can be captured to support the project’s capital costs and equity initiatives.
$2.4B - $7.9B Value Created From Developing Soft Sites
$153M - $367M Value Premium on Privately-owned Developed Sites
$0.4776 City of Austin’s Property Tax Rate for FY2024-25 (per $100 Assessed Value)
$12.4M$39.7M Annual Property Tax Revenue in FY2024-25 dollars under a future full buildout of soft sites and value premiums
In addition to the City of Austin, other taxing agencies such as Austin Independent School District (ISD), Austin Community College District (ACC), Travis County, and Travis County Healthcare District will benefit from greater property tax revenue.
$2.4B - $7.9B Value Created From Developing Soft Sites
$153M - $367M Value Premium on Privately-owned Developed Sites
$0.9505 Austin ISD $0.1013 ACC $ 0.3444 Travis County $ 0.1080 Travis County Healthcare District
Property Tax Rate for FY2024-25 (per $100 Assessed Value)
$39.1M$124.9M Annual Property Tax Revenue in FY2024-25 dollars under a future full buildout of soft sites and value premiums
Our Future 35 can also complement and amplify investments like the Waterloo Greenway, Austin Convention Center, and more to attract more visitors to Austin.

10% more investments in parks and recreation lead to 2.3% increase in leisure visits1

10% more investments in parks lead to 1.3% increase in employment in tourism industry1

Clusters of recreational facilities and amenities spur greater visitation and encourage longer stays2
Use
In addition to the impacts on visitation and surrounding real estate, a construction program and public space operation of the magnitude of Our Future 35 will have ripple effects throughout the Austin region.
Our Future 35 will have… DIRECT impacts, or effects from spending immediately associated with the project. These could include wages to construction workers or wages to concession operators.
INDIRECT impacts, including business spending resulting from the direct impacts, such as a construction company purchasing landscaping materials from a local nursery, or food and beverage concessions spending on raw ingredients.
INDUCED impacts, or household spending resulting from direct spending activity such as a construction worker or parks administrator using new wages to shop in their community.
Austin’s caps also offer an opportunity to intentionally plan, design, and implement an inclusive project that supports well-being and growth for all Austin residents.
Development utilizing density bonuses, value capture strategies, or public land can confer additional public benefits, including affordable housing
The project’s large construction program offers opportunities for equitable contracting to build wealth for local small and disadvantaged businesses
Intentionally inclusive programming & design will ensure the diversity of Austinites feel at home and have opportunities for celebration and commerce.
Austin’s caps are place-based investments that will help the city continue to attract and retain businesses and talent.

Cities that invest in open spaces are better able to attract and retain diverse and highly skilled workforces.1
1 in 5 leaders of the fastest-growing companies nationally named quality of life as a key factor in business location.2


85% of Americans identify parks and open space as an important factor in their decision of where to live.3
Our Future 35 can be a centerpiece in a larger program of projects to reconnect Downtown and East Austin and turn this part of the City into a precedent setting example of how public-private redevelopment can transform urban districts in the 21st century.

What could next steps look like for Our Future 35?
• Advance vision for caps in partnership with community and private sector leaders
• Cultivate philanthropic champions
• Development governance model to implement project
• Advance robust financing and phasing strategy for each cap
• Align vision and financing strategy with District Planning (in progress)
