bio port landscape of mobility
Dominik Wagner BSc. Master Thesis LFU Innsbruck Supervisor: Univ.-Prof. Dr. Claudia Pasquero Co-Supervisor: Maria Kuptsova, MA
Dominik Wagner BSc. Master Thesis LFU Innsbruck Supervisor: Univ.-Prof. Dr. Claudia Pasquero Co-Supervisor: Maria Kuptsova, MA
submitted in fulfillment of the requirements for the degree Diplom-Ingenieur to the Leopold-Franzens-University of Innsbruck Faculty of Architecture Supervision Univ.-Prof. Dr. Claudia PASQUERO Co-Supervision Maria KUPTSOVA, MA
Institute of Urban Design - Landscape Architecture ioud / synthetic landscape lab
Innsbruck, January 2021
Due to the economic, political and also cultural and social globalization, the demand for infrastructural networking of the planet is increasing. The volume of people and goods being transported is therefore expanding worldwide. This development is counterproductive to climate change and its consequences.
The aim of this master thesis is to use the tool „design-fiction“ and digital and parametric drawing techniques to develop a diegetic prototype for a green and sustainable airport. Rigid systems in the aviation industry are to be broken up and designed with new technologies.
City airports pose a considerable burden for urban areas. Therefore, the topic of a new airport has been a topical issue in Lisbon for decades and an additive project is to be realized in the next few years. This project critically examines that project and presents an alternative in the border area between utopia and dystopia.
The Bioport should produce and consume all of its energy requirements itself. Renewable energies and biofuels play a major role in this. Technological research projects such as „Omega“ (offshore membrane enclosures for growing algae) by Jonathon Trent, or „sci.robot.2“ (a soft pneumatic robot that navigates through its surroundings through growth) by EW Hawkes, LH Blumenschein, JD Greer , AM Okamura from Stanford university, are taken up.
Conventional flight operations are questioned and an alternative, modular, efficient solution is offered that deals with both passenger and goods traffic.
„...we see how technology situated inside of fiction can play a role in how the general public comes to understand new technologies, in both positive and negative ways.“[1][1] The Limits of Our Imagination: Design Fiction as a Strategy for Engaging with Dystopian Futures Joshua Tanenbaum, Marcel Pufal and Karen Tanenbaum
is a design practice aiming at exploring and criticising possible futures by creating speculative, and often provocative, scenarios narrated through designed artifacts. It is a way to facilitate and foster debates. There are two opposite aims of constructing them: utopia and dystopia. [2]
An utopia can be defined as an ideal community or an imaginary society or place that contains highly desirable or perfect qualities. Qualities that make us feel good and happy. An utopia is therefore often a highly pleasant place, a positive place, a place that makes us feel comfortable. Utopia is also the place of freedom, a place we can fully enjoy, have fun in and relax in.
Utopias have existed since the beginning of humanity. The first writing known is Plato’s book The Republic dating back to 380 B.C., and much later Thomas Moore’s Utopia from 1516 (Sargent, 2010). The questions spurring the construction of utopias are timeless: How to make the wor
A dystopia is, like utopia, an imaginary society or place set in a speculative future, characterized by elements that are opposite to those associated with utopia. Dystopias contain qualities that make us feel uncomfortable or bad; that gives us the feeling “that we shouldn’t be there”. A dystopia is a place in which people live dehumanized or fearful lives, in which everything seems unpleasant or uncanny (as we know it from many science fiction films). Dystopias contain – directly or indirectly – a critique of our society as it is today. [2]
ld better? How can we live differently, with different economics system, social institutions, scientific progress, human evolution, different political governance – and perhaps new values? [3]
In design fiction as world building multiple artefacts come together (left) to define multiple entry points into an artificially created world. Each entry point describes that world at a different scale. The effect is a reciprocal prototyping relationship, where the world is prototyping the artefacts and the artefacts are prototyping the world (right). [4] fig.01

„...The hype curve on the graph shows that technologies tend to go through a staged process. The process starts with a ‘trigger’ (a new technology), builds to a ‘peak of inflated expectation’ (everyone gets very excited), drops quickly to a ‘trough of disillusionment’ (people realise this technology isn’t quite ready), climbs up the ‘slope of enlightenment’ (slowly people realise how the technology can be useful), and arrives at the ‘plateau of productivity’ (everybody knows what it is, how it works, and it becomes part of everyday life)....“ [4]
chasm
visibility peak ofinflated expactations customer need
slope of enlightenment
technology trigger trought of disillusionment
plateau of productivity time
disillusionment of possibility
peak of vision hidden market chance invisible phase visible phase
fig.02
cycle

fig.03 https://www.noddyswritings.com
fig.04 https://www.unep.org/gef/what-we-do/land-degredation fig.05 https://inshorts.com/en/news/152-indian-population-undernourished-report
Because of the human-made environ mental problems, new approaches need to be found.
Population groth, globalization and ur banization lead to environmental pro blems such as land degratation, food shortage, energy crisis and climate ch ange.
By researching new photosynthetic building structures, the production of microalgae was chosen as the source of the possible solution, as it is possible with it to produce rapidly renewable, energy-rich biomass through photo synthesis, which can be used for new transport technologies. Bioport is a design proposal for a trans port typology based on the production of microalgae for a photsyntetic archi tecture.
fig.06 https://chinadialogue.net/en/energy/china-should-set-up-a-carbon-cap-zou-ji-on-the-next-national-energy-targets/ fig.07 https://www.whoi.edu/know-your-ocean/ocean-topics/climate-ocean/ fig.08 https://mayafiles.tase.co.il/


Air traffic has almost tripled in the last two decades. Even events such as 9/11, the financial crisis in 2008 and „Fridays for Future“ could only minimally reduce growth. However, this current pandemic poses to be the ultimate test for many airlines.

Emissions reduction should play a major part in aviation’s post COVID recovery:
According to a study from Kearney about the future of aviation from April 2020, the demand for air travel should reach the pre-crisis level again around 2024. In this phase of economic reconstruction, the aviation industry must pursue new strategies to address current issues such as sustainability and social responsibility. That will be crucial to win back the younger generation. Greenwashing with a marketing spin won‘t be enough. Airlines need to demonstrate their commitment to significantly reduce their carbon footprint and develop credible sustainability strategies and ambitious roadmaps. Innovative products and functions such as the combination of air and rail, CO2-neutral ground operations, more efficient aircraft and more sustainable aviation fuel should be at the center of these strategies.
iberian peninsula, tagus river lisbon estuary enviromental history of the Tagus Estuary air base no. 6 salinas do Samouco airport Montijo
The Iberian Peninsula is located in the southwest corner of the European continent. The peninsula is divided between Spain and Portugal, comprising most of their territory, as well as a small area of France (the French Cerdagne), Andorra and the British overseas territory of Gibraltar.


The Tagus is the longest river in the Iberian Peninsula. It is 1,007 km long, 716 km in Spain, 47 km along the border between Portugal and Spain and 275 km in Portugal, where it empties into the Atlantic Ocean near Lisbon. It drains an area of 80,100 square kilometers (the second largest in the Iberian peninsula after the Douro). The Tagus is highly utilized for most of its course. Several dams and diversions supply drinking water to places of central Spain and Portugal, while dozens of hydroelectric stations create power. Between dams it follows a very constricted course, but after Almourol it enters a wide alluvial valley, prone to flooding. Its mouth is a large estuary near the port city of Lisbon.
Tagus Estuary Natural Reserve is a natural reserve in Portugal. It is one of the 30 areas which are officially under protection in the country. The estuary of the Tagus River is the largest wetland in the country and one of the most important in Europe, a sanctuary for fish, molluscs, crustaceans, and especially to birds that stop-over on their migration between northern Europe and Africa. It is the largest estuary in western Europe, with about 34,000 hectares, and regularly hosts 50,000 wintering waterfowl. [5]
[5] http://www.birdforum.net/opus/Tagus_Estuary fig.11 https://earth.google.com/web/ fig.12 https://www.meteoblue.com/de/wetter/archive/windrose/lissabon_portugal


Enviromental history of the Tagus Estuary e) current situation. Wetlands are now mostely confined to the widened middle section of estuary, and the remnant river branches have bee transformed into regulated irrigation channels. Urbanisation and infrastructure has taken over most of the right bank along Lisbon, Oeiras, and some south bank municipalities . Along the eastern edge of the estuary, the largest expanse of mudflats and marshes is set against farmland, with very limited urban development. The south bank hosts small but important marshes, heavily encroached by urban development. [6]
a) Situation of the narrow estuary ca. 12.000 years before present, following the Last Glacial Maximum; b) ca.4000 y.b.p., after the rate of SRL stabilized, the estuary began to fill, and wetlands became established at sheltered and upstream sections; c) ca. 1000 y.b.p., after at least one millenium of settlement around the estuary and along the basin , increased sediment inflow and prograding delta; d) ca.1800 most of the reclamation of the delta and consolidation of the lezirias was complete, but the river still displayed remnants of its former anastomosing delta;

The estuary was shaped over millennia to what it is today. A wetland that is constantly changing due to fluvial sediment from the Tagus River and the forces of the tides from the Atlantic Ocean. These natural factors of change are influenced on the one hand directly by humans through energy-generating river barriers and the use of water for agriculture, and indirectly through the rising sea level as a result of global warming.

Located on the South Bank of the Tagus River, on the characteristic Montijo peninsula, Air Base No. 6 ( BA6 ) borders on the municipalities of Montijo and Alcochete in the Setúbal district.


Currently, for the performance of its mission, BA6 has fleets to carry out transport, maritime surveillance and search and rescue missions, planes for special air transport and helicopters for transport, search and rescue and Surveillance and Reconnaissance.
Mission: Ensure the readiness of the air units and the logistical-administrative support of units and bodies based therein but dependent on other commands, as well as internal security and immediate defense. [7]
[7] https://militarybases.com/overseas/portugal/ fig.11 https://earth.google.com/web/ fig.14 https://www.clix.expresso.pt/politica/2016-10-04-Comissao-de-Defesa
fig.11 fig.14
3 km N ➤


SALINAS DO SAMOUCO
Foundation of the Salinas do Samouco is consisting of an area of 360 hectares, the Salou de Samouco Complex is a place of food, refuge and nesting for thousands of birds where species such as chilreta, mosquitoes and interrupted collared sandpipers stand out. Currently, the Samouco salt pans are presented as the salt with the greatest wealth and abundance of birds during the high tide period of the entire Tagus. In contrast to its economic weakening, it appears that the ecological richness of the salt pans has been increasingly valued and recognized. Its proximity to the largest and most important wetland in Portugal, the Tagus Estuary, makes the salt marshes a great shelter for many water birds that, during their migrations, find in different tanks, a great place to feed and rest. Already in the nesting season, birds find ideal conditions to breed. [8]

[8] http://www.salinasdosamouco.pt/ fig.11 https://earth.google.com/web/ fig.15 https://viagens.sapo.pt/viajar/viajar-portugal/artigos/22-lugares-que-nao-vai-acreditar-que-ficam-em-portugal
fig.11 fig.15

The Lisbon airport has been operating at Portela-Lisbon since 1942. At the time of its construction Portela was outside Lisbon, in its northeast outskirts. During the following two decades this area was engulfed by the urban expansion of Lisbon, which impeded the expansion of the airport at this location. The relocation of this major infrastructure has been considered by successive national governments since 1969.
In the 1960s, Portugal‘s poulation and economy grew, with an overseas outreach anchored in the African colonies. Based on these conditions, the decision was made to expand the capacity of the existing airport. An initial study identified five alternative sites. All these sites were located on the south bank of
the Tagus River. This region offered the largest, closest and easiest accessible plain areas in the surroundings of Lisbon.
Locations identified included existing military and air force installations, small airports, and four of the five previously identified locations. The reasons for choosing Ota were based on the fact that a military installation was already in place, offering a large, government owned area.
After a complex decision-making process, the Ota site was chosen in 2005 for the Lisbon new international airport. Building the new airport there would require the removal of more than 50,000 cork trees, a protected species and habitat in Portugal. Another argument
in favour of the Ota site was the connection between this airport location and the routing of the high speed train that would necessarily link Lisbon to Porto. After the decision to choose the Ota site was made, a national debate hardened public opinion against this decision. The debate mainly centered on the high costs of locating the airport at Ota, partly due to the hydrological and topographical complexity of the site. There was also concern that Ota would provide no increased capacity benefit. Nevertheless, with the final decision in 2005, the detailed design of the project layout was initiated and a thorough EIA was started. Since the first intention to develop the airport 36 years had elapsed, but the environmental issues were only brought into the picture in the last six years. [9]


Aviation accounts for around 25% of emissions from global transport. Carbon dioxide, nitrogen oxides, water vapor and fine dust are the main air pollution factors. Due to the continuous further development of the technologies, the fuel consumption is continuously reduced, but the demand in the aviation industry is increasing so rapidly that the statistics show little change. (fig.a)
In the automotive industry, the trend is steadily moving towards electric mobility, car sharing and autonomous driving. However, research in aviation is also pointing in this direction. In addition, various new types of drive and locomotion typologies are constantly being researched. Urban air mobility is an important part of this.
Carbon dioxide (CO2) Oxides of nitrogen (NOx)
Water vapor (H2O), and contrails
Particulates (pm2.5, pm10)
The graphic shows the global carbon dioxide emissions from aviation. The aviation emissions includes passenger air travel, freight and military operations. It does not include nonCO2 climate forcings, or a multiplier for warming effects at altitude.
1. air taxis on demand point-to-point operations
2. airport shuttles scheduled short-ran ge operations
3. intercity flights
[10] Baur, Schickram, Homulenko, Martinez, Dyskin „Urban air mobility, The rise of a new mode of transportation“ Roland Berger gmbh, Munich, 2018
air taxis on demand point-to-point operations km 50 25 0
-On demand point-to-point non-stop service from one destination to another
-Optimally used under the following circumstances:
-Short distance between two landing sites -Fluctuating medium/high demand between two landing sites
-high network coverage
-fastest travel times between two points
-Schedule frequency depending of air taxis
-High number of routes to cover all points
-Large amount of landing sites required to create network
-Sufficient air space (no restrictions) required to make use of direct point-topoint network
km 50 25 0 km 200 100 0
-Scheduled operations with fixed flight plans and pre-booked flights schedule adjusted to arrival and departure times of airport
-UAM landing sites strategically located very close to terminal and gates
-Intercity flights to other larger cities close by, which are too close even for regional airlines -Fast UAM connection between cities favorable for commuters and business travelers
-fastest transportation option between airport and city -transfer from plane to UAM on air-side of airport possible (very short transfer times)
-Interference with commercial airline operations problematic -Scheduled operations
-Short travel times let metropolitan areas grow closer -significantly reduced travel times between two cities -the only high-speed travel option without much infrastructure need (compared to establishing high-speed train services) -scheduled operations with predictable demand -long flight times pose challenges to technology (batteries, motors etc.) -alternate landing sites required along the way in case of emergency

This term designates wingless aircraft concepts with more than four fixed propellers. These aircraft cater to between 2 and 4 passengers and can reach maximum speeds of 80 to 100 km/h. One example of this technology is the Volocopter.
These wingless aircraft concepts with four fixed propellers, possibly arranged as four sets of push-pull propulsion groups, can carry between 2 and 6 passengers at speeds of 120 to 150 km/h. Examples of these concepts are eHang 184, CityAirbus and Pop.Up Next.
These concepts center around aircraft with fixed forward-facing propellers for forward movement and upward-facing/ retractable propellers to generate lift during the take-off and landing phases. Between two and four passengers can fly at speeds of 150 to 200 km/h in these vehicles. Uber Air is an example of this approach.
These aircraft have several propellers or ducted fans that can be tilted at different angles for fixed or tilting wings to achieve the different configurations needed for take-off, landing, flying and hovering. These aircraft cater to between 2 and 4 passengers and can reach speeds of 180 to 250 km/h. Airbus‘s Vahana is one example.
Winged vertical takeoff and landing jets are equipped with variabledirection fans. They too can accommodate 2 to 4 passengers and can fly at 200 to 300 km/h. One example that recently completed its maiden flight is Lilium.
Today‘s aviation follows either the „hub and spoke“ principle in which the connection from point A to point B runs via Z, or the „point to point“ system in which A is directly networked with B. No matter which of the two systems, the basic principle is the same. Infact, the same aircraft takes off, cruises and lands itself and pollutes the environment to the maximum, because it is precisely the take-offs and landings that cause the greatest emission of pollutants and noise pollution. All air planes are filled with the same fuel, although fossil fuels are not ideal for all the above-mentioned flight phases.
In this scenario the different flight phases are replaced by different, optimized flight operators. These support a modular system consisting of a type of container system. For example, longhaul flights are handled by an „Ultra Long Range Flight Operator“, which is only built to operate at the optimum cruising altitude and with the ideal fuel. This is operated by feeder shuttles with goods, passengers and fuel. The exchange takes place during the flight.
The previously mentioned systems can now be thought further until a new mobility experience is achieved. In addition to the already existing twodimensional mobility system, the UAM adds the third dimension and thus avoids stagnation, so to speak, and is intended to open up new possibilities.
Suppose there is a modular transport container that is to be understood as a private or public element. This travel box can be picked up and passed on by a wide variety of transport systems. This can lead to the fact that you only have to give the respective input
device the destination, and due to various personal parameters such as economical, time-saving or inexpensive travel, the transport systems interact automatically and choose themselves. The modular transport box does not have to be left at any time.
But to provide a system like that the existing infrasucture has to be adapted with vertical take off and landing zones in an urban area. Therefore, the greater Lisbon map was analyzed.
advanced materials


sustainability
fig.19 Codex, London, 23-25 September 2019, Dr. Mark Bentall, COO, Corporate Technology Office, Airbus fig.20 https://moodley.at/idsheet/siemens-one4all/

electrification autonomy connectivity industry systems artificial intelligence typologies in aviation


fig.19
fig.20
p.0.43
On the height profile map of the greater Lisbon area, strategically important locations, such as existing airports, train and subway terminals, important city and town centers, and tourist destinations were marked, which are to be provided with socalled urban pocketports. Since these points are mostly centrally located and should be left as quickly as possible by the VTLO due to the noise nuisance, each of these points is assigned a flight circle corridor that adapts to the local conditions. As a result, flight corridors appear, which represent a 3D highway for uraban air mobility.

SantoEstevão

airbase1
belem airportcascais cascais
mafra ericeira caisdesodre cacilhas
amoreira santaapolonia aeropuortooriente
agriculture bioport barreiro
alcochetesalinasdo samoucco
pegões 10km
caparica


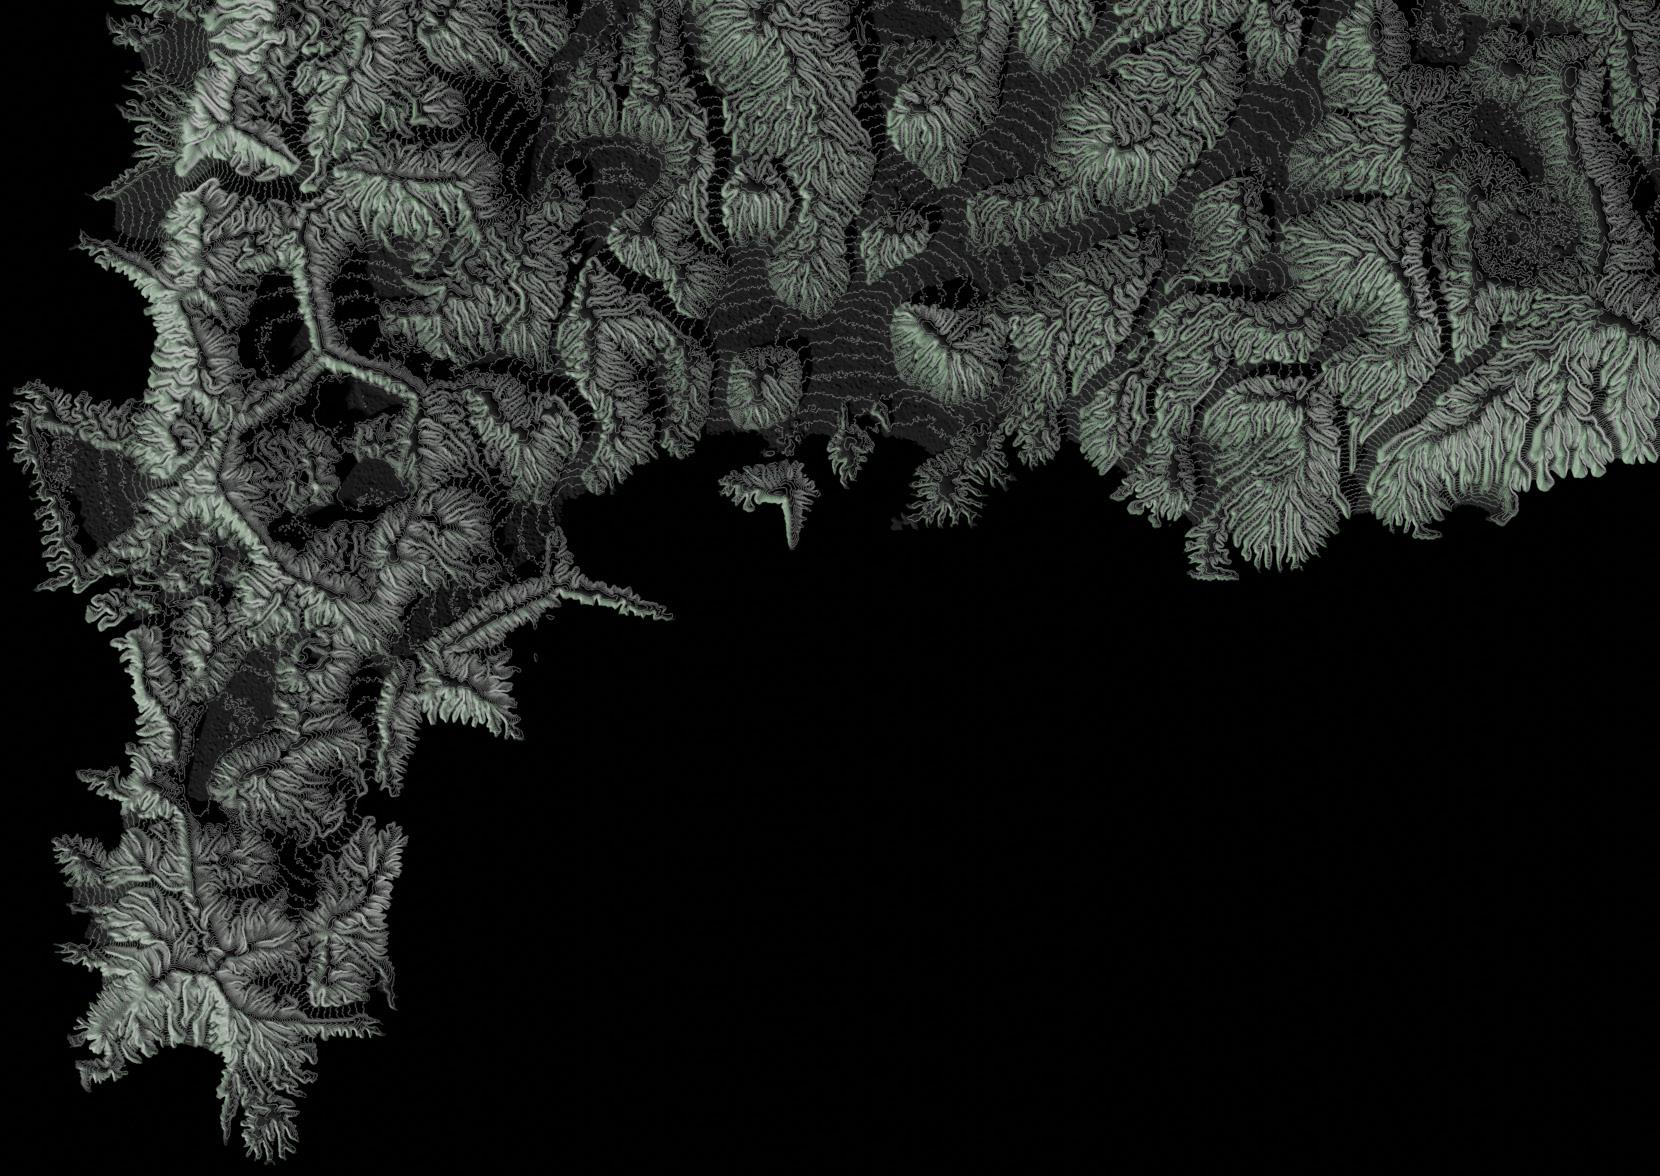
The first intention was to use the adjacent salinas as a starting point for a land transformation. From a bird‘s-eye view, the man-made water basins have a cell-like appearance. On the basis of this, the building site was divided into an imaginary grid of cells. The idea is that these new „salinas“ or future bioreactor cells will produce energy in the form of biofuels from biomass production. The appearance of the new structure should pick up the topic of salt.


robotic transformation fig.21
The goal, at this point in time, was a land transformation with small-scale, but large numbers of construction robots that interact with one another and pursue a common it in detail. A “printed landscape”, at least digitally, was the aim of these pictures.

The building site is to be transformed into a biological biomass production facility. Therefore, the maximum playable area was added, which in this case includes land, water and wetlands. The size of it is about 25 square kilometers, which will be zoned and worked out in more detail later on.
With the help of a 3D graphics software called Houdini, the following 3D landscapes were digitally generated with the design idea of salt in mind. Houdini‘s main focus is on procedural synthesis, which sets Houdini apart from other 3D graphics software.


As a result, series of catalogs were produced, with the end product that was further worked on. Shown above are pictures 1-4 from row #6. Each step has experienced adapted erosion repetitions. The following images are produced with the object with #6.4. The 3D processing program “Blender” was used for that developement.


On the last pages, the design research process 03.1 from the pre-diploma was presented without comment. At the end of this series of images, a synthetically generated landscape is merged with building elements. These are neither true nature nor true manmade structures. Subsequently, as shown on the following pages, further design processes are evaluated which should bring more and more details to light. Although these processes were adapted to the terrain deformation of the construction site, the scale with regard to a feasible solution is missing. Many of the findings from these studies will be incorporated into the final draft and made applicable at a later stage.
The course of the following design process:
1.) eroding terrain with modifyers in the form of added noises
2.) controlled mesh face reduction and variations 3.) adding paramtric script called randoMesh with: - one layer - two layers 4.) adding parametric script called by tools: -simplified landscape surface organic shell -triangulated grid -metaballs
1 2 3
noise1: manhattan worley noise2: worley noise3: chebyshev worley


hard surface modifiers: triangulate mesh dual mesh wireframe glass surface modifiers: reduce mesh triangulate mesh dual mesh creased wireframe
hard surface modifiers: triangulate mesh randoMesh wireframe glass surface modifiers: reduce mesh triangulate mesh dual mesh creased wireframe
hard surface modifiers: triangulate mesh dual mesh randoMesh wireframe glass surface modifiers: reduce mesh triangulate mesh dual mesh creased wireframe


In these representations, the later approach to the building structure emerges.
1.) A surface mesh with square sides is triangulated in the first step and then broken down into its dual mesh. A string of these pages results in a honeycomb appearance.

2. The same surface network is again and triangulated and broken open with the help of a script with various parameters and apparently rebuilt at random
3.) the third picture on the right shows a combination of the procedures shown above. For this purpose, a dual mesh is generated from the arbitrarily composed surface network and made visible through a grid of varying thickness. The different strengths are created by weight values and shown on the next page.


from the previously shown weight editing values from the Curvature value, only the flat to concave values are retained. and the convex values are eliminated. The resulting mesh now has openings upwards

and no longer has a coherent structure. By inserting a second level (easily visible as a square grid, the „salt structure“ should be maintained.

four-sided supporting substructure is replaced by a continuous three-way curved glass surface. Due to the still very restless design language of the „terrain“, implementation is difficult or even impossible.

design

digital synthetic landscape CycleGAN: rural development urban development bioport: the roof as a photobioreactor the static structure the biomass refinery
existing runfield
function airport present existing technolo gie & Infra structure
future
harbour rail connection
energy production biomass production electricity urban air mobility vertiports
In order to generate digital terrain information from the construction site, a height profile map was used as the starting point. Based on these 2d data, a three-dimensional existing site was generated, and further processed in two different strategies. The terrain of the construction site is relatively flat. Therefore, the terrain was multiplied by a factor of 20 in the z-axis in order to get more details.


future eroded terrain future eroded terrain incl. sealevelrise


synthetic modifiers future eroded modified terrain future eroded modified terrain incl. sealevelrise

hightmap file monijo strategy No.1 strategy No.2 +6.25 [m] +6.25 [m]


-creating a future eroded terrain-
In the future, the terrain will continue to change due to influences such as wind, precipitation, solar radiation, tides and river sediment. A future eroded area can be simulated by digital erosion processes.
This eroded terrain is associated with rising sea levels in several stages. From this it can be seen that large parts of the peninsula will be under water in the future, or that the surface of the wetlands will move more and more inland.
The resulting surface is the base layer for further displays.
-creating a future eroded synthetic terrain-
As with Strategy No.1, a three-dimensional terrain model is created. Then it will be added in the vertical with modification in several steps at the places that will be flooded in the future. This creates a digital artificial landscape that creates a new, second surface.
This surface represents a fusion between the future primeval terrain and a digitally generated artificial landscape. Later, on the one hand, it will represent the roof area of the airport building and, on the other hand, it will also provide topology information about the original site.
3d terrain from hightmap file: -for better visibibility scale in z axis with factor 20 -resolution scale mesh: 1 -scale: grid is 1x1 [km]


#5 erosion: adding hydro erosion -erodability 0.3 -erosion rate: 0.8 -bank angle 45 -spread iterations: 115

3d terrain from hightmap file: -for better visibibility scale in z axis with factor 20 -resolution scale mesh: 1 -scale: grid is 1x1 [km]


adding transforming factors: rain -noise type: alligator -amplitude: 0.5 [factor] -base size: 0.5 [factor] -transformation scale:1 -resolution scale mesh: 1 -scale: grid is 1x1 [km]
adding transforming factors: other influences -noise type: alligator -amplitude: 0.5 [factor] -base size: 0.5 [factor] -transformation scale:1 -resolution scale mesh: 1 -scale: grid is 1x1 [km]
#1 erosion: adding hydro erosion -erodability 0.5 -erosion rate: 0.4 -bank angle 65 -spread iterations: 115
#2 erosion: adding hydro/thermal erosion: -erodability 0.8/0.1 -erosion rate: 0.4 -bank angle 45 -spread iterations: 55
#3 erosion: (resample factor: 4) adding hydro/thermal erosion -erodability 0.6 -erosion rate: 0.6 -bank angle 80 -spread iterations: 153
#4 erosion: adding hydro erosion in two steps: -erodability 0.3, 0.3 -erosion rate: 0.3, 0.3 -bank angle 88, 45 -spread iterations: 25, 15
#5 erosion: adding hydro erosion -erodability 0.3 -erosion rate: 0.8 -bank angle 45 -spread iterations: 115
p.0.86


Strategy No.2: -creating a future eroded terrain

Based on Strategy No.1, taking into account the sea level rise, those land sections of the Montijo Peninsula become visible that will have more and more problems with the water rise in the future.
In this process, Strategy No.2, landscape modifi ers will be placed over these areas to create a new synthetic landscape surface to deal with man-made sea level rise.


result before eroding: -3d terrain from hightmap file: -#1, #2, #3 noise added


#5 erosion: adding hydro erosion -erodability 0.3 -erosion rate: 0.8 -bank angle 45 -spread iterations: 115

3d terrain from hightmap file: -for better visibibility scale in z axis with factor 20 -resolution scale mesh: 1 -scale: grid is 1x1 [km]
#1 noise: main structure: cell structureoriented on sallinas de samoucco -amplitude:120 -element size:100 -noise type: worley cellular F2-F1 -clipp. min: 0.583; clipp. max: 0.137
#2 noise: sub structure: point structure for more variaty -amplitude: 30 -element size: 91 -noise type: alligator -clipp. min: 0.439; clipp. max: 0.582
#3 noise: noise structure: for a better eroding results -amplitude: 14 -element size: 1 -noise type: alligator -clipp. min: 1; clipp. max: 0
result before eroding: -3d terrain from hightmap file: -#1, #2, #3 noise added


#1 erosion: adding hydro erosion -erodability 0.5 -erosion rate: 0.4 -bank angle 65 -spread iterations: 115
#2 erosion: adding hydro/thermal erosion: -erodability 0.8/0.1 -erosion rate: 0.4 -bank angle 45 -spread iterations: 55
#3 erosion: (resample factor: 4) adding hydro/thermal erosion -erodability 0.6 -erosion rate: 0.6 -bank angle 80 -spread iterations: 153
#4 erosion: adding hydro erosion in two steps: -erodability 0.3, 0.3 -erosion rate: 0.3, 0.3 -bank angle 88, 45 -spread iterations: 25, 15
#5 erosion: adding hydro erosion -erodability 0.3 -erosion rate: 0.8 -bank angle 45 -spread iterations: 115
p.0.92
level rise: +2.5 [m] year: 2100 (extreme scenario)
No.2: -creating a future eroded synthetic terrainwith sea level rise taken into account


level rise: +3.75 [m] year: app. 2120 (extreme scenario)
level rise: +5.0 [m] year: 2150 (extreme scenario)
level rise: +6.25 [m] year: 2200 (extreme scenario)
compairing eroded terrain with modified eroded synthetic terrain with current sea-level
+0.00 [m]
eroded original terrain (z factor 20 ) sea level rise: +-0.00


manipulatet reclaimed terrain sea level rise: +-0.00
p.0.94
compairing eroded terrain with modified eroded terrain with sea level rise taken into account
+6.25 [m]
eroded original terrain (z factor 20 ) sea level rise: +6.25 [m] year: 2200 (extreme scenario) heightlines: 5m


manipulatet reclaimed terrain sea level rise: +6.25 [m] year: 2200 (extreme scenario) heightlines: 5m

curvature value faces area local coordinates in z-direction


In order to get a better understanding of the topology of the generated landscape, the contour lines were made visible.
The interesting eroded terrain structure, which was not changed by additional modifiers, is striking.

With the help of the previously shown value analysis, a new possible spatial
planning master plan can be read off, which corresponds to future weathering phenomena of the Montijo peninsula.
This ensures natural water circulation in canals. The areas of this physically traceable water circulation can be made visible in a new urban structure through the infrastructural connection such as streets or public space.
(see pictures on the right)
The marked area is examined in more detail below.


Like the contour lines, the flowlines make the terrain visible and usually run at right angles to them. They make the aesthetic transition to the Targus River understandable and connect land with water.
They are also showing, as the name suggests, the natural water flow route, which logically follows the force of gravity.

In the next step, two possible scenarios are played through to illustrate the digitally generated landscape and to get an impression of the transformation. A picture translator called Cycle-GAN is used for this.
For version 1, a satellite image is chosen that has roughly the same scale as the synthetic landscape and has a rural character. On the picture you can see the center of Monijo, parts of the current military airport, the river and the Salinas
For version 2, an aerial photo of the historic center of Lisbon is chosen in order to achieve a stately character. Here, too, is the same yardstick.
version 1: rural area satellite image monijo

version 2: urban area satellite image lisbon


bioport land water air
bioport
-part of the synthetic landscape surface -interface between land, water and air


The Bioport as a building:
The Biport is to act as an interface between land, water and air. Infrastructures and mobilities are brought together.
On the west side, the building borders the Tagus River and is therefore open to shipping.
On the east side, the building is delimited by the existing military runway and new parking lots and Taxiway for the aircraft. In the area of the former east-west runway, the connection to the rail network such as the train and subway system will be ensured
The topography of the roof makes the cell structure of the roof visible in the form of landing zones, which are intended for vertical take off and landing (vtlo‘s). These landing zones are connected to each other in order to achieve the most effective connection time possible when transporting goods or people.
The transport center, the Bioport, blends in with the urban environment and, due to its size, can be described as a district that becomes a building. Due to the aesthetics, which suggest a synthesis of terrain and building, it can also be called landscape architecture.

The roof:
The roof takes over part of the energy production in the form of biomass production and photovoltaics.
By using Curvature Modifyers, the roof shape is divided into concave and convex zones, which can be read through valleys and ridges.
The valley zones form the main structure of the roof, which is supported by supports that follow the same principle. It is a modular steel construc tion which can also take the loads of a green roof. The back zones form translucent zones that flood the interior of the air port building with light. These zones are also supplemented with trans lucent photovoltaic modules at optimized points.
A pipe system runs over the entire roof structure, some of which can move flexibly over the surfaces and thus adapt to the external conditions. As a result, the building becomes a kind of dynamic photosynthetic orga nism with the help of artificial intelligence.

The roof takes over part of the energy production in the form of biomass production and photovoltaics.
By using Curvature Modifyers, the roof shape is divided into concave and convex zones, which can be read through valleys and ridges.
The valley zones form the main structure of the roof, which is supported by supports that follow the same principle. It is a modular steel construction which can also take the loads of a green roof.
The back zones form translucent zones that flood the interior of the airport building with light. These zones are also supplemented with translucent photovoltaic modules at optimized points.
A pipe system runs over the entire roof structure, some of which can move flexibly over the surfaces and thus adapt to the external conditions.
As a result, the building becomes a kind of dynamic photosynthetic organism with the help of artificial intelligence.


The static structure:
A self-contained pipe system is to be led over the static support struc ture onto the roof structure.
The individual Photo-Bioreactor hose systems run in this pipe system and follow the shape of flowlines on the outside of the roof.
Depending on the positioning, external influences and length of the hoses, these should merge into the Targus River if necessary and spread out there in the form of floating, closed menebranches.
The bioport will be provided with a bio-oil refinery on the ground floor, which will make the process of fuel production visible to the airport user and explain the individual process steps. Thus a relationship with the lo comotion energy source is established by the traveler.
There, bio-fuel is produced from the microalgae through physical and chemical processes.
fig.22 fig.23 fig.24


The energy production for the bio port
As already mentioned at the beginning, the bio port should generate large parts of the energy it needs itself. Green electricity is generated from renewable energies. The main focus is on a lesser-known biological energy source that will play an important role in the future as an alternative to fossil fuels. Microalgae.
fig.22 https://www.amchamchile.cl/2014/12/el-petroleo-cuando-la-tendencia-es-tu-amiga/ fig.23 https://www.renewableenergyworld.com/blogs/ fig.24 https://algaebiomass.org/blog/9507/adm-launch-algae-derived-dha-for-use-in-aqua-feed/
Microalgae are small aquatic organisms that can convert sunlight into energy. Some of these algae store energy in form of natural oils. Under the right conditions, algae can make a lot of oil that can be converted into biofuels.

macroalgaes multicellular 1mm-60m brownalgaes Laminaria Palmaria ...
microalgaes
fig.25 https://mayafiles.tase.co.il/ fig.26 https://sarifoods.co/blogs/news/161696711-why-its-important-to-know-the-source-of-your-spirulina fig.27 https://algaebiomass.org/blog/9507/adm-launch-algae-derived-dha-for-use-in-aqua-feed/
unicellularmulticellular

Chlorella Spirulina
fig.25 fig.26 fig.27


fig.30
challenges for biofuels: improve the compatibility for engines - no competition for food production strong price increases for food triggered through increased production of first generation biofuels
The conflict of use could arise from biofuels of the new generation that are not made from plant fruits but from Plant residues or fast growing grasses or woods can be obtained. However, their manufacture is still very expensive.
In order to prevent the destruction of virgin forests for the production of biofuels, comprehensive certification of imported biomass and fuels must be carried out. Here the so-called domino effect, such as in Brazil, to be avoided: The plantations of the Energy crops (sugar cane) sustainable because they were created on former pastures for cattle rearing. Around Gaining new pastures, however, was in return Rainforest destroyed.
The cultivation of microalgaes
Basically, algae are divided into macro and microalgae. Both types can be used to make algae fuel. Algae can be cultivated in open ponds called raceways , however control of the conditions is very limited in order to achieve the ideal growth potential. Therefore, the cultivation will take place in closed, transparent, surfacemaximized algae reactors, which make the conditions in terms of nutrient, CO2 and O2 concentration, temperature, mixing, etc. more controllable.
In OMEGA, oil-producing freshwater algae are grown inflexible, clear plstic photobioreactors (PBRs) attachedto
a floating infrastructure anchored offshore in aprotected bay. Wastewater and CO2 from coastalfacilities provide water and nutrients. The surroundingseawater controls the temperature inside the PBRs andkills algae that escape from the system. The salt gradientbetween seawater and wastewater drives forwardosmosis, to concentrate nutrients and facilitate algaeharvesting. The OMEGA infrastructure also supportsaquaculture below the surface and provides surfaces forsolar panels and access to offshore wave generators and wind turbines. Integrating algae cultivation withwastewater treatment,
CO2 sequestration, aquaculture,and other forms of alternative energy creates an ecologyof technologies in which the wastes from one part of thesystem are resources for another. In addition, the parts economically support the integrated whole. By treatingwastewater, sequestering CO2, and providing a marinehabitat, the system is environmentally friendly. By usingwastewater for water and fertilizer and operating offshore, OMEGA does not impact agriculture. [11]
[11] Jonathan Trent, „Offshore membrane enclosures for growing algae (OMEGA), NASA Ames Research Center, 2012 fig.32 - 34 https://www.iwilife.com/ fig.33 https://www.derstandard.at/


A flexible, translucent hose system turned out to be a possible solution in order to find a suitable strategy for growing algae with reference to the artificial topological conditions of the Bioport construction project. This soft robot hose can operate on land as well as on water without additional construction.
This system, by inverting its own material, can achieve a substantial,
controllable change in length from the tip by recreating its structure along its growth path. This leads to the ability to move through a restricted environment without sliding friction. As the tip moves, the body forms into a structure in the shape of the tip‘s path. In addition to its function as a bioreactor, this system also has the ability to convey data, energy or material through the soft inner film, so this soft robot can be equipped with sensors at the tip, but
also
setup: tubefoil 50 my roll width: 80mm material: LDPE transparent watercontainer 3d printed PLA white airtube:4x1mm green first eperiment: -one layer -no air pressure -steering by gravity and obstacle -on hard surface

fig.35 fig.36 fig.37


This system principle also occurs in numerous forms in natural biological systems that grow to navigate their enviroments. Neurons grow through constrained tissue to create structures that act as signal pathways. Pollen tubes lengthen through pistil tissue to build conduits to deliver sperm to the ovary. Sclerenchyma cells grow within the xylem and phloem to create supporting structures.
fig.35 Hawkes, Blumenschein, Greer, Okamura, „A soft robot that navigates its environment through growth“, Science Robotics, New York, 2020 fig.36 https://pmgbiology.com/2015/02/14/sexual-reproduction-in-plants-2-a-understanding-for-igcse/ fig.37 https://bio.libretexts.org/Bookshelves/Botany/Book/
To gain a better understanding of the growth of algae in closed systems, a Chlorella culture was grown over a period of 120 days. For this purpose, three glass containers were supplied with a nutrient combination independently of each other. Nutrients were supplied at 30-day intervals. Room air was mechanically supplied several times a day and the room climate was kept constant at 20°C. Direct sunlight was not applied.

The algae solution was subsequently implemented in the „Soft-Robot-Pipe“ prototype.

The rolled up plastic film tube is extended by adding water and / or air pressure to a continuously variable linear system, which at the same time functions as a photo-bio-reactor. In the first experiments, the expansion process of the hose system was tested with the help of gravity. Therefore one liter of water is expanding the body of the hose for one meter in one minute. A deflector placed at an angle of 45° is used to guide the body away. Based on these findings, it is possible to steer the robot to follow the water course using gravity alone and a guiding surface, such as the topology of the roof area.
setup: Mikroalgae: Chlorella watercontainer glass transparenent 1l airtube: 6x1,5mm green connection parts: 3d printed


0:05 [min] 0,08 [l] 0,1 [cm] 0:35 [min] 0,58 [l] 11 [cm]
0:10 [min] 0,16 [l] 0,5 [cm] 0:40 [min] 0,66 [l] 12,5 [cm]
1 min - 1liter -1m


0:15 [min] 0,25 [l] 0,8 [cm] 0:45 [min] 0,75 [l] 18,5 [cm]
0:20 [min] 0,33[l] 1,4 [cm]
p.0.135
0:50 [min] 0,83 [l] 36 [cm]


0:25 [min] 0,41 [l] 2,5 [cm] 0:55 [min] 0,91 [l] 45 [cm]

0:30 [min] 0,5 [l] 5,5 [cm]
1:00 [min] 1 [l] 50 [cm]
04.1 energy production


The heart of the Bioport is the oil reefing facility in the core of the airport building. There the oil (lipid) is extracted from the algae. This is happening by breaking down the cell structure of the algae. This can be done by using solvents or sonification. After the oil is extracted, it is further physical and chemical processed to naphta, that is raw gasoline. And can be used for many types of aircrafts.


The bio-oil refinery on the ground floor will make the process of fuel production visible to the airport user and explain the individual process steps. This a relationship with the locomotion energy source is established by the traveler..


As mentioned, the photosynthetic tubes operate not only on the roof structure, but also on the water surface. The illustration on the right shows a possible snapshot of the constantly changing appearance of the tube systems. The coiled tubing structure extends as far as desired into the Targus River, making use of the otherwise unused wetlands. The water temperature of the estuary also regulates the temperature in the hoses. Their controllability allows the flexieble robots to maneuver into water zones that are ideal for the growth process.
The arbitrary spreading study of the tubes floating in the water on the left shows how the fibers spread on a straight surface. Based on this, the fibers should follow a predetermined path.

OMEGA growing grid 17x random seed max time max ivy length ivy size max float length max adhesion length primary weight random weight gravity weight adhesion weight branching probability ivy branch size

0 0 250m 2 250m 250m 0,5 0,2 1 0,15 0,05 0,05

This path is defined by the OMEGA growing grid (Image1). This grid is computer generated and is digitally generated by the data from the sensors of the hoses. This grid is a flexible system that can change in a continuous way. Image 2 shows how the hoses move along this grid, showing a kind of digital swarming behavior.

Bioport is a new definition of landscape that integrates and redescribe the fun ctions of infrastructure within its logics.
Machine learning procesesses and di gital simulations are creating a new lan guage of architecture.

The project breaks down long-established rigid aviation systems by making visible a new layer of mobility in form of new technologies.
A new social shift of principle, away from nowadays extreme mass consumption, served-up, by low-cost airlines.
Towards a new sustainable, ecological and regional layer of air travel. With the powerful help of artificial and biological intelligence in a digital age.


The Limits of Our Imagination: Design Fiction as a Strategy for Engaging with Dystopian Futures Joshua Tanenbaum, Marcel Pufal and Karen Tanenbaum
Dunne, Raby, „Speculative Everything: Design, Fiction and Social Dreaming“, MIT Press, 2013 Eva Knutz, Thomas Markussen, Poul Rind Christensen, „The Role of Fiction in Experiments within Design, Art & Architecture - Towards a New Typology of Design Fiction“, Artifact, Volume III, issue 2, pages 8.1-8.13, 2014
Paul Coulton, Joseph Lindley, Rachel Cooper, „The Little Book of Design Fiction for the Internet of Things“, Lancaster University, Lancaster, 2018 http://www.birdforum.net/opus/Tagus_Estuary
https://www.researchgate.net/figure/Environmental-history-of-the-Tagus-Estuary-a-situation-ofthe-narrow-estuary https://militarybases.com/overseas/portugal/ http://www.salinasdosamouco.pt/ Maria R. Partidàrio, Miguel Coutinho, „The Lisbon new international airport: The story of a decision-making process and the role of Strategic Environmental Assessment“, Lisbon, Elsevier, 2010 Baur, Schickram, Homulenko, Martinez, Dyskin „Urban air mobility, The rise of a new mode of transportation“ Roland Berger gmbh, Munich, 2018
Jonathan Trent, „Offshore membrane enclosures for growing algae (OMEGA), NASA Ames Research Center, 2012
fig.01 fig.02 fig.03 fig.04 fig.05 fig.06 fig.07 fig.08 fig.09 fig.10 fig.11 fig.12 fig.13 fig.14 fig.15 fig.16 fig.17 fig.18 fig.19 fig.20
Paul Coulton, Joseph Lindley, Rachel Cooper, „The Little Book of Design Fiction for the Internet of Things“, Lancaster University, Lancaster, 2018 https://esser.me/there-is-more-than-just-the-hype-cycle/ https://www.noddyswritings.com https://www.unep.org/gef/what-we-do/land-degredation https://inshorts.com/en/news/152-indian-population-undernourished-report https://chinadialogue.net/en/energy/china-should-set-up-a-carbon-cap-zou-ji-on-the-nextnational-energy-targets/ https://www.whoi.edu/know-your-ocean/ocean-topics/climate-ocean/ https://mayafiles.tase.co.il/ https://www.cnbc.com/video/2020/05/01/how-airlines-park-thousands-of-grounded-planesamid-coronavirus.htm https://www.kearney.com/ https://earth.google.com/web/ https://www.meteoblue.com/de/wetter/archive/windrose/lissabon_portugal https://www.researchgate.net/figure/Environmental-history-of-the-Tagus-Estuary-a-situation-ofthe-narrow-estuary https://www.clix.expresso.pt/politica/2016-10-04-Comissao-de-Defesa https://viagens.sapo.pt/viajar/viajar-portugal/artigos/22-lugares-que-nao-vai-acreditar-queficam-em-portugal https://www.researchgate.net/figure/Annual-energy-consumption-by-energy-source-GlobalCarbon Sausen, Schauman„The contribuition of global aviation to anthropogenic climate forcing for 2000 to 2018“, Lee et al., 2020 Baur, Schickram, Homulenko, Martinez, Dyskin „Urban air mobility, The rise of a new mode of transportation“ Roland Berger gmbh, Munich, 2018 Codex, London, 23-25 September 2019, Dr. Mark Bentall, COO, Corporate Technology Office, Airbus
https://moodley.at/idsheet/siemens-one4all/
fig.21 fig.22 fig.23 fig.24 fig.25 fig.26 fig.27 fig.28 fig.29 fig.30 fig.31 fig.32 fig.33 fig.34 fig.35 fig.36 fig.37
https://coolhunting.com/culture/detritus-by-jonathan-schipper/ https://www.amchamchile.cl/2014/12/el-petroleo-cuando-la-tendencia-es-tu-amiga/ https://www.renewableenergyworld.com/blogs/ https://algaebiomass.org/blog/9507/adm-launch-algae-derived-dha-for-use-in-aqua-feed/ https://mayafiles.tase.co.il/ https://sarifoods.co/blogs/news/161696711-why-its-important-to-know-the-source-of-yourspirulina
https://algaebiomass.org/blog/9507/adm-launch-algae-derived-dha-for-use-in-aqua-feed/ https://eurosportello.eu https://www.meteoblue.com/de/wetter/archive/windrose/lissabon_portugal
Jonathan Trent, „Offshore membrane enclosures for growing algae (OMEGA), NASA Ames Research Center, 2012 https://www.americanscientist.org/article/making-biofuel-from-microalgae/ https://www.iwilife.com/ https://www.derstandard.at/ https://www.iwilife.com/ Hawkes, Blumenschein, Greer, Okamura, „A soft robot that navigates its environment through growth“, Science Robotics, New York, 2020 https://pmgbiology.com/2015/02/14/sexual-reproduction-in-plants-2-a-understanding-for-igc https://bio.libretexts.org/Bookshelves/Botany/Book/
Ich erkläre hiermit an Eides statt durch meine eigenhändige Unterschrift, dass ich die vorliegende Arbeit selbständig verfasst und keine anderen als die angegebenen Quellen und Hilfsmittel verwendet habe.
Alle Stellen, die wörtlich oder inhaltlich den angegebenen Quellen entnommen wurden, sind als solche kenntlich gemacht.
Die vorliegende Arbeit wurde bisher in gleicher oder ähnlicher Form noch nicht als Magister- /Master-/ Diplomarbeit/Dissertation eingereicht.
Innsbruck, Jänner 2021
Many thanks to my family and friends who have always stood by me.
To my parents, who have always supported me on my life‘s journey.
Flaminia, for your great help and patience. Claudia and Maria for the inspirations, the many good inputs and constructive conversations.
