
RATIONAL REFLECTIONS
By Bell InstitutionalIncreasing Returns to Scale and the Big Five
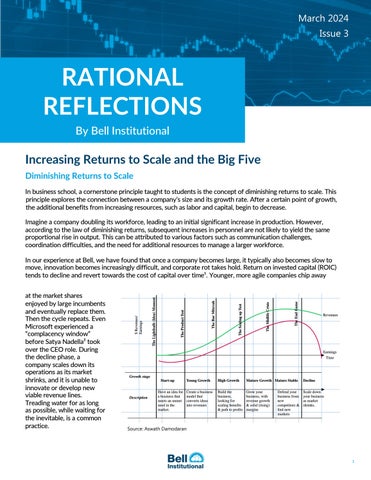
Diminishing Returns to Scale
In business school, a cornerstone principle taught to students is the concept of diminishing returns to scale. This principle explores the connection between a company’s size and its growth rate. After a certain point of growth, the additional benefits from increasing resources, such as labor and capital, begin to decrease.
Imagine a company doubling its workforce, leading to an initial significant increase in production. However, according to the law of diminishing returns, subsequent increases in personnel are not likely to yield the same proportional rise in output. This can be attributed to various factors such as communication challenges, coordination difficulties, and the need for additional resources to manage a larger workforce.
In our experience at Bell, we have found that once a company becomes large, it typically also becomes slow to move, innovation becomes increasingly difficult, and corporate rot takes hold. Return on invested capital (ROIC) tends to decline and revert towards the cost of capital over time¹. Younger, more agile companies chip away
at the market shares enjoyed by large incumbents and eventually replace them. Then the cycle repeats. Even Microsoft experienced a “complacency window” before Satya Nadella² took over the CEO role. During the decline phase, a company scales down its operations as its market shrinks, and it is unable to innovate or develop new viable revenue lines.
Treading water for as long as possible, while waiting for the inevitable, is a common practice.
 Source: Aswath Damodaran

March 2024 Issue 3
1
While the concept of diminishing returns is grounded in reality and applicable to the majority of companies, the information age³ has presented a unique challenge. It now appears that a new phenomenon is taking place: increasing returns to scale.
A key ingredient allowing this phenomenon to materialize is the shift from supply-side economics (tangible goods) to demand-side economics (intangible goods). This shift has contributed to the proliferation of network effects and aggregation effects. Network effects describe a scenario where a product or service becomes more valuable as more people use it. Aggregation effects, on the other hand, occur when companies gather vast amounts of data or user information, allowing them to personalize their offerings and gain a competitive advantage.
These concepts have enabled select companies to defy the traditional limitations of size and achieve outsized growth. This article focuses on the Big Five (Amazon, Meta, Alphabet, Apple, and Microsoft) and explores their unique positions in the current economic landscape.
Increasing Returns to Scale
Increasing returns to scale describes a situation where the marginal investment generates a return on invested capital that is above the rate currently being earned. Companies exhibiting this behavior typically hold a dominant market share and display rising ROICs. ⁴
Prior to the internet era, businesses primarily operated under supply-side economics. This meant that providers of goods competed based on exclusive supplier relationships. Each additional good sold also came with a marginal cost (physical items cost money to produce). Today, however, distributors of digital goods may commoditize suppliers and produce the marginal good for near zero cost. This allows them to focus solely on enhancing the customer experience and producing the best product possible. In this environment, the best products tend to win on a large scale, and winner-take-most scenarios are common.
For example, YouTube (Alphabet property) attracts users and content creators at a minimal cost (paid out via advertising revenue sharing). This creates a self-reinforcing cycle:
• More users attract more content creators;
• More content creators create more content; and
• More content attracts even more users.
YouTube then sells personalized advertising against this environment that is able to target a desired audience more effectively than traditional advertising. Delivering one more ad costs YouTube next to nothing. This model has propelled YouTube to become the largest video-sharing platform in the world⁵ and the second largest social media channel, with roughly 2.5 billion active users. This is the hallmark of the aforementioned demand-side economics. As long as the demand exists and the user experience continues to be the best, increasing returns should continue. Other examples of aggregation and network effects include Apple’s App Store, Meta’s properties, Amazon Marketplace and Prime, Google Search and Microsoft Office. See the next page for a graphical representation of how increasing returns can affect a company over its lifecycle.
2
March 2024 Issue 3
In contrast to the Big Five, most S&P constituents earn ROICs that are either at or barely above the cost of capital. The spread between ROIC and the cost of capital for the S&P 500 as of Dec. 31, 2023, is about 1.6%, whereas the average spread for the Big Five is 28.9%.
Maintaining and Increasing ROIC
Maintaining and increasing ROIC over time is dependent upon a company’s ability to reinvest effectively. The capacity to reinvest capital generated from existing assets into new and equally (more) profitable ventures is a key indicator of future investment returns. While many investors acknowledge the importance of a company’s ability to reinvest, we believe it remains underappreciated. It’s very difficult to beat a business that consistently compounds its reinvestments at a high rate of return.
The increasing returns to scale enjoyed by the Big Five empower them to compete for dominance in new business verticals, the newest being artificial intelligence and LLMs.⁷ If a company wants to train on the equivalent of 600,000 H100s,⁸ like Meta is doing with their LLAMA model, they need to have a business that is generating the massive cash piles needed in order to fund these GPU purchases.
3
37.4% 10.1% 8.5% 0% 10% 20% 30% 40% 50% Dec-14 Dec-15 Dec-16 Dec-17 Dec-18 Dec-19 Dec-20 Dec-21 Dec-22 Dec-23 Average Big Five ROIC Last 10 Years Average Big Five S&P 500 Cost of Capital 5,000 10,000 15,000 20,000 0 5 10 15 20 $ Revenues / Earnings Time Average Company vs Increasing Returns Company Average Co Revenues Average Co Earnings IR Co Revenues IR Co Earnings Cost of capital is derived from the implied discount rate for the S&P 500. ROICs are adjusted for R&D expense.
Source: FactSet
March 2024 Issue 3
For reference, at 600,000 total H100 equivalents, one can estimate a total GPU server investment of around $20.2B. This does not include networking and operating costs of the data center, which would likely more than double the total investment. At such high prices, this can be a significant barrier to entry for smaller companies. The startup costs are simply too high.
Furthermore, the Big Five possess vast amounts of proprietary data. Amazon has access to customer purchasing habits, Google tracks search and browsing behavior, Meta collects personal data, and so on. Tesla, not a member of the Big Five, arguably could boast the most valuable data set with unique access to customer driving data. As artificial intelligence continues to become more and more commoditized, it stands to reason that the companies with the most extensive data collections will win. The more data available to train AI models, the better the models’ performance will be.
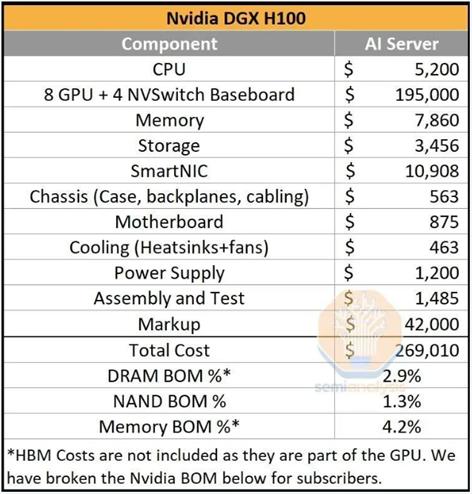
Source: Semi Analysis
This does not guarantee the Big Five’s permanent leadership. However, their data advantage allows them to strive toward providing the best possible products, ultimately leading to a larger user base and perpetuating the aggregation cycle. While the Big Five have achieved immense scale, they are not complacent, unlike many companies that define their businesses too narrowly.
The ability and willingness to embrace new ideas, even if met with skepticism (e.g., Mark Zuckerberg’s vision for the Metaverse), are crucial factors for continued success.
A good way to visualize reinvestment ability is to look at returns on incremental invested capital⁹ (ROIIC) over time.
Average Big Five ROIIC Last 10 Years
*ROIICs are adjusted for R&D expense
*Source: FactSet
4
20.6% -30% -10% 10% 30% 50% Dec-14 Dec-15 Dec-16 Dec-17 Dec-18 Dec-19 Dec-20 Dec-21 Dec-22 Dec-23
March 2024 Issue 3
Increasing Returns to Scale in Action
Due to the increasing returns to scale noted prior, the Big Five have been able to consistently earn ROICs well in excess of the cost of capital. This has allowed the group to outperform the broader market.
Over the past 15 years, the S&P 500 has generated a total return of 830.5% or 16.0% annualized. However, a closer look reveals that a significant portion of this growth can be attributed to the Big Five. These companies collectively contributed 210.2% to the S&P 500’s total return. In other words, the Big Five have accounted for approximately 25.3% of the index’s overall gains during this period.
Source: Morningstar as of Feb. 29, 2024
*Meta went public in May 2012.
When applying the idea of increasing returns to scale to our first principles framework approach to equity valuation (growth, reinvestment, and risk), we find that growth is able to continue for much longer than the average company. This extended high growth phase translates into significantly higher cash flows in future years compared to companies with shorter growth periods. Consequently, the terminal value of such companies also becomes significantly higher.
As a result, companies benefiting from increasing returns to scale can be expected to rarely seem “cheap” based on traditional valuation metrics such as the price-to-earnings ratio.
Network and aggregation effects also can be observed in the returns and earnings growth rates of various indices over time. For example, the Nasdaq 100 index, with its higher exposure to the Big Five and technology companies in general, historically has outperformed indices like the S&P 500 and the Dow Jones Industrial Average, which offer a broader composition.
5
Company Total Return Return Annlzd Rescaled Weight Contribution Apple 6,594% 31.3% 4.2% 66.8% Microsoft 3,338% 24.6% 3.4% 65.0% Amazon.com 5,356% 30.6% 1.9% 28.5% Alphabet Class A 1,527% 16.5% 1.5% 16.8% Meta Platforms* 749% N/A 1.1% 20.1% Alphabet Class C** 392% N/A 1.0% 13.0% 210.2% S&P 500 830.5%
**Alphabet issued Class C shares (no voting rights) in April 2014.
March 2024 Issue 3
6
500 ex-technology ETF incepted Sept. 25, 2015. Source: FactSet as of Feb. 29, 2024 720.13 1,652.28 844.92 0 200 400 600 800 1,000 1,200 1,400 1,600 1,800 08 09 10 11 12 13 14 15 16 17 18 19 20 21 22 23 24 Total Return Indexed to 100 ( ( ( 743.28 355.95 0 100 200 300 400 500 600 700 800 08 09 10 11 12 13 14 15 16 17 18 19 20 21 22 23 24 EPS Growth Indexed to 100 ( ( ( 356.7 286.09 460.89 307.36 242.20 50 100 150 200 250 300 350 400 450 500 14 15 16 17 18 19 20 21 22 23 24 Total Return Indexed to 100 ( ( ( ( March 2024 Issue 3
*S&P
Conclusion
Traditionally, economic theory has been based on the concept of decreasing returns to scale. While this principle remains intact for most companies, a select few have defied this trend. These companies have benefited from the economy’s shift from supply side economics to demand side economics, where the marginal good can be delivered at near-zero cost.
While the Big Five have delivered performance and accounted for a large portion of the S&P 500 total return in recent history, we expect this trend to persist over the long-term. In the information age, characterized by the invention of the internet, the shift towards continued strength for large companies appears to be structural rather than transient. Bigger can be better.
Keeping the Feedback Loop Open
It is entirely possible that you disagree with a variety of the assumptions in this article. Rather than dismiss alternative analyses as wrong, we are better served by keeping our feedback loop open. If you would like to share your opinion and/or critique ours, please feel free to share your thoughts. One of the great aspects of investing is that if you get something wrong, you always have the opportunity to change it. Refusing to change a narrative, just because it is yours, is nothing more than hubris.
 Jordan Bancroft, CFA, CAIA VP/Portfolio Manager
jbancroft@bell.bank
Fargo
7
March 2024 Issue 3
End Notes
¹Declining companies often exhibit negative excess returns as CEOs attempt to boost revenues by investing in projects that have little chance of success.
²Satya Nadella succeeded Steve Ballmer as CEO of Microsoft in 2014.
³The information age is defined by information becoming a commodity that is quickly and widely disseminated and easily available via the internet.
⁴Calculated as Net Operating Profits After Taxes0/Invested Capitalt-1
⁵According to Nielsen, YouTube accounts for 8.6% of total time spent with video. Netflix is second at 7.9%.
⁶Includes Facebook, WhatsApp, Instagram, and Messenger.
⁷Large Language Models. LLMs are a type of artificial intelligence program that is able to recognize and generate text, among other tasks.
⁸Graphic Processing Unit (GPU) chip from NVIDIA used in the training of large language models.
⁹ROIIC is calculated as (NOPAT0 – NOPATt-1)/(Invested Capital0 – Invested Capitalt-1) Appendix
Disclosures
This communication reflects the personal opinions, viewpoints and analyses of the Bell Institutional Investment Management (BIIM) employees providing such comments, and should not be regarded as a description of advisory services provided by BIIM or performance returns of any BIIM client.
The views reflected are subject to change at any time without notice. Nothing in this communication constitutes investment advice, performance data or any recommendation that any particular security, portfolio of securities, transaction or investment strategy is suitable for any specific person.
Any mention of a particular security and related performance data is not a recommendation to buy or sell that security. BIIM manages its clients’ accounts using a variety of investment techniques and strategies, which are not necessarily discussed in the commentary. Investments in securities involve the risk of loss. Past performance is no guarantee of future results.
8
Investing and wealth management products are: Not FDIC Insured | No Bank Guarantee | May Lose Value | Not A Deposit | Not Insured by Any Federal Government Agency Sales per Share CAGRs GOOGL AAPL AMZN MSFT META S&P 500 10y SPS 18.5% 14.0% 21.2% 12.0% 32.3% 4.9% 15y SPS 19.3% 21.6% 23.8% 10.5% N/A 4.1% Earnings per Share CAGRs GOOGL AAPL AMZN MSFT META S&P 500 10y EPS 20.5% 15.8% 58.2% 14.1% 37.9% 6.0% 15y EPS 21.0% 26.0% 27.6% 11.6% N/A 8.7% Total Return CAGRs GOOGL AAPL AMZN MSFT META S&P 500 10y Return 10.6% 25.9% 25.6% 27.4% 21.8% 12.7% 15y Return 16.5% 31.3% 30.6% 24.6% N/A 16.0%
March 2024 Issue 3
Source: FactSet and Morningstar as of 2/29/2024