2025 IMD Smart City Index


The housing affordability challenge: A growing concern


World Competitiveness Center




World Competitiveness Center




The housing affordability challenge: A growing concern


World Competitiveness Center


World Competitiveness Center


The housing affordability challenge:
A growing concern
In a deglobalized world where countries seem more out for their own interests than in the recent memorable past, we remain united by the issue of affordable housing.
2025 has barely gotten underway and yet significant trade tensions, policy shifts, and weakened business and consumer confidence appear to have set the tone for the year. The aggressive trade stance adopted by the United States – which notably includes substantial tariff hikes on imports from China, Mexico, and Canada – has, as we know, triggered retaliatory measures, re-escalating trade wars. In 2018, during his first term, President Trump started increasing tariffs on goods from China -first on “only” 8% of Chinese exports but covering over 66% by early 2020.
While the extent, magnitude, and duration of current tariff increases remain uncertain, past lessons from the 2018 US-China trade war suggest that the direct participants will all experience economic losses (Caliendo and Parro, 2023), while the impact on other economies will be more difficult to predict; there may be some winners – especially in Southeast Asia where production can be more easily relocated (Fajgelbaum et al., 2024).
Inflationary pressures remain a concern, particularly in industries heavily reliant on imported materials, such as construction. Higher tariffs on steel (and potentially lumber) are expected to increase development costs, putting further stress on an already-constrained housing supply.
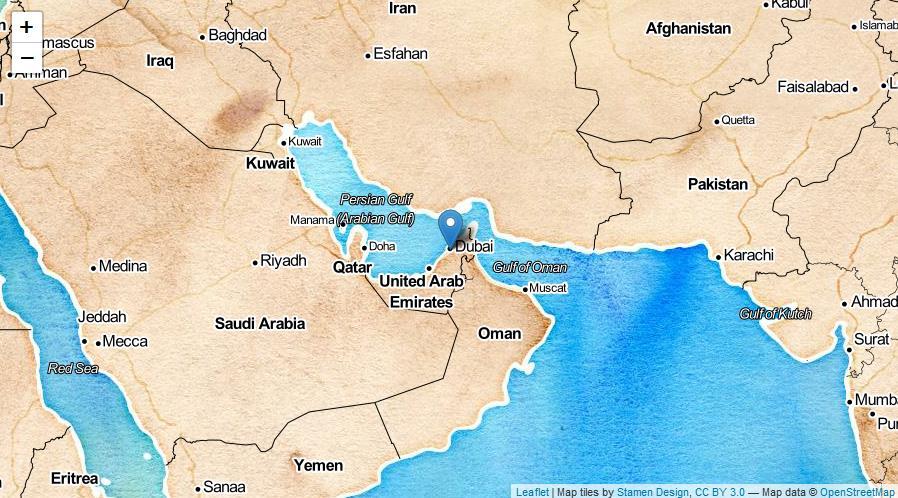
Making housing more affordable is the top priority for most of the respondents of the 2025 IMD Smart City Survey. In 110 out of 146 cities, affordable housing is mentioned as a priority by at least half of the respondents in the city. The issue is particularly felt in Dublin or Vancouver, where about 90% of the IMD Smart City Survey respondents expressed concern over housing affordability. Respondents in the Middle East agree: about 80% of respondents from AlUla or Dubai identify affordable housing as a priority area.
Housing has become increasingly unaffordable for many households over the past couple of years.
According to IMF data, it is currently less affordable than during the house price bubble that preceded the 2007-08 global financial crisis (Biljanovska et al., 2023). This harsh statistic is reflected in the responses in the IMD Smart City Survey: in cities as far apart geographically as Lisbon, Vancouver, Dublin, and Reykjavik some nine in 10 respondents report difficulties finding housing that costs less than a third of their income.
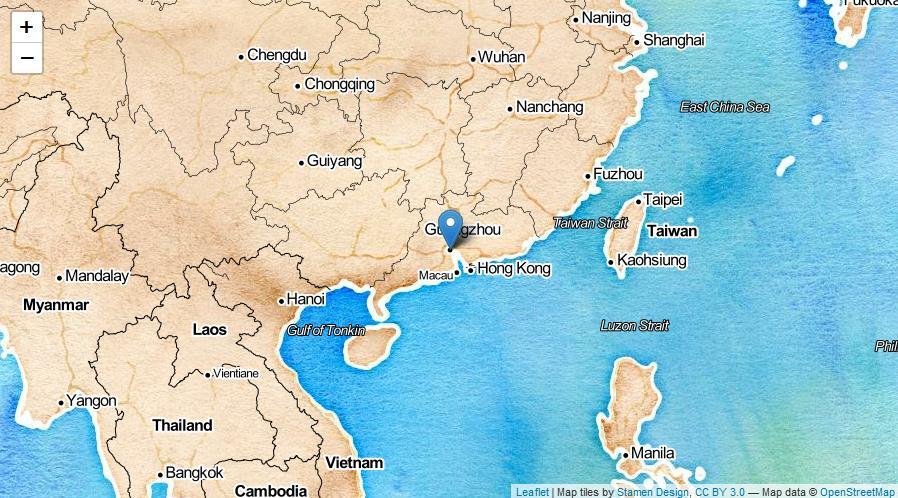
Conversely, in Chinese cities such as Guangzhou (a Tier 1 city) and Hangzhou and Chongqing (both new Tier 1 cities), perceptions of affordability are significantly more optimistic: just three in 10 respondents report difficulties finding housing that costs less than a third of their income. However, this finding needs to be viewed in the context of China’s ongoing real estate downturn. In 2020, China introduced measures to curb excessive leverage in real estate and de-risk the sector. Stalled projects and liquidity shortages led to defaults by major developers like Evergrande and Country Garden, further deepening the sector’s slump. Despite efforts to stabilize the market through public investments and interest rate cuts, business and consumer confidence remains low, far below prepandemic levels.
Rising interest rates, persistent inflation, and elevated energy costs have priced large segments of the population out of both homeownership and rental markets. A major driver of rising housing costs is the imbalance between supply and demand. Restrictive zoning laws and regulatory barriers have contributed to high housing costs in countries such as the US (Glaeser et al., 2005), the UK (Hilber and Vermuelen, 2016), and other OECD countries (Caldera and Johansson, 2013). This evidence is echoed in our data: over 70% of respondents from an American or a British city list housing as a priority area. Moreover, about eight in ten respondents in San Francisco, Denver, Seattle, Boston, Cardiff, or Glasgow report that finding housing that costs less than a third of their income is problematic. The rapid growth of urban populations and demographic shifts have further intensified demand pressures.
The affordability “crisis” as it has come to be called is no longer limited to low-income households, but it is increasingly affecting the middle classes. Brueckner and Rosenthal (2009) underscore the cyclical nature of gentrification and neighborhood evolution, highlighting how rising costs can lead to displacement and exacerbate wealth inequalities. Respondents in the IMD Smart City Survey who expressed concern about housing affordability also showed apprehension towards the availability of employment and critical services such as healthcare and education. The housing burden is, in addition, constraining labor mobility, leading to a misallocation of workers with potentially severe effects on economic growth (Glaeser and Gyourko, 2018). Cities like New York and San Francisco have adopted stringent regulations for new housing, de facto making housing affordable only to high-productivity workers able to command higher wages (Hsieh and Moretti, 2019).
The recent surge in immigration has sparked a debate about the role of immigrants on housing costs.
The argument is that when housing supply is constrained (for example, because of stringent regulations), the additional demand for housing by migrants would fuel housing prices. Empirical evidence supports this conjecture: a 1% increase in international immigration translates into a 1% hike in (flat) rental prices (Card, 2007 for the US; Unal et al., 2024 for Germany). The effect is larger when focusing on high-skilled immigrants (Ottaviano and Peri, 2012): US states with a higher share of high (rather than low)-skilled migrants witness larger rent increases.
Seeing these results through the lenses of our sample would imply that in talent-importing cities, such as Zurich, Geneva, and Dubai, the inflow of foreign professionals has contributed to rising rental costs and housing shortages. In Dubai, over 40% of the value of all residential property is held by foreign nationals, thanks to a 20% increase between 2020 and 2022 in foreign-owned residential real estate. Conversely, in talentexporting cities, such as Mumbai, the outflows of skilled workers ease the pressure on the real estate market. Half of Mumbai’s respondents find affordable housing problematic – a relatively low share compared to other cities. Supply-side constraints and investment-driven speculations may still pose challenges to housing affordability.
The COVID-19 pandemic initially caused a sharp decline in downtown residential prices due to increased teleworking and underutilized commercial spaces, but it was short-lived (Duranton and Handbury, 2023). However, suburban housing prices surged, which led to a lasting “doughnut effect”, where suburbs became preferred over downtown areas by both people and businesses (Ramani and Bloom, 2024). These shifts have further reshaped urban housing demand and affordability dynamics.

Housing affordability is closely tied to transportation infrastructure. Expanding access to affordable housing can be achieved by increasing housing density and improving public transport networks.
Take London and Brussels, two cities where congestion costs commuters over 110 hours per year (TomTom Traffic Index, 2024), and, unsurprisingly, traffic congestion is perceived as problematic by at least three in four respondents in Brussels or London (IMD Smart City Survey). These citizens lament inadequate public transportation - about two in five respondents in Brussels and one in three in London - and deem bike-hiring or car-sharing as rather ineffective tools to reduce congestion –only about half of respondents find these tools useful, and a similar share of respondents agrees that apps that direct drivers to an available parking space have reduced journey times.
City governments play a crucial role in addressing housing challenges through urban planning and transportation policies. The OECD emphasizes the importance of leveraging local policy tools to enhance housing accessibility and affordability. For instance, investments in efficient public transport can expand viable residential areas, connecting lower-cost suburban regions with urban job markets (Ewing and Cervero, 2010). Additionally, streamlining permitting processes and promoting high-density development could help mitigate supply shortages.
The availability of funding – both public and private –plays a crucial role in housing affordability.
Some governments, particularly in the Middle East, have adopted aggressive strategies to increase supply through massive real estate investments.
As part of UAE Vision 2030, significant efforts were made to diversify the economy and prop up the real estate sector. Large-scale residential investments were facilitated by government-backed initiatives and partnerships with private developers. Dubai’s housing boom is driven by favorable taxation and ownership regimes, as well as extensive urban planning
efforts. Some of these elements, such as incentives for foreign investors, are also behind the expansion of the real estate sector in Manama, a new entrant in the Smart City Index ranking.
For cities struggling with affordability, significant dividends could come from leveraging both public and private capital to develop high-density and support transit-oriented housing.
In the US, homeowners insurance premiums have increased by 13%, in real terms, between 2020 and 2023 (Boomhower et al., 2024). Some insurance companies are no longer offering writing policies in some areas. Climate change is raising insurance premia, as the increased frequency and intensity of natural disasters have led to higher insurance losses.
Rising sea levels, extreme weather events, and natural disasters influence also housing location choices and long-term sustainability. Government interventions, such as constructing sea walls or flood defenses, may unintentionally encourage development in high-risk areas (Hsiao, 2023). Increasing transparency over climate-related risks can shape buyer behavior and help prevent undesirable outcomes. Fairweather et al. (2024) find that when homebuyers have access to flood risk data, they tend to favor safer locations and adjust their willingness to pay accordingly. Policies that enhance the acquisition and diffusion of reliable and accessible data can thus pay large dividends.
In China, research by Zhang et al. (2016) suggests that simply providing buyers with an information card detailing the benefits of green buildings significantly increases their willingness to invest in sustainable housing. This finding underscores the potential of targeted information campaigns to drive environmentally responsible development without excessive costs.

Addressing the housing crisis requires a multipronged approach that integrates regulatory reforms, economic policy adjustments, and innovative urban planning.
Combining infrastructure investments, incentives, and institutional frameworks will help build a more resilient and inclusive housing market (Ashraf, Glaeser, and Ponzetto, 2016). Implementing such a broad range of interventions can be challenging for advanced economies and even more so for emerging markets given their often-limited implementation capacity. However, confronting the crisis by tackling supply constraints, fostering affordability, and incorporating sustainability into housing policies can create more livable and more inclusive urban environments, delivering positive economic dividends at the same time.

Ashraf, N., Glaeser, E. L., & Ponzetto, G. A. (2016). Infrastructure, incentives, and institutions. American Economic Review, 106(5), 77-82.
Biljanovska, N., Fu, M. C., & Igan, M. D. O. (2023).
Housing affordability: A new dataset. International Monetary Fund.
Boomhower, J., Fowlie, M., Gellman, J., & Plantinga, A. (2024). How are insurance markets adapting to climate change? Risk selection and regulation in the market for homeowners’ insurance (No. w32625). National Bureau of Economic Research.
Bown, C. P. (2021).
The US-China trade war and Phase One agreement. Journal of Policy Modeling, 43(4), 805-843.
Caldera, A., & Johansson, Å. (2013).
The price responsiveness of housing supply in OECD countries. Journal of Housing Economics, 22(3), 231-249.
Caliendo, L., & Parro, F. (2023).
Lessons from US-China trade relations. Annual Review of Economics, 15(1), 513-547.
Card, D. (2007).
How immigration affects US cities (Vol. 11, No. 07). CReAM discussion paper.
Duranton, G., & Handbury, J. (2023). Covid and cities, thus far (No. w31158). National Bureau of Economic Research.
Fairweather, D., Kahn, M. E., Metcalfe, R. D., & Olascoaga, S. S. (2024).
Expecting climate change: A nationwide field experiment in the housing market (No. w33119). National Bureau of Economic Research.
Fajgelbaum, P., Goldberg, P., Kennedy, P., Khandelwal, A., & Taglioni, D. (2024).
The US-China trade war and global reallocations. American Economic Review: Insights, 6(2), 295-312.
Glaeser, E. L., Gyourko, J., & Saks, R. E. (2005).
Why have housing prices gone up? American Economic Review, 95(2), 329-333.
Glaeser, E., & Gyourko, J. (2018).
The economic implications of housing supply. Journal of economic perspectives, 32(1), 3-30.
Hilber, C. A., & Vermeulen, W. (2016).
The impact of supply constraints on house prices in England. The Economic Journal, 126(591), 358-405.
Hsiao, A. (2023).
Sea level rise and urban adaptation in Jakarta. Working Paper.
Hsieh, C. T., & Moretti, E. (2019).
Housing constraints and spatial misallocation. American economic journal: macroeconomics, 11(2), 1-39.
Ottaviano, Gianmarco I. P., and Peri, Giovanni (2012).
The effects of immigration on US wages and rents: a general equilibrium approach In: Nijkamp, Peter and Poot, Jacques and Sahin, Mediha, (eds.) Migration Impact Assessment: New Horizons. Edward Elgar Publishing Limited, Cheltenham, 107146. ISBN 9780857934574
Ramani, A., & Bloom, N. (2021).
The Donut Effect of COVID-19 on Cities (No. w28876). National Bureau of Economic Research.
Rogoff, K. S., & Yang, Y. (2020).
Peak China housing (No. w27697). National Bureau of Economic Research.
Unal, U., Hayo, B., & Erol, I. (2024).
The effect of immigration on housing prices: Evidence from 382 German districts. The Journal of Real Estate Finance and Economics, 1-39.
Zhang, L., Sun, C., Liu, H., & Zheng, S. (2016).
The role of public information in increasing homebuyers’ willingness-to-pay for green housing: Evidence from Beijing. Ecological Economics, 129, 40-49.
– AlUla, Astana (formerly Nur Sultan), Caracas, Kuwait City, Manama, and San Juan – were added to the 2025 Smart City Index (SCI), bringing the total number surveyed from 142 in 2024 to 146 in 2025. Due to a lack of sufficient data, Tianjin and Zhuhai were excluded from the sample considered.
Once again, the rankings remain stable with minimal shifts among the top 20 cities.
The only changes here relative to last year concern Taipei City, which slid from 16th in 2024 to 23rd in 2025, and Ljubljana which jumped from 32nd to 16th.
The methodology remains consistent over time.
The ranking assesses how urban technologies and infrastructure perform in five key areas – health and safety, mobility, activities, opportunities, and governance. To ensure accuracy and mitigate the influence of potential outliers, we employ a three-year moving average of residents’ perceptions along the different issues considered.
The SCI is based on the survey responses of residents from a heterogeneous group of cities. To enable comparability across similar environments, responses are calibrated to the local context by incorporating the citylevel Subnational Human Development Index (SHDI) from the Global Data Lab.
Zurich holds onto the top spot for another year, continuing the existing trend of strong performances by Swiss cities across all dimensions the SCI evaluates. Middle Eastern cities such as Dubai and Abu Dhabi rose in the 2025 ranking from 12th and 10th position to fourth and fifth, respectively.

For over thirty years, the IMD World Competitiveness Center has pioneered research on how countries and companies compete to lay the foundations for sustainable value creation. The competitiveness of nations is probably one of the most significant developments in modern management and IMD is committed to leading the field.
Professor Arturo Bris Director
Christos Cabolis Chief Economist & Head of Operations
José Caballero
Senior Economist
Fabian Grimm
Research Specialist
Odete Madureira
WCC Coordinator
William Milner
Associate Director
Francesca de Nicola
Senior Economist
Chinar Sharma Projects Analyst
Alice Tozer
Content Manager
Smart City Ranking: The Ranking position of the city amongst the 146 cities measured, based upon the Rating and its components.
Group: Each city is assigned to one of four groups, based upon its HDI values.
Smart City Rating and Factor Ratings: The Ratings for each city are calculated from the city’s performance relative to the other cities within the group.

The Methodology section provides the exact procedure for these calculations.
The 2024 Ranking and Rating are also shown for the 142 cities included in the last edition’s index.

This section presents the Human Development Index (HDI) at the city level taken from the Global Data Lab, and the population of the city as defined through the United Nations World Urbanization Prospects for the majority of cities, or Eurostat for some of European cities.
It also presents the United Nations HDI (country-level - for the parent economy of a given city) and its four components, as well as the city’s position on the map. Please note: for Taipei City only, the data is calculated using the same methodology and comparable data.
Summarizes the areas that the respondents perceive as the priority area for their city. From a list of 15 indicators, survey respondents were asked to select 5 that they perceived as the most urgent for their city. The total bar indicates the percentage of the respondents that included a given area as one of their five choices. The higher the percentage of responses per area, the greater the priority for the city.
From a list of 15 indicators, survey respondents were asked


Shows and compares the responses to three key privacy aspects (willingness to concede personal data, comfort vis-à-vis face recognition, and whether online information has increased trust in authorities) and the percentage of day-to-day transactions that are non-cash. The city is represented by the blue bar, while the group average is shown by the green bar.

Key survey data collected on Structures (left side) and Technologies (right side), under five key areas: health and safety, mobility, activities, opportunities, and governance.
Each indicator presents the Score for the city and a comparison with its Group (1-4). Showing the Group’s Minimum, Mean, and Maximum Scores (green bar) alongside with the city (blue circle) allows a clear comparison of the city’s performance in this indicator. The Methodology section provides the exact calculation of the Score.
This table can be read in two ways: down to examine all Structures or Technologies indicators, or across to examine a key area in both Structures and Technologies.
The IMD Smart City Index 2025 assesses the perceptions of residents on issues related to structures and technology applications available to them in their city. 2
This edition of the SCI ranks 146 cities worldwide by capturing the perceptions of 120 residents in each city. The final score for each city is computed by using the perceptions of the last three years of the survey, with the weight of 3 : 2 : 1 for 2025 : 2024 : 2023. 3
There are two pillars for which perceptions from residents are solicited: The Structures pillar referring to the existing infrastructure of the cities, and the Technology pillar describing the technological provisions and services available to the inhabitants.
4
Each pillar is evaluated over five key areas: health and safety, mobility, activities, opportunities, and governance.
5
The cities are distributed into four groups based on the Global Data Lab’s Subnational Human Development Index (SHDI) score of the city they are part of.
Within each SHDI group, cities are assigned a ‘rating scale’ (AAA to D) based on the perceptions-score of a given city compared to the scores of all other cities within the same group.
For group 1 (highest SHDI quartile), scale AAA–AA–A–BBB– BB
6
7
For group 2 (second SHDI quartile), scale A–BBB– BB–B– CCC
For group 3 (third SHDI quartile), scale BB–B– CCC–CC–C
For group 4 (lowest SHDI quartile), scale CCC–CC–C–D
Rankings are then presented in two formats:
• an overall ranking (1 to 146)
• a rating for each pillar and overall
The SCI is derived from survey responses collected from residents of participating cities. To encourage the comparability of results across diverse global contexts, these responses are calibrated using the region-level Subnational Human Development Index (SHDI), provided by the Global Data Lab.

In addition, data on city population is included for context, although it is not factored into the rankings or ratings. Population figures are sourced from the UN’s World Urbanization Prospects, Eurostat, or, when necessary, the respective national census authority.






Expected




In alphabetical order by country with HDI context
0.636 Hyderabad 0.66
In alphabetical order by country with HDI context
World Competitiveness Center