


Plug-and-play products that comply with the Open Process Automation Standard are turbocharging testbeds and coming to supplier shelves


ADVANCING AN ENERGY DATA REVOLUTION IMPACT OF 'EVERYWHERE


Process improvement is like a trapeze act. You need a trusted partner who lends a hand at the right moment.
Just as athletes rely on their teammates, we know that partnering with our customers brings the same level of support and dependability in the area of manufacturing productivity. Together, we can overcome challenges and achieve a shared goal, optimizing processes with regards to economic efficiency, safety, and environmental protection. Let’s improve together.


Connect
The Unlimited Platform for Total System Integration

ALL YOUR DATA

ALL YOUR DEVICES


ALL YOUR PEOPLE

ALL YOUR LOCATIONS
ALL YOUR OPERATIONS


ONE PLATFORM TO CONNECT ALL YOUR PROCESSES, PEOPLE & PROGRAMS
Learn more about Ignition: ia.io/platform
Are we better prepared?
Four years after the COVID-19 pandemic, process control solutions are tackling the warts it exposed
No time to waste
Circularity report shows effects of resource scarcity

Lost manufacturing time causes
How Syngenta uses advanced analytics software to identify production losses and increase operational efficiency
Overcoming temperature measurement uncertainty
Temperature certainty requires proper testing at operating points
Impact of 'everywhere HMI' Context is critical for process information, so mobile displays must handle the job
32
ARC Forum tackles AI, sustainability, etc Also, NIST updates cybersecurity framework
35
The many faces of interfaces Control 's monthly resource guide
Non-contacting radar takes pressure off LPG tank gauging
Solutions tackle the growing need for accurate inventory management and overfill prevention for pressurized gas storage
Wedge flowmeter 'seals' the deal Rosemount 9195 wedge flowmeters enhanced by standardized seal assemblies
Choosing the right flowmeter for flare gas detection
Our experts recommend ultrasonic flowmeters to get the job done right
Controller/computer lines
blurred by software
PLCs, PACs and IPCs digitalize, and add more I/O, ports, network links and physical protections
Achieving plantwide, multivariable control
These practical techniques help eliminate compartmentalization of multivariable control
See the forest
Prepare to look back, be patient, and explain the basics

Designed for compact installations without compromising on capability, Emerson’s Micro Motion
G-Series Flow Meter delivers the benefits of Coriolis technology and is the perfect fit for general purpose applications. G-series is notable for its lightweight design and is the most compact dual-tube Coriolis meter available. Operators can gain measurement confidence and process insight in every corner of the plant.
Learn more at www.Emerson.com/MicroMotion

Endeavor Business Media, LLC
30 Burton Hills Blvd, Ste. 185, Nashville, TN 37215
800-547-7377
EXECUTIVE TEAM
CEO Chris Ferrell
President
June Griffin
COO
Patrick Rains
CRO
Paul Andrews
Chief Digital Officer
Jacquie Niemiec
Chief Administrative and Legal Officer
Tracy Kane
EVP/Group Publisher
Mike Christian
EDITORIAL TEAM
Editor in Chief
Len Vermillion, lvermillion@endeavorb2b.com
Executive Editor
Jim Montague, jmontague@endeavorb2b.com
Digital Editor
Madison Ratcliff, mratcliff@endeavorb2b.com
Contributing Editor
John Rezabek
Columnists
Béla Lipták, Greg McMillan, Ian Verhappen
DESIGN & PRODUCTION TEAM
Art Director
Derek Chamberlain, dchamberlain@endeavorb2b.com
Production Manager
Anetta Gauthier, agauthier@endeavorb2b.com
Ad Services Manager
Rita Fitzgerald, rfitzgerald@endeavorb2b.com
Operations Manager / Subscription requests
Lori Goldberg, lgoldberg@endeavorb2b.com
PUBLISHING TEAM
Group Publisher
Keith Larson
630-625-1129, klarson@endeavorb2b.com
Group Sales Director
Amy Loria
352-873-4288, aloria@endeavorb2b.com
Account Manager
Greg Zamin
704-256-5433, gzamin@endeavorb2b.com
Account Manager
Kurt Belisle
815-549-1034, kbelisle@endeavorb2b.com
Account Manager
Jeff Mylin
847-533-9789, jmylin@endeavorb2b.com
Subscriptions
Local: 847-559-7598
Toll free: 877-382-9187 Control@omeda.com
Jesse H. Neal Award Winner & Three Time Finalist
Two Time ASBPE Magazine of the Year Finalist
Dozens of ASBPE Excellence in Graphics and Editorial
Excellence Awards
Four Time Winner Ozzie Awards for Graphics Excellence
Four years after the COVID-19 pandemic, process control solutions are tackling the warts it exposed
IT’S sometimes hard to wrap my head around the fact that it’s been four years since the COVID-19 pandemic changed, well, a lot. It sure doesn’t seem that long ago. Then again, in terms of our preparation for another globally disruptive event, it seems like generations have passed.
There shouldn’t be any doubt that companies and office workers are now better set up to work remotely in a pinch. Many schools and universities don’t even have “snow days” anymore. Instead, they use the remote learning processes honed during the pandemic to replace downhill sleds with online skeds (poor kids). But, what about industry?
It’s worth pondering if the world’s plants, refineries, et. al., are in a better position to handle another pandemic, or worse. Would the global supply chain suffer the same fate that (still) has many scrambling for resources? More importantly, would fewer people be put in harm's way to perform essential jobs such power generation, food processing orpharmaceutical manufacturing?
The short answer is nothing beats experience. Thankfully, process control and automation technologies continue to refine solutions for increasing operational efficiency, remote maintenance and data security. While not specifically focused on another pandemic, the groundswell for automated process control has reached a fever pitch these days. Just attend any industry event this spring conference season and your certain to hear experts talk at length about the needs to shore up data analytics, communicate seamlessly across products and systems, and to be able to transfer knowledge at a moments notice. This month, we take a look at some of these advancements throughout our coverage in Control and ControlGlobal.com.
Our cover story examines developments for open process automation (p. 38), which should enable faster technology development and deployment of the solutions that can foster a more relilient opearations across several industries. In addition, there's increased recognition of the need for investment in data analytics (p. 44), particularly cloud-based software that lets technicians access vital decision-making data from just about anywhere and on any device.
So, the next time we're all confined to our homes, productivity won't be stuck next to us.

 LEN VERMILLION Editor-in-Chief lvermillion@endeavorb2b.com
"Thankfully, process control and automation technology continues to refine solutions for increasing operational efficiency, remote maintenance and data security."
A new report shows that 92% of industrial businesses in the U.S. have been affected by resource scarcity, which has led to increasing costs, supply chain disruptions and production slowdowns. In response, most businesses surveyed in the report support circularity regulations, and 67% say they’ll invest more over the next three years despite the lack of a standardized approach and slow adoption of key practices.
The global survey, "Circularity: no time to waste," from ABB Motion and conducted by Sapio Research in October 2023, shows industry connects improving circularity with energy efficiency, and that energy is among of the biggest waste sources.
Raw materials (39%) are seen as the scarcest resource, followed by labor (35%), and electronic components (33%). Resource scarcity has led to increased costs for 39% of businesses, as well as supply chain disruptions for 39%, and slowdowns in production capacity for 29%. Despite energy being an increasingly scarce resource, more than 40% reported it’s their biggest source of waste.
The global survey gathered responses from 3,304 industrial decision-makers across 12 countries, including 400 respondents in the U.S. Respondents represented a range of industries, such as energy, chemicals, oil and gas, and utilities.
While there’s optimism about investing in circularity, the survey identified obstacles to immediate progress. For example, no single definition of "circularity" was accepted by a majority of the respondents. Also, only 14% saw circularity as a company-wide responsibility, but this group experienced the highest level of improvements across key circularity metrics, such as energy

consumption, use of recycled materials and carbon emissions.
The survey also revealed limited adoption of important circular practices in the U.S., including partnering with waste management companies (41%), incorporating energy-efficient technologies (37%), and promoting circular principles in the supply chain (36%). Meanwhile, 81% are using recycled materials in their products to some extent.
Investing in circularity has already led to measurable benefits, including waste reduction (44%) and energy efficiency improvements (49%). Though some businesses express concern about upfront investment required, many anticipate long-term improvements in process efficiency and cost control.
Most respondents (84%) agree a circular economy encourages innovation and drives competitiveness. They also support increased regulation and reporting requirements (80%), and want more government support for adopting circular business practices (82%). The full report is available at bit.ly/CircularityReport
Another report ABB released recently covers the journey to fossil-free steel,
and examines decarbonization challenges including cost, complexity in transitioning to lower-carbon technologies, and access to hydrogen, clean electricity, and fossil-free carbon.
Current steel production is carbonand energy-intensive, and is classified as one of the six “hard to abate” sectors. Globally, the steel industry is responsible for an estimated 8% of the world’s energy demand, and generates 7-9% of CO2 emissions, mostly from burning fossil fuels.
To meet U.N. Paris Agreement criteria on climate change, and limit global temperature increase to less than 1.5 °C compared with pre-industrial levels, the steel industry must achieve net-zero emissions by 2050. This will require radical transformation, especially as global steel demand is projected to increase 30% by the same date.
The report spotlights fossil-free steel innovation in five steel-producing markets, and presents actions that steel producers can make to reduce carbon in the short and medium term, as well as steps to take with industry suppliers and partners to work together towards a fossil-free steel future.
The full report is located at bit.ly/Fossil-FreeSteel


 SPONSORED
BY


More than six decades of innovation as Emerson’s Rosemount™ technologies continue to transform industrial temperature measurement


6 Error-proof DESIGN
8 Simplified INSTALLATION
10 Resilient OPERATIONS
12 Lifecycle PERFORMANCE


Temperature is the most widely measured variable in industries ranging from oil & gas to chemical and food and beverage to pharma. Accurate measurements are vital to product quality as well as an operation’s safety and efficiency. But ensuring that critical measurements are delivered in a timely, reliable and trustworthy fashion can present operators with a range of challenges. For more than 60 years, Emerson’s Rosemount™ Temperature Measurement solutions have led the industry in combating such challenges through new and innovative technologies. Control recently caught up with Michael Olivier, Vice President of Temperature Measurement Instrumentation at Emerson, to learn more about how Emerson’s innovative solutions continue to help processors tackle their biggest temperature measurement challenges.
Q: Why are temperature measurement solutions vital to the success of process industries?
A: Accurate temperature measurements help ensure product and process safety, quality, and efficiency in a variety of process industries. Temperature measurement serves as a key indicator of many processes such as complete reactions for chemical producers, distillates of desired purity for oil refiners, and thorough clean-in-place cycles for the food & beverage industry, just to name a few examples. In addition, the global push for increased sustainability means inaccurate temperature measurement can lead to not
only inefficient processes, but also the discharge of unnecessary greenhouse gases into the atmosphere.
Q: What distinguishes Emerson as a leader in temperature instrumentation?
A: Emerson focuses on creating innovative and sustainable solutions, producing the highest quality outcomes, and ensuring our customers’ needs are exceeded with our unmatched support and expertise. Our Rosemount Temperature Measurement solutions are no different. From transmitters to thermowells to sensors and more, we offer a complete breadth of temperature products and solutions available in fully integrated assemblies ready for out of the box installation. Our reliability, quality, expertise, and innovation set us apart from our competitors.
Q: What are the primary challenges associated with temperature measurement?
A: ere are four phases in the lifecycle of temperature solutions: design, installation, operation, and maintenance. Challenges can occur in each phase. Most design challenges are associated with thermowell calculations to ensure they are designed appropriately for their application.
Temperature installations often need to be done when the process is not running and can require piping modifications to facilitate the installation of the thermowell. Unexpected shutdowns can occur when the


device is operational due to failing or degrading sensors or environmental factors. Failing, degrading, or malfunctioning sensors can also cause inaccurate measurements when maintaining the device throughout its lifecycle.
It is important to consider all phases and their potential challenges when specifying the temperature solution that best fits your application. Emerson considers these potential challenges in all phases when engineering our products and tools.
Q: What solutions does Emerson offer to help combat these challenges?
A: Emerson offers free thermowell design software that significantly decreases design time and eliminates
“Accurate temperature measurements help ensure product and process safety, quality, and efficiency in a variety of process industries.”
— Michael Olivier
manual trial-and-error calculations. We created a more robust thermowell with a unique design that can withstand harsh process conditions that are unsuitable for traditional thermowells. In addition, we were the first to design a technology to accurately measure process temperature without a thermowell.
Emerson also offers a full portfolio of temperature transmitters that have been recognized by our customers as the number one brand of transmitters for over 20 years in Control’s Readers’ Choice Awards. ese transmitters have a full suite of advanced diagnostic capabilities to help customers do more with less by optimizing operations and simplifying maintenance.
Q: Finally, what future temperature measurement innovations can readers expect from Emerson?
A: Emerson continues to be at the forefront of temperature measurement innovation. With the next generation of temperature instrumentation, we aim to provide our customers with even higher quality devices with superior performance and usability to match. This includes improved user interfaces, advanced diagnostics, industry-leading accuracy specs and other features to make operation more intuitive for decades to come.
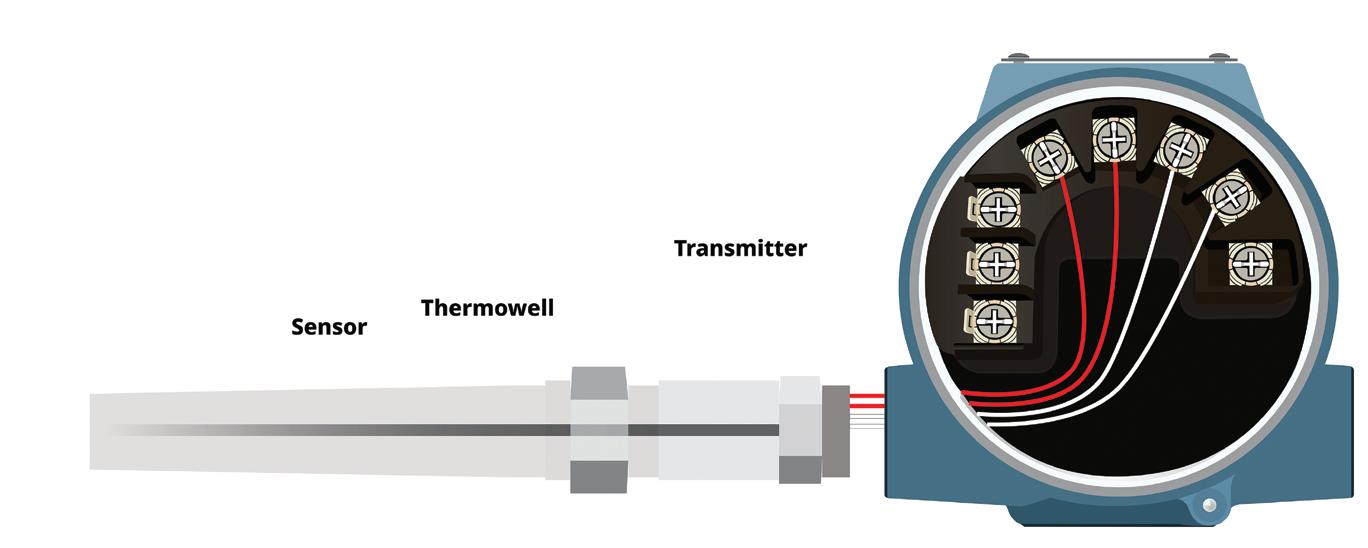
In most cases, a complete process instrumentation solution for temperature measurement is comprised of three components: a transmitter, a sensor and a thermowell. Traditionally, its design comes with its share of complexity and a risk of failure if not done properly. Most of the challenge lies with the design of the thermowell, a metal alloy sheath that penetrates the process piping and protects the sensor from often harsh process conditions. Think about an oil refinery’s catalytic cracker regenerator that runs in excess of 1,000º F. Add to such high temperatures turbulent flows and fluid velocities that can flirt with the speed of sound, and one quickly appreciates the need for a well-designed thermowell.
Industry best practice is to perform thermowell wake frequency calculations, which ensure that the thermowell design will withstand the process conditions to which it is exposed. These calculations account for 75% of the overall engineering work to design and specify a complete temperature measurement point. Most of the design time is spent on the thermowell because it is the component that comes into direct contact with the process. It is also a pressure-retaining component, so a poorly designed thermowell can lead to safety concerns as well as unplanned and costly shutdowns.
application. Other considerations may revolve around your measurement objective. Is your temperature measurement intended to be used for closed-loop control or monitoring purposes?
In addition, thermowell calculations must adhere to the most current ASME PTC-19.3 TW industry standard. Most individuals are not well-versed in the requirements of the standard and could potentially design a thermowell that fails to meet these requirements.
Historically, performing such calculations included the use of manual spreadsheets and numerous manual trialand-error iterations. This process was tedious, time-consuming and prone to errors.

Emerson developed the Rosemount™ Thermowell Design Accelerator to ease the complexities of the thermowell design process. This free, easy-to-use and intuitive online software tool can execute thermowell calculations up to 90% faster by eliminating many of the manual tasks of the past.
Designing a thermowell is a complex task, and there are several considerations that must be factored into both the overall design and the specifications for each application. Among those considerations are allowances for material compatibility with the process as well as the mounting types and style appropriate to the
For example, if a user changes process specifics, they’ll have to do another calculation to ensure the thermowell isn’t affected. In the past, that required the use of trial and error and spreadsheets, resulting in a 50-tag project typically taking about 40 hours to calculate. The Rosemount Thermowell Design Accelerator can reduce that same project design time to about two hours. It is able to upload and calculate up to 1,000 thermowell tags at once and, uniquely, includes auto revision functionality, allowing the Accelerator to continue revising the thermowell dimensions after a failed calculation until it finds a passing solution.

Rosemount Thermowell Design Accelerator can execute thermowell calculations up to 90% faster by eliminating many of the manual design tasks.

Another feature that makes the software unique is its ability to not only recalculate failed tags, but also automatically generate thermowell and sensor model numbers that are specific to the solution that meets the application’s process conditions.
In addition, to ensure the most current standards are being used, all information from the software is based on the ASME PTC-19.3 TW standard.
In situations where a traditional thermowell won’t work for the specific application, the software can recommend a different type of product to meet the needs of the application.
Among those products are the Rosemount Twisted Square™ ermowell and Rosemount X-well™ Technology. e Rosemount Twisted Square dampens the effects of the vibrations on the thermowell, thus making it a more robust solution. is is achieved by using a unique helical-shaped stem profile that is designed to eliminate more than 90% of the dynamic stresses that a conventional thermowell would experience. is design allows for operation at higher fluid velocities.
It is also designed to improve the reliability of a thermowell and to reduce the risk of thermowell failures with changing process conditions, including start-up, shutdown
or unintended events. In addition, because of its ability to withstand harsher process conditions, the Rosemount Twisted Square allows for insertion lengths that reach the middle of the pipe for highest temperature measurement accuracy. e Rosemount Twisted Square ermowell can easily be expanded to new applications and can reduce inventory since one thermowell fits a range of requirements.
Rosemount X-well Technology is Emerson’s non-intrusive solution to accurately measure process temperatures without using a thermowell. It features a patented thermal conductivity algorithm and, with an understanding of the thermal conductive properties of the temperature measurement assembly and piping, can calculate internal process temperatures with accuracy on par with a traditional thermowell. In addition, Rosemount X-well Technology simplifies measurement point specification, installation and maintenance while reducing possible leak points.
To avoid the complexities of thermowells, or if a thermowell solution is not possible for an application, Emerson offers Rosemount X-well Technology which accurately measures process temperature without a thermowell.
e Rosemount ermowell Design Accelerator can help turn a once timeconsuming and tedious process into an efficient and accurate thermowell design solution. Whether it is recommending a traditional thermowell or an alternate approach, you can trust the Rosemount ermowell Design Accelerator to give you the best possible temperature measurement solution for your application.
When it comes to accurately measuring the temperature of the flow inside a pipe, the thermowell has long played an essential role. It brings the sensor into close, conductive proximity with the process fluid while also protecting the sensor from often harsh conditions. But the thermowell also comes with several installation challenges.
First, installation of a thermowell into a pipe requires a shutdown of the process, directly affecting productivity. Pipe modifications, such as welding or cutting, are required to install a thermowell, and classified environments may need to be fully cleared of explosive hazards for the work to be performed.
In addition, small line sizes present a challenge. Stem conduction of ambient heat sources can impact measurement accuracy when the immersion depth is less than 10 times the thermowell tip diameter. It is often impossible to achieve this immersion depth in small line sizes without significant modifications to the pipe, such as adding a tee.
Finally, installation of a temperature measurement solution becomes more challenging when components are sourced from multiple vendors and made to fit properly. Assembling components from multiple vendors complicates and lengthens the overall installation process.
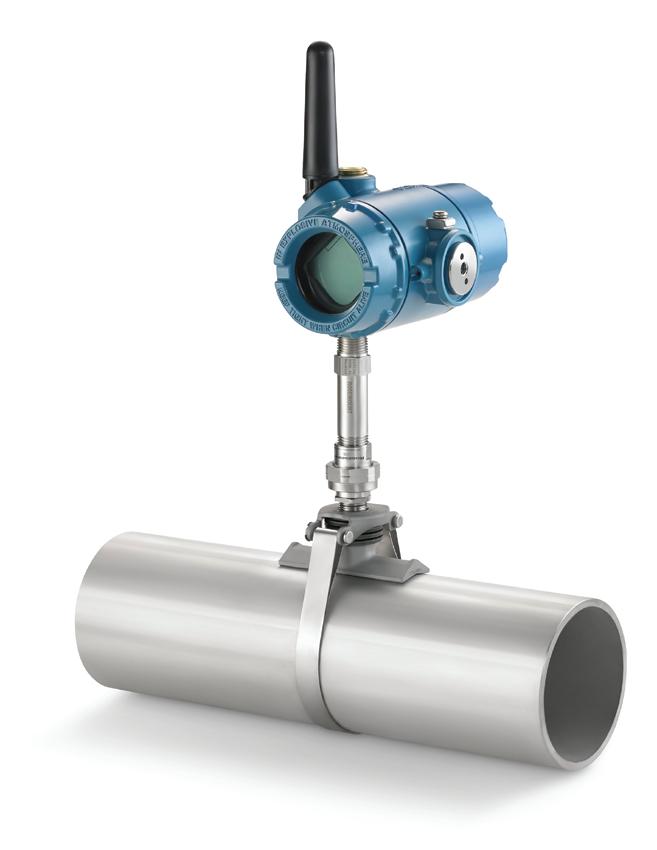
With these and other thermowell-related challenges in mind, Emerson developed Rosemount X-well Technology, which measures process temperature without the need for a thermowell. This technology is non-intrusive, as the instrumentation attaches around the outside of the pipe. When installing Rosemount X-well, users don’t need to shut down the process because the instrumentation isn’t going inside the pipe, in sharp contrast to thermowell installations. Instead, the sensor contacts
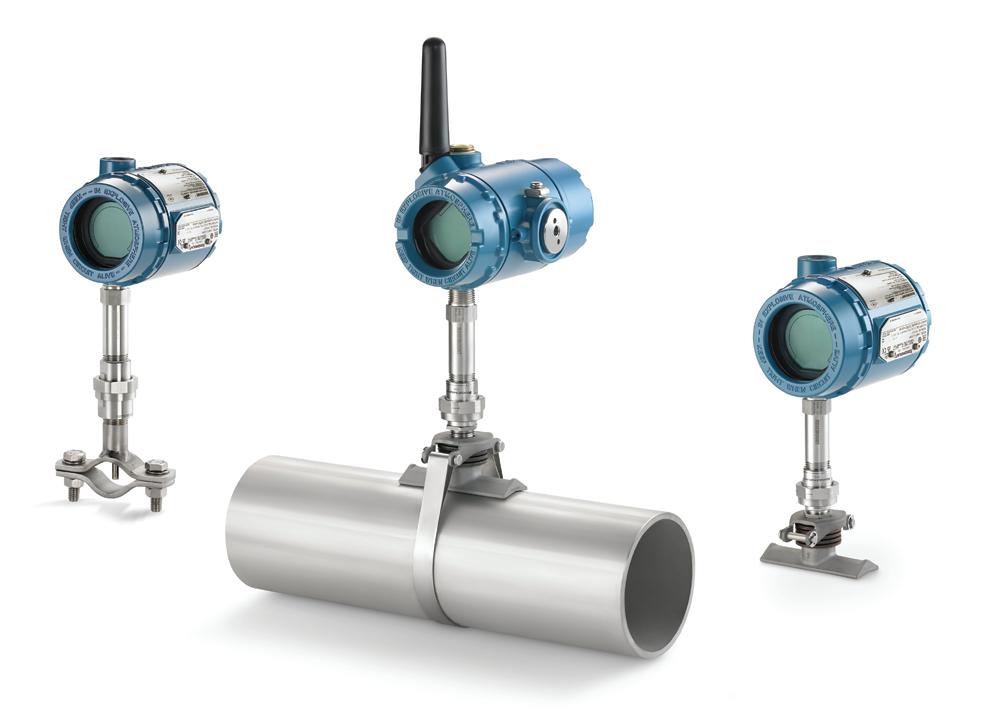
Rosemount X-well Technology accurately measures process temperature without the use of a thermowell or process penetration, thus avoiding process shutdowns to install a new temperature measurement point.
only the outside surface of the pipe, resulting in a 75% reduction in overall installation time.
Rosemount X-well Technology is available with either the Rosemount 3144P Wired Temperature Transmitter or the Rosemount 648 Wireless Temperature Transmitter. Using the wireless transmitter option provides additional benefits of not having to run new wires to the device for power and communications. As a result, wireless instruments are routinely commissioned in less than an hour, leading to an even greater reduction in overall installation time.
Rosemount X-well Technology uses a built-in algorithm to extrapolate the internal process temperature based on surface temperature, plus the conductive properties of the pipe (composition and thickness). This delivers temperature measurement accuracy in line with that of a sensor in a traditional thermowell. Plus, Rosemount X-
well does not encounter the issues that often make thermowells inaccurate for line sizes smaller than 5 inches.
Rosemount X-well Technology is also suitable for any applications that have high-velocity, abrasive material within the process or corrosive processes that dictate an exotic material for the thermowell. It also makes sense for any application where a traditional thermowell path is too costly or too complicated.
One European chemical maker recently utilized Rosemount X-well Technology with Rosemount 648 Wireless Temperature Transmitters to further simplify the installation of 65 temperature measurement points to determine flowrates via energy balances for a heat exchanger that was particularly sensitive to erosion. The solution was commissioned in under an hour and seamlessly connected to the existing wireless infrastructure without process shutdown or production loss.
multiple shipments and lead times from separate vendors. Plus, different sources of each of those components can require time-consuming workarounds to accommodate unanticipated incompatibilities.
Sizing the thermowell and the sensor together is more complicated if you purchase them from different sources. It can increase the risk of a misfit—either the sensor’s too long and it won’t fit in the thermowell, or the sensor’s too short, which could lead to measurement inaccuracies if the tip of the sensor is not making contact with the inner wall of the thermowell.
Emerson offers full integrated temperature assemblies that are ready to install upon arrival at your facility.
Universal Pipe Mount’s cut-to-fit banding design brings new functionality to this technology. Standardized units can be stocked in inventory, installed, moved, and reinstalled on pipes of different line sizes. This provides value to operators, as they can rapidly deployment measurement solutions from their standardized inventory in emergency situations. They can also use a single device to validate several existing insertion measurement points over time.
Overall, for those looking to avoid installation and other thermowell challenges, but want to obtain accurate process temperature measurements, Rosemount X-well Technology is your go-to solution.
For those applications where a thermowell still makes sense, another Emerson approach that significantly streamlines installation time and effort are fully integrated solutions that include sensor, transmitter and thermowell already fully assembled and ready to install.
This approach offers advantages from a procurement standpoint, eliminating the need for multiple quotes and purchase orders. In addition, it avoids the management of
Meanwhile, each temperature transmitter must be configured to match the sensor type that’s being wired. If the user buys them pre-assembled from the same vendor, this extra step is eliminated. Separate sourcing also creates extra work when it comes to wiring in the field. Separately purchased transmitters require the sensor to be physically wired to the terminal block.
Users can achieve a higher level of performance when the transmitter and sensor are ordered together by specifying Callendar-Van Dusen (CVD) constants. These are coefficients that characterize how a specific resistance temperature detector (RTD) operates at different temperatures. Sourcing components together makes it easier to achieve transmittersensor matching because Emerson can preconfigure the transmitter with CVD constants for that specific RTD at the factory. There’s no manual entry of the constants into the transmitter as would be required to pair an RTD from one company with a transmitter from another.
Emerson’s complete point solutions and Rosemount X-well Technology give process industry users streamlined and non-intrusive temperature measurement solutions that help reduce the time and effort spent during the installation process.
In the list of sentences that operators and plant managers don’t want to hear, “We need to shut down the plant” ranks near the top of the list. Unplanned shutdowns can have a significant impact on the profitability of a business. Furthermore, accurate process measurements throughout an operation are critical to the quality, safety and yield of the process. That’s why continuous measurement in process control applications is essential. To operate continuously, users face two main challenges: performance optimization, ensuring sensors are working properly and electrical noise interference is minimized; and accuracy optimization, ensuring that the sensor physically accesses the most representative measurement point.
Temperature measurements can experience a multitude of issues that impact plant operation. Despite protective measures, sensors are prone to failure and degradation that can cause a loss of measurement integrity. Sensors can also have small voltages (known as thermal electromagnetic fields, or EMFs) build up in their wiring and can cause inaccuracies in temperature readings due to a resultant change in resistance.
In addition to issues with sensor failure and degradation, environmental factors can have a significant impact on the quality of a temperature reading received by the control system. Transmitter wiring can be susceptible to electrical noise and vibrations. Suboptimal conditions are commonly found in installations near blowers, pumps and compressors. Transient events such as lightning strikes or electrical discharges can cause inaccurate readings, which lead to false alarms. Such alarms can result in a shutdown of the process and require operations personnel to perform a check on the sensor.
Critical control or custody transfer applications, such as batch reactors, lease automatic custody trans -

Emerson’s Hot Backup Capability will automatically switch to a secondary sensor if the primary sensor fails.
fer (LACT) skids, and safety loops require a high level of temperature measurement accuracy. Often, resistance temperature detector (RTD) sensors are used to take such measurements. These sensors work by measuring resistance changes in a temperaturesensitive alloy; and the accuracy of that correlation can be affected by errors and inconsistencies introduced during the sensor’s manufacture.
Accuracy of a temperature measurement can also be impacted by the immersion length of the thermowell used to protect the sensor. The highest level of accuracy and time response in a pipe application is obtained by inserting the tip of the thermowell (along with the tip of the sensing element) into the very center of the pipe. However, this goal is often not achieved, as thermowell length sometimes must be reduced to endure harsh process conditions and vibration stresses.
Emerson offers a range of solutions to help tackle these challenges and to better ensure continuous temperature measurement and operation. These include Transmitter-Sensor Matching, the Rosemount™ Twisted Square™ Thermowell, and a range of advanced diagnostic features included in Rosemount Temperature Transmitters.
Temperature transmitters improve the performance and reliability of industrial temperature measurements. They are commonly used in the chemical, oil and gas, refining, food and beverage, life sciences and many other process industries. Rosemount Temperature Transmitters are available with a suite of sensor and environmental diagnostic features that help users proactively identify and address issues before they impact productivity or safety.
One of these features is Emerson’s Hot Backup™ Capability. This capability features a redundant, dual-input sensor configuration designed to mitigate the effects of a failed sensor. If the primary sensor fails, the transmitter will automatically switch to the secondary sensor.
The Hot Backup feature also displays an alert indicating that the primary sensor has failed so that it can be replaced. This capability is especially beneficial for critical applications where a failed sensor and subsequent lost measurement could cause safety concerns.
Emerson’s Rosemount Temperature Transmitters also offer several advanced diagnostic features to limit the impact of environmental conditions on the accuracy of a temperature measurement. One of those diagnostic features is transient filtering, which prevents intermittent transient signals (such as those resulting from an electrically noisy environment or high vibration) from affecting the measurement. By disregarding apparent temperature spikes, sensor signal interruption is prevented and the last known reliable temperature value continues to be transmitted, thus saving a potential process upset or trip condition.
Another useful diagnostic feature is Open Sensor Hold-Off. Based on calculations performed by the trans-
mitter, this feature determines whether a high-voltage transient event (i.e., lightning or electrostatic discharge) or an actual open sensor event has occurred. Inaccurate open sensor conditions can cause unnecessary alarms. To avoid these alarms, the transmitter ignores the outlier and outputs the previously established value.
Additionally, Rosemount Temperature Transmitters are equipped with an electromagnetic field (EMF) compensation feature. This diagnostic analyzes sensor loops and compensates for the thermal EMFs, resulting in more accurate temperature readings.
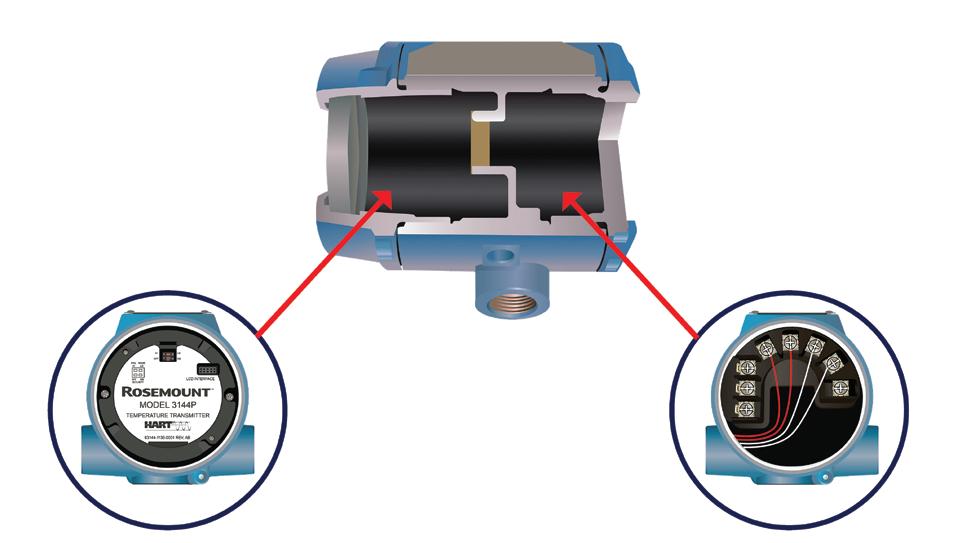
Apart from their diagnostic features, Rosemount Temperature Transmitters are available in a variety of form factors and housing styles to optimize their performance based on the needs of the application. Of the available form factors, the field mount is the most robust design. This solution features a dual compartment housing, meaning that the device electronics are in a separate chamber from the terminal block. This helps prevent the presence of moisture (from humidity or other sources) and subsequent corrosion of the device electronics.
Thermowells that must be shortened from their optimal length to withstand an application’s process conditions necessarily forfeit some degree of accuracy. Emerson’s innovative solution, the Rosemount Twisted Square Thermowell, features a unique helical stem profile that reduces dynamic stresses by more than 90%. This reduction in vibrational effects allows for the tip of the thermowell to rest in the center region of the pipe, allowing for the most accurate measurement possible.
In some cases, users can live with the error associated with the actual resistance curve of an RTD. In critical control and custody transfer applications, however, this error can be detrimental to the plant’s operation. Fortunately, Emerson’s temperature transmitters have the option to be specified with a Transmitter-Sensor Matching option. Transmitter-Sensor Matching decreases the error associated with the total measurement by up to 75%.
‘This reduction in error is achieved by programming the four constants from the sensor’s Callendar-Van Dusen equation into the transmitter. When specified with the Transmitter-Sensor Matching option, Emerson programs the transmitter with the appropriate constants from the factory, allowing users to achieve highly accurate temperature measurements that reliably optimize operational performance.
Once designed and installed correctly, maintaining temperature measurement accuracy and operational integrity over the long haul becomes the focus. Proper maintenance of a temperature measurement point can help reduce the risk of measurement failure as well as ensure ongoing accuracy. High-quality resistance temperature detectors (RTDs) can be extremely stable, but thermocouples can begin drifting as soon as they are put into operation. All temperature sensors, even high-quality ones, can degrade over time due to harsh process and environmental conditions.
Sensor degradation can lead to an abnormal measurement condition called on-scale failure. This is the indication of a valid measurement value that appears to be within process alarm limits, when the data is, in fact, inaccurate. If personnel cannot identify atypical temperature behavior such as on-scale failure, they might be unaware of problems occurring within the process. This lack of awareness can lead to unnecessary process shutdowns and safety issues, as well as negatively impact process efficiency and quality.
Diagnostic innovations have advanced the continuous maintenance capabilities for process instrumentation and sensor health monitoring, giving users confidence in both instrument performance and measurement accuracy. Emerson’s Rosemount™ Temperature Transmitters feature advanced diagnostic capabilities that help proactively identify issues before they impact productivity and provide information to the right people at the right time, resulting in faster decision making.
The Thermocouple Degradation Diagnostic monitors the resistance in a thermocouple sensor loop. This diagnostic notifies operators of an increase in sensor loop resistance, which can indicate that the sensor is deviating from the true temperature value and potentially failing.
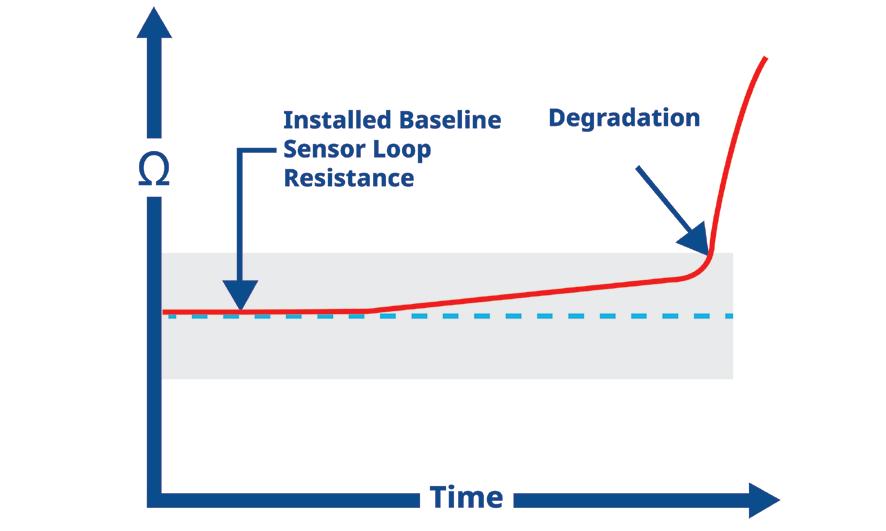
T/C Degradation alerts users of a degrading sensor by detecting loop resistance.
It lets users set a resistance limit for each unique installation. For example, if a plant’s standard installation is running at 30 ohms, the transmitter can be set to alert technicians if it hits a threshold of twice the baseline, or in this case, 60 ohms. Once it hits the threshold, the transmitter will keep the process operating but send an alert.
Another diagnostic available in Rosemount Temperature Transmitters is Measurement Validation. It works by evaluating sensor noise. Before a sensor fails, it will exhibit signs of degradation such as increased signal noise, which will often result in inaccurate but transient on-scale readings. Measurement Validation monitors the signal noise and uses it to calculate a deviation value, indicating the magnitude of the noise, which is compared to a user-selected alert limit. If this limit is exceeded, the user is notified, allowing action to be taken.
Measurement Validation can detect increases in signal noise due to loose or corroded connections, high vibration levels or electronic interference. In addition to detecting on-scale failures as a result of these conditions, Measurement Validation also performs a rate of change calculation
Transmitters
to differentiate abnormally fast temperature changes due to sensor failure from actual temperature swings.
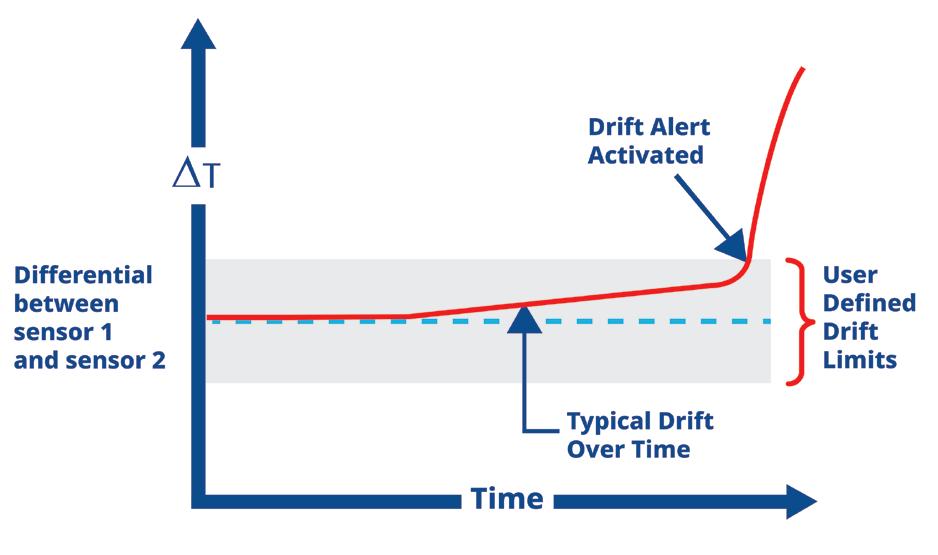
Sensors are sometimes prone to drift, especially when exposed to extreme process conditions. Sensor drift is a common issue found in the chemical, refining and power industries and in applications such as coker heaters, crude vacuum distillation units, furnaces and hydrocrackers. Drift can have a significant impact on the accuracy and reliability of sensor data. Gradual, subtle changes in the sensor happen over time, causing discrepancies between the true process temperature and the output of the sensor.
For transmitters with dual sensor input capability, Sensor Drift Alert is another diagnostic tool that provides insight into sensor health. Sensor Drift Alert works by measuring two sensors simultaneously and monitoring the temperature difference between them. If one starts to drift, the other can be relied upon to continue to provide accurate data until the failing sensor is replaced. Because there are two readings for the same measurement point, technicians are quickly alerted if the readings diverge.
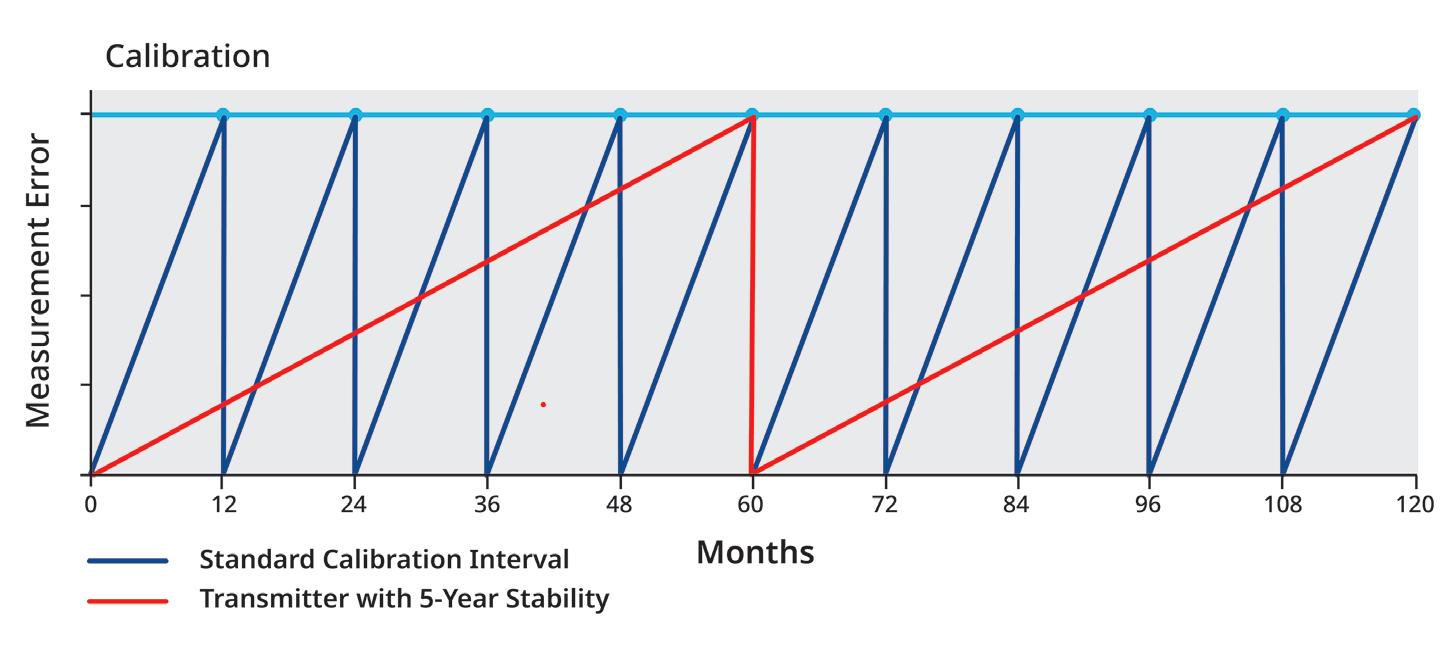
Another important component of maintenance of a temperature measurement point is calibration frequency. When using Rosemount Temperature Transmitters, it is possible to calculate the frequency needed for calibration, as the stability specification plays a large role in how often they must be recalibrated.
For example, the Rosemount 3144P Temperature Transmitter has a five-year stability specification. Users should take into account a transmitter’s stability and accuracy specifications in conjunction with their own onsite requirements to calculate how often units should be inspected. This approach can often extend the calibration interval, freeing maintenance personnel to do other important tasks.
Maintaining accurate instrumentation is a vital element in the productivity of a process. Temperature sensors will degrade over time, and the inability to monitor this behavior can lead to false alarms, lower product quality, energy inefficiencies or process shutdown. Emerson’s Rosemount Temperature Measurement Solutions are designed to help maintain accurate instrumentation and keep your process up and running over the long term. Advanced diagnostic capabilities also help users do more with less by enhancing overall operations, augmenting the capabilities of their front-line teams, and empowering them to direct their efforts towards the highest value-added tasks.
As people around the world demand a more sustainable way of life, process industries need innovative solutions that are proven safe, reliable, and efficient. Emerson’s Rosemount Temperature Measurement Solutions are designed to tackle the most challenging process design, installation, operation and maintenance challenges to ensure industry can meet its safety and sustainability goals. In addition, the MyEmerson portal serves as go-to source for the necessary service, education and training to make this vision a reality.

Emerson’s Rosemount™ X-well™ Technology delivers accurate and reliable process temperature measurements without a thermowell. Simplify design, installation, and maintenance, and save up to 30% on lifetime costs per temperature measurement point.
Learn more at www.Emerson.com/Rosemount-X-well
In part two of this series, agrochemicals producer Syngenta shows how it implemented Seeq software to identify production losses, increasing operational efficiency and profitability.
by Dr. Stephen Pearson and John W. CoxUNDERSTANDING asset utilization is key to maximizing productivity in any industrial process. In manufacturing, production can be held up by mechanical breakdowns, material shortages, external delays, operator errors and equipment degradation.
In part one of this case study (Control, Oct ‘23, p. 13, bit.ly/QuantifyingManufacturingTime), we showed how advanced analytics can classify lost productivity with a basic set of assumptions, without requiring operatoror equipment-provided reason codes. This enables fine-tuned targeting to deploy limited resources where improvements are most likely and impactful.
When investigating deviations from ideal profiles, multivariate correlations between sensors must be considered in addition to individual sensor profiles (Figure 1). Frequently in industry, we find the low-hanging fruit of univariate issues have already been solved, increasing the likelihood that chronic issues are multivariate in nature.
In part two, we demonstrate how Seeq was deployed at Syngenta to benchmark operations against ideal practices, and identify operational anomalies using univariate and multivariate approaches.
Benchmarking against the best (univariate)
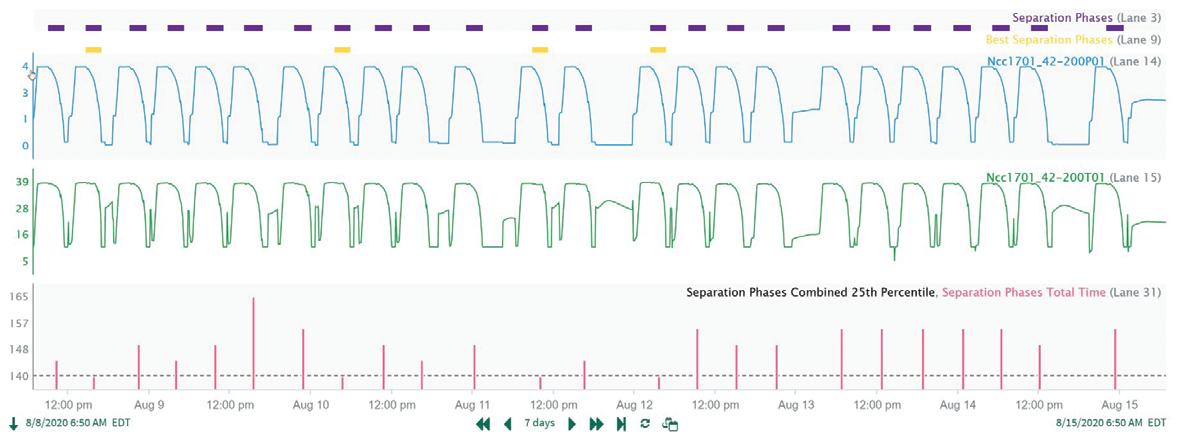
The fastest 25% of batches can be used to create a reference profile for each relevant process sensor, for example, those that directly impact phase duration or product quality. Slower batches in the upper percentiles can be compared to this reference profile to look for possible delay causes. Rather than targeting the entire batch profile, attention is given to phases responsible for a high proportion of losses.
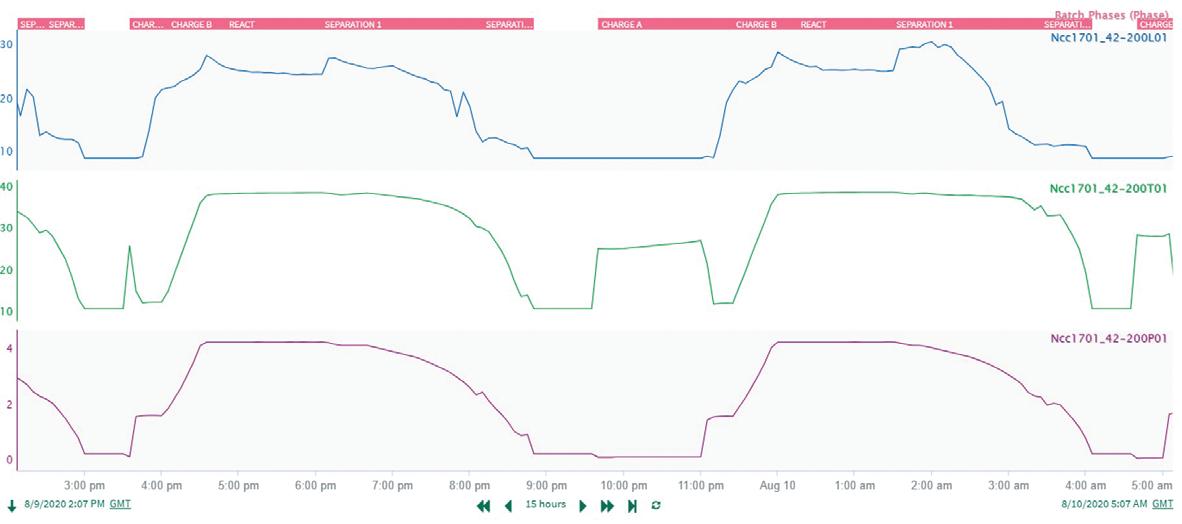
To illustrate this, focus can be applied to the combined separation phases, where characteristic temperature and pressure profiles are known to directly influence overall batch quality.
The “best separation phases,” a subset of all the “separation phases,” are identified quantitatively, based on a duration of less than or equal to the 25th percentile benchmark. These results can be easily examined by users (Figure 2).
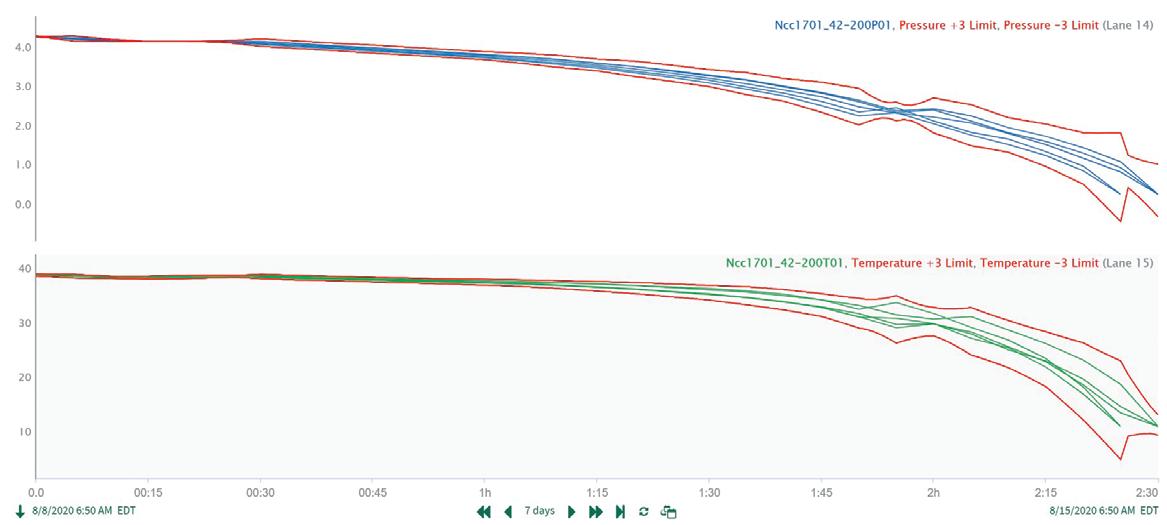
Next, “golden” or best profiles for temperature and pressure signals are calculated as the ±3 standard deviation limits, based only on data from the best separation phases (Figure 3).
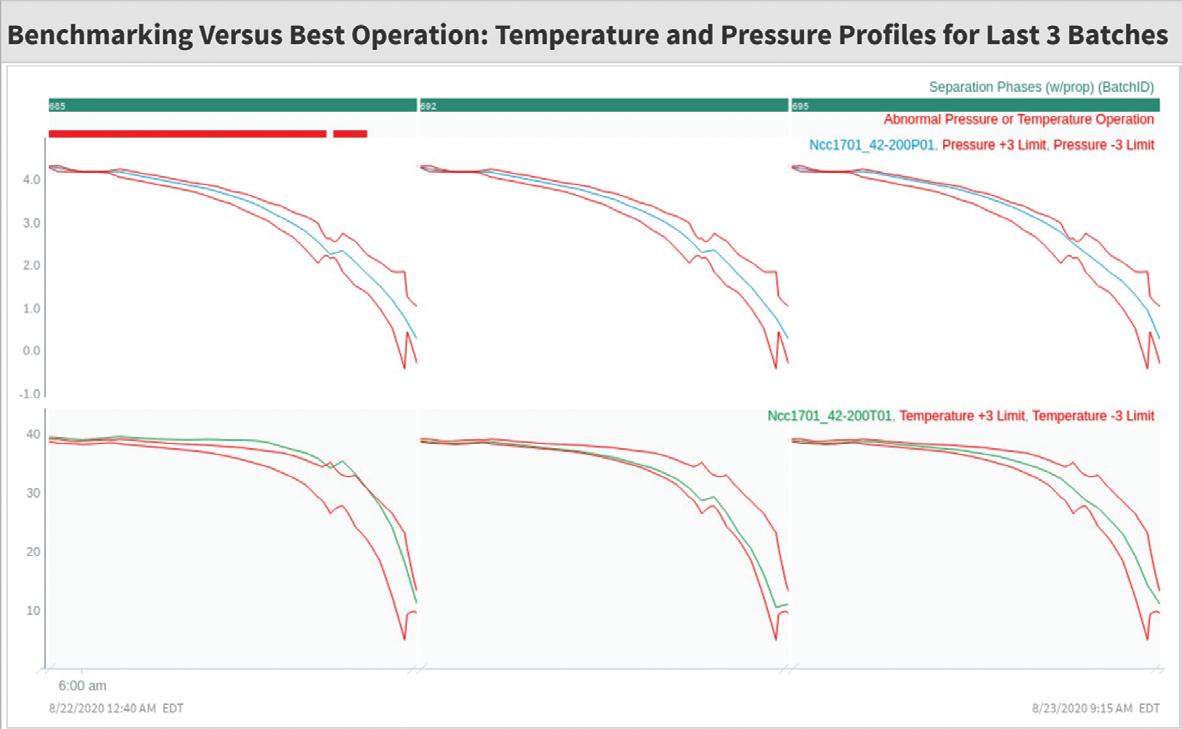
With the best operation profiles developed for temperature and pressure, current operations can be benchmarked using autoupdating reports easily shared with operations teams. Here, reporting date range functionality displays the last X number of batches (where X is user-configurable), and abnormal deviations are highlighted whenever temperature or pressure falls outside of best operating limits (Figure 4).


With this approach, any relevant signals can be monitored univariately to identify operating issues in a timely manner.
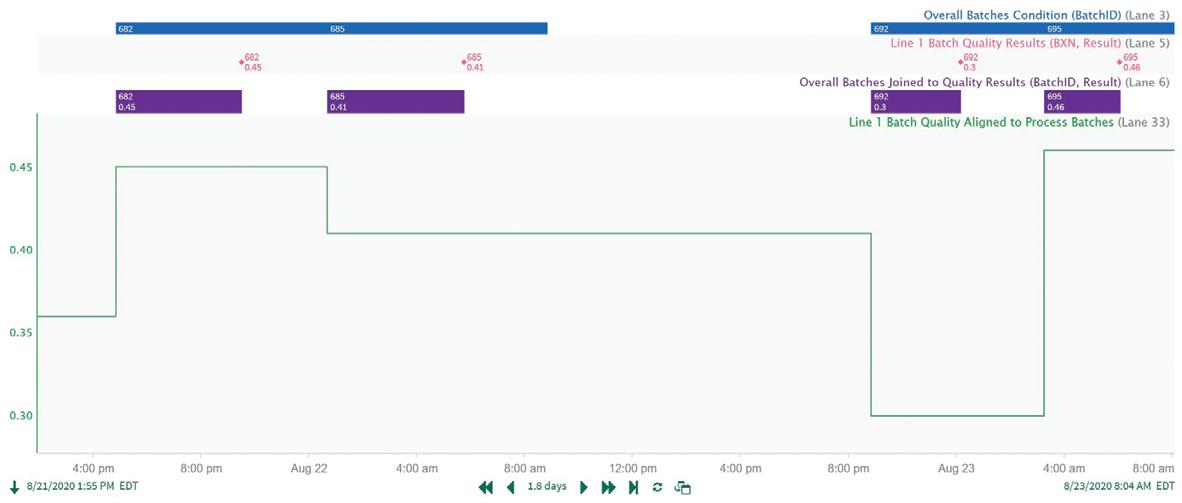
Connecting the quality result to corresponding process batch data can be challenging because this result is commonly lab-measured and reported at varying time intervals following completion of the process batch. Seeq provides a single-line, built-in formula function to join batch and qualityresult time periods just above in the trend, based on matching batch number values (“Overall batches joined to quality results,” Figure 5).
From this point, with quality results automatically transferred as a capsule property on the resulting condition, it’s easy to create the “Line 1 batch quality aligned to process batches” as a signal representing the quality result, which is shifted back in time by varying amounts to align with the batch operation.
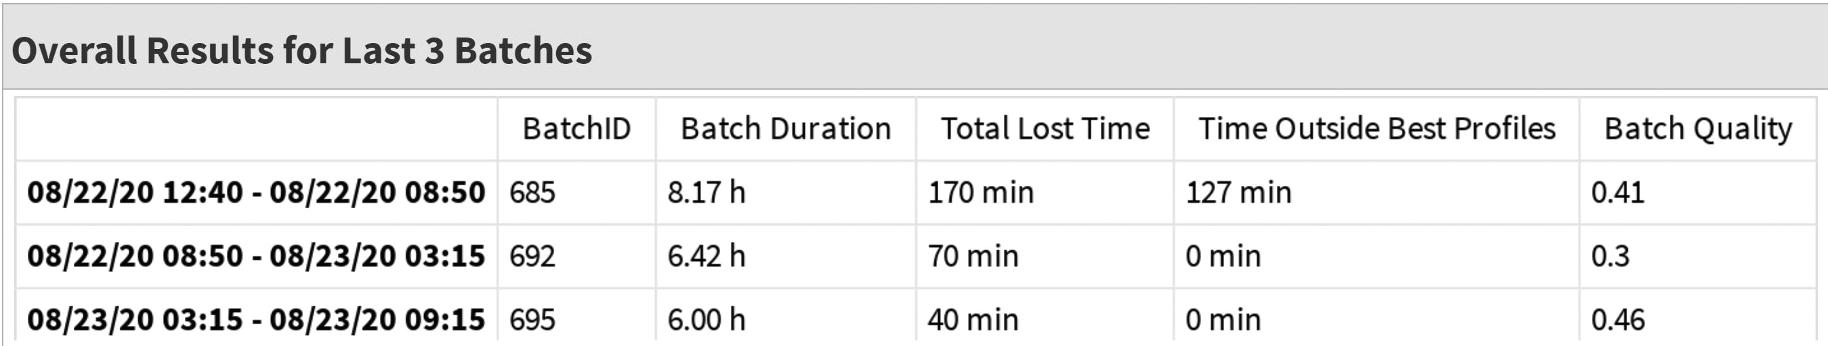
With quality results now listed, along with lost time and time outside best operation metrics in the monitoring dashboard (Table 1), users can rapidly identify which batches merit investigation, and whether the anomalies resulted in inadequate quality or waste.
This lets users differentiate between lost productivity due to different operating profile characteristics compared to other causes.
Benchmarking against the best (multivariate)
While anomalies in single process variables are often easy to detect visually, multivariate issues are typically more complex. Sometimes, profiles for various sensors may be within the individual reference boundaries, but combinations of profiles can create unexplained quality issues.
These multivariate anomalies can be difficult to detect, but they’re critical to understanding underlying causes of lost productivity and
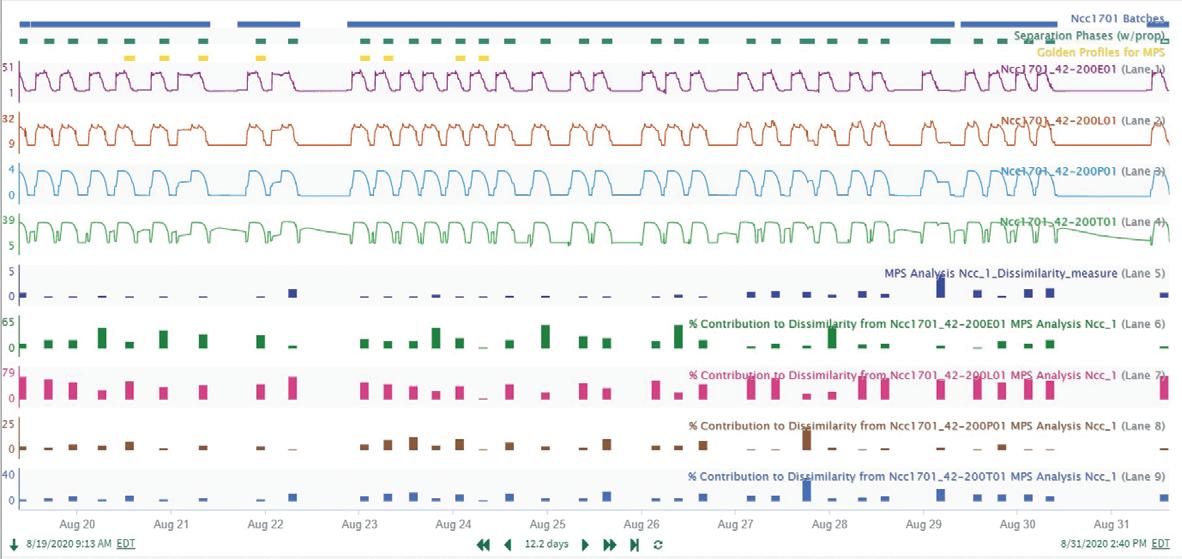
inferior quality. To identify these anomalies, Syngenta used the multivariate pattern search (MPS) function in Seeq to make multivariate comparisons of batches against a reference
or “golden” set. After training on the best historical separation phases, MPS produces overall “dissimilarity” and individual signal dissimilarities for each batch (Figure 6).
The resulting MPS model can be used in near real-time to monitor dissimilarities for each of the recent separation phases. In Table 2, Batch 747 was the most dissimilar to the historical best separation phases during the time of analysis. In particular, the L01 signal for Batch 747 was the most dissimilar,
and it contributed the most to anomalous operation.
These sorts of diagnostic insights enable users to investigate suboptimal operation in a targeted, streamlined manner, identifying many process improvement opportunities.
The next investigative step at Syngenta was generating a capsule view
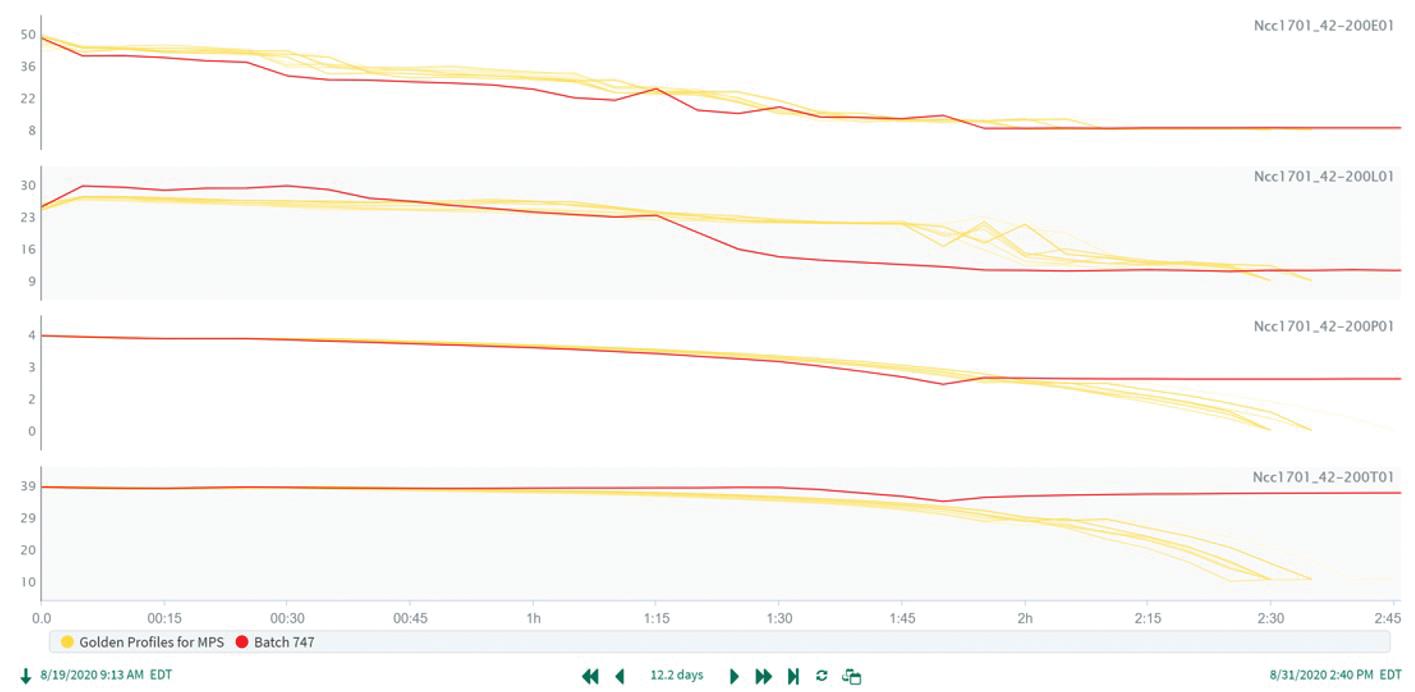
trend to compare Batch 747 data to the best operation profiles (Figure 7).
This showed signal L01 with the largest deviation from ideal. With this information, a user can apply process expertise to understand the contrast of the L01 profile with the best operational time periods, which can lead to improvements that eliminate this issue in the future.
Syngenta identified multiple areas for operational optimization by leveraging modern data analytics in Seeq, identifying operational anomalies using univariate and multivariate approaches, and benchmarking current operation against ideal profiles.
Multivariate approaches can reveal valuable insights that aren’t easily detected via visual inspections of signal trends. Alo, subject matter experts can efficiently examine individual batch profiles in the same trending and visualization software environment to identify further actionable root causes from process sensors. By leveraging modern software, companies can implement process improvements to increase productivity and maximize uptime in their manufacturing environments.
Dr. Stephen Pearson is a principal data scientist at Syngenta. He helps manufacturing sites improve data management and analyses. John Cox is a principal analytics engineer at Seeq, where he works on advanced analytics use cases.
 JOHN REZABEK Contributing Editor JRezabek@ashland.com
" While RTDs are inherently more accurate and linear than thermocouples, they’re not perfectly linear, and each sensor deviates from the established tables to some degree."
The path to temperature certainty requires proper testing at the operating point
I happened upon one of Scott Adam’s “Dilbert” comics, where his pointy-haired boss asks, “Are you sure the data you gave me is correct?” Dilbert replies, “I’ve been giving you incorrect data for years. This is the first time you’ve asked.” I can relate. What’s my answer if my boss asks the same question?
It’s generally accepted that a platinum resistance temperature detector (RTD) will achieve better accuracy and stability than a thermocouple, where two dissimilar metals are joined and produce a millivolt signal in proportion to the difference in temperature between the two junctions. Out of the box, a standard 100-ohm platinum RTD will have better than 1 degree accuracy below 100 °C, with increasing uncertainty as the measured temperature increases. Some vendors offer RTDs for specific ranges or maximum temperatures. If your process is running at 751 °F/40 °C, the path to temperature “certainty” most likely requires a test at the operating point.
Whether you have an in-house calibration capability or rely on your supplier, a temperature “bath”—an apparatus for applying a known temperature to the sensor of interest— is often used. The temperature of the bath is typically measured by a National Institute of Standards and Technology (NIST)-certified or a NIST-traceable temperature sensor. For a fee of a few hundred dollars to maybe around $20,000, NIST will characterize a given sensor against other certified sensors or “triple points” (melting points) of various fluids. The triple point of water is around 0 °C (at specific pressure conditions). NIST uses the melting points of various other substances from near absolute zero to more than 1,000 °C to “standardize the standards.”
Once compared to the NIST-traceable sensor in one’s temperature bath, you might find yours is deviating at some points of interest. While RTDs are inherently more accurate and linear than thermocouples, they’re not
perfectly linear, and each sensor deviates from the established tables to some degree.
British physicist Hugh Longbourne Callendar labored to elevate the RTD as an accurate temperature sensor, and his equation relating resistance to temperature was later refined by NIST chemist M.S. Van Dusen. For a specific sensor, your temperature transmitter might have the capability to include the CallendarVan Dusen coefficients, which provide a characterization of temperature to that sensor’s resistance, improving accuracy versus standard tables and linearization.
If you’ve pursued certainty, you might feel comfortable, but you’re not finished. Since you’ve established a relationship between resistance and temperatures, you must now measure that resistance at the tip of a probe that might be many feet away (some elements are more than 50 ft. long). A change of 1 °F changes a standard 100-ohm platinum RTD’s resistance less than 0.2 ohms at 750 °F. RTDs are commonly supplied in three- or four-wire varieties, permitting the transducer to subtract the resistance of the conductors and terminations between the sensor and the transmitter. Both lead wire and RTD must be measured with comparable accuracy.
Interest in improved accuracy motivates some to locate a transmitter as close as possible to the sensor. While this is likely better than a kilometer of lead wire, the influence of ambient temperature on the transmitter might be worth a look. Unless the transmitter is digitally integrated using fieldbus, you’ll have uncertainty introduced through D/A (generating a 4-20 mA signal) and the corresponding A/D at the DCS or PLC I/O card.
When operators or my boss ask me how sure I am that their reading is correct, I can reply it’s as good as the standard to which it was calibrated on the day it was calibrated. Who knows what other vagaries of uncertainty might have crept in since then?
Context is critical for process information, so mobile displays must be able to handle the job
LOOK around. How many people do you see staring at their phones or tablet PCs? One reason is because mobile devices provide people with everything, all in one place.
Despite regulations in some jurisdictions— where work stays within working hours—the expectation for individuals to at least be able to connect from anywhere at anytime now extends to information from the real-time control realm. The thin edge of this wedge is remote access to diagnostic information on complex equipment with high impacts in the event of failure, such as compressors. However, once the infrastructure for making this happen is in place, the barrier to entry is significantly lower, and we can do the same thing for motors, process analyzers, etc.
Of course, this information needs to support different form factors to satisfy our curiosity about how things are going. The same platforms allow us to reach out from wherever we are, provided we don’t require a full-size, 1,920 x 1,080 pixel display to get the level of detail required to understand the situation— or satisfy our curiosity.
Unfortunately, a cell phone isn’t the same size as an HMI. It can be used to display specific information remotely, but most HMIs are now web-based, and it’s unlikely mobile displays can present information in context, at least not all at once. Understanding the context of information is critical, particularly for process operations. For example, even “accidentally” affecting a variable while viewing diagnostic information can have unintended and potentially catastrophic consequences.
One possible solution is to develop HMIs based on human factors. The design principles may have new schematic types with better KPIs to provide what users need. Similar to the “map app,” they can zoom in on the detail needed to make correct decisions.
Having information with context is consistent with another expectation of devices that
are always connected—the ability to have or find context on the same platform either through a search engine or intelligent links between different data points. To achieve this capability, an HMI is no longer a series of static displays of process information, but a view to equipment health status, manuals, performance metrics and statistics. Making something available doesn’t mean the user should have access to it, especially as awareness of OT systems as the “easy” backdoor increases in the hacker community.
Fortunately, as we learned during the COVID-19 pandemic, adding more remotely connected “bring your own devices” is simply another permutation of the work-from-home concept that was already in progress in part due to demographics prior to the pandemic. The ability to manage increased surface area by implementing practices such as zero-trust is better understood now with the tools in place to implement and support it.
Just as with any technology transition, the adoption curve also needs to be considered. One factor in adoption is the expectations of the audience. Newer workers, who have always had context-sensitive interactive displays available, are more likely to accept and expect similar (interactive) capabilities from their HMI devices. Meanwhile, workers at the other end of the work spectrum, though familiar with new display technologies, are often happier leaving well enough alone and avoiding the risks associated with change.
The dichotomy of generational expectations, included potentially in future immersive environments, and added guidance from artificial intelligence to capture and incorporate not only procedures but also knowledge of experienced workers, will certainly impact future HMIs. One thing is certain, being tethered to a single location by a cable to access process information is no longer necessary, and for many technologies, it’s not even feasible.
 IAN VERHAPPEN Solutions Architect Willowglen Systems
Ian.Verhappen@ willowglensystems.com
IAN VERHAPPEN Solutions Architect Willowglen Systems
Ian.Verhappen@ willowglensystems.com
“The ability to manage increased surface area by implementing practices like zero-trust is better understood now with the tools in place to implement and support it.”
IF the diffuse and multivariate process industries have a bellwether for what’s going on and the undercurrents they share, the ARC Industry Leadership Forum is it. That’s why close to 800 visitors attended the 28th annual event on Feb. 4-8 in Orlando, Fla., where they listened to and interacted with close to 200 speakers, who focused on cybersecurity, digitalization, artificial intelligence (AI) and sustainability.
“We’ve delivered energy and products for 140 years. Even as alternative sources of energy ramp up, oil and gas will continue to play a role in meeting energy needs for decades to come," said Wade Maxwell, engineering VP at ExxonMobil Technology & Engineering Co. (corporate.exxonmobil.com), during his keynote address on Feb. 6 at the ARC Industry Forum in Orlando, Fla. "However, we also need innovative technologies to handle new and diverse energy sources, so we can meet society’s energy and product needs and reduce emissions.”
Maxwell reported these efforts include:
• Carbon capture and sequestration (CCS)—ExxonMobil has captured about 150 million metric tons of CO2 over the past 30 years. It’s working on accelerating CCS deployment, and establishing a CCS business together with other companies with the potential to capture and store more than 100 million metric tons annually (MTA) of CO 2 per year on the U.S. Gulf Coast.
• Hydrogen—ExxonMobil is one of the world’s largest hydrogen players, producing and consuming more than 1 million tons each year in its refining and chemical operations. It’s announced plans for the world’s largest, low-carbon hydrogen facility at a planned startup in Baytown, which is
expected to produce 1 billion cubic feet of low-carbon hydrogen per day, and capture 98% of the CO2 produced by the facility.
• Sustainability—ExxonMobil is investing in projects to develop lower-emissions fuels, such as renewably produced diesel at a new plant in Canada. This site has a capacity of 20,000 barrels per day. ExxonMobil also plans to increase plastics recycling to 1 billion pounds per year by 2026.
• Efficient operations—Consists of better methane detection, improved equipment inspections by drones and other robots, and more efficient operations using advanced process control and reduced flaring.
• Artificial intelligence (AI)—For accelerating technical development, more effective knowledge management, subsurface modeling, and concept analytics and development optimization, which uses mathematical models to identify net-zero pathways, and to optimize production and manufacturing operations.
• Standards and Interoperability— Relies on open standards such as Open Process Automation (OPA) to bring value and ExxonMobil encourages the process industries to adopt open, secure, standards-based automation systems.
Mike Carroll, innovation VP at Georgia-Pacific (www.gp.com), reported these and similar efforts will require greater “factfulness,” which means relying on strong supporting facts to avoid exaggerations and distortions that cause problems. Fortunately, even though people often aren’t good at getting their facts straight, Carroll adds that computing and AI can provide an assist in the future in with more fact-based analytics and better decision-making.
“The three elements of AI are the ability to learn, predict, and reason/decide,” explained Carroll in his keynote address. “We can use our knowledge and AI to build better hypotheses and decisions based on the world as it is, and enable AI to work on our behalf to help us navigate.”
In the following panel discussion, Rashesh Mody, business strategy and realization EVP at Aveva (www.aveva. com), explained that AI can gather knowledge and learnings from three to six months of operations, and use them to serve as an improved advisory system. “AI can augment each user’s intellect and assist it,” said Mody. “You can give it complex questions, and it should be able to answer it. For example, asking ‘Why was production down eight hours last week?’ likely needs information from many sources, but AI can help trace it to vibration data or other probably causes.”
Beyond its keynotes and technical sessions, ARC forum also featured many informative press conferences and exhibits. Those presentations included:
• FDT Group (www.fdtgroup.org) announced Feb. 20 the certification of its first device-specific, device-type manager (DTM) flow-control software driver based on the latest FDT 3.0 standard supporting the HART protocol. The newly certified device is Logix 3820 Series DTM from Flowserve Corp. (www.flowserve.com), which uses its positioners that support HART 6/7 to tackle flow control problems.
• To expand production capacity in the Americas, improve lead times, and enhance service, Omron (www.omron.com) reported Feb. 8 that it’s relocating its current facility in Renton, Wa., to Greer, S.C. The company will manufacture motion controllers and drives, machine vision, barcode readers and verification systems at its new facility.
• Yokogawa Electric Corp. (www.yokogawa.com) announced Feb. 21 that it’s partnering with Tsubame BHB Co., Ltd. (tsubame-bhb.co.jp/en) on developing ammonia production solutions. Tsubame BHB is a university-based startup that invented an ammonia synthesis method using electride catalysts.
• Motion Industries Inc. (www.Motion.com) agreed Feb. 20 to acquire Perfetto Manufacturing (www.perfetto.ca) and SER Hydraulics (serhydraulics.ca. Both companies provide engineered solutions, service and equipment for hydraulic/ pneumatic cylinders, complex power units and other assets.
• Newark (www.newark.com) announced Feb. 22 that it’s partnering with Auer Signal (www.auersignal.com) to provide customers with a diverse range of audible and visual signaling devices, including steady beacons, flashing beacons, strobe lights, horns, buzzers and electronic sirens.
• Safety automation provider HIMA Group (www.hima.com) reported Feb. 5 that it’s acquired the Norway-based Origo Solutions (www.origo-solutions.com), which provides safety, automation and instrumented systems for monitoring, control and protection of offshore and onshore facilities, as well as complete SCADA systems for the wind industry. For more than 20 years, Origo Solutions has also been HIMA's exclusive representative in Norway.


• ABB (www.abb.com) demonstrated its ABB Ability Connected Worker apps to enhance health and safety, increase efficiency with digitalization and standardization, improve collaboration in the field, and ensure complete, digital audit trails. ABB also demonstrated its ABB Ability PlantInsight—Operator Assist software that can provide early alert, daily support and incident mitigations.
• ARC Advisory Group (www.arcweb. com) launched its subscriptionbased Sustainability Data as a Service (SDaaS) that provides a use case-centric view of key opportunities related to energy transition and sustainability in the global industrial marketplace. SDaaS combines the qualitative market perspective of ARC domain experts with quantitative market data capabilities to provide unmatched insight into key trends and growth areas of within
process and discrete industries to uncover specific sustainability-related business opportunities.
• Honeywell (www.honeywell.com) is driving new automation capabilities into its Experion Process Knowledge System (PKS) with its Release R530, and expanding support of Experion PKS Highly Integrated Virtual Environment (HIVE). Experion PKS R530 introduces Experion Remote Gateway, which enables remote operations by providing a browserindependent method to simplify monitoring and operations. Also, its updated Ethernet Interface Module lets Experion PKS HIVE integrate smart protocols while optimizing the C300 controller’s processing load.
• Opswat (www.opswat.com) reported on advances in its MetaDefender Kiosk for securing critical environments. These include its more-portaable Kiosk Mini form factor, VSA-mountable


Kiosk Stand, and integration with Opswat’s MetaDefender Sandbox scanning solution and Media Firewall technologies to enable defense-indepth for peripheral media.
For more coverage and information about the ARC forum, visit www.arcweb.com/events/arc-industry-leadership-forum-orlando


In the first major update since it was created in 2014, the National Institute of Standards and Technology (NIST) reported Feb. 26 that it’s updated the widely used Cybersecurity Framework (CSF) document. The 2.0 edition (www.nist.gov/cyberframework) of this landmark guide for reducing cybersecurity risk is designed for all audiences, industry sectors and organization types, from the smallest schools and nonprofits to the largest agencies and corporations—regardless of their degree of cybersecurity sophistication.


In response to the numerous comments received on the draft version, NIST expanded CSF 2.0’s core guidance, and developed related resources to help users get the most out of the framework. These resources are designed to provide different audiences with tailored pathways into the CSF, and make the framework easier to put into action.


“The CSF has been a vital tool for many organizations, helping them anticipate and deal with cybersecurity threats,” says Laurie Locascio, undersecretary of commerce for standards and technology and NIST’s director. “CSF 2.0 is a suite of resources that can be customized and used individually or in combination over time as an organization’s cybersecurity needs change and its capabilities evolve.”
Control ’s monthly resources guide
The website maintained by the Abnormal Situation Management (ASM) Consortium includes overviews and its guidelines on alarm management, HMI design, procedural practices, change management in HMI development and operations practices, as well as sections on control room design and others. The overviews and guidelines are at process.honeywell.com/us/en/site/ asm-consortium
ASM CONSORTIUM www.honeywell.com
This four-part video series starts with the 10-minute, “What is highperformance HMI?,” and continues with videos on design basics, developing an HMI philosophy, and detailed design principles. The series starts at www.youtube.com/ watch?v=5GEvFF8pGlc&t=79s. There’s also an online article version at www.realpars.com/blog/hmi-design
REALPARS www.realpars.com
This feature article, “How to design effective HMIs” by Bridget Fitzpatrick, covers the ANSI/ISA-101.01 standard, “Human machine interfaces (HMI) for process automation systems,” shows how to use questionnaires and interviews with operators to learn what HMI capabilities they require before building them. It also shows how to use storyboarding workshops and advanced methods to further refine HMIs. It’s at www.controlglobal.com/visualize/ hmi/article/11306756/how-to-designeffective-hmis
CONTROL www.controlglobal.com
This online article, “Design like a pro, part 2: developing dynamic HMI/ SCADA projects with speed and precision,” covers the processes for set up, layout, templates, development, startup and others. It’s at inductiveautomation.com/resources/ article/design-like-a-pro-part-2. There’s also a 49-minute video/webinar version at www.youtube.com/ watch?v=V8LGl7JSNLE
INDUCTIVE AUTOMATION
www.inductiveautomation.com
This 14-minute video, “Better SCADA design tips: high-performance HMI,” covers analog values, color palette, animation, trends and radar charts. It’s at www.youtube.com/ watch?v=UK6dRGmz8MQ
SCADA TORCH
www.scadadatorch.com
This online article has two versions, “Design tips to create a more effective HMI” by Chip McDaniel and “HMI best practices for an effective HMI every time.” The first is longer and covers storyboarding, operator interviews, judicious use of color, situational awareness, limiting required access clicks, providing feedback, avoiding pop-ups, alarm and event logging, password protection, and creating a style guide. It's at blog.isa.org/designtips-effective-industrial-machine-process-automation-hmi. The second version is shorter, but has links to other HMI articles. It’s at library.automationdirect.com/best-practices-effectivehmi-every-time
ISA AND AUTOMATIONDIRECT www.isa.org ; www.automationdirect.com
This online article, “Leading the way in HMI design 4.0” by Manabu Kawata, covers the history of HMIs, the current state of screen design, layout options and screen structures. It also links to a six-minute video about empowering workforces with HMI-centric concepts. It’s at www.proface.com/en/solution/ article/design_4
PRO-FACE BY SCHNEIDER ELECTRIC www.proface.com
This online article, “HMI design—best practices for effective HMI screens” by Vladimir Romanov, shows how to select screen sizes and colors, pushbuttons vs. touchscreens, user inputs, local vs. distributed data processing, navigation issues and design tasks. It’s at www.solisplc.com/ tutorials/hmi-design
SOLIS PLC www.solisplc.com
This online article, “Integrator experts provide visualization options for clients” by Joshua Choe, SCADA engineering manager at system integrator Tesco Controls, shows how industrial HMI/SCADA design practices are transitioning from traditional graphics to situational awareness principles, which systems integrators can efficiently tailor and standardize to best meet the individual needs of their clients. It was published in Processing magazine, but it’s accessible at tescocontrols. com/2022/12/16/hmi-scada-designbenefits-from-si-expertise
TESCO CONTROLS www.tescocontrols.com
 TOMAS HASSELGREN Manager, Global Business Development Emerson
LIQUEFIED petroleum gas (LPG) is a hydrocarbon gas consisting primarily of propane, butane, or a mixture of both. Because it produces lower greenhouse gas emissions than traditional solid fuels, there's increasing demand for LPG across the world. In fact, some governments have implemented policies and initiatives to promote the use of LPG to reduce air pollution and improve public health. This increased demand puts the onus on storage terminals to use their capacity as efficiently as possible, by optimizing inventory management and safety. This can be achieved by integrating noncontacting radar level gauges into tank gauging systems.
Control ’s editor-in-chief, Len Vermillion, spoke with Tomas Hasselgren, manager of global business development at Emerson, about the challenges of LPG tank gauging, and the benefits that can be achieved by using non-contacting radar level gauges rather than traditional level measurement technology.
Q: What are the main challenges for tank gauging when it comes to LPG storage tanks?
A: LPG is usually in a liquid phase when it's stored, so the tanks are pressurized or in some cases cryogenic to support the liquid phase of the LPG product.
Typically, there are two types of tanks: a bullet-shaped tank or a spherical tank. The spherical tank can normally take a larger volume than the bullet tank. It's also more complicated to build those spherical tanks. Some refrigerated tanks can take a lot more volume but are more expensive to build and more difficult to handle.
In pressurized vessels and during certain conditions such as rapid depressurization or temperature changes, the level surface is affected by boiling or foam on the surface. This
can also happen when filling the tank, and that makes it difficult in these applications.
Also, the density can vary. When filling or emptying the tank, the technologies used for level measurement depend on the actual density of the product and are affected by it.
Q: There are the traditional mechanical methods and non-contacting radar measurement. Can you explain the differences between the two?
A: One is a fully electronic device without any moving parts, and the other is a mechanical device.
Mechanical devices have a float or displacer that goes down, touches the product surface, or sometimes goes into the surface. Non-contacting radar doesn't have any moving parts, meaning there's no need for maintenance, which the mechanical device requires. Also, mean time between failure is much longer for non-contacting radar gauges than mechanical devices.
Q: What are the specific benefits of radar for LPG tank gauging?
A: It's a benefit for all tanks independent of what product is stored in the tanks. The difference with LPG is that you can't access the tank; they're pressurized. You can't go into the tank, you can't maintain it, and you can't change the wire or the displacer easily on a mechanical device. Whatever you install on the tank, you must be sure it will work for a long time.
The maintenance of these tanks is normally done about every 10 years. It's important to have a device that doesn't require constant maintenance or repair. You don't have any recalibration needed and there's no drift. The density varies in these tanks, and radar isn't affected by density changes.
Q: We hear a lot about the 2-in-1 technology present in Emerson's radar solutions. Can you explain what that means and how it works?
A: It means there are two radars in the same metal housing, and they're galvanically separated with independent communication and independent power supply. The benefit for LPG tanks is you only need one tank opening for both level and the overfill prevention system (OPS). When it comes to LPG tanks, users don't want any more tank openings than needed.
The challenge users face when upgrading an existing LPG tank from a mechanical device to radar technology is the ease with which the new technology can be installed. If an existing LPG tank has only one opening available, the tank would need to be modifi ed to enable two separate radar level gauges to be installed to support the tank gauging system and the OPS. Making that modifi cation may be cost-prohibitive, as it would involve the tank being taken out of service, thereby impacting throughput and profi tability.
However, this challenge is solved by the Rosemount™ 5900S 2-in-1 Radar Level Gauge from Emerson, which

Non-contacting radar technology provides accurate and efficient level measurement of pressurized liquefied petroleum gas (LPG) storage tanks.
Source: Emersonconsists of two separate and independent electrical units and a common antenna. This enables a single device to be used for both tank gauging and separate OPS purposes, requiring only one tank opening and minimal or no modifi cations.
Q: Let’s talk about some of that available technology, especially for tank gauging, in general, and specifi cally for LPG.

To hear more of this discussion, including added benefi ts such as automatic vapor compensation and identical separation and future developments for non-contacting radar measurement, check out the Control Amplified podcast at ControlGlobal.com/Podcasts
A: Everything we do, and have been doing for the last 50 years, is based on radar measurement, and then we build a system around the level because there are so many other things needed at the site.
In general, the basic requirements are to provide accurate and reliable level and temperature measurement, perform calculations for volume, mass, density, and then you need to view it somehow on the display. We provide our own software for viewing or sending data to the SCADA, DCS, PLC or similar.
As a result, non-contacting radar technology offers an effi cient and maintenance-free level measurement solution that tackles the growing need for accurate inventory management and overfi ll prevention for pressurized gas storage.


 by Jim Montague


WHAT’S the goal of an interoperable process control standard? Plug-and-play products—and they’re almost here.
“We advocate open and standardized automation, and Open Process Automation (OPA) is a great example. We’re executing our OPA lighthouse project in Baton Rouge this year, and advancing open-asset digital twins as the foundation for achieving speed and scalability from wherever,” said Wade Maxwell, engineering VP at ExxonMobil Technology & Engineering Co. (corporate.exxonmobil.com), during his keynote address on Feb. 6 at the ARC Industry Forum in Orlando, Fla. "OPA is demonstrating its value in improved turnrounds, project planning and visual inspections. Openness and interoperability enable faster technology development and deployment at scale.”
Ryan Smeltzer, OPA program manager at ExxonMobil, added, “We talked for years about moving OPA from concept to reality, and now our lighthouse project will demonstrate OPA system compatibility, performance and support in 3Q24, as well as illustrate its value, and provide key inputs into commercial scalability in our manufacturing facilities. We took a stepwise approach to developing OPA technology, standards and business models as we progressed from prototype to testbed to field deployment. The commercial deployment in Baton Rouge embodies the Open Process Automation Standard (O-PAS) architecture initially developed in 2016, and we’re implementing an OPA system with products built to O-PAS, Version 2.1, into our OPA lighthouse project.”
Opmeer reports that 2023 was a busy year for O-PAS and OPAF. Their major milestones included:
• Published O-PAS, Version 2.1, for control functionality (publications.opengroup.org/standards/c230) in February 2023, which enables one application to be used on another platform, and extracts program data and other elements users may want to put in another carrier.
• Progressed on developing an AutomationML model to provide portability. AutomationML is a neutral, XML-based, object-oriented data modeling for storing and exchanging plant engineering information.
• Harmonizing with the Module Type Package (MTP) framework from the NAMUR (www.namur.net) organization that standardizes equipment data models and description language to streamline interoperability, and recently collaborated with OPAF on a tradeshow demonstration about how they can work together.
Plug-and-play products that comply with the Open Process Automation Standard (O-PAS) are turbocharging testbeds and coming to supplier shelves
Of course, ExxonMobil’s lighthouse project and the 10 other end-user testbeds underway are all based on O-PAS principles and requirements that the Open Process Automation Forum (www.opengroup.org/opaf) and its supporters have been developing for close to 10 years.
Jacco Opmeer, co-chair of OPAF and DCS subject matter expert at Shell (www.shell.com), reports the original design of O-PAS established in 2016 remains solidly applicable, even as newer technologies joined in recent years (Figure 1). Likewise, the OPAF organization continues to grow, and now has more than 100 members, including 10 of the largest owner-operating companies on the Forbes Top 100 list.
“The diagram for our open, standards-based, interoperable, secure, process control architecture still stands, and our organization is healthy, even as we liaison with more end users and standards organizations,” said Opmeer. “We’re also following the parallel effort on practical execution by ExxonMobil and its partners in their OPA testbed and field trial.”
• Harmonizing with the OPC UA Field eXchange (FX) specification that details extensions to the OPC UA protocol for uniform communications between controllers on a common network.
• Released a snapshot preview of O-PAS, Part 9, on system orchestration, so potential users and the larger community can download it and provide feedback.
• Progressed on Version 2 of the O-PAS Adoption Guide’s Q&A section for system integrators and service providers.
• Launched OPAF’s End User Subcommittee.
“With new updates coming almost every day, our theme for 2024 is ‘Productize, Certify and Deploy,’” added Opmeer. “We don’t have O-PAS-certified products yet, but many prototypes are being tested in end-user installations at BASF, Cargill, Dow Chemical, Equinor, ExxonMobil, Georgia-Pacific, Petronas, Reliance, Saudi Aramco and Shell.”
O-PAS, V2.1, was intended to provide enough content for interested suppliers to build complin systems. It focuses on configuration portability, and includes:
• Control data defined in OPC UA’s information model;
• Execution engines and reference function blocks for the IEC 61131 standard for programmable controllers and IEC 61499 standard about function blocks for industrial process, measurement and control systems;
• Alarm messages based on OPC-UA alarms and conditions;
• OPC UA client/server network communication protocol;
• System management based on DMTF’s (www.dmtf.org) Redfish standard protocol that provides a RESTful interface for managing servers; and
• Security architecture based on IEC 62443 standard.
Scheduled to launch later in 2024 or shortly after, O-PAS, Version 3.0, focuses on the physical platform, application portability, system orchestration, and IEC 61131 and IEC 61499. More specifically, its features include:
• Exchange of control strategies such as import/export;
• Standardized distributed control node (DCN) with I/O on a PICMG backplane;
• Standardized I/O services to allow I/O from multiple vendors on a DCN;
• Support for alarms and events hierarchies and groups;
• Security via role-based access and control;
• Portability of application control logic; and
• Standardized orchestration.
“We expect several products to be certified in the first half of 2024. We’re also going to announce recognized verification labs and recognized test tools for O-PAS profiles,” concluded Opmeer. “The certification launch coming soon will cover the O-PAS connectivity framework, network requirements, system management, security and OPC UA client server as global discovery server.”
System integrators for this testbed are Wood (www.woodplc.com) and Yokogawa (www.yokogawa.com), which helped
implement its advanced computing platform (ACP), O-PAS connectivity framework (OCF), and I/O and other DCNs, and test its adoption of IEC 61499. The testbed’s ACP relies on Dell and VMware to run IEC 61499 engineering from Schneider Electric, HMI and alarms from Yokogawa, global discovery server via OPC UA, and system management from Zabbix and Red Hat. Its utilities are provided by Cohesity, Microsoft, McAfee, GitLab and Harbor.
“The DCNs and IEC 61499 enable real-time control, and decouple our I/O from compute functions, which lets us scale O-PAS to smaller applications with less than 50 I/O,” said Robert Tulalian, information technology (IT) manager at Shell. “Despite these gains, we’ve also experienced some challenges, such as HMIs that don’t automatically reconnect, OPC UA sometimes preventing alarm acknowledgements, unexpected global deliver server shutdowns, and some function block difficulties. Still, software on the testbed is stable overall, even though it will require some updates, which can be expected in a beta test environment. We’ll also need to explore further third-party integration for HMIs, historians, alarms and condition management in our brownfield trials this year."
On-premise OT data center (executing IEC 62264 Level 2 and 3 functions)
Advanced computing platform
Virtual DCN
Application
Application
Application
Application
Application
External OT data center (executing IEC 62264 Level 2 and 3 functions)
Enterprise IT data center (executing IEC 62264 Level 4 functions)
Business platform
External data centers may run physical or virtual DCNs that are connected to the OCF through a firewall Standalone DCF environments may be used for functions such as offline engineering and simulation
Non-OPAS environments OCI
Business platform communicates through Apps running in a DCN, not directly to the OCF
Legend
OPAS conformant component
Non-OPAS conformant platform
Figure 1: Developed in 2016 and before, the Open Process Automation Standard (O-PAS) architecture has proven to be a solid foundation on which suppliers and system integrators can innovate and add more interoperable products such as distributed control nodes (DCN) that are in the process of being released. Updated a year ago as O-PAS, Version 2.1, its physical and virtual DCNs, O-PAS connectivity framework (OCF) network, and advanced computing platform (ACP) provide a framework for plug-and-play process automation and control software and hardware that follow O-PAS principles and will soon be certified as complying with it. Source: OPAF
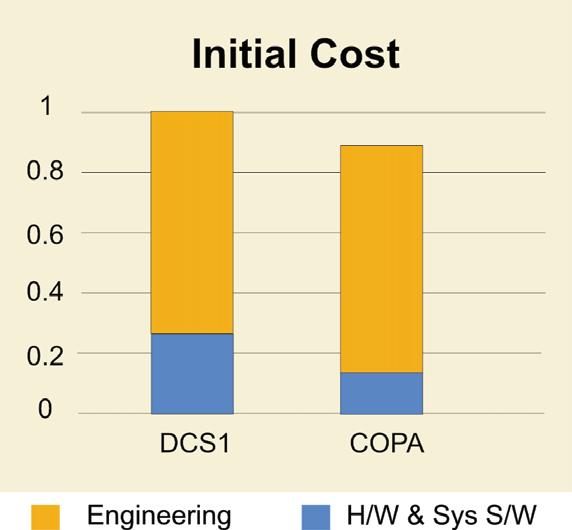
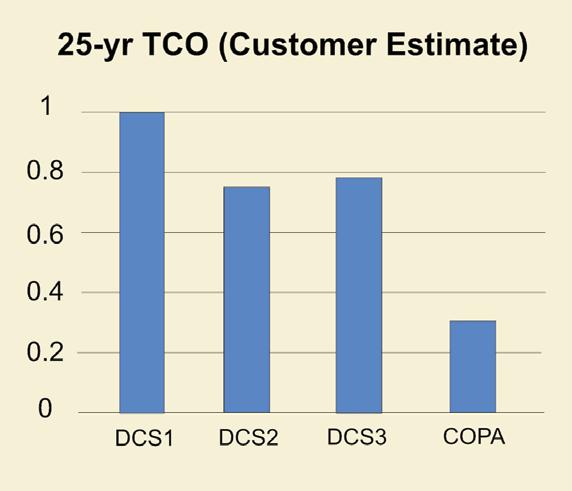
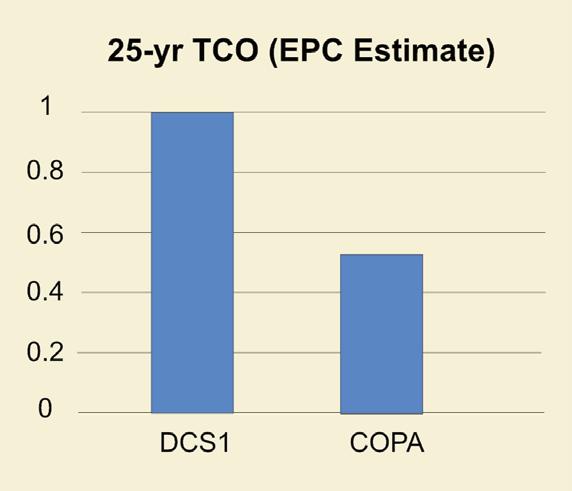
agricultural products company tested a COPA-based, O-PAS control system at one of its continuous process plants with 14,000 I/O. It found that initial costs for system hardware and software were 52% less with O-PAS controls compared to the first DCS and 10% less for the total project. It also showed that total cost of ownership (TCO) over 25 years was 47% less with O-PAS than with the first DCS, according to the EPC, and that TCO over 25 years was 60-70% less with O-PAS compared to each of three DCSs, according to the agricultural firm’s calculations. Source: COPA
ExxonMobil still leads on OPA testbeds
With system integration provided by Yokogawa (www.yokogawa.com), ExxonMobil’s OPA lighthouse project is presently progressing through detailed engineering and staging phases. The project has incorporated learnings from the initial proof of concept (PoC) in 2017, prototype in 2020 and testbed since 2019. Smeltzer reported that OPA hardware fabrication and wiring are complete, and application testing is in progress.
“Factory acceptance testing (FAT) is expected to kick off in March and finish in April, and then it will be installed in the field and cutover. We plan to have this OPA system operational by 3Q24,” said Smeltzer. “We’re being very judicious about this demonstration project because we’re looking to prove to ourselves and the process industry that open, standards-based automation can be done at cost and the fleet level. We’re confident that we can land this field trial, and that it will be successful, so the next task is scaling up.”
Commercializing OPA via deployment starts with:
• Implementing OPA solutions for near-term benefits;
• Engaging with suppliers to screen opportunities for using OPA via request for information (RFI) and requests for proposal (RFP);
• Focusing on software enablement via an app store-style outlet for delivering OPA solutions;
• Requiring OPA capabilities in purchased products; and
• Realizing the potential of UniversalAutomation.org (UAO, www.universalautomation.org) protocol based on IEC 61499 and industry-standard runtime.
“We always talked about having an app store structure for OPA, and now we can really prove it,” said Dave DeBari, OPA technical team leader at ExxonMobil and co-chair of
OPAF’s application portability subcommittee. “Because our testbed includes an advanced computing platform (ACP) and remote I/O, we began working with Aimirim STI (en. aimirimsti.com.br) in February 2023 to help integrate advanced process controls (APC) within IEC 61499 at the function block level and test them in the testbed.”
Though most O-PAS communications occur via OPC UA, DeBari explained that Aimirim also helped the testbed’s team to natively insert function blocks into UAO’s runtime and build-time functions, which enable it to use edge computing to perform advanced control tasks more effectively in the open process environment. For example, DeBari reported the testbed’s O-PAS communications framework (OCF) used Aimirim’s Opper model-predictive control (MPC) software with UAO runtime’s IEC 61499 capability for an APC demonstration on a simple, 2 x 2 feedforward control application. It was deployed in 4diac-RTE (FORTE), which is a small, portable C++ implementation of an IEC 61499 runtime environment that supports executing its function block (FB) networks on small, embedded devices. This demonstration yielded several exceptional results, including:
• Improved disturbance rejection in the feedforward application. On both increase and decrease pressure steps in the pressure-vacuum (PV) valve, where the regular PID function showed visible disturbances, Opper MPC anticipated this effect, leading to no visible effect on the PC valve.
• Faster unmeasured disturbance rejection. Oscillations present in steady-state for pressure and flow control were rejected by Opper MPC more quickly than the existing PID for both variables, leading to considerable reduction in the standard deviation of the process variables. Standard deviation for pressure control was reduced from 2.23 with PID to 1.21
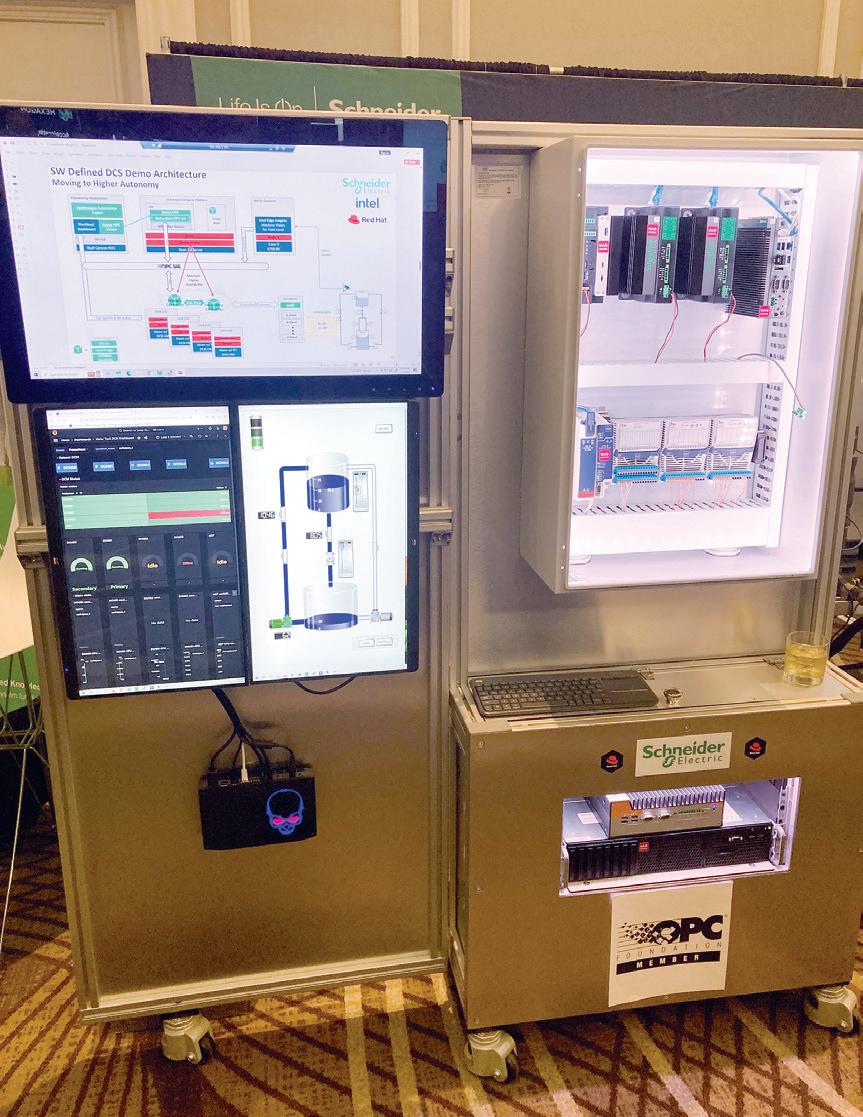
This will reportedly allow users to move to a software-defined, plug-and-produce, network-based experience and solution.
Source: Schneider Electric and Jim Montague
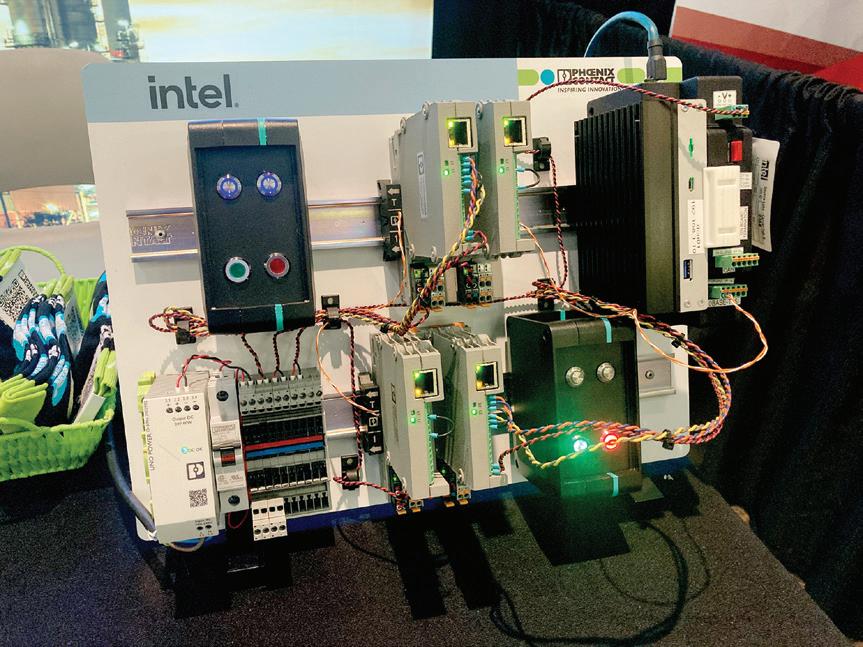
with Opper MPC, while standard deviation for flow control was reduced from 0.60 with PID to 0.55 with Opper MPC.
“Using edge computing for APC levels the playing field, and lets more startups use OPA, so they can bring more great algorithms and applications to market,” said DeBari. “Open process systems unlock value by decoupling software from hardware to allow better real-time control and performance. This is technology we can use today because it only takes 18 minutes to set up and fully commission a DCN in our testbed using orchestration script to safely deploy and run embedded control code. We never have to say ‘no’ to a project now because this kit can do it.”
DeBari added the original testbed in Woodlands, Texas, completed its R&D work in August-September 2023, and a 25% subset was moved in December to ExxonMobil’s campus in Spring, Texas. The remaining 75% went to Yokogawa’s facility in Sugar Land, Texas. Both can perform all of the testbed’s functions. Yokogawa reported it’s presently staging in preparation for the FAT to be conducted in 1Q24 for installation in the OPA lighthouse project in Baton Rouge to control a chemicals facility with about 2,000 I/O.
“We have tens of thousands of process PLCs in the field, and brownfield replacements and even greenfield projects are increasingly difficult, complex and costly with existing technology, so we needed to do a moonshot with OPA," Smeltzer concluded. "It’s taken some collaboration, but OPA’s technical challenges were solvable, and it can provide definite economic advantages that will benefit everyone."
To quantify the performance gains and savings that O-PAS can deliver, the 15-member Coalition for Open Process Automation (COPA, www.copacontrol.com) reported on a recent, front-end engineering design (FEED) study by one of its clients, which evaluated the initial and long-term costs of operating three traditional distributed control systems (DCS) compared to an O-PAS DCN system. The client is a multinational, agricultural products company that's an active, non-OPAF member. It tested O-PAS at one of its continuous process plants with 14,000 I/O for its cost-comparison study.
In the first part of the study, COPA-member Wood served as engineering procurement contractor (EPC), and calculated the initial cost and 25-year total cost of ownership (TCO) of O-PAS versus the DCSs. In the second part, the client also calculated the 25-year TCO.
Using a scalable, COPA-based DCN, the contemplated, greenfield installation excluded field device, construction and cabling costs, and included: one-time costs for control system hardware and software, engineering, configuration and acceptance testing; ongoing costs for owner and contractor labor for control system operation and maintenance; and recurring costs for lost production from plant downtime
due to control system maintenance. It also includes costs of frequency changes, such as Windows or Linux patching at one month; firmware upgrades at one year; office network replacement at five years; HMI replacement at 10 years; industrial network placement at 12 years; control/compute replacement at 20 years; and I/O placement at 25 years.
Consequently, the FEED study found that:
• Initial costs for system hardware and software were 52% less with COPA’s DCN compared to the first DCS, and 10% less for the total project, according to the EPC’s calculations.
• TCO over 25 years was 47% less with the DCN than with the first DCS, according to the EPC’s calculations; and
• TCO over 25 years was 60-70% less with the DCN compared to each of the three DCSs, according to the agricultural firm’s own calculations (Figure 2).
One reason an open-computing O-PAS DCN can generate savings is it has far more computing power and speed than a traditional DCS, while it also has software redundancy with no incremental hardware costs. For instance, while two of the DCSs that Wood and the agricultural client studied a few months ago can perform 760 million instructions per second (MIPS) or 855 MIPS for $20,000-$50,000 per device, a DCN such as COPA-member ASRock’s (www.asrock.com) industrial PC (IPC) has 10 microprocessor cores that can perform 30,000 MIPS for about $2,000 per device.
“Usually, we can only run MPC at the top of the computing stack once every 30 seconds or so, which can make it hard to use results. However, an O-PAS DCN can let MPC run right in it, which also means less bandwidth use and latency,” says Don Bartusiak, former co-chair of OPAF and president of COPA-member Collaborative Systems Integration Inc. (CSI-automation.com). “Driving more computing power down from Level 3 to a DCN at Level 1 can allow users to solve other types of problems that add value.
“For example, more computing power can let users employ artificial intelligence (AI) or neural networks to better estimate compositions for distillation towers in a more timely way than using a gas chromatograph, or use deep-reinforcement learning to continually optimize PID loop tuning. It can also enable software redundancy with software pairs that can pick up if one fails, or allow orchestration to achieve high-availability by implementing redundancy in a dynamic, software-defined way. Eliminating the need for physical pairs for additional computing hardware also means fewer hardware backups are needed, which means spare capacity in the system can be used for more software-based functions. The computing power in multiple DCN can provide redundancy without adding hardware costs.”
To deliver these high-speed capabilities, ASRock and other upcoming DCNs must be able to communicate and collaborate with other devices in their overall operations. O-PAS defines and accomplishes this task for DCNs by
establishing and verifying device profiles in its O-PAS Systems Management (OSM)-003 conformance requirements. Profiles are usually a series of “shall” statements that determine and assign functions like connectivity, networking and security. This verification process is based on the non-profit Distributed Management Taskforce’s (www.dmtf. org) Redfish Agent Standard for IT and cloud-computing services that allows device access and vendor-agnostic visibility of system resources. This enables system orchestration, which automates applications, requirements and lifecycle management of devices, but with the added benefits of zero downtime and minimal required IT skills.
Ever since O-PAS, V2.1, was published a year ago, suppliers have been working furiously to develop products that follow its interoperability principles and can soon be certified as complying with it. Several were announced at the ARC event.
COPA reported that ASRock’s iEP-7020E IIoT controller with COPA-member Intel’s 13th Gen Core processor and iEP-5010G IIoT controller with Intel’s Atom x6000 processor are the first two DCNs to successfully complete verification testing for the OSM-003 profile. iEP-7020E also operates reliably from -40 °C to 70 °C. Both are expected to be certified in 2Q24.
Similarly, Schneider Electric (www.se.com) reported that it’s collaborated with Intel and Red Hat to release their DCN software framework as an extension of its EcoStruxure Automation Expert software. It will reportedly allow users to move to a software-defined, plug-and-produce, network-based experience and solution, enhance operations, ensure quality, reduce complexity, and optimize costs (Figure 3).
As part of its work on the O-PAS physical platform subcommittee, COPA-member Phoenix Contact (www.phoenixcontact.com) has collaborated with Intel to develop a 10BASE-T1S multidrop, Ethernet-backplane demonstrator that shows the I/O subsystem possibility that multiple I/O stations can communication with a DCN via a single, twistedpair cable with T1S PHYs (Figure 4).
“It’s been discussed that T1S could be the backplane of the future, so we got together with Intel to create a PoC and demo for T1S applications, the O-PAS standard has reserved as a potential future state, and makes T1S a reality for I/O connectivity, interoperability and interchangeability,” said Jason Norris, global market development group leader for process automation at Phoenix Contact. “The demo includes an Intel computer serving as the DCN, Phoenix Contact’s prototype, configurable I/O and connectors, and a T1S backplane running CoDeSys programming environment via OPC UA protocol and two-wire/single-pair Ethernet. This is the common network where we believe all signals types will converge in the future.”

THROUGHOUT the energy industry, companies face technical challenges involved with improving operating efficiency. These efforts are further complicated by issues associated with fluctuating market conditions and regulatory compliance, which strongly impact production decisions. Devon Energy (www.devonenergy.com), a large independent oil and natural gas producer, addresses these issues head on by embracing technological innovation and progressively implementing data-centric systems to enhance overall company performance.
For more than a decade, Devon invested in data technologies by following a strategy focused on accessing high-quality data, applying advanced analytics, making the results visible throughout the organization, and scaling-up successes. A key to its success has been the ability to provide useful information for a wide range of user types and to foster collaboration among them.
By researching, testing, and deploying the best-fit applications for each aspect of data management, the company continues to evolve data solutions that provide value to all categories of staff and users. This capability helps the organization enhance sustainability, performance and profitability. A key example is how Devon used Iota Software (www.iotasoftware.com) to pull together a comprehensive data solution.
Devon Energy manages a diversified mix of oil-and-gas commodities sourced from multiple U.S. basins. Operating at a large scale while maintaining a low-cost structure is essential for preserving adequate profit margins. Beginning in 2011, the company committed to improving performance by investing progressively in the following technologies:
• Enterprise-wide digitalization and data management;
• Advanced analytics for improving operational efficiencies;
• Artificial intelligence (AI) to support drilling and completions;
• Robotics for process automation;
• Cloud-connectivity;
• Computer vision;
• Software as a service (SaaS) platforms; and
• Cloud-based data historians While there are certainly benefits to working in a single ecosystem for digitalization initiatives, the team found
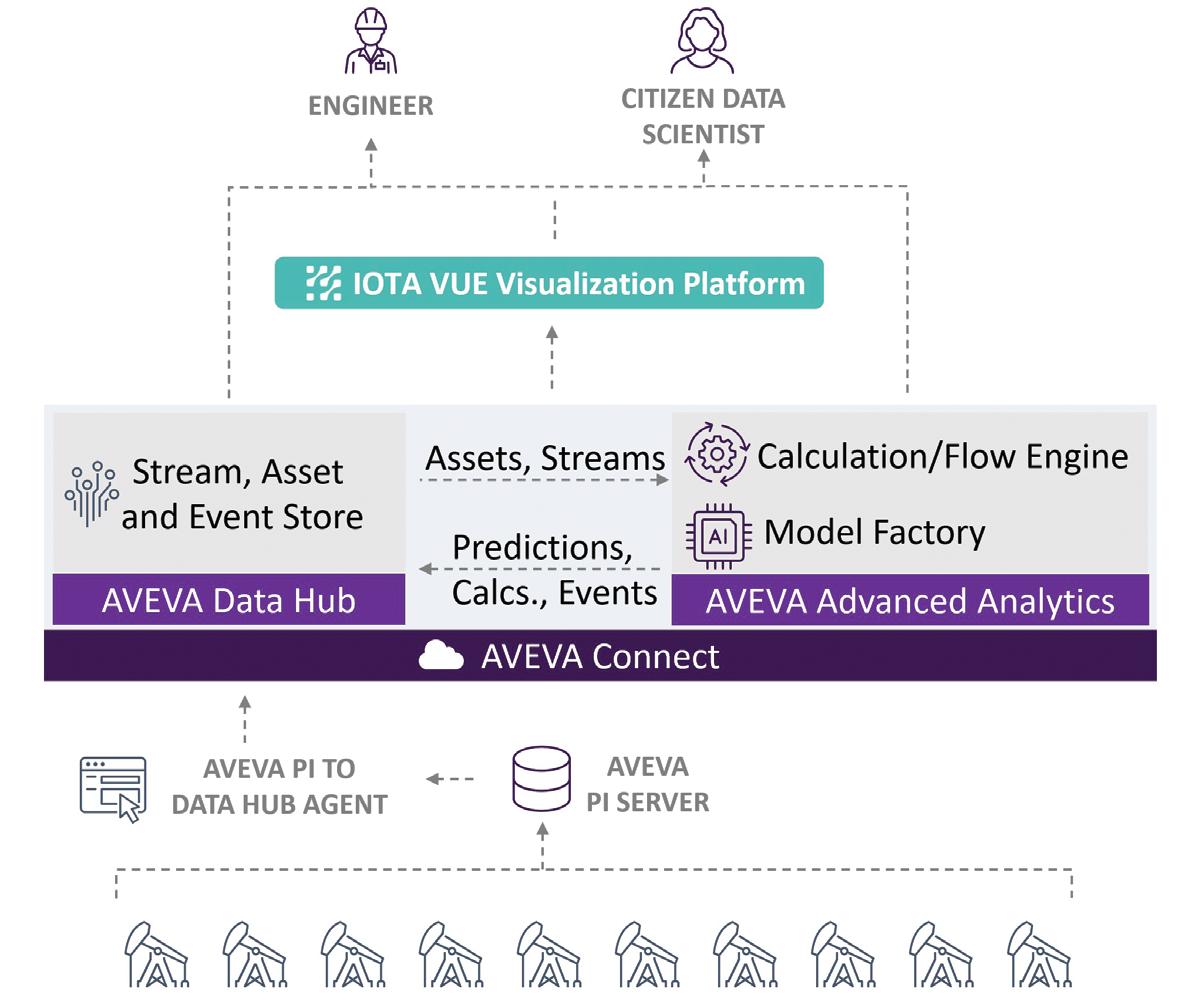
greater flexibility by choosing best-ofbreed products for each application and technical need. Each step in this evolution resulted in performance benefits, prompting the next move.
Success was realized by performing small-scale tests of individual technologies to identify which approaches worked best, and then applying the technologies to targeted use cases to achieve quantifiable wins. When a technology proved to be easily applied, was useful for solving specific operating issues, and could be readily deployed and used by those who needed it, it was adopted and then scaled-up to additional locations.
A typical example of putting data to work was creating a solution to proactively identify well performance issues. One common challenge for producers is the buildup of paraffin in wellbores, which leads to reduced flow rates and decreased overall productivity. Manually monitoring and detecting this incremental buildup can consume significant labor, and introduces time delays for recognizing and resolving issues.
Devon’s solution was to combine modern technologies from Aveva and the Aveva Partner Network to create a flexible and capable wellbore monitoring approach. The progression was:
• Identify Aveva PI System servers already on-premise at well properties that collect and store data from realtime-sensors, derived values, and other production information;
• Configure Aveva PI System and Data Hub—a cloud-native and scalable SaaS industrial data management service—to aggregate, contextualize, and securely share all the PI data;
• Employ Aveva Advanced Analytics and techniques available in TwinThread, such as machine learning (ML) models, which can be trained to identify patterns and anomalies indicative of paraffin buildup; and
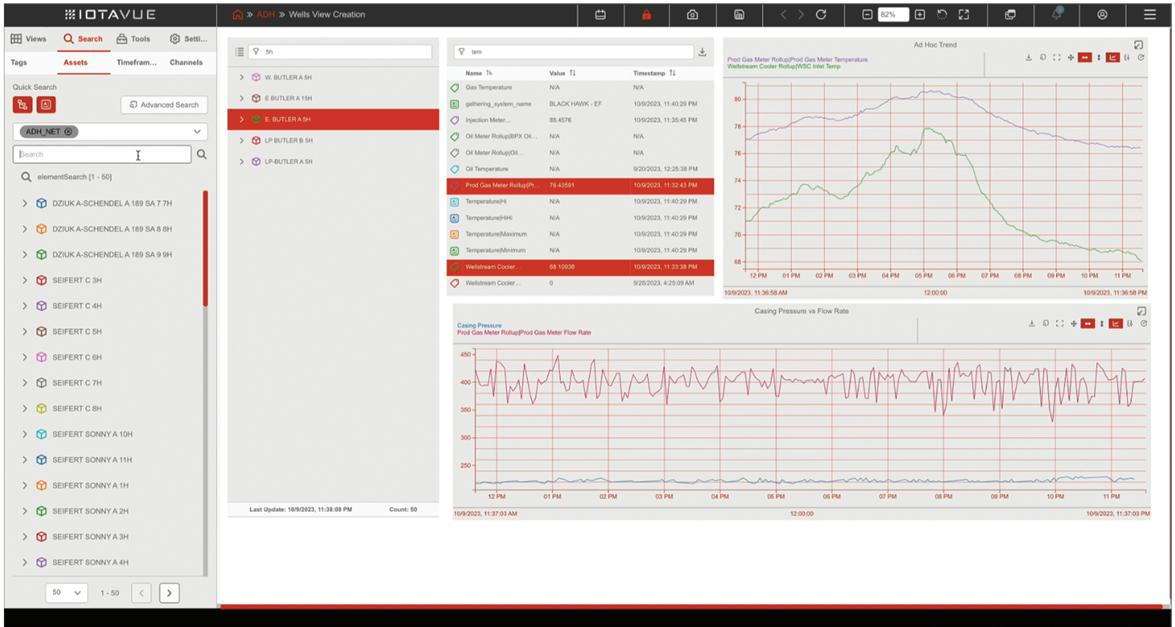
• Use the Iota Vue platform to provide comprehensive visualization of data and associated analytical efforts, and guide improvement efforts.
This combination resulted in a powerful wellbore-monitoring tool (Figure 1). The on-premise historians connect seamlessly with cloud-based data management, delivering high-integrity source data for well casing pressure, net gas rate and other conditions related to well performance. Predictive models were developed using this historical data to identify early signs of paraffin accumulation. Real-time data was applied to the models to detect impending problems.
A key aspect of the implementation is keeping staff in the loop, which is why the visualization delivered using Iota Vue has been an essential element. Visualization serves as both a starting point and the culmination of the data analysis process. Although every data and analytical software application offers its own interface, it’s critically important for usability and acceptance that users be furnished with one intuitive visualization environment.
This type of software platform empowers staff to access data sets, view live well conditions and input signals, review details of the analysis process, and reveal intricate data patterns and
associated insights provided by the analytics (Figure 2).
One strength of this visualization platform is its ability to seamlessly integrate with any data source, analytical software or other digital system. The visualization solution emphasizes streamlined user interactions and workflows, which fosters collaboration among users. By visually depicting information— and highlighting the most essential aspects—users are empowered to pursue informed, data-driven decision-making, so they can perform timely interventions. In many cases, optimal user clarity is achieved by combining disparate data sources, such as alarm/event logs, asset details, maps, trends and analytics output (Figure 3).
While the paraffin buildup detection example may seem a bit intricate, it’s been assembled from several smaller and proven elements, illustrating how some data projects can begin with very small value-adds.
In one case, the process team recognized there was no physical gas rate meter at a certain location. However, they knew there was enough other process information available in the area to create a “virtual” gas rate meter based on other data sources. Once this targeted application was proven, it was deployed widely in other areas,
and then integrated into even more advanced scenarios, such as using the virtual meter for logic functions. To provide optimal clarity, the visualization informs users where the data is coming from, what it indicates, and how else it’s used.
A wide range of user types are interested in accessing and interacting with process data and analytics. Some examples at Devon are production/reservoir engineers, field technicians and dispatchers, control room operators and business/management personnel.
Although many of these staff members can create and maintain various aspects of a data solution, the reality is Devon employs a team to support users by managing and owning data displays, which have increased to more than 3,000 at last count. This arrangement, and visualization ease-of-use, frees up users to be true “citizen data scientists,” with the flexibility to pursue investigations and data projects at their comfort level, knowing they have in-house support to pull together a variety of best-fit products. This approach allows these citizen data scientists to focus their efforts on creating valuable solutions (Figure 4).
For original visualization efforts, Devon tried various native applications,
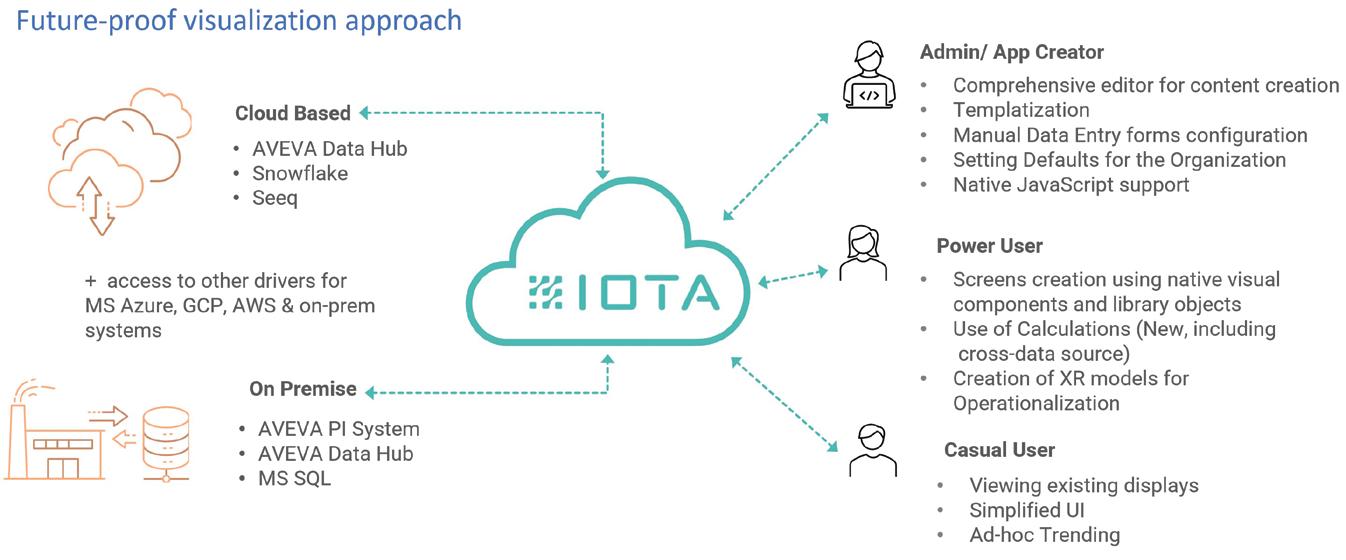
along with more customized or hardcoded methods. This often required the extra complication of looping analytical results back to the historical database to provide access for visualization.
By adopting a third-party visualization solution built from the ground up to be data-agnostic, it doesn’t matter where the data is sourced. Users find this transparency, combined with better graphical objects, make the end results feel like one holistic system, regardless of how many elements operate behind the scenes.
This openness also frees the team to explore any areas of interest. In addition to time-series data (TSD), the team can take advantage of event-driven
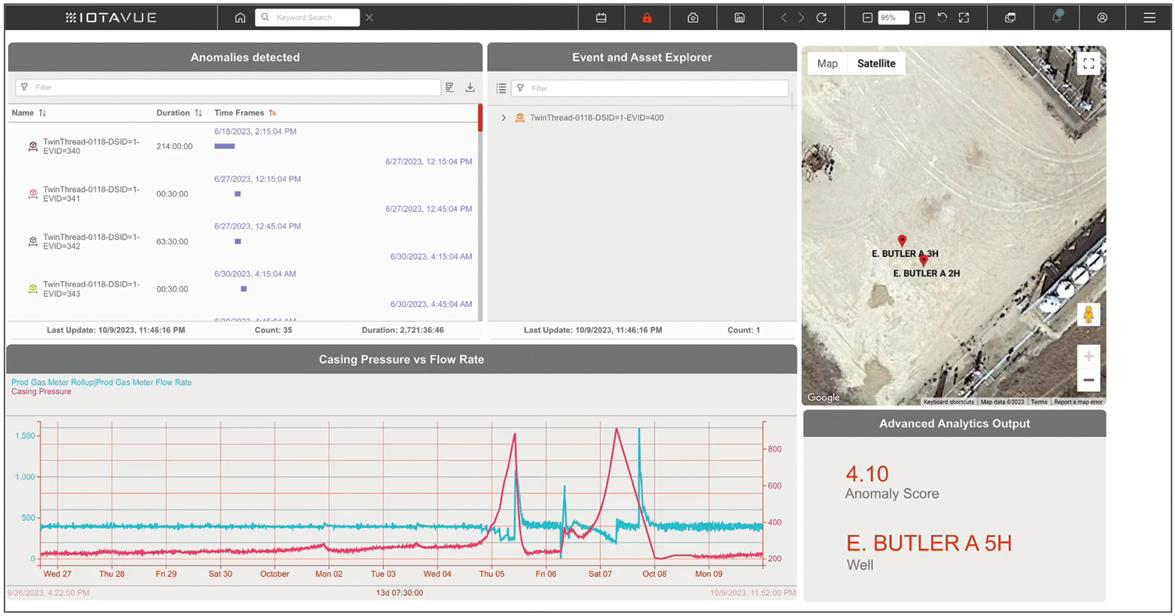
architectures, and it’s possible to test alternative cloud-based options for any of these data sources. Users can easily incorporate other analytical software, such as Seeq Workbench, Seeq Organizer, Aveva Advanced Analytics, Databricks, Snowflake, or any other platform the company uses. Iota can access and display data from multiple sources without the need to get everything in one place.
Like many other enterprises, Devon Energy constantly seeks better ways to improve efficiency and minimize downtime. Progressive technology adoption over the years led it to find a proven approach to success.
By using Aveva data management, Aveva Advanced Analytics, and Iota Vue, Devon can rapidly deploy solutions that are easy to use and deliver immediate value. The wellbore monitoring example, which provides early detection of paraffin buildup and enables scheduled maintenance, has helped optimize production. This is just one case where a data-driven analytical application with clear visualization promotes advantageous well management, and the company can continue creating these types of solutions.
Don Morrison is the real-time systems architect for Devon Energy.


Part one of this two-part series examines the confusing differences in engineering terms and calculations
 BY R. RUSSELL RHINEHART
ENGINEERING ranks efficiency and practicality in calculations over scientific or mathematical perfection. However, our sensibility with terms and equations can often lead others astray, and those more grounded in perfection might call engineers downright sloppy. You need to be aware of engineering conveniences when doing calculations.
This first part of this article discusses terms and calculations, and the second part, which will be published in the April 2024 issue of Control, will discuss conveniences used in probability calculations for reliability and safety systems.
Terminology nuances
A pound mass is not the same as a pound force. If you have one pound mass on Earth and place it on a scale, it weighs 1 lb. This means the scale springs must push up with a 1-lb force to hold it. On the moon, the same mass requires only one-sixth of the force to hold it. It weighs about 0.17 lbf .
Dual use of the term “lb” is inconsequential on Earth, but the meanings of mass and force are quite different. When using the British (Imperial) system of units, be sure to explicitly state lbm or lbf. With the international system of units (SI), mass and force have separate names such as kilogram (kg) and Newton (N).
There is another use of the term lb. We called our lowpressure steam line the 15-lb line because the pressure was 15 pounds per square inch (psig). I asked a new engineer to design a heater using the 15-lb line to dry solvent off filter fabrics. He interpreted the term to mean that the line had 15 lb m in it. He calculated there was only enough steam to dry about 10 of the filters, then there would be zero pounds left in the line, and we wouldn't be able to dry any more. Industrial terminology can be misleading to novices.
We use F = ma and omit the dimensional unifier gc that has the value of 1 (kg-m/N-s2) in SI units. In the Imperial system, we use gc = 32.174 (lbm-ft)/(lbf-s2). A 1-lb mass on Earth has a weight of 1-lb force. But, without gc, one of our fundamental equations, F = ma, would indicate the 1 lbm mass has about 32.2 lbf weight on Earth. The equation should be F = ma /gc
We take the logarithm of values, such as log(x), but the argument of the log function must be dimensionless. For convenience, we omit the unity scalar log(x/1). And, since this is log(x)-log(1) and since log(1) = 0, the log(x) has the same value as log(x/1). For example, pH, a measure of net acidity, is commonly accepted as the negative log of the hydrogen ion concentration, pH = -log10 ([H+]). But, since the units on [H+ ] are moles per liter, this can't be done. The truth is that the argument of the logarithm is the ratio of the [H+ ] of the solution to the [H+ ] at a reference concentration of 1 mole per liter. pH = -log10 ([H+ ]/[H+ ]reference) = -log10 ([H+ ]/1), which for convenience reduces to pH = -log10 ([H+]).
In the valve capacity equation, F = Cv f(x) √(∆Pv /G) is used, where f(x) is the valve characteristic, and x is the valve stem position. G is the fluid specific gravity, which is dimensionless. Since C v has the units of F, perhaps gpm, the argument of the square root function needs to be dimensionless. But ∆P v may have the units psi. The 1 psi scalar, = 1 psi is omitted for convenience because it doesn't change the value. F = Cv f(x) √(∆P /G ) . But for mathematical consistency, needs to be there.
Commonly, gc is also omitted in the friction factor relation for pressure losses ∆P = f L/D ½ v 2 . But as it is, the equation doesn't convert the units of kinetic energy to that of pressure drop. It needs to be scaled by gc.
The argument of an exponent must be dimensionless. It's important to use the value for the gas law constant, R, that's consistent with the units on the other variables in equations of state, vapor-liquid equilibrium relations, and reaction kinetic equations.
The term psig is a deviation from atmospheric pressure, and °F is a deviation from about 458.67 Rankine. If your calculation requires true pressure and temperature, such as in the ideal gas equation of state, be sure to convert deviation measures to absolute.
Laplace transform notations are based on deviation variables. Consider step-testing a process to get fi rstorder plus deadtime (FOPDT) models. The step might be initiated at 2:27 pm but that begins t = 0, a deviation from
2:27. And the initial steady value of the process may have been 0.012 mole fraction impurity, with a 36% controller output, but the initial deviation values are zero. When converting Laplace notation to real variable calculations, one must first subtract the reference value from the inputs. Then, after the calculations in deviation variables, one must add the reference value to the outputs.
Chemical reaction and thermodynamic equilibrium models require absolute temperature, unless the equation already contains the reference temperature and permits the use of degrees F or C.
Dimensionless/unitless
Unitless means that in a ratio of values the unit labels cancel. For instance, π is the length ratio of circumference to diameter, while grade of a road is the length ratio of elevation change to distance, and Reynolds number, Re = du /μ, is the rate of momentum ratio conveyed by the flowing fluid along the flow direction to diffusing perpendicular to the flow direction. These unitless ratios are often termed dimensionless values because the units on the numerator and denominator cancel. But to use these ratios, one must preserve their dimensional meaning.
Any measurement of quantity refers to that quantity. Canadian dollars ($) have a different value than U.S. dollars even though the label $ is the same. If the value ratio is 0.8 [$/$], it appears to be unitless. However, to show how to use it, the 0.8 must still carry the associated units of the value of a Canadian dollar to the value of a U.S. dollar. The value ratio is not unitless. It's 0.8 [$US/$CA]. But for convenience, we often eliminate the labels and units in the act of converting. If you search for, “How do you convert psi to kPa?," the answer is, “Multiply by 6.89476.” For convenience, we don’t show the dimensional units, but the answer is still multiply the psi value by 6.89476 [kPa/psi].
Similarly, proportions and probabilities (based on count, cost, etc.) aren't really dimensionless either. A probability is the count of number of events per number of trials. The expected count of outcomes with event A is the probability of A times the total number of trials. To convert total number of trials to expected count of A outcomes requires the probability to have the units [count of A per total number of trials].
The units on a composition ratio may have the same measurement quantity, but the units are not dimensionless. For example, 1 [lb of A] per 100 [lbs of B] is 0.01 [lbs A per lbs B]. If the ratio is 0.01 [dimensionless], then multiplying 1,000 [lbs of B] by 0.01 would return 10 [lbs of B], not the intended 10 [lbs of A].
Similarly, mole fraction, volume fraction and weight fraction aren't dimensionless. The ratios represent the fraction of A in the mixture. Even though we consider the fraction to
be dimensionless because it's the same measure of quantity for one component in the numerator as it is for the total mixture in the denominator (moles to moles, volume to volume), it's not dimensionless. Mole fraction is the moles of A per moles of total.
Dimensionless groups are unitless, but truly not dimensionless. Reynolds number again, Re = du /μ is unitless, but represents separate numerator and denominator phenomena— the rate of momentum conveyed by the flowing fluid along the flow direction to the rate of momentum diffusing perpendicular to the flow direction. Similarly, the ratio of activation energy to thermal energy, E/RT, used in reaction kinetics, and vaporliquid equilibrium is truly not dimensionless. It's the activation energy to cause a reaction divided by the average thermal energy in the molecules. But, we consider such ratios to be dimensionless groups, and use them as dimensionless variables in correlation equations and exponentials.
Meanwhile, %CV isn't the same as % MV. Both are % of full scale. Conventionally, controller gain has the dimensions of %MV/%CV. Gain multiplies the %CV to convert it to %MV. If the descriptor of the variable label is omitted, then controller gain is %/%, which is often considered dimensionless. If gain were a dimensionless number, multiplying it by %CV would return %CV, not %MV. For engineering purposes, for utility and effectiveness, when used properly in the calculation, controller gain can be considered dimensionless.
We use ideal relations (like the Bernoulli relation to the ideal 2 exponent) for pressure-loss relations. Then correct it with an adjustable drag coefficient or friction factor. It would be much simpler to use the experimentally determined power of about 1.852 as in the Hazen-Williams relation for turbulent flow friction losses in pipe:
∆P = (4.52LQ 1.852 )/(C 1.852 d 4.8704 )
However, the 4.52 coefficient is only right if the length is in feet, flow rate is gpm, pipe roughness factor is from the table relating to the fluid and the pipe, diameter is in inches, and pressure loss is in psi. The 4.52 coefficient is not dimensionless.
The engineering community uses many conveniences. Precision in terminology is important. I respect the practice utility and unencumbered use of conversions without tracking their dimensional units, but I think the truth about a number needs to be preserved—the convenience of not using dimensions should be explained. Use such conveniences, but don't let them lead to errors in your analysis.
Russ Rhinehart started his career in the process industry. After 13 years and rising to engineering supervision, he transferred to a 31-year academic career. Now “retired,” he enjoys coaching professionals through books, articles, short courses, and postings on his website www.r3eda.com.


Control Amplified offers in-depth interviews and discussions with industry experts about important topics in the process control and automation field, going beyond Control's print and online coverage to explore underlying issues affecting users, system integrators, suppliers and others in the process industries.


Check out some of the latest episodes, including:
Coriolis technology tackling green hydrogen extremes
FEATURING EMERSON'S GENNY FULTZ AND MARC BUTTLER
Ultrasonic technology takes on hydrogen, natural gas blends
FEATURING SICK SENSOR INTELLIGENCE'S DUANE HARRIS
Asset-specific insights to transform service workflows
FEATURING EMERSON'S BRAIN FRETSCHEL
Analytics enabling next-generation OEE
FEATURING SEEQ'S JOE RECKAMP


Rosemount 9195 wedge flowmeters enhanced by standardized seal assemblies
AVAILABLE since the 1970s, wedge flowmeters typically position a wedge-shaped piece of metal in the middle of a pipe spool, where it restricts flows and causes pressure changes that can be measured. This is useful because wedge flowmeters can handle harsh materials that regular differential pressure (DP) flowmeters have difficulty measuring. However, the tradeoff has been that wedge flowmeters and seals require specialized support, so they’re usually implemented as individualized and expensive projects.
“We’ve been able to support customers dealing with these challenging applications with customized solutions, but now we can support them with a standard, easy-touse solution,” says David Wright, DP flow product manager at Emerson. “We have more interest in refinery safety systems, CO2 injection for carbon capture, mining for lithium or precious metals, and all these processes require a more robust instrument than we’ve been able to offer in the past.”
To resolve these longstanding prob lems with traditional wedge flowmeters, Emerson is introducing its Rosemount 9195 Wedge
Primary Element DP flowmeters. They consist of:
• A fully assembled flowmeter for accurate measurement of difficult or erosive fluids, even in very low Reynolds number situations;
five remote-seal packages can combine to address those needs.” These five remote-seal packages are:
• Standard —built for general-purpose applications found in water and wastewater or pulp and paper.
• Abrasive —designed to handle entrained solids in slurries that can erode normal impulse piping. This package is effective in mining and metal-recycling applications.
• Ultra-high temperature —uses a remote seal design for temperatures up to 770 °F (410 °C). This package is effective in industries such as refining or asphalt production, where viscous and abrasive fluids run at high temperatures.
• Cold environment —suitable for applications where ambient or process temperatures fall below 0 °F (-18 °C). Outdoor pipelines in colder regions can benefit from
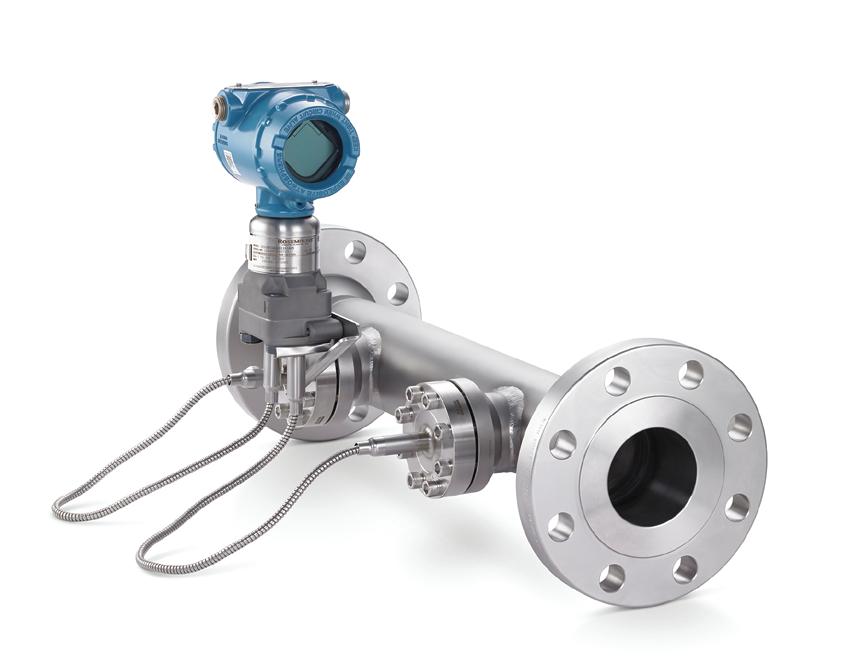
—is for applications where spacing is limited. It provides flexible mounting configurations in plants, while maintaining acceptable time responses.
Rosemount 9195 Wedge Primary Element flowmeters are aided by Rosemount Remote seal assemblies.
• Preconfigured Rosemount remoteseal assemblies that allow for plugand-play solutions in abrasive, high-temperature, cold environments and remote-mount applications;
Source: Emerson
• Wedge-shaped element based on the ISO 5167-6 standard that has no critical sharp edges, allowing it to withstand abrasive applications and enhance wear resistance; and
• Various connection styles for installation flexibility.
“Our remote-seal assembly packages are designed for specific applications based on diaphragm thickness, fill fluid, diaphragm material, capillary length and other factors,” explains Wright. “Previously, individual wedge flowmeters had to be specifically configured to serve in different abrasive situations, temperatures, etc. Now, Rosemount 9195’s
“For example, if a user reports they’re processing a mining slurry, this would trigger an abrasive package with a thicker diaphragm and material that would be the most appropriate,” adds Wright. “This also allows Emerson to serve as a muchneeded one-stop-shop for solutions and support, which also makes ordering quicker and easier, too.”
When paired with a Rosemount DP transmitter, Rosemount 9195 achieves ideal flow measurement with other advanced functions, such as:
• Advanced diagnostics that predict and prevent abnormal process conditions;
• 100% wireless, battery-operated flow solutions with long communication ranges;
• Ultra for Flow measures for percent-of-reading performance over a 14:1 flow turndown;
• 15-year stability and 15-year warranty with 3051S; and
• available with 4-20 mA Modbus, 4-20 mA HART, WirelessHART and Foundation Fieldbus protocols.
For more details, visit www.emerson.com/rosemount-wedge
Our experts recommend ultrasonic flowmeters to get the job done right
Q: I’d like to select a flowmeter for a 28-in. pipe at the flare outlet (waste gas). The range is wide—100 kg/h to 245,000 kg/h. My suggestion is to use a thermal mass flowmeter, but I’m afraid it won’t have sufficient rangeability. Please help me select the right flowmeter.
RAHIM SALAMAT process controlengineer rahim1356@gmail.com
A1: Methane is a primary component of natural gas, and is responsible for up to a third of global warming caused by human activities. It’s short-lived in the atmosphere (about 10 years) but is 25 times more powerful than carbon dioxide, and without serious action, global methane emissions are projected to rise 13% by 2030. Today's concentration in the atmosphere is about 2.0 ppm. At a United Nations conference in Dubai, 103 emitter countries signed the Global Methane Pledge, which aims to reduce methane emissions by 30% compared to 2020 levels.
In 2022, Stanford University researchers found that in some natural gas producing regions, 9% of the methane in flare gas escaped into the atmosphere. This suggests that global methane emissions are much higher (possibly five times higher) than estimates in published literature or by the U.S. Environmental Protection Agency (EPA) at 1.4%. In the past, oil and gas producers assumed that flaring natural gas from their facilities (Figure 1) burned 99% of the vented gas, but Stanford’s research shows flaring is far less effective than previously thought.

Today, global methane emissions are still rising, and their concentration in the atmosphere is the highest it’s ever been, having increased by more than 10% during the past two decades. For these reasons, the need to accurately measure flared gas flows and compositions has increased, resulting in improvements in sensors that measure flare flows.
This column is moderated by Béla Lipták, who is also the editor of the Instrument Engineers’ Handbook (5th Edition: https://www.isa.org/products/ instrument-and-automationengineers-handbook-proce).
If you have a question concerning measurement, control, optimization or automation, please send it to: liptakbela@aol.com.
When you send a question, please include full name, affiliation and title.
Now, concerning flare mass flow measurement over a range of 2,500:1 in a 28-in. diameter pipe, you’re correct that thermal flowmeters aren’t suitable because of size, rangeability and contamination considerations. For your type of applications, the most often used detectors are transit-time, ultrasonic sensors.
Ultrasonic frequency is beyond human hearing (more than 20,000 Hz). Differential transit time, also referred to as time of flight (TOF)-type ultrasonic detectors, measure the difference in the travel times of ultrasonic pulses as they traverse an interior pipe section, both with and against the direction of flow (Figure 2, top). The longer the travel distance of the pulses (Figure 2, bottom), the better the time resolution and the accuracy. There are both single and multipath TOF sensor designs, and their transit times are measured in nanoseconds and picoseconds.
Flow velocity (V) is determined as the average of the velocity profile, which is flat under highly turbulant conditions, and becomes unpredictable in the transition zone (under RE = 10,000). The acoustic path length (L) is a function of the path patterns (Figure 2, bottom), while ( ) is the angle of pulse path relative to the pipe (a) axis. The product of velocity and area gives volumetric flow.
Figure 3 shows the relationship between meter coefficient (K) and Reynolds number (RE):
• RE is a function of the fluid composition because the speed of sound is a function of that. RE is also a function of both ambient and fluid conditions during both calibration and operation.
• Fluid property changes including pressure, temperature, density and other variables, including pipe ovality
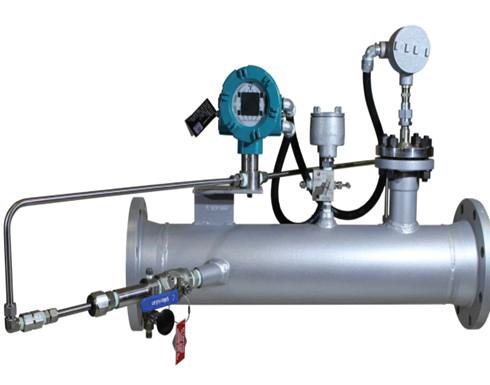
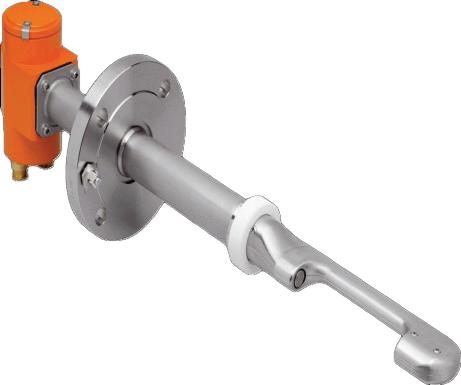
and inner surface quality in up and downstream straight runs, also influence RE and the K factor.
Because only the transit times were measured in early designs, while the other process variables were estimated constants, these meters were low accuracy (±1% at full scale) and low rangeability (10:1). The main reason accuracy and rangeability of today's detectors (Figure 4) increased drastically is because the accuracy of measuring TOF improved by orders of magnitude. Also, using more sensors increased the accuracy of the meter constant K (Figure 3), and using sophisticated proprietary algorithms made it feasible to calculate flare gas molecular weight and mass flow.
I believe suppliers' claims of up to 4,000:1 rangeability at flow measurement accuracies of 2% to 3% over that range are exaggerated. I don’t believe measuring volumetric flow velocities from 0.03 to 120 m/s (0.1 to 394 ft/s) is feasible without dropping into the RE transition zone. Also, the velocity profile is likely to be disturbed by probe-type designs. The angle ( ) of the pulse path isn’t likely to be that accurate, and calibration (if any) is questionable. In fact, I’m not certain that calibration facilities for all flow cells (sizes 1 in. to 98 in.) are available (Figure 4).
My advice is to install one of these flow cells, and not worry about their not living up to claimed performance because they’re still better than any others, and nobody has a sensor to debate their accuracy at low RE.
BÉLA LIPTÁK liptakbela@aol.comA 2: Better than 1:100 is difficult to achieve without a big loss in accuracy. From a cost point of view and for similar accuracy, I recommend using ultrasonic flowmeters for such big pipelines.
DR. H. S. GAMBHIR professor hsgambhir@gmail.comPLCs, PACs and IPCs digitalize, add more I/O, ports, network links and physical protections
P1AM-200 open-source CPU has joined the line of ProductivityOpen controllers. It can be programmed in C++ using Arduino IDE or in CircuitPython using any text editor.

P1AM-200 features up to 16 MB of flash memory, 120 MHz processor, Crypto coprocessor, and a neo-pixel RGB LED. Also, two DC I/O modules are available for Productivity1000 controllers: P1-08ND-TTL and P1-08TD-TTL discrete I/O modules with 3.3 to 5 VDC input and 5 VDC output versions with eight points per module.
AUTOMATIONDIRECT automationdirect.com/programmable-controllers
BTC22 box thin client has a robust design with no moving parts and is optimized for 24/7 operation. Its closed aluminum housing is dust-resistant and designed for a 0 °C to 55 °C temperature range. BTC22 also features long-term support with product availability of more than five years; up to 3x full HD monitors via DisplayPorts and USB-C alt mode; two ultra HD (4K) screen resolution of up to 60 Hz for large screens; and three dedicated Gigabit Ethernet ports.
PEPPERL+FUCHS bit.ly/BTC22thinclient
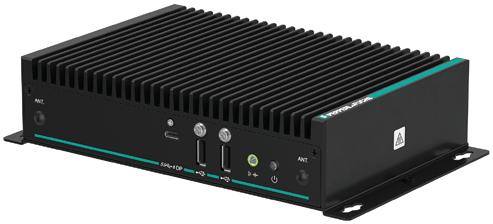
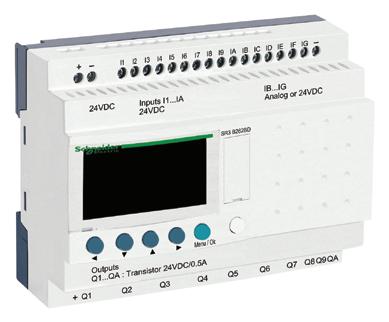
Zelio Logic (SR3B262BD) smart relays/programmable controllers from Schneider Electric are for simple control systems from 10 to 40 I/O. Simple to select, install and program, they’re suitable for all applications. Zelio Logic is flexible, offering a choice of two ranges (compact, monobloc or modular, extendable), as well as two programming languages (FBD or Ladder). It’s also open, and enables control and monitoring of installations in any situation, either onsite or remotely.
NEWARK
bit.ly/ZelioLogicSmartRelays
Developed with Finder, Opta is a micro-PLC supporting Arduino programming and five IEC 61131-3 standard languages. By combining with Arduino Cloud or third-party services, it can scale up. All three variants—Opta Lite, Opta RS485 and Opta WiFi—are secure and durable by design. They support OTA firmware updates, and ensure data security from hardware to the Cloud thanks to an onboard secure element and X.509 standard compliance, and regular cybersecurity assessments.
ROHTEK AUTOMATION
bit.ly/Opta-MicroPLC

DeltaV Edge Environment software expands on the DeltaV automation platform to provide an operational technology (OT) sandbox for data manipulation, analysis and organization. Users can deploy and execute applications to run key artificial intelligence (AI) engines and analytics close to data source with seamless, secure connectivity to contextualized OT data across cloud-computing services and enterprises. This software also has one encrypted, outbound-only data flow.
EMERSON
bit.ly/DeltaVEdgeEnvironment

Able to operate despite the heat of BBQ flames on a grill, EZRack PLC is an industrial, modular, rack-mount PLC that’s reported to be ½ to ¼ the cost of competing products. Its CPU is equipped with communication ports, including Serial RS232/422/485, USB, microUSB and Ethernet. EZRackPLC is IIoT-ready with MQTT and Ignition’s Sparkplug B protocols built-in. It also acts as an EtherNetI/P scanner and/or adapter, supporting explicit and implicit I/O messaging.
EZ AUTOMATION ezautomation.net
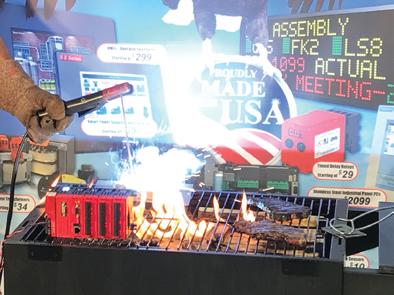

FX5S PLC expands on Melsec iQ-F compact controllers to offer a more affordable, all-in-one controller for small machines of up to 60 I/O with integrated Ethernet connectivity. It features a built-in webserver for connecting to customized webpages and CC-Link IE network capability for reliable communication to HMIs, VFDs, servos and remote I/O. FX5S basic model is programmed in the same GX Works3 user-centric software environment as other iQ-F series compact PLCs.
MITSUBISHI ELECTRIC AUTOMATION INC. tinyurl.com/5fhb8yke

AC500-XC is an extreme-condition PLC that’s resistant to humidity, salt mist, vibration, altitudes up to 4,000 m above sea level and hazardous gases, and can withstand -40 to 70 °C temperatures. It’s scalable, flexible, and offers the same engineering suite, I/O modules, communications modules and dimensions as standard AC500 PLCs. AC500-XC also features reinforced, gold-plated connectors and sealed PCBs. Its built-in protections can replace costly cabinets and cables.
ABB
bit.ly/AC500-XC
INTERFACE WITH ROCKWELL PLCs
C6040 ultra-compact industrial PC (IPC), adds scalability in terms of power and interface options to its C60xx series. Using 12th-gen Intel Core processors with up to 16 cores, this controller is ideal for handling complex automation projects in one ruggedized device measuring just 132 x 202 x 76 mm. The i7 and i9 processors used in C6040 are the first to be installed in a hybrid architecture, which means four additional efficiency cores are added to the i7 and eight to the i9 processors.
bit.ly/C6040-IndustrialPLC

UniStream TA32 PLC offers six analog inputs, two temperature inputs and three analog outputs onboard, and is scalable to 2,048 local I/O, and nearly limitless remote I/O. It can handle 64 PID loops, recipes and data logging. UniStream TA32 can network via Modbus, Ethernet/IP, EtherCAT, CANbus, CANopen, CANLayer2, BACnet, HART and OPC-UA. It also uses REST API, MQTT, SQL, SNMP agent/trap, VNC, FTP server/client, web server, email and SMS messaging, and GPRS/GSM.
UNITRONICS
unitronicsPLC.com
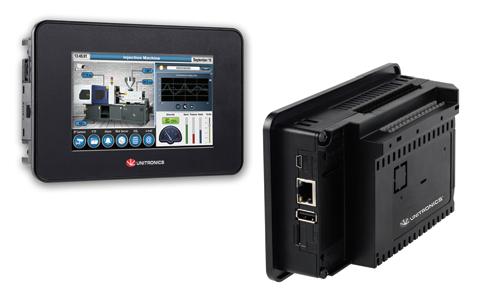
BOX IPC WITH 21 TOPS AND WIRELESS

To provide easy, low-risk upgrades for devices with obsolete Allen-Bradley PLCs, SoftPLC programmable automation controllers (PAC) can replace the A-B PLC or interface a new Rockwell PLC with RIO/DH+ devices. Logic, I/O, wiring, HMIs and networks can be preserved. This lets users decide which parts of the system to change now, and which to retrofit at a later time. SoftPLC PACs also have more memory, I/O capacity, and communications than Rockwell Logix controllers.
SOFTPLC CORP.
800-SoftPLC, 512-264-8390; softplc.com/#/_a_b_migrations
AC100 box IPC enhances the Nvidia Jetson Xavier NX with up to 21 trillion/tera operations per second (TOPS) of computing power, enabling concurrent execution of advanced neural networks and data processing from multiple high-resolution sensors. It has versatile input/output interfaces, including DisplayPort, Ethernet and USB, and mass storage with its internal PCIe M.2 SSD interface. For wireless connectivity, AC100 has M.2 ports for a 4G/5G WWAN module and two Wi-Fi 6 modules.
EKF ELEKTRONIK GMBH bit.ly/AC100boxIPC
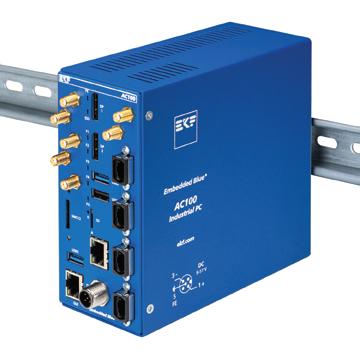
To easily move data from the field to the cloud, EPC 1502 and EPC 1522 are PLCnext edge computers that integrate into existing IT infrastructure, closing the IT-OT gap. They have preinstalled software tools, such as Node-RED, local timeseries database and a simple cloud connection, which reduce development and provision times. EPC 1522 has integrated WiFi, while some models have a serial port for legacy connections. They also have a full-metal housing for passive cooling.
PHOENIX CONTACT
plcnext-community.net
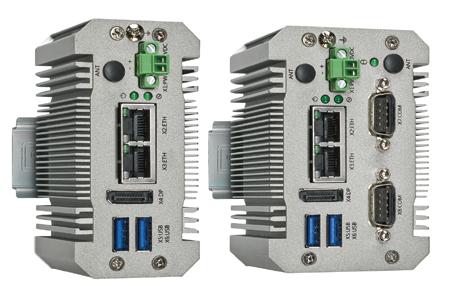

750-9401 is the latest member of the Com pact Controller 100 family, and has all the features of the original CC100, with the addition of a CANopen port. This port makes it easier to expand into applications, where more digital I/O may be needed, or where links are needed to other devices, such as sensors or J1939 enabled devices. This compact unit is programmed with CoDeSys 3.5 software, or it can be used with Docker software containers for running open-source applications.
WAGO
wago.com


FL1F SmartRelay programmable logic controllers (PLC) from Idec come with an RJ45 Ethernet port for remote downloading, uploading and monitoring. They’re equipped with a micro-SD slot for program storage, transfer and data logging. Monitoring and controlling from a smartphone or tablet can be done via the SmartRelay App for iOS and Android devices. FL1F can network up to 16 SmartRelays, making it an ideal controller for simple automation tasks.
GALCO
galco.com
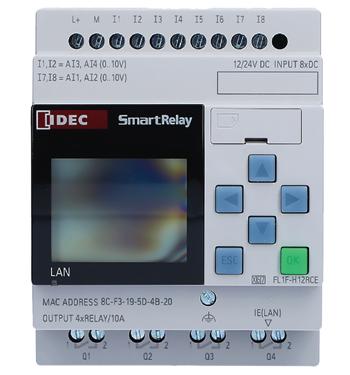


Gregory K. McMillan captures the wisdom of talented leaders in process control, and adds his perspective based on more than 50 years of experience, cartoons by Ted Williams, and (web-only)
Top 10 lists. Find more of Greg's conceptual and principle-based knowledge in his Control Talk blog. Greg welcomes comments and column suggestions at ControlTalk@ endeavorb2b.com
These practical techniques help eliminate compartmentalization of multivariable control
GREG: Unit operations are affected by other upstream and downstream unit operations. That’s why plantwide control is necessary, so unit operations work together toward the common goals of greater plant capacity utilization and efficiency. We’re fortunate to have Vivek R. Dabholkar’s insightful and extensive experience to provide practical techniques to eliminate compartmentalization of multivariable control. His experience includes positions at ExxonMobil, Shell Polymers, Dow Chemical and Ineos. He is currently an independent APC consultant.
Vivek, what are the problems with many present approaches for plantwide multivariable control?
Vivek: Before we discuss a solution, it may be useful to discuss the sub-controllers in a large multivariable controller (MVC). Communication among sub-controllers in the same master controller is seamless. A sub-controller is just a software trick to turn off a group of manipulated and controlled variables, perhaps belonging to one distillation column in a distillation column train, with the stipulation that each manipulated variable can only be part of one sub-controller, while the controlled variables can be shared among more than one sub-controller.
Communication across standalone (separate) controllers (each of which may or may not contain sub-controllers) is strictly forbidden. Currently, no controller-context memory sharing is allowed. In short, what a furnace says an F-101 APC controller is doing can’t be known by an F-102 APC controller at the same point in time
Not all plants need a plantwide MVC. An olefins plant is an excellent example of how plantwide MVC can be exceptionally beneficial. In an olefins plant, control complexity is enormous. Typically, there are 10 or more furnaces, with two or three processing different
feed-types, as well as recycle furnace(s) that process recycled ethane feed from C2-splitter bottoms. You can add to that the compressors/turbines, cascaded propylene/ethylene (sometimes methane refrigeration), a primary fractionator, quench water towers, and a distillation train consisting of five or six columns, and hydrogenation reactors. The scope is enormous. The combined scope may have upwards of 500-600 controlled variables and about 150 manipulated variables.
Greg: Why can’t there be a very large dynamic matrix control (DMC) for each furnace, refrigeration unit and column?
Vivek: This simply isn’t practiced due to the enormous scope and computational difficulty of real-time execution within one minute. There’s one place in the world, Kemya, that has the largest DMC with several sub-controllers in one application due to a smaller number of furnaces with less passes and complexity. It may seem very attractive to have such a well-coordinated application, but trying to simulate it with a DMC is quite a challenge due to the enormous size and sluggish simulator response.
Greg: What’s the next best approach for communicating among standalone MVCs?
This is where the composite linear program (CLP) comes into play, though it was later simply called “composite” when the quadratic program (QP) replaced the LP. It was invented for DMC by the late John Ayala, and was implemented for the first time in Japan in the 1990s by Ayala and fellow AspenTech APC engineer Doug Raven. History was made for the plantwide control of an olefins plant, so the front-end furnace feed could be pushed against the back-end distillation tower delta-P or compressor turbine constraints. If the feed limiting constraints are
in the front-end (furnaces), the utility of composite is diminished considerably. The challenges must have been enormous based on what we know and take for granted today. There were no double-precision control calculations or much appreciation for relative gain array (RGA)/singular value decomposition (SVD) analysis. You had to make sure to let a sick furnace to run DMC “on,” but not participate in feed-pushing ability via composite.
The next challenge is to coordinate communications among standalone controllers running at different offsets from the top of the minute cycle. The idea is to declare total furnace feed for each feed type as a feedforward (FF) in the backend, cold-side controller. Next, there’s the composite.ini file or equivalent to configure each back-end FF into a front-end furnace pass flow. Composite software would replace each curve relating to total furnace feed for each feed type by appropriate furnace pass flow, and this is how a plantwide controller gain matrix is set up internal to the software before solving for plantwide, steady-state targets. Next, each front-end controller’s entire move plan (not just the one time-step value) is passed on to the back-end controllers.
Things get lot more complicated if there are multiple feed types among different furnaces, and if the same furnace can crack multiple feed types through a same pass flow tag at different times. This is either handled by Control Configuration File Switcher software (written by Ramesh Rao while at AspenTech) or by dynamic aliasing.
It’s possible in principle to declare a very large number of FFs, one for each furnace and feed type, and then turn off inapplicable FFs depending on individual furnace feed type, making it a clumsy controller. However, it’s not possible in this Control Talk column to describe all the intricacies involved in composite implementation. One needs to work on a few
composites to get a feel for it, and not just copy-paste from other sites.
Vivek, how do users implement feed pushing capability if they don’t have composite or can’t implement a very large controller?
Vivek: In this case, feed pushing capability is severely impaired. Most commercial control software, except Pace, has feed-pushing capability. A user must create dummy manipulated variables representing total feed of each feed type in the back-end controller. If front-end furnaces (due to lack of availability) can’t deliver maximum feed, then the dummy total feed (for chosen feed type) high limit or external target in the back-end controller must be restricted for each cycle. Also, the dummy total furnace feed steady-state target from the backend controller must set the total feed for a chosen feed type for the front-end furnace controllers to meet, while none of them know each other’s steady-state targets unless communicated by external means. This is a total mess that’s uncalled for in 2024.
G reg: What is a material balance controller and what’s its role in the composite?
Vivek: In most olefins plants, APC engineers want to take advantage of large feed-drums and column-bottom levels for the surge capacity, without extending the steady-state time of the overall controller due to long level controller dynamics (if tuned to take advantage of surge capacity). I've witnessed many incorrect composite designs, where front-end, columnbottom levels or feed-drum levels are in a separate sub-controller. It becomes an issue when sub-controllers between the levels are “off” due to critical analyzer failure or some other process reason. In this case, material balance link between front-end feed and back-end constraints is broken, and composite can’t backout feed. For example, this can happen to a high DeEthanizer delta-P if the DeMeth sub-controller is “off,” and its level isn’t within a common material balance controller.

 JIM MONTAGUE Executive Editor jmontague@endeavorb2b.com
“The superpower of ignorance is it doesn’t have to do anything to have an impact. Facts require work.”
Prepare to look back, be patient, and explain the basics
JUST as individuals can freeze up, speak without thinking, or otherwise have difficulty communicating, I believe groups small and large can have the same problem. During a large presentation and panel discussion on the Open Process Automation Standard (OPAS) at the recent ARC Industry Forum in Orlando, an audience member asked a basic question about its purpose. Unfortunately, this query seemed to throw the experts on the panel and in the audience for a loop because several immediately launched into explanations about standards-development and documentation efforts by the Open Process Automation Forum’s (OPAF) committees and details its distributed control nodes (DCN), OPAS connectivity framework (OCF), advanced computing platform (ACP).
While all of these answers were true, they really didn’t answer the initial question about the purpose of O-PAS, which is interoperability and plug-and-play process controls. I was little shocked by the OPAF experts’ detailed but seemingly ineffective responses because they’re some of the most intelligent people I’ve ever covered, and most have been working on the “standard of standards” for close to 10 years. Not only is O-PAS’ mission tattooed on the brains of every OPAF member, it’s also in its name, but articulating this was temporarily elusive.
So, why are simple answers often difficult to express? I think it’s due to the well-known situations where we “can’t see the forest for the trees.” Many of the technical professionals I’ve covered are so forward-focused on the technical problems they’re trying to solve that it’s hard to look back and express the overall reasons for what they’re doing.
Of course, the varying receptiveness of audiences also plays a big role. Even questioners sometimes can’t understand answers, aren’t paying actual attention, or may not want to hear them. Legend has it that even after the
newly enlightened Buddha attained Nivana and gained the ultimate wisdom of the universe, he failed to convey what he’d learned to the first man he met (www.youtube.com/ watch?v=_hXSKNLcSNc).
The superpower of ignorance is that it doesn’t have to do anything to have an impact. Facts require work. This is also the reason “a lie can go halfway around the world before the truth gets its boots on.”
Not to worry though. Just prepare and keep in mind some answers that could help potential O-PAS users or rookies in any field who need orientation. FAQs and mission statements used to be staples for most organizations and websites, so it would probably help to revive and/or update them in many places.
Likewise, it could also help to check out the Flame Challenge (www.stonybrook.edu/ commcms/alda-center/thelink/posts/The_ Flame_Challenge.php and www.youtube.com/ watch?v=rCslOEolDd4) from the Alan Alda Center for Communicating Science at Stony Brook University. This was a terrific program that asked technical professionals to explain concepts like fire, color, time, sleep and others in language that 11-year-old students could understand.
Likewise, O-PAS already operates several outreach efforts, and just established its new end-user subcommittee, so there’s little doubt it will continue to succeed, and reach more and more potential process control users and application with its performance advantage, cost savings and other benefits.
However, the windows for reaching and engaging with the largest possible audience for O-PAS or any potentially useful solution are typically narrow and can close quickly. This is why it’s so important to consider the receptivity of others who aren’t as far along our learning curves, and remember that digitalization makes everyone a newbie in one area or another.