Envisaging the Future of Cities


First published 2022 by United Nations Human Settlements Programme (UN-Habitat)
Copyright © United Nations Human Settlements Programme, 2022
All rights reserved
United Nations Human Settlements Programme (UN-Habitat)
P.O. Box 30030, Nairobi, Kenya Website: www.unhabitat.org
The designations employed and the presentation of the material in this report do not imply the expression of any opinion whatsoever on the part of the Secretariat of the United Nations concerning the legal status of any country, territory, city or area, or of its authorities, or concerning delimitation of its frontiers or boundaries, or regarding its economic system or degree of development. The analysis, conclusions and recommendations of this report do not necessarily reflect the views of the United Nations Human Settlements Programme or its Executive Board.
The Report is produced with official data provided by governments and additional information gathered by the Global Urban Observatory. Cities and countries are invited to update data relevant to them. It is important to acknowledge that data varies according to definition and sources. While UN-Habitat checks data provided to the fullest extent possible, the responsibility for the accuracy of the information lies with the original providers of the data. Information contained in this Report is provided without warranty of any kind, either express or implied, including, without limitation, warranties of merchantability, fitness for a particular purpose and non-infringement. UN-Habitat specifically does not make any warranties or representations as to the accuracy or completeness of any such data. Under no circumstances shall UN-Habitat be liable for any loss, damage, liability or expense incurred or suffered that is claimed to have resulted from the use of this Report, including, without limitation, any fault, error, omission with respect thereto. The use of this Report is at the User’s sole risk. Under no circumstances, including, but not limited to negligence, shall UN-Habitat or its affiliates be liable for any direct, indirect, incidental, special or consequential damages, even if UN-Habitat has been advised of the possibility of such damages.
HS Number: HS/004/22E
ISBN Number(Series): 978-92-1-133395-4
ISBN Number: 978-92-1-132894-3

In2016,theinternationalcommunityadoptedtheNewUrban Agenda to harness the power of sustainable urbanization to achieve our global goals of peaceful, prosperous societies on a healthy planet.
Despite progress since then, the COVID-19 pandemic and other crises have posed huge challenges. Urban areas were particularly hard hit by the pandemic – underscoring the importance of stepping up efforts to build a more sustainable and equitable urban future.
Local is the space where we connect the dots. Cities and towns can spearhead innovations to bridge the inequalities gaps, deliver climate action and ensure a green and inclusive recovery from the pandemic – especially as the proportion of people living in urban areas is projected to grow to 68 per cent by 2050.
The World Cities Report 2022 stresses that building resilience must be at the heart of the cities of the future. The success of cities, towns and urban areas will largely depend on policies that protect and sustain all, leaving no one behind. We need green investment for sustainable patterns of consumption and production; responsive and inclusive urban planning; the prioritization of public health; and innovation and technology for all.
These steps will help cities adapt and respond to shocks and stresses and lead our world to a resilient, just, and sustainable urban future.

In February 2020, as UN-Habitat announced that the 2022 World Urban Forum will be hosted by Poland in the city of Katowice, we could not imagine that the world would go into lockdown. The COVID-19 pandemic created a temporary crisis of confidence in the future of cities as urban dwellers across the world, especially in large cities, fled to the perceived safety of the countryside or to smaller towns.
At the peak of the pandemic, what were once bustling cities became desolate as residents disappeared from public spaces during enforced lockdowns. Today, in 2022, many cities have begun to resemble their old selves, cautiously returning to the way they operated previously. There is a broad consensus that urbanization remains a powerful twenty-first century mega-trend. A sense of optimism is returning that the pandemic is providing us with the opportunity to build back differently. Can our children inherit an urban future that is more inclusive, greener, safer and healthier?
If the world were to experience another pandemic or major threat, would our cities and towns be sufficiently prepared basedonwhatwehavelearnedoverthelasttwoyears?Would our cities have developed a robust system of resilience to respond to and withstand future shocks? I recall mayors and city managers asking: how do we build back better, greener and inclusively?
The answer lies with what we have learned and adopted as best practices responding to COVID-19 and the climate crisis. We must start by acknowledging that the status quo leading up to 2020 was in many ways an unsustainable model of urban development. To meet this challenge, the future of cities must respond to pressing urban challenges in different parts of the world. An optimistic scenario of urban futures will reduce inequality and poverty, foster productive and inclusive urban economies, invest sustainably to promote clean energy and protect ecosystems, and prioritize
The vision of sustainable and equitable urban futures will not be guaranteed unless cities and subnational governments take bold and decisive actions to address both chronic and emerging urban challenges
public health. These ambitions, in turn, must be facilitated by responsive urban planning and multilevel governance systems in which finance, innovation and technology play overarching roles.
While the COVID-19 pandemic has occupied a significant share of global attention since 2020, it is far from the only threat facing the future of cities. High inflation and unemployment, slow economic growth, looming recession, mounting public debts, supply chain disruptions, armed conflicts, and a global food and energy crisis amount to a bitter cocktail of contemporary challenges. Unless concerted action is taken, millions of poor and vulnerable families across the world will continue to live in a future that is unfolding without the necessary safeguards and one that eclipses their dreams of a better urban future. Building economic, social and environmental resilience, including appropriate governance and institutional structures, must be at the heart of the future of cities. Economic resilience with new fiscal sustainability frameworks, societal resilience with universal social protection schemes, climate resilience with greener investments, and stronger multilevel collaboration to confront future shocks must be the main building blocks of a resilient future that can withstand and respond to the various threats and shocks that urban areas face.
The World Cities Report 2022 envisages an optimistic scenario of urban futures that relies on collaborative and effective interventions to tackle multidimensional poverty and inequalities; promote vibrant, resilient, diversified urban economies and productive urban futures; build healthy and thriving cities; strengthen the drive towards green urban futures; promote well-planned and managed urbanization processes; and ensure inclusive digital economies for the future. The optimistic scenario envisions concerted policy action facilitated by the implementation of the New Urban Agenda. It has now been over five years since the New Urban
Agenda was adopted at the Habitat III summit in 2016 and the implementation framework must be amplified to achieve theSustainableDevelopmentGoalsbymakingtransformative progress in addressing the multiple challenges confronting cities both now and in the future.
The Report reaffirms that the vision for the future of cities must embody the “new social contract” in the form of universal basic income, universal health coverage and universal housing and basic services. This proposal was first articulated in the 2021 UN-Habitat report Cities and Pandemics: Towards a More Just, Green and Healthy Future and remains more urgent than ever.
The vision of sustainable and equitable urban futures will not be guaranteed unless cities and subnational governments take bold and decisive actions to address both chronic and emerging urban challenges. Without urgent and transformative policy action at all levels, the current situation will only get worse. The urgency of new approaches for transformative change in cities cannot be overemphasized. Within this Decade of Action window, it is urgent for cities and subnational governments to adopt innovative approaches that will foster the optimistic scenario of urban futures.
The New Urban Agenda provides a holistic framework for urban development that encourages the integration of all facets of sustainable development to promote equality, welfare and shared prosperity. Our cities and towns must mainstream these commitments in their local development plans with a deliberate focus on tackling inequality, poverty and climate change, among other challenges. Sustainable urban futures remain a cornerstone of the fight to ensure that cities are better prepared for the next crisis.
Authors: UN-Habitat Core Team
Neil Khor (Division Director); Ben Arimah (Chief of Unit and Task Manager); Raymond Otieno Otieno; Matthijs van Oostrum; Mary Mutinda; Judith Oginga Martins
Authors: External Godwin Arku; Vanesa Castán Broto; Merlin Chatwin; Lewis Dijkstra; Simon Joss: Ayyoob Sharifi; Alice Sverdlik; David Simon; Pietro Florio; Sergio Freire; Thomas Kemper; Michele Melchiorri; Marcello Schiavina; Alfredo Alessandrini; Fabrizio Natale; Daniela Ghio; Olivier Draily; Linda Westman; Ping Huang; Enora Robin; Hita Unnikrishnan
Robert Ndugwa; Donatien Beguy; Dennis Mwaniki; Julius Majale; Amos Thairu; Kevin Nyamai; Edwin Kochulem; Daniel Githira; Linda Mwongeli; Martin Runguma; Carol S. Akoth.
Contributors: UN-Habitat Staff
Raf Tuts; Robert Ndugwa; Donatien Beguy; Dennis Mwaniki; Remy Sietchiping; Shipra Narang Suri; Paula Pennanen-RebeiroHargrave; Paulius Kulikauskas; Katharina Rochell; Xing Quan Zhang; Chris Williams; Filiep Decorte; Anne Amin; Rafael Forero; Maria Tellez Soler; Angela Mwai; Cecilia Andersson; Lucia Kiwala; Stefanie Holzwarth; Janene Tuniz; Rosa Muraguri-Mwololo; Graham Alabaster; Isabel Wetzel; John Omwamba; Lennart Fleck
Contributors: External
Susan Parnell; James Duminy; Elmond Bandauko; Karen Vankerkoerle; Maximilian Kriz; Jasmin Cook; Roberto Rocco; Abdellah Abarkan; Oliver Lah; Nathalie Roebbel
Caroline Gaceru; Brenda Gacheru; Nelly Kang’ethe; Shova Khatry
Leon Osong; Moshy Savegod
International Advisory Board
Christine Platt; John Ebohon; Taibat Lawanson; Yu Zhu; Matt Benson; Nikolai Bobylev; Ryan Centner; Bharat Dahiya; Carol Archer
Government of Sweden
Ministry of Development Funds and Regional Policy, Government of Poland Abu Dhabi Department of Municipalities and Transport, United Arab Emirates
Editorial Consultant
Gregory Scruggs
Communications and Media Team
Katerina Bezgachina; Victor Mgendi; Ivy Mutisya
Design and Layout: Peter Cheseret; Michael Lusaba
Creative Direction: Andrea Posada
Illustrations: Ana María Ospina
Web Development: Andrew Ouko, Joshua Gichuhi
Box 1.1: Five lessons
Box 1.3: The Vision
the COVD-19
“Cities
Box 2.1: Levels and classes in the
of Urbanization
Box 2.2: Advantages of the Degree of Urbanization
Box 2.3: Projections and data sources
Box 2.4: Different drivers of population
Box 2.5: City size
Box 2.6: Shrinking cities:
the Degree of Urbanization
Box 2.7: Making room for future urban expansion: Minimal
Box 3.1: The “troubled spots” of residential segregation
Box 3.2. Building the resilience of “urban weak spots”
3.3: Moving Urban Poor Communities in the
Box 3.4: China’s integrated urban social programme
Box 4.1: Informal economy:
Box 4.2: Urban and territorial planning,
4.3: European Regional Development Fund
4.4: Windsor’s L.I.F.T economic diversification strategy
United
Resilience (MOVE
conflict-affected
urban
Box 4.5: Innovative municipal finance mobilization using land value capture in Hargeisa, Somaliland 132
Box 4.6: Freetown is reforming its property tax system 133
Box 5.1: Let’s make a “Green” Deal: Infrastructure, jobs and the green economy................................................................................................. 144
Box 5.2: Green recovery: Commitments and actions misaligned? 148
Box 5.3 Car-free and carefree: The movement to open streets for people 151
Box 5.4: Urbanization and climate impacts 156
Box 5.5: Job comparison between green and unsustainable investment types 168
Box 5.6: Post-COVID-19 resilience in informal settlements 171
Box 5.7. Participatory approaches to future visioning and scenario planning......................................................................................................... 173
Box 5.8: Transnational municipal networks in global environmental governance 175
Box 6.1: Global emissions almost back to pre-pandemic levels after unprecedented drop in 2020 186
Box 6.2: UN-Habitat expands COVID-19 prevention in Kenya’s Mathare and Kibera informal settlements through youth-led groups 187
Box 6.3: Regulating the short-term rental market 188
Box 6.4: Scaling up safe street designs in Addis Ababa 193
Box 6.5: San Francisco makes four Slow Streets
198
Box 6.6: Harambee urban farms fill a crucial void for Black, Latinx families during the pandemic 209
Box 7.1: HIV/AIDS epidemic statistics as of 2020 215
Box 7.2: Armed conflicts worsen health in cities 224
Box 7.3: Using technology to bridge access to dementia care in Gangdong-du City, Republic of Korea 228
Box 7.4: Inequitable impact of air pollution in Greater Accra, Ghana
232
Box 7.5: Lessons from the health in all policies approach in Richmond, US to foster health equity and climate resilience, reduce violence and discrimination, and promote social justice 234
Box 7.6: Pro-poor strategies to expand universal health coverage 238
Box 8.1: Chatbot initiative in Mutare, Zimbabwe 248
Box 8.3: Living Labs: Capacity building through experimentation 256
Box 8.4: How community participation built new roads for Old Accra.................................................................................................................. 259
Box 9.1: Examples of frontier technologies in urban contexts 281
Box 9.2: Digital microwork in an informal settlement in Windhoek 286
Box 9.3: Bridging the digital divide in Toronto 291
Box 9.4: Marginalized youth as citizen scientists in Eskilstuna, Sweden 294
Box 9.5: Collaborative assessment of future drone technology in the UK 297
Box 9.6: Mitigation measures for environmental risks.
298
Box 10.1: The City Resilience Index (CRI) 305
Box 10.2: ICLEI’s Urban Natural Assets for Africa Programme (UNA) 315
Box 10.3: Comprehensive city resilience strategies: Buenos Aires, Cape Town and Gothenburg 325
Box 10.4: Five climate action pathways to urban transformation 327
Figure 1.1: Urban and rural population of the world (1950-2030)
Figure 1.2: Cities where the population declined between 2000 and 2018
Figure 1.3: Possible Scenarios for Urban Futures
Figure 1.4: Pathways to sustainable urban futures
Figure 2.1: Population by Degree of Urbanization and in nationally defined urban areas by SDG regions and income group,
2.2: City population growth through expansion, annexation and new cities in Hanoi, Viet Nam and Debrecen, Hungary
Figure 2.3: Evolution of population by degree of urbanization
in absolute and relative terms
Figure 2.4: Population share by degree of urbanization and SDG region (1950–2070)
2.5: Population share by degree of urbanization and income level (1950–2070)
by city population share in 1950
Figure 2.6: Land covered by cities, towns and semi-dense areas, 1975–2070.........................................................................................................
Figure 2.7: Land covered by cities, towns and semi-dense areas and income group, 1975–2070
Figure 2.8: Components of city population growth, 1960–2070
Figure 2.9: The role of reclassification in city population growth during the previous decade, 2030–2070
Figure 2.10: City population growth between 2020 and 2030 by city size, income group and source of growth
Figure 2.11: Population share by age group in cities, towns and semi-dense areas, and rural areas in 1950, 2020 and 2050
Figure 2.12: Growth in the number of cities 1975–2070 by income group..............................................................................................................
Figure 2.13 Growth in the number of cities 1975–2070 by region of the world
Figure 2.14: Number of cities with at least 1 or 5 million inhabitants per region, 2020–2070
Figure 2.15: City population by city size and income group, 1975–2070
Figure 2.16: Growth of the number of cities by population size and income group, 1975-2070
Figure 2.17: Growth of city land by income group and region, 1975–2070
Figure 2.18: City land by city size and income group, 1975–2070 (thousand square kilometres)..............................................................................
Figure 2.19: Maputo in 2020 and in 2050 under three different scenarios
Figure 2.20: City expansion under three development scenarios in Medellin, Lusaka, Taejon and Hamburg
Figure 2.21: City population density by income group and region, 1975–2015 63
Figure 2.22: Population density in cities in 1990 and 2020 and in three different scenarios in 2050 by income group and SDG region (density in inhabitants per sq. km).......................................................................................................................................................65
Figure 2.23: City land in 1990, 2020 and in three scenarios in 2050 by income group and SDG region (city land in 2020=100)
67
Figure 3.1: Multidimensional nature of urban poverty 74
Figure 3.2: Complex web of multidimensional urban inequalities: drivers and outcomes 75
Figure 3.3: Extreme poverty rates by region in a no COVID-19 scenario 76
Figure 3.4: Urban population of multidimensionally poor (millions) 77
Figure 3.5: Percentage of urban population living in extreme poverty in selected Sub-Saharan African countries (2016–2030)
79
Figure 3.6: Proportion of urban population living in extreme poverty in selected Asian countries (2016–2030) 80
Figure 3.7: Percentage of urban population living in extreme poverty in selected Latin American and Caribbean countries (2016–2030) 81
Figure 3.8. COVID-19 exacerbates pre-existing urban vulnerabilities 84
Figure 3.9: The differential consequences of the urban services divide on the poor 87
Figure 3.10: Urban services divide leads to higher burden for the underserved
Figure 3.11: People at risk of poverty or social exclusion in European cities (2017).................................................................................................. 89
Figure 3.12: Multidimensional approach to equitable urban futures 90
Figure 3.13: Pillars of urban social protection 96
Figure 3.14. The A, B, C and D of urban social protection design 98
Figure 4.1: Conceptualization of urban economic resilience 107
Figure 4.2: Key dimensions of resilience building for urban economies 108
4.3: Urbanization
4.4: Urbanization
4.5:
Figure 4.6:
4.7: Informal
4.8:
4.9:
Figure 5.2: Models of net zero development in urban areas................................................................................................................................. 145
Figure 5.3: Public transport: coverage and share of population with convenient access, 2020 149
Figure 5.4: Characteristics of inclusive adaptation planning 159
Figure 5.5: Access to basic water facilities 161
Figure 5.6: Access to basic sanitation facilities 161
Figure 5.7: Benefits and limitations of nature-based solutions 167
Figure 6.1: Reductions in NO2 concentrations over India following COVID-19 lockdowns
184
Figure 6.2: Short-term comparison of PM2.5 levels in major cities before, during and after lockdown restrictions imposed by governments at the beginning of the pandemic 185
Figure 6.3: Temporary reduction in global greenhouse gas emissions during the first half of 2020 and rapid recovery in the second half 185
Figure 6.4: Guidelines for a safe return to the office during COVID-19 191
Figure 6.5: Spatial strategies for restaurants in response to COVID-19.................................................................................................................194
Figure 6.6: The 15-Minute Paris200
Figure 6.7: Representation of the 20-minute neighbourhood in the Melbourne Plan 201
Figure 6.8: Impacts of COVID-19 on public transit ridership between 2020 and 2021 in a 25-city research 202
Figure 6.9: The link between traffic fatality rates and public transport ridership 202
Figure 6.10: Sustainable Urban Mobility Planning 205
Figure 6.11: Examples of instruments under an Avoid/Shift/Improve framework 206
Figure 6.12: The City-Region Food Systems (CRFS) approach
208
Figure 7.1: Leading global causes of death (2000 and 2019) 218
Figure 7.2: Leading behavioural causes of mortality in 1990 and 2019 in Kisumu, Kenya (percentage of total deaths by risk factor) 219
Figure 7.3: Leading behavioural causes of mortality in 1990 and 2019 in Jakarta, Indonesia (percentage of total deaths by risk factor) 220
Figure 7.4: Causes of death in 2019 for London’s Borough of Kensington and Chelsea (wealthy neighbourhood) and Borough of Tower Hamlets (poorer neighbourhood) 221
Figure 7.5: Urban inequalities in measles vaccination rates as shown through differences between non-slum urban areas and slums (in absolute per cent) for children aged 12–23 months 222
Figure 7.6: Skilled birth attendance in the Philippines: percentage of births with skilled health personnel in all urban slum areas, all non-slum urban areas, Manila slum areas and Manila non-slum areas (2003–2017) 223
Figure 7.7: Child stunting in Bangladesh comparing all urban slum areas, all non-slum urban areas, Dhaka slum areas and Dhaka non-slum areas (2004–2018) based on percentage of children aged 0–59 months who are below minus two standard deviations from median height-for-age
223
Figure 7.8: Framework on intersecting, multi-level urban health inequities: key factors from global to city and individual scales 225
Figure 7.9: Causes of injury deaths among adults by sex (aged 15 and older) in two of Nairobi’s informal settlements (January 2003–December 2012, N=2,464) 227
Figure 7.10: Health, climate and livelihood/asset benefits of upgrading informal settlements..................................................................................231
Figure 7.11: Potential benefits of urban climate actions for health, adaptation and mitigation................................................................................. 236
Figure 7.12: Towards Health Urbanism: Inclusive Equitable Sustainable (THRIVES) framework...............................................................................237
Figure 8.1: Alliance for Affordable Internet REACT Framework 249
Figure 8.2: Different kinds of metropolitan governance arrangements 251
Figure 8.3: Women in local councils 252
Figure 8.4: Share of revenue for subnational governments 261
Figure 8.5: Governance challenges and innovations during the COVID-19 pandemic............................................................................................ 265
Figure 8.6. Share of people who trust their national government 270
Figure 9.1: Most important practices to support innovation in cities 276
Figure 9.2: Diagram showing the flows of energy in a ‘positive energy district’ 278
Figure 9.3: Five technological innovations that will shape the future of waste management 284
Figure 9.4: Map of New York showing households without internet access: with concentration in the less affluent parts of the Bronx, Queens and Brooklyn........................................................................................................................................................................ 290
Figure 9.5: City dashboard Bandung, Indonesia 293
Figure 9.6: Screenshots from the QlueMyCity app, which utilizes citizen participation to identify problems across the city 294
Figure 9.7: Living Labs that are part of the European Network of living labs 295
Figure 10.1: The Rockefeller-Arup City Resilience Index 306
Map 2.1: City land area change, 2020–2050
Map 2.2: Population density in cities,
Map 2.3: Total area change per city in a low-density scenario, 2020–2050
Map 2.4: Total area change per city in a high-density scenario, 2020–2050
Map 5.1: Percentage of urban population
5.2: Percentage of urban population
5.3: Percentage of urban
5.4:
Table 1.1: Top
1.2: Urban population
1.3: Urban rate
Table 2.1: Urban primacy
access to basic sanitation facilities
sewerage connections
do
country
country
country
Table 2.2: Population density in three
income
think
SDG region,
Table 3.1: Roles of specific actors in supporting informal sector workers
4.1: COVID-19 induced municipal
losses in selected European Union countries
Table 5.1: Reducing emissions in the built environment, examples of actions
5.2: Approaches to sustainable urban mobility
5.3: Informal transport examples
Table 5.4: Climate planning in Indian cities 160
5.5: Maintaining build environment capabilities for climate change mitigation and adaptation 163
Table 5.6: Nature as a response to societal challenges 166
Table 5.7: Institutions and methods
participation in urban planning
7.1: Potential reductions in premature mortality for European cities
air
172
216
9.1: Examples of the digital divide and approaches to digital inclusion 290
9.2: Four risks of digitalization, and examples of mitigation measures 297
€ Euro
ABC Ahorro, Bono y Crédito (Savings, Bond and Credit)
AI artificial intelligence
AMVA Metropolitan Area of Valle de Aburrá
ASEAN Association of Southeast Asian Nations
ASI avoid-shift-improve
AU$ Australian dollar
B3W Build Back Better World
BREEAM Building Research Establishment Environmental Assessment Method
BRICS Brazil, Russia, India, China and South Africa
BTI Bertelsmann transformation index
CASBEE comprehensive assessment system for built environment efficiency
CAV connected and autonomous vehicles
CDC Centers for Disease Control and Prevention
CFRS city-region food systems
CHW community health worker
COPD chronic obstructive pulmonary disease
COVID-19 coronavirus disease 2019
CRI city resilience index
DALY disability adjusted life year
EU European Union
EV electric vehicle
FAO Food and Agriculture Organization
FDI foreign direct investment
G20 Group of 20
GBI green-blue infrastructure
GCP gross city product
GDP gross domestic product
GHG greenhouse gas
GIZ Gesellschaft für Internationale Zusammenarbeit
GTA Greater Toronto Area
HHI Herfindahl-Hirschman index
HIA health impact assessment
HiAP health in all policies
ICLEI Local Governments for Sustainability
ICT information and communications technology
IEA International Energy Agency
IHD ischaemic heart disease
ILO International Labour Organization
IoT internet of things
IPBES Intergovernmental Science-Policy Platform on Biodiversity and Ecosystem Services
IPCC Intergovernmental Panel on Climate Change
ITDP Institute for Transportation and Development Policy
JRC Joint Research Centre
LEED-ND Leadership in Energy and Environmental Design - Neighborhood Development
LGBTQI lesbian, gay, bisexual, transgender, queer and intersex
MENA Middle East and North Africa
MERS Middle East respiratory syndrome
NBSs nature-based solutions
NCD non-communicable disease
NGO non-governmental organization
NIMBY not-in-my-backyard
NUA New Urban Agenda
NUP national urban policy
NZED net zero-energy districts
OECD Organisation for Economic Co-operation and Development
OPEC Organization of Petroleum Exporting Countries
PPP public-private partnership
PrEP pre-exposure prophylaxis
PSUP Participatory Slum Upgrading Programme
R&D research and development
SARS severe acute respiratory syndrome
SDGs Sustainable Development Goals
SDI Shack/Slum Dwellers International
SMEs small and medium-sized enterprises
SPA special planning area
sq. km square kilometre
SSA Sub-Saharan Africa
SUFF Sustainable Urban Futures Fund
SUMP sustainable urban mobility plan
TfL Transport for London
TMNs transnational municipal networks
UBI universal basic income
UCLG United Cities and Local Governments
UHC universal health coverage
UITP International Association of Public Transport
UK United Kingdom of Great Britain and Northern Ireland
UNCDF United Nations Capital Development Fund
UNCTAD United Nations Conference on Trade and Development
UNDP United Nations Development Programme
UNECE United Nations Economic Commission for Europe
UNEP United Nationals Environmental Programme
UNFCCC United Nations Framework Convention for Climate Change
US United States of America
US$ United States dollar
VLR voluntary local review
WASH water, sanitation and hygiene
WEF World Economic Forum
WHO World Health Organization
WIEGO Women in Informal Employment: Globalizing and Organizing
While the COVID-19 pandemic dominated the two years between editions of the World Cities Report and upended many aspects of urban life, this Report comes at a time when world events create ever more dynamic environments for urban actors. Although most of the world has lifted the public health restrictions and border closures that made COVID-19 such a dominant aspect of urban life, the virus continues to flare up periodically and some countries still have strict measures in place. Recently, the world has witnessed a sudden global spike in inflation and cost of living, alongside supply chain disruptions, which is severely affecting the recovery of urban economies. New and persistent armed conflicts have altered the geopolitical order and contributed to global economic uncertainty.
The disruptive nature of the COVID-19 pandemic is a stark reminder that urban areas need to be prepared for dynamic and unpredictable futures. Cities across the world were totally unprepared for the magnitude of the economic and social impacts of the pandemic. The pandemic revealed and amplified long-standing weaknesses in the social structure of cities, resulting in disproportionate impacts on vulnerable and marginalized groups. Key lessons emerging from the COVID-19 pandemic are that urban areas must invest in preparedness, which requires developing the economic, social, environmental and institutional resilience to respond to a wide range of shocks, including having contingency plans for the most vulnerable groups.
The foregoing raises key questions about the future of cities. What kind of cities do we envisage and reimagine in the aftermath of the pandemic? What kind of cities are needed to support humanity in a predominantly urban world? How do cities prepare for an uncertain world? Building economic, social and environmental resilience, including appropriate governance and institutional structures, must be at the heart ofthefutureofcities.Tomeetthischallenge,sustainableurban futures must prioritize reduction in poverty and inequality; foster productive and inclusive urban economies that provide
opportunities for all; adopt environmental policies and actions that mitigate and adapt to climate change, promote clean energy and protect ecosystems; integrate public health into urban development; – facilitated by responsive urban planning and governance systems in which with finance, innovation and technology play overarching roles.
Cities are here to stay, and the future of humanity is undoubtedly urban: The experience in the early days of the COVID-19 pandemic, when some residents fled large cities was a temporary response that will not fundamentally change the course of global urbanization. We are witnessing a world that will continue to urbanize over the next three decades—from 56 per cent in 2021 to 68 per cent in 2050. This translates into an increase of 2.2 billion urban residents, living mostly in Africa and Asia. All regions of the world are expected to become more urbanized, although highly urbanized and more developed regions are expected to stabilize or experience a decline in urban growth. Unequivocally, this tells us that cities are here to stay, and that the future of humanity is undoubtedly urban, but not exclusively in large metropolitan areas.
Thefutureofcitiesisnotuniformacrossregionsandcan lead to a range of scenarios: While responding to climate change vulnerability and rising levels of inequality are global concerns, other issues are bifurcated by region. In developed countries, the key priorities for the future of cities also include managing cultural diversity, upgrading and modernizing ageing infrastructure, addressing shrinking and declining cities, and meeting the needs of an increasingly ageing population. In developing countries, urban priorities for the future are rising levels of poverty, providing adequate infrastructure, affordable and adequate housing and addressing challenge of slums, high levels of youth unemployment, and investing in secondary cities. How these challenges are addressed will lead to a range of future scenarios.
The worst-case scenario of urban futures is that of high damage: In a high damage scenario, extreme poverty could increase by 32 per cent or 213 million by 2030. Under this scenario, the impacts of the ongoing COVID-19 pandemic
as well as global economic uncertainties, environmental challenges, and wars and conflicts in different parts of the world could have long-term impacts on the future of cities. For instance, cities in Africa could lose up to two-thirds of their financial resources and the weak urban service delivery and governance systems in some of these cities could collapse. If global action against multiple urban challenges fails and this bleak scenario becomes a reality, the credibility of the multilateral system would be compromised, thereby undermining coordination efforts to address urgent and pressing global issues.
Business as usual will result in a pessimistic scenario: Returningtothepre-pandemicstateofaffairs,alsoknownasthe Bad Old Deal, is characterized by the systemic discrimination and exclusion of the poor in urban agendas including the exclusion of informal sector workers, overreliance on fossil fuels, poorly planned and managed urbanization, low prioritization of public health in urban development, and entrenched digital inequalities, which collectively undermine the vision of achieving inclusive, resilient, and sustainable cities where no one is left behind. Globally, 1.6 billion people or 20 per cent of the world’s population live in inadequate housing, of which one billion reside in slums and informal settlements. Under these conditions, the goal of eradicating poverty in all its forms by 2030 and leave no one behind will not be achieved. Without concerted efforts, the pessimistic scenario could lead to new forms of urban vulnerabilities in the future that would disproportionately affect already disadvantaged and vulnerable groups.
Changing course to a sustainable path can lead to an optimistic scenario: With concerted policy action through the effective implementation of the New Urban Agenda as a framework for achieving the SDGs, it is possible for cities to avoid either of the high damage or pessimistic scenarios and instead emerge into a more optimistic future. This scenario involves collaborative, well-coordinated and effective multilateral interventions to leverage the opportunities and address the challenges of urbanization. With appropriately implemented measures, the response to the current urban crisis can lead to a collective reprioritization of cities across the world towards shared prosperity and inclusion.


Urbanization is intertwined with several existential global challenges: Cities do not exist in isolation from global challenges. The emergence of urbanization as a global megatrend is intertwined with the existential challenges that the world has faced in the last 50 years, including climate change, rising inequality and the rise in zoonotic viruses with the latest being the novel coronavirus pandemic, which triggered the worst public health crisis in a century and the worst economic recession since the Great Depression. These challenges will in different ways, leave their imprints on the future of cities.
Building resilience must be at the heart of the future of cities: Building economic, social and environmental resilience,includingappropriategovernanceandinstitutional structures, must be at the heart of the future of cities.


Economicresiliencewithnewfiscalsustainabilityframeworks, societal resilience with universal social protection schemes, climate resilience with greener investments and stronger multilevel collaboration to confront future shocks must be the building blocks of a resilient urban future.
Urban areas need to be prepared for dynamic and unpredictablefutures: The disruptive nature of COVID-19, supply chain disruptions, high inflation, climate change and armed conflicts are all reminders that urban areas need to be prepared for an ever-changing and unpredictable future. Our urbanizing world must be adequately equipped for effective response to a broad range of shocks, and at the same time, transition to more sustainable, just, green, resilient and healthy futures. Global threats require concerted action, which can only be achieved in the spirit of solidarity and cooperation, as no single government or multilateral agency can address such threats alone.
a new social contract with universal basic income, health coverage and housing: Following the disruptions wrought by the COVID-19 pandemic, an emerging vision for an optimistic future in cities is one that embodies a new social contract in the form of universal basic income, universal health coverage and universal housing and basic services. The emerging vision should seek to make cities more equitable, one that is greener and more knowledgebased and is resilient across multiple dimensions.
Localizing the New Urban Agenda and SDG 11 is the most promising pathway to the optimistic scenario of urban futures: The global impacts and disruption triggered by the coronavirus pandemic, much of which played out in urban areas, have simply added a sense of urgency and the demand for a change to some of the unsustainable practices in the journey towards more sustainable urban futures. The path to sustainable urban futures will be determined by inclusive and transformative policies to eradicate poverty and inequality; produce urban economies that provide opportunities for all; generate greener investment for sustainable consumption and production patterns; set the framework for responsive urban and territorial planning; implement collaborative and integrated systems of urban governance; prioritize public health; deploy inclusive innovation and technology; and build resilience, which enables cities to respond to and withstand a wide range of shocks. The localization and effective implementation of the New Urban Agenda serves as a framework for integrating the interrelated components that constitute these pathways.
A new harmonized definition, called the Degree of Urbanization, facilitates international comparisons of urbanization. By defining three main classes of human settlements (cities, towns and semi-dense areas, and rural areas), the Degree of Urbanization captures the urbanrural continuum as recommended by research. It provides a pathway to overcoming the fundamental challenge linked to monitoring urban trends and the development agendas that has lingered over the years: the lack of a unified definition of what constitutes “urban” and its precise measurement.
This chapter provides a unique perspective on future trends using Degree of Urbanization and data emanating from this new harmonized approach. Specifically, it provides scenarios that allow us to understand the anticipated demographic and spatial changes across the urban-rural continuum in various regions as well as their drivers.
Fast-paced global growth in city population is behind us and a future slowdown is in the offing across the urban-rural continuum: New research using the harmonized definition “Degree of Urbanization” indicates that demographic growth has already started to slow down and is projected to continue over the coming decades. While the city population share doubled from 25 per cent in 1950 to about 50 per cent in 2020, it is projected to slowly increase to 58 per cent over the next 50 years. The share of other settlements in the urban-rural continuum(townsandsemi-denseareasaswellasruralareas)is expected to decrease; towns and semi-dense areas are expected to drop to 24 per cent (from 29 per cent in 2020) and that of rural areas to 18 per cent (from 22 per cent).
A slowdown does not indicate no growth—the populationofcitiesinlow-incomecountriesisprojected to grow nearly two and a half times by 2070: Lowincome countries have much higher absolute and relative city population growth than higher income countries. From 1975 to 2020, their city population grew fourfold to about 300 million. By 2070, their population is projected to exceed 700 million. Additionally, projections show that, between 2020 and 2070, the number of cities in low-income countries will grow far more than in the rest of the world—an increase of 76 per cent, compared to 6 per cent in upper-middle-income
countries. High-income and lower-middle-income countries will see an increase of about 20 per cent.


Most expansion of city land area will occur in lowincome countries—without effective planning, urban sprawl might become a low-income country phenomenon: The new data show that changes over the next five decades—in terms of growth of city land area from 2020 levels—will mostly take place in low-income countries (141 per cent), lower-middle-income (44 per cent) and highincome countries (34 per cent). Changes in upper-middleincome countries is projected to be relatively small (13 per cent). This growth is projected to be highest in Oceania and Sub-Saharan Africa, where it is estimated to (almost) double. Growth in city land will be relatively lower in Eastern and South-Eastern Asia (10 per cent), Latin America and the Caribbean (14 per cent) and Europe (16 per cent).
Small cities and towns remain critical to achieving sustainable urban futures in low-income countries: Small cities (less than 250,000 inhabitants) cover almost half of city land (about 45 per cent) in low-income countries, a trend that will persist over the coming decades. Therefore, adequate territorial planning and enhanced capacities in these settlements can strengthen the pivotal role they play in realizing sustainable futures in these countries.


Managing city density is the key future sustainability challenge for low-income countries: While density scenarios play out differently cities in various regions of the world, the fast-paced growth in city population in low-income countries sets them apart. City densities in these countries need to be planned for and managed in ways that do not exert pressure on existing open land, infrastructure and services, resulting in crowding on one hand or leading to unsustainable sprawl on the other. In these countries, a high-density scenario, for instance, would see the already high population density in cities reach 14,000 by 2050 while a low-density scenario would mean cities need five times the amount of land to accommodate growth. In contrast, growth in city population in upper-middle- and high-income countries is lower and cities are less dense. As a result, they can accommodate future growth of population without any need to increase the amount of land. In some cases, the amount of city land is projected to shrink, such as in Eastern Asia.
Enhanced planning capacities are needed in lowincomecountries,especiallyforsmallerandnewcities:


Urban and territorial planning that is responsive, anticipates and effectively addresses the demand for city expansion is imperative for sustainable futures in low-income countries. City land in these countries is projected to increase nearly one and a half times over the next 50 years. Notably, a significant share of this expansion will come from smaller and new cities, which may struggle to plan for this growth. Enhanced capacities in these settlements will strengthen the important role they play across the urban-rural continuum in achieving sustainable futures.
Various levels of government need to plan for greying cities and towns: Demographic changes mean that in the future cities will have a larger share of elderly and a smaller share of children. It is therefore vital to plan for age-friendly cities and towns that afford good quality of life for all its inhabitants across all generations. Already, the ageing of population is a reality in urban areas of high- and uppermiddle-income countries.
Urbanization is inevitable, planning for urban growth is critical for sustainable futures: Effective urban and territorial planning is critical to mitigate the negative social, economic and environmental associated with future urban growth. The growth of city land in low-income countries, for instance, will require substantial efforts in terms of both planning and infrastructure investments. Planning should be undertaken ahead of this expansion of cities to halt informality and ensure that there is policy coherence at various scales guiding the needed investments.
Cities generate wealth but also concentrate poverty and inequality. From the overcrowded slums in the developing world to homelessness and pockets of destitution in the developed world, urban poverty and inequality take many forms. We cannot envision a bright future for cities when inequality appears to be on the rise globally and poverty in certain regions. How to tackle poverty and inequality are among the most pressing challenges facing urban areas; and improving income and a wide range of opportunities for all is essential to achieving an optimistic urban future. The global development agenda gives prime of place to the issue, with SDG 1, which calls for a world in which we “end poverty in all its forms everywhere.” If urban poverty is not addressed, then this goal will remain elusive.
Urban poverty and inequality remain one of the most intractable challenges confronting cities: Urban poverty and inequality are highly complex and multidimensional challenges whose manifestation go beyond lack of income. Urban poverty and inequality are intertwined; they reinforce each other to create conditions of disadvantage that constrain the poor from enjoying the benefits of sustainable urbanization. The multidimensionality of urban poverty and inequality should be at the centre of interventions to create inclusive and equitable urban futures globally.
Without concerted action at all levels, poverty and inequality could become the face of the future of cities: Poverty and inequality are increasingly becoming pervasive in our cities. In developing countries, slums and informal settlements are the most enduring spatial manifestation of poverty and inequality. For the millions living in slums, access to essential services remains elusive; thus, preventing the realization of a better urban future. In cities of developed countries, pockets of poverty and destitution have become entrenched, where minority groups endure marginalization and stigmatization coupled with underinvestment in urban infrastructure. If decisive actions are not taken, urban poverty and inequality will become endemic.
Most countries in Sub-Saharan Africa are off-track from ending poverty by 2030: Most countries in Sub-
Saharan Africa are off-track in achieving the goal of ending poverty by 2030. The region has the highest incidence of urban poverty globally with about 23 per cent of the urban population living below the international poverty line and 29 per cent experiencing multidimensional poverty. The rate of multidimensional urban poverty in Sub-Saharan Africa is 11 times higher than in Latin America and the Caribbean. Indeed, poverty is on the rise in close to one-third of the countries in Sub-Saharan African. Unless governments at all levels act decisively, poverty could become an entrenched feature of the future of cities in the region.
TheCOVID-19pandemichasresultedintheemergence of newly poor people: The COVID-19 pandemic has reversed years of remarkable progress made in the fight against poverty. The pandemic has resulted in the emergence of newly poor people—that is, those who would have exited poverty in the absence of the pandemic but remain poor; and those who have fallen into poverty on account of the pandemic. In 2020, the pandemic-induced new poor globally was between 119 and 124 million people; this is projected to have risen to between 143 and 163 million in 2021. A majorityofthenewpoorwillbelivinginurbanareas;thereby, presenting additional burden to already overstretched local governments especially in developing countries.
Tacklingurbanpovertyandinequalityareurgentglobal priorities: The current COVID-19 pandemic is a reminder that the vision of equitable urban futures will not be achieved unless cities and subnational governments take bold actions to address the pervasive presence of urban poverty and inequality. Without urgent and transformative policy action at all levels, the current situation will only worsen. The longterm costs of each incremental policy choice may not be clear, but each decision could shape the future of cities for generations. Wrong decisions by city leaders could entrench poverty, deny opportunity for millions and widen urban disparities in ways that will become increasingly difficult to reverse.
A multidimensional approach is key to an inclusive urban future: Within the Decade of Action window (20202030), cities and subnational governments should adopt a multidimensional approach to addressing poverty and inequalitybyinvestingininfrastructureandessentialservices, while addressing the multiple spatial, social and economic barriers that foster exclusion. Narrow, sectoral approaches have proved ineffective amid the social, economic, political,
and environmental crises that trap most residents in poverty. As part of building sustainable urban futures, the following dimensions are critical: spatial dimension—access to land, housing, and infrastructure; social dimension—rights and participation; and economic dimension—opportunities for all. Collectively, these factors can lift millions of people out of poverty and create more equitable and inclusive urban futures.
Governments must extend infrastructure and urban services to underserved communities: Investing in and extending infrastructure and services to deprived urban neighbourhoods is a critical policy lever to address poverty and inequality. Access to water and sanitation can be a matter of life and death for poor urban dwellers. Targeting improvements in quality, coverage and affordability to zones of disadvantage and poverty should be a matter of policy priority. If these transformative measures are implemented, they can change the current negative trends and galvanize actions towards achieving equitable, inclusive and resilient urban futures.
Supporting informal employment is critical for building inclusive urban futures: Informality is a reality of urbanization especially in developing countries. Looking into the future, cities should halt the exclusion of informal sector workers in all spheres of urban endeavour. Cities and subnational governments should acknowledge the legitimate contributions of informal workers and stop their harassment and penalization. The rights of informal workers should be guaranteed. These rights include legal recognition, economic and social rights, access to essential services and better representation in policymaking. Cities will not be able to offer a bright urban future if their informal sector workers are perpetually excluded from urban development processes.
Gender transformative approaches are crucial for building inclusive urban futures: Going forward, cities and subnational governments should prioritize inclusive and gender-transformative responses that are co-produced with vulnerable urban populations. Cities should focus on developing inclusive urban governance processes that promote transformative resilience to multiple risks by using local knowledge in the face of uncertainty. Urban leaders should draw on grassroots, civil society and private-sector efforts and build local alliances to deliver more effective strategies and co-design solutions to urban poverty and inequality.
The urban economy is integral to the future of cities. Given the size of the contribution of cities to the national economy, the future of many countries will be determined by the productivityofitsurbanareas. Peoplefirstgatheredindenser human settlements for the purpose of trading at markets, and this fundamental aspect of urban life has evolved over time. Today’s urban economies are complex systems tied to global trade and capital flows, in which foreign entities can own the property next door and distant events can affect the prices for local goods. Cities must be smarter than ever about how they position their economies for the maximum benefit of all residents while also safeguarding the environment and improving their city’s quality of life.
When planning their economic future, cities cannot overlook the informal sector: Recognizing and supporting the informal sector is vital for urban economic resilience and productive urban futures, particularly in developing countries. Given the contribution of the informal sector, cities should adopt a transformative urban economic agenda that is inclusive and equitable. Approaches to urban planning, governance and international development should be reformed to make them responsive to the needs of informal sector workers. This should be backed by the necessary support mechanisms such as access to finance (and relief during crises), markets and infrastructure to boost the resilience of informal economy actors to shocks and strengthen their contribution to productive urban futures.
Future economic growth and resilience cannot be sustained without bridging the infrastructure gaps across the urban-rural continuum: Cities and subnational governments should prioritize infrastructure investments towards building resilient urban economies and prosperous urban futures. This includes targeting underserved neighbourhoods such as slums and informal settlements and marginalized neighbourhoods who bear the brunt of underinvestment in infrastructure. Investments should also be directed towards transport infrastructure systems to enhance the competitiveness of cities and enable urban productivity.
Sustainable urban and territorial planning supported by effective governance structures is critical for building resilient urban economies and productive urban futures: In developing countries, more focus should be on institutional capacity building to enable sustainable planning and management of urban development. Cities that are well planned and managed perform better in optimizing and reaping the benefits of economies of agglomeration. If cities continue to grow in a disconnected and fragmented manner, the opportunities of leveraging economies of scale and urban agglomeration will be missed.
Sustainable and innovative municipal finance is fundamental: Cities must diversify their revenue sources by mobilizing sustainable, innovative and resilient revenue sources. The COVID-19 pandemic has shown that overreliance on traditional revenue sources like property taxes could have potentially crippling effects on the fiscal health of cities. Revenue mobilization should be back by institutional reforms to grant cities adequate fiscal autonomy to experiment with new financing instruments such as land value capture and municipal bonds, as well as to provide them leverage to reform their tax systems in line with their economic bases. These innovative financing instruments (especially when aligned with sustainability ambitions) can serve as important levers to catalyse economically impactful capital investments that create long-term value for citizens, businesses and the city as a whole; thus, contributing to resilient and productive urban futures.
Economic diversification is a critical pillar for urban economic resilience and productive urban futures: The New Urban Agenda encourages governments to prioritize economic diversification by progressively supporting the transition to higher productivity through high-value-added sectors,technologicalinnovationsandcreatingquality,decent and productive jobs. In order to withstand future shocks and
stresses, cities should utilize existing and potential resources to diversify their economies. Diversification of urban economies should be supported by targeted investment and strategies to shift production structures towards new sources of growth. Failure to diversify urban economies will make cities extremely vulnerable to future shocks, especially in developing regions and in cities that heavily depend on single industries such as tourism, manufacturing or natural resource extraction.

Cities should embrace the circular economy as a new frontier in the pursuit of sustainability and resilience: The New Urban Agenda promotes the adoption of policies that lead to a circular urban economy in order to move consumption and production away from unsustainable patterns. Gazing into the future, cities must facilitate and promote greener recovery for resilient economies. Adopting the circular economy can potentially generate additional decent and productive jobs, which are catalysts for urban productivity.
Measures to achieve balanced and integrated urban and territorial economic development must be put in place today to avert skewed development tomorrow. In line with the call of the New Urban Agenda for balanced urban and territorial development, cities and subnational governments should put in place measures to ensure that economic growth is equitable across territories. Full implementation of national urban policies should be a priority. Other measures could include targeted infrastructure investments in secondary and intermediate cities that have been left behind. This focus will enhance the competitiveness of secondary cities, set their economies towards sustainable growth and build resilience to future shocks.
The accelerated pace of transformation in the world of work calls for continual talent and skills development to achieve urban economic resilience and productive futures: Cities should focus on investing in human capacity development to build skills and competences that are in sync with rapid transformations taking place and the emerging new urban economy. Developing skills and talent for human capital is vital for inclusive and sustainable urban growth as it aligns with SDG 8 on promoting productive employment and decent work for all. The new urban economy requires re-skilling of workers to adapt to technological changes. A well-trained workforce is a prerequisite for resilient urban economies and productive urban futures.
Climate change and environmental concerns increasingly dominate future scenarios. The increase in extreme weather events and natural disasters like flooding, heatwaves and landslides will impact urban areas the hardest, which makes climate change adaptation a paramount concern. Meanwhile, urban areas are responsible for the majority of the world’s carbon emissions. As such, the transition to net zero greenhouse gas emissions must occur as soon as feasibly possible. Cities can do their part by embracing a wide range of options.
The transition to net zero GHG emissions has been marked by a lack of ambition and policy pitfalls: There has been a growth of interest in net zero policies to facilitate sustainability transitions at the local level. However, current net zero policies have pitfalls, including an overreliance on underdeveloped technologies that overlook local resources and the lack of integration of local governance strategies in national programmes for action. Meanwhile, the lack of ambition in the current national commitments to net zero also echoes a lack of imagination in defining alternative urban futures.
The twin crises of climate change and the loss of global biodiversity threaten the futures of cities: Climate impacts and other environmental crises interact with drivers of urban inequality, affecting people’s capacity to anticipate the impact, then respond and recover from them. Dealing with future risks—including environmental risks— has become one of the main concerns for local governments and other urban-based actors, eliciting diverse responses.
Inclusive spaces to deliver green urban futures are necessary for sustainability transitions: There are many cases where significant infrastructure and transport projects are accomplished at the expense of various social groups in urban areas, in some cases entrenching existing inequalities and vulnerabilities. Transition and resilience agendas foreground the need to align social and environmental justice goals with the policy priorities of the SDGs and the New Urban Agenda. The interaction between global and local partnerships is further making broader inclusion possible. Additionally, there are also growing opportunities
for collective action to deliver low carbon and resilient urban futures at the local level.
The world is losing the opportunity to use the postpandemic context as a catalytic moment to facilitate investmentforatransitiontonetzerocarbonemissions: While the COVID-19 pandemic represented a significant setback in achieving poverty reductions and the SDGs, it presented a potential inflection point for change toward sustainability. However, the window of opportunity opened by the crisis to rethink human-environmental relations and mobilize recovery funds for environmental sustainability is closing rapidly, with carbon emissions again soaring and the extinction crisis unabated.
Greener futures cannot be secured without just transitions: Alongsidenewtechnicalpossibilitiestofacilitate resource efficiency in sectors such as energy and transport, urban policies must recognize how the informal sector serves the needs of many urban residents. A well-documented example is informal motorized and non-motorized transport that serve many disadvantaged communities in urban areas. A just transition will need to incorporate the concerns of this sector, alongside technological improvements. Urban planning must be inclusive to effectively cater for the informal services sectors that work for the urban poor.
Policymakers at all levels must recognize and support the role of urban areas in the net zero transition: Besides actions at the national level, achieving net zero is also dependent on subnational and city-level action. There is, therefore, a need to develop policies to support action at the subnational level, limiting carbon emissions or reducing vulnerabilities. In addition, current instruments at the national level need to be aligned with local priorities. At the very least, there should be coordination between various levels of governance to ensure that national-level policy is designed in ways that does not curtail or limit local experimentation by multiple actors.
Nature-based solutions must be part of inclusive planning processes for sustainable urban futures: Nature-inspired approaches to urban planning, urban governance and urban design are revolutionizing current thinking about cities and urban services. To achieve sustainable urban futures, local action cannot overlook this trend. Nature-based solutions offer the opportunity to develop a wide range of responses to urban environmental
challenges that harness nature for urban sustainability. Many of these responses can be integrated into urban planning and are often low-cost.

Future-oriented thinking, such as scenario analysis, requires plural politics that ensure diverse voices are heard to minimize uncertainties in the pathways to securing greener urban futures: Building net zero scenarios can be challenging as it involves long time frames and detailed speculation on technological and social changes, with inferences across different sectors and processes. Ensuring that diverse voices are heard in such scenariobuilding approaches will minimize the perception of such scenarios as technocratic and limiting stakeholders’ agency as well as eliminate simplified assumptions about social and political dynamics.
Various levels of government and institutions can harness the potential of international partnerships such as transnational networks and social movements in delivering greener urban futures: Social movements, for instance, are the new point of hope for climate and biodiversity action as new generations (supported by old ones) clarify that business as usual is not an option. Social movements can foster innovation and transitions towards net zero. There is increasing evidence of innovation and feasible responses coming from informal settlements and various community groups. The COVID-19 pandemic, in particular, has shown how local responses can support solidarity and resilience, primarily when invested in partnerships with local and regional governments.
Support diverse forms of knowledge in environmental decision-making to achieve sustainable urban futures: Today, hierarchies of knowledge persist, in which some forms of knowing are consistently valued above others. Local governments and local institutions can support diverse forms of knowledge—including indigenous knowledge, local knowledge and traditional knowledge—that respond to global demands and acknowledge specificity. This also requires redefining vulnerable groups from passive victims as active urban change agents (following the slogan “nothing for us, without us”).
Cities are complex systems that grow, develop and even shrink based on a variety of forces. Planning is an essential tool for shaping the future of cities, as unplanned human settlements are prone to sprawl, inefficient land use, poor connectivity and a lack of adequate municipal services. Good urban planning is one of the three pillars of sustainable cities, without which cities are unlikely to achieve the optimistic scenario of urban futures.
Recoverytopre-COVIDnormalislikelytodelayclimate action in cities: While in many cities, emissions plunged to unprecedentedly low levels during the lockdowns, rapid recovery to pre-COVID levels was observed after easing mobility restrictions with an observed increase in car dependency. There are concerns that economic recovery actions could derail many activities aimed at urban climate change adaptation and mitigation. Interventions in the energy and transport sectors are key to the success or failure of climate action in cities.
Current planning approaches continue to enable vulnerable groups to be disproportionately affected by pandemics: Vulnerable groups such as ethnic minorities and the urban poor have been disproportionately affected by the worst impacts of the pandemic, making it difficult to contain the spread of infectious diseases in cities. Modern urban planning has achieved limited success in equitably distributing resources. Profound inequalities have existed in cities for several decades, persist in the present and will possibly continue into the future without urgent changes in the way cities are planned.
Urban indoor and outdoor spaces are not versatile and flexible enough: The pandemic revealed issues related to the lack of versatility and flexibility in the design of indoor and outdoor spaces. It increased the demand for multipurpose and flexible spaces that can adapt to new situations, which is a significant shift from traditional urban planning practices like single-use zoning that often overlook flexibility and adaptability. Moving forward, there is a need for changes in the design of urban building layouts, working spaces, shopping malls, and open/public spaces to make them more flexible and adaptive to future shocks.
Compact cities are pandemic resilient: Concerns over densitybeingariskfactortotheriseofpandemicshasresulted in outmigration in some cities and could lead to new waves of suburbanization and urban sprawl with major socioeconomic and environmental implications. No compelling evidence has been reported on the role of density in virus transmission and mortality rates. However, there is consensus that density alone is not a major risk factor, and other factors such as income, infrastructure access and residential overcrowding could be more influential. A lack of access to health care and other services will increase vulnerability to pandemics and other future adverse events.
Urban-rural interlinkages are overlooked in urban planning and decision-making practices: Urban planning approaches continue to place limited emphasis on urban-rural linkages despite cities being dependent on their hinterlands for natural resources, commodities and multiple types of ecosystem services. Urban areas experience dynamic and non-linear flows both in and out of cities whether goods, trade, human movement or species migration. Such high connectivity levels have implications for resilience as shocks and disruptions in one part of the system could rapidly spread to the other parts.
Urban planning should urgently pursue climate action as a basis for greener urban futures: Measures taken to recover from the pandemic should help cities mitigate and better respond to climate change, which is a major threat looming over cities. There is need for a continued paradigm shift toward environmentally friendly and humancentric energy and mobility options. This can be achieved through efficient public transport and active mobility when integrated with energy-efficient modes such as electric vehicles powered by clean energy.
Post-COVID recovery should ensure a transition to more equitable and inclusive urban futures for all: Recovery programmes should prioritize addressing the needs of vulnerable and marginalized groups, including ethnic minorities, urban poor, immigrants, refugees, and those who are precariously employed or housed. To seize the pandemic as an opportunity to reform our cities and build back batter, it is essential to carefully assess the impacts on marginalized groups and ensure they are adequately engaged in planning processes.
Cityauthoritiesshouldinvestinthemultipleco-benefits of green infrastructure development: Integrating green infrastructure into the design of streets, street networks and open spaces is an effective way to enhance their flexibility and multi-functionality. Indeed, creating networks of green areas and green spaces will allow better responses to future pandemics while also providing co-benefits for climate change mitigation, adaptation and health by restoring and regenerating natural ecosystems.
Embrace the “15-minute city” concept as a model for creating walkable, mixed-use and compact neighbourhoods: As a new planning approach, the “15minute city” can guide the development of neighbourhoods where residents can meet most of their daily needs within a 15-minute travel time on foot, cycle, micro-mobility or public transport. Through the integration of green infrastructure, this model can also provide multiple co-benefits for health, equity, and climate change adaptation and mitigation. It is, however, necessary to make sure that 15-minute neighbourhoods do not exacerbate spatial inequalities in cities by becoming enclaves for wealthy urbanites that fail to integrate into the overall urban structure.
Urban actors must break down silos in pursuit of integrated urban and territorial planning: Planning should move away from silo-based approaches toward integrated plans and policies that consider interactions between multiple factors in a city region such as the hinterlands and surrounding ecosystems. Such socioecological approaches are more sustainable and resilient against present and future adverse events.

As history attests, the productivity and resilience of cities is undergirded by effective public health. Beyond hospitals, medicines and vaccines, equitable provision of healthpromoting infrastructure such as green spaces, improved housing, clean and safe drinking water, and extensive sewer systems to safely dispose of human waste are necessary minimum components for securing public health in urban areas. While COVID-19 led to the first major global pandemic in a century, the future portends more epidemics and pandemics. Public health is now once again at the forefront in envisioning the future of cities.
Urbanhealthrisksaremulti-layeredandchangerapidly: Since 2020, cities have had to grapple with more than just COVID-19 as Ebola, bird flu, H1N1 flu, MERS, SARS and Zika outbreaks occurred at different times and in different cities. The HIV-AIDS epidemic continues to be of concern with elevated rates of infection amongst marginalized groups such as racial/ethnic minorities, migrants and intravenous drug users. Moreover, climate-related risks are now increasingly contributing to urban deaths and ill health. Annually, an estimated 7 million people die prematurely due to air pollution. Urban food system transformations towards ultraprocessed foods with high levels of fat and sugar have led to the progressive increase of diet-related health risks and the rising toll of non-communicable diseases in both low-income and higher-income cities.
Inmanyurbanareas,thesamehealthrisksareexperienced and acted upon in different ways: These differences are attributedtoracialdivides,gendereddiscrimination,xenophobia and other sources of disadvantage. If left unchecked, these health inequities could lead to the pessimistic or even high damage urban future scenario. An improved understanding of how multiple factors contribute to urban health disparities at several levels and sites (including homes, workplaces and neighbourhoods) is key to effective interventions that can avoid entrenching urban health inequities.
Climate change is the foremost urban health threat and risks leading to the high damage urban future scenario: Climate change manifests in more frequent, intense and
longer-lasting extreme weather events, particularly floods and heatwaves. These and other disasters translate to complex overlapping urban health burdens, starting with immediate injuries, mortality, displacement and lost livelihoods amongst affected residents. Broader impacts include rising levels of urban water insecurity, increased rates of waterborne illness andescalatingfoodpricesandfoodinsecurity.Unabated,these conditions create a fertile ground for the high damage urban future scenario where health vulnerabilities are amplified, and poverty and inequality persist over the long term.
The increase in mental related illnesses is a growing urban health concern: Mental disorders are in the top 10 leading causes of disease burdens globally, and the number of disability-adjusted life years (DALYs) lost due to mental illness has increased by over 55 per cent over the last two decades. Rising levels of depression, anxiety and other mental health impacts have been linked to COVID19, particularly for essential workers, those with heightened caring duties (especially women), racial/ethnic minorities and other vulnerable groups.
The shift in armed conflicts to urban battlegrounds is another growing concern that could lead to the high damage scenario for urban futures: The use of heavy weaponry in towns and cities inevitably leads to heavier civilian casualties and destruction of interconnected basic infrastructure such as water, sanitation, gas and electricity lines leaving fragile communities highly susceptible to infectious diseases. Further, armed conflicts disrupt health systems including physical destruction of hospitals, flight of healthcare workers and interruption of child vaccination and communicable disease surveillance programmes. These healthsystemsrequireintensetimeandresourceinvestments to rebuild. Consequently, the occurrence of armed conflict can lead to prolonged instabilities and intractable poverty as resources are diverted away from development long after the weapons are silenced.
If cities take the Health in All Policies Approach, they can make progress on multiple SDGs: By mainstreaming the Health in All Policies (HiAP) approach, cities can realize multiple benefits and unlock synergies between health and sustainable development pathways. Adding a health perspective in urban decision-making can simultaneously improve health (SDG 3), tackle poverty (SDG 1), foster gender equality (SDG 5) and enhance access to clean energy and climate-resilient infrastructure (SDGs 7 and 9).
Local governments are best placed to design and implement multisectoral approaches to effectively realize healthy urban futures: A multisectoral approach is necessary because health is an essential component of sustainable urbanization given its impact on and interrelation withsocial,economicandenvironmentaltargets.Responsive, accountable local governments play a pivotal role in translating global and national targets to effective place-based interventions that generate multiple co-benefits for health, inclusion and climate change mitigation. Local governments, however, need stable funding, long-term political support and effective mechanisms for public engagement.


Ongoing disaggregated data collection is essential for effective responses to future urban health risks: Since urban health risks are multilayered and change rapidly, policymakers require ongoing data collection with attention to emerging and differentiated health challenges in urban areas. Using disaggregated data to inform inclusive interventions,policymakerscandevelopholisticmultisectoral initiatives that address complex urban health inequities and support locally rooted solutions. City authorities can leverage digital technology such as telemedicine and drones, as well as community-led citizen science, to collect data from marginalized and hard-to-reach groups to ensure they leave no one behind.
Governments should provide universal health coverage to strengthen future health system preparedness: With the anticipation of future epidemics and pandemics, inequitable access to quality healthcare compromises the collective health and well-being for all. COVID-19 has unequivocally demonstrated that in an interconnected world, infectious diseases mock geographic, socioeconomic and other privilege boundaries. As part of the new social contract, governments should provide universal health coverage that secures equitable access as well as sufficient quality and affordability of healthcare for effective response to urban health crises in the future.


Addressing mental illness is an urgent priority not only for supporting health and dignity but also for continued economic and social development: Improving access to mental health programmes and developing holistic strategies to address mental illness remain a key concern globally, especially in the wake of COVID-19. Key priorities for equitable, inclusive mental health initiatives include additional investments that link mental health with universal health coverage and primary healthcare interventions. The new approach to mental health must move beyond biomedical techniques and instead seek to address the social determinants of health such as improving access to urban green spaces and enhancing social cohesion, as well as countering stigma facing those with mental illness.

Whichever future urban challenge cities face, whether it is poverty, health, housing or the environment, urban governance always has a critical enabling role to ensure that the capacities and resources of institutions and people match their responsibilities and desires. Sustainable urban development is not possible without effective multilevel urban governance – including local governments, civil society and national governments. Governments have been severely tested since 2020, which means now is the time to rethink urban governance and put cities on the path to an optimistic future scenario.
A spatial justice approach is essential to respond to shocks: A spatial justice approach that includes vulnerable residents in decision-making has proven to be essential in responding to future global shocks. Cities with a more equitable and accessible distribution of basic services were better able to protect vulnerable and high-risk communities from the COVID-19 pandemic. Cities with more autonomy in local government are better positioned to respond to health care crisis with contextualized knowledge and experiment with different approaches and service delivery.
COVID-19 accelerated the digitalization of urban governance: Physical distancing and lockdowns required governmentstorapidlyscaleuptheiruseofdigitaltechnology to conduct basic functions. This trend provides opportunities for the future of urban governance as governments can use new technologies to make data collection more reliable, provide more open data, communicate better with residents and improve service delivery. But cities also have a responsibility to govern how new technologies are used and work to eliminate the digital divide while protecting the safety and privacy of residents.
City diplomacy and international city networks are increasing in number and political potency: Cities and subnational governments are reasserting themselves on the international stage and supplementing national governments where national frameworks are lacking. City diplomacy and international city networks provide an emerging opportunity for cities of all sizes and geographies to address transnational
issues, as well as exchange experience and learn from each other to adapt governance approaches to evolving future challenges.
A lack of human and financial capacity continues to strain sustainable urbanization: Cities, especially in developing countries, continue to lack adequate capacity to addresscurrentandfuturechallenges.Alackofresourcesand trainedprofessionalslimitsthecapacityneededtoimplement transformative changes, while also creating conditions for corruption. The future of multilevel governance relies on effective decentralization of decision-making, enhancing local fiscal autonomy and stronger links between national urban policies and cities.
Civil society and participatory process are under threat: While many cities are engaging in innovative participatory processes, globally, the space for civil society is shrinking. State-initiated participation can be tokenistic and is often disregarded in crisis situations. Evidence of, or even the perception of corruption, or mishandling of finances undermines trust between the government and civil society. If this trend continues, the future of cities will be more authoritarian.
Future urban governance should institutionalize the mindset of planning for shocks and disruptions: For urban governance to be prepared for an age of global threats and disruptions it will require collaborative and concerted action to prepare processes and systems that can withstand and recover from shocks in an effective and inclusive way. There is a need to institutionalize planning frameworks that incorporate disruptions as a central element and learn from previous shocks and challenges. Effective multilevel governance for disruptions needs to balance clear legal frameworks with a flexible approach to new partnerships, cooperation, solidarity and collective action within and between state and non-state actors.
The need to build trust and legitimacy of institutions is crucial for the future of urban governance: With the anticipated rise in global shocks including climate, security and public health crises, the need for trust and legitimacy of institutions is crucial. With ever larger cities, the distance between governments and their citizens has increased. Effective communication, meaningful participation opportunities and accountability structures built into integrated governance relationships are all necessary
responses for addressing the trust equation. In light of the digitalization of urban governance, maintaining privacy and security of data should be a priority for maintaining trust.
The future of effective local government relies on wellcoordinated metropolitan governance: Future urban areas are projected to grow far beyond the boundaries of any particular jurisdiction, which necessitates new and adaptable urban governance and management frameworks. Metropolitan governance with institutionalized frameworks has demonstrated an ability to optimize coordination, engage secondary and rural communities, and create collaborative approaches in mitigation, adaptation and recovery efforts. The future of metropolitan governance, however, is plural: there is no single metropolitan model of governance that works everywhere. Metropolitan governance needs to have adequate political and institutional legitimacy, clearly defined roles and need capacity and resources that meet their responsibilities.
National governments should enable better local government finances to respond to the challenges of urbanization: Effective models for collaborative governance, financing and integrated development should be responsive to ever-changing future conditions and needs. Financial managers should resist parachuting normative best practices into inappropriate contexts. Sustainable urban development requires comprehensive and context specific financial management that includes diverse sources of funding. Clearer national regulation and more decentralized governance plays an important enabling role to a financially solvent urban future, making transfers to local governments more regular and allowing cities to borrow and issues bonds.
The future of equitable service delivery relies on governance through modes of co-production with relevant stakeholders: Achieving equitable outcomes with respect for human rights and the well-being of residents will require urban policymakers to re-envision their relationship with the public. Governments need to fully acknowledge and invest in slum dwellers and their organizations as true development partners. Special attention must be paid to underrepresented groups and co-create strategies such as re-municipalization, community-led finance and forms of co-production of urban services. Civil society has different roles—as service providers, agents for civic engagement and enforcers of social accountability, and as financiers through philanthropy—and the future of urban governance needs to ensure regulation better reflects the different roles they play in society.
Advances in technology and urban futures are inextricably linked. The future of cities will be knowledge-based, driven largely by innovation and the widespread use of new technologies and digitization of virtually all facets of urban life. Technological innovations define the twenty-first century. Cities are going through a wave of digitalization that is reshaping how urban dwellers live, work, learn and play. Technology holds great promise for improving urban livelihoods, but there are also risks that smart city technology will invade privacy. Cities, meanwhile, are competing for innovation-based businesses in a race that will create both winners and losers in urban futures.
Innovation and technology play an increasingly central role in planning for urban futures: This arises from rapid advances in technological developments, the pace of urbanization, and the scale of urban challenges requiring systemic responses. Urban innovation extends beyond technology: it also encompasses social and organizational innovation, which recognizes the important contribution of civic organizations and community groups to urban development,andthebenefitsofmoreopenandcollaborative local government.
Digitalization and automation are transforming urban economies: Smaller cities and suburban areas may benefit from the shift towards hybrid working (accelerated by the COVID-19 pandemic). Larger cities may be less exposed to the impacts of automation, given the concentration of highly skilled professionals. Significant changes in the mix of job occupancies can be expected in the formal economy in both developed and developing countries. Some cities offer re-skilling programmes to prepare residents for the future of work. In informal economies, digitalization may provide significant opportunities.
Theurgencytodecarbonizeurbaneconomiesisdriving the convergence of green and smart technologies: A key feature of smart environmental technologies is their suitability for flexible, modular designs and local adaptations. Thebenefitsincludesustainableenergyproduction,improved resilience and financial incentives (e.g. feed-in tariff) for
residents. The trend towards more localized applications highlights the importance of on-the-ground partnerships and community buy-in.


There is a rapid growth in the demand for smart city technology:Thedemandforsmartcitysystemsandsolutions is estimated to increase annually by 25 per cent, with an overall market value of approximately US$517 billion. This is driven by governments investing in technology to meet the demands of an urbanizing world. This also based on rapid advancements in digital and connected technologies and their ubiquity in everyday life. The speed with which cities are adopting smart technology is illustrated by strong demand for Internet of Things technology, with over 20 per cent annual growth forecast for the coming years. Similarly, blockchain technology is predicted to grow by over 30 per cent in the next few years. Artificial Intelligence technologies are increasingly deployed by municipal governments in the form of virtual agents like chatbots.

Technological advances risk exacerbating existing, and generating new, socioeconomic inequalities: The digital divide tends to adversely affect women, the elderly, ethnic minorities and immigrants most acutely. Cities can mitigate this with measures include providing affordable Internet access, skills training and community support. An environmental divide occurs when urban sustainability initiatives disproportionally benefit middle-class residents. Cities are faced with a series of complex ethical, legal, and technical issues through the introduction of frontier technologies, such as drones and autonomous vehicles. This requires careful assessment. Several initiatives have been put in place to mitigate the risks of digitalization and other technological innovations.


Innovation practices need to be tailored to local contexts: Smaller cities, and cities in emerging and developing countries, may need alternative approaches to innovation than those pursued by world cities and major metropolitan regions. Cities can use their convening power to nurture a culture of innovation with a focus on addressing major urban challenges. Innovation should be approached more broadly than traditional research and development by involvingawiderrangeofstakeholders,includingcivilsociety organizations and community groups. City governments can lead by example, by innovating in more open, collaborative, and inclusive planning and decision-making.
City governments should embrace low-carbon technologybutmitigatenegativeenvironmentaleffects: The combination of green and smart technologies creates new opportunities for small-scale and small-grid, modular, and flexible systems and applications. Together with their relative affordability, this can benefit communities, towns and cities with limited financial and infrastructural resources. But cities need to consider the negative environmental externalities when investing in low carbon and digital and connected technologies. This includes environmental problems associated with the mining of rare earths (e.g. lithium for batteries), toxic electronic waste and high energy consumption of some technologies (e.g. blockchain).
Localgovernmentsneedtopreparetheireconomiesfor the effects of advancing automation and digitalization: This includes taking an active approach to digital (labour) platforms,ifnecessary,withappropriateregulationtoaddress the problem of precarious work. There is an important agenda for skills development and training, to counter the risk of growing social inequalities and exclusion arising from technological advances. This should particularly focus on those on the wrong side of digital and environmental divides. Mobilizing community members as trainers can be useful, for example in informal settlements.
Cities can use digital tools innovatively to improve the provision of public services and local decisionmaking: To avoid top-down, one-way communication, digital tools need to be inclusive, collaborative and empowering. Their use needs to align with wider offline decision-making structuresandprocesses.Whilefulltechnologicalsovereignty may be out of reach, city governments have an opportunity and responsibility to co-determine how innovation and technology are designed for, and applied in, cities. They should initiate, and participate in, technology assessments, and involve other urban stakeholders in the process.
Any scenario of urban futures outlined in this Report will face unexpected shocks and stresses. Will a given city collapse like a house of cards or withstand whatever unpredictable future comes their way? The answer to that question lies in a city’s resilience, a capacity that bookends all of the discussion up to this point. A key message running through this Report is that building economic, social and environmental resilience, including appropriate governance and institutional structures must be at the heart of the future of cities. Cities that are well-planned, managed, and financed have a strong foundation to prepare for such unknown future threats. Moreover, cities that are socially inclusive and work for all their residents are also better positioned to face environmental, public health, economic, social and any other variety of shock or stress, as cities are only as strong as their weakest link.
Resilience thinking has embraced the “building back differently” mentality: The schools of thought on urban resilience continue to evolve and now emphasize the importance of positive change in recovery processes to reduce urban poverty and inequality as key determinants of vulnerability and risk exposure. This means addressing the spatial and environmental as well as social inequality and injustice that are reflected in the urban built environment.
Resilience practitioners can benefit from several diagnostic, monitoring and evaluation frameworks: The most widely used of these tools is the City Resilience Index. These frameworks examine the economic, social, environmental and institutional dimensions of resilience. However, addressing these dimensions separately risks negative trade-offs. Maximizing added value and prospects for success therefor requires integrated and holistic policy and practice, as emphasized through the analysis of good governance and integrated, holistic policy and planning.
Thereisnoeither/ordividinglinebetweenincremental and transformational change in human settlements: If the current context has clearly prevented a step-change to transformational adaptation, it is unlikely suddenly to
become feasible and be initiated without substantive reform or realignment of governance institutions and processes. Moreover, such changes are often complex, messy and slow. Conversely, substantive gains can be made under broadly existing arrangements, promoted by appropriate champions among officials and elected representatives, and that do not demand unrealistic institutional reinventions as a prerequisite.
Science and technology are evolving rapidly and opening new possibilities for positive change: However, the equity and justice dimensions to such technological deployments are often overlooked. Who benefits and who suffers when constraints are introduced? The costs and benefits of specific technologies or an entire technologydriven package like smart cities, when introduced into particular contexts, need explicit inclusion in planning, decision-making and monitoring.
Effective urban resilience capacity building requires mainstreaming across local government: Proactive climate change, vulnerability and disaster risk reduction and pandemic response policies cannot be undertaken as add-ons to other work or concentrated in one specific department, but rather must be incorporated into the annual and multiyear workplans and design standards of all departments. In turn, this requires effective forward-looking design and planning frameworks that factor in local forecasts of future climatic, environmental and public health conditions so that infrastructure, buildings and services are built or retrofitted to appropriate standards to withstand best estimates of conditions that will prevail over the coming decades.
Governments already have a roadmap to urban resilience in the global sustainable development agenda: The multilateral system has laid out a framework for achieving urban resilience in the form of the SDGs, the New Urban Agenda, Sendai Framework for Disaster Risk Reduction, the Addis Ababa Action Agenda and the Paris Agreement on Climate Change. Together these documents provide a coherent framework for integrated, multi-level action that recognizes the importance of subnational entities, particularly local governments, in building resilience.
Building substantive urban resilience must be multisectoral,multidimensionalandmulti-stakeholder: The process of making cities more resilient only works if it is forward-looking, inclusive of all stakeholders (including
the marginalized and poor) and proactive. It also provides an integrated investment in preparedness and building back differently, not just building back, or building back better along the same lines that perpetuate existing inequalities and injustice. Hence, as with sustainability, resilience is about increasing equity while reducing poverty and injustice.


Policymakers must match urban risk assessments with appropriate solutions: Cities face a diverse range of hazards, including but not limited to pandemics and climate change, and must create accurate, localized and downscaled assessments of those threats. But without appropriate remedial steps, cities risk leaving their citizens despondent. Furthermore, short-term plans and interventions, such as those within a single planning, budget or electoral cycle, must align with those for the medium and longer terms, whicharetherelevanttimehorizonsforaddressingstructural inequalities and so-called “wicked” challenges like building sustainability and resilience.


Visioning and implementation of urban resilience plans must prioritize the poorest and most vulnerable communities: These categories of urban residents face the brunt of hazards and risks due to their location, as frequently they are confined to less desirable and more risky urban land. Such populations are disproportionately experiencing cascades or chains of increasingly frequent and often severe impacts that are compounding their vulnerability by undermining their assets and resilience.
Building urban resilience will not succeed without public participation: Resilience is not a top-down process butratherabottom-upone,andanyefforttoprepareresilience plans, draft policies or implement projects will have greater prospects for success if undertaken using active participatory methods so that all residents and stakeholders are involved in planning and decision-making. Through co-production and co-design of resilience, residents will develop a shared sense of ownership alongside local government.


1. Cities are here to stay, and the future of humanity is undoubtedly urban, but not exclusively in large metropolitan areas.
2. Urbanization will continue to be a transformative, but uneven process that will require differentiated responses depending on the diversity of the urban context.
3. The worst-case scenario of urban futures will have disastrous consequences for cities; thus, resulting in economic uncertainties, environmental challenges and exacerbate existing vulnerabilities.
4. A business-as-usual approach will result in a pessimistic scenario of urban futures characterized by the systemic discrimination and exclusion of the poor in urban agendas.
5. With concerted policy action, it is possible for cities to avoid either of the high damage or pessimistic scenarios and instead emerge into a more optimistic urban future.

1. The emergence of urbanization as a global mega-trend is intertwined with the existential challenges that the world has faced in the last 50 years.
2. Building economic, social and environmental resilience, including appropriate governance and institutional structures, must be at the heart of the future of cities.
3. The disruptive nature of COVID-19 and the emerging global uncertainties are all stark reminders that urban areas need to be prepared for an ever-changing and unpredictable future.
4. Any vision for an optimistic future of cities must embody a new social contract with universal basic income, health coverage and housing.
5. Localizing the New Urban Agenda and SDG 11 is the most promising pathway to the optimistic scenario of urban futures.

Policymakers,researchersandurbanresidentshavelongbeen preoccupied with the future of cities, particularly in charting the divergent demographic, economic, social, environmental and policy pathways that will lead towards more sustainable outcomes.1 Thispreoccupationisduetoagreaterrecognition in the multilateral system of the role that urban areas play in securing sustainable futures across a range of key global issues, including climate change, inclusive economic growth, poverty eradication, housing, infrastructure, basic services, productive employment, food security and public health.2 Analysis of a range of urban futures offers an investigative and diagnostic view on how cities can be prepared for an ever-changing world. Such analysis can also explore the drivers and scenarios behind the aforementioned pressing global challenges, all of which have an increasingly urban dimension.
adopted in the last decade, in the quest to find long-term solutions to global challenges such as the ongoing pandemic, climate change, inequality and rising poverty. Since 2020, armed conflict has also taken centre stage among pressing challenges that impede sustainable urban development. Years old conflict has persisted in Syria and Yemen, while new conflicts have flared up in Ethiopia, Myanmar and Ukraine. The seizure of power in Afghanistan by the Taliban in 2021 was also tumultuous for human settlements across the urban-rural continuum. These conflicts are reminders that the spectre of war remains an enduring threat even in the twenty-first century. Ultimately, however, the lessons from the pandemic offer an opportunity to reflect on the role of local governments in driving the direction of city diplomacy amid global systemic disruptions.6 The world must maintain its focus on delivering the global development agendas and local governments are key players at the forefront of that effort. Local governments have not only embraced these agendas,buttheywereactivelyinvolvedintheirnegotiation.7
Recently, the future of cities agenda has assumed a greater level of importance and urgency given the disruptive impacts of COVID-19 and its implications for urban areas.3 In this regard, governments, international agencies, the private sector and scholars, among others, are critically examining what the future of cities portends in the aftermath of COVID19.4 While the early days of the pandemic in 2020 created a temporary crisis of confidence in the urban future as many of the world’s largest cities saw their populations shrink and their residents disappear from public spaces, a broad consensus is that urbanization remains a powerful twentyfirst century mega-trend. Indeed, there is now an emerging sense of optimism that the crisis may provide us with the opportunity to build back better, stronger, more inclusively, greener and safer based on the impacts and lessons learned from the pandemic. COVID-19 provides the opportunity to look back, correct past mistakes and transform cities globally for future resilience, inclusion, green growth and economic sustainability.
5


In casting an eye on the future, we must also establish crucial links with the past. That imperative compels us to embrace the overarching role of multilateralism, especially the interrelationship between the various development agendas
The emerging “new normal” seeks to brings us closer to the solutions and behavioural changes that address the structural problems of the past and set us on the path to a more sustainable future. For instance, the short-term environmental gains that accompanied the lockdown during the peak of the pandemic in 2020 are an indication of the willingness of people to comply with government directives and alter their behaviour for the common good. Urban areas are best placed to foster the behavioural and lifestyle changes that are necessary to ensure the transition to resilient and sustainable urban futures. Cities remain central to the sustainable development trajectory as planned urbanization provides the foundation, institutions and prosperity that are crucial in the efforts to build back better, more inclusively, greener, safer and smarter.
Most cities are not able to meet the triple objective of being economically productive, socially inclusive and environmentallysustainable.8 Consequently,transformation in cities and communities along certain priority areas are required to achieve the Sustainable Development Goals (SDGs). These priorities include ensuring access to a clean water supply, functional sanitation, and appropriate sewage and waste disposal; providing sustainable and efficient
The future of cities agenda has assumed a greater level of importance and urgency given the disruptive impacts of COVID-19 and its implications for urban areas
Since 2020, armed conflict has also taken centre stage among pressing challenges that impede sustainable urban development
mobility; promoting more compact, safe and healthy settlements; and enhancing resilience against climate change, extreme weather events and disease transmission.9 All of these priorities resonate with measures taken to mitigate the impacts of COVID-19 and achieve more sustainable urban futures.
The United Nations gave us a glimpse into the future in 2014 when it collated 202 contributions from scientists in response to the question “What do you think the world will be like in 2050?” These responses were synthesized to 95 ideas and the scientists were invited to vote on their ideas. Table 1.1 shows the top 15 ideas that were voted as the likely futures if the world continues in the business-as-usual historical path of incremental improvements in reaction to perceived crises, instead of a shift towards a long-term perspective anticipating the troubles ahead.10 The standout ideas are accelerating climate change, inequality, poverty and unsustainable consumption of natural resources. Many of these issues are unfolding in urban areas (as indicated in the shaded areas of Table. 1.1), which account for 56 per cent of the world’s population. In just six years, many of these anticipated future outcomes have been accelerated by the impacts of the COVID-19 pandemic.
From a demographic perspective, a glimpse into the future, points to a world that will continue to urbanize over the next three decades – from 56 per cent in 2021 to 68 per cent in 2050, with urban areas absorbing virtually all the future growth of the world’s population (Figure 1.1).11 Whatever urban-to-rural migration occurred temporarily during the COVID-19 pandemic is not forecasted to alter the fundamental reality of a predominantly urban world. This trend line implies that the level of urbanization will increase by 12 percentage points over the next three decades, which translates to an increase of 2.2 billion urban residents, with most of these living in Africa and Asia. All regions of the world are expected to become more urbanized in the next 30 years, although highly urbanized and more developed regions are expected to stabilize or experience a decline in the rate of urban growth. Unequivocally, this tells us that cities are here to stay, and that the future of humanity is undoubtedly urban, but not exclusively in large metropolitan areas (Chapter 2).
The increase in urbanization is intertwined with the existential challenges that the world has faced in the last 50 years.12 These challenges include long-term stresses like climate change and income inequality, as well as immediate
Idea Score
Global collapse of ocean fisheries before 2050
Accelerating climate change
There will be increasing inequity, tension and social strife
Global society will create a better life for most, but not all, primarily through continued economic growth
Persistent poverty and hunger amid riches
Humanity will avoid “collapse induced by nature” and has rather embarked on a path of “managed decline”
Two-thirds of world population will be under water stress
Urbanization will reach 70 per cent (+2.8 billion people in urban areas, -0.6 billion in rural areas)
The number of people going hungry will be reduced by 500 million people, still leaving 250 million with insufficient food
Continued lack of understanding of the complex non-linear dynamics of ecosystems
Food production peaks around 2040 at a level 60 per cent above today’s current levels, in terms of tonnes of food per year75
Gross world product keeps growing until the second half of the twenty-first century, but at an ever-decreasing rate
Temperatures and sea levels will continue rising, as will the share of renewable energy use
Massive human interference with phosphorus and nitrogen cycles well beyond safe thresholds
Greenhouse gas (GHG) emissions will increase by 70 per cent, from 48 to 83 GtCO2-equivalent. Most of the increase will be in Brazil, Russia, India, China and South Africa (BRICS).
Source: UNDESA, 2014a.
Table 1.1: Top 15 crowdsourced answers to the question “What do you think the world will be like in 2050?”
Source:

shocks.Theriskofzoonoticvirusescametotheforefrontwith the COVID-19 pandemic, which triggered the worst public health crisis in a century and the worst economic recession since the Great Depression. The armed conflict in Ukraine that began in February 2022 has led to the most destructive urban warfare since World War II. These challenges will leave their imprints on the future of cities in different ways. The concentration of greenhouse gases as measured by carbon dioxide, driven mainly by human activities, especially the burning of fossil fuels, has been increasing since 1958 and currently stands at 413.64 ppm.13 The Intergovernmental Panel on Climate Change (IPCC) report Climate Change 2021: The Physical Science Basis notes that global warming of between 1.5°C and 2°C will be exceeded during the twenty-first century unless net carbon emissions decline by 45 per cent by 2030 based on 2010 levels.14 This report was a call to action for sustained reduction in the use and production of fossil fuel and massive investments in clean energy projects and infrastructure to the tune of US$4 trillion annually by 2030 to get the world on track for net zero emissions by 2050.15
However, current plans by governments to produce fossil fuels up to 2030 are incompatible with limiting global temperatures to 1.5°C. Global energy markets have been in flux since Russian military operations in Ukraine began
and the long-term consequences of that conflict remain to be seen. Many countries have signalled their intention to stop importing Russian oil and gas, but it as yet unclear if this geopolitical shift will accelerate the adoption of renewable energy or shift consumption to other sources of fossil fuels. Regardless of recent events, Chapter 5 notes that the transition to net zero is marked by lack of ambition and policy pitfalls. The assessment of recent national energy plans and projections shows that governments are in aggregate planning to produce around 110 per cent more fossil fuels in 2030 than would be consistent with limiting global warming to 1.5°C, and 45 per cent more than would be consistent with limiting warming to 2°C, on a global level.16 By 2040, this excess is expected to grow to 190 per cent and 89 per cent respectively. While many governments have pledged to lower their emissions and even set net zero targets, they have not yet made plans to wind down the production of the fossil fuels, which generate most emissions.17
Current plans by governments to produce fossil fuels up to 2030 are incompatible with limiting global temperatures to 1.5°C
We have also witnessed continuous growth in the world economy: doubling since 2000 to US$66.2 trillion in 2010 and increasing to US$84.7 trillion in 2020.18 At the same time, inequality, which has been increasing for more than 70 per cent of the world’s population,19 is expected to rise further on account of the impacts of COVID-19. Growing inequality in the face of increasing global income is an indication that the gains in real income have been beneficial to the very wealthy in all countries and to the rising middle class in developing countries.20 The bleak prospects for lowskilled workers and young people in the labour markets of low-income countries in the aftermath of COVID-19 point to increasing levels of inequality and higher vulnerability to extreme poverty; as between 65 and 75 million more people are estimated to fall into extreme poverty in 2021 compared to pre-pandemic projections.21 High rates of inflation globally as well as disputed food supply chains due to the conflict in Ukraine are putting further strains on the lowest rungs of the economic ladder. We cannot envision a bright future for cities when inequality appears to be on the rise globally and extremepovertyloomsincertainregions.Chapter3discusses what needs to be done to prevent poverty and inequality from becoming permanent features of the future of cities.
Rapid urbanization and the globalized nature of cities have added new layers of urban health risks as the world has increasingly witnessed the spread of zoonotic diseases such as avian influenza, severe acute respiratory syndrome (SARS), Ebola and most recently, COVID-19. As cities seek to recover from the impacts of the pandemic, the UN-Habitat report Cities and Pandemics: Towards a More Just, Green and Healthy Future makes a case for a new social contract in the form of universal basic income, universal health coverage and universal housing.22 This proposal is further discussed in this chapter and in Chapter 3.
Demographic responses to COVID-19 indicate a new pattern of secondary cities as subregional hubs that connect the 62 per cent of the world’s population living in smaller cities, towns and rural areas with the 22 per cent that live in larger metropolitan regions.23 Following the outbreak of

the COVID-19 pandemic, many urban dwellers, especially those in large cities, fled. More affluent residents retreated to second homes in the countryside. Middle-class families movedtosmallertownsthatofferedmoreaffordablehousing. Low-income residents saw service sector jobs decimated and left in search of economic opportunity. The cumulative effect was a net decline in major cities. For example, United States Census data shows the largest net declines in population from 2020 to 2021 were in Los Angeles County (179,757) and Manhattan (113,642).24 Although such net population declines might be temporary, this reshuffle has implications for the role secondary cities can play in the future as more workers in knowledge-based fields work remotely or adopt hybrid modes of working.
This territorial reorganization raises the question of what will happen with small- and medium-size cities as they become increasingly important in the regional landscape? Will accelerated digitalization prompted by the COVID-19 pandemic undo the economic advantages of large cities?25 On the contrary, can economies of scale and agglomeration effects show their capacity to re-energize new urban activities in the aftermath of shocks and threats?
These concerns raise key questions about the future of cities, especially the kind of cities needed to support humanity in a predominantly urban world. How do we envisage and reimagine the future of cities? What do we want our cities to look like? What are their different possible transitions and trajectories? What are the possible scenarios for growth and development? What are the most desirable outcomes and the likelihood of achieving them?
The disruptive nature of the COVID-19 pandemic is a stark reminder that urban areas need to be prepared for dynamic and unpredictable futures. The pandemic clearly exposed the soft underbelly of cities and their vulnerability to shocks. Cities across the world were totally unprepared for the magnitude of the economic and social impacts of the pandemic. We live in an age of global threats and disruptions that require concerted action, which can only be achieved in the spirit of solidarity and cooperation, as no single government or multilateral agency can address such threats alone.26 The world must therefore be better prepared to predict, prevent, detect, assess and effectively respond to threats in a highly coordinated manner.27
Growing inequality in the face of increasing global income is an indication that the gains in real income have been beneficial to the very wealthy in all countries and to the rising middle class in developing countries
 Subway train passengers with protective masks, Sofia, Bulgaria © Shutterstock
Reflecting on the nature of and responses to the COVID-19 pandemic helps us filter some key lessons for the urban world, which is likely to witness other epidemics and even pandemics in years to come. As such, cities must be prepared for a dynamic and unpredictable future.
i. The pandemic crossed territorial boundaries despite border closures. Geographic exclusion and social privilege had limited efficacy. Highly contagious disease teaches us that a threat anywhere is a threat everywhere. Effective response to a global threat calls for multilateral collaboration that complements and reinforces national and local efforts in a spirit of solidarity, mutual respect and cooperation.
ii. The pandemic reminded us that well-planned cities can better manage contagion when they provide density without residential overcrowding, enhance accessibility, limit urban sprawl and provide room for public green spaces. Integrated urban planning that promotes socio-spatial equity and green, well-provisioned neighbourhoods for people’s health and well-being is critical for adaptation and resilience for the future.
iii. No one level of government and no single ministry, department or agency was able to address the pandemic on its own. The most effective and efficient urban governance framework in the face of dynamic, unpredictable urban futures proved to be multilevel governance with multi-stakeholder collaborations from the micro level (neighbourhood) to the meso level (sectoral) to the macro level (regional to global).
iv. Effective responses defined the pandemic on a broader perspective beyond the health domain, recognizing the socioeconomic, political and built environment factors that aggravated risks and vulnerabilities. Socio-spatial inequalities manifest in the urban services divide, which presented nodes of weakness in curbing the spread of the virus. Bridging the gap and addressing multidimensional urban poverty and inequalities in access to water, sanitation, basic health, adequate housing and digital tools are crucial for building resilient urban futures.
v. The post-pandemic city is not the same as the future city. While emergency responses to the pandemic offered us a glimpse of a radical shift in daily urban life, their social and environmental benefits were short-lived. Realizing the green, inclusive, sustainable urban futures will require deliberate long-run transformative interventions closely attuned to the demands of local contexts and backed by adequate resources.
The pandemic revealed and amplified long-standing weaknesses in the social structure of cities, resulting in disproportionate impacts on specific segments of the population, especially vulnerable and marginalized groups. Key lessons emerging from the COVID-19 pandemic are that urban areas must invest in preparedness, which requires developing the economic, social, environmental and institutional resilience to respond to a wide range of shocks, including having contingency plans for the most vulnerable groups (Box 1.1).28
If the world were to experience another pandemic or major threat in the future, would urban areas be sufficiently prepared to respond based on the lessons learned from the COVID-19 pandemic? Would cities have developed a robust
system of resilience to respond to and withstand such a threat? To meet this challenge, urban futures must reduce inequality and poverty; foster productive and inclusive urban economies that provide opportunities for all; and adopt environmental policies and actions that mitigate and adapt to climate change, promote clean energy and protect ecosystems – all of which are facilitated by responsive planning and governance systems in which with finance, innovation and technology play overarching roles.
The unpreparedness of cities to address pandemics and related shocks is an indication that the current process or model of urbanization is inadequate on several grounds. In many contexts, the outcome of this process of urbanization is environmentally, socially and economically
unsustainable.29 Under such conditions, the process is, to some extent, dysfunctional and even erodes the inherent value of urbanization.30 Disease modellers are quick to note that COVID-19 will not be the last pandemic that cities will face; new outbreaks of other pandemics and major health emergencies will occur31; cities will experience recessions, natural disasters, armed conflict and social unrest, among other shocks. As has often been repeated over the last two years: a threat anywhere is a threat everywhere and no one is safe until everyone is safe.32
Our urbanizing world must be adequately equipped to respond effectively to a broader range of shocks and ensure the transition to a more equitable, inclusive, green, resilient andhealthyfuture.Ifnot,millionsofcitydwellersindifferent parts of the world will continue to live in a future that is unfolding without the necessary scaffolding against the many threats to humanity that eclipse their dream of a better urban future. It is therefore in the interest of countries that urban futures embody a well-functioning system of cities alongside institutions that can cope with future crises and prepare for a societal reset. Such cities can help galvanize resources from multiple sources to invest in robust health infrastructure as part of city resilience development programmes, including urban development, management and governance.33
The pandemic has raised the profile of cities even further as being key to building more resilient and inclusive societies, and central to countries’ recovery strategies.34 Beyond
the primary concern of the public health emergency and containing the virus to protect societies, as shown in Chapter 7,thepandemichascompelledcitiestoreconsiderhowspaces are planned and used, how services are delivered and how equitable development and economic growth can be resumed to achieve more just, inclusive and equitable societies.
The future of cities is one that should embody the fundamental principles of human rights, greater equality, trust, compassion and solidarity. Building economic, social and environmental resilience, including appropriate governance and institutional structures, must be at the heart of the future of cities. Economic resilience with new fiscal sustainability frameworks, societal resilience with universal social protection schemes, climate resilience with greener investmentsandstrongermultilevelcollaborationtoconfront future shocks – these elements must be the main building blocks of a resilient future that can withstand and respond to the various threats and shocks that urban areas face.
the global economy, degree of informality, culture, local challenges, and local political and institutional
linkages
World 1.90
More
developed
1.33 1.22 1.131.48
0.36 0.32 0.280.39
2.34 2.09 1.88 1.71 1.56 1.42 1.312.09
Africa 3.58 3.44 3.32 3.19 3.04 2.89 2.713.17
2.16 1.84 1.58 1.35 1.15 0.98 0.841.41
0.35 0.30 0.28 0.26 0.25 0.22 0.170.26
Latin America and the Caribbean 1.30 1.15 1.00 0.85 0.72 0.59 0.470.87
North America 0.95 0.96 0.92 0.84 0.75 0.67 0.620.82
Oceania 1.42 1.30 1.24 1.18 1.15 1.12 1.070.89
Source:
systems.35 Every major region of the world has its unique featuresanddevelopmentoutcomes,whichmustbereflected in polices for achieving better urban futures. Ideally, this diversity implies that every city will have to design its future journey to reflect the unique combination of opportunities and constraints that it faces.36 Urbanization will continue to be a transformative, but uneven process that will require differentiated responses. At the same time, there are areas of convergence across the urban context. Cities create wealth, enhance development, fulfil aspirations, harness human progress and increasingly deploy new technologies to address diverse challenges. The future of cities should reflect to varying degrees the challenges and opportunities that cities face.
Thissectionexploresthediversityofurbanizationindifferent contexts with a view to drawing out the implications for the future of cities. The issues to be addressed in the future of cities can be classified into two broad categories: those that affect developed and developing countries. There are overlaps within such simplified categorization, which is not intended to be exhaustive but rather illustrative of some of the trends and challenges of the diversity of the urban context in different settings to which the future of cities must address.37
Whiletheglobalurbantransitionwitnessedoverthelastthree decades has been phenomenal, the level, pace and processes driving urbanization are uneven across the world. The process of urbanization is much advanced in the developed
regions of the world where 79 per cent of the population reside in urban areas (Table 1.2). This trend will continue, albeit slowly, as 87 per cent population is expected to be urban by 2050. While the level of urbanization in developed countries is high, the rate of urban population growth is low, declining and even negative in some countries. Urban population is expected to grow at 0.46 per cent annually between 2020 and 2025 and 0.40 per cent between 2030 and 2035 (Table 1.3).
Current and expected urban growth in the developed world will be driven partly by international migration, mainly from developing countries, which accounts for about one-third of urban growth,38 and for 55 per cent of the global migration stock.39 This trend will continue into the foreseeable future since the population in most developing countries is expected to increase in the decades to come, thus placing migration pressure on future generations.40 Increasing waves of international migration have meant that urban areas in all parts of the world are increasingly becoming multicultural, which both enriches cities and brings new challenges.
While cities can generate a lower ecological footprint per capita when they follow compact urban development patterns, the high rates of urbanization in developed regions
The future of cities should reflect to varying degrees
opportunities that cities face

do not always translate to environmentally sustainable urban form. Urban areas in developed regions, particularly the US, have the largest ecological footprints in the world. High levels of resource consumption, widespread dependence on private automobiles, large-scale waste generation and lowdensity suburban sprawl eroding agricultural land are all key environmental issues for the future of cities in developed regions. Urban densities in developed countries have been declining, thus aggravating the problem of urban sprawl.41 Findings from a global sample of cities with over 100,000 inhabitants show that between 2000 and 2015, the physical extent of urban areas in North America and Europe grew much faster than their population, thereby consuming more land for urban development.42 This trend has profound implications for energy consumption, greenhouse gas emissions, climate change and environmental degradation.
The urban conditions, trends and processes in developed countries suggest certain key issues that should be addressed in the transition to more sustainable urban futures. These are highted below and discussed in greater detail in different chapters.

Over the past four decades, rising inequality especially in urban areas has been widespread in developed countries. Consequently, social exclusion, urban segregation and persistent pockets of destitution and poverty are increasingly common features in cities of developed countries (Chapter 3). Nonetheless, levels of inequality in developed countries are generally lower than in developing countries, which indicates greater access to public goods and services and the existence of institutions that implement more egalitarian polices. While the levels of inequality across Western Europe have been widening since the 1980s, this region remains the most egalitarian in the world. Conversely, the US has the highest income inequality among developed countries and is currently experiencing its highest levels of inequality in the last 50 years.43 The most unequal US cities have become more unequal, as eight of the ten most unequal cities experienced an increase in their Gini coefficients between 2010 and 2018.44
Over the past four decades, rising inequality especially in urban areas has been widespread in developed countries
A key issue to be addressed in cities of developed countries are manifestations of the various forms of exclusion and marginalization that migrants and other minority groups face, many of which have been worsened by the impacts of COVID-19.45 Developed countries can address the systemic inequality in urban areas through a wide range of policies aimed at creating more equitable cities as discussed in Chapter 3.
Climatechangeremainsatoppriorityintheglobaldevelopment agenda. Developed and leading industrial countries will have to play a key role in addressing the challenge of climate change as only a handful of countries have strengthened their targets to reduce emissions. In Europe, 70 per cent of cities are in low-lying areas less than ten metres above sea level. Except for the Baltic coastline, a majority of European cities have experienced an increase in sea levels and this risk is projected to increase along with global sea-level rise.46 North American cities are also at risk, especially those on the Gulf of Mexico and Atlantic seaboard, with more than 90 cities experiencing regular flooding, a number that is set to double by 2030.47 The New Urban Agenda envisions future cities and human settlements that build resilience and reduce their disaster risk while simultaneously promoting clean energy and pursuing sustainable consumption and production patterns in order to protect ecosystems and preserve biodiversity.48
Growing waves of international migration have meant that urban areas in developed countries are increasingly transformed into heterogenous, multi-ethnic, multicultural and multilingual spaces. Among the most culturally diverse cities are San Francisco, US; Sydney, Australia; New York; London,UK;Toronto,Canada;andBrussels,Belgium.Inthese cities, foreign-born residents account for 35–58 per cent of their population.49 Megacities in developed countries have become microcosms of the world at large. For instance, the 4 million workers in London speak more than 240 languages.50 Migrant populations offer significant creative cultural contributions and open new opportunities for shrinking cities in Europe and North America, which have experienced deindustrialization, ageing populations and low birth rates.51 Over the past 15 years immigrants have accounted for 47 per cent of the increase in the workforce in the US and 70 per cent in Europe.52
Experience shows that managing diversity occurs at the local level through everyday experiences and encounters. The importance of neighbourhood context and relationships
formed at the micro level are key ingredients for social harmony across racial, ethnic, religious and linguistic backgrounds. In addition, public policies can help integrate new arrivals like migrants, refugees and internally displaced persons into their host communities. Culturally-sensitive design and social supports can strengthen a sense of identity and belonging, thus transforming migration from a potential societal strain into an asset that can lead to urban regeneration and revitalization.
One of the most important needs for all urban futures in developed countries is upgrading and modernization of their ageing stock of physical infrastructure – bridges, power transmission and distribution systems, water and sewerage pipelines, and sustainable transport infrastructure.53 The challenge of ageing infrastructure arises from growth demands, rapid urbanization and development booms. Among developed countries only Australia and Japan have invested sufficiently over the years to meet or exceed their
infrastructureneeds.54 Conversely,Germany,theUK,andthe USfacemajorgapstomeettheircurrenturbaninfrastructure spendingcommitments.55 ThecityofNewYorkhasmorethan 1,000 miles of water pipe over 100 years old and its ageing sewer system is a major contributing factor to flooding.56 London’s iconic public transport system, the Underground, has passed its centennial anniversary and its managers have warned that they may enter a period of “managed decline” in 2023 without national funding commitments.57


Nearly half of the cities in developed regions are shrinking. Most of the 52 cities globally that have experienced population decline since 2000 are in Europe and North America (Figure 1.2). These cities were home to 59 million people in 2018, down from more than 62 million in 2000. Shrinking cities are the outcome of a decline in the regional economy or cities’ economic base with the population migrating elsewhere. In the US, more than 40 per cent of cities with at least 10,000 residents have lost population between 1980 and 2010.58 These cities are located mostly in the deindustrialized region known as the Rust Belt, where population loss has led to high rates of unemployment, blight and violent crime. Unlike in some post-industrial regions of Europe, shrinkage in US conurbations occurs largely in the urban core, while suburban regions continue to grow.59

One of the most important needs for all urban futures in developed countries is upgrading and modernization of their ageing stock of physical infrastructureRepair work in the city to replace water pipes in the city of Samara, Russia © Shutterstock
Source:
Urban shrinkage generates vast challenges such as how to sustain the cost of under-utilized infrastructure and address the negative effects of urban blight that come with huge swathes of vacant housing units, as well as commercial and industrialfacilities.Shrinkingcitiesposeanurbangovernance challenge of managing decline in a smart way to ensure that public services such as education or healthcare are still available to residents in the face of budget constraints.60 However, the low cost of land and abundance of existing building stock also makes shrinking cities places of opportunity for enterprising and creative architects, artists, designers and entrepreneurs.
In addition to shrinking cities, developed countries have experienced population ageing. In Europe, the ratio of the size of the working-age population (aged between 20 and 64 years) relative to the total number of older persons (aged 65 years or over) fell from 3.9 in 2001 to 2.9 by 2020; this ratio is predicted to decrease to 1.6 by 2080.61 Such demographic shifts can have significant implications for government revenue, pension funds, healthcare and social services. An ageing population can also lead to labour supply shortages and economic decline.62 It is therefore critical that these issues are factored into decision-making and planning for the future of cities. In

planning for a growing older population, cities across the region are beginning to support active ageing by creating public spaces, transport and buildings that are accessible for people with restricted mobility.
Overthelastfewdecades,developedcountrieshavewitnessed the process of industrial relocation as firms seeking to reduce labour and operating costs have relocated to developing countries or to less developed areas within the developed world.63 Inmanycities,jobsinheavymanufacturingandmining have disappeared entirely on account of deindustrialization, economic restructuring and globalization. Secondary cities in developed countries have been particularly affected by these changes because of their less diversified economies, as they are often dependent on a single sector such as traditional manufacturing or raw material-based industries. These cities have faced challenges in adjusting to the decline in manufacturing as few have successfully revitalized and diversified their economies in order to retain capital, human resource and attract investment.64 In the absence of bold economic recovery programmes, the prognosis for this group of cities appears pessimistic. As urban analysts note: “These problems threaten to persist into the future, as declining cities face outmigration and become increasingly disadvantaged and disconnected from their national system of cities”.65

Indevelopingregions,52percentofthepopulationcurrently reside in urban areas. This figure is expected to grow to 57 per cent in 2030 and to 66 per cent in 2050 (Table 1.1). Developing countries have the fastest rate of urbanization, with an annual urban growth rate averaging 2.1 per cent between 2020 and 2025. The implication of this trend is that future urban growth will take place mainly in the developing regions of Africa and Asia, where the planning systems and public institutions are least equipped to deal with the challenges of rapid urbanization.
Urbanization in the developing regions demonstrates considerablediversity.LatinAmericaandtheCaribbean,with 81 per cent of its population living in urban areas, has four of theworld’slargestmegacities:MexicoCity,Mexico;SãoPaulo, Brazil; Buenos Aires, Argentina; and Rio de Janeiro, Brazil. Thesemegacitiesaloneaccountfor17percentoftheregion’s urbanpopulationandattractmostoftheforeigninvestment.66
While cities in the region have become more egalitarian in the last two decades, income inequality remains relatively high. Latin America and the Caribbean is the only region where migration between urban areas is a significant driver of urban growth, accounting for nearly 50 per cent and due to several factors, with the pursuit of livelihoods being the most important.67
Africa is the least urbanized, but most rapidly urbanizing, region in the world. Currently, 44 per cent of the region’s population resides in urban areas (Table 1.1). By 2035, the region will have half of its population living in cities and will be predominantly urban by 2050 with six in ten persons living in urban areas. Urban growth rates in Africa currently stand at 3.4 per cent. While projected to decline in the years ahead, urban growth in Africa will remain the highest of any region. In many African countries, urbanization is occurring at lower levels of income compared to other developing regions.68 This phenomenon has been referred to as the weakening of the historical link between urbanization and prosperity.69 Urbanization is also taking place within the context of rising unemployment, financially weak municipal
authorities, weak governance structures, increasing levels of poverty and inequality, proliferation of slums and other forms of vulnerability. These are some of the key issues that will dominate the future of cities in the region.
Asia and the Pacific has 51 per cent of its population living in urban areas and accounts for 54 per cent of the world’s urban population.70 By 2050, it is expected that about twothirds of the region’s population will be living in urban areas. While Asia is one of the most rapidly urbanizing regions of the world, urban population growth has been declining since the 1980s, from an annual average of 3.83 per cent to the present rate of 1.84 per cent (Table 1.2). The process of urbanization in Asia is driven mainly by rural-urban migration. Urbanization in the region, especially South-East Asia, is strongly linked to economic transition and greater integration into the global economy, as many cities have become recipients of foreign direct investment, mainly in the form of the outsourcing of manufacturing by parent companies in developed countries.71 Despite the large number of megacities (18 if Japan is included and 16 if excluded), 54 per cent of Asia’s urban population live in cities of less than 1 million people, while 16 per cent reside in megacities. This fact is a clear indication that the agenda for the future of cities in the region should in part focus on the key issues relating to secondary cities, in addition to those of megacities.
1.3.4. Urban priorities for the future of cities in developing countries
The diversity of the urban context in developing countries suggest certain key issues that should be addressed in the future of cities. These are briefly described below and discussed in greater detail in different chapters.


As cities in developing countries seek better urban futures, poverty remains a persistent challenge that must be addressed (Chapter 3). It is estimated that one-third of all urban residents are poor, which represents one-quarter of the world’s total poor with the majority residing in small cities and towns in developing countries.72 Based on historic trends, extreme poverty is projected to decline to 6 per cent by 2030.73 However, COVID-19 has exacerbated poverty levels, thereby leaving the poor further behind and increasing the number of those newly living in poverty.74
One projection of the increase in poverty due to COVID-19 estimates that as much as 500 million people or 8 per cent of the world’s population fell into poverty.75 This decline marks
future urban growth will take place mainly in the developing regions of Africa and Asia, where the planning systems and public institutions are least equipped to deal with the challenges of rapid urbanization
the first increase in global poverty of the last three decades. Countries in developing regions also have the highest levels of inequality. Inequality disproportionately affects vulnerable groups like women and girls, older persons, indigenous people, persons with disabilities, migrants, refugees and people living in poverty, all of whom are excluded from full participation in economic, political and social life (Chapter 3). As shown elsewhere, the outbreak of the COVID-19 pandemic has exacerbated these inequalities.76


Cities in developing countries face the challenge of providing adequate infrastructure and basic services, without which a better urban future can be difficult to attain. The provision of infrastructure and basic services in developing countries is still very poor. For the hundreds of millions of low-income and poor households, improved water and sanitation remain a rarity; well-funded public education and quality healthcare are unavailable; and access to safe and affordable transport services, leisure and open space are minimal.77 The lowest levels of infrastructure provision are to be found in Africa, where of the urban population, only 54 per cent have access
to safely managed water and only 23 per cent have access to sanitation.For Latin America and the Caribbean, 81 per cent of the region’s urban population has access to safely managed water and 40 per cent have access to sanitation.78 These averages mask huge intra-urban differences between well-off districts and poor neighbourhoods that lack the most basic of services, all of which contributes to the vulnerability of already marginalized settlements. Investing in infrastructure is therefore an absolute necessity for the future of cities in developing countries.
Cities in developing countries face the challenge of providing adequate infrastructure and basic services, without which a better urban future can be difficult to attain

Affordable and adequate housing remains an illusion for many in developing countries. The inaccessibility of this basic human need is reflected in the growth of slums,79

which forms part of the unfinished business of the urban agenda that needs to be addressed going forward especially in Africa and South Asia. Slums are one of the most enduring faces of poverty, inequality, exclusion and deprivation. Slum dwellers must contend with inadequate access to potable water, poor sanitation, overcrowding, poor-quality housing in hazardous locations, insecure tenure, risk of eviction, food insecurity, malnutrition, poor health, unemployment and stigmatization, all of which make them highly vulnerable to COVID-19 and other shocks.80
While remarkable progress has been made in reducing the proportion of the world’s urban population living in slums from 28 per cent in 2000 to 24 per cent in 2018, more than 1 billion people still live in such settlements with over half of slum dwellers located in East, South-East, Central and South Asia, and 23 per cent in Sub-Saharan Africa.81 The forces driving the prevalence of slums in developing regions are unplanned urbanization; ineffective planning; lack of affordable housing options for low-income households; dysfunctional urban, land and housing policies; a dearth of housing finance; and poverty and low incomes. All these factors must be addressed decisively and with the political will that they deserve if cities are to meet their housing needs going forward.
Rapidly urbanizing cities in developing countries are more vulnerable to climate change and least able to respond to its effects. They are hampered by limited financial, human and technicalresourcesaswellasweakinstitutionsandgovernance structures for disaster mitigation and preparedness. At the same time, these cities contribute very little to global warming, making their suffering disproportionate. Cities, especially those in warm climates or low-lying coastal areas, face existential threats due to the risks and impacts of climate change and extreme weather events such as increased heatwaves in Delhi, India, and the pervasive flooding in Jakarta, Indonesia, and Durban, South Africa.
In developing countries, the effects of climate change can exacerbate existing urban challenges and make it more difficult to tackle the persistent issues that cities already face, such as poverty, inequality, infrastructure deficits and
Rapidly urbanizing cities in developing countries are more vulnerable to climate change and least able to respond to its effects
housing, among others.82 These challenges could make it difficult to achieve certain SDGs, especially those relating to poverty, hunger, health, water, sanitation and ecosystems. The long-term effects of climate change could combine with the short-term impacts of the COVID-19 pandemic to further reverse global development gains.
Many developing countries are characterized by a significant increase in the proportion of persons aged 15 to 24, which is referred to as the youth bulge. There are 1.19 billion people within this age bracket worldwide with 88 per cent in developing countries in 2015.83 A high youth bulge presents the challenge of youth unemployment, which is two to three times higher that adult unemployment. A youth bulge can represent a potential opportunity to spur social and economic development if countries harness the power of age-structure transformation. The youth bulge can also increase the risk of domestic conflict in an urban context of weak governance, poor economic performance and high levels of inequalities.84 A youthful population requires investment in educational, employment training, recreational and community facilities. Countries will also need to integrate various aspects of demographic change in their urban development policies, particularly the youth bulge observed in many developing countries.
Secondary cities of less than 1 million inhabitants account for 55 per cent of the urban population of the less developed regions of the world.85 Indeed, the fastest growing cities are the small and intermediate cities and towns. Despite their demographic importance, planning and policy initiatives in developing countries have focused mainly on large metropolitan areas, thereby further fuelling urban primacy. Residents of secondary cities endure multiple deprivations and infrastructure deficiency on account of this metropolitan bias. The COVID-19 pandemic has demonstrated that secondary cities are vulnerable to these external shocks because of deficits in infrastructure and services.
With adequate planning, management and governance, secondary cities will foster better urban-rural linkages and relieve some of the quality-of-life strain, such as rampant informal settlements, environmental degradation and long commutes, that can be endemic to megacities. As noted earlier, secondary cities served as subregional hubs in supporting post-COVID-19 recovery efforts.86 If secondary cities are to form part of the agenda for the future of cities in developing countries, governments must prioritize
investment in infrastructure and service delivery to address these issues and close the widening urban services divide.
Though the future cannot be predicted with certainty, the current trends across the key themes covered in this report (urban poverty and inequality, urban economies, urban governance, urban and territorial planning, public health, innovation and technology and building resilience) have significant bearing on the future of cities. Based on the analysis of available data and current trends provided in this Report, the three scenarios of urban futures are possible (Figure 1.3).

This is the worst-case scenario that can occur with disastrous consequences for the future of cities. Under the “high damage” scenario, the impacts of the ongoing COVID-19 pandemic as well as global economic uncertainties, environmental challenges, and wars and conflicts in different parts of the world could have long-term impacts on cities in both developed and developing countries. In this scenario, developing regions bear the brunt of this catastrophic damage because of already existing vulnerabilities and structural fragilities as discussed in Chapters 1 and 3.
Under the high damage scenario, if 80 per cent of the economic damage inflicted by the COVID-19 pandemic persistsforadecadethentheglobalpovertyheadcountcould increase by 32 per cent or 213 million people by 2030.87 Even in 2050 the increase in the number of people living in poverty is projected to be over 200 million.88 The repercussions of this scenario have significant gender dimensions: 90 million women and girls were pushed into poverty in 2020, a figure that is expected to reach 105.3 million by 2030. These COVID-19 induced dynamics have lasting implications for the ability of countries to achieve the targets of SDG 1. Currently in most developing countries, the pandemic has weakened the fiscal capacity of cities and subnational governments to tackle poverty and other urban challenges. The sheer amount of homelessness
in most developing countries, the pandemic has weakened the fiscal capacity of cities and subnational governments to tackle poverty and other urban challenges
and concentrated urban poverty in some developed country cities could potentially escalate to alarming levels and marginalized groups such as minorities, indigenous peoples and migrants could endure multiple deprivations for decades to come.
In a worst-case scenario, especially if the global rise in inflation and cost of living does not abate, the impact on urban economies would be disastrous (Chapter 4). For instance, cities in Africa could lose up to two-thirds of their financial resources,89 which will make it progressively difficult to meet the basic needs of their population at a time when price hikes have sent the cost of food, energy and commodities soaring. The impact on urban economies will be most intensely felt in cities that are already enduring multiple social, economic, political and environmental fragilities such as such as Juba, South Sudan; Sanaa, Yemen; and Aleppo, Syria, among others. If the impact of the pandemic and global challenges continues unabated, then already weak urban service delivery and governance systems in some of these cities could collapse entirely (Chapter 8). A majority of those in developing regions are already trapped in a vicious cycle of poverty. It will be extremely difficult if not impossible to achieve SDG targets in the face of massive material deprivation, weak urban economies, high unemployment especially among youth, a growing digital divide (Chapter 9), worsening vulnerability to public health crises (Chapter 7), perpetual violent conflict and any additional shocks or stresses. The high damage scenario would create fertile grounds for amplifying these vulnerabilities, making it hard for urban leaders to manage multiple urban crises and promote cities that work for all.
Ahighdamagescenariowouldalsoresultinamassivereduction in official development assistance to poor countries, which means that less funding could therefore be available for state initiated urban development and infrastructure projects, which in turn will negatively affect the implementation of urban development programmes targeted at improving the lives of ordinary citizens. Under the high damage scenario, urban futures will be characterized by high levels of poverty and inequality, weak urban economic growth especially in poorer regions and insufficient resilience to risks like climate change and pandemics (Chapter 10). If global action against multiple urban challenges fails and this bleak scenario becomes a reality, the credibility of the multilateral system would be compromised, thereby undermining coordination efforts to address urgent and pressing global issues.
Urban poverty and inequality remain a major feature in cities
Urban economies vulnerable to shocks and stresses-especially in developing country cities
Fragmented and weak institutional frameworks to tackle multiple, complex, and interrelated urban challenges
Continuing urban heath inequities
Unimaginable reversal of development gains, particularly in poorer regions resulting in missing of SDG targets
Millions could be pushed into extreme poverty-with women, children, migrants, refugees, indigenous peoples, and other disadvantaged groups bearing the brunt of this crisis
poor
most parts of the world,
in developing
adoption
ICTs- creating digital

crisis severely affecting urban economies
infrastructure damage and livelihoods disruptionsespecially in coastal cities and in contexts where resilience to climate shocks is relatively weak
Poor households and communities, including those living in slums are still severely affected by multiple shocks and risks that negatively affect their resilience
Political upheavals and pandemics could amplify poverty, food insecurity to unmanageable levels

Massive expansion of slum-like conditions in poorer regions, which could expose millions of people to the wrath of public health crises
The looming climate emergency could trigger calamitous damage which could generate additional urban crises in both developed and developing country cities. Failure to build climate resilience could be severely damaging to urban economies
“Bad Old Deal”Characterized by exploitation and perpetual exclusion of informal sector workers, systemic discrimination, and exclusion of the urban poor in urban development agendas
Severely weakened urban economies
Cities could be locked into cycles of poverty, poor productivity, unhealthy living conditions and potentially become inequality traps for decades
‘New’ forms of urban vulnerabilities in the future that would disproportionately affect already disadvantaged groups (e.g. migrants and refugees, slum dwellers, the homeless, women, children, and indigenous people)
Concerted efforts and transformative action to achieve SDG targets and the New Urban Agenda
Reprioritization of the most vulnerable and disadvantaged urban populations in urban planning and development, urban governance, technology-based projects and climate action plans
Desirable outcomes that have long-term expectations for cities to be equitable and inclusive, productive, green, compact, walkable, and healthy, resilient urban development as called for by the global development agenda relevant to sustainable urbanization.
This scenario is likely to materialize if cities and subnational governments return to the prepandemic business-as-usual approach, what one development practitioner calls the “Bad Old Deal.”90 This system is characterized by exploitation and perpetual exclusion of informal sector workers (Chapters 3 and 4), systemic discrimination and exclusion of the urban poor in urban agendas (Chapter 3), overreliance on fossil fuels to support manufacturing industries (Chapter 5), poorly planned and managed urbanization processes particularly in developing regions (Chapter 6), poor prioritization of public health interventions in urban development (Chapter 7), rapid deployment of modern technologies without opportunities for the poor and thereby creating and entrenching digital inequalities (Chapter 9). Collectively, these challenges will undermine the global vision of achieving inclusive, resilient, and sustainable cities where no one is left behind.
The pessimistic scenario could also have dire consequences in regions that already face multiple instabilities. For example, in Africa, more than 20 per cent of the urban population will endure extreme poverty between 2016 and 2030 in countries such as Madagascar, Chad, Central African Republic, South Sudan and Democratic Republic of the Congo.91 Globally, 1.6 billion people or 20 per cent of the world’s population live in inadequate housing, of which 1 billion reside in slums and informal settlements.92 Under these conditions, the goal of eradicating poverty in all its forms by 2030 and leaving no one behind will not be achieved. Without concerted efforts, the pessimistic scenario could lead to new forms of urban vulnerabilities that would disproportionately affect already disadvantaged groups. Moreover, as the climate emergency looms, the resilience of cities to shocks and stresses is being tested, especially those located in coastal regions. There are already warning signs globally and further inaction on these multiple crises could jeopardize the prospects for resilient, thriving and sustainable urban futures. Finally, the revised downward growth rates for 2022 and 2023, brought on by supplychainstressesandtheconflictinUkraine,willcontinue to cause economic hardship under the pessimistic scenario as households struggle with higher prices for food, energy and basic goods while wages do not keep up with inflation.93
The optimistic scenario provides a vision where concerted policy action facilitated by the implementation of the New Urban Agenda as a framework for achieving the SDGs is amplified to make transformative progress in addressing multiple challenges confronting cities in both developed and developing regions. This scenario involves collaborative, wellcoordinated and effective multilateral interventions to tackle multidimensional poverty and inequalities (SDG 1 and SDG 10, see Chapter 3), promote vibrant resilient and diversified urban economies and productive urban futures (SDG 8 and SDG11, see Chapters 4 and 10), build healthy and thriving cities (Chapter 7), strengthen the drive towards green urban futures (Chapter 5), promote well-planned and managed urbanization processes (SDG 11, see Chapter 6) and ensure inclusive digital economies for the future (Chapter 9).
In the optimistic scenario, national and local governments invest in the Decade of Action to reset the urban development path towards a just, resilient, healthy and prosperous urban future. Under this scenario, the world will meet the SDG target of a poverty rate below 3 per cent at the global level in 2045. If countries embark on the SDG Push proposed by the United Nations Development Programme to exceed pre-pandemic development trajectories, then there will be 125 million fewer people in poverty than in the pre-COVID baseline. By 2050, that figure grows to more than 260 million.94 Under the optimistic scenario, national governments will embrace peace and diplomacy to resolve their differences rather than pursue military action, especially in instances that have global economic consequences like the conflict in Ukraine, thus alleviating pressure on global energy and food markets. In the optimistic scenario, governments are also successful at managing the COVID-19 pandemic to balance health outcomes with economic activity and citizen rights, thus smoothing out global supply chains.
As the climate emergency looms, the resilience of cities to shocks and stresses is being tested, especially those located in coastal regions
The optimistic scenario will not materialize automatically. It requires commitment from leaders at the global, regional, national and local levels. Going forward, the drive towards an SDG push in cities must be accompanied by brave commitments to tackle structural inequalities and create conditions that foster social, economic and spatial inclusion to ensure that no one is left behind. If appropriate measures are implemented, the response to the current urban crisis can lead to a collective reprioritization of cities across the world towards shared prosperity, inclusion, productive employment, innovation, environmental sustainability, gender-responsivesystemsandcohesivecommunitybuilding.


The unprecedented global impacts and disruption triggered by the COVID-19 pandemic – much of which have played out in urban areas – compel us to reimagine the future of cities and reflect on the type of cities that are needed to support humanity in a predominantly urban world. What do we want our cities to look like, especially in the aftermath of the COVID-19 pandemic, and how can cities prepare for an uncertain future? The vision of the future of cities should be guided by the norms of the New Urban Agenda and the 2030 Agenda for Sustainable Development, especially SDG
The vision of the future of cities should be guided by the norms of the New Urban Agenda and the 2030 Agenda for Sustainable Development, especially SDG 11

11. Other global frameworks are also relevant to sustainable urbanization: the Paris Agreement on Climate Change, the Sendai Framework for Disaster Risk Reduction and the Addis Ababa Action Agenda. While this framework was already in place, the COVID-19 pandemic has added a sense of urgency and a demand for a change on the journey towards more sustainable urban futures.
The call in the New Urban Agenda of “cities for all” is a people-centred urban development vision that protects the planet, is age- and gender-responsive, enhances the realization of human rights and fundamental freedoms, facilitates living together, ends all forms of discrimination and violence, reduces social and economic inequalities, and empowers all individuals and communities, while enabling their full and meaningful participation (Box 1.3). Indeed, the New Urban Agenda offers a global vision for people, the planet and long-term prosperity in which urbanization plays a vital role for positive change.
The vision of cities for all envisages cities and human settlements that:
i. Fulfil their social function, including the social and ecological function of land, with a view to progressively achieving the full realization of the right to adequate housing as a component of the right to an adequate standard of living, without discrimination, universal access to safe and affordable drinking water and sanitation, as well as equal access for all to public goods and quality services in areas such as food security and nutrition, health, education, infrastructure, mobility and transportation, energy, air quality and livelihoods.
ii. Are participatory; promote civic engagement; engender a sense of belonging and ownership among all their inhabitants; prioritize safe, inclusive, accessible, green and quality public spaces friendly for families; enhance social and intergenerational interactions, cultural expressions and political participation, as appropriate; and foster social cohesion, inclusion and safety in peaceful and pluralistic societies, where the needs of all inhabitants are met, recognizing the specific needs of those in vulnerable situations.
iii. Achieve gender equality and empower all women and girls by ensuring women’s full and effective participation and equal rights in all fields and in leadership at all levels of decision-making; by ensuring decent work and equal pay for equal work, or work of equal value, for all women; and by preventing and eliminating all forms of discrimination, violence and harassment against women and girls in private and public spaces.
iv. Meet the challenges and opportunities of present and future sustained, inclusive and sustainable economic growth, leveraging urbanization for structural transformation, high productivity, value-added activities and resource efficiency, harnessing local economies, and taking note of the contribution of the informal economy while supporting a sustainable transition to the formal economy.
v. Fulfil their territorial functions across administrative boundaries, and act as hubs and drivers for balanced, sustainable and integrated urban and territorial development at all levels.
vi. Promote age- and gender-responsive planning and investment for sustainable, safe and accessible urban mobility for all, and resource-efficient transport systems for passengers and freight, effectively linking people, places, goods, services and economic opportunities.
vii. Adopt and implement disaster risk reduction and management, reduce vulnerability, build resilience and responsiveness to natural and human-made hazards, and foster mitigation of and adaptation to climate change.
viii. Protect, conserve, restore and promote their ecosystems, water, natural habitats and biodiversity, minimize their environmental impact, and change to sustainable consumption and production patterns.
Source: United Nations, 2017.
The New Urban Agenda seeks to foster an enabling environment that empowers cities to achieve core developmental, environmental and other commitments.95 This approach is a notable departure from previous global agendas as the importance of cross-scale governance rather than top-down implementation is clearly recognized.96 A significant precedent is the explicit recognition of the
centrality of subnational entities, particularly cities, in national and international systems for driving sustainability.97
The magnitude of the devastation of a global shock such as the current pandemic could not have been anticipated when the New Urban Agenda was adopted in 2016. The pandemic can therefore be seen as a defining feature of our global landscape,
which has major implications for the future of cities and for implementation of the New Urban Agenda. The UN-Habitat report Cities and Pandemics: Towards a More Just, Green and Healthy Future identifies some shortfalls of the New Urban Agenda and its implementation regarding COVID-19.98 These oversights include insufficient comprehension of the extent of poverty and inequality globally that has since been exposed by the pandemic; the new vulnerabilities generated by an extreme health crisis that were not anticipated, which necessitate a more explicit human rights-based approach grounded on the principles of social and economic justice; and inadequate recognition of the importance of digital access and infrastructure investments necessary for the creation of inclusive and sustainable urban economies.
to acknowledge the significant role of cities and local governments; the importance of the provision of basic services and public goods; and the need to enlarge the fiscal space and capacity of cities and local governments through the devolution of public administration.
Nonetheless, the New Urban Agenda along with its guiding principles, transformative commitments and means of implementation remain pertinent to fostering resilient urban futures. Indeed, many of the policies and blueprints being proposed to address the impacts of the COVID-19 pandemic in cities are embedded in the New Urban Agenda and other global frameworks relevant to sustainable urbanization. What is then required is the effective implementation of these development frameworks, backed by adequate resources.99


Following the disruptions wrought by the COVID-19 pandemic, an emerging vision of urban futures is that of a more equitable and just city, one that is greener and more knowledge-based and is resilient across multiple dimensions to different types of shocks, crises and catastrophes. The pandemic has forced a renewed reflection on the form and function of cities, connectivity, managed density and prevention of overcrowding. It has also caused the public
In Cities and Pandemics, UN-Habitat advocates for a new social contract in the form of universal basic income, universal health coverage and universal housing and basic services. This proposal can be seen as part of an emerging vision for sustainable urban futures, as cities seek to build back differently and recover from the impacts of the pandemic.100 The pandemic has crystallized the necessity of a rights-based universal social protection framework providing for the basics of health, housing and income for an urban future that is susceptible to disruptions.101 This proposed new social contract articulates the “reciprocal obligations between individuals, households, communities and leaders”102 on protection, provision and participation in society.103 At its core, the new social contract expresses the common agenda of a human society in which every person has inherent dignity and rights. The provision of universal social protection in times of crisis is a litmus test of the strength of a social contract and a key pillar for safeguarding social cohesion.104
The calls for a new social contract are not new. They were well established before the crisis when only one out of five persons believed that the current social system worked for them.105 The pandemic provided a watershed moment stirring up heated social and political debates on the efficacy of the current social trade-offs in the face of a more precarious future. In the reality of a weakly supported social contract under intense pressure from the pandemic, there was and continues to be a real threat to social cohesion with questions of state legitimacy growing louder.106 As argued by UCLG, the 2030Agendaisanewsocialcontracttoco-createasustainable future for the planet.107 In this regard, local governments are key players and SDG 11 targets provide a starting point for local governments and partner institutions to launch the kind of initiatives that can deliver sustainable urban futures.

Universal basic income (UBI) provides a pathway out of extreme poverty by creating a mechanism to support economic opportunities and widen social inclusion for vulnerable groups.108 In UBI schemes, citizens receive regular, guaranteed, broad-based, unconditional income support from the state.109 Public support for UBI grew from the onset of the pandemic with the growing perception that precarious
New Urban Agenda along with its guiding principles, transformative commitments and means of implementation remain pertinent to fostering resilient urban futures
an emerging vision of urban futures is that of a more equitable and just city, one that is greener and more knowledge-based and is resilient across multiple dimensions
economic futures will affect all one way or the other. The pandemichasmovedUBIintomainstreampublicpolicyasseen by increased support across the political spectrum, including more economically conservative thinkers, that some form of targeted basic income is needed in the face of the economic hardship caused by widespread job losses.110 This idea has already been piloted at the local level, with cities creating models that could be scaled up to the national level.111 The possibility of technologically-enabled administration of such systems also contributes to its growing support. 112
There has been an exponential growth in social protection programmes since the onset of COVID-19, with some form of universal income being a key component.113 By May 2021, there were 3,333 planned or implemented social protection measures in 222 countries and territories. That growth translates to a 32-fold increase since the start of lockdowns in March 2020, when just 103 such schemes were recorded. Of these measures, 42 per cent of the interventions were cash transfers – both conditional and unconditional. There are strong indications that the measures prevented millions from falling into poverty in Latin America.114 The US experience stands out as a strong case for the impact of a guaranteed income in addressing poverty and inequality. The 2020 stimulus check payments kept 11.7 million people from falling into poverty. In fact, the national government payments reduced poverty rates from 11.8 per cent in 2019 to 9.1 per cent in 2020.115 This outcome has provided strong evidence to challenge the common criticism of UBI as having a drag effect on economic prosperity.

Universal health coverage (UHC) means that all persons have access to sufficient quality healthcare to restore and improve their health when they need it, without undue financial strain.116 The goal of universal health coverage is threefold: equity in access whereby everyone who needs health services should get them, not only those who can pay for them; sufficient quality, which means that health services should be good enough to improve the health of those receiving services; and no undue financial risk, in that the cost of using health services should not be a deterrent to access healthcare (Chapter 7).117
The stark reality is that access to healthcare is far from equitable; at least half of the world’s population still do not have full coverage of basic health services, and over 800 million people spend at least 10 per cent of their household budgets on health.118 UHC protects vulnerable groups from fallingintopovertyforpresentandevenfuturegenerations.119
Health care for all encompasses more than access to health services. It entails preventive measures, including healthy urban design that reduces spatial inequality, improves air quality and manages urbanization in a fashion that protects biodiversity and mitigates the spread of zoonotic diseases.120
The value of adequate housing was proven in its use as a public health strategy for managing the pandemic.121 As the pandemic persisted, many low-income urban residents found themselves confined in inadequate housing lacking adequate basic services and with no income, risked eviction.122 At the height of the pandemic, many countries initiated measures to protect access to housing including moratoriums on evictions, rent subsidies and mortgage relief programmes. Measures were also taken to house the homeless. For instance, in the UK, the Everyone In scheme established in March 2020 temporarily placed 15,000 individuals at risk of lackingshelterinhotelrooms.123 Reducingexposuretohealth risk by safeguarding access to housing helped the National Health Service cope with demand by flattening the curve for acute cases.124 This outcome demonstrated the positive link between access to housing and improved health. Beyond pandemics, access to appropriately designed, inclusive and affordable housing is a useful lever for sustainably realizing the aspirations of urbanization.
Theemergingvisionofurbanfuturesmustalsoreflectthenew normal, which entails new ways of living, working, studying, recreating and socializing; a renewed focus on hygiene and public health; more public spaces; and different forms of social interactions. For instance, at the city level, this shift in urban lifestyles manifests in the increasing importance of the home as a part-time or even full-time workplace for some workers; social distancing, reprioritization and retrofitting of public space (Chapter 6); and increased deployment of innovation and technology (Chapter 9) – all of which show that there are radically different ways of living.125
Visions of urban futures should be driven by the realities on the ground, which means embracing the new opportunities to tackle existing and emerging challenges. Positive visions of urban futures will not be realized by chance, but instead facilitated by proactive measures, inclusive policies,
The stark reality is that access to healthcare is far from equitable; at least half of the world’s population still do not have full coverage of basic health services
meticulousplanning,fitforpurposeinstitutionsandpublicand private sector collaboration. Achieving these visions involves prioritization of actions, selection of strategic interventions, efficient monitoring systems and control of negative forces.
Realizing
Realizing the urban visions that we want is predicated on addressing the inherent weaknesses of the current models of urbanization and building back differently with emphasis on inclusive policies. How do we create economically productive cities without exacerbating inequality? How do we rethink models of city development that are largely driven by private, rather than public, interests? How can the model of city development avoid generating multiple forms of deprivation, social exclusion and digital divides, which ultimately create spatial inequalities and divided cities? How can the model of urbanization be part of the solution to climate change and environmental degradation rather than the cause? The answers to these and many more questions are key to achieving visions of sustainable urban futures.
Urbanization in the twenty-first century is not a singular pathway, but rather encompasses divergent paths to growth and many possible futures, including multiple threats. Despite the range of possibilities, it is important to consider desirable outcomes that make cities more equitable, inclusive, productive, green, compact, walkable and healthy as called for by the relevant components of the global development agenda. The interrelated and mutually reinforcing pathways to sustainable urban futures will be determined by inclusive and transformative policies to eradicate poverty and inequality; produce urban economies that provide opportunities for all; generate greener investment and sustainable consumption and production patterns; set the framework for responsive urban and territorial planning; implement collaborative and integrated systems of urban governance; prioritize public health; deploy inclusive innovation and technology; and build resilience, which enables cities to respond to and withstand a wide range of shocks (Figure 1.4). The effective implementation of the New Urban Agenda serves as an integrating framework for the various interrelated components that constitute these pathways.


We cannot envision a bright future for cities when inequality appears to be on the rise globally and poverty is endemic in certain regions (Chapter 3). Without concerted action at all levels, poverty and inequality might be the defining features of the future of cities. Indeed, it has been noted that poverty and inequality could be greater in the post-pandemic era if governments do not take decisive actions.126 Inequality in urban areas is undermining the social value of urbanization. A more proactive approach is therefore required to deal with urban inequality and to take advantage of the economic and social opportunities offered by urbanization.127 Social protection programmes and redistributive polices are urgently needed and should be mainstreamed in domestic resource frameworks as it is a necessary investment in people, not a burden.128 Social protection programmes serve to counter market forces by giving priority to vulnerable and low-income households.
Urban futures will only be equitable for all when the rights of vulnerable groups are protected; gender equality is promoted
Urban futures will only be equitable for all when the rights of vulnerable groups are protected; gender equality is promoted; there is broad-based civic participation; persons are protected against discrimination based on sexual orientation and gender identity; and when marginalized groups like slum dwellers, the homeless, indigenous people, youth, and older persons are empowered. These issues are explored in greater detail in Chapter 3, which also discusses how cities can respond to the challenges of poverty and inequality to ensure that no one is left behind, especially in midst of the multiple crises.
The urban economy is integral to the future of cities. Given the contribution of the urban economy, the future of many countries will be determined by the productivity of its urban areas. Policies designed to ensure access to productive employment, nurture the talent and skills required to thrive in a modern urban economy, develop endogenous resources, effectively manage urban growth diseconomies, and identify the impediments that prevent cities from maximizing their productivity potential all have a key role to play in building resilient urban economies.129 The crises precipitated by the pandemic should be an
Greater economic diversity improves productivity by utilizing existing and potential resources as a basis for building up resilience

opportunity for cities to adopt innovative ways of driving their economies.
Policiesshouldaddresshowcitiescandiversifytheireconomy to create jobs, enhance access to goods and services, and reduce poverty and inequality. A lack of economic diversity increases the vulnerability and scale of economic decline.130 By contrast, greater economic diversity improves productivity by utilizing existing and potential resources as a basis for building up resilience against shocks.131
Sustainable urban futures are contingent on viable sources of finance. It is important to address how urban futures can be adequately financed in the face of dwindling local government revenues, huge budget deficits and decreasing foreign investment, among other fiscal constraints. The path to long-term sustainable financing in cities requires diversification and mobilization from a wide range of financial resources. Existing urban fiscal systems must be overhauled to ensure locally viable tax revenues. In turn, cities must have access to the financial resources required to meet their needs since they are ideally placed to drive local redistribution programmes and provide social safety nets.132 Chapter 4 explores how urban economies can be strengthened and discusses the path to a resilient economic future for cities.
1.6.3 Green investments for sustainable consumption and production patterns Green investments offer an essential pathway for the future of cities. Lessons from the COVID-19 pandemic show that a green economic recovery can yield significant environmental benefits. Countries and cities can deliver greener urban futures by investing in cleaner and more resilient forms of renewable energy that will create lasting solutions, reduce the risks of future crises and adequately mitigate the impacts of climate change. Cities can transition to sustainable urban futures characterized by net zero GHG emissions and much reduced impacts on the environment. This transition to carbon neutrality must be accompanied by significant shifts to sustainable consumption and production patterns that contribute to the responsible use of resources (Chapter 5). Policies and planning processes that integrate cities into the ecosystems
of subnational regions foster resilience and can contribute to the transition toward a circular economy.133
The pathway to sustainable urban futures requires delivering environmental benefits in a manner that reaches every segment of the population, especially the disadvantaged. The urban poor must be represented, and their needs prioritized, be it about the urban commons, atmospheric commons, public spaces or resource use. In urban areas, nature-based solutions have been associated with positive effects on both urban biodiversity and human health. Investments in ecosystem services and natural infrastructure are not only a cost effective and sustainable way to improve resilience to climate impacts, but also offer employment opportunities like human-made infrastructure investments.134 A recent study shows that ecosystem restoration creates 3.7 times as many jobs as oil and gas production per dollar.135

The pandemic exposed the weaknesses of current urban planning in many contexts. This inadequacy is evident from the fragmented response at various levels of governance and across jurisdictional boundaries. Weaknesses of urban planning systems in effectively addressing such crises also reflect failings in governance structures, which underscores the need for urban planning to continuously adjust to the new realities and forces refashioning the global context so that we do not continue along dysfunctional trajectories.136
The pathway to better urban futures calls for planning paradigms that are responsive to changes in urban realities –these can play a vital role in addressing multiple and evolving challenges. This kind of urban and territorial planning will improve preparedness and empower cities to adequately respond to all hazards, including public health threats and future systemic shocks.
As a pathway to sustainable urban futures, urban planning can create sustainable neighbourhoods drawing on lessons from the COVID-19 pandemic. There is renewed focus on compact, mixed-use neighbourhoods and the use of nonmotorized transport such as cycling and walking. During this periodthe“15-minutecity”emergedasanimportantconcept inmakingcitiesmoresustainable.137 The15-minutecityaims
to ensure that everything urban dwellers need in their dayto-day endeavours can be reached within 15 minutes by foot, bicycle or public transit. This method of living can help cities rebuild and restore their economy while protecting lives and cutting dangerous pollution.138 Fundamentally, such proposals require improvements in the quality and density of public transport links between neighbourhoods and to poorly-connected neighbourhoods (urban “weak spots”), among other measures.139 Public transport remains integral to achieving cleaner and greener urban futures despite perceptions, now waning, that it is a major gateway for the spread of diseases.140 This fundamental urban reality means that public transport systems should be made accessible, safe, affordable, efficient and reliable, as well as able to serve diverse demands (Chapter 6).
Public health should be prioritized as a key component of the urban development framework. The pandemic laid bare the weakness of the health systems in many countries. Cities in collaboration with national governments and relevant stakeholders, including the private sector, must invest in health infrastructure as an integral part of city resilience development programmes. Chapter 7 addresses how cities in both developed and developing countries can prioritize public health given its importance to sustainable urban futures.
Public health should be prioritized as a key component of the urban development framework
Health and health disparities must be addressed within a broader societal context, including the quality of the built environment, which plays a key role in health outcomes.141 Given that cities are places where health disparities vary across social groups and neighbourhoods, appropriate urban healthcare must be provided for vulnerable groups –children, women, the poor, ethnic minorities, migrants, the elderly, the homeless and other excluded groups who tend to be disproportionately affected.
Allocation of adequate resources should be made to facilitate the development of twenty-first century health systems, including preparedness and responses that can match and support the demand for future urban healthcare. Rapid urbanization means that an increasing number of people are exposed to risk factors emanating from the social and physical environment, which contributes to increased stress and worse mental health outcomes.142
This transition to carbon neutrality must be accompanied by significant shifts to sustainable consumption and production patterns
Lessons from the COVID-19 pandemic demonstrate the inherent weakness of urban governance frameworks in addressing complex global emergencies. The fragmented response at various levels calls for strong, effective and inclusiveinstitutionsaswellasamoreintegrated,cooperative multilevel governance approach. Multilevel governance arrangements are instrumental for creating synergies, reducing overlapping and critical gaps between institutions, and promoting trust and accountability that enhance policy coherence.143 Multilevel urban governance strategies have been lauded as an effective mechanism by which cities can respond to a wide range of shocks in several contexts.144
Chapter 8 discusses how urban governance and institutional structures can drive sustainable urban futures and analyzes some of the governance mechanisms that have been adopted at various scales.
The governance structures required for a resilient urban future must be fit for purpose to address twenty-first century urban challenges. COVID-19 has reinforced an important lesson: no single city, irrespective of its resources, can address the pandemic alone. Rather, cities working with smaller units and higher levels of government were able to respond better to the pandemic. Effective localization of the global agendas and the realization of the economic, social, environmental, health, infrastructural and institutional imperatives underlying sustainable urban futures hinges on multilevel governance arrangements. The localization and implementation of the global agendas with local governments being in the driving seat is central to achieving sustainable urban futures.
Multilevel urban governance strategies have been lauded as an effective mechanism by which cities can respond to a wide range of shocks in several contexts


The future of cities will be knowledge-based, driven largely by innovation and the widespread use of new technologies anddigitizationofvirtuallyallfacetsofurbanliving.Thevalue of innovation and technology lie in the transition to more sustainable urban futures – more productive, prosperous and resilient urban economies; enhanced social inclusion and equitable policymaking; and environmentally resilient urban development.
In serving as a pathway to sustainable urban futures, it is important that the deployment of innovation and technology is linked to the uniqueness of local urban conditions and trends, including resource availability. What kind of technology can be deployed in different urban contexts in view of the large disparities that exist in the availability and usage of technology solutions? Developments in science and technology will have a major impact on society, but there are uncertainties in the city dimension of these developments (Chapter 9).
While the deployment of innovation and technology has responded to urban challenges in various contexts, it has exposed a deepening digital divide and social inequalities. Since “the future of technology is the future of cities,”145 it is imperative to address digital exclusion to ensure that the digital revolution in cities is inclusive and leaves no one behind. Some cities are already making strategic investments to ensure that minority groups are not digitally excluded. In 2020, the Toronto District School Board distributed 60,000 devices to its students during the transition to remote learning toensurethatnochildisleftbehindinthelearningprocess.146
The future of cities will be knowledge-based, driven largely by innovation and the widespread use of new technologies and digitization of virtually all facets of urban living
Putting people at the centre calls for concerted efforts by cities to close the digital divide within cities and across the urban-rural continuum, as well as within various population groups; empower people by building their digital skills; support job creation in the digital sector; use digital platforms to deliver services equitably; protect the most vulnerable online; mobilize new financing models to reach the unconnected; and invest in affordable technology solutions.147
A central premise of this Report is that building economic, social and environmental resilience, including appropriate governance and institutional structures, must be at the heart of the future of cities. The discussion in the preceding sections feed into the notion of resilience. For instance, measures designed to diversify urban economies to enhance economic resilience should be aligned with the long-term objectives of achieving net zero GHG emissions. As a pathway to sustainable urban futures, building resilience is a multisectoral, multidimensional and multi-stakeholder effort,whichrequireseffectivecollaborationandcooperation across all scales, as the various dimensions of resilience are interrelated and mutually reinforcing. In practice, welldesigned resilience policies can cover these dimensions simultaneously.148
The notion of resilience should go beyond one that seems to favour simply enduring the status quo without attempting to change the underlying conditions that created such adverse situation in the first place. The idea of challenging resilience is to go beyond building back better to building differently in a manner that does not preserve the existing situation, but rather effects a real change that confronts structural inequalities in an uneven society. Chapter 10 identifies the necessary supportive structure and capacity required to build resilient urban futures in different contexts, including the specific roles of the different levels of government and relevant stakeholders.
The idea of challenging resilience is to go beyond building back better to instead building differently in a manner that does not preserve the existing situation


building resilience is a multisectoral, multidimensional and multi-stakeholder effort, which requires effective collaboration and cooperation across all scales
World Cities Report 2022: Envisaging the Future of Cities seeks to provide greater clarity and insights into the future of cities based on existing trends, challenges and opportunities, as well as disruptive conditions, including the valuable experience and lessons from the COVID-19 pandemic, and suggest ways that cities can be better prepared to address a wide range of shocks and transition to sustainable urban futures.TheReportproposesastateofinformedpreparedness that provides us with the opportunity to anticipate change, correctthecourseofactionandbecomemoreknowledgeable of the different scenarios or possibilities that the future of citiesoffers.Thefuturecertainlymatters.AstheOrganization for Economic Cooperation and Development argues: “It illuminates the ways that policy, strategies and actions can promote desirable futures and help prevent those that we consider undesirable.”149
This Report builds on two major reports recently published by UN-Habitat: World Cities Report 2020: The Value of Sustainable Urbanization and Cities and Pandemics: Towards a MoreJust,GreenandHealthyFuture.Theformerconvincingly affirms that well-planned, managed, and financed cities and towns create value that can be harnessed for sustainable urban futures and make cities and human settlements more resilient in the face of profound shocks and risky events. The latter provides the basis for much-needed local level action on spatial planning, poverty and inequality, the economy and governance in addressing the impacts of the COVID-19 pandemic as cities seek to build back differently.
This Report seeks to imagine a future of cities that connects to the structural problems and conditions that predate the pandemic. These are hard realities – including the destructive effects of climate change, inequality, poverty and various forms of marginalization and exclusion – and if not adequately addressed, they will continue to shape
our urbanizing world. This Report does not seek to predict the future; rather, it assesses the possibility of alternative futures. Although the future cannot be known with absolute certainty, a wide range of futures is possible. Exploratory predictive analysis can provide insights into the future to ensure rational thinking that can manage uncertainty.
The Report conceptualizes the possible futures for cities in terms of desirable outcomes in which people experience a good quality of life, the global and local commons are respected, rights are guaranteed, collective interests are protected,andaworldofequalitywithdifferencesistolerated. At the same time, the Report explores negative scenarios that limit the transition to sustainable urban futures. The Report discusses the necessary conditions for the manifestation of brighter urban futures while understanding that urban futures and the paths toward them are neither linear nor independent, but instead are merged and interwoven into multiple realities, all of which are necessary to understand and ensure a better future for all.
Moiretal,2014.
UN-Habitat,2020a.
GlaeserandCutler,2021.
UnitedNations,2020a;UN-Habitat, 2021a;Deloitte,2021;OECD,2020a.
UnitedNations,2020a.
Deiningeretal,2019.
UN-Habitat,2020a.
Sachsetal,2019.
Sachsetal,2019.
UNDESA,2014a.
UNDESA,2019a.
McGowan,2020.
ScrippsInstitutionofOceanography, 2022.
IPCC,2021.
IEA,2021a.
SEIetal,2021.
SEIetal,2021.
WorldBank,2020a.
UNDESA,2020b.
UNDESA,2014a.
IMF,2021.
UN-Habitat,2021a.
CitiesAlliance,2021a.
UnitedStatesCensusBureau,2022.
Floridaetal,2020.
WHO,2021a.
WHO,2021a.
Puttkamer,2020.
UN-Habitat,2016a.
UN-Habitat,2016a.
Zakaria,2020.
GhebreyesusandvonderLeyen, 2020.
UN-Habitat,2016a.
Acutoetal,2020.
UN-Habitat,2009a.
McKinseyandCompany,2018.
UN-Habitat,2016a.
UN-Habitat,2008.
IOM,2019.
IMO,2019.
UN-Habitat,2009.
UN-Habitat,2016a.
McGowan,2020.
Bach,2020.
UN-Habitat,2020a.
IPCC,2019.
Fuetal,2016.
UnitedNations,2017.
UN-Habitat,2020a.
Moiretal,2014.
UCLG,2019.
UNHabitat,2020a.
UNHabitat,2020a.
Woetzeletal,2017.
Woetzel,etal,2017.
UNHabitat,2020a.
TransportforLondon,2021.
Florida,2019. 59. Wallingetal,2021. 60. OECDandEuropeanCommission, 2020. 61. Eurostat,2021. 62. Eurostat,2021. 63. UN-Habitat,2009. 64. Moiretal,2014.
Moiretal,2014,p.18.
66. UNDESA,2018.
UN-Habitat,2021.
Freireetal,2014.
69. Mahendraetal,2021. 70. UNDESA,2020a.
71. UN-Habitat,2020a.
Baker,2008.
Sachsetal,2021.
Furcerietal,2020.
Sumneretal,2020.
UN-Habitat,2020a.
UN-Habitat,2016a.
78. WHOandUNICEF,2021.
79. UN-Habitat,2020a.
UN-Habitat,2020a.
81. UN-Habitat,2020a.
82. GlobalCommissiononAdaptation, 2019.
83. UNDESA,2015. 84. Urdal,2004. 85. UNDESA,2019b. 86. CitiesAlliance,2021a. 87. Broom,2020. 88. Hughesetal,2021. 89. UN-Habitat,2020. 90. Chen,2020. 91. WorldDataLab,2022. 92. UN-Habitat,2020a. 93. Gourinchas,2022. 94. Hughesetal,2021. 95. UN-Habitat,2021a. 96. Valenciaetal,2019. 97. Parnell,2016.;CohenandHabron, 2018;Valenciaetal,2019. 98. UN-Habitat,2021a. 99. UN-Habitat,2018a. 100. UN-Habitat,2021a. 101. Devereux,2021;Büscheretal,2021; Razavietal,2020.
102. UnitedNations,2021d. 103. Loeweetal,2021. 104. ILO,2021. 105. Edelman,2019. 106. Razavietal,2020Editorial(2020); AuethavornpipatandTanyag,2021. 107. UCLG,2019. 108. Wijngaardeetal,2021. 109. FranceseandPrady,2018. 110. McGowan,2020. 111. Gentilinietal,2020;Hughes,2018. 112. Nettleetal,2021. 113. Gentilinietal,2020. 114. Lustigetal,2020. 115. UnitedStatesCensusBureau,2021. 116. WHO,2021a. 117. UnitedNations,2020b. 118. UnitedNations,2020b.
119. WHO,2021b. 120. UN-Habitat,2021a. 121. UnitedNations,2021a. 122. DevereuxandCuesta,2021. 123. Bradshawetal,2021. 124. Bradshawet.al,2021.
125. Floridaetal,2020.
126. Stiglitz,2020.
127. UN-Habitat,2020a.
128. UnitedNations,2021a.
129. UN-Habitat,2020a.
130. SharifiandKhavarian-Garmsir, 2020a.
131. OECD,2020a. 132. Parnell,2020. 133. UN-Habitat,2021. 134. OECD(2020a. 135. WRIetal,2021. 136. UN-Habitat,2018a. 137. Hadjiosif,2020. 138. Sisson,2020a.
139. C40KnowledgeHub,2021.
140. SharifiandKhavarian-Garmsir, 2020b;EltarabilyandElghezanwy, 2020.
141. JointResearchCentre,2019.;Fouad etal,2017.
142. Gruebneretal,2017. 143. UN-Habitat,2020a.
144. SharifiandKhavarian-Garmsir, 2020a.
145. CornellTech,2021. 146. CBC,2020.
147. UnitedNations,2021d. 148. OECD,2020a.
149. OECD,2017.

1. Global city population share doubled from 25 per cent in 1950 to 50 per cent in 2020; it is projected to slowly increase to 58 per cent over the next 50 years.
2. Between 2020 and 2070, the number of cities in low-income countries will increase by 76 per cent, in high-income and lower-middle-income countries by about 20 per cent, and in uppermiddle-income countries by 6 per cent.
3. Over the next five decades, growth in city land area will mostly take place in low-income (141 per cent), lower-middle-income (44 per cent) and high-income countries (34 per cent). Changes in upper-middle-income countries are projected to be relatively small (13 per cent).
4. Small cities cover almost half of city land (about 45 per cent) in low-income countries, a trend that will persist over the coming decades.

1. City densities in low-income countries need to be planned for and managed in ways that future growth does not exert pressure on existing open land, infrastructure and services, and result in crowding on the one hand or lead to unsustainable sprawl on the other.
2. Enhanced planning capacities for small cities and emerging newer cities will strengthen the important role they play across the urban-rural continuum in achieving sustainable futures.
3. Planning for age-friendly cities and towns that afford good quality of life for all inhabitants across all generations is critical for sustainable futures.
4. Effective urban and territorial planning is critical to mitigate the negative social, economic and environmental associated with future urban growth.
5. Effective urban and territorial planning is critical to mitigate the negative social, economic and environmental associated with future urban growth.
Oneofthefundamentalchallengeslinkedtomonitoringglobal urbanization trends and progress on the global development agendas has been the lack of a unified definition as to what constitutes “urban” and its precise measurement that can facilitate international comparability. This has largely been attributed to the differing criteria employed by countries in defining “urban” and “rural” areas—a reflection of their various perspectives as to what constitutes these types of human settlements. Understanding future scenarios of urban trends calls for a more precise measurement that allows for meaningful comparison across countries, while remaining relevant to national conceptions of urban and rural areas.
It is in this light that this chapter uses a new, harmonized and global definition of urbanization that facilitates international comparability to present scenarios of urban trends in various regions of the world. These scenarios allow us to understand the anticipated demographic and spatial changes across the urban-rural continuum in various regions as well as their drivers.Thisdefinition,knownastheDegreeofUrbanization, was endorsed by the United Nations Statistical Commission in 2020. It was developed by six international organizations1 to facilitate international comparisons and complement national definitions. The monitoring of both the New Urban Agenda and the 2030 Agenda for Sustainable Development in particular stands to benefit from this harmonized definition. A detailed manual of how to apply this new definition was published in 2021.2
Chapter 1 describes urban trends based mainly on data from the United Nations World Urbanization Prospects (WUP). This chapter, on the other hand, complements the analysis in the preceding chapter by providing a different, but equally important, perspective on future trends using Degree of Urbanization and data emanating from this new harmonized approach.
The chapter begins with a short introduction to the Degree of Urbanization. It then shows how urbanization has and will change from 1950 to 2070 using a new global definition of cities, towns and rural areas. The chapter presents the drivers of urbanization in the different regions of the world, highlighting how the spatial expansion of cities and the emergence of new cities have contributed to city population growth. It reveals how cities attract young adults, but children and elderly are more likely to live outside cities. The chapter explores how the number and size of cities have been changing and the future challenges of city growth. Finally, the chapter interrogates how dense our cities should be while advancing options that enhance sustainability.
Despite varying national definitions, the harmonized definition proposed by the Degree of Urbanization methodology has revealed that there is in fact a broad consensus across countries on what constitutes a large city and where the most rural areas are. However, there is a wide variation in how “towns” are defined, a discrepancy with profound implications for demographic analysis of global urbanization trends. In general, national definitions in Europe and the Americas tend to classify towns as urban, while in Africa and Asia they tend to classify them as rural. For example, in Brazil, France, Mexico and the United States, towns tend to be classified as urban, while in Egypt, India, Uganda and Viet Nam towns are often classified as rural. In some cases, this happens because the country uses a high minimum population threshold for a settlement to be considered urban. In other cases, especially where the minimum population threshold is already met, a range of other indicators or criteria applied by a country (in combination with the minimum population threshold) excludes such settlements from being officially recognized as urban. This distinction leads to only a small share of towns being classified as urban.
There is a wide variation in how “towns” are defined, a discrepancy with profound implications for demographic analysis of global urbanization trends
It is worth noting that most national definitions with a minimum population size threshold for an urban area use a relatively low threshold. Out of the 100 countries for which the World Urbanization Prospects lists a minimum population threshold, 84 use a threshold of 5,000 or smaller. The Degree of Urbanization follows this approach and defines all settlements with at least 5,000 inhabitants as urban. However, it recommends splitting these urban areas into cities of at least 50,000 inhabitants, on the one hand, and towns and semi-dense areas, on the other hand. This captures the urban-rural continuum more accurately, as a growing number of national definitions do as well. It also means that the cities and the rural areas as defined by the Degree of Urbanization are generally classified as urban and rural, respectively, by their national definitions and that the areas that are not treated consistently by national definitions are confined to the intermediate classes: “towns and semidense areas.”
2.1. The Degree of Urbanization and Why it is Important?
The Degree of Urbanization also has a second-level classification that splits towns from semi-dense areas and creates three classes in rural areas: villages, dispersed rural andmostlyuninhabited(Box2.1).Tobetterunderstandurban futures and their demographic drivers, it is important move beyond the classical rural-urban dichotomy and consider entire urban continuum.3 This reconceptualization is critical and aligns with the vision of the New Urban Agenda and SDG 11 of fostering equitable regional development across all sizes and scales of human settlements while supporting positive economic, social and environmental interlinkages in these territories. Sustainable urban futures cannot be realized using the traditional dichotomized or binary treatment of human settlements.
The discrepancy in how towns and other areas in the middle of the urban-rural continuum are classified by national definitions has a statistically significant impact on the global level of urbanization. For example, the world would be substantially “more urban” if all such settlements were

classified as urban. Applying this definition to an estimated global human settlements population grid (GHS-POP)4 for 2015 shows that in most regions the population share in cities as defined by the Degree of Urbanization is similar or smaller than the urban population share based on national definitions (Figure 2.1).
The rural population share as defined by the Degree of Urbanization is also typically similar or smaller than the national defined rural population share. In high-income countries, however, the nationally-defined rural population share is smaller than the one as defined by the Degree of Urbanization approach. This is because several of the highincome countries use a minimum population threshold below 5,000 inhabitants. For example, the US uses 2,500, Canada and New Zealand use 1,000 and Denmark and Sweden use 200.
These results highlight the broad agreement on the two categories of human settlement at the extremes as well as the disagreement with regard to the middle of the urbanrural continuum. Given the global population concentration in Asia and Africa, the global population share in nationallydefined urban areas (54 per cent) has a closer resemblance to the share of population in cities (48 per cent) than the aggregate of cities plus towns and semi-dense areas (78 per cent) as defined by the Degree of Urbanization.
Scenarios of Urban Futures: Degree of UrbanizationTo better understand urban futures and their demographic drivers, it is important move beyond the classical rural-urban dichotomy and consider entire urban continuumFigure 2.1: Population by Degree of Urbanization and in nationally defined urban areas by SDG regions and income group, 2015
The Degree of Urbanization methodology offers more nuance than the “urban” and “rural” binary that categorizes the demographic classification of human settlements common in many national statistical offices. Instead of those two categories, the Degree of Urbanization approach proposes two levels of understanding with distinct classes of human settlement by analysing grid cells of one square kilometre (1 sq. km).
Level 1 consists of three classes:
1. Cities: settlements of at least 50,000 inhabitants in a high-density cluster of grid cells (greater than 1,500 inhabitants per sq. km)
2. Towns and semi-dense areas: an urban cluster with at least 5,000 inhabitants in contiguous moderate-density grid cells (at least 300 inhabitants per sq. km) outside cities
3. Rural areas: grid cells with a density of less than 300 inhabitants per sq. km or higher density cells that do not belong to a city, town or semi-dense area
Urban areas are defined as “cities” plus “towns and semi-dense areas.” It is recommended, however, to keep all three classes separate given their different nature.
Level 2 uses six classes:
1. Cities: same as above
2. Towns: settlements with between 5,000 and 50,000 that are either dense (with a density of at least 1,500 inhabitants per sq. km) or semi-dense (a density at least 300 inhabitants per sq. km).
3. Suburban or peri-urban areas: cells belonging to urban clusters but not part of a town
4. Villages: settlements with a population between 500 and 5,000 inhabitants and a density of at least 300 inhabitants per sq. km.
5. Dispersed rural areas: rural grid cells with a density between 50 and 300 inhabitants per sq. km.
6. Very dispersed rural areas or mostly uninhabited areas: rural grid cells with a density between 0 and 50 inhabitants per sq. km.
TheWorldUrbanizationProspectsalsolistscitieswithatleast 300,000 inhabitants. Comparing these designations with the cities identified by the Degree of Urbanization shows a very high overlap.5 This confirms that national definitions and the Degree of Urbanization agree on what constitutes a large city. However, compared to the data in the World Urbanization Prospects, the data used here has several advantages (Box 2.2). The concept of “city” and its definition here have been harmonized whereas the World Urbanization Prospects employs a mixture of city proper, urban agglomeration and metropolitan areas. Second, instead of the point locations
provided by the World Urbanization Prospects, this data set produces boundaries with a high spatial resolution. The cities are defined using a grid of one square kilometre (1 sq. km) cells. This means that city population densities can be calculated and compared in a meaningful way.
The cities are defined using a grid of one square kilometre (1 sq. km) cells. This means that city population densities can be calculated and compared in a meaningful way
The Degree of Urbanization methodology:
• captures the urban-rural continuum through three different classes at level 1 and through six different classes at level 2 of the methodology’s classification system (Box 2.1: Levels and classes in the Degree of Urbanization methodology);
• uses the same population size and density thresholds across the world;
• starts from a population grid to reduce the bias of using spatial units with different shapes and sizes;

• measures population clusters directly instead of indirectly by using building clusters as an approximation of population clusters;
• defines areas independently from their access to services to ensure that this access can be monitored reliably, in other words, without interference from the definition;
• proposes a relatively cost-effective approach that can be applied to existing data collections.
Source: European Union et al, 2021.
Scenarios of Urban Futures: Degree of UrbanizationAs a city expands, it incorporates the population of the surrounding rural and semi-dense areas and can annex nearby towns (Figure 2.2a). When a town grows, it can pass the minimum population threshold and become a new city (Figure 2.2b). In both cases, the total population has grown, but the initial population of the rural and semi-dense areas as well as the towns are merely reclassified. This population was already there before the city expanded or became a new city. Measuring the impact of reclassification separately is a longstanding United Nations recommendation.6 Previously, this task has been difficult to achieve due to the lack of a harmonized definition and boundaries with a high spatial resolution. This chapter, however, looks at the impact of reclassification in subsequent sections.


Generally, the high growth rates of urban population in the World Urbanization Prospects have dominated the debates on urbanization in recent decades. However, the differences betweenthenationaldefinitionsandtheunclearimpactofthe reclassification of areas have led to an overestimation of urban growthrates,anemphasisonchallengesformegacitiesrelative to small- and medium-sized cities, and an underestimation of the relevance of urban natural increase versus rural-to-urban migration as a source of city population growth.7
According to different scenarios, in particular regarding the decline of fertility rates in developing countries, the peak for global population growth could be reached between 2070 and the end of the 21st century.8 Apart from differences in timing, the completion of demographic transition in developing countries is expected to parallel urban transitions and lead to a convergence of urban population growth rates towards the low level already reached by highly urbanized countries.9
Within this general theoretical framework, the trends of urbanizationindevelopingcountriesandemergingeconomies exhibit unique features with respect to what happened during industrialization in the 19th century. While increases in the share of urban population are only slightly higher by historical standards, developing countries are characterized by an unprecedented growth of urban population in absolute terms mostly due to their high national population growth.10
In terms of economic development, the previous two editions of the World Cities Report have highlighted the positive link between urban areas and economic development. The World Cities Report 2016 showcased urbanization as a transformative trend, with urban areas described as “a positive and potent force for addressing
sustainable economic growth, development and prosperity, and for driving innovation, consumption and investment in both developed and developing countries.”11 The World Cities Report 2020 reinforced this message by stating that urban areas generate enormous economic value, although the economic value generated varies depending on the local context.12 For instance, while the linkages between urbanization and economic growth have been apparent in Eastern and South-Eastern Asia, several authors have highlighted that the relationship between urbanization and economic development has decoupled in Sub-Saharan Africa, citing several reasons e.g. widespread neglect and bad management of cities, among other factors.13
In relation to environmental sustainability, the World Cities Report 2020 notes that urbanization, if unplanned or unmanaged, presents threats such as “unbridled urban sprawl, irreversible land-use changes and biodiversity loss, resource and energy-intensive consumption patterns, and high levels of pollution and carbon emissions.” In the same vein, Chapter 5 of this Report stresses the threat posed by the twin crises of climate change and the loss of global biodiversity to the
future of cities. In relation to climate change, for instance, the IPCC points out that the resulting sea-level rise—which is expected to significantly increase by the end of this century— poses risks to high-density coastal urban developments in both developing and developed countries.14

The projections presented in this chapter produce different estimates of urban and rural population as compared to national definitions for two main reasons. First, some national definitions include medium-sized settlements or towns in the urban category, while others categorize them as rural. The Degree of Urbanization classifies these settlements into its own category: “towns and semidense areas.” The second reason is that the projections of population by Degree of Urbanization are not derived from an extrapolation of the trends of rural and urban population aggregated at the national level, as normally done in the United Nations World Urbanization Prospects, 15 but from a bottom-up approach starting at the grid cell level.
With the Degree of Urbanization approach, urbanization is not predetermined from national trends but emerges from a gravity model that reflects the surrounding and attractiveness of each grid cell. The parameters used in this model have been estimated for different regions of the world and are based on changes in population and built-up area grids between 1975 and 2015.
Since the population by Degree of Urbanization is based on geographically-detailed data, it is possible to do a more detailed analysis. The Degree of Urbanization can be applied at multiple points in time, which makes it possible, for example, to measure the impact of expansion and densification separately for each city.
In terms of data sources, the projections and trends in this chapter rely on three distinct data sets. For the period 1950 to 1975, the population by Degree of Urbanization has been estimated by combing data based on national definitions from the World Urbanization Prospects and estimates of the population by the Degree of Urbanization for 1975 produced by the European Commission’s Joint Research Centre (JRC). From 1975 to 2015, the data relies global estimated population grids for 1975, 1990, 2000 and 2015 produced by the JRC. The data from 2015 to 2070 relies on projected population grids produced by Jones et al. (2020). The national population projections are derived from the Shared Socioeconomic Pathway 2: Middle of the Road scenario as prepared by the International Institute for Applied Systems Analysis (IIASA).
Scenarios of Urban Futures: Degree of UrbanizationUrbanization undoubtedly presents a unique opportunity for social and economic progress.16 On the other hand, as highlighted in Chapter 1, it also presents challenges when planning systems and public institutions are not equipped to deal with the challenges posed by rapid urbanization. Rapid population growth in cities, for instance, can lead to congestion and crowding when it is not anticipated with adequate infrastructure and housing and when the expansion of the city is not properly planned and managed. As a result, the population growth in cities, especially rapid growth, is a central concern as humanity moves into a future that is predominantly urban.
Uncovering some of these demographic trends using a harmonized global methodology that captures the urbanrural continuum in a consistent manner is therefore fundamental. In this regard, this section applies the Degree of Urbanization to briefly examine the demographic trends of the three classes of settlements that comprise Level 1 in Box 2.1. It provides a synopsis of previous decades before venturing into future projections of what is expected to unfold until 2070. Similarly, using this harmonized data, it peeks into future anticipated land-cover changes.
Over the past seven decades, the world has experienced significant population growth and notable demographic “megatrends,” including urbanization, which have significant implications for economic and social development as well as environmental sustainability.17 In 1950, the global population was relatively small at only 2.5 billion and mostly rural. By 2020, the global population had grown to 7.8 billion and most people lived in cities. This transformation has had big economic, social and environmental consequences which various chapters of this report examine with a view to achieving sustainable futures.
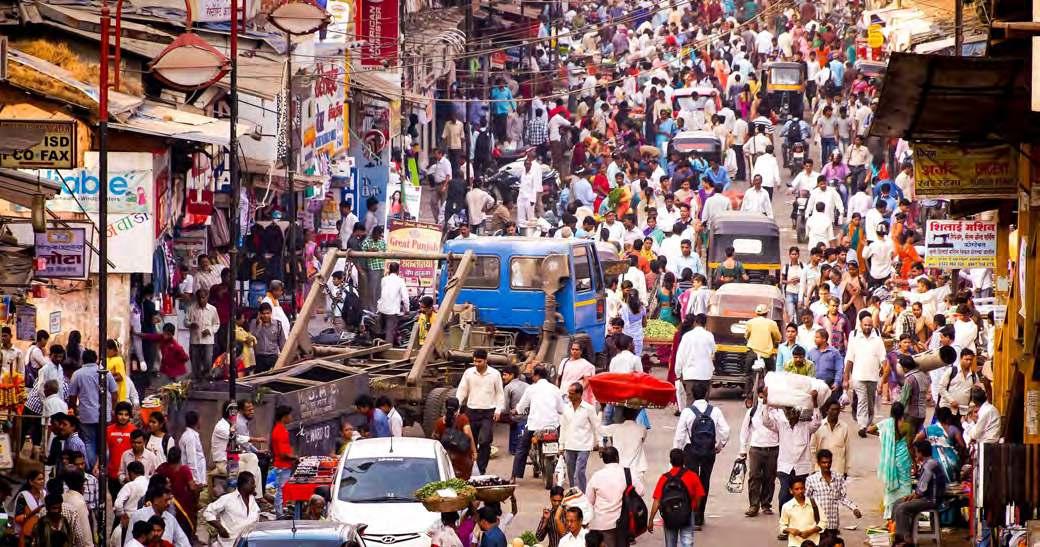
In 1950, most people lived in rural areas, followed by towns and semi-dense areas, while cities were the least inhabited. Faster growth in city population meant that by 1965, the global population was equally distributed across these three types of areas (Figure 2.3). By 1990, the order had reversed with most people living in cities, followed by towns and semi-dense areas, and then rural areas last. In 2020, almost half the global population lived in cities, while 29 per cent lived in towns and semi dense areas and 22 per cent in rural areas.
However, this large transformation is projected to slow into the future. Demographic growth has already started to decelerate and is projected to continue to do so over the coming decades. The share of population in cities is projected
The share of population in cities is projected to grow at a slower pace to reach 58 per cent of the global population in 2070, while the share in towns and semi-dense areas is expected drop to 24 per cent
to grow at a slower pace to reach 58 per cent of the global population in 2070, while the share in towns and semi-dense areas is expected drop to 24 per cent.
Notably, the population in towns and semi-dense areas has generally grown at the same speed as the total population between 1950 and 2020. As a result, it has maintained its population share of 30 per cent over that period, but the absolute number of people in these areas tripled from 750 million to 2.25 billion. The population in these settlements is projected to continue growing, but more slowly than the total population. Between 2050 and 2070, however, population in towns and semi-dense areas will start declining.
The rural population, on the other hand, has grown more slowly than total population from 1975 to 2020. This growth is projected to continue to slow down until 2050, after which a slight decrease in absolute numbers is expected. As a result, its population share has dropped from 38 per cent in 1950 to 22 per cent in 2020 and to 18 per cent in 2070.
In terms of geographic regions, data from the Degree of Urbanization shows Sub-Saharan Africa and Oceania to be having the lowest city population share in 1950 (Figure 2.4). These two regions—together with Northern Africa and Western Asia—are projected to experience the biggest increase in the city population share in the future. On the other end of the spectrum, Europe will experience the smallest increase in its city population share among the regions. In most regions, the population share will drop in both rural areas as well as towns and semi-dense areas. In the Americas, Europe, Australia and New Zealand, however, the population share in towns and semi-dense areas barely changes over time.
Scenarios of Urban Futures: Degree of Urbanization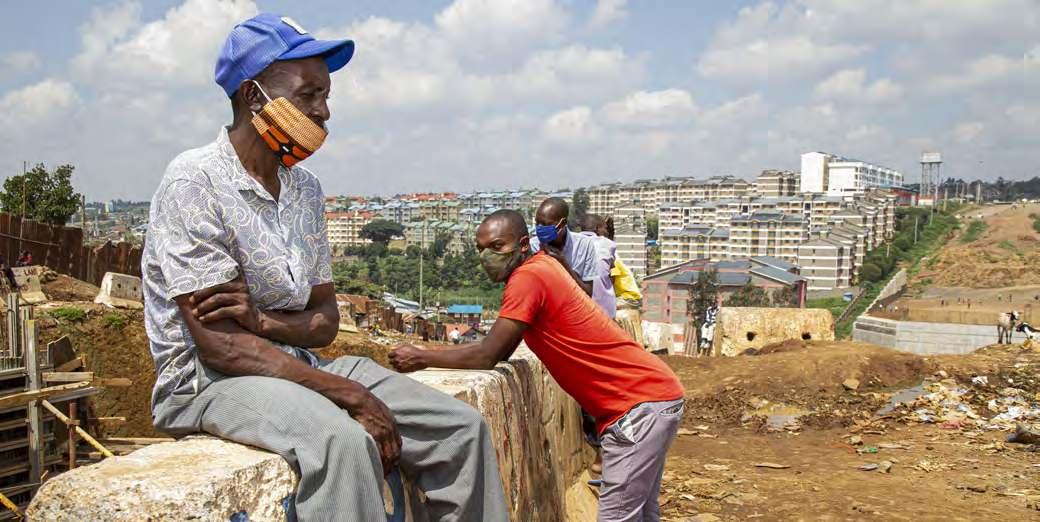
When these demographic changes are assessed in terms of income groups, the data show that low-income countries had the smallest share of city population (17 per cent) in 1950, while high-income countries had the highest share (31 per cent). Because city population shares in low-income countries increased faster than in high-income countries, this gap has shrunk from 14 to 7 percentage points and is projected to drop to 5 percentage points by 2070 (Figure 2.5).
Over the past decades, population growth rates in lowerincome countries have been higher than in other countries. This trend is expected to continue. By contrast, high-income countries have had relatively low population growth rates, which are projected to slow further and reach almost zero by 2070. Upper- and lower-middle-income countries have also experienced higher growth rates in the past decades, but they are also slowing down. The population of uppermiddle-income countries is even projected to shrink from 2040 onwards.
The growth of population in cities, towns and semi-dense areas invariably leads to spatial expansion. Past studies have shown urban land area growing at a higher rate than population and, relatedly, population densities have also been declining as a result of more dispersed patterns of urbanization in the form of urban sprawl.18 These trends significantly affect the environment and have profound socioeconomic repercussions. These effects include negative impacts on ecosystem services and increased energy consumption, higher cost of providing infrastructure (often leading to the uneven or unequal distribution of services), a
sustainable futures call for slowing down urban sprawl and, if possible, ensuring that the compactness of cities is maintained or increased over time in line with Target 11.3 of SDG 11
reduction in the economies of agglomeration and decreased urban productivity, among others. Yet, sustainable futures call for slowing down urban sprawl and, if possible, ensuring that the compactness of cities is maintained or increased over time in line with Target 11.3 of SDG 11—which also provides a measure of how efficiently cities “utilize” land.19
The Degree of Urbanization shows that the share of land occupied by cities is small (0.5 per cent in 2020), but has been growing (from 0.2 per cent in 1975) and is projected to keep growing (to 0.7 per cent in 2070) (Figure 2.6). In contrast, land covered by towns and semi-dense areas double between 1975 and 2020, but it is projected to start shrinking from 2040 onwards due to conversion to city and rural land. This projection also indicates that the amount of urban land is likely to shrink after 2050.
City land in low-income countries has been growing rapidly and is projected to more than double between 2020 and 2070 (Figure 2.7). Additionally, land covered by towns and semidense areas in low-income countries is projected to grow, but at a slower pace (+50 per cent between 2020 and 2070). In contrast, upper-middle-income countries are projected to experience the slowest increase in city land (+10 per cent between2020and2070)andlandcoveredbytownsandsemidense areas is likely to shrink, in part due to their shrinking population. Urban land in lower-middle- and high-income countries is projected to grow, but the pace slowing over time to reach almost zero between 2060 and 2070.


The previous section and Chapter 1 show that urbanization is pervasive although the level, pace and processes driving urbanization are uneven across the world. The previous sections of this chapter have also described nuanced trends along the urban-rural continuum based on the classes in new global definition (“cities,” “towns and semi-dense areas” and “rural areas”). This section delves into the most distinct and unique pattern emerging at the global level that carries significant implications for urban futures: population growth in cities.20
Depending on how it is managed, population growth in cities can contribute to sustainable urban futures and deliver on the optimistic scenario described in Chapter 1 by increasing economic productivity, spurring innovations and new ideas that enable people to find a better job and better access to services. On the other hand, if this growth is not planned for and well-managed, it can exacerbate poverty and inequality (increasing the population of slums or poorly-serviced neighbourhoods), compound environmental problems and
Depending on how it is managed, population growth in cities can contribute to sustainable urban futures
Land covered by cities, towns and semi-dense areas in low income countries, 1975-2070
3.5% 3.0% 2.5% 2.0% 1.5%
Land covered by cities, towns and semi-dense areas in Lowermiddle income countries, 1975-2070
0.5%
Land covered by cities, towns and semi-dense areas Uppermiddle income countries, 1975-2070
1.8% 1.6% 1.4% 1.2% 1.0% 0.8% 0.6% 0.4% 0.2%
0.31% 0.75% 1975 0.49% 0.95% 1990 0.65% 1.14% 2000 0.82% 1.41% 2010 0.98% 1.62% 2020 1.13% 1.73% 2030 1.26% 1.80% 2040 1.35% 1.86% 2050 1.40% 1.90% 2060 1.42% 1.91% 2070
Land covered by cities, towns and semi-dense areas in high income countries, 1975-2070
0.32% 0.67%
0.39% 0.75% 1990 0.47% 0.79% 2000 0.51% 0.87% 2010 0.58% 0.91% 2020 0.64% 0.91% 2030 0.68% 0.90% 2040 0.72% 0.89% 2050 0.75% 0.87% 2060 0.78% 0.85% 2070
pose challenges to the achievement of net-zero
to the pessimistic or even high
described in Chapter 1. As a result, this section, using new data from the harmonized definition of cities in the Degrees of Urbanization approach, revisits the drivers of city population growth, including the questions of how cities expand, how new cities emerge and how the age of a city’s population differs from those in the rest of the country.
2.3.1. Natural growth is the main driver of city population growth
have warned about the frequent
of the role of rural-urban migration in the
urban
Despite using different methodologies
in last decades in particular in Sub-Saharan Africa.
the demographic drivers of urban growth,
agree that about 60 per cent of the
urban population increase is attributable to natural growth and the remaining 40 per cent is due to the combined effect of migration and reclassification of areas. Because most of the growth in city population is due to natural change and expansion, restricting migration into cities would have relatively little impact.22
These warnings and estimates are confirmed by the analysis of city population growth over time (Figure 2.8). In lowermiddle- and low-income countries, city population growth is mainly determined by natural change (captured in the fixed share component, see Box 2.4). The influence of city-to-rural migration (captured by the change in share component) has been dropping over time and is projected to continue to do so. For example, between 2060 and 2070, the city
population in low-income countries is projected to increase by 12 per cent. Two-thirds of this increase (8 per cent) stems from natural change (fixed share) and only one-third from rural-to-city migration (change in share).
In high-income countries, both components (fixed share and change in share) contribute equally to growth, and both are shrinking over time. In upper-middle-income countries, the contribution of the natural change (fixed share) is decreasing at a faster rate than rural-to-city migration (change in share) and becomes negative after 2040. This decline is because the national population is projected to shrink from 2040 onwards and only the rural-to-city migration ensures that city populations continue to grow.
National population change is often broken down into “natural change” (the difference between the numbers of births and deaths) and “net migration” (the difference between in-migration and outmigration). At the national level, this natural change and international net-migration data are usually available. Measuring population change at the city level, however, is more complicated. At the city level, net migration has to consider both international and internal migration. Data is usually not available for natural change at the city level. Finally, the boundaries of a city can change over time, leading to a reclassification of population. As a result, this chapter splits population growth in two different ways.
City population growth can be split into two components based on the changes in the city population share:
• Fixed share shows how much the population of a city would grow if its share of the national population remained fixed. This would be the case if it had the same natural change and net-migration rate as its country did. In lower-income countries, this will primarily be driven by natural change.
• Change in share shows how much the population of a city grows because its share of the national population changed. This share can grow due to net migration, expanding city boundaries and differences in natural change. In lower-income countries, this will be mainly driven by rural-urban migration.
City population growth can also be split into change and reclassification:
1. Population change:
i. Within the initial boundaries of the city.
ii. Within areas that are newly classified as a city.
2. Reclassification: Initial population in areas that are newly classified as (part of) a city.
i. Expansion: Rural, suburban and peri-urban areas that have been added to a city.
ii. Annexation: A town is added to a city.
iii. A new city: An area, typically a town or village, grows enough in population and density to be classified as a city.


One important, and often ignored, driver in expansion of city population is represented by the changes in the classification of an area. So far attempts to explicitly account for the role of reclassification in explaining urban growth have been hindered by the lack of harmonization in the definitions and the absence of detailed boundaries. However, with the new definitions and by using spatial methods applied on population grids, some studies have started to demonstrate how this role is far from being negligible.23
As population grows, some areas originally classified as towns or rural areas are reclassified as cities and their population starts to contribute to city population growth. The other sources of city population growth are natural change and migration. By applying the classification by Degree of Urbanization at multiple points in time, the impact of the change in classification for each cell can be captured and aggregated. Overall, the spatial expansion of cities and the emergence of new cities are projected to contribute between 20–40 per cent of the growth in city population. However, as highlighted in the previous subsection, most population growth in cities is due to natural change (fixed share) and most of that growth will occur within the initial boundaries of a city, while reclassification will add less and less to city populations (Figure 2.9).
Most new cities will be towns that have grown to attaining the threshold for “city” classification as per the Degree of Urbanization harmonized definition. The contribution of these reclassifications is higher in low-income countries and leads to a 5 per cent increase city population per decade. Further, from the spatial analysis using the Degree of Urbanization approach, the transformation of a rural area directly to city can also be observed in low-income countries. This phenomenon, however, does not happen in countries with higher incomes.
In high-income countries, new cities will be rare. Between 2060 and 2070, new cities are projected contribute to increase the city population by only 0.5 per cent. In contrast, in low-income countries the emergence of new cities between 2060 and 2070 is projected to increase the city population by 2.3 per cent. The emergence of new cities of small size poses challenges in terms of urban governance for low-income countries. The previous World Cities Reports

have highlighted the plight of secondary or intermediary cities in most countries. Often, these cities face challenges in managing urbanization. They struggle to attract investments; generate employment; and meet the demand for housing, infrastructure and basic urban services.24
To realize sustainable urban

Despite these challenges, policy discussions on urbanization have been dominated in the past by their attention on the unprecedented growth of megacities and large cities. As illustrated in Chapter 4, the “winner-takes-all” phenomenon propels megacities and large cities to growing economically faster than others creating more localized development as opposed to allowing more diffused spatial development across territories. Such asymmetrical development compounds the urbanspatialdivide,especiallywithregardtosecondarycities— whose populations, especially in regions such as Sub-Saharan Africa, often face multiple deprivations relating to income and employment, water and sanitation, health and housing.25
To realize sustainable urban futures, an integrated and territorial approach to urban development is imperative. Various levels of government can develop and implement national urban policies and strategies that ensure integrated spatial growth and development to harness the potential of such small and intermediate cities within national urban systems. These settlements offer a significant, but often untapped, potential for achieving the Sustainable Development Goals and contributing to sustainable futures. The poor data and information on these cities pose severe challenges for evidence-based policy formulation. For instance, the lack of sufficient geographic detail and of a harmonized definition makes it impossible to unpack the specific components of urban growth.
In low-income countries, expansion and annexation account for a relatively small share of city population growth and the high growth rates are mainly driven by population growth within the initial city boundaries and the new city areas (Figure 2.10). On the other hand, expansion and annexation are more important in high-income countries because cities

during
previous
tend to be surrounded by larger suburbs, which are absorbed by the city as it expands. This tendency is particularly the case for small cities, where the population of the surrounding suburbs is more important relative to the city population than is the case for larger cities.


In the rural areas of low- and lower-middle-income countries, children as a share of the rural population is higher than the share of children in the city population (Figure 2.11). These higher shares reflect the higher fertility rates in rural areas whichisdocumentedinseveralanalysesbasedonDemographic and Health Survey data.26 Between 1950 and 2050, the slopes
of the lines for children do not change substantially, but tend to shift downwards. This indicates an overall reduction in the share of children at the country level, but illustrates no fundamental changes in rural/city differences.
Inupper-middle-incomecountries,areductionoftheintercept between 2050 and 2000 shows the effect demographic transition in terms of changes of overall age structure at national level. This change is also accompanied by a flattening of the lines, which indicates that rural areas are converging towards the lower fertility and mortality levels found in cities.
While differentials in age structure for the age groups of children can be mainly attributed to fertility and mortality, differences in other age groups stem both from cohort effects (population residing in the areas moving to the next age group) and migration patterns which can also have a strong age component.27

In all income groups, the slopes invert from positive to negative when moving from children to young adults’ cohorts. This inversion indicates that cities attract more younger adults relative to towns and rural areas. In low-income countries, the slopesaremorepronouncedandtheinversionisanticipatedto the age group 15–19. For high-income countries, the negative slope starts at age 20 in correspondence with migrations of students to cities for tertiary education.
Another inversion that can be observed after age 50, particularlyinhigh-incomecountries,denoteshowpopulation ageing is affecting rural areas. This trend is likely attributable to migrations from cities to rural areas in correspondence with retirement. Differentials in age distribution between cities, towns and rural areas have implications both for the ageing of population in countries in advanced stages of their demographic transition and for countries with still high fertility rates and large youth populations.
Overall,thelargeshareofyouthpopulationincitiesisexpected to persist. If accompanied by favourable conditions, large youth bulges concentrated in cities of developing countries represent the source of a demographic dividend. In the absence of such conditions, they pose several demographic and socio-economic challenges. Provided there are sufficient employment opportunities, a large youth population frees up resources for investments and boosts productivity. 28 This positive effect holds true irrespective of the level of income and geographical area. Where employment opportunities are lacking, youth bulges may be a source of unrest, violence and conflicts.
Town
2020 2050
Note: This graph shows the population share for five-year age groups by Degree of Urbanization for three points in time. The data points of the three classes of the Degree of Urbanization are connected by a line. A line with an upward slope means that a higher share of that age groups lives in rural areas as compared to cities. A line with a downward slope means that a higher share of that age group lives in cities as compared to rural areas.
More than a decade ago, the UN-Habitat flagship report State of the World Cities 2008/09 described cities as “one of humanity’s most complex creations, never finished, never definitive. They are like a journey that never ends. Their evolution is determined by their ascent into greatness or their descent into decline. They are the past, the present and the future.”30 The analysis of previous and anticipated future trends using the harmonized definition of cities provides an insight into this evolution of cities in a coherent way. As alluded to in previous sections, it shows that cities have been growing demographically and spatially and will continue to do so.
At the same time, the data paint a picture of overall growth: the number of cities globally doubled between 1975 and 2020 to 14,000. However, the data also show that the growth in the number of cities will slow down—with only another 3,000 new cities appearing over the next 50 years. As the following subsections will illustrate, this global slowdown in the growth of the number of cities hides a lot of variation,
some based on size of cities (Box 2.5), income grouping and geographic region. Some will even experience population loss and shrinkage in the future.
Cities as defined by the Degree of Urbanization are divided into four size classes:
Small cities have a population between 50,000 and 250,000 inhabitants.
2. Medium-sized cities have a population between 250,000 and 1 million inhabitants.
Large cities have a population between 1 and 5 million inhabitants.
Very large cities have a population of a least 5 million inhabitants.
Low-income countries experienced the largest increases in the number of cities between 1975 and 2020 (+270 per cent), while high-income countries experienced the smallest increase (+30 per cent). Increases in middle-income countries were between these two extremes (+55 per cent and +130 per cent) (Figure 2.12). Projections indicate that, between 2020 and 2070, the number of cities in lowincome countries will grow far more than in the rest of the world. An increase of 76 per cent, compared to 6 per cent in upper-middle-income countries. The number of cities in high-income and lower-middle-income countries will both increase by about 20 per cent.
From a geographical perspective, the two regions with the biggest absolute increase in the number of cities between 1975 and 2020 are Central and Southern Asia (+2,500) and Sub-Saharan Africa (+1,800) (Figure 2.13). According to the projections, they will also experience the biggest increases between 2020 and 2070 (+850 and + 1,700, respectively).
The two regions with the lowest relative increase in the number of cities between 1975 and 2020 are Europe, where they remained constant, and Eastern and South-Eastern Asia, where they increased by 35 per cent. The projections also suggest that the growth in cities will remain low in these two regions. In Europe, the number of cities is projected
to increase by only 9 per cent between 2020 and 2070 while the number of cities is projected to remain constant in Eastern and South-Eastern Asia.
The biggest increase in cities with 1 or 5 million inhabitants between 2020 and 2070 is projected to happen in SubSaharan Africa and Central and Southern Asia. In SubSaharan Africa, the number of cities with at least 1 million inhabitants will increase from 60 to 134 over the next 50 years and those with at least 5 million will increase from six to 28. For Central and Southern Asia, the respective increases are from 117 to 183 and from 16 to 31. In all other regions, the increase is much lower. Notably, Eastern and South-Eastern Asia is projected to see a small reduction of cities with at least 5 million, from 29 to 27.
2.4.2. In more developed countries, the largest city tends to be more important Urbanization and the concentration of population in cities is seen by standard economic geography as a finite and beneficial process, part of the transformation from agrarian to industrialized societies. Higher concentration has been historically associated with economic development, improvements in living standards, better education, lower fertility, technological development and increased productivity. However, these outcomes are not guaranteed,
especially in poorer countries, and urbanization by itself is not a sufficient condition for economic development.
The new harmonized definition and data set allow us to capture primacy, or the relative importance of the biggest city, in two ways: (a) by calculating the population in the largest city relative to total city population in a country and (b) via the Hirschman-Herfindahl Index (HHI), a common measure of concentration.32 Noteworthy, because, for most countries,itwasnotpossibletoobtaindataforeachcity,most studies relied on a less suitable indicator: the population of the largest city as a share of the national population.
Overall,primacytendstobehigherinsmallercountriesaswell asinmoredevelopedcountries(Table2.1).Asmallcountrymay only have a single city, leading to high primacy. For example, Bahrain, Lesotho, Mauritius, Timor-Leste and Singapore only have one city. In a large country, a single city cannot capture a large share of the country’s city population. For example, in India the biggest city only accounts for 4 per cent of the country’s city population. The city population share in the largest city decreases from 69 per cent in small countries (1 to 5 million total population) to 21 per cent on average in very large countries (i.e., with more than 100 million inhabitants); HHI decreases from 56 per cent on average in small countries to 8 per cent on average in very large countries.
Population
Low Income
Lower-middle income
Upper-middle income
High Income 74%62%47%25%31%25%53%
Oceania 8% 8% Northern America 30%10%20% Central and Southern Asia 50%43%35%26%15%34% Australia and New Zealand61% 28% 45% Sub-Saharan Africa 65%60%35%39%31%9%45% Europe 62%54%43%18%24%22%47% Latin America and the Caribbean71%57%44%39%27%22%49%
Northern Africa and Western Asia82%53%50%23%30%32%50% Eastern and South-Eastern Asia96%84%56%31%45%31%54%
All 69%56%42%31%32%21%46%
Low Income
Lower-middle income
Upper-middle income
16%17%5%29% High Income
Oceania 3% 3% Northern America 13%3%8% Central and Southern Asia 29%25%14%8%5%17% Australia and New Zealand40%
29% Sub-Saharan Africa
Europe
Latin America and the Caribbean54%39%25%20%10%7%31% Northern Africa and Western Asia72%35%31%7%11%12%35% Eastern and South-Eastern Asia93%74%35%13%25%14%39%
Primacy also tends to be higher in high-income countries than in lower-income countries, but the relationship is complex. Econometric analyses show that the relationship between the concentration of population in the biggest city, or primacy, and economic growth is not linear. Given the population size and the level of development of a country, there is an optimal range of primacy where it contributes to economic growth, beyond which it acts as a brake on development.33
As population continues to grow in most countries, primacy is also projected to drop. On average, city primacy in 2020 was 46 per cent, which is slightly lower than in 1975 (49 per cent). Projections indicate that it will continue to drop, reaching 45 per cent in 2070. The HHI shows the same pattern: decreasing from 36 per cent in 1975 to 30 per cent in 2020 and projected to reach 29 per cent in 2070.
The two regions with the highest average primacy are Eastern and South-Eastern Asia and Northern Africa and Western Asia.Inboth,primacytendstobesignificantlyhigherininthe various country population size groups, which may indicate that excessive primacy could limit economic growth. Faster population growth of the smaller cities in these countries would reduce their primacy and may help to reduce pressure on the largest city.
2.4.3. More and more people are living in large cities
City population growth varies by income group and city population size (Figure 2.15). In low-income countries, city population increases from below 100 million people in 1975 to more than 700 million people in 2070. Most significant change takes place in the cities with more than 5 million inhabitants. Low-income countries did not have a single city of this size in 1975. By 2020 there were three cities with more than 5 million inhabitants, which hosted about 18 million people: Dar es Salaam, Tanzania; Kabul, Afghanistan; and Kinshasa, Democratic Republic of the Congo. By 2070, low-income countries are projected to have 15 cities in this class with a cumulative population exceeding 150 million people. The total population in cities of between 1 and 5 million inhabitants was only 18 million in 1975. That figure
The total population in cities of between 1 and 5 million inhabitants was only 18 million in 1975. That figure tripled to 70 million in 2020 and is projected to double by 2070 to reach almost 140 million
tripled to 70 million in 2020 and is projected to double by 2070 to reach almost 140 million.


Population in cities in lower-middle-income countries is projected to increase from half a billion to 2.5 billion people between 1975 and 2070. Population increases were the biggest for cities with at least 5 million inhabitants, increasing from 60 to about 360 million between 1975 and 2020 (+500 per cent). The projections indicate that this population will further increase to 830 million by 2070.
City population in upper-middle-income countries increased from 540 million people in 1975 to 1.2 billion people in 2020, but projections show that the population size will level off over the coming decades, stagnating at around 1.35 billion between 2050 and 2070. The largest increments in city population in these countries have taken place prior to 2020. Noteworthy, the growth in city population is concentrated in cities with at least 5 million inhabitants, which increased from 65 million in 1975 to 310 million in 2020 (+400 per cent). It is projected to still increase, but at a much slower rate, to 370 million by 2070 (+20 per cent). Population in smaller cities grows more slowly in uppermiddle-income countries.
City population in high-income countries grew from about 350 million people in 1975 to about 615 million people in 2020, and is projected to pass 800 million people in 2070. Notably, cities with at least 5 million inhabitants are exhibiting an almost similar trend. These cities had a population of only 80 million in 1975, which increased two and a half times to reach 200 million in 2020 and is projected to reach over 300 million in 2070. On the other hand, the slow growth recorded in smaller cities is projected to continue into the future. However, as noted in Chapter 1, the COVID-19 pandemic has resulted in a net population decline of some large cities of countries like the US as people migrate to smaller cities and towns, a shift speculated to be temporary.
There are significant differences between income classes when it comes to the change of city numbers over time. Overall, there is an accentuated growth of cities in lowerincome countries. This trend is particularly clear from Figure 2.16 in the low-income subplot (top-left quadrant), where there is a linear growth of cities in all city size classes, except from the largest size class (with more than 5 million inhabitants). The growth of the number of cities with at least 5 million inhabitants in low-income countries is high and increases over time.
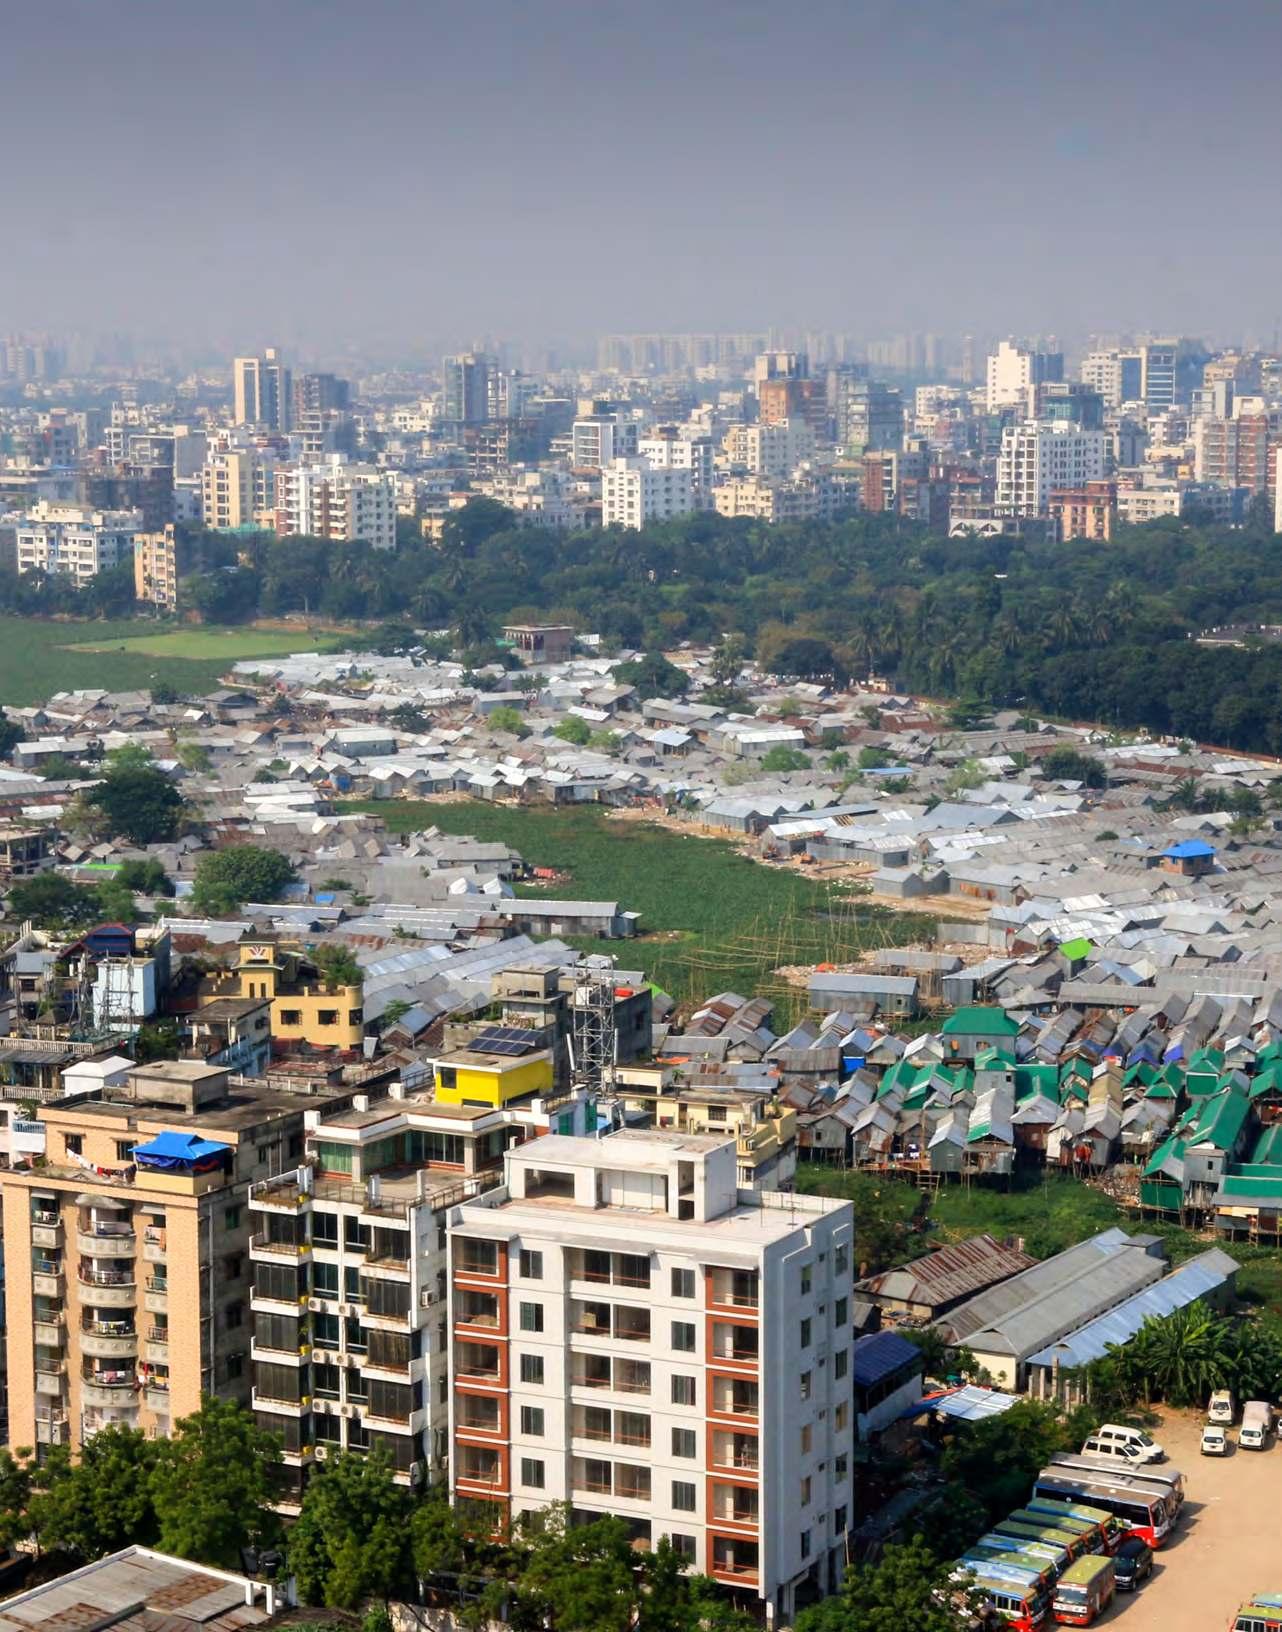 Dhaka Cityscape © Joker King/Shutterstock
the lower-middle-income countries (top-right quadrant), the number of large cities grew slightly faster between 1975 and 2020. Projections indicate that this process will continue with higher growth in the number of cities with at least 5 million inhabitants while the growth in the smaller cities slows down.
upper-middle-income countries (bottom-left quadrant), the number of cities stabilizes after 2020 for all city classes. In high-income countries, the number of cities with at 5 five million inhabitants continues to grow also beyond 2020, while the number of smaller cities only increases slightly.
be anticipated
related actions that guard
exploitative
unserviceable sprawl, which cause inefficiencies and distortions that undermine the urban economy.
Figure 2.16: Growth of the number of cities by population size and income group, 1975-2070
Growth of cities
population size group in low-income countries,
Growth
cities
population size group in Upper-middle
countries,
Growth of cities by population size group in Lower-middle
income countries, 1975-2070
Thesuccessfulmanagementofthisurbangrowth—especially in low-income and lower-middle-income countries, where the pace of urbanization is projected to be the fastest—is key for sustainable development.35 The new data from the Degree of Urbanization approach show that changes—in terms of growth of city land area from 2020 levels—will mostly take place in low-income countries (+141 per cent), lower-middle-income (+44 per cent) and high-income countries (+34 per cent) (Figure 2.17). Changes in uppermiddle-income countries are projected to be relatively small (+13 per cent). Growth of physical extent of city land is projected to be highest in Oceania (+109 per cent) and SubSaharan Africa, where it is projected to almost double.
Growth
population
in high income countries, 1975-2070
The rapid spatial expansion of the physical extent of cities in Sub-Saharan Africa, for instance, is to a large extent attributed to peri-urbanization. The region is experiencing continual engulfment of un-serviced land in a mostly informal process largely driven by low-income households attempting to secure land that is affordable and in reasonable locations.
Recent studies have also confirmed that this rapid spatial expansion is taking place at a higher pace in small and secondary cities than it is in large cities.
Often, government structures, institutional capacities,
land
countries in Sub-Saharan Africa are not able to
in
effectively to the emergence of these new settlements. As such, expansion areas are not well-planned and, as well, lack public goods and social amenities—thus charting an inefficient and unsustainable spatial development path with significant negative implications e.g. for rural livelihoods, agriculture and food security.38
On the other hand, the projections show that lowest growth in city land will be in Eastern and South-Eastern Asia (+10 per cent), Latin America and the Caribbean (+14 per cent) and Europe (+16 per cent). These regions are relatively highly urbanized and will be experiencing some of the smallest increase in city population share (Figure 2.4). Notably, a number of cities in these regions are projected to experience some level of shrinkage (Map 2.1).
Shrinkageisnotanewphenomenon.PastUN-Habitatflagship reports have recorded this phenomenon in both developing and developed countries, triggered by various reasons.39 Shrinking cities are often characterized by deteriorating living conditions, environmental degradation, urban decay
such as property abandonment and a rise in inequality. These worsening conditions force residents to seek opportunities in other cities that offer higher quality of life, further spiralling shrinking cities into long-term population loss if necessary measures and strategies are not implemented to tackle the decline.40
While most of the cities projected to shrink by 2050 are small (in Armenia, Barbados, Belarus, China, Cuba, El Salvador, Georgia, Germany, Japan, Moldova, Republic of Korea, Russia and Ukraine), there are notable large cities whose land area is projected to shrink by more than one-tenth by 2050. These include Daegu, Republic of Korea (-14 per cent); Kitakyushu, Japan (-15 per cent); and Saint Petersburg, Russia (-20 per cent). The management of shrinking cities requires innovative measures and strategies by policymakers (Box 2.6). For example, Kitakyushu City—once renown as a major iron and steel centre during the rapid industrialization years of Japan and now home to the fastest-growing ageing population—has adopted green growth strategies to address population decline and ensure regional revitalization.41
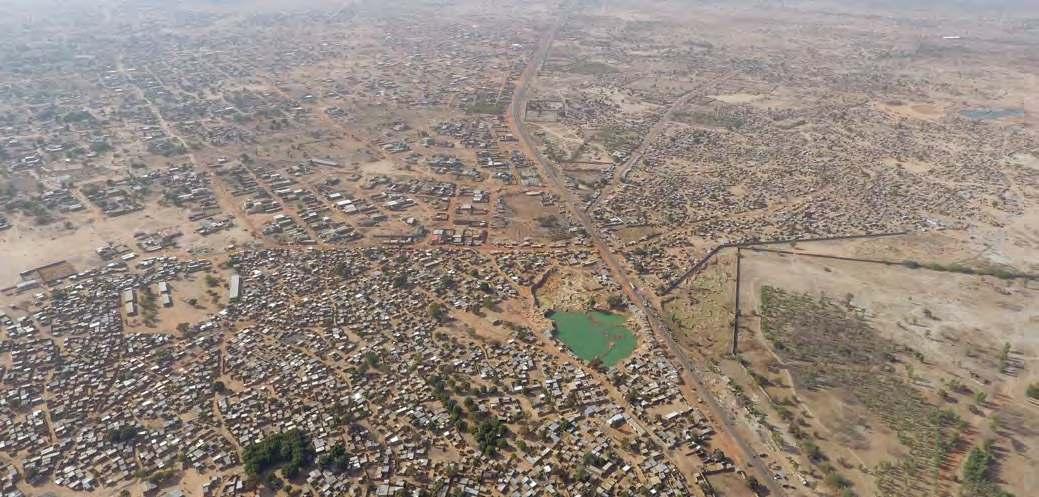
Management of shrinking cities requires innovative skills and strategies to contain population flight and attract new residents. Policymakers should consider the following:
• Continuous monitoring is indispensable to understand population and spatial changes for evidence-based policy formulation and future planning. This is useful in assessing the persistent presence of urban growth or shrinkage. In most places, poor data and information (often lacking geographical detail) creates challenges for evidence-based policy formulation.
• Regional integration, connectivity and networking schemes aid cooperative public policy in changing urban areas. Improved connectivity, for instance, is critical to maximizing the potential economic benefits of agglomeration or helping to offset the loss of it. Moreover, enhanced networking of people and firms fosters innovation as well as the exchange of ideas, goods and services.
• Public-private partnerships allow for innovation, renewal and adaptation of the fiscal bases of cities. The focus of the revitalization efforts in these cities should be on the needs of the disadvantaged segment of the population. Importantly, ensuring voices from such groups are heard and they benefit from the growth and establishment of local anchor institutions rather than be pushed out by the changing conditions (e.g. through gentrification). It is imperative to enhance public participation policies that encourage more engagement from various actors in the planning process.
• Investments in public education and workforce development as well as knowledge transfer and economic diversification can assist regions in moving from outdated economic activities to new businesses and sources of revenue.
• Increasing openness towards external migrants and integrating them into cities as part of a revitalization strategy to counteract for depopulation from outmigration.
• Urban policies should facilitate planning for industrial environmental impacts in the declining phases of cities, and for management of the environmental legacy of industrial activities.
• Flexible design and placement of assets (such as industrial infrastructure, commercial buildings, and infrastructure for water, sewage, electricity and industrial land) facilitate transformation into new uses when necessary. For example, launch a green transformation of abandoned industrial districts into ecological open space or revitalized public space, like a creatively-designed industrial park.
• Issues surrounding the environmental legacy of shrinking cities are a global phenomenon: planners and policymakers need to be aware of the environmental changes that lead to shrinkage as well as the ways in which shrinkage leads to environmental changes. Moreover, pursuing environmental justice presents an opportunity for addressing the decline (i.e., it can form a basis for revitalization).
When these changes in city land are observed from the lens of city size and income groups, results show that the lower the income of a country, the higher the share of city land covered by small cities (less than 250,000 inhabitants) (Figure 2.18). In 2020, for instance, almost half of all city land in low-income countries was covered by small cities, compared to around one-third in middle-income countries and one-quarter in high-income countries. By 2070, the share of land in small cities is projected to drop slightly as
the land covered by larger cities grows faster. Nevertheless, the big difference between income groups will remain with a far higher share of land covered by small cities in lowincome countries (45 per cent) as compared to high-income countries (23 per cent).
This trend essentially implies that small cities— as well as towns and semi-dense areas (as illustrated in Figure 2.6 and Figure 2.7)—remain critical to achieving sustainable
development, especially in low-income countries. It is in these settlements that a variety of urban-rural linkages in production, consumption and financial relationships, have profound impact across the urban-rural continuum are fostered;42 small cities (and towns and semi-dense areas) essentially enhance synergy within the continuum of human settlements. Therefore, given share of city land covered by these settlements, adequate territorial planning and enhanced capacities in these settlements can strengthen
pivotal role they play as well to help reduce pressure on
cities in developing regions.
cities— as well as towns and semi-dense
remain critical to achieving sustainable development, especially in low-income countries
Scenarios of Urban Futures: Degree of UrbanizationThe growth of cities both demographically and spatially over the past several decades has highlighted the challenges of managing city growth. UN-Habitat promotes well-planned and designed cities with adequate densities and recommends increasing densities where necessary. The various classes of urbansettlementsdiscussedinthischaptercanaccommodate growth through a mix of strategies, such as densification, mixed-use development, affordable housing, improved connectivity, increased access to public space and a diversity of employment opportunities. These strategies should be underscored by inclusive governance arrangements that promote socially cohesive urban communities.43
This section explores and shows the impact of three different city development scenarios on the demand for city land and city population densities in 2050. Density, increasingly seen as a critical sustainability metric, is employed in these scenarios because it is “the intervening measure that translates population into land consumption.”44 The three scenarios are based on the density of cities, towns and semidense areas for three different parts of the world (Table 2.2). The biggest differences in density are for cities, a ninefold increase from the low- to the high-density scenario, followed by towns with a six-fold increase, while semi-dense areas remain very similar across the three scenarios. The population density of a city is critical as it determines how much land is needed to accommodate a given population. In this section, cities with a density below 3,000 inhabitants per sq. km are considered “low density,” between 3,000 and 6,000 is considered “medium density,” above 6,000 is considered “high density.”
In the low-density scenario, a city will tend to grow more horizontally and less vertically. For example, population density would not increase much in the centre of the city and most growth would occur at the edges of the city and at lower densities as illustrated by the case of Maputo,
Mozambique, in Figure 2.19. The land covered by the city of Maputo would more than double under all three scenarios. In the low-density scenario, for instance, the land occupied by the city of Maputo would increase by almost 160 per cent, while its population density drops from 6,000 to 5,000 inhabitants per sq. km (see Figure 2.19, top right). Under the high-density scenario, more growth will occur within the initial boundaries of the city, thus increasing density levels, and additional city land will also be relatively high density. Under this scenario, Maputo’s land would only grow by 35 per cent, but its population density would double to 13,000 inhabitants per sq. km (see Figure 2.19, bottom right). The medium density scenario leads to a moderate increase in population density and more limited spatial expansion (see Figure 2.19, bottom left).
It worth noting that population growth within the initial boundaries of a city or a town can be accommodated through planned infills or densification by building on vacant land within the town or city, replacing low-rise buildings with medium- or high-rise buildings. Planned city infills can respond to future urban growth in an orderly manner, minimizing expansion through inefficient land-use patterns and leapfrogging that generates wasteful areas as well as avenues for speculation. Infills can also remedy fragmented urban spaces.
that generates wasteful areas
avenues for speculation
These density scenarios play out differently for cities in various regions of the world. Medellín, Colombia—with a very high population density at 16,000 inhabitants per sq. km in 2020—is projected to grow its city’s area in the range of 17 per cent and 100 per cent between 2020 and 2050 depending on the scenario. In the low-density scenario,
its area would double and its density would drop to 9,500 inhabitants per sq. km, which is still high. The high-density scenario (Figure 2.20) would mean no expansion of city land, but density would further increase to 21,000 inhabitants per sq. km. The medium-density scenario strikes a balance between the demand for land and density with a spatial expansion of only 33 per cent and a small reduction in population density to 14,000 inhabitants per sq. km.
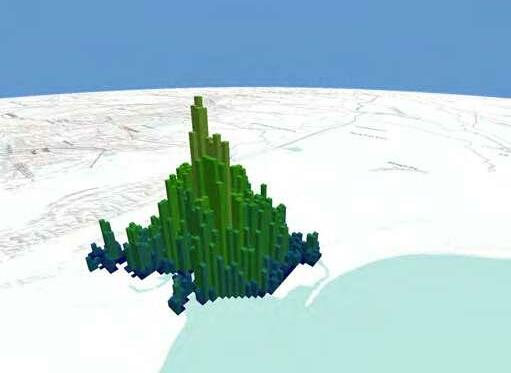
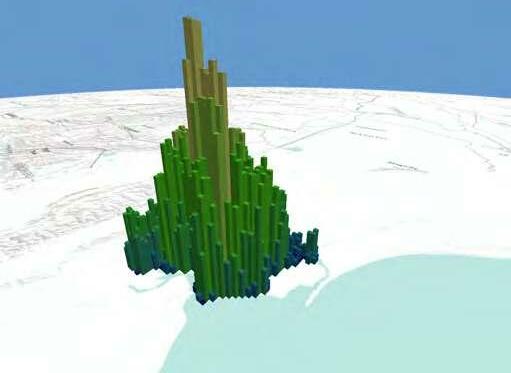

The population of Lusaka, Zambia, is projected to at least double between 2020 and 2050. In the high-density scenario, city land would only increase by 16 per cent, but this scenario doubles its density to 17,600 inhabitants per sq. km. In the moderate density scenario, city land doubles,
which keeps population density around 8,700 inhabitants per sq. km. In the low-density scenario, population density drops to 6,300 inhabitants per sq. km, and its area increases by 150 per cent.
Taejon, Republic of Korea, and Hamburg, Germany, are cities where the impact of the scenarios is far smaller because their populations are not really projected to grow. For Taejon, city land barely increases in the moderate- and low-density scenario, while in the high-density scenario city land shrinks (-23 per cent). In Hamburg, also virtually nothing changes in the moderate- and low-density scenario, but in the highdensity scenario Hamburg attracts more residents leading to a growth in population (71 per cent) and in area (31 per cent).
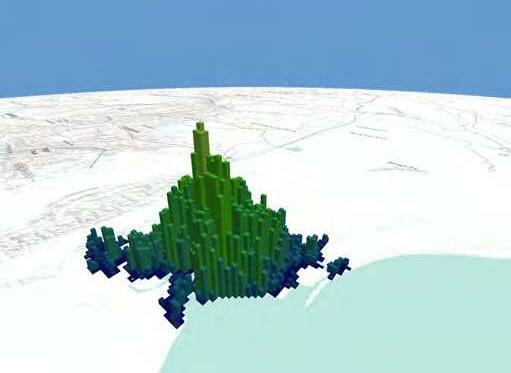 Scenarios of Urban Futures:
2.5.1. City densities are high and growing in lowincome countries
A review of past trends using the harmonized data from the Degree of Urbanization approach shows that cities in lowincome countries are among the densest in the world. On average, their density has increased over time from 7,000 to 11,000 inhabitants per sq. km between 1975 and 2015 (Figure 2.21). Cities in lower-middle-income countries had a similar density to that of cities in low-income countries in 1975, but their densities dropped a bit as their cities expanded slightly faster than their populations grew. In 2015, their cities had an average density of about 7,000 inhabitants per sq. km. In upper-middle-income countries and high-income countries, city densities were lower (5,000 and 3,000 respectively) and barely changed over time. These countries experienced slower population growth, which reduced the challenge of providing enough housing and infrastructure.
City population density by region shows more variation with the highest densities in Central and Southern Asia, Oceania and Sub-Saharan Africa and the lowest densities in Australia, New Zealand and Northern America (Figure 2.21 and Map 2.2). In most countries, the density increases with the population size of the city, except in low-income countries where on average density does not necessarily increase with population size as smaller cities also tend to be dense.
cities in low-income countries are among the densest in the world. On average, their density has increased over time from 7,000 to 11,000 inhabitants per sq. km between 1975 and 2015
NorthernAfricaandWesternAsia
Oceania
Inhabitants per
2,000 2,000 - 4,000
4,000 - 6,000 6,000 - 8,000 8,000 - 10,000
10,000
250,000 - 500,000 500,000 - 1,000,000
- 5,000,000 5,000,000 - 10,000,000 10,000,000 - 20,000,000
20,000,000
The impact of the three scenarios depends on rate of population growth. The scenarios take into account that it is easier to change the density of new developments than of existing ones. As a result, the biggest impact is on the low-income countries as their population is projected to increase the most (64 per cent between 2020 and 2050), while the population increase in the other income groups is much smaller (ranging from 2 to 29 per cent). For example, city densities would not change dramatically in Northern America, Australia, New Zealand and Europe because their population growth is relatively low (Figure 2.22). By contrast, densities
continue to increase rapidly in Sub-Saharan Africa in the high-density scenario and drop substantially in the low-density scenario.
the high-density scenario, population density in cities in low-income countries would continue to increase and reach 14,000 by 2050, while densities in highincome countries would increase the least reaching just
4,000 by 2050. The two middle-income groups would both experience a moderate increase reaching 9,000 in lower-middle-income and 7,000 in upper-middle-income countries (Figure 2.22).
Compact, socially inclusive, better integrated and connected cities are an imperative for sustainable urban futures. As highlighted in previous sections of this chapter and in Chapter 6, the negative social, economic and environmental impacts of dispersed urban growth are significant. On the other hand, compact development reduces sprawl, allows for more efficient use of and preservation of land resources, is associated with lower infrastructure cost per capita, and reduces long commutes (and consequently greenhouse gas emission), among other benefits. For example, transport infrastructure and utilities are more costly to provide and maintain in low-density development scenarios. Efficient
16,000 14,000 12,000 10,000 8,000 6,000 4,000 2,000
16,000 14,000 12,000 10,000 8,000 6,000 4,000 2,000
16,000 14,000 12,000 10,000 8,000 6,000 4,000 2,000 0 16,000 14,000 12,000 10,000 8,000 6,000 4,000 2,000 0 16,000 14,000 12,000 10,000 8,000 6,000 4,000 2,000 0
16,000 14,000 12,000 10,000 8,000 6,000 4,000 2,000 0
16,000 14,000 12,000 10,000 8,000 6,000 4,000 2,000 0
16,000 14,000 12,000 10,000 8,000 6,000 4,000 2,000 0
16,000 14,000 12,000 10,000 8,000 6,000 4,000 2,000 0
16,000 14,000 12,000 10,000 8,000 6,000 4,000 2,000 0
16,000 14,000 12,000 10,000 8,000 6,000 4,000 2,000 0
16,000 14,000 12,000 10,000 8,000 6,000 4,000 2,000 0
16,000 14,000 12,000 10,000 8,000 6,000 4,000 2,000 0
public transport depends on sufficient demand at each public transport stop, which is difficult to provide in lowdensity neighbourhoods.
Well-designed and contextually supported densification and compact development are important for the various classes of cities discussed in this chapter and are in line with the “optimistic” vision of the future outlined in Chapter 1. Cities should therefore aim for sufficient density with adequate activity mix, while still providing important public amenities such as parks, squares, sports grounds and cultural venues, as well as good transport infrastructure, to ensure connectivity at the city and regional level.45 These public spaces play a vital role of making density work. The COVID-19 pandemic, for instance, has reinforced the value of quality public spaces, walkability, proximity and enhanced accessibility.46
All of these preferences call for responsive urban and territorial planning that anticipates and effectively addresses the demand for city expansion.47 They also call for the public sector to embrace a fundamental set of actions that will ensure an orderly urban expansion (Box 2.7).48 On the other hand, however, weaknesses in planning and institutional frameworks will perpetuate sprawl or lead to densification that results in overdevelopment and crowding (and its associated adverse health outcomes), gentrification, poor air quality and noise pollution, among other problems, that make sustainable urban futures elusive and bring to
fruition the “high damage” and “pessimistic” scenarios alluded to in the previous chapter.
Globally, cities would occupy less land and host more people under the high-density scenario, but as shown above it would force the already high population density in lowincome cities even higher. On the other hand, low-income countries would need five times the amount of land for their cities in the low-density scenario (Figure 2.23). Lowdensity development would require massive infrastructure investments to provide services and access to all the new neighbourhoods in low-income countries. So many cities would more than double in area under the low-density scenario (Map 2.3) that it would be extremely difficult for governments in lower-income countries to finance the necessary infrastructure. The World Cities Report 2020 already outlined the challenge of financing urban infrastructure in these countries. Still, the moderate- or high-density scenario would imply a tripling or doubling of city land in low-income countries.
In upper-middle- and high-income countries, the growth in city population is lower and cities are less dense. As a result, they can accommodate more people in their cities without any need to increase the amount of land. In some cities, the amount of city land could even shrink (Map 2.4), especially in Eastern Asia.
Source:
Scenarios of Urban Futures: Degree of UrbanizationThis chapter, using harmonized data from the Degree of Urbanization approach, shows that the global population share in cities has been increasing continuously, but that the rate of increase has slowed down. About one-quarter of the world population lived in cities (as defined by this approach) in 1950 and this figure grew to almost half the population in 2020. Going forward, a further increase to almost 60 per cent in 2070 is projected. This essentially denotes that the biggest increases in the share of people living in cities is already behind us.
The chapter has further illustrated that city population in low-income countries has been growing much faster than in other countries due to much higher overall demographic growth and a faster increase in the city population share from a low base. As a result of these dynamics, the amount of land covered by cities in low-income countries has grown much faster over the years. It doubled between 1975 and 2020 and is projected to do so again by 2070, a clear indication of the need for policymakers in these countries to focus on managing this spatial growth with sound policies that promote compact development as well as mitigate the negative social, economic and environmental impacts of dispersed urban growth where it is recorded. In contrast, this chapter has also shown that city land in higher-income countries is projected to increase moderately by between 10 per cent and 50 per cent over the same period.
Population growth in cities is primarily driven by natural growth, while rural-to-city migration has a smaller impact. This is especially the case in low-income countries, where natural population growth explains two-thirds of city population growth.
As cities grow, they tend to expand spatially into surrounding suburban and rural areas and to annex nearby towns. This chapter has illustrated that both of these factors contribute to the growth of city population, especially in high-income countries where many cities are surrounded by large suburban areas. In low-income countries, however, the chapter has shown that expansion and annexation adds relatively little to city population growth, in part due to high overall population growth rates and a relative absence of suburban areas.
In terms of various population cohorts, the chapter has shown that the estimated share of children in rural areas tends to be higher than in cities in low-income and lowermiddle-income countries. This has been the trend over the past decades, it presently is so, and projection to 2050 shows that it will remain that way. In high-income countries, however, this trend is changing from slightly higher share in rural areas in 1950 to a lower share in rural areas in 2050. The chapter further records that young adults prefer city living across countries within all four income groups, while only in high-income countries do people over 65 move to the rural areas.
The chapter has also vividly shown that concentration of city population in the largest cities tends to be higher in more in more developed countries, when taking into account the population size of a country. Further, it has illustrated that low-income countries have a higher share of their city population and city land in small cities as compared to higher-income countries.
Given the rapid growth of city population in low-income countries, the type of urban development will have a big impact on the shape of cities. For sustainable futures to be realized in these places, policy measures that incentivize compact and moderate- or high-density development—which allow more people to live in cities, while using less land— should be implemented. It is worth noting that significant spatial expansion is inevitable in these countries—even under a higher-density development scenario, city land in low-income countries is projected to double in the 2050s.
Finally, this chapter has emphasized the need for urban and territorial planning that anticipates and responsive to effectively mitigates the negative social, economic and environmentalassociatedwiththisgrowth.Thegrowthofcity land in low-income countries will require substantial efforts in terms of both planning and infrastructure investments. Planning should be undertaken ahead of this expansion of cities to halt informality and ensure that there is policy coherence at various scales guiding the needed investments. In the absence of this, low-density city development that will see city land in low-income countries increase by a factor of five. This sprawl, compounded by informality, will be extremely challenging to manage, inhibiting the pursuit and realization of sustainable futures.
1. EU,FAO,ILO,OECD,UN-Habitatand theWorldBank.


2. EuropeanUnionetal,2021.
3. NationalResearchCouncil,2003.
4. GHS-POP(https://ghsl.jrc. ec.europa.eu/ghs_pop.php); Applyingthistootherglobal populationgridssuchasWorldPop willproduceslightlydifferentshare, buttheoverallpatternremainsthe same.www.worldpop.org
5. Dijkstraetal,2021.
6. UNDESA,2001.
7. Montgomery,2008.
8. Lutzetal,2018;UNDESA,2019c; Vollsetetal,2020.
9. BocquierandCosta,2015;DeVries, 2013;Dyson,2011;Zelinsky,1971.

10. UNDESA,2001;Dyson,2011; Stecklov,2008;Davis,1965.
11. UN-Habitat,2016a.
12. UN-Habitat,2020a.
13. Brückner,2012;Barrios,Annez,P., R.BuckleyandJ.Kalarickal,2010; BertinelliandStrobl,2006;Fayand Opal,1999.


14. Resource-richcoastalcities,urban atollislands,denselypopulated deltasandArcticcommunitiesare mostthreatened(IPCC,2022b); insomecountries(e.g.China)the expansionofcitiesincoastaland deltaregionshasbeennotable (McGranahanetal,2007).
15. UNDESA,2019b.
16. FullerandRomer,2014.

17. UNDESA,2019c.
18. UNECOSOC,2019;UN-Habitat, 2019a;LincolnInstituteofLand Policy,2016.

19. UN-Habitat,2018b.
20. Thissectiononlyprovidesaglobal overview.Itisworthnotingthatnot allcitiesareexperiencingpopulation growth;someareexperiencing shrinkage.Subsequentsections ofthischapter,Chapter1and previousUN-Habitatflagshipreports highlightthisphenomenon.
21. Farrell,2017;Farrell,2018;Farrell andWestlund,2018;Menashe-Oren andStecklov,2017;Montgomery,


2008;Stecklov,2008.
22. MenasheOrenandBocquier,2021.
23. Jiangetal,2021;Jonesetal,2020.
24. Roberts,2014.
25. UNICEFetal,2020.
26. EuropeanCommissionandLSE, 2000.
27. Rogersetal,2002.
28. Bloometal,2003.
29. UrdalandHoelscher,2009.
30. UN-Habitat,2008.
31. Glaeser,2014.
32.
First,thepopulationofeachcityis expressedasashareofthetotal citypopulation.Second,eachof thosesharesissquared.Finally, thesesquaredsharesaresummed. Highnumbersindicatehighprimacy.
33. Henderson,2000.
34. UN-Habitat,2021a.
35. UNDESA,2019b.
36. UN-Habitat,2020a;UN-Habitat, 2020b;UN-Habitat2010.
37. Mudauetal,2020.
38. Agyemangetal,2019;Yiranetal, 2020;UN-Habitat,2009.
39. UN-Habitat,2008.
40. UN-Habitat,2008.
41. Ortiz-Moya,2020;Cityof KitakyushuandInstituteforGlobal EnvironmentalStrategies,2018.
42. UN-Habitat,2020a.
43. UN-Habitat,2019b.
44. Angeletal,2020.
45. UN-Habitatrecommendsa minimumof15,000inhabitantsper squarekilometre(UN-Habitat,2014).
46. OECD,2020b.
47. UN-Habitat,2014.
48. Angeletal,2021.

1. Urban poverty and inequality are highly complex and multidimensional challenges whose manifestation go beyond lack of income.
2. Without concerted action at all levels, poverty and inequality could become the face of the future of cities.
3. Poverty is on the rise in close to one-third of the countries in Sub-Saharan African, and most countries in the region are off-track in ending poverty by 2030.
4. The COVID-19 pandemic has reversed years of remarkable progress made in the fight against poverty and has resulted in the emergence of newly poor people.
5. The level of urban poverty and inequality, coupled with the impacts of the COVID-19 pandemic are clear indicators that governments must act now to create the conditions that nurture equitable urban futures.

1. The vision of equitable urban futures will not be achieved unless cities and subnational governments take bold actions to address the pervasive presence of urban poverty and inequality.
2. Within the Decade of Action window (2020–2030), cities and subnational governments should adopt a multidimensional approach to addressing poverty and inequality.
3. Investing in and extending infrastructure and services to deprived neighbourhoods is a critical policy lever to address poverty and inequality

4. Supporting informal employment is critical for building inclusive urban futures.
5. Gender transformative approaches are crucial for building inclusive urban futures.
Urban poverty and inequality remain one of the most intractable and highly complex problems confronting cities. The notoriously overcrowded slums in Mumbai, India; Nairobi and Rio de Janeiro; chronic homelessness in London; and persistent concentrated poverty in Baltimore, US, all send one clear message to policymakers: tackling urban poverty and inequality is one of the key priorities for building inclusive and equitable urban futures. The SDGs and the New Urban Agenda are bold, ambitious, multi-stakeholder frameworks that have been adopted to tackle poverty and inequalities and develop cities in an inclusive manner. Both frameworks recognize the transformative power of cities in promoting equitable growth and prosperity.1 Specifically, target 11.1 of SDG 11 seeks to ensure access to affordable housing and basic services for all by 2030. The New Urban Agenda envisions cities as centres of equal opportunities, where everyone enjoys productive and prosperous lives. Both SDGs and the New Urban Agenda are underpinned by the principle of leaving no one behind. Urban groups that are often marginalized include women, children, the homeless, migrants and refugees, minorities, indigenous people, people with disabilities and those working in the informal economy. These groups are systemically excluded from the opportunities and benefits of urbanization based on gender, age, race, ethnicity and other characteristics.
The solutions to creating inclusive and equitable urban futures are more likely to come from the decisions of local governments. Cities have several unique characteristics to attain the principles embedded in sustainable development. The process of urbanization has the potential to become a transformative force that creates opportunities for all. Properly planned and well-managed urbanization processes can reduce poverty and inequality by creating employment opportunities as well as ensuring access to infrastructure and basic urban services, especially for the most vulnerable. Conversely, poorly planned urbanization can be a key driver of and catalyst for urban poverty, inequality, social exclusion and marginalization. Without concerted action at all levels, poverty and inequity might become enduring features of the future of cities.
Despite the aspirations embedded in international development frameworks, cities are characterized by both visible and invisible divides that often trigger various forms of social, economic and political exclusion. The Kuala Lumpur Declaration on Cities 2030 rekindled these concerns by highlighting key challenges facing our cities. These include inequitable access to urban services and economic opportunities, insufficient protection of the
urban poor from forced evictions and exclusion of the poor in urban planning processes.2 Cities have become arenas of contestation between different interests. Elites are increasingly concentrating economic and political power in ways that manifest spatially. Thus, despite being incredible generators of economic growth and well-being, cities are potentially poverty and inequality traps. More than ever, increasing levels of poverty and inequality are becoming persistent trends in our towns and cities.3
The COVID-19 pandemic has exacerbated existing urban inequalities and amplified vulnerabilities, with disproportionate impacts on disadvantaged groups. The pandemic, along with the looming climate crisis, current socioeconomic and political instabilities, and persistent armed conflict, create significant challenges for building inclusive and sustainable urban futures. The pandemic is a vivid reminder that the vision of inclusive and equitable urban futures can be nurtured or suppressed in cities. Therefore, the key questions for policymakers are: what will the future of cities look like with respect to urban poverty and inequality, and how will these realities play out in different geographical settings? Though the future cannot be predicted with certainty, what happens in cities today will determine the nature of poverty and inequality for years to come.
This chapter examines the outlook for poverty and inequality in the future of cities. As a prelude, the chapter introduces the multidimensional nature of urban poverty and inequality and how they manifest in different geographical settings, urbanization trends, shifting modes of production, changing political economies, and local and national policies. It analyses the current situation with respect to urban poverty and inequality in different geographical contexts and discusses how cities can respond to the underlying challenges of poverty and inequality to ensurethatnooneisleftbehindamidmultiplecrises.Urban poverty and inequality trends differ significantly between cities of developed and developing countries, which reflects the reality of a highly unequal urban world. The chapter explores the future roles of cities and subnational governments in eradicating poverty and inequality and discusses how slums and informal settlements can act as entry points for place-based interventions to build resilience. Finally, the chapter examines transformative approaches for addressing poverty and systemic inequalities as a basis for sustainable and inclusive urban futures. These approaches will help determine which of the scenarios of urban futures discussed in Chapter 1 will come to pass.


Urban poverty and inequality are some of the most persistent problems confronting cities today and will likely continue to do so for many years to come without significant intervention. These deprivations presently occur at a larger scale in cities due in part to the fact that majority of the world’s population resides in urban areas. The COVID-19 pandemic has exacerbated these challenges, creating more challenges for cities and subnational governments. Figures 3.1 and 3.2 represent the multiple dimensions of urban poverty and inequality, respectively, as they manifest in cities.
As shown in Figure 3.1, urban poverty is complex and multidimensional. Income-based measures of urban poverty are inadequate as they do not account for its multiple dimensions. Relying entirely on income-based indicators is overly simplistic because it implies that the income required to address poverty is the same in every geographical context. This view does not reflect the multiple deprivations that
urban inhabitants experience. The multidimensional perspective to urban poverty is important as it informs the design of policy interventions to enhance human well-being in other facets rather than just income. For example, incomes for urban households might appear high until factoring in the deprivation of basic services (housing, water, sanitation, energy), which places additional economic burden on households, especially in slums and informal settlements where the majority of the poor live.

Urban poverty and inequality are some of the most persistent problems confronting cities today
Incitiesofdevelopingregions,slumsandinformalsettlements are the most enduring faces of poverty.4 Residents of slums and informal settlements experience one or more of the following deprivations: lack of access to improved water and sanitation facilities; overcrowded and precarious housing conditions and location; voicelessness and powerlessness in politicalsystemsandgovernanceprocesses;andlackoftenure security (Figure 3.1).5 These deprivations are also amplified by what could be called a “poverty of urban planning,” or
Scenarios of Urban Futures:approaches to the built environment that do not improve the livelihoods of the poor. For instance, in the Pakistani cities of Karachi and Lahore public funds have been diverted to largescale infrastructure projects to the detriment of smallerscale, pro-poor development proposals.6
The urban poor living in slums are heterogenous groups with differentlevelsofvulnerabilitybasedongender,age,ethnicity, race, household structure, migration status and other intersectional factors. Urban poverty has social, economic, environmental and spatial dimensions, and its manifestation differs from place to place. The various dimensions shown in Figure 3.1 are not isolated; they interact and reinforce each other to create, recreate and entrench urban poverty. This conceptualization allows us to see urban poverty as entailing a web of deprivation, a crisscrossing of circumstances that create conditions trapping millions in zones of concentrated deprivation with limited opportunities for upward social mobility. Without collective action, the multiple dimensions of urban poverty could become more complicated and generate cumulative vulnerabilities and deprivations that will be difficult to reverse or rectify.

3.1.2. The multiple faces of urban inequalities Urban poverty and inequality are interrelated in different ways. Figure 3.2 shows that urban inequality is also multidimensional and highly complex. Like poverty, urban inequality has economic, social and spatial manifestations. Urban inequality is marked by differential access to income and wealth, urban services and infrastructure, technology, public health, social protection, education, social protection, public spaces, decision-making structures and environmental burdens, among others.
The current models of urban development in cities of both developed and developing regions are driven by massive capital accumulation, hyper-commodification and privatization of urban spaces, thereby escalating urban inequalities.7 As shown in Figure 3.2, the “new urban economy” represented by these new modes of production produce and reproduce equalities. The restrictive housing policies prevalent in cities today generate material and symbolic conditions that marginalize and exclude certain groups of the urban population. Moreover, the consumeroriented urban economy in cities has created diverse
geographies of urban inequalities in cities of developed and developing countries, albeit at different scales.
The unequal production and consumption of urban spaces results in significant disadvantage being concentrated in certainplacesratherthanothers.Forexample,thenewurban economy promotes the emergence of privatized residential enclaves where the rich enjoy superior infrastructure and services while the urban poor are relegated to deprived neighbourhoods reliant on underfunded public goods. These deprived neighbourhoods have poor quality infrastructure and municipal services, and their residents bear the brunt of education disparities, health disparities, socioeconomic and political exclusion, territorial stigmatization and discrimination.8 The resulting patterns are disjointed, fragmentated and unsustainable urban geographies of inequality and human suffering where a society of wealthy islands are surrounded by a sea of poverty. A prime example is the Eko Atlantic City in Nigeria—a private city being built in Lagos adjacent to the highly deprived and impoverished Makoko slum.9 In cities of developed countries, spatial segregation of social groups results in differential access to employment opportunities, healthcare and social services, often along racial or ethnic lines.
The various dimensions of urban poverty and inequality explained above are not new; they have always been a pervasive feature of cities. However, poverty and inequality are created, recreated and amplified based on trends in the global economy and external shocks and stresses,
which often lead to added layers of new vulnerabilities. For example, the COVID-19 pandemic has exposed some of the hidden pockets of poverty and inequality in cities of both developed and developing countries; deepened already existing disparities; and reversed declines in global poverty, which is indicative of the pessimistic scenario of urban futures discussed in Chapter 1. These events create additional challenges for cities and subnational governments as they struggle to build equitable, inclusive and sustainable urban futures under conditions of high uncertainty.
This section discusses the current trends on urban poverty and inequality and implications for inclusive and equitable urbanfutures.Thefirstpartgivesaglobaloverviewonpoverty and inequality trends while the second part analyses trends at the local level in both developed and developing regions.
Over the past several decades before the COVID-19 pandemic, there has been steady progress in the fight against extreme income poverty globally. Official estimates suggest that the number of people living in extreme poverty (living on less than US$1.90/day) has been declining; between 1990 and 2015, close to 1.2 billion people were pulled out of extreme poverty.10 By 2018, three years after the adoption of the SDGs, the proportion of people living in extreme
Source: Data generated from Frederick S. Pardee Center for International Futures, 2022.
poverty had decreased from 10 to 8.6 per cent. Based on historic trends, extreme poverty was projected to decline to 6 per cent by 2030,11 which is still above the SDG target of less than 3 per cent of the population. Before COVID-19, the number of people living in extreme poverty was expected to decline; falling to 672 million by 2030 and to just over 400 million by 2050.12
There are regional variations in global poverty dynamics. Currently, more than 90 per cent of the poor live in lowincome and middle-income countries. High-income countries have already met the SDG target of reducing extreme poverty to less than 3 per cent of the population, though many upper-middle-income countries are yet to meet the target at the country level. In lower-middle-income countries the
poverty rate before the COVID-19 pandemic in 2019 was just under 12 per cent of the population (358 million) and in low-income countries it was 45 per cent (329 million).13


Figure 3.3. shows poverty trends by regions. Though poverty has been declining in Africa since 2015, the continent still faces significant challenges in meeting the SDG target of eradicating poverty in all its forms. Many African countries face serious challenges due to fragile economic and political circumstances like armed conflicts and dependency on commodity exports. These conditions are compounded by governments’ inability to provide adequate infrastructure, services and employment to pull people out of poverty. Other regions—Europe, Asia, Oceania, Northern America, and Latin America and the Caribbean—have been doing

relatively well under the no COVID-19 scenario. In Northern America, Europe and Oceania, effective programmes and egalitarian policies enable governments to provide basic infrastructure and services, including targeting the poor.
The fight against poverty is part of the unfinished business of the global development agenda. Current projections suggest that the number of people living in extreme poverty will remain above 600 million in 2030, resulting in a global poverty rate of 7.4 per cent.14 Multidimensional poverty in developing countries remains high. Research conducted in 107 developing countries revealed that 1.3 billion people15 or 22 per cent of the population are multidimensionally poor.16 Current estimates suggest that about 84.3 per cent of the multidimensionally poor live in Sub-Saharan Africa (556 million) and Southern Asia (532 million), while about 67 per cent are in middle-income countries. About 200 million of the 1.3 billion multidimensionally poor people reside in urban areas17 with the regional breakdown shown in Figure 3.4.
The COVID-19 pandemic is reversing development gains made in the fight against global poverty. The pandemic has increased poverty and made achieving the SDGs even more urgent. Projections suggest that globally, COVID-19 likely pushed between 88 and 115 million people into extreme poverty in 2020.18 The pandemic has resulted in the emergence of “newly poor” people—that is, those who would have exited poverty in the absence of COVID-19 but are now projected to remain poor as well as those projected to fall into poverty because of the pandemic.19 In 2020, between 119 and 124 million people were projected to enter the global ranks of the new poor; this number was projected to rise to between 143 and 163 million in 2021.20 Many of the new poor will be living in urban areas21; presenting an additional burden for cities and subnational governments that are already overwhelmed.
Over the last decade there has been steady progress in reducing global inequality. The Gini index fell in 38 out of 84 countries between 2010 and 2017.22 Income gaps between countries have also improved in the past 25 years, suggesting that average incomes in developing countries are increasing at a faster rate. Very big economies like China and India have a large share of the world’s population and their development
trajectories have greatly influenced global inequality.23 However, some regions still record high levels of income inequality. For instance, Latin America and the Caribbean is one of the most unequal regions in the world, where income and wealth is concentrated in the richest top 10 per cent of individuals. Countries like Brazil, Honduras, Colombia, Panama and Guatemala remain at the top of regional and global inequality rankings.24 Brazil’s inequality statistics are staggering; the country’s six richest men control as much wealth as the bottom half of the population. Oxfam notes that current reduction rates, it will take 75 years for Brazil to reach the current level of income equality in the UK and almost 60 years to meet that of Spain.25
Latin America and the Caribbean is one of the most unequal regions in the world
Inequalities between developed and developing regions remain large. For example, the average income of people living in North America is 16 times higher than Sub-Saharan Africa.26 South Africa remains one of the most unequal countries in the world, where the poorest 40 per cent have annual incomes of less than US$1,000 per person, while the richest 10 per cent earn more than US$39,000 per person— which is nearly 40 times higher than those at the bottom 40 per cent.27 The top 10 per cent in South Africa hold 80.6 per cent of all financial assets; the rates in Botswana and Namibia are 61.2 per cent and 65.5 per cent, respectively.28 Such alarming levels of income inequality result from massive wealth gaps between the rich and the poor. This disparity has been amplified by the economic impacts of the COVID-19 pandemic, which could further undermine the prospects for inclusive and equitable growth, leading to the high damage or pessimistic scenarios outlined in Chapter 1. Despite the existence of universal welfare systems and social protection systems, inequality in developed regions, particularly in Northern America and Oceania, has been increasing, with the rich getting richer while the socioeconomic progress of the poor remains limited.29 In the US, unequal distribution of income and wealth has reached astronomical levels; where over 20 per cent of the country’s wealth belongs to the top 1 per cent.30
In addition to income inequalities, there are also gaps in access to basic services and opportunities. The ongoing global housing affordability crisis means that slums and informal settlements are the only housing option for millions of lowincome households in developing countries. Currently, about
1.6 billion people or over 20 per cent of the global population live in inadequate, crowded and unsafe housing. Another two billion people are expected to be living in slums in the next 30 years, which represents roughly 183,000 people each day.31 More than 90 per cent of urban residents living in slums are located in poor countries.32 Although slums and informal settlements are characteristics of cities in low- and middleincome countries, some cities in developed countries are also experiencing inequalities in housing. London, for example, has experienced an appalling surge in homelessness because of restrictive urban housing markets.
Globally, there is a growing divide in access to basic services. Developing countries have larger proportions of their populations with limited access to basic water and sanitation as shown in Chapter 1. About 70 per cent of the urban population in developing countries is currently underserved by municipal services. About half of the population in 15 major cities lack access to piped water while 64 per cent rely on unsafely managed sanitation, which exposes them to various health and environmental hazards.33 In some of the poorest countries, the difference in access to drinking water between the richest and the poorest households in urban areas was 59 percentage points in 2017.34 Between 2000 and 2017, urban population growth exceeded the total number of people gaining at least basic sanitation services in Sub-Saharan and Oceania.35 The above trends manifest spatially in cities of both developing and developing regions.
As the world becomes increasingly urbanized, poverty is shifting from rural areas to towns and cities—a phenomenon described as the “urbanization of poverty.” Urban areas, especially those in developing countries, are experiencing a remarkable increase in the number of people living in extreme income poverty, with vulnerable groups bearing the brunt. Figure 3.5 shows the proportion of people living in extreme poverty in urban areas of selected Sub-Saharan African countries.
Since 2016, South Sudan, Central African Republic, DemocraticRepublicoftheCongoandEritreahaveseenmore than 20 per cent of their urban population living in extreme poverty. These high rates are projected to remain so in 2030, thereby making the target of eradicating extreme poverty in all its forms unattainable. Current estimates suggest that by 2030, over 60 per cent of those living in extreme poverty will be in fragile states.36 Urban poverty in South Sudan, Central African Republic and Democratic Republic of the Congo is exacerbated by social, economic, political and environmental fragility coupled with weak institutions to deliver public services such as health, education, water and sanitation and social protection capable of eradicating poverty. Indeed, the 2021 Fragile States Index for South Sudan, Democratic
Republic of the Congo and Central African Republic are 109.4, 108.4 and 107.0, respectively. All three countries are ranked in the top 10 of the world’s most fragile states.37
The current trends show that most countries in SubSaharan Africa are off-track in achieving the goal of ending poverty by 2030. The region has the highest incidence of urban poverty globally with about 23 per cent of the urban population living below the international poverty line and 29 per cent experiencing multidimensional poverty.38
A recent study of 119 countries (representing 45 per cent of the world’s population) reveals that the rate of multidimensional urban poverty in Sub-Saharan Africa is 11 times higher than in Latin America and the Caribbean.39 Indeed, poverty is on the rise in close to one-third of the countries in Sub-Saharan African.40 Unless governments at all levels take concerted measures to act now, poverty will become endemic features of cities for several years to come in Sub-Saharan Africa.
In Asia, in the last two decades, China and India experienced rapid economic growth and urbanization, which led to a massive reduction in the number of people living in poverty. Over the years, China’s poverty reduction efforts have largely focused on broad-based economic transformation
and targeted support for vulnerable households to alleviate persistent poverty.41 This has resulted in more than 800 million people being lifted out of poverty. Figure 3.6 shows the proportion of the urban population living in extreme poverty in selected Asian countries. Current trends demonstrate that most countries in Asia are on track to end poverty by 2030, while some may fail to achieve this goal. For example, in Southern Asia, Afghanistan may fail to achieve SDG 1 targets because of growing socioeconomic and political fragilities, which undermine the fight against extreme income poverty.
Despite the economic gains and low levels of income related urban poverty in Asia, there are significant regional variations. In Japan for instance, spatial concentration of poverty in specific areas has deepened in the megacity regions of Tokyo and Osaka.42 This is the situation in most megacities in South Asia, such as Dhaka, Bangladesh, where the spatial concentration of deprivation is embedded in the daily lives of the urban poor.
In Latin America and the Caribbean, the proportion of urban population living in extreme poverty is relatively low; with projections under 5 per cent from 2016 to 2030 (Figure 3.7). While Latin America countries have become
Source: World Data Lab, 2022.
more egalitarian over the last two decades, the last seven years have witnessed a gradual increase in poverty and the slowing down in the reduction of inequality. The COVID-19 pandemic has amplified urban poverty in most Latin American cities. In Bogotá, Colombia, urban poverty rates increased to 26 per cent in 2020 up from 15 per cent in 2019.43 The exacerbation of urban poverty could cast a dark shadow on the achievement of SDG targets on poverty in the absence of decisive policy interventions. The reduction in the Gini coefficient dropped from an average of 1.1 per cent per year from 2002–2014 to 0.5 per cent per year from 2014–2019.44 This slowdown occurred within the context of economic stagnation, huge public debt, public discontent and demands for social justice, all of which were further exacerbated by the impacts of the COVID-19 pandemic.
Despite the made significant strides made over the past decades, cities in Latin America and the Caribbean are still struggling to meet the infrastructure needs of their evergrowing population. Sluggish growth over the past few years hasnegativelyaffectedinvestmentinhousing,water,sanitation

cities in Latin America and the Caribbean are still struggling to meet the infrastructure needs of their evergrowing population
and other urban services. Consequently, there are major gaps in infrastructure spending. The region will need to increase infrastructure spending from 3 to 5 per cent of GDP—about US$180 billion a year—to bridge the gap. Latin American countries spend a smaller share of GDP on infrastructure than other regions, except for Sub-Saharan Africa.45
3.4.1. Slums and informal settlements: face of poverty in the future of cities Asthehousingaffordabilitycrisisgrows,theurbanpoorresort to living in slums and informal settlements. Over 1 billion people globally reside in slums and informal settlements and are subjected to the worst forms of deprivation and marginalization.46 Slums and informal settlements are prevalent in Eastern, South-Eastern, Central and Southern Asia and in Sub-Saharan Africa. In Sub–Saharan Africa, 56 per cent of the region’s urban population live in informal settlements, which is far greater than the average of other developing regions.47
The main drivers of slum growth in developing countries include rapid urbanization, ineffective planning, lack of affordable housing options for low-income households and poverty. Estimates demonstrate that a 1 per cent increase in urban population growth will increase the incidence of slums in Africa and Asia by 2.3 per cent and 5.3 per cent, respectively.48 Thesedynamicsdemonstratethaturbanization
in African and Asian cities continues to occur in contexts characterized by unplanned urbanization, appalling urban poverty, weak governance structures and incoherent urban planning and housing policies. If current trends persist, the future of cities in developing regions will be accompanied by “mega slums” that will be vastly undeserved and whose residents will endure multiple deprivations, which will negatively impact on socioeconomic mobility.

Furthermore, slums and informal settlements perennially suffer from chronic underinvestment in infrastructure and basic services, which entrenches poverty and limits opportunities. For the millions of people living in slums and informal settlements, access to infrastructure and basic urban services remains elusive, without which a better urban future will be difficult to achieve. Inadequate access to water and sanitation is one of the key drivers of multidimensional poverty in slums, which has a greater impact particularly for womenandchildren.49 Slumdwellersalsoendurepoorquality and overcrowded housing often built in environmentally hazardous locations, insecure tenure and risk of evictions, poor health, unemployment, food insecurity, unemployment, and stigmatization.50 All these factors make slum dwellers highly vulnerable to external shocks and stresses like the current COVID-19 pandemic.
In developing country cities, refugees and migrants in informal settlements experience severe social, economic and environmental challenges, all of which worsened during the COVID-19crisis.51 WhileCOVID-19hasmadethechallenges in slums more visible, they are a result of perpetual exclusion from urban services, reflected in acute health inequalities thatwereprevalentbeforethepandemic.Forequitableurban futures,citiesshouldprioritizeextendingbasicinfrastructure and services to slums and informal settlements. Inaction will be detrimental to the future of cities: slums and informal settlements will continue to turn into dense pockets of poverty and loci of cumulative vulnerabilities that will haunt the urban poor for decades. This will create a downward spiral of so-called “slumification,”52 making it even more difficult for marginalized groups to escape poverty and thereby further entrenching the pessimistic scenario of urban futures described in Chapter 1.

Tenure insecurity in slums and informal settlements exposes households to forced evictions and displacements. The pandemic has amplified the urgency of strengthening tenure security in slums and informal settlements as one of the catalysts for equitable urban futures. Forced evictions and displacements disrupt livelihoods and social networks, which is linked to increased poverty and inequality. As we move into the future, strengthening tenure security in slums and informal settlements provides the rights that enable access to urban infrastructure and services.53 Access to secure land enables slum dwellers to undertake home improvements and invest in their communities, which is often a path out of poverty for poor households.54 These measures are a response to the

slums and informal settlements perennially suffer from chronic underinvestment in infrastructure and basic services, which entrenches poverty and limits opportunitiesPoor family in, Dhaka, Bangladesh © Shutterstock
clarion call of the New Urban Agenda to promote equally the shared opportunities and benefits that urbanization can offer and that enable all inhabitants, whether living in formal or informal settlements, to live decent and dignified lives and achieve their full human potential. Without concerted efforts at all levels, residents of slums and informal settlements will always be left behind and endure the dire consequences of future shocks, especially on their livelihoods.
Without access to urban services, the poor resort to selfprovision using alternative arrangements, which can be exploitative and thereby aggravate their already precarious condition.55 Self-provision imposes crippling burdens for poor households residing in slums and informal settlements. Those that struggle to pay often spend the most for the same basic services. For example, residents of Mukuru, an informal settlement in Nairobi, bear the brunt of the “poverty penalty.” They pay more than four times more for drinking water compared to those that live in formal neighbourhoods of the same city.56 The urban poor in Nairobi’s slums pay a much higher price for rental housing, water, electricity and other basic goods and services compared to middle- and higher-income residents in the city. Consequently, they have little income left for other necessities. This scenario traps families in a cycle of poverty and leads to intergenerational transmission of poverty, a trend that is increasingly evident in slums of various developing country cities.57


Globally, the urban poor earn their livelihoods from the informal sector. Informal sector workers constitute 61 per cent of all workers, which translates to 2 billion workers worldwide.58 In developing countries, slum dwellers, migrants, refugees and other vulnerable groups work in the informal economy, earning highly irregular incomes that are vulnerable to shocks. The COVID-19 pandemic disrupted livelihoods of an estimated 1.6 billion people, or 80 per cent of those in the informal sector.59 The resultant losses in working hours in 2020 worldwide were about four times higher than the 2007–2008 global financial crisis with higher losses for women, youth and low-skilled workers.60 Without access to any form of social protection, the pandemic has aggravated the economic vulnerability of informal sector workers. For example, in the favelas of Rio de Janeiro where residents typically make less than US$5 a day, over 70 per cent of households reported an income decline.61 In Khulna, Bangladesh, 70 per cent of slum dwellers had no savings when the pandemic started, which aggravated their economic insecurity once their livelihoods were disrupted.62
The COVID-19 pandemic also amplified the vulnerability of informal transport sector workers, particularly minibus operators in paratransit systems. A majority of the minibus operators and motor-taxi companies in Douala, Cameroon, and Dakar, Senegal, discontinued service, resulting in large income losses.63 Chapter 4 clearly notes that in the absence of social protection programmes, informal sector workers will struggle to rebuild their livelihoods, which is detrimental to the collective vision of equitable urban futures.
Thedoublejeopardyofinadequateservicescoupledwithhigh fees must be tackled decisively to break the systemic barriers that continue to lock the urban poor in situations of endemic precarity and downward social mobility. The negative effects of self-provisioning can undermine economic prosperity of the entire city. To make matters worse, cities in developing regions are bedevilled by scarce financial resources and limited planning capacity. At the same time, these struggling cities are under tremendous pressure to meet the urgent needs of their ever-growing populations while avoiding decisions that lead to unstainable urbanization.
As we move into the future, recognizing and addressing the lack of social safety nets or social assistance for the informal workforce is essential for tackling the current pandemic and for cities to be more economically resilient to future crises.64 Transforming cities globally for future resilience, inclusion and economic sustainability is more urgent than at any time in human history. The path to equitable urban futures is impossible without building the resilience of informal sector workers to economic shocks. If governments fail to act decisively, informal workers will be trapped in precarious conditions with limited prospects for economic mobility.
3.4.4. Climate-related vulnerabilities and impacts on the urban poor Despite negative effects of climate change on urban infrastructure and livelihoods in rapidly growing cities as shown in Chapter 5, some urban leaders continue to turn
Without access to urban services, the poor resort to self-provision using alternative arrangements, which can be exploitative
a blind eye to these realities.65 Current projections indicate that a 2°C increase in global temperature in 2050 will expose 2.7 billion people, or 29 per cent of the global population, to moderate or high climate-related risks, with 91 to 98 per cent of the exposed and vulnerable population living in Asia and Africa respectively.66 Sea-level rises, and storm surges often adversely affect the poor and those living in vulnerable communities. For example, in Ho Chi Minh City, Viet Nam, 85 per cent of the urban poor areas may be exposed to flood risk by 2050.67 These risks are present in most low-lying coastal cities in developing countries.
The most vulnerable populations are migrants, refugees, women, the elderly and others who live in overcrowded and risk-prone informal settlements. These populations disproportionately bear the burden of environmental risks becauseoftheirphysical,socialandeconomicvulnerability.68 Not only does climate change make it difficult for people to escape poverty, but it also creates create a vicious cycle of deprivation that could be difficult to reverse; thereby trapping the poor in the high damage or disastrous scenario of urban futures. When hit by climate related shocks, the urban poor suffer relatively greater losses in terms of their lives and livelihoods. Such differential impacts further amplify existing inequalities and undermine the capacities of people to withstand, cope, adapt and recover from
future shocks.69 If cities and subnational governments fail to prioritize climate resilience for all, then the urban poor, especially those living in slums, will continue to bear the brunt of climate-related vulnerabilities that will undermine their well-being.

The COVID-19 pandemic has exacerbated multiple deprivations and exposed structural fragilities that characterize cities in developing regions (Figure 3.8). The pandemic further exposed the stark urban services divide, particularly in cities of developing countries where there are limited egalitarian policies on service delivery.70 The pandemic has inflicted unprecedented suffering on already marginalized urban populations—women, children, people living with disabilities, indigenous people and the homeless, among others.71 These groups usually have limited access to basic services and precarious sources of livelihood, which make them highly susceptible to shocks. The pandemic also exposed hidden pockets of urban poverty and created a class of newly poor urban dwellers, as noted earlier.
The COVID-19 pandemic is also reinforcing pre-existing gender inequalities due to differentiated access to public services, vulnerability of informal sector jobs and the
additional responsibility of household and childcare imposed on women. Without significant policy and programmatic support, these vulnerable groups will struggle to bounce back and will be trapped in endemic precarity with limited prospects of upward social mobility. Cities have found themselves in an unprepared and difficult situation; they face unprecedented social, economic and health problems that must be urgently tackled if the vision of inclusive and equitable urban futures is to become a reality.
While cities in developing countries experience the most widespread effects of urban poverty, cities in developed countries are not immune. For example, London has seen a sharp rise in homelessness because of increasingly unaffordable housing prices.72 In the US, deprived neighbourhoodsinoldercitiesarecharacterizedbyeconomic marginalization, social problems and underinvestment in key municipal infrastructure and services. In New York City, the urban poor, especially minorities, live in congested neighbourhoods and overcrowded housing stock, often in multi-generational families.73 There are also worrying trends of urban services deprivation in Philadelphia, Baltimore and Detroit, where the urban poor have faced mass water shutoffs in recent years. The most affected are thousands of high-risk and at-risk households clustered in pockets of “water poverty,” disabled individuals, blacks and Hispanics.74 If water rates increase at projected amounts, more than 35 per cent of US households will struggle to pay their water bills.75 The exorbitant water bills not only expose the poor to shutoffs but affects their ability to meet other basic needs.
neighbourhoods or suburban municipalities, where opportunities, good quality services and infrastructure are guaranteed. If governments fail to promote equitable access to urban infrastructure and services, urban poverty will become entrenched while disproportionately affecting specific groups of urban populations.
In Europe, countries such as Austria, Belgium, Demark, Germany and the Netherlands, have witnessed higher poverty rates in cities than in rural areas over the years.77 Data from the European Union Statistics on Income and Living Conditions reveal that 22.5 per cent of the population in the region were at risk of poverty and deprivation in 2017.78 In Sydney, there are pockets of disadvantage concentrated in the western and southwestern suburbs where the manifestation of urban poverty has gender and racial dimensions.79 Currently, the proportion of Aboriginal people on a low income in Sydney is 21.1 per cent, compared to 10.2 per cent of non-Aboriginal people.
Despite high economic growth in cities of developed countries, minority groups, migrants, refugees, the homeless and indigenous peoples, among others, experience structural barriers that perpetuate their marginalization. Failure to addressthesechallengeswillcreateconditionsforcumulative deprivations that will lead to a vicious cycle of urban poverty for decades. In worst case scenarios, intergenerational poverty could worsen, as families struggle to break barriers that undermine their economic mobility. Failure to prioritize the needs of minorities and other vulnerable populations in developed country cities could forestall the drive towards inclusive and equitable urban futures.

The pandemic has derailed the European Union’s target of lifting at least 20 million people out of poverty by 2020.76 The manifestation of urban poverty in the US has a strong class and racial character. It is predominantly black and other minority dominated neighbourhoods that endure deprivationstogetherwithhighratesofcrime,drugaddiction and continued deterioration of physical infrastructure. In contrast, the privileged elites reside in relatively wealthy
The opportunities associated with urbanization in cities of developing regions are not equally shared. Increasing levels of inequality are becoming pervasive in these cities, which is where most of the population growth will occur over the next 30 years.80 Despite a steady decrease in extreme poverty, inequality within cities has generally been growing. Cities of developing regions experience the highest levels of inequality, especially in Latin America and Sub-Saharan Africa.81
In addition to high levels of income inequality, millions of people in Latin American cities face spatial disparities and social segregation, which manifests through fragmentation
The pandemic has derailed the European Union’s target of lifting at least 20 million people out of poverty by 2020
of social services: the wealthy, the middle class and the poor do not share the same facilities and amenities.82 If not addressed, these alarming levels of inequality will create vicious circles that will be harder to reverse. Income and opportunities will be concentrated in the hands of the few urban elites, while the poorest bear the brunt of unequal income distribution.
Sub-SaharanAfricaissecondafterLatinAmericawithrespect to income inequality in cities. Close to three-quarters of the cities in Sub-Saharan Africa have high levels of inequality as indicated by Gini coefficients exceeding 0.4, with South African cities being the most unequal in the region.83 The astronomical levels of income inequality in Latin America and Sub-Saharan Africa reflect institutional and structural failures in the drive towards more equitable and just cities.
Cities in Asia have the lowest levels of income inequality among developing regions. There are significant regional variations in urban inequalities, with the largest disparities between basic and safely managed water services for urban populations in Central and Southern Asia.84 Despite being the 12th richest city in the world, Mumbai is marked by extreme disparities where the city’s wealth is concentrated in the hands of the few. People in the poorest districts of Mumbai earn only 25 per cent of what people in the wealthiest districts earn.85 Chinese cities are characterized by increasing residential segregation because of the hukou household registration system. High income groups in Beijing and Shanghai reside in privatized neighbourhoods, while rural migrants congregate in urban villages and worker enclaves, sometimes with limited access to opportunities and social amenities. Failure to address these dimensions of inequalitiescouldaggravatetheexclusionandmarginalization of the poor, with dire consequences for equitable urban futures.


Theurbanservicesdivideincitiesofdevelopingcountriesisa manifestationofurbaninequalities.86 Unequalaccesstohighquality, reliable and affordable essential infrastructure and services often results in poor health, inflicts environmental damage and locks people in cycles of poverty for generations. In absolute numbers, 63 million people in urban areas in
Sub-Saharan Africa have no access to safe water sources.87 Currently, only 44 per cent of all Sub-Saharan Africa’s urban residents have access to basic sanitation services.88 In SubSaharan Africa, rich households in urban area are 329 per cent more likely to have access to improved water sources and 227 per cent more likely to have access to improved sanitation facilities compared to poor households.89 This urban services divide is more pronounced in secondary cities, and this is expected to widen as these cities are often neglected in public infrastructure investment.90
Those living in slums and informal settlements are disproportionately affected by this urban services divide; they bear the brunt of disease outbreaks, economic shocks and environmental risks. Studies have demonstrated that disparities in accessing essential infrastructure and urban services can have greater impact on lives, livelihoods and long-termprospectscomparedwithdifferencesinearnings.91 In developing country cities, relatively well-off communities are better served with core infrastructure and services compared to poor communities, thus creating a huge urban services divide (Figures 3.9 and 3.10).92
Figure 3.9 demonstrates a sharp contrast between betterserved and underserved urban groups. While the urban services divide creates more opportunities for better served groups, it places higher burdens for poor communities in terms of cost, time and ill health, limiting their opportunities for prosperity. If the current urban services divide is not addressed, the long-term impacts on the future of cities will be dire, as it creates a vicious cycle of deprivation that will be hard to escape for millions of the urban poor.
As indicated in Figure 3.10, the cumulative costs of this stark urban services divide are huge: worsening inequalities, lagging productivity and further environmental damage. More than 1.2 billion urban residents are underserved worldwide, which represents two out of every three city dwellers in low-income countries.93 This divide poses a major challenge to attaining inclusive, sustainable and equitable urban futures in developing regions. Unequal access to infrastructure and services perpetuates a vicious cycle that becomes increasingly difficult to escape. The urban services divide encumbers cities in ways that weaken their economic vitality.94 Without drastic and purposeful change, the rapidly expanding cities of developing regions will find it hard to escape this trajectory. Therefore, equitable access to urban services is a key lever for achieving inclusive and equitable urban futures and delivering on the optimistic scenario described in Chapter 1.
Figure 3.9:
better
Constant, reliable power—has lighting, heating, and cooling, and does not worry about interruptions to work
Opportunities (for pro ductiv ity,
Reliable, affordable water access—wakes at a reasonable time, knowing there is water in the taps
Access to public transit or a private vehicle—has a short, swift, and affordable
Secure housing with private and safely managed sanitation— lives in decent housing with access to services and opportunities, with few concerns about family health and safety
y y
Betterserved
No indoor
No indoor water wakes early to queue at expensive tanker
or a shared water
Source: Adapted from Mahendra et al, 2021, p. 14.
Figure 3.10:
The
No access to affordable public transit or private vehicles—walks or commutes long distances in congestion, paying
fares, rain or shine
Intermittent power or no access to power must use unhealthy, inadequate, or expensive methods for lighting, cooking, and heating, which interrupts work
Crowded slum with shared on-site sanitation—lives in poor-quality housing with inadequate services, risk of eviction, flooding and other disasters, and constant concern about family health and safety
Underserved
Source: Adapted from Mahendra et al, 2021, p. 15.
Better served
Though still
such as pollution, the better served face fewer costs in terms of time, money, and health, with more resources to pursue
Under-
Generally, urban inequalities are relatively lower in developed regions because of the prioritization of egalitarian policies. Nonetheless, income inequality, socioeconomic disparity and spatial exclusion are becoming rife in cities in developed countries. Cities in developed regions generate over 60 per cent of jobs and economic growth, but not all cities have managed to grow inclusively.95 The most unequal cities in the US have become more unequal, as eight of the ten most unequal cities experienced an increase in their Gini coefficients between 2010 and 2018.96 This trend has been further exacerbated by the COVID-19 (Box 3.1).
TheGinicoefficientdoesnotcapturethemultipledimensions of urban inequalities. However, in some situations the Gini index correlates with socioeconomic data. For instance, due to high income inequality, Miami was ranked 265th out of 274 cities by the Urban Institute’s overall inclusion rankings—along with high levels of racial segregation.97 This demonstrates that income inequality measured through the Gini coefficient can interact with other socioeconomic dimensions of inequality to produce highly unequal and divided cities, where wealth and urban opportunities become concentrated in the hands of a few.
Failure to address the above challenges could be detrimental to the goals of inclusive and equitable urban futures. Cities in the US could see a massive increase in the number of highly segregated neighbourhoods where minorities face chronic underinvestment in basic infrastructure and services, deteriorating job opportunities, increased crime rates, poor health delivery systems and downward economic mobility.
In European cities, there is mounting evidence of growing inequalities. In 2017, 112 million EU inhabitants or 22 per cent of the total population were at risk of poverty or social exclusion.98 While EU cities are characterized by high standards of living, they are also places of moderate to high levels of income inequality. In recent years, wealth has increasingly become concentrated in the hands of the few, and this polarization of wealth is most concentrated in urban areas (Figure 3.11).99
In most European cities, welfare programmes, housing markets, place-based policies and migration dynamics play a major role in shaping socioeconomic segregation at the neighbourhood level. For instance, the high levels of socioeconomic segregation in Brussels are the outcome of a small share of social housing, limited placed-based interventions and territorial processes that have created a divided city.100 Naples, Italy, is a city deeply marked by socioeconomic inequalities have been driven by urban segregation and the lack of financial instruments to bridge the gap.101 The spatial concentration of deprivation in European cities is closely linked to other dimensions of inequality such as inadequate education, poor health and limited employment opportunities.

In US cities, consumer-oriented modes of production have created separate and unequal landscapes or urban neighbourhoods, with negative impacts on health, social mobility and economic prosperity for racialized communities. The current COVID-19 pandemic has laid bare these structural inequities and their differential impact on the people of colour. Nationally, black people are dying from COVID-19 at 2.4 times the rate of white people because of the inequitable living conditions, underlying structural conditions and unequal access to health services that characterize segregated neighbourhoods. Residential segregation has made it possible for government authorities to implement discursive measures such as withholding resources from minority communities through a host of negative policies and practices, including over-policing and underinvestment in urban infrastructure. These are forces that impede wealth accumulation and halt social mobility. As of 2016, the median net worth among white families was 10 times that of black families, and more than eight times that of Latino or Hispanic families.
Source: Loh et al, 2020.
Tackling poverty and inequality remains one of the key global priorities for creating equitable and inclusive cities that provideopportunitiesandprosperityforall.Withoutinclusive cities, the impacts of future shocks and stresses may be even more acute than the current COVID-19 pandemic.102 Achieving this vision of a more egalitarian society that leaves no one behind is not guaranteed; it requires bold actions to break the structural barriers that trap people in cycles of poverty and inequality. Currently, cities are experiencing multiple crises (health, financial, political, economic and environmental), all of which complicate responses to poverty and inequality. The levels of urban poverty and inequality, coupled with the devastating impacts of the COVID-19 pandemic, send a clear message that governments must act now to create conditions that nurture inclusive and equitable urban futures. Without decisive action at all levels, the current situation will only worsen.
3.8.1. A multidimensional approach to an inclusive and equitable urban future


The urgency of new approaches for transformative change in cities cannot be overemphasized; the time for short-lived, piecemeal solutions should be a thing of the past. Urban poverty and inequality are increasingly becoming persistent and complex challenges, which call for new approaches. Narrow, sectoral approaches are not effective amid the social, economic, political and environmental crises that trap most residents in poverty. Within the Decade of Action window, it is pertinent for cities and subnational governments to adopt a multidimensional approach to addressing poverty and inequality. Such approaches must extend beyond conventional hard infrastructure programmes and look at the multiple spatial, social and economic factors that lead to exclusion and marginalization.
The spatial, social and economic dimensions of cities are crucial to building sustainable and equitable urban futures (Figure 3.12). These dimensions are interrelated. For instance, affordable public transportation provides access to jobs; jobs increase access to housing and basic services; and access to housing and services increases participation in urban governance and decision-making processes. Given the multiple deprivations facing the poor in cities, a multidimensionalresponsecouldgeneratesignificantgainsin marginalized urban communities. The integration of spatial,
Tackling poverty and inequality remains one of the key global priorities for creating equitable and inclusive cities that provide opportunities and prosperity for allSource: Joint Research Centre, 2019.
Source: Adapted from World Bank, 2015, p. 13
social and economic dimensions of urban development can break structural barriers that create vicious cycles of poverty.

Another priority action for tackling urban poverty and inequality is extending infrastructure and basic services to the most deprived neighbourhoods. The current COVID-19 pandemic is a vivid reminder that access to basic water and sanitation facilities can be a matter of life and death. Cities are uniquely positioned to develop urban infrastructure to improve the quality of life for the most vulnerable urban populations while at the same time responding to threats that exacerbate inequalities, such as climate change. Targeting improvements in quality, coverage, and affordability to disadvantaged neighbourhoods often results in citywide transformations. The cities of Colombo, Sri Lanka; Kampala, Uganda; and Nairobi have shown that extending piped water and sewer networks in low-income neighbourhoods improves public health, protects the environment and allows citizens to be more productive.103
Extending infrastructure and basic services to deprived neighbourhoods can galvanize action towards building inclusive, thriving and resilient cities. Making these transformations does not only enhance equitable access to urban services but can also yield large dividends and cascading benefits for the entire urban economy.104 It is estimated that every dollar invested in developing water and sanitation infrastructure generates between US$4–34 in benefits by improving health outcomes and boosting urban productivity.105 The revitalization of water and sanitation infrastructure in targeted neighbourhoods in Afghanistan led to a 6.4 per cent annual increase in private investments in land, housing and real estate.106 Moreover, extending basic infrastructure and services to slums is critical to building livelihoods, improving quality of life and strengthening public health (Chapter 7), as well as and stimulating the local economy.
The cumulative effects of equitable access to urban services to poverty reduction can be significant. Equitable access to urban services is a necessary, but not sufficient
condition. Cities must be transformed at a deeper level in their governance and decision-making structures, planning approaches, institutions and priorities of political leaders. These ingredients are vital for addressing poverty and promoting urban prosperity for all.

The COVID-19 pandemic is an opportunity to better recognize informal sector workers for their legitimate contribution to urban economies. The informal economy must be supported not only because it provides livelihoods for the working poor, but also because it supplies goods and services that keep the city’s formal economy running (Chapters 4, 6 and 10). The implementation of pro-informal sector urban policies can unlock the hidden value that this segment of the economy carries as well as transform the livelihoods of millions of people that are employed in this sector.107 This issue is addressed in the SDGs, particularly through SDG 8: “Promote sustained, inclusive and sustainable economic growth, full and productive employment and decent work for all.” Prioritizing the informal sector in urban programmes will help achieve the SDGs on poverty, gender equality and equality.
Looking into the future, cities must stop the exclusion and harassment of informal workers. The harassment and penalization of street traders, waste pickers and market vendors must be halted, and their rights respected (Figure 3.14).108 These rights include legal recognition, social and economic rights, access to essential infrastructure and services and better representation in urban governance and
policymaking processes. In the Indian cities of Surat and Ahmedabad, the Mahila Housing Trust negotiated with city authorities and leveraged city funds on behalf of informal sector workers.109 These funds were used to upgrade housing conditions and access solar energy technologies to run refrigerators, soldering irons and sewing machines for home-based workers.
For these priority actions to materialize, there are key roles which key urban stakeholders can play in supporting informal employment (Table 1.1). For inclusive urban futures, it is important for cities and subnational governments to acknowledge that informality is the dominant mode of contemporary urbanization in developing countries; therefore, urban policies and programmes should be developed from this perspective. Thus, cities must rethink and review the current exclusionary urban planning approaches in ways that are responsive to the needs of informal activities (Chapter 6). Cities cannot eradicate poverty or become more equal and economically productive if they continue to exclude or harass large populations of the informal workforce. Urban planning and policymaking that considers informal workers is difficult but not impossible. It requires a shift in the mindset of policymakers and city plannerstorecognizethecontributionofinformaleconomies to the livelihoods of the urban poor.

City governments
Recognize the challenges of different types of urban informal workers and their contribution to urban economies in different sectors
Improve access to essential urban infrastructure and services
Enhance access to public spaces, procurement opportunities and social protection programmes
Civil society, social movements, and nongovernmental organizations
Defend social and economic rights of informal workers
Collaborate with urban governments to increase the access of informal workers to public spaces, public services and public procurement opportunities
Advocate for a more inclusive vision of economic prosperity, so that it is shared across all who contribute to the workforce
Ensure equal employment rights and security for informal workers, including social and fiscal safety nets in times of crisis and disasters
Support and facilitate participation of informal workers groups in urban decision-making that affects their lives and livelihoods
National governments
Create incentives for cities to offer public procurement contracts for services such as waste management to informal worker organizations with a path to formalization and benefits
Engage informal worker organizations when setting policies in sectors in which they are employed, and support them in negotiations with local governments
Private sector
International community, including development finance institutions
Partner with informal small entrepreneurs to invest in local innovations
Comply with wage laws and offer paths to formal employment and reliable livelihoods with benefits and insurance schemes
Include informal workers in supply chains for goods and services and provide reliable business to support their livelihoods
Create and operationalize innovative credit instruments in the banking sector for informal workers and businesses investing in informal settlements, thus fostering financial inclusion
Develop financing programmes that help cities integrate informal workers into formal employment and service delivery systems, with social and fiscal safety nets, health benefits and secure livelihoods
Incentivize a change in mindset to acknowledge the implications and contributions of the informal economy
Design programmes that ensure economic gains are distributed for shared prosperity, ensuring access for all citizens to the full range of opportunities the city offers
Source: Adapted from Mahendra et al, 2021, p. 129.
It is paramount for cities to develop inclusive urban governance systems and processes that promote transformative resilience to multiple crises by using local knowledge in the face of uncertainty. The quality of local governance and use of local knowledge strongly influence access to shelter, services, infrastructure and emergency response.110 These approaches have been instrumental as part of the COVID-19 response strategies.
Urban leaders must draw on grassroots, civil society and private sector efforts to build local alliances to deliver more effective strategies of addressing poverty and inequality. If cities harness local knowledge, they can effectively understand how complex risks are experienced. This
perspective becomes the basis for developing forwardlooking strategies that build the resilience of the poor in the face of multiple risks.111 Cities should therefore support inclusive, gender-transformative responses that are co-produced with marginalized urban populations, including attention to intersecting inequalities as noted in Chapter 1. These strategies will require working closely with specific urban groups such as:
Women and girls who bear the brunt of care burdens and underrepresentation in urban governance structures
Ethnic minority groups who are often disproportionately burdened by shocks and bear the brunt of discrimination and systemic exclusion from urban development processes
Table 3.1: Roles of specific actors in supporting informal sector workers
Migrants, refugees and internally displaced persons who face heightened risk of socioeconomic exclusion and marginalization
People with disabilities and the elderly who may have pre-existing health conditions and may struggle with accessing infrastructure and urban services
3.8.5. Place-based interventions to build resilience in “urban weak spots”
Cities should prioritize efforts to build resilience in their “urban weak spots” so that they can withstand future shocks and stresses (Box 3.2). Urban weak spots are areas such as slums and informal settlements that are characterized by poor services, overcrowding, hazardous locations, high risk of eviction and multiple vulnerabilities. By amplifying these vulnerabilitiesandcreatingnewones,theCOVID-19pandemic send a strong message on the need to address the structural inequalities in cities. Failure to do this will trap millions of people in zones of deprivations with limited prospects of
upward mobility. Cities and subnational governments should therefore develop and implement citywide upgrading and renewal strategies based on need and disadvantage that prioritize investment in urban weak spots.
City leaders should think creatively about improving housing options for the poor. Existing evidence shows that in situ upgrading is preferable to relocation, except in cases when people need to move for their safety or to serve an overwhelming public need.112 Implementing upgrading strategies in partnership with local communities helps cities harness untapped skills and the lived experiences of these communities.Thiscollaborativeapproachwillimproveaccess to basic infrastructure and services, economic productivity, and overall quality of life for the marginalized.
In the long term, international and regional financial institutions like the World Bank, the Africa Development Bank and the Asian Development Bank can support the scaling-up of slum-upgrading interventions to strengthen investment in infrastructure and services for underserved communities. Funding from development banks can be mobilized through grants and/or low-interest microloans (or a combination) for housing improvements. This approach would quickly get cash to households to make needed shelter improvements that would build resilience to future crises and serve to stimulate the formal and informal construction industries, on which many informal, urban poor workers rely. Investing in homes can serve to reduce the spatial inequalities that exist within cities between the formal and informal sector, as well as build longer-term household wealth. Improvements in housing could also reduce overcrowding and thus vulnerability to future health crises. This kind of investment is important for building longer-term resilience and reducing the social disparity that exists in cities.
Source: World Bank, 2020
There are emerging models of best practices in participatory slum upgrading, which provide important lessons on how slums and informal settlements can act as entry points for place-based interventions. In Nairobi and Windhoek, Namibia, there have been strong alliances between local governments and community groups in slum upgrading interventions. These cities are changing urban planning and land-use regulations to improve infrastructure quality and access as well to enable incremental building over time.113 In Thailand, cities have partnered with community-based organizations and NGOs to upgrade informal settlements through the Baan Mankong programme, creating a model that has been scaled up to over 215 cities in 19 Asian countries.114 These grassroots, bottom-up housing and slum upgrading programmes tapped into local knowledge, while combining with government funds and approvals to serve as an innovative model throughout the region.
The success of place-based interventions depends on the existence of political will to pursue pro-poor urban development.Thisapproachtourbanpolicymakingempowers poor communities to demand and realize their rights and entitlements, matched by financial, human and technical capacity to create conditions for socioeconomic changes on the ground. Community-led slum upgrading interventions, like those in Bangkok, Thailand, have produced well-serviced and affordable housing for the poor.115

The COVID-19 pandemic and the looming climate crisis have demonstrated the urgency of building resilience in the planning, governance and management of cities. Chapter 10 notes that building resilience for sustainable urbanization requires linking in an integrated way the various pillars of the 2030 Agenda for Sustainable Development. The COVID-19 pandemic presents an opportunity for urban leaders to prioritize building long-term resilience of cities against all forms of shocks.116 The pandemic has intensified the pattern of emergencies, with urban areas bearing the brunt. In the same vein, almost two-thirds of cities with
more than 500,000 residents are at high risk of exposure to floods, droughts, earthquakes and other natural disasters.117
The Moving Urban Poor Communities in the Philippines Towards Resilience (MOVE UP) model provides important lessons for the future of cities with respect to propoor resilience interventions (Box 3.3). Specifically, the urban poor and at-risk communities must be at the centre of interventions targeting the institutional, social, economic, environmental and infrastructural dimensions of resilience.118 The MOVE UP model demonstrates that the participation of at-risk communities strengthens their capacities and engenders a sense of ownership over projects.
Urban context in the Philippines Cities in the Philippines are characterized by rapidly expanding informal settlements, the majority of which are situated in environmentally hazardous areas. Most of the 1.5 million informal settlement residents do not have access to essential infrastructure and basic urban services such as water and sanitation. Residents of informal settlements are highly vulnerable to climate-related impacts. The COVID-19 pandemic has worsened the situation by disrupting livelihoods of thousands of poor households.
How does the MOVE UP Project help build resilient communities?
The MOVE UP Project envisions resilient communities as those that can prepare and bounce back from shocks and stresses because: they have the resilience capacities to do so; the society they live in is inclusive and equitable; and good governance provides an environment that enables them to participate in public life and decision-making. The MOVE UP project places urban poor communities at the centre. The project was designed based on the idea that communities become more resilient if they have strong resilience capacities, and if the society they live in has well-developed social, economic, environmental, institutional and infrastructure sectors. To help achieve this ideal, the project employs three main strategies—building resilience capacities, improving social positions and creating an enabling environment.
Building resilience capacities entails increasing urban poor communities’ capacities to anticipate, respond to, adapt to and transform risks. Aside from bolstering these resilience capacities, livelihoods and livelihood assets may also be made more resilient by strengthening, diversifying and protecting them. This is particularly important in the context of COVID-19 where livelihoods of informal settlement dwellers have been eroded due to lockdown measures and lack of social safety nets from governments.
Improving social positions means advancing social inclusion relating to gender, ethnicity, age and disability; increasing organizational capacity; and pushing for the equitable distribution of capital and assets.
Creating an enabling environment consists of promoting participatory and inclusive governance processes that follow the rule of law.
The project was a collaborative effort between different stakeholders such as communities, civil society and non-government organizations, private sector, local government units, and the national and subnational levels of government. By focusing on improving shelter conditions during emergencies and making livelihoods more resilient to shocks and stresses, MOVE UP hopes to strengthen the resilience capacities of urban poor communities and their respective local governments.
Source: Resilience and Innovation Learning Hub, 2020.
As cities recover from the pandemic, their resources should be directed towards collaborative resilience building with poorurbancommunities(Chapter8).Ifcitiesareplannedand managed using such innovative and bottom-up approaches, new opportunities for tackling poverty and inequalities will be unlocked. No urban intervention will succeed without putting the poor communities at the centre. Failure to invest in urban resilience can reverse development gains by pushing millions back into poverty.119
The COVID-19 pandemic provides a unique opportunity to reimagine transformative urban policies that redress poverty and inequalities in cities. The UN-Habitat report Cities and Pandemics: Towards a More Just, Green and Healthy Future advocates for a “new social contract” in the form of universal basicincome,universalhealthcoverageanduniversalhousing and basic services (Chapter 1).120 The COVID-19 pandemic has exposed the gaps in social protection coverage, given its disproportionate impact on the livelihoods of the urban poor and low-income workers.121 Policy interventions by both national and local governments are important for bolstering the resilience of vulnerable groups to future shocks. There are increased calls global for universal social protection on the grounds of both efficiency and equity.
Social protection is a potentially powerful policy tool for redistributing wealth and addressing urban poverty and inequalities, which have become defining features of cities especially in developing countries (Chapter 1). The need to reform social protection programmes has never been this urgent. Social protection programmes have the potential to contribute to the achievement of several SDGs. If social protection covers some form of basic income, housing and health, then it can contribute to achieving several SDG targets. For instance, SDG target 11.1 seeks to ensure access for all to adequate, safe and affordable housing and basic services; thus, social protection can directly enhance
access to these basic needs.122 Prioritizing the poorest urban households in social protection interventions could generate more progress in addressing poverty and inequality. Transformative social protection is hinged on the notion that poverty and vulnerability have social and economic dimensions, which call for more than income support. What potentially makes such interventions transformative are efforts to dismantle structural barriers such as discrimination against marginalized and vulnerable groups.123
Formal social protection assistance coverage is generally higher in rural areas. The COVID-19 pandemic has amplified the urgency of urban social protection programmes. A key lesson from implementing social protection programmes in Latin America and Asia is that replicating rural models in urban settings will not work. This experience calls for adapting or redesigning social protection interventions to make them appropriate for urban-specific vulnerabilities.
There are three key pillars of urban social protection that should be prioritized (Figure 3.13). The first is social protection for informal workers.124 Workers in the informal sector endure precarious livelihoods, unpredictable incomes, and difficult working conditions. During the COVID-19 pandemic, street traders’ vending markets were destroyed in the name of public health measures, which contributed to massive loss of livelihoods and incomes, thus deepening poverty. These informal workers rarely have unemployment insurance, social assistance or any form of safety net. If cities are to serve as engines of inclusive growth, then social protection and dignified work should form related policy elements of equitable urban futures. A transformative approach to social protection would include implementing regulation and monitoring to ensure the health and safety of all urban workers. In fact, the COVID-19 pandemic has demonstrated the urgent need to strengthen the links between social protection and livelihoods.
Social protection is a potentially powerful policy tool for redistributing wealth and addressing urban poverty and inequalities
Going forward, governments should ensure strong linkages between social protection and livelihoods to help the most vulnerable workers build more resilient livelihoods.125 In the Indian cities of Bengaluru and Pune as well as in Brazil, Colombia and Argentina, local governments have signed contracts with previously informal waste picker cooperatives for door-to-door waste collection.126 Cities should also recognize informal sector workers as legitimate economic actors through integration of their livelihoods activities into urban policies and plans.
The second pillar of social protection is adequate urban housing for all, as millions of the urban poor, especially in developing countries, live in slums, informal settlements and various forms of inadequate housing. Measures to achieve adequate housing for all not only entail financial resources, but also involve legal claims on tenure and an assertion of the right to the city. The housing affordability crisis in cities of developed and developing countries is a grave concern. For instance, in Australia, there is a constant rejection of the view that social housing should be expanded to ensure all households are able to access decent, affordable housing.127 This view is incompatible with the current global goals of promoting access to decent and affordable housing for all.

To address the current housing affordability crisis, governments at all levels should prioritize targeted social housing programmes. Latin American countries have been at the forefront of housing subsidies.128 In Chile, the ABC programme (ahorro or “savings,” bono or “subsidy” and credito or “loans”)129 uses the savings of residents as a financial basis on which to offer loans and subsidies to make housing more affordable.130 In Brazil, pragmatic publicprivate partnerships involving the three levels of government are used to redevelop cityland and createspace for affordable housing in the centre of São Paulo.
Cities could promote rental housing by converting underutilized urban land to affordable housing131 and invest in public transport to connect housing with employment centres. Subsidized housing programmes should be carefully designed as poorly structured incentives can have negative outcomes. Ambitious social housing programmes that are insensitive to location have been an important driver of urban expansion without access to basic services and have created a mismatch between where houses are built, where people
want to live and where services are available.132 National governments should create decentralized frameworks that empower cities to implement an appropriate housing policy mix best suited to the needs of their local population.
Access to essential public services constitutes a third area of convergence between social protection and urbanization. The COVID-19 pandemic demonstrated the centrality of essential services—water, sanitation, transport and energy, among others, for the well-being of urban dwellers. However, a majority of the poor including those living in informal settlements, refugee camps and migrant dormitories do not haveaccesstotheseservices,makingthemhighlyvulnerable. Social protection can alleviate access constraints by giving poor households subsidized or free access to these services. City governments could experiment with innovative models of social protection for urban services provision by designing well-structured, targeted subsidies for affordability and social returns.133 Providing targeted subsides for electricity and water connections for the neediest residents has proven effective and affordable, allowing residents to pay the upfront costs over time. Several cities across Chile, Colombia and South Africa subsidize water for households below a certain income threshold, using existing socioeconomic classifications.134 However, such programmes will need to be carefully designed to ensure that the most vulnerable derive the intended benefits.
Poorly designed interventions can have unintended consequences, with the low-income and poor households paying more for inferior services and the publicly-funded subsidies going to higher-income groups. In Asia, China has experimentedwithurbansocialprotectionanddemonstrated that it is practical to implement such measures by adopting an integrated system that recognizes the need to go beyond
Figure 3.13: Pillars of urban social protection
The Chinese government introduced the Regulations on Minimum Subsistence for Urban Residents, abbreviated as Dibao, which is a formal poverty-oriented measure to support low-income urban working households. In addition to Dibao, China’s urban social protection regime includes education, health, employment, housing, disaster relief and temporary assistance programmes targeted at tekun people (those destitute, in extreme difficulty and poverty), urban residents with no labour capacity, no income, and no legal guardian. The primary target beneficiaries of these urban social protection programmes are the working poor, older persons without pensions, needy children and persons with disabilities. In terms of housing, local governments give priority to low-income families in urban areas facing housing insecurity priority in the allocation of public rental housing, rental subsides and home renovation schemes.
There are several important lessons emerging from the Dibao programme:
i. Social programmes designed for urban areas should target the most marginalized groups, especially those that struggle to access urban labour markets.
ii. The design of social protection programmes must consider the multiple dimensions of urban vulnerabilities such as lack of access to basic services like education, health and housings.
iii. Social protection programmes should form part of the multilevel governance response to urban poverty and inequalities, providing a framework through which cities can promote inclusive and equitable urban futures.
Source: Lixiong, 2018.
income support measures (Box 3.4). The country’s locally designed Dibao programme integrates a fragmented system within a planned framework and establishes a security net to meet basic needs of all people towards social justice and inclusive cities.
The implementation of successful urban social protection policies and programmes will not happen by chance. It depends on factors such as consideration of urban-specific vulnerabilities, governance and institutional reforms, datadriven targeting, rights-based approaches, comprehensive and integrated design of interventions, and political marketing, among others.
A key le sson from the implementation of social protection policies in Asia and Latin America is that simply replicating rural models in urban settings does not work because urbanspecific vulnerabilities are complex and multidimensional, which necessitates adapting or re-imagining the design of
these programmes.135 Social protection interventions that fail to consider urban-specific vulnerabilities such as higher living costs, high levels of informality and unemployment, and unequal access to urban services, among others, will have limited success.
Urban vulnerabilities manifest differently in different geographical contexts; therefore, a one-size-fits-all approach will not work. Figure 3.14 shows some of the key design considerations for urban social protection given that urban poverty and inequality across cities are highly differentiated—factors which determine the design of urban social protection interventions. Cities should tailor strategies that respond to different form of vulnerabilities. Social protection interventions should be nuanced and wideranging to ensure the different risks and vulnerabilities associated with gender, age, ethnicity, migratory status and other characteristics are effectively identified and tackled in urban welfare programming.
3.10.2. Comprehensive and integrated design of urban social protection is key
The complexity, multidimensionality and interconnectedness of urban poverty and inequality require a comprehensive
Source: Adapted from Gentilini, 2015.
social protection system that goes beyond income. Cities and subnational government must invest in comprehensive social protection systems, which guarantee income security and a wide range of services for vulnerable groups. Additionally, cities should see themselves as part of a continuum of national social protection systems where they are part of the broader and interconnected interactions between rural, peri-urban and urs ban areas of various sizes. The COVID-19 crisis has exposed the dangers of not having social protection systems that cushion vulnerabilities across territories, thus demonstrating the need to integrate social assistance, insurance and labour market interventions in coherent and connected ways across the urban-rural continuum.136
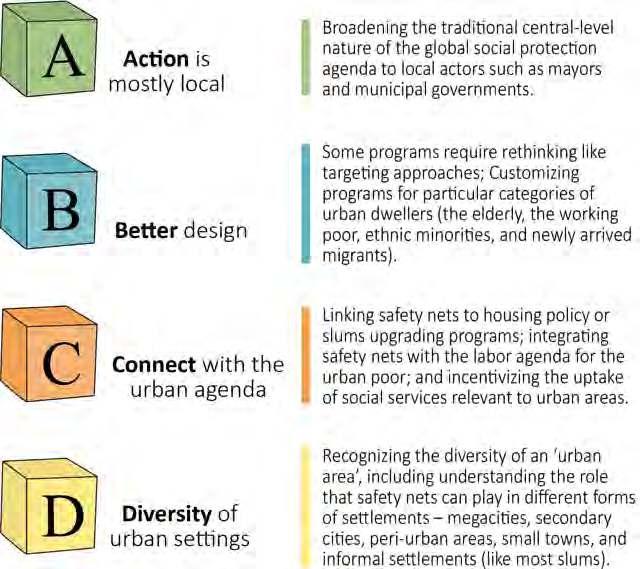
Transformative and ambitious policy interventions require hugefinancialcommitments.Tosuccessfullyimplementsocial protection programmes, city governments in many countries will have to increase their revenue streams. Depending on the context, city governments will need to diversify their portfolio of revenue, improve capacity for revenue
generation and harness innovative financing mechanisms. Chapter 4 provides insights on how cities can diversify their economies and expand their fiscal opportunities. Cities can also pay to extend basic services and infrastructure to marginalized communities by tapping into fees paid by the rich. For instance, in Ouagadougou, Burkina Faso, the municipality uses fees paid by high-income households to improve wastewater infrastructure and support safe on-site sanitation for low-income households.137 Cities should also develop appropriate incentive schemes to engage with the private sector and underserved markets in order to adopt new financing mechanisms that can fund the projects cities need most urgently. For cities to mobilize innovative revenue sources, they will require fiscal autonomy within an effective decentralized framework.
Cities do not exist in isolation; those in poor countries lack the capacity, jurisdiction and resources to implement these bold and transformative measures. The transformative power of cities should be strengthened through a sustained, shared vision among diverse local stakeholder groups, including
Figure 3.14. The A, B, C and D of urban social protection design
representatives of international or multilateral agencies operating locally. A governance challenge facing urbanspecific social protection is that the New Urban Agenda devolves much of the responsibility for delivering services to local governments, while social protection is usually implemented at a national level. A multilevel governance approach is therefore crucial for the implementation of urban social protection. National governments should promote policies and institutional reforms that enable the fiscal capacities of cities to implement these ambitious transformative measures.138 Additionally, the design and implementation of social protection programmes and policies should meet specific urban needs in a coordinated national protection system.139
Political marketing is critical for successful urban social protection. It is important to frame social protection within an optimistic urban development narrative to facilitate policy uptake in the future. Policymakers at the city and subnational levels are sometimes sceptical about cash transfers or other forms of social protection in urban areas. Proponents of urban social protection programmes must address opposing views such as concerns that these programmes will create a dependent class disincentivized to work and induce urban congestion by encouraging migration to cities. Such biases pose a key challenge for the institutionalization of urban social protection programmes. Thus, it is important to frame these policy measures differently. For example, designating social protections as part of a broader suite of urban public works can draw support from local political leaders.140
Successful urban social protection programmes target key constituencies, but such efforts must be evidence driven to reach the most vulnerable urban populations. Targeting eligible urban populations raises challenges that are often not present in rural areas. Geographical and categorical targeting can be complicated by the varying spatial dimensions of urban poverty and inequalities, and lack of current information on the spatial distribution of poverty. The poor are usually clustered in specific geographical areas in some cities and widely dispersed in others. Local governments should identify so-called “pockets of poverty” so that geographical targeting becomes effective in reaching the most vulnerable populations.141
Cities cannot adequately address challenges that are poorly understood when they have limited data on the needs, priorities and vulnerabilities of the local population. These
data gaps often lead to poorly designed and ineffective policy responses. Cities should utilize new technologies, such as satellite imagery and geospatial mapping, for better and more nuanced local insights on poverty and inequality.
Social protection systems are most likely to deliver on their transformative potential if they are rooted in foundations of human rights.142 Adequate legal and institutional frameworks help social protection to be seen as an inherent social entitlement or right, rather than as mere charity, for the most vulnerable populations. A rights-based approach to social protection that follows two basic principles is important. First, universalize social assistance to highly vulnerable urban populations; and second, universalize social protection insurance to all workers including those working informally. For example, Austria’s comprehensive system of social security, which includes both contributory and noncontributory social protection programmes, is rooted in international and regional human rights instruments. Austria considers social policy “a key instrument in tacking poverty and improving chances in life.”143
3.10.8. Mainstreaming social policy objectives into national and local policies and plans
The design and reform of social protection programmes should be complemented with comprehensive review of macroeconomic policies to mainstream socioeconomic objectives such as urban poverty and inequality reduction into city development plans and policies. Until recently, urban poverty and inequality have hardly featured in the macroeconomic policy of many developing countries. Governments should have poverty reduction and economic development plans that set priorities for cities. Furthermore, cities should strengthen the link between urban policy and social protection; for instance, most of the risks faced by informal sector workers stem from their exclusion in urban development policies and plans.
This chapter has shown that poverty and inequality could become persistent features of the future of cities in both developed and developing countries if governments and stakeholders at all levels do not take decisive actions. The COVID-19 pandemic laid bare the structural inequalities inherent in urban areas, exacerbated poverty, exposed
hidden pockets of poverty, amplified existing vulnerabilities and created new ones and in ways that have placed additional burden on already overstretched local governments, especially in developing countries. The impacts of the pandemic were severely devastating for the marginalized and most vulnerable groups including the homeless, indigenous peoples, refugees and migrants and internally displaced persons, slum dwellers and those working in the informal economy.
Whether urban poverty and inequality will become entrenched and pervasive features of cities will undoubtedly be determined by decisions and actions taken by city leaders today. Without urgent and transformative policy action at all levels, the current situation will only worsen. The long-term costs of each incremental policy choice may not be clear, but each decision could shape the future of cities for generations to come. Wrong decisions by city leaders could entrench poverty, deny opportunity for millions and widen urban disparities in ways that will become increasingly difficult to reverse or rectify.
For inclusive and equitable urban futures to be realized, the chapter emphasized the following key policy areas:


Adoption of a multidimensional approach to addressing urban poverty and inequality through investing in both hard and soft infrastructure can address the multiple spatial, social and economic barriers that lead to exclusion and marginalization.


Extending infrastructure and basic services to underserved communities can be a catalyst for inclusive and equitable urban futures.
Recognizing and supporting informal sector workers through tailored social protection programmes and responsive urban planning and policies is critical for tackling poverty and inequality.
Inclusive and gender transformative approaches are urgent for building equitable urban futures.


Urban sensitive social protection is a potentially powerful policy tool for redistributing wealth and addressing poverty and inequalities.


Place-based interventions can build the resilience of “urban weak spots” such as slums and informal settlements.
The New Urban Agenda provides a framework for all facets of sustainable urbanization to promote equality, welfare and shared prosperity. Cities should mainstream these commitments in their local development plans with deliberate focus on addressing urban poverty and inequality. Eradicating poverty and reducing inequality in all forms remain a cornerstone to ensure that cities are better prepared for the next crisis.
1. Bandaukoetal,2021.
2. UN-Habitat,2018c.
UN-Habitat,2020a.
4. UN-Habitat,2020a;UNDESA,2020.
5. UNDESA,2020b.
Khan,2020.
7. Bandaukoetal,2022a,Asystematic reviewofgatedcommunities...
Bandaukoetal,2022b.Theysay theseareplacesforcriminals...
Serin,2019.
WorldBank,2018a.
Sachsetal,2021.
Hughesetal,2021.
Hughesetal,2021.
Lakneretal,2020.
UNDPandOxfordPovertyand HumanDevelopmentInitiative,2021.
UNDPandOxfordPovertyand HumanDevelopmentInitiative,2020.
UNDPandOxfordPovertyand HumanDevelopmentInitiative,2020.
WorldBank,2020b.
Nguyenetal,2020.
Lakneretal,2020.
Sanchez-Paramo,2020.
UnitedNations,2020d.
Gradínetal,2021.
Sánchez-Ancochea,2020.
Oxfam,2021.
UnitedNations,2020d.
Gradínetal,2021.
WorldBank,2022c.
Fisher-Post,2020.
Lord,2020.
Khan,2020.
JeanClaude,2020.
Mahendraetal,2021.
UNICEF,2020.
35. UNICEF,2020.
36. Chilkoti,2021.
37. FundforPeace,2021
38. UN-Habitat,2020a.
39. WorldBank,2018a.
40. WorldDataLab,2022.
41. Wangetal,2020.
42. Kidokoroetal,2021.
43. Moloney,2020.
44. ECLAC,2021.
45. Muggah,2018.
46. UN-Habitat,2020a.
47. UN-Habitat,2020a.
48. Arimah,2010.
49. WorldBank,2018a.
50. Bandaukoetal,2022c.
51. ElgendyandAbaza,2020.
52. CitiesAlliance,2022.
53. DachagaanddeVries,2021;World Bank,2020c.
54. HabitatforHumanityInternational, 2021.
55. Mahendraetal,2021.
56. Mahendraetal,2021.
57. Mutindaetal,2020.
58. ILO,2018.
59. ILO,2020.
60. ILO,2021b.
61. MuggahandFlorida,2020.
62. Akteretal,2021.
63. WorldBank,2020d. 64. Mahendraetal,2021.
65. Chuetal,2019.
66. Byersetal,2018.
67. Bangaloreetal,2019.
68. CitiesAlliance,2021c.
69. UnitedNations2021b.
70. UN-Habitat,2021a.
71. UN-Habitat,2021a.
72. Khan,2020. 73. LallandWahba,2020. 74. MackandWrase,2017.
75. MackandWrase,2017.
76. SchinnerlandGreiling,2019. 77. SchinnerlandGreiling,2019. 78. TribunaEconomica,2019. 79. Maley,2019.
80. UN-Habitat,2020a. 81. UN-Habitat,2020a. 82. Sánchez-Ancochea,2020. 83. UN-Habitat,2020a. 84. UNICEF,2020. 85. ShabanandAboli,2021. 86. Mahendraetal,2021. 87. UN-Habitat,2020a. 88. UN-Habitat,2021a. 89. Armahetal,2018. 90. CitiesAlliance,2021a. 91. Mahendraetal,2021. 92. Mahendraetal,2021. 93. Mahendraetal,2021. 94. Mahendraetal,2021. 95. OECD,2016. 96. Bach,2020. 97. Poethigetal,2018. 98. JointResearchCentre,2019. 99. JointResearchCentre,2019. 100. Haandrikmanetal.,2021. 101. LanzaandDeMartino,2022. 102. UN-Habitat,2021a. 103. Mahendraetal,2021. 104. Mahendraetal,2021. 105. UNESCO,2016. 106. WorldBank,2020c. 107. Mahendraetal,2021. 108. ChenandBeard,2018. 109. Mahendraetal,2021. 110. SverdlikandWalnycki,2021.
111. SverdlikandWalnycki,2021. 112. DasandKing,2019. 113. King,etal,2017.
114. CommunityOrganizations DevelopmentInstitute,2018. 115. Mahendraetal,2021. 116. UN-Habitat,2021a. 117. UNDESA,2018b. 118. ResilienceandInnovationLearning Hub,2020. 119. CitiesAlliance,2021b. 120. UN-Habitat,2021a. 121. Devereux,2021. 122. Cuestaetal,2021. 123. Cuestaetal,2021. 124. Cuestaetal,2021. 125. WFP,2020. 126. Mahendraetal,2021. 127. Watt,2017. 128. Triveno,2016. 129. Bredenoordetal,2014. 130. Mahendraetal,2021. 131. Kingetal,2017. 132. Mahendraetal,2021. 133. FeltensteinandDalta,2020. 134. Mitlinetal,2019. 135. Gentilinietal,2021. 136. WorldBank,2021a. 137. Mahendraetal,2021. 138. Annan-Aggreyetal,2021 139. Gentilini,2015. 140. Gentilinietal,2021. 141. Cuestaetal,2021. 142. UNRISD,2016. 143. FederalMinistryofLabour,Social AffairsandConsumerProtection, 2014.
 Bangladesh, Dhaka, BRAC, Bijoy Sarani Railway Slum, ©UN-Habitat/Kirsten Milhahn

1. Future shocks that significantly impact urban economies are imminent. However, there are disparities in cities’ resilience to face such shocks, with some more prepared than others.
2. The informal economy is still and will continue to be vibrant economic force in urban areas of developing countries. The sector must therefore be recognized and supported as a legitimate contributor to urban economies through a wide range of inclusive policies and targeted programmes.
3. Well-planned and managed urbanization is a transformative force towards sustainable and inclusive growth in the future of cities.
4. The COVID-19 pandemic has unleashed an unprecedented crisis resulting in massive job losses, shrinking local revenues and contraction of urban economic growth. This experience demonstrates the urgency of building resilient urban economies for the future.
5. Cities in developing countries are experiencing rapid urbanization without structural transformation, thus failing to reap productivity gains, which make them highly vulnerable to future shocks.

1. Cities should prioritize economic diversification as a critical pillar for building resilient urban economies and productive urban futures in line with the New Urban Agenda.
2. Sustainable urban and territorial planning supported with effective governance structures is critical for building resilient urban economies and productive urban futures.
3. Urban economies are more productive in peaceful and stable societies.
4. Governments should implement targeted interventions such as tailored social safety nets to strengthen the capabilities of marginalized groups.
5. Sustainable and innovative municipal finance are fundamental for optimistic urban futures.
Cities are significant accelerators of economic growth, contributing more than 80 per cent of global gross domestic product (GDP). Due to agglomeration effects and economies of scale, cities generate substantial economic activity and wealth, with tangible benefits for urban residents. For instance, in Africa, one can earn as much as 23 per cent more in cities than in rural areas.1 This kind of income boost is a clear pointer that, if well-managed, urbanization can be a transformative force for sustainable growth that increases the productivity of cities and drives local economic activity.
The New Urban Agenda encourages governments to prioritize sustainable and inclusive urban economies by leveraging the benefits associated with well-planned urbanization processes.2 The NUA also envisages cities that are adequately prepared to meet the challenges and opportunities of present and future; cities that generate inclusive and sustainable economic growth, including recognition of the informal economy.3 Moreover, SDG 8 calls for nations to pursue inclusive and sustainable economic growth as well as employment and decent work for all, trends that will be driven by outcomes in urban areas. These calls to action from the global development agenda show how urban economic prosperity is a pillar of achieving the ambitions set out in the SDGs and the NUA, as well as helping the world recover from the economic crisis caused by the COVID-19 pandemic.
Historically, cities have always been vulnerable to economic shocks and stresses. The global financial crisis of 2008–2009 impacted cities by reducing demand for manufactured goods and exports, worsening unemployment, disrupting housing markets, reducing public revenue and overall contracting local economies.4 But that crisis pales in comparison to the current pandemic; the COVID-19 crisis has unleashed an unprecedented stress test on urban economies, even highly competitive ones. Melbourne, Australia, for example, is projected to see a cumulative reduction in gross product of up to AU$110 billion and stifled job growth from the onset of the pandemic to 2024, with up to 79,000 fewer jobs created than pre-COVID forecasts.5
The economic impact of the pandemic is reverberating across regions. For instance, before the pandemic, per capita GDP in the Middle East and North Africa (MENA) region was estimated to be US$14,000, but this figure dropped to US$13,000 in 2020. Estimates show that regional economies in MENA could take until 2024 or 2025 to bounce back to pre-pandemic levels,6 with cities being the hardest hit. In Europe, the regional economy contracted by 5.9 per cent in 2020.7 In England and Wales, for example, urban areas could have accounted for 60.4 per cent of the total job losses due to pandemic-induced economic shocks.8
The economic impact of the pandemic has been variegated across the world owing to differences in the resilience of urban economies, economic structure of different urban areas, the fiscal health of various levels of government and social protection measures, among others. In developing regions, workers in the informal economy have borne the brunt of economic contraction and massive job losses, complicating their ability to rebuild their livelihoods. In developed countries, the pandemic’s economic impact disproportionately affected marginalized groups such as minorities, migrants, indigenous peoples and the homeless, among others (Chapters 1 and 3). For example, migrants in European urban economies work with limited job security and without legal status, making them vulnerable to income losses in times of crises, especially sectors in which migrants were overrepresented.9
the COVID-19 crisis has unleashed an unprecedented stress test on urban economies, even highly competitive ones

The pandemic also inflicted strain on the fiscal health of cities and countries. Globally, local governments were expected to have 15 to 25 per cent less revenues by 2021.10 With weakened fiscal capacity and growing pressure on public finances, local governments may struggle to invest in key infrastructure and services—critical pillars for thriving urban economies and productive urban futures. Additionally, the pandemic has not only slowed down investment into and progress towards SDG 8 on decent work and economic growth, it has also left countries grappling with inflation well above their monetary policy targets.11 The tightening of global financing conditions in the face of rising inflation is projected to put more countries at risk of debt distress, furtherconstrainingtheirfiscalspaceandimpedingeconomic growth. Already, current estimates indicate that 60 per cent of least developed and other low-income countries being at high risk of, or in, debt distress.12
As the world transcends the pandemic, the inflationary pressures have been exacerbated by both ongoing global supply chain disruptions and the war in Ukraine. Besides
massive loss of life and displacement of persons, the conflict in Ukraine has further increased the ongoing disruptions to global logistics and supply chains. Additionally, since the region is a significant contributor to global food and energy supplies, the conflict is also shaking energy markets— driving up oil and fuel prices globally—and worsening food insecurity, increasing further uncertainty in the global economy already battered by COVID-19 crisis.13
The World Cities Report 2020 highlights how the COVID-19 pandemic provides an opportunity for policymakers to reimagine how cities can build the resilience of their urban economies to reduce their vulnerability to future shocks and stresses. Without concerted efforts at all levels of government to manage the COVID-19 crisis and recovery, the pandemic would continue to undermine the economic structures of cities and increase the level of risk aversion among businesses anddepressurbaninvestmentinthelongrun.14 Thepandemic and the emerging shocks could set the productivity of cities on a downward spiral with dire consequences on the collective vision of inclusive, equitable, resilient and productive urban futures. The multiple impacts of the recent shocks on urban economies demonstrate the urgency of investing in integrated resilient interventions, taking into account the economic needs of most vulnerable groups.
This chapter explores the pathways to resilient urban economies and productive urban futures. It analyses how the urban economy can be strengthened to withstand future shocks and crises, while examining how the urban economy can be fully fit for purpose to withstand these shocks. Additionally, the chapter discusses new innovative sources of revenue that cities can leverage for sustainable urban futures. Finally, the chapter explores the different ways city authorities can support the informal sector to achieve inclusive growth. As a prelude, the chapter introduces the concept of urban economic resilience, including its strategic pillars and how these relate to both cities of developed and developing regions. The state of urban economies in both developing and developed regions is then discussed, including implications for the future of cities. The chapter ends by discussing the transformative pathways towards resilient urban economies and productive urban futures.
Urban economic resilience refers to “the capacity and related capabilities of cities or urban communities to plan for, anticipate negative shocks, including long-term stresses, to their economies, allocate, reallocate, and mobilize resources to withstand those shocks, recover from the shocks, and rebuild at least to pre-crisis levels, while placing their economies on the path to sustainable economic growth and simultaneously strengthening their capacity to deal with any future shocks” (Figure 4.1). 15 A resilient urban economy must be able to withstand and recover from shocks such as financial and economic crises (Chapter 10).
Cities with strong economic resilience usually have the resources and institutional capacity to implement adaptive changes and diversifying into new economic sectors, thereby makingtheirlocaleconomiesagile.16 Existingevidencesuggests that economic diversity can contribute to urban economic resiliencewhilesectoralspecializationandexportconcentration are likely to be more vulnerable to economic shocks.17 The COVID-19 pandemic has exposed these realities; specialized
Cities with strong economic resilience usually have the resources and institutional capacity to implement adaptive changes and diversifying into new economic sectors, thereby making their local economies agile
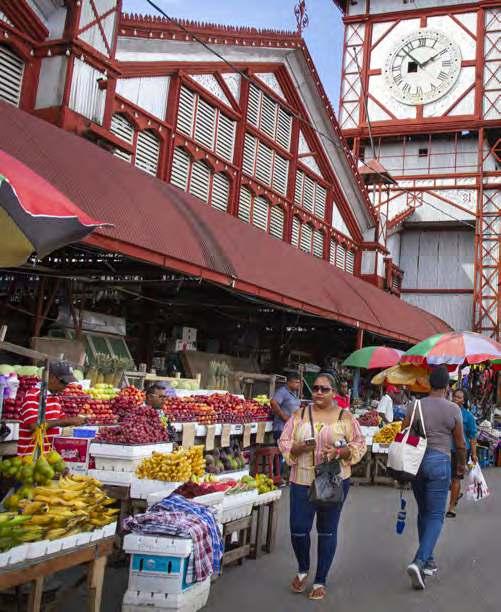
Source:
urban economies such as those who relied more on tourism and export markets were severely impacted due to restrictions in movement and supply chain disruptions. On the other hand, diversified urban economies capitalized on their innovation capacities and creative human capital in order to adapt to the new economic order necessitated by the pandemic.
As indicated in Figure 4.1, the overall objective of urban economic resilience is to achieve balanced, inclusive, and sustainable development as measured by indicators such as gross city product (GCP) growth, labour force participation rate, inequality rates and per capita gross city product and
per capita revenue. Ultimately, an increase in GCP per capita, labour force participation rates and own source revenue per capita coupled with a decrease in inequality will improve the well-being of urban residents.
Urban economic resilience is also multidimensional: its key pillars include business environment, economic governance, labour market conditions and financial arrangements (Figure 4.2). Business environment and economic governance refer to urban systems and describe, respectively, conditions for business operations (both public and private), the structure of local economies, as well as rules and regulations that govern the activities of businesses. Labour market conditions and financial arrangements refer to factor markets (labour and capital, respectively) in urban areas. Together these four pillars are critical for building resilient urban economies and productive urban futures, but their manifestation varies geographically.
Entrepreneurship
Source: UN-Habitat and UNCDF, 2021.
Debt markets
Equity markets
Government financing
Financial technology (fintech)
Complementary financing mechanisms

Wages and working hours
Mobility
in labour markets
Ease of doing business
Resilience in development planning
economic crisis
Macroeconomic and urban economies
Theinformaleconomyandsmallandmedium-sizedenterprises (SMEs) constitute a key part of the business environment in developing country cities. On the other hand, the business environment in cities of developed countries is mostly characterized by larger firms in the knowledge industries, advanced producer services, advanced manufacturing sectors and creative industries, among others. When compared to developingcountries,urbaneconomiesindevelopedcountries are also backed by diverse labour market conditions, with highly skilled workers that can easily adapt to changes in local economies. These characteristics create favourable conditions for stronger agglomeration economies and productivity enhancing gains—making developed cities more resilient to shocks than their counterparts in developing regions.
Developed and developing country cities vary significantly in terms of the mechanics of their economic governance. For instance,mostcitiesindevelopedcountriesusuallyhaveexplicit economic development plans, policies and strategies, which are oftenexecuted.Incomparison,mostcitiesindevelopingregions
are operating in a context where urban policy formulation needs improvement and implementation remains a hurdle. This difference in policy contexts is reflected in disproportionate experiences in responding to shocks and channelling resources towards resilient urban economies. Compared with developing countries, developed country cities have vibrant debt, equity and capital markets, which facilitate access to reliable financing instruments to fund urban programs. As illustrated in Figure 4.2, infrastructure and connectivity systems are central to facilitate the functioning of the other four dimensions of the urban economy under stressful conditions. In building urban economic resilience, these key pillars should be considered in an integrated and holistic way.
infrastructure and connectivity systems are central to facilitate the functioning of the other four dimensions of the urban economy under stressful conditions
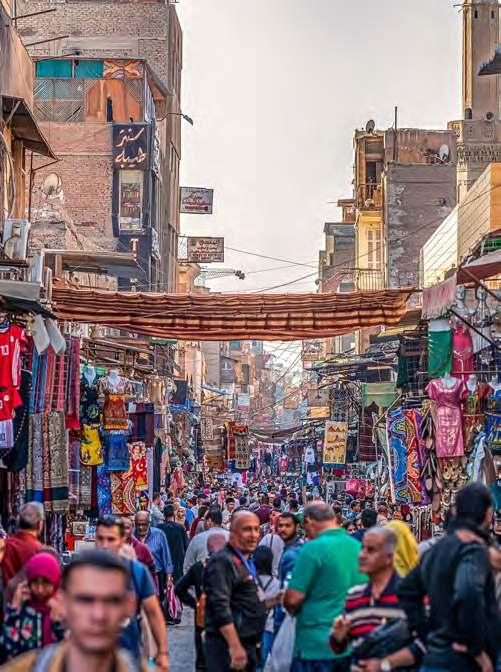
This section examines the state of urban economies in cities of developing regions, with particular focus on (i) structure of urban economies, (ii) the structure of the informal economy and its contributions, (iii) the nexus between urban planning and urban economies, (iv) dynamics of unbalanced urban and territorial economic development and (v) municipal financing, among other aspects of the economic well-being of cities. The implications of these issues for urban economic resilience and productive urban futures are highlighted, as are areas requiring specific policy attention moving forward.
Countrieswithsimilarurbanizationtrendsmightnevertheless have varying urban economic structures.18 Economies of agglomeration are stronger in the manufacturing and highskilled service sectors, which exist in most Eastern Asian and Latin American cities but are less common in Sub-Saharan Africa (SSA) or the Middle East and North Africa (MENA).19 In Eastern Asia, some countries such as China, Malaysia and Thailand have been relatively successful in leveraging the benefits of urbanization by generating higher productivity jobs (Figure 4.3).
Figure 4.4: Urbanization without economic transformation in Africa
of


Urbanization rate, percent of population
Sub-Saharan Africa, 2019 All excluding SSA, 2019 Kenya, 1985-2019 South Africa
Fitted values
Fitted values Nigeria 1985-2019
Source: Grover et al, 2022.
In Sub-Saharan Africa, urban economies tend to be undiversified with a limited manufacturing sector and small firmsizes.Somecountriesareexperiencingrapidurbanization without structural transformation of their city economies, which amplifies their vulnerabilities to future shocks. These dynamics have reduced the ability of governments to promote vibrant manufacturing as a driver of sustainable economic growth.20 Mauritania, for instance, despite being one of the most urbanized countries in the region, exhibits the possibility of a weak link between urbanization and growth; the country’s economy remains largely reliant on natural resources. In this so-called “incomplete urbanization” scenario, the process of urbanization is not commensurate with parallel increases in GDP per capita.21 Simply put, Mauritania has not benefitted from the economic dividends that typically accompany urban growth. Similarly, Nigeria and South Africa have seen their shares of manufacturing in GDP decline even while they experienced rapid urbanization (Figure 4.4).22
Despite urbanization being a key feature of structural change, in most African cities, a majority of the urban population currently does not have access to productive jobs.23 In Mozambique, Sierra Leone and Tanzania, at least 30 per cent of the urban population are still employed in agriculture.24 African cities do not fully reap the benefits
of agglomeration economies and specialize primarily in producing non-tradable goods and services.25 Notably, the share of tradable commodities in Asian cities is comparably higher at about 70 per cent, which is 20 percentage points higher than that of African cities (Figure 4.5).26
The dynamics in Figure 4.5 also play out in so-called “consumption cities” where a large share of urban workers is employed in non-tradable service sectors (e.g. commerce, transport and government services).27 Because of their economic structure, consumption cities do not generate significant productivity gains and knowledge spillovers, making them highly vulnerable to future shocks.28 These dynamics discourage firms and workers from moving to cities where there is no guarantee of enjoying productivityenhancingbenefits.29 Ifthecurrenttrajectoryofurbanization without structural transformation continues, the prospects for resilient urban economies and productive urban futures
Because of their economic structure, consumption cities do not generate significant productivity gains and knowledge spillovers, making them highly vulnerable to future shocks
Sub-Saharan
Gaborone(Botswana) DaresSalaam(Tanzania) Kampala(Uganda) Kigali(Rwanda) Bamako(Mali) Accra(Ghana) Nouakchott(Mauritania) Nairobi(Kenya) Dakar(Senegal) AddisAbaba(Ethiopia) Kinshasa(DRC) Lagos(Nigeria) Mombasa(Kenya) Lusaka(Zambia) Harare(Zimbabwe) Middle East and North Africa Tunis(Tunisia) Beirut(Lebanon) Amman(Jordan) Cairo(Egypt) Latin America LaPaz(Bolivia) Asuncion(Paraguay) Cordoba(Argentina) Medellin(Colombia) Bogota(Colombia) BuenosAires(Argentina) Lima(Peru) Asia Yangon(Myanmar) Bangkok(Thailand) ZhengzhouCity(China) Dhaka(Bangladesh) ShenzhenCity(China) Delhi(India) Chittagong(Bangladesh)
in developing countries could be significantly inhibited. In Southern Asia, for instance, limited economic diversification as well as poorly organized labour markets are among the key factors that made urban economies highly vulnerable to economic crisis induced by the COVID-19 pandemic. In this region, economic diversification is low or minimal, with near single-industry economies especially susceptible to supply and demand shocks in countries like Bangladesh (garments), the Islamic Republic of Iran (oil) and Maldives (tourism).
Moving forward, there is an urgent need for various levels of governments to rethink their industrial and growth policies soastopromotethedevelopmentofmorecomplex,high-skill and high value-added sectors to build the resilience of urban
economies to future shocks. The MENA region, for example, has longstanding economic structural problems such as low GDP growth, low employment especially among women and youth, low human capital index, a large informal sector, weak investment climate and poor amounts of foreign direct investment.31 These problems have been amplified by the pandemic and are key impediments to the long-term growth of urban economies. In some parts of the MENA region, urban economies face multiple vulnerabilities beyond low and minimal diversification. These vulnerabilities include high-intensity conflict in Libya and Syria, medium-intensity conflict in Iraq and Yemen, and social fragility in Lebanon, the West Bank and Gaza, among others.
Conflicts in this region, as well as other regions across the world, not only result in loss of life, they destroy local economies. The continuation of these conflicts does not augur well for urban economies and productive urban futures. Not only will infrastructure be destroyed, but supply chains will also be continuously disrupted. By implication, urban competitiveness will suffer, and any prospects of domestic and foreign investment will fade. This ultimately will create a vicious cycle where cities in conflict-affected regions will continue to experience disintegration of their economic structure, which has negative repercussions on productive urban futures.
As pointed out in the World Cities Report 2020, the informal economy has become the lifeblood of many cities in developing countries. Indeed, 61.2 per cent of global employment is in the informal sector.33 In emerging market and developing economies (EMDEs), the informal sector contributes about one-third of GDP and more than 70 per cent of employment.34 International Labour Organization (ILO) data shows that 85.8 per cent of employment in Africa is informal. In Asia and the Pacific as well as Arab States it constitutes 68 per cent of employment; in Americas, 40 per cent; and in Europe and Central Asia, 25.1 per cent. 35 The prevalence of informal employment is highest in urban areas of Africa (Figure 4.6 and Figure 4.7).
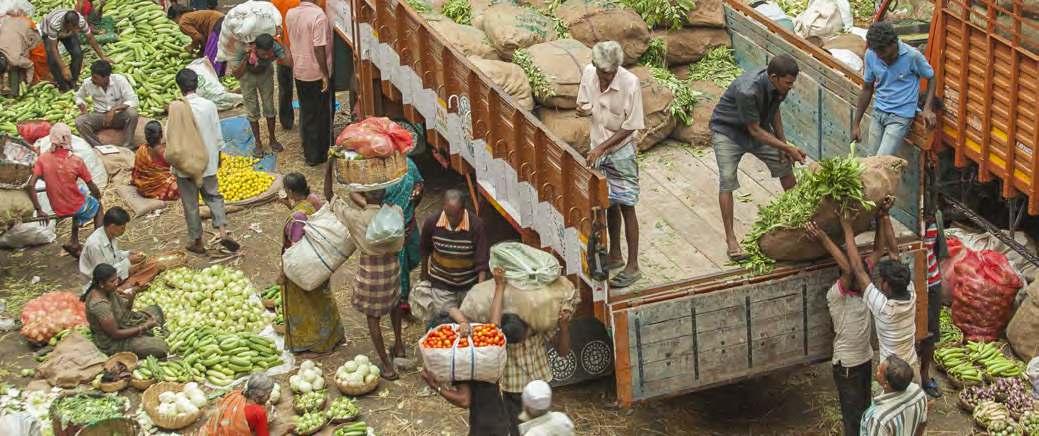
employment in total employment by area of residence
Informal workers from slums also make significant contributions to urban economies in developing countries. For instance, informal waste pickers, a majority of whom are slum dwellers, perform 50 to 100 per cent of waste collection in developing countries. As of 2014, waste pickers in South Africa saved municipalities between R300 million and R750 million per year by extending the life of landfills.36
The informal economy still faces structural impediments that affect its productivity. In most cities in developing countries, the informal sector is not recognized as a legitimate contributor to urban economies. Most cities in developing countries deploy exclusionary urban policies to penalize informal workers for their livelihood practices, especially those in public spaces like street vendors. Waste pickers are denied access to waste management contracts and their contribution to the urban economy is undervalued by city planners.37 The informal economy is almost always perceived
as a residual and low productivity sector, and hence receive little or no support in terms of access to infrastructure, finance, social protection systems and markets.
These multiple barriers constrain the productivity of informal workers despite their contribution to the livelihoods of the poor and urban economies. In Sub-Saharan Africa, for example, the productivity of informal firms is estimated to range from one-fifth to one-quarter that of formal firms.38 This disparity translates to precarious incomes and little contribution to urban economic activity. Informal workers also struggle to accrue adequate savings, thereby increasing their vulnerability to future shocks.
The COVID-19 pandemic has amplified the structural barriers confronting the informal economy, which could further undermine its productivity and contribute to worsening poverty (Chapter 3). Yet, in some cities the

In fragile and conflict-affected situations, the informal economy provides a dynamic and systemic response to the prevailing challenges as well as opportunities. For many informal workers such as fruit sellers and street food vendors, work continues despite the crises. However, the main challenge is surviving a highly volatile context riddled with urban violence that disrupts transport, supplies and markets.
Time and again, especially in fast-burn crises, a solidarity system of survival emerges in which barriers break down and communities unite to face a common threat. Humanitarian interventions often miss this adaptability, ingenuity and solidarity and thus undermine the potential for self-help, for example in early replacement of basic services lost during the crisis.
For informal workers, growth (e.g. transition to managing enterprises) requires more security, market stability and operating space so that capital investment in supplies and equipment is not wasted. This means rebuilding the complex networks that sustain informal workers and enable them to operate—such as suppliers, transport networks, mobile phones, links to middlemen, and relationships of trust and credit. Here flexibility to adopt blended livelihoods combining income streams from several jobs is critical, but action by local officials as well as security or aid agencies can disrupt these fragile networks. Such networks are also vulnerable to co-option and extortion by criminal gangs. Early intervention to prevent such coercion taking hold is critical.
Some informal enterprises and workers find capacity to thrive in the hostile business environment of crises. These include transport operators supplying aid goods; skilled reconstruction workers; and migrants, internally displaced persons or refugees with access to diaspora networks to support trade and investment. This phenomenon has been vital in the emergence of Somaliland. Refugees, however, face constraints when the legal frameworks in host countries do not support their right to work, condemning them to unofficial income-earning activities.
Lastly, development agencies that focus on economic reconstruction for formal businesses often miss the local economic development potential of the many smaller enterprises which flourish in post-conflict cities, despite unsupportive regulatory frameworks or hostile local government actions.
Source: UN-Habitat, 2019c.
informal economy does not exist in the shadows but rather constitutes the bulk of economic activity. Notably, in fragile and conflict-affected situations, it performs a vital labourabsorbing function through its ability to provide employment opportunities during crises (Box 4.1). Therefore, the challenge for policymakers is how to effectively harness this sector for building resilient urban economies that can withstand future shocks
As we move into the future, cities and subnational governments should implement policies and programs to support transition to formalization and create opportunities for decent and productive employment. Doing so will help achieve SDG 8 the provisions of the New Urban Agenda that call for harnessing the informal economy. Transition to formalization should be backed by tailored support measures suchasaccesstoaffordablefinance,marketsandinfrastructure to strengthen the resilience of informal enterprises and boost
their contribution to productive urban futures and urban economic resilience. Increased productivity of the informal economy could lead to better incomes and reduced poverty levels (Chapter 3). It is likely that the informal economy will expand significantly in the future, thus, urban policies should be developed with this reality in mind.
In fast-growing cities, current deficiencies in planning coupled with limited housing supply contribute to the massive expansion of highly crowded informal settlements that are underserved in terms of basic infrastructure and services. These institutionalized deprivations create vicious cycles of low economic growth, low tax revenue bases and subsequent perpetual decline in infrastructure investment and services due to inadequate revenue. African cities are often described as crowded, disconnected, and costly—the

infrastructure investments have not kept
nor have
For households and firms - high deter investors and trading partners, especially in regionally and workers’ high food, housing and transport costs increase labour costs to firms and thus reduce expected returns on investment.
Source:
“CDC dilemma” (Figure 4.8).39 African cities are 23 per cent more fragmented than Asian and Latin American cities,40 which increases the cost of infrastructure provision. Such cities become less competitive and struggle to attract both domestic and foreign investment.
As shown in Figure 4.8, poorly planned urbanization processes translate to a disconnect between the provision of infrastructure and residential concentrations, resulting in unreliable transport systems. This negatively affects the ability of cities to leverage agglomeration economies of scale.41
The CDC dilemma has a negative impact on urban economies due to limited accessibility of opportunities, including limited ability of residents and businesses to access markets, employment opportunities, healthcare (e.g. hospitals) and education (e.g. schools and universities). All of these amenities are critical to urban economic development.42 For example, heavy traffic congestion and informal transportation systems constrain accessibility to employment in Nairobi. Residents who rely on public transport (minibuses known as matatu) can only access 4 per cent of opportunities within a 30-minute timeframe, as compared with almost double that share (7 per cent) in Buenos Aires, Argentina.43 Once cities become crowded, they generate massive diseconomies of scale (Chapter 6). Similarly, in Southern Asian cities, poorly managed urbanization creates congestion costs coupled with increased pressure on land, housing and urban services.44
This kind of messy urbanization undermines the potential of powerful agglomeration economies to bring about
prosperity, which in turn undermines the drive towards productive urban futures. In some developing country cities, authorities have adopted strict land-use controls that limit opportunities for densification. Most African cities, for example, still retain regulatory standards passed on from the colonial era. 45 These land-use policies produce dysfunctional cities by encouraging sprawl rather than compact development.46 Chapter 2 already lays out the future scenarios of such growth and calls for such spatial growth should be anticipated with sound policies that promote compact development.
Taken collectively, these multiple dynamics create structural impediments for urban economic prosperity and inclusive growth as envisaged in the New Urban Agenda. These conditions undermine the economic productivity and competitiveness of cities, making them unattractive to both domestic and foreign investment. For rapidly growing cities in Asia and Latin America, broader economic policies should provide right incentives for productive and sustainable growth. For example, urban and territorial planning as well as investments in infrastructure should be linked with the objectives of structural transformation (Box 4.2).
messy urbanization undermines the potential of powerful agglomeration economies to bring about prosperity, which in turn undermines the drive towards productive urban futures

The global view on financing development in low- and medium-income countries is changing, with the focus moving from dispersed grants to supporting major investment in key infrastructure. Flagship programmes that take this new approach include China’s Belt and Road Initiative, the European Union (EU)’s Global Gateway, and the Build Back Better World (B3W) initiative of the US and Group of Seven. This shift inevitably raises question about the role of cities and their development in these large infrastructure investment programmes given the territorial dimension of development that underpins any kind of structural transformation in low- and medium-income countries. Linking investment in regional and urban infrastructure to structural transformation of national economies is an important prerequisite to sustainable investment.47 The EU Global Gateway strategy, for instance, has a strong focus on infrastructure investment that enhances connectivity at different territorial scales. Such a strategy views agglomeration economies as fundamental factors that can kickstart a steady and sustainable process of economic development while also aiming to reduce negative environmental issues and generate higher standards of living for the population.
UN-Habitat, as the urban focal point within the United Nations system, promotes urbanization as a vehicle for economic development for a country, with a clear emphasis that investment in urban infrastructure and services underpins economic transformation. In this regard, pursuing investment in urban development coupled with sound territorial planning as a mechanism to achieve structural economic transformation can lead to more investment synergies in various sectors of economy. Territorial analysis of planned investment in infrastructure and urban development can help achieve coherence of impact for large and medium-size investment projects.
An example of where the United Nations can add value through the territorial dimension of economic transformation is the Territorial-Industrial Atlas for Investment Attraction: High-potential industries in Mexico prepared by UN-Habitat and the United Nations Industrial Development Organization in partnership with the Government of Mexico.48 This novel approach to attract foreign investment is founded on urban and regional planning perspectives.
Lastly, achieving synergies for investments and ensuring coherence of impact can be underpinned by better coordination of public revenue and expenditure (e.g. investing and operating infrastructure) at the national and sub-national levels and including external finance in the complete system of public finance.49
Source: UN-Habitat Office for European Institutions Brussels.
The future of urban economies in developing country cities will depend on the policy decisions taken today. Looking ahead, policymakers at various levels of government must counter the negative impacts of poorly planned and managed urbanizationandsettheircitiestowardseconomicprosperity. If the current unsustainable trends persist, developing countries will continue experiencing underleveraged urbanization and their cities will potentially remain locked in congestion pressures for decades to come. Therefore, national, regional and local governments should ensure that connectivity is enhanced at the city and regional level to alleviate both current and future congestion pressures and facilitate the exploitation of agglomeration economies, thereby enabling the tremendous untapped potential of cities to be realized.
4.2.4. The dilemma of unbalanced urban and territorial economic prosperity
Whilemegacitieshavelongdominatedtheurbanconversation and will continue to play a prominent economic role, most of the future urban growth will occur in small, intermediate and secondary cities.50 However, economic growth, infrastructure investments and employment opportunities tend to be concentrated in large metropolitan areas. This so-called “big city bias” and winner-takes-all urbanism propels large places to grow economically faster than smaller places, which concentrates development in a small footprint as opposed to allowing for more diffused spatial development across territories. Such asymmetrical development is compounding the urban spatial divide, especially regarding secondary cities—whose population often face multiple deprivations relating to income, employment, health, water,
Poor urban connectivity: poor road and ICT infrastructure
Governance and institutional deficiencies:
Low human capital: the lack of highly skilled workforce undermines the competitiveness of secondary cities
Weak urban economies: due to lack of economic diversity and poor competitive advantage
Low-priority of infrastructure development by governments: poor social, physical, and economic infrastructure making them unattractive to investment
sanitation and housing (Chapter 3). For instance, in Sri Lanka, both Colombo and the Western Region Megapolis are better connected and have stronger and more diversified economies as compared with other urban centres, which results in regional disparities in economic development.51
Figure 4.9 illustrates the dynamics of asymmetrical development in secondary and intermediate cities in developing countries. Because of “big city bias,” small, secondaryandintermediateurbanareashaveweakcapacities to develop and implement policies on urban economic resilience. Governments do not prioritize investments in infrastructure and services (e.g. water, sanitation, energy, transport and housing) in these small, intermediate and secondary cities. The lack of core infrastructure and services undermine the potential comparative advantage of secondary cities to attract investment and retain skilled human capital. This disinvestment makes their urban economies more easily succumb to future shocks and stresses.
The message emerging from these dynamics is that infrastructure investments and urban planning interventions should not be biased towards megacities.52 Instead, governments must pay attention to small and secondary cities that might be left behind or otherwise ignored in national and regional economic development strategies.
Government at all levels should revamp local infrastructure and services in small and intermediate cities in order to match the future capabilities needed from domestic and foreign firms. Doing so is a response to the call by the New Urban Agenda to support the implementation of balanced territorial development policies, including strengthening the role of small and intermediate cities in urban economic development.53
governments must pay attention to small and secondary cities that might be left behind or otherwise ignored in national and regional economic development strategies


Local and regional governments require significant amounts of financial resources to support their urban economies. In Africa and Asia, estimates suggest that over the next 30 years investments of around 5 per cent of GDP will be required to meet the demand for infrastructure, housing and public services to support rapidly growing urban populations.54 At the same, most city governments in developing regions face severe barriers to financing key infrastructure investments in line with SDGs, particularly doing so in an inclusive
manner that reaches the most vulnerable urban populations (Chapters 6 and 8).55 Managing own-source revenue systems indevelopingcountriesremainamajorchallenge;low-income countries generate around US$12 per capita per year from own-source revenue in local governments, compared with US$2,944percapitaperyearinhigh-incomecountries(Figure 4.10: Own source revenue per capita of local governments by country income group (US$)). For example, Iwo, Nigeria; Lucena City, Philippines; and Pekalongan, Indonesia, raise about US$14, US$54 and US$101 per resident per year, respectively.56 Given the significant investments needed to build sustainable and resilient infrastructures, there is an urgent need to build adequate fiscal capacity.
City governments in developing regions largely rely on intergovernmental transfers, and to some degree their own internally generated revenue (e.g. property taxes, planning and licensing fees), in order to fund capital projects. Intergovernmental transfers account for 90 per cent of local revenues in Kenya, Tanzania, and Rwanda. This figure demonstrates very limited power and capacity by cities to collect their own revenues.57 Property taxes account for only 20 per cent of financial resources in developing countries.58
Trends across regions are a cause for concern with regards to sustainable urban finance. The tax base in Asia-Pacific cities continues to contract, which undermines the ability of city governments to invest in key urban infrastructure.59 In countries such as Afghanistan, Maldives and Nepal, the central government sets all local revenue rates,60 undermining the flexibility of municipalities to exploit the potential of their tax bases. In Pakistan, large cities can only mobilize 7 per cent of their financial resources from own-source revenues.61 Similarly, the collection of property taxes in Latin American countries is a paltry 0.3 per cent of GDP.62 Cities in developing countries also face constraints in accessing city-level debt as most lack the necessary revenue autonomy and capacity to
develop creditworthy projects. Currently, only 20 per cent of the largest 500 cities in developing countries are considered creditworthy, undermining their capacity to fund key urban infrastructure investments.63
The COVID-19 pandemic has significantly weakened the fiscal capacity of local governments in developing countries. For example, based on projections early in the pandemic, African cities were expected to lose 65 per cent of their local revenue.64 If current trends persist, the investment capacities of African cities could be severely devastated, undermining the ability of municipal governments to build resilient urban economies and productive urban futures. In Colombia, there was a 38 per cent nationwide decline in municipal property taxes in the first half of 2020.65 This unprecedented financial pressure on cities in developing countries may continue or deepen in the post-pandemic recovery phase. Without decisive action, these trends could potentially paralyze cities’ capacity to reactivate their economies towards productive urban futures.
Overall, effective urban financing in developing countries dependsonmorenuancedapproachestofiscaldecentralization, as well as the capacity of local governments to mobilize endogenous resources. Collaboration among various levels of government, even if fluid and negotiated, ensures more effective outcomes of investment in urban development.66 In this context, improving investment planning, strengthening local revenues, and coordinating national, local, and external financing are key policy streams helping improve effectiveness of public and private investment in urban development (Box 4.2). When planned responsibly and based on sound, but not necessarily exhaustive, cost/benefit analysis and supported by adequate regulations, the financing and development of infrastructure can be used as an engine for the development of institutions, policies, and capacities at all levels and across all sectors of governance in these countries.67
This section analyses the structure of urban economies in developed countries, highlighting both strengths and weaknesses and implications for the future of cities. Cities of developed countries have unique features: diversified urban economies, high urban productivity, ageing populations, high value-added sectors, technology driven industries and increased number of shrinking cities among others. The ways in which these characteristics shape the future of resilient urban economies and productive urban futures are discussed, as well as the state of financing for urban economies in developed countries.

Urban economies in developed countries are more equipped to bounce back after shocks, as currently witnessed in the case of the COVID-19 pandemic where many hard hit metropolitan areas are now once again showing strong economic indicators. This resiliency is because cities in developed countries have more diversified economic structures, stronger economic foundations, are more resourceful and can quickly deploy policy measures in partnership with national government to revamp their economy. Megacities such as New York, London, Sydney and Paris are primarily “production cities,” where most workers are employed in manufacturing or tradable services like finance, business services and creative industries. These cities generate significant productivity thereby putting them in a strong position to attract firms, people and resources.
cities in developed countries have more diversified economic structures, stronger economic foundations, are more resourceful and can quickly deploy policy measures
Overall, urban productivity—measured by the total GDP generated by industry and services divided by total urban population—is high in developed country cities, averaging US$50,000 per capita.68 Cities like New York and Los Angles, for example, are highly productive because they have larger metropolitan labour markets where workers have access to sizeable, more diversified pool of jobs while firms have access to a larger, more diversified pool of workers69 thus, maximizing agglomeration economies.
Large and more diversified labour markets enable firms to withstand both positive and negative shocks by quickly adjusting their labour profiles in light of economic changes. In the Canadian province of Ontario, large and more diversified metropolitan regions such as the Greater Toronto Area (GTA) have a strong economic base to withstand the impact of the failingtraditionalmanufacturingsector.70 CitiesintheGTAare alreadyembracingthenewwaveofcreativeandtechnology-led economies. In Australia, mid-sized towns have diversified their economies beyond their single industrial bases (e.g. mining and manufacturing) to reduce the vulnerability of their urban economies to shocks.71 During the global financial crisis of 2007–2008, major capital regions in Europe with diversified high-value functions were able to generate more, or at least lose fewer, jobs than their respective country averages,72 demonstrating agility and resilience to withstand and recover from economic shocks.
Faced with the COVID-19 crisis, European local and regional authorities exhibited varying degrees of vulnerability depending on their economic geographies and their ability to withstand external shocks
Faced with the COVID-19 crisis, European local and regional authorities exhibited varying degrees of vulnerability depending on their economic geographies and their ability to withstand external shocks. Sofia, Bulgaria, with its large share of services, especially in high-tech and trade, was more flexible and less affected by the pandemic-induced economic stress. Overall, unemployment remained below 10 per cent in large municipalities in the country because of opportunities for teleworking, largely supported by better information and technology (ICT) infrastructure.73 Although most cities in advanced economies are more diversified, there are regional variations. Tyrol and Salzburg, Austria, were significantly affected by the COVID-19 pandemic because their economies are specialized for the tourism industry. Similarly, in Finland, both large and smaller cities dependent on tourism had a comparable experience.74 These trends demonstrate that overdependence on a single economic sector could potentially set urban economies on a downward spiral in the event of economic shocks.
Advanced economies, especially those in Eastern Asia, Europe and North America, face the challenge of shrinking cities (see Chapter 2). Shrinking cities are characterized by

economic downturns and employment outflows, which leave them with predominantly ageing populations who are less adaptable to emerging economic trends.75 In such cities, jobs in different sectors such as traditional manufacturing and mining are disappearing76 because of deindustrialization, structural changes in urban economies and shifts in the global economy. For example, the relocation of automobile manufacturing firms to developing countries (e.g. Mexico) was a contributing factor to municipal bankruptcy in once booming manufacturing cities such as Detroit.77
Likewise, cities in Eastern Europe and Eastern Asia are shrinking due to a combination of multiple factors, including ageingpopulation,economicrestructuringanddecliningurban economies.78 In Australia, the loss of employment in mining townsleadstoadownwardspiralofmassiveoutmigrationfrom once booming mining towns.79 The loss of skills, knowledge and innovation from shrinking cities has dire consequences for the future of urban economies in these places.

Going forward, in order to encourage the “optimistic scenario” described in Chapter 1, urban leaders in shrinking cities should plan for future growth while anticipating shrinkage by deploying a combination of urban policy and investmentinstrumentstoreviveurbaneconomies,including embracing the creative and technology-based sectors. Economic diversification becomes urgent to save these places from becoming “ghost cities.” If cities continue to experience urban shrinkage without any remedial measures, future economic growth is bound to be curtailed in multiple ways. For example, a rise in vacant buildings reduces the capital value of real estate and creates a diminishing tax base.
Advanced countries usually have well-developed capital markets, where debt and equity financing instruments can be deployed to fund ambitious infrastructure projects80 and provide reliable basic services. Several municipalities have investment-grade credit ratings, typically linked to propertybased tax revenues. Cities in advanced economies already leverage debt. For example, the US municipal debt market is worth approximately US$4 trillion.81 High per capita incomes also mean that many infrastructure investments can generate revenues that enable cost recovery and sustained economic growth.
However,citiesindevelopedcountriesgrapplewithinvestment needs to replace ageing infrastructure like water and sewerage pipelines and new transport links, which often requires billions of dollars. Australia has invested sufficiently over the past several years to meet or exceed their infrastructure needs and will arguably be able to spend less going forward than they have in the past.82 Conversely, countries such as Germany, the UK and the US face major gaps between their current spending commitments and estimated needs.83 For instance, New York City has more than 1,000 miles of water pipe that are more than 100 years old.84
Despite their advanced economies, the impact of the COVID-19 pandemic on municipal revenues in developed countries has also been catastrophic. Local and regional authorities in the European Union have faced remarkable pressure on their budgets as they make substantial increases in expenditures to sustain their local economies (Table 4.1).
France Estimated net loss of revenue for all local and regional authorities was €5 billion (which constitutes 2.4 per cent of operating income). Municipalities suffered a sharp drop in tariff and tax revenues.
Germany In 2020, municipalities experienced €6 billion (5.7 per cent) loss in tax revenues compared to 2019; business tax dropped by €5 billion; user fees fell by €1.4 billion (8.8 per cent) in the first half of 2020.
Italy Estimated €8.4 billion of losses or 23 per cent of 2020 municipality revenues compared to 2019. The biggest loss, €3.5 billion, is from the Single City Tax covering property (-10 per cent) and waste tax (-23 per cent).
The Netherlands Municipal revenue losses were estimated to be €1.02 billion. About one-third of municipalities entered 2021 with negative budget balance having exhausted their reserves.
PolandIn 2020, large Polish cities experienced €2.4 billion drop in local revenue. Significant losses were experienced in tax revenues mainly from corporate and personal income taxes.
BulgariaOverall, total loss in Bulgarian municipality revenue in 2020–2022 would be 30 per cent compared to 2019. This corresponds to €519 million in 2020, €404 million in 2021 and €360 million in 2022.
Ireland The decline in local revenue was projected to be €228 million (6.4 per cent) of which €78 million was lost from parking charges and planning fees and €150 million from uncollectable commercial property taxes.
Source: Prepared based on data from European Union, 2021.
In the US, the pandemic triggered unprecedented damage to municipal fiscal health. For example, recent projections suggest that 411 Florida municipalities would lose US$5.1 billion from 2019 pre-pandemic levels in fiscal years 2021 through 2023.85 In 2020, nationwide estimates pointed to a gloomy picture in the US, where cities, towns and villages were projected to face a US$360 billion budget shortfall from 2020 through 2022.86 However, by mid-2021, some of the cities and states that were facing bankruptcy had cash surplus due federal relief funds.87 In Australia, Melbourne’s lost revenue due the COVID-19 pandemic for the period 2020–2021 is estimated to be AU$83 million.88
Cities with diverse revenue and economic structures have a better chance of withstanding external shocks than those that are less diverse in their revenue generating sources. For instance, in the US, cities with both vulnerable economic profiles (greater than 15 per cent share of employment in high-risk industries) and a tax structure that is highly reliant on elastic sources of own revenue (greater than 25 per cent share of general fund revenues) were more impacted by economic shocks compared to those with alternative economic and fiscal structures.89 With weakened fiscal capacity, various local governments cut investments in infrastructure and key urban services.
Looking ahead, it is critically important for cities and subnational governments to diversify their revenue portfolios bycombiningbothtraditionalandinnovativerevenuesources to cushion their fiscal health against future shocks and
stresses. At the same time, as illustrated in Box 4.3, tapping resources at the national and supranational levels remain vital to effectively addressing present and future urban challenges and fostering sustainable urban development.
The EU Cohesion Policy is at the heart of this funding support and the fostering of strategic, integrated and inclusive approach to address todays’ challenges across cities in Europe. Its instruments for the ongoing period 2021-27 follow a dedicated policy objective implemented through territorial and local development strategies. As example of supranational financing, European Regional Development Fund through its instrument of European Urban Initiative supports greater empowerment of local, urban and territorial authorities by transfers of funds for public investment. It will mobilise investments in urban areas: a minimum 8 per cent of the ERDF resources in each EU Member State must be invested in priorities and projects selected by cities themselves and based on their own sustainable urban development strategies. It serves a priority of bringing investment closer to citizens, supporting locally-led development and sustainable urban development across the EU.
Source: European Commission, 2021.

Sustainable and inclusive urban prosperity and opportunities for all is one of the key transformative commitments laid out in the New Urban Agenda. The NUA emphasises that cities and human settlements should be places of equal opportunities, allowing people to live healthy, productive, prosperous and fulfilling lives. In line with this vision, what is needed now and in the coming years is for cities and subnational governments to prioritize building resilient urban economies against future shocks and provide tangible solutions for the whole community—in short, leaving no one behind.90 Prioritizing resilient investments and interventions that address the root causes of multiple vulnerabilities will generate a triple dividend: help cities boost their local economies, improve equity, and prepare urban communities to withstand future shocks, stresses and risks.
Figure 4.11 illustrates the key transformative pathways to building resilient urban economies and productive urban futures. Cities should reimagine the future of urban economies through economic diversification, transition to circular economies, prioritize sustainable urban and territorial planning, and mainstream resilience in all major urban programs. These resilient interventions and investments should harness the untapped potential of
the informal economy and support active ageing to create decent and productive jobs. They should prioritize balanced territorial economic development to ensure that no space is lagging behind. These transformative pathways should be backed by sustainable and innovative financing instruments, resilient infrastructure investments and a vibrant human capitalbase(Figure4.11).Urbaneconomicresilienceisabout recognizing that risks and uncertainties are interconnected, so interventions should be as well.91
The implementation of these transformative pathways for urban economic resilience and productive urban futures should be integrated, holistic and coordinated across different levels of government while at the same time addressing challenges related to governance, socioeconomic development, funding and financing. Not every policymaker will find all the transformative pathways appropriate to their context, but some pathways will be. Thus, city leaders should determine the right mix of pathways that are compatible with their context given existing national circumstances, available resources and institutional capacities. Additionally, cities cannot build economic resilience alone. As we move into the future,thereisaneedforstrongcoalitionbuilding,mobilizing and galvanizing support from different stakeholders such as local and international financial institutions, the private sector, development banks, community and civil society groups, and national government entities.
Agile, diversified,
Greener,
Resilient, and inclusive urban
Harnessing active
Inclusive
TheCOVID-19pandemicisavividreminderthatoverreliance on a single sector, like tourism, increases the fragility of urban economies. Moving forward, cities should consider economic diversification as a core feature of building resilient urban economies (Chapter 10). The need for economic diversification and structural transformation has never been moreurgentduetothemultiplecrisesconfrontingcities.The relatively low levels of economic diversification in developing country cities, particularly in Sub-Saharan Africa, is a key factor in their vulnerability to external shocks.92 The NUA acknowledges the need to transition progressively to more productivity through high-value-added sectors by promoting diversification, technological innovations and creating quality and productive jobs.93
Economic diversification provides different economic outputs, thereby strengthening the ability of cities to drive sustainable growth by creating more jobs, increasing household incomes and attracting investments that strengthens the resilience of urban economies against future shocks.94 For example, Dubai, United Arab Emirates, has been successful in diversifying its urban economy to reduce dependency on commodity resources aided by expansion in tourism, real estate and trade. This transformation has been supported through expansion in infrastructure, upgrading of financial services sector and establishment of free zones to improve its competitiveness.95
In Colombia, the City of Bucaramanga has been effective in diversifying its economy. The city’s economy was previously dominated by lower-value-added industries such as clothing, footwear and poultry production. However, it is now home to knowledge-intensive activities such as precision manufacturing, logistics, biomedical research and development labs, and business process outsourcing, as well a vibrant tourism sector.96 This success was not automatic; it was driven by coalition building and galvanizing local stakeholders towards a shared vision. In addition, Bucaramanga has some of Colombia’s highest levels of human capital, including both technical and management skills, which has been a strong driver of its economic diversification agenda. Because of its successful economic diversification, Bucaramanga is doing well in recovering its economy from the COVID-19 pandemic.97
Similarly, in Changsha, China, urban leaders successfully transformed the city’s economic structure, which was previously dominated by low-value-added, non-tradable
services like restaurants and hair salons. The city focused on balancingthegrowthofexistingindustrieswiththeattraction and development of emerging automotive and entertainment businesses through sector-specific support strategies such as provision of market intelligence and dedicated workertraining programs. Ultimately, diversification of Changsha’s urban economy has reduced its vulnerability to economic shocks and strengthened its local fiscal sustainability.98
From the above case studies, it is clear that successful economic diversification cushions urban economies against future volatilities and provides a more stable and progressive path toward inclusive growth. Learning from the pandemic, Windsor,Canada,hasadoptedaboldandambitiouseconomic diversification strategy for future growth (Box 4.4).99 The
city government acknowledges that diversification beyond manufacturing is the key to its economic future.

As a mid-sized city in southwestern Ontario, Windsor is the original home of the Canadian car industry, with a concentration of highly skilled manufacturers. However, successive city administrations have always explored different ways to diversify Windsor’s economy. Recently, the city prepared an ambitious economic diversification strategy, which has four pillars: location, infrastructure, future economy and talent (L.I.F.T). Windsor plans to maximize its strategic location, which links it to key US markets. In terms of infrastructure, the plan is to revitalize downtown districts and improve mobility. The city also proposes to develop more diverse housing stock that appeals to young families, with a housing target for downtown that helps drive revitalization.
For the future economy, strategies include protecting Windsor’s current strengths in the auto sector and diversifying into adjacent sectors, such as border technology and building expertise in software and cybersecurity for autonomous vehicles. With regard to talent, the city plans to train, retain and attract the best talent from across Canada and the world. An appropriate mix of talent, innovators and entrepreneurs will be critical for driving the city’s economic future. The City of Windsor has also devised a mix of investment incentives to attract new investors into the local economy.
Source: City of Windsor, 2020.
Economic diversification should be backed by a menu of support measures such as smart regulations, investment incentives, infrastructure improvements, land provision for new industries, skill development, innovation districts, and accesstofinanceforenterprises.100 Together,thesestrategies create competitive cities that can turn around the economic fortunes of urban areas. The future of urban economies in post-industrial cities depends on the implementation of context-specific growth policies. For example, faced with industrial closures and population decline, Katowice, Poland, has embraced technologically driven economic growth and cultural development to diversify its local economy.101 To achieve urban resurgence in the context of population decline, proactive industrial policies will be urgently needed for “rapid and better-targeted economic restructuring to create a competitive manufacturing sector (endowed with new high-tech firms) and to catalyse growth interdependence with modern local services.”102
In the same vein, Africa’s ambitious development programme Agenda 2063 strongly emphasizes industrialization and structuraltransformation.103 Inordertoachievethisstructural transformation agenda, governments will have to put in place appropriate policies to support the diversification of their urbaneconomies.Thesepoliciesshouldincludesupportingthe manufacturing sector to create decent jobs and enhance urban productivity while at the same time reducing market barriers to promote the growth of young firms.104 If successfully
implemented, these measures could generate spillover effects with other sectors such as agriculture and services, setting urban economies on a more positive path towards sustainable economic growth (Figure 4.11).
While urban policymakers can learn from some of these successful experiences, there is no “one size fits all” blueprint for economic diversification; government action and policy choices should be contextually calibrated based on existing economic structures and institutional capacities. If urban economies become diversified, they will optimize agglomeration economies, promote innovation and strengthen urban productivity. Recent shocks like the COVID-19 pandemic have shown that failure to heed the call for economic diversification will have serious consequences for the future of urban economies. There are already warning signs in some regions and any further inaction will exacerbate the economic fragility of cities and undermine prospects for productive urban futures.
4.4.2. The circular economy: a new frontier for resilient urban economies
The circular economy presents an opportunity for cities and regions to reimagine and achieve better environmental quality and increased resource efficiency. As discussed in Chapter 5, if cities successfully transition to a circular economy, it could create new jobs, especially for vulnerable communities (Figure 4.12).
Improve environmental quality
Evenbeforethepandemic,cityleadersinEuropewerealready exploring new ways of enhancing long-term urban prosperity in urban centres.105 London, Paris, Amsterdam and Milan have been at the forefront of experimenting with the urban circular economy. London was one of the first largest cities in developed countries to implement a circular economy transformation agenda. London’s Waste and Recycling Board estimates that the transition to a more effective economy could be worth US$10 billion annually to the city’s economy. The city estimates that transitioning to a circular economy could create over 12,000 net new jobs through the reuse, remanufacturing and maintenance industries.106 The goal in London was to enhance urban economic resilience while promoting resource efficiency as well as adapting the city to new economic realities.
The NUA emphasizes


The NUA emphasizes transition to the circular economy in the face of new and emerging challenges confronting urban systems.107 Furthermore, in this transformative agenda, Member States committed themselves to developing vibrant, sustainable and inclusive urban economies and promoting “sustainable consumption and production patterns and fostering an enabling environment for businesses and innovation, as well as livelihoods.”108
Considering these commitments, the circular economy holds great potential for a green recovery and a sustainable urban future. Cities and regions should play a key role as promoters, facilitators, and enablers of circular economy. Adequate conditions should be in place to unlock this potential, which can be achieved through the 3Ps framework of people, places andpolicies(Figure4.13).Foratransformationtothecircular economy to happen, it requires behavioural and cultural change towards different production and consumption pathways as well as new business and governance models in a shared responsibility across levels of government and stakeholders. Successful circular economy policies create complementarities across water, waste, energy, transport,
housing and land use. Finally, the inflows and outflows of materials, resources and products require a reflection on the appropriatescaleatwhichthecirculareconomyisappliedand on functional linkages across the urban-rural continuum.109

Transitioning to a circular economy is expected to increase the average disposable income of individuals by reducing costs and prices of products and services. For example, the average disposable income for EU households would rise by 3,000, or 11 per cent more than the current development path, by 2030.110 This boost would also translate to a 11 per cent GDP increase by 2030. Circular economy practices will likely have a big economic impact, especially in developing countries, by opening opportunities for new decent and productive jobs.111
4.4.3. Sustainable urban and territorial planning: a key driver for productive urban futures

Sustainable urban and territorial planning is critical for building resilient urban economies and productive urban futures. Cities that are well-planned and managed better optimize and reap the benefits of agglomeration economies. If cities continue to grow in a disconnected and fragmented manner, the opportunities to leverage economies of scale will be missed. As enshrined in the New Urban Agenda, urban and territorial planning is a fundamental driver for sustained and inclusive economic growth, which provides an enabling framework for new economic opportunities and the timely
provision of adequate infrastructure and basic services. For example, if governments continue to underinvest in public transport systems, there will be significant congestion costs, which undermine economic growth and urban productivity.
Going forward, local and regional governments should prioritizethesoundandresponsiveplanningandmanagement of urban areas to ensure sustainable urban prosperity. These interventions are in sync with the clarion call of the NUA to “optimize the spatial dimension of the urban form and deliver the positive outcomes of urbanization.”112
Additionally, agglomeration can also occur regionally, making coordination between city authorities for land-use planning critical to promote long-term growth and productive urban futures.113 If local and regional governments fail to promote better planning and management of urbanization processes, cities could be locked in cycles of massive congestion pressures, which would be detrimental to the productivity and competitiveness of urban economies. This could ultimately tarnish any prospects of resilient urban economies and productive urban futures as promoted in the SDGs and the NUA.
Cities that are well-planned and managed better optimize and reap the benefits of agglomeration economies

The informal sector is a vibrant economic force in developing countrycities,andpolicymakersatvariouslevelofgovernment cannot continue to remain numb to this reality. Therefore, moving forward, a transformative urban economic agenda should focus on reimagining a future urban economy that is more robust, just, ethical and equitable (Chapters 3 and 10).114 The continued exclusion of informal sector workers is inconsistent with commitments in the NUA (para. 59), where global leaders pledged to recognize the contribution of the poor in the informal economy.
If cities are to leave no one behind, then a paradigm shift is urgently required: urban planning and policy frameworks should be reformed to create more equitable urban futures, where the informal sector is recognized as a legitimate contributor to urban economies and social protection as well as other support measures are extended to workers in the sector (Chapter 3). Such interventions could include creating more legitimate workspaces for informal businesses, facilitating their integration with regional supply chains and regional markets, accounting for informal sector workers in
urban economic statistics, and extending relief to individuals and businesses in times of crisis. Resilience building should prioritize formalization policies and measures to strengthen the productivity of informal enterprises through facilitating access to affordable credit and municipal infrastructure improvements that address the underlying vulnerabilities in the informal economy.115
Figure 4.14 illustrates different interventions that can build the resilience of the informal sector to future shocks. The first two interventions relate to making urban planning and policies inclusive as well as empowering informal economic actors to demand their economic rights such as safe working environments. The last two focus on addressing specific economic challenges confronting the informal economy such as access to markets, finance and business opportunities.
Figure 4.14: Policy interventions to build the resilience of the informal sector

Interventions targeting specific economic related challenges

Organizing for equitable access to economic opportunities
Changing policies and institutions to better protect and enable the informal economny to thrive
Promoting access to quality jobs to increase economic mobility
Improving access to resources to foster enterprise growth and resilience of the informal economy
Organizing informal sector workers can empower them to demand economic rights and equitable access to livelihood opportunities, safe working conditions
Creating urban policies and institutions that promote and protect the informal economy can improve livelihoods, offer greater legal protection, safer working conditions and better wages.
Promoting development of skills and creating new jobs through inclusive business models can improve livelihoods and contribute to economic mobility of informal workers
Making business resources available can spur growth of informal enterprises and improve their resilience to economic shocks. Other interventions could include promoting access to markets, finance, skills, and infrastructure
Resilience building should prioritize formalization policies and measures to strengthen the productivity of informal enterprises
These measures should be tailored to meet the needs of specific groups of informal workers (e.g. street traders, waste pickers and home-based workers) who bear the brunt of economic insecurity. There are emerging practices of informal sector integration. South Africa adopted waste picker integration guidelines in 2020 recognizing that waste pickers have practical experience with adapting quickly to new value chains and market opportunities that can help cities maximize recycling. Similarly, some cities in Colombia, Argentina and India have successfully integrated informal waste pickers into their solid waste management value chains to support door-to-door recycling.116 This move has unlocked economic productivity and secured livelihoods. In Maputo, waste pickers were registered as cooperatives and integrated into formal collective service, which generated full-time employment for 250 people.117 Integrating informal workers in urban systems coupled with other support measures can boost the productivity of informal enterprises and strengthen their contribution to resilient urban economies.
The successful integration of informal sector workers into urban policies will contribute towards SDG Target 8.3, which calls for the adoption of development-oriented policies to propel the growth of small and medium-sized enterprises including the informal sector. Failure to support and harness the potential of the informal economy could lead to an unprecedented labour market crisis118 and curtail the drive toward resilient urban economies and productive urban futures.


The ability of municipalities to meet the challenges of demographic change is important for creating inclusive resilient urban economies and productive urban futures.119 As highlighted in Chapter 2, developed world cities are likely to have a significant proportion of greying population. Therefore, going forward, cities should formulate tailored policies and programmes to support ageing populations in line with the SDGs, as well as the New Urban Agenda’s commitmenttoaddresstheeconomicandspatialimplications of ageing populations and leverage active ageing for decent
jobs and inclusive and sustainable economic growth. Taking action is urgent given that 43.2 per cent of all older populations (65+ years) are in the OECD region,120 with significant implications for labour supply in the future.
There are emerging practices, where cities are harnessing ageing population to support their urban economies. In Calgary, Canada, the Retired Employee Employment Pool engages retired city employees for limited-term projects that require particular skills or expertise. Other measures include creating opportunities for older workers to remain in the labour force to avoid labour shortages in ageing societies. For instance, Toyama, Japan, implemented agricultural training to increase the employability of older people, as a response to the decline in the number of the city’s farm workers.121 Yokohama, Japan, has taken concerted measures to integrate ageing strategies with its economic development plans and policies for sustainability. The City’s emphasis on wellbeing and economic prosperity has resulted in increased attractiveness and urban competitiveness.
The future of resilient urban economies depends on the ability of cities to develop policies that create new jobs and harness the experiences of older populations while at the same time implementing strategic actions aimed at retaining young and skilled persons while reducing their outflow
The ability of municipalities to meet the challenges of demographic change is important for creating inclusive resilient urban economies and productive urban futuresAn elderly couple in Portsmouth, Hampshire, UK © Shutterstock
from cities. Cities grappling with an ageing population could also strategically incorporate newly arriving migrants into local labour markets to counter negative population growth, ensuring sustained future economic growth that, in turn, is required to finance local infrastructure services.122 Together, these measures will promote resilient, inclusive and sustainable urban economic growth.
The COVID-19 pandemic has aggravated the vulnerabilities of specific groups such as minorities, migrants, indigenous peoples, women and people with disabilities. The pandemic has demonstrated the urgency of effective and robust social protection programs for urban economic resilience and recovery.123 Gazing into the future, developing a range of tailored economic support and relief packages to informal workers, vulnerable urban populations and at-risk sectors is vital for building resilient urban economies. Bangladesh’s 2020 Urban Social Protection Strategy and Action Plan sets out plans for expanding social protection to urban areas, includingthedesignofaconditionalcashtransferprogramme for the urban poor, especially those living in slums.124
Cities and subnational governments can also create tailored strategies that respond to different forms of vulnerability as well as unexpected shocks. These measures should be nuanced and wide-ranging to ensure that the different risks associated with gender, age, disability, ethnicity, migratory status and other characteristics are effectively identified and addressed in urban welfare programmes.125 Social protection strengthens households’ ability to invest and take productive risks, which boosts livelihoods and increases economic resilience.126 Thus, urban-sensitive social protection could potentially be a powerful tool for promoting inclusive urban economies (Chapters 1 and 3).
The NUA encourages governments to promote balanced territorialdevelopmenttoreducedisparitieswithintheurban system. Secondary cities connect 62 per cent of the world’s population living in smaller cities, towns, and rural areas, and the 22 per cent that live in metropolitan regions.127 Going forward, it is important for governments to prioritize balanced economic development, especially in ‘left behind’ secondary cities, while addressing territorial disparities in infrastructure and basic services. These intermediary cities are hubs for provision of goods and services to the hinterland and are instrumental in structuring urban-rural linkages,
thus providing a conducive environment for job creation and income diversification. With effective management these cities can provide greater investment and business opportunities and facilitate transformation across the urbanrural continuum.128
Noteworthy, in 2021, under the Italian Presidency, the G20 recognized the significant, but often unexplored and underutilized potential of intermediary cities in achieving the SDGs at the local level. In this regard, the G20 Platform on SDG Localisation and Intermediary Cities (G20 PLIC) was established to facilitate the exchange of good practices that strengthen intermediary cities and rural-urban linkages in developing countries.129 Additionally, to advance balanced territorial development that also strengthens the socioeconomic status of these cities, UN-Habitat has been supporting the implementation of national urban policies (NUPs) in 56 Member States.130 In advocating for balanced territorial development—as aimed for in SDG Target 11.a— these urban policies are a priority and a driver of sustainable national development.
Today, various countries are scaling up efforts to support their intermediate cities. For example, through the Secondary Cities Support Program, Ghana deployed World Bank loans to its municipal assemblies in order to promote economic development of intermediate cities.131 This programme acknowledges the need to address disparities in Ghana’s urban system, where economic growth and employment opportunities are concentrated in Greater Accra and the Kumasi regions at the expense of intermediate cities.132 Finland,LaosandTurkeysupportedsmallerpopulationcentres through regional development programmes. Investing in secondary cities could enhance their productivity and ignite their potential to add value to metropolitan economies.
Sustainable and innovative municipal finance is a catalyst for urban economic resilience and productive urban futures. Cities must diversify their revenue streams by mobilizing innovative revenue sources. The COVID-19 pandemic has shown that overreliance on traditional revenue sources like central government transfer could have potentially crippling effects on the fiscal health of cities. Thus, the need for structural policies to bolster growth and enhance local revenue as well as measures that mitigate vulnerability to shocks.133 It is important to address how urban futures can be adequately financed in the face of dwindling local government revenues, increasing national budget deficits
and decreasing foreign investment in certain contexts, among other fiscal constraints.
Importantly, cities will be on a path to resilience when the objectives and programmes undertaken by such financing are aligned with sustainability ambitions. The Local Government Association in the UK, for instance, proposed the Sustainable Urban Futures Fund, which is potentially a game changer in terms of building back better. This fund is expected to provide long-term, large-scale funding for integrated urban recovery programmes to improve economic vitality of cities. The financial resources could be used to tackle priority infrastructure needs (Figure 4.15). This fund could be applied to implement place-based integrated programmes to promote sustainable economic growth and recovery after the COVID-19 pandemic, thereby strengthening the resilience of urban economies.
However, context matters. Such innovative funding instruments could be tailored to other jurisdictions considering existing social, economic and political climates. It would require massive domestic resource mobilization and strong intergovernmental collaborations and political will.134
If implemented, this could result in significant economies of scope and scale, achieving much higher impacts, gaining more private sector leverage and buy-in than small individual grant schemes.135
In Sub-Saharan Africa, there are emerging innovations in municipal revenue mobilization to address gaps in infrastructure investments. For instance, Mzuzu, Malawi, an intermediate city that historically lacked adequate central government transfers, implemented a revenue mobilization programme, which deployed a fit-for-capacity property valuation system that resulted in a seven-fold increase in revenues.136 Municipal government in Teresina, Brazil, has implemented a reprioritization of existing municipal budgets in order to increase the availability of finance through restructuring own-source revenue arrangements to mobilize additional resources through new sources or expanding some of the existing ones.137
The other innovative financing instrument which cities could leverage on is land value capture. This has been successfully implemented in cities like Hargeisa, Somaliland (Box 4.5) and Bogotá, Colombia, with significant economic gains. In
To capture the gains of rapid urbanization, Hargeisa city government has implemented a system of “in-kind” land value capture or exaction. With this system, landowners on the outskirts of the city who apply to convert their land from rural to urban land use must provide the city government with 30 per cent of the asset if their application is approved. In this way, the city can access land for needed public infrastructure to service a growing city. At the same time, rent from this land can offer the city a valuable source of additional income to pay for the required infrastructure. The Hargeisa case study also shows that planning for future expansion is not only useful for capturing the gains from rapid urbanization through exaction, but also improves future urban investment.
Source: UN-Habitat et al, 2021.
Bogotá, a betterment levy (contribución de valorización) charges property owners a fee to defray the costs of public works improvements. Between 1997 and 2007, this innovative financing mechanism has been used to fund over US$1 billion worth of investment in 217 infrastructure projects all over the city.138
The successful implementation of innovative financing instruments should be accompanied by capacity building for municipal officials, administrative and policy reforms, technical innovation and strengthened political incentives. Municipal governments should be granted better fiscal autonomy for cities to modify their tax structures in line with their existing economic bases. This will enable cities to collect a better mix of sales, income and property taxes and become better prepared to face changes in economic conditions and residents’ needs. This flexibility will also provide local governments with opportunities to diversify theirrevenueportfolios,whichiskeyforstrengtheningurban economic resilience against future shocks. As cities focus on rebuilding their urban economies, they should confront the challenge of the 4Rs of urban finance for recovery (Figure 4.16).
The ability of municipalities to meet the challenges of demographic change is important for creating inclusive resilient urban economies and productive urban futures
Cities should also leverage public-private partnerships (PPPs) to develop ambitious infrastructure programmes. Japan is implementing capital intensive innovations in partnership with the private sector. Such initiatives include the Shibuya Station regeneration and Tokyo Station, whose objective is to overhaul ageing transport infrastructures and create a vibrant urban economy. Japan’s central government policies
no longer rely on stimulating growth through public capital investment, but rather seeks private sector support for innovation districts and zones in second-tier cities with negotiated regulatory incentives.139 Chicago, US, has been successful in developing and mobilizing new PPP models and value capture innovations, often in partnership with major banks, transnational infrastructure developers and other private-sector financial partners.140 These financing models are becoming popular because of dwindling federal funding for urban programmes.
Figure 4.16: 4Rs of urban finance for economic resilience
Engage with the central government, development partners, and other partners to minimize the drop in municipal revenues from own sources and intergovernmental fiscal transfers.
Reallocate budgets to maximize funds for activities that contribute to inclusive, green, and resilient recovery.
Engage with the central government and development partners to achieve a city’s maximum discretion over its budget and ensure an adequate fiscal autonomy.
Diversify and unlock sources of finance (public and private) and apply new financing approaches and techniques for inclusive, green, and resilient recovery.
Source: UN-Habitat and UNCDF, 2021.
For a resilient future, an enabling environment is critical for mobilizing sustainable and innovative financing mechanisms (Figure 4.17). Cities can also explore the possibility of using green bonds to fund interventions such as the transition to circular economies (Chapter 10). Gothenburg, Sweden, was the first local authority to launch a municipal green bond in 2013 and has since developed a robust framework for such instruments.141 For this financial scheme to be replicated in most regions, local governments require fiscal autonomy, legal power and creditworthiness. An effective local tax base is also necessary to allow cities to tap global finance more successfully and thus build up the city’s creditworthiness.
In most places, reforming tax systems is much needed to strengthen cities’ fiscal sustainability. Cities like Freetown, Sierra Leone, for example, are reforming their property tax system to enhance revenue generation for infrastructure development (Box 4.6).142 In the near and long-term, building this capacity can yield significant returns, such as tapping into the ever-growing green bond market which saw US$52 billion worth of bond issuances in 2019, a 21 per cent increase from 2018.143


Freetown has recognized that to fund public services, it needs to raise property taxes. In 2020, after a twoyear-long working group, the city reformed its property tax system, which will use a simple model to calculate property values and a new IT system to manage the entire tax collection process. The city has also registered almost all the 100,000-plus properties in the city. The system will make the property tax regime of Freetown more progressive and has resulted in much higher tax bills for the most valuable properties. The tax payable on the top 20 per cent of properties has more than tripled, on average. At the same time, that on the bottom 20 per cent has been more than halved. Under the system, Freetown’s potential revenue from property tax is estimated to increase more than five-fold.
Source: Kamara et al, 2020.
Overall, the realization of resilient urban economies and productive urban futures depends on the capacity of cities and subnational governments to mobilize adequate financial resources to fund infrastructure investments. While the need for new infrastructure investments in undeniable and urgent,thecurrentunmetneedshavenegativerepercussions on urban economies. Underinvestment in key infrastructure threatens competitiveness and the productivity of cities, thereby casting a shadow on urban economic resilience. If cities fail to close the massive gaps in infrastructure financing and investment, they will struggle to attract domestic and foreign investment—thereby putting the future of their economies in jeopardy.
Cities and subnational governments must urgently prioritize infrastructure investments towards building resilient urban economies and prosperous urban futures. Slums and informal settlements in developing country cities are underserved with key municipal infrastructure (Chapter 3), which undermines the productivity of residents and make cities unattractive for investment. Within cities, investments in road infrastructure provide significant economic returns. For Kampala, investment of around US$82 million in road infrastructure provided a net economic benefit of US$15 to US$35 million per year.144 Overall, closing Africa’s infrastructure gap could result in 1.7 per cent increase in annual GDP growth, with large economic gains in cities.145
Estimates reveal that a dollar invested in developing water and sanitation infrastructure generates between US$4 and US$34 in benefits by improving health outcomes, saving time and boosting urban productivity.146 Additionally, investing in transport infrastructure also improves connectivity that allows people and goods to move easily within and between cities. Moreover, investments in public transport systems typically trigger economic benefits, especially for the urban poor whose access to jobs is affected by sociospatial segregation. Investment in mass transit systems are also a catalyst or resilient and inclusive urban futures (Chapter 5). Bogotá’s bus rapid transit system increased the average welfare of the city’s residents by 3.5 per cent.147 Another important priority is investing in green energy infrastructure, which has strong potential to unleash productive growth throughout the entire urban economy, thus creating employment, generating revenue and yielding spin-off effects to multiple sectors.
COVID-19 has amplified the need for investing in digital infrastructures148 to meet the needs of the new economy, including an expansion of digital networks (Chapter 9). Digital infrastructures are critical for cities to transition to greener and inclusive urban economies. Therefore, the future of resilient urban economies depends on governments’ commitment to invest in key infrastructure and public services. Such investments could steer cities away from the pessimistic scenario of urban futures (Chapter 1) and galvanize action towards building inclusive, thriving, resilient and productive urban futures in sync with the SDGs and the NUA. Making these transformations not only enhances equitable access to urban services for the poor, it can also yield large dividends and cascading benefits for the entire urban economy, as highlighted above. On the other hand, failure to address underinvestment in infrastructure will undermine urban competitiveness and threaten the productivityofcities,aswellasconstrainnationaleconomies, particularly in developing countries.
In recent years, there has been significant transformation in the world of work. These winds of change are guaranteed to persist into the future. The COVID-19 pandemic, for instance, has ushered in a new economic order that is based on innovation and technology (Chapter 9). It is imperative that cities and subnational governments continually invest in human capacity development to reskill and upskill workers in order to keep pace with these transformations so as to meet the requirements of the new urban economy.149 Developing skills and talent for human capital is vital for inclusive and sustainable urban growth as it aligns with SDG 8 on promoting productive employment and decent work for all. Failure to reintegrate workers separated from labour markets during the pandemic through reskilling or upskilling puts the future of urban economies at further risk.
Policy action is particularly important for women, youth, migrants and refugees, among other vulnerable groups who are more likely to have dropped out of labour force.150 The COVID-19 crisis had a disproportionate impact on women and youth employment.151 Women, for instance, comprised a large share of the workforce in the sectors worst affected by the pandemic and the drop in their employment-topopulation ratio has been relatively higher than that of men. It is projected to remain so in the coming years (Figure 4.18).152
Figure
by sex,
Male
Another way to advance talent and skills development to achieve resilient urban economies is by cultivating research, training and innovation through the establishment or expansion of urban research universities. Research-intensive universities can act as a magnet for talented students and researchers, drive innovation and provide opportunities for the local population to gain new skills and increase their earnings; thereby boosting the urban economy.
In the US counties, for example, a US$1 increase in university expenditures leads to an 89-cent increase in the urban income.153 In China, Suzhou Industrial Park has set up its own technical and vocational training college. This has resulted in stronger linkages between skills supply and actual needs of the local industries as well as boosting productivity and competitiveness of the industrial park.
These measures were complemented with talent attraction strategies such as housing subsidies. To retain talent, the city of Vaasa, Finland, implemented the Digitalisation Academy in 2018 in partnership with a local university155 (Figure 4.19). This academy was designed to respond to the talent shortage in the region’s business sector by strengthening the digital
skills of Finnish and foreign students studying in Vaasa and supporting their employment in the region’s companies.
Vaasa’s Digitalisation Academy demonstrates the importance of partnerships between universities, firms and regional authorities in implementing talent development programs.
development and talent retention programs are critical in cities that are experiencing urban shrinkage. As people become skilled and reskilled, this talent pool can attract
stimulate local innovation networks
realization of agglomeration
urban productivity.
also
to informal sector
alleviate long-term
Figure 4.19: The Digitalisation Academy model in the city of Vaasa, Finland
ï Joint effort by the ecosystem actors to tackle talent shortages
ï Funding for the Academy
Industry insights and needs via teaching and visits
Internships and thesis work for students
ademic fields
countries cultures
Insights into the future regarding employers
ï Access to students
Support for planning and
ï Access to a talented future workforce
Close contact with ecosystem actors
Way of showing social responsibility
Source: Adapted from Niemi et al, 2021.
Insights into industry needs and the Finnish job market skills
Networking with the ecosystem actors
ï Free programme for students, chance to support their employment
Insight into industry’s needs, networks
Tool for fulfilling
InvestinginstrongerhumancapitalisaresponsetotheNUA’s
commitment on “providing the labour force with access to knowledge, skills and educational facilities that contribute to an innovative and competitive urban economy.”156
Cities with a large pool of skilled human capital are more resilient to future economic turbulence compared with those that do not. At the same time, it is vital to incentivize a human-centred work culture and work models for firms. In developed countries, the pandemic has spurred what is referred to as the Great Resignation or Great Reshuffle that has been largely characterized by a higher attrition as workers change jobs, “hoping for something more—more purpose, more flexibility, more empathy.”157
The transformative pathways towards resilient urban economies and productive urban futures discussed in this section can only be effectively pursued and result in meaningful outcomes in peaceful and stable societies. Social stability and peace are critical ingredients for fostering urban economic resilience. Besides structural conditions, the future economic outlook of cities and nations hinges on their prevailing social conditions as well as the relationship between nations. The past decades have shown that peace and security challenges in one country have the potential to easily spill over and bear negative impacts regionally and even globally.
Today, urban areas are increasingly becoming platforms of local and international armed conflicts: “wars have moved into the lives, cities and homes of ordinary people in a more vicious way than ever before.”158 As alluded to in previous sections, conflict destroys local economies. Conflicts and societal instability result in displacement, loss of life, economic disruption, lower consumption and destruction of urban assets. In regard to the ongoing conflict in Ukraine, for example, preliminary estimates put the overall cost of rehabilitating the country after the war at 200–500 billion (US$220–540 billion)—the upper limit is over three times Ukraine’s pre-war GDP.159 These disruptive events also inhibit revenue mobilization capacity, leading to lower local and national revenue flows, among other negative impacts that cultivate the pessimistic scenario alluded to in Chapter 1.
The 2030 Agenda for Sustainable Development is our common global blueprint to create more peaceful, stable and resilient societies.160 Fully respecting human rights, embracing the presence of strong and effective institutions at all levels as envisaged in SDG 16, and establishing values and norms that facilitate the resolution of problems in peaceful and non-violent means are key to a prosperous future. At the same time, to secure a sustainable urban future, global priority must be given to the fostering of international cooperation and the practice of preventive diplomacy, overcoming conflicts through agreements and compacts, as well as addressing the dynamics that give rise to and reinforce conflicts and social instability. Lastly, the pursuit of sustainable urbanization must be an imperative; it is an enabler of peace and stability.161
Although the COVID-19 pandemic has unleashed an unprecedented crisis, it also provides an opportunity for directing investment towards building resilient urban economies and productive urban futures. Globally, cities have differential economic fragility. Some cities are more resilient to shocks while others are more vulnerable because of differences in economic structures and fiscal health, among other factors. For the collective visions of sustainable, resilient and productive urban economies to be realized as enshrined in the SDGs and the New Urban Agenda, this chapter has placed emphasis on the following key policy areas for cities and subnational governments to drive inclusive economic growth:
Prioritize investment in key infrastructure and services to strengthen urban competitiveness and boost productivity of cities towards sustainable, resilient and inclusive economic growth.
Mobilize sustainable and innovative financial resources such as PPPs and land value capture to complement traditional sources of revenue.
Recognize and integrate the informal sector into urban systems as well as facilitate access to markets, finance and training to enhance the productivity of informal enterprises and strengthen their resilience to future shocks.
Implement targeted interventions to expand the capabilities of marginalized groups, including tailored social protection measures to alleviate their vulnerability to future shocks.
Support ageing populations and harness active ageing for new decent jobs and inclusive economic growth in line with SDGs and the NUA.
Strengthen sustainable urban and territorial planning to reduce costs associated with congestion pressures and diseconomies of scale.
Diversify urban economies and revitalize post-industrial cities as a critical part of achieving broader economic resilience, especially in contexts where there is overdependence on single industrial bases.
Invest in skills and talent development to enhance access to decent and productive employment for all, including reskilling to meet the demands of the new urban economy.
Adopt the circular economy as a catalyst to greater urban economic resilience while promoting resource efficiency as well as adapting cities to new economic realities.
Implement balanced territorial economic development to reduce regional disparities and promote equitable and inclusive economic growth.
Cultivating peaceful and socially stable societies.


1. HendersonandKriticos,2018.
2. UnitedNations,2017.
3. UnitedNations,2017.
4. CohenandSimet,2018;UN-Habitat, 2011a.
5. CityofMelbourne,2020.
6. HoogeveenandLopez-Acevedo, 2021.
7. UNECE,2021.
LocalGovernmentAssociation,2021.
OECD,2020c.
Wahbaetal,2020.
11. UNECE,2021;AdrianandGopinath, 2021.
12. UnitedNations,2022a.
13. UnitedNations,2022b;United Nations,2022c;Tollefson,2022; Pomeroy,2022;Anayietal,2022.
14. UnitedNations,2021.
UN-HabitatandUNCDF,2021.
Ženkaetal,2019.
Zhiweietal,2019.
UN-Habitat,2020a.
UN-Habitat,2020a.
Abrehaetal,2021.
WorldBank,2020f.
LallandMaloney,2022.
Pageetal,2020.
Groveretal,2022.
Pageetal,2020.
Lalletal,2017.
UN-Habitat,2020a.
Lalletal,2017.
Venables,2015.
UnitedNations,2021.
HoogeveenandLopez-Acevedo, 2021.
HoogeveenandLopez-Acevedo, 2021.
ILO,2018.
OhnsorgeandYu,2021.
ILO,2018.
Godfreyetal,2016.
ChenandBeard,2018.
IMF,2017.
Groveretal,2022;Hendersonand Nigmatulina,2016.
HendersonandNigmatulina,2016.
41. Sachsetal,2021.
42. Peralta-Quirós,2015.
43. AvnerandLall,2016.
44. EllisandRoberts,2016.
45. UN-Habitat,2020a.
46. GlaeserandXiong,2017.
47. UnitedNations,2022d.
48. UN-HabitatandUNIDO,2021.
49. UN-Habitatetal,2021b.
50. CitiesAlliance,2021.
51. GovernmentoftheDemocraticSocial RepublicofSriLanka,2018.
52. Thieme,2016.
53. UnitedNations,2017.
54. CitiesAlliance,2021b.
55. KnuthandKrishnan,2021.
56. Löffler,2016.
57. OECDandUCLG,2019.
58. OECDandUCLG,2019.

59. UN-HabitatandESCAP,2019.
60. EllisandRoberts,2016.
61. Venkateswaran,2014.
62. Ahmadetal,2019.
63. WorldBank,n.d.
64. UN-Habitat,2020c.
65. Bernaletal,2020.
66. UnitedNations,2022d.
67. UN-Habitatetal,2021.
68. UN-Habitat,2020a.
69. AngelandBlei,2016.
70. Cleaveetal,2019.
71. Beeretal,2020.
72. FratesiandRodríguez-Pose,2016; Capelloetal,2015.
73. EuropeanUnion,2021.
74. EuropeanUnion,2021.
75. Morill,2014.
76. Biswasetal,2018.
77. Kilroyetal,2015.
78. Kilroyetal,2015;Jarzebskietal, 2021.
79. Martinez-Fernandezetal,2016.
80. Ahmadetal,2019.
81. MunicipalSecuritiesRulemaking Board,2022.
82. Woetzeletal,2017.
83. Woetzeletal,2017;UN-Habitat 2020a.
84. UN-Habitat,2016a.
85. GuoandChen,2021.
86. NationalLeagueofCities,2020. 87. SchulzeandKing,2021. 88. CityofMelbourne,2021. 89. PaganoandMcFarland,2020. 90. UNECE,2019.
91. ICLEIetal,2018. 92. Ndung’u,2020. 93. UnitedNations,2017. 94. UN-HabitatandDiMSUR,2020. 95. Deloitte,2014.
96. Kulenovic,2015.
97. Ijjasz-VasquezandMukim,2021. 98. KulenovicandZhu,2016. 99. CityofWindsor,2020. 100. Ijjasz-VasquezandMukim,2021. 101. UrbanTransitionsAlliance,n.d. 102. Bartholomaeetal,2017. 103. César,2021. 104. César,2021. 105. BonatoandOrsini,2018. 106. BonatoandOrsini,2018. 107. NUApara.71(UnitedNations,2017). 108. NUApara.45(UnitedNations,2017). 109. OECD,2019a. 110. EllenMacArthurFoundation,2015. 111. Deloitte,2020. 112. UnitedNations,2017. 113. EllisandRoberts,2016. 114. UN-Habitat,2021a. 115. OECDandILO,2019. 116. Mahendraetal,2021. 117. BuqueandRibeiro,2015. 118. ILO,2020a. 119. OECD,2015a. 120. OECD,2015a. 121. OECD,2015a. 122. CohenandSimet,2018. 123. UN-HabitatandUNCDF,2021. 124. GovernmentofPeople’sRepublicof Bangladesh,2020. 125. UN-Habitat,2021a. 126. RNSF,2017. 127. CitiesAlliance,2021. 128. SuriandBonaglia,2021. 129. OECD,2021a.
130. SeeNationalUrbanPolicyPlatform (https://urbanpolicyplatform.org).

131. SeeGhanaSecondaryCitiesSupport Program(https://projects.worldbank. org/en/projects-operations/projectdetail/P164451).
132. WorldBank,2018b.
133. WorldBank,2022b.
134. Bandauko,etal.2021.

135. LocalGovernmentAssociation,2021.

136. UN-Habitatetal,2021.
137. UN-HabitatandUNCDF,2021.
138. Mahendraetal,2021.
139. UN-HabitatandESCAP,2019.
140. KnuthandKrishnan,2021.
141. CityofGothenburg,2019.
142. Kamaraetal,2020.
143. AmundiAssetManagementand InternationalFinanceCorporation, 2020.
144. CDCEvidenceReview,2021.
145. CDCEvidenceReview,2021.
146. WorldWaterAssessment Programme,2016.
147. Tsivanidis,2018.
148. WorldEconomicForum,2020.
149. Neagle,2022.
150. WorldBank,2022b.
151. Youngpeople(15–24years)fared worsethanpersonsabove25years oldduringthecrisis(ILO,2022).
152. ILO,2022.
153. KantorandWhalley,2014. 154. Zeng,2016. 155. Niemietal,2021.
156. UnitedNations,2017.
157. Linkedin,2022;ILO,2021.
158. ICRC,2017.
159. TheEconomist,2022.
160. Harris,2018.
161. UN-Habitat,2021b.

1. Current net zero policies have pitfalls, including an overreliance on underdeveloped technologies that overlook local resources and the lack of integration of local governance strategies in national programmes for action.
2. Climate impacts and other environmental crises interact with drivers of urban inequality, which threatens the futures of cities.
3. Greener futures cannot be secured without just transitions.

4. The world is losing the opportunity to use the post-pandemic context as a catalytic moment to facilitate investment for a transition to net zero carbon emissions.
1. Achieving net zero is also dependent on subnational and city-level action. Policymakers at all levels must therefore recognize and support the role of urban areas in the net zero transition.
2. Nature-based solutions must be part of inclusive planning processes for sustainable urban futures—local action to secure greener futures cannot overlook their vital role.
3. In environmental decision-making, diverse voices and perspectives must be heard to minimize uncertainties in the pathways to securing greener urban futures.
4. Various levels of government and institutions should harness the potential of international partnerships such as transnational networks and social movements in delivering greener urban futures.
We are living a unique moment, where the world is transcending a pandemic whose recovery efforts are entangled with a push to develop alternative futures. The climate crisis—and related goals of keeping the global average temperature change under 1.5 degrees—and avoiding mass extinction now a primary concern at various levels of governance. Cities continue to be at the forefront of environmental and sustainability action, although after a decade of optimism, their role in constructing sustainable urban futures is increasingly questioned by the public, especially younger generations operating with a sense of urgency out of fear for their future. In short, the promise of sustainable urbanization remains unfulfilled.
Calls for urgent action on the climate and biodiversity crises emphasize the need to build sustainable urban futures. The challenge for various actors is to envision how those futures can make urban space liveable for humans while not contributing to environmental degradation. But multiple uncertainties shape environmental action. While living in the Anthropocene, we must recognize the impact humans have ontheEarthasawhole,withimplicationsforhumansocieties and ecosystems.1 Previous editions of the UN-Habitat World Cities Report have argued that there are opportunities to harness the value of sustainable urbanization to advance green, resilient and more equitable futures.

The goal of limiting average mean temperature rise to 1.5°C by 2100 has become a policymakers’ guiding metric to imagine sustainable futures
The goal of limiting average mean temperature rise to 1.5°C by 2100 has become a policymakers’ guiding metric to imagine sustainable futures. In 2018, the IPCC Special Report identified two pathways to maintain this goal. The first pathway is to stabilize global warming at or below 1.5°C above pre-industrial levels. The second pathway, also called an “overshoot” pathway, foresees global warming exceeding 1.5°C around mid-century, remaining above 1.5°C for a maximum duration of a few decades, and returning to below 1.5°C before 2100.2 Both pathways highlight mitigation and adaptation efforts in multiple sectors, including energy, transportation, forestry and sustainable land use.
Despite securing net zero commitments from 153 countries, the Glasgow Climate Pact negotiated at COP26 in November 2021 showed that current steps to limit global warming
are insufficient. The lack of ambition in current national commitments echoes a lack of imagination in defining alternative urban futures. Much of the debate has rightly focused on keeping the 1.5ºC goal alive, with subnational governments making new commitments that accelerate climate targets to 2030.3 At the same time, the great extinction likely to sweep away the world’s biodiversity speaks to the disconnection of human activity from its natural surroundings.4 There is one last chance for humanity to reconcile with the possibilities of living on Earth, shift development pathways, and reconnect with the stewardship role that recognizes a mutual and beneficial relationship between humans and the environment. Every citizen has a role to play in actively engaging with the urban landscape.
This chapter analyses the interrelated challenges of climate change and biodiversity to explore how alternative urban futures could be developed. The rationale of the chapter follows an examination of the ideas about the future that dominateplanningpractice.Inparticular,thechapterengages with two alternative future-oriented approaches. On the one hand, the chapter examines the growth of scenario planning and scenario modelling to consider what the future means for urban areas. On the other hand, following the operation of scenarios in practice, the chapter recognizes the need to include multiple perspectives and acknowledge inequality in planning practices. These two cross-cutting themes are examined in six sections that explore different aspects of delivering green urban environments: the transition towards net zero carbon, the future of urban transport, the increasing importance of building resilience, the growing visibility of nature-based solutions, the development of inclusive urban planning, and the constitution of global partnerships to deliver green urban futures. Each section thus explores the treatment of futures, how future visions influence planning practice as well as their impact on populations across the urban-rural continuum.
Net zero GHG emissions means achieving balance, over a specified period, between anthropogenic GHG emissions produced by human activities and those removed from the atmosphere through reduction measures.5 The transition to net zero emissions requires sustainable consumption and production practices that facilitate responsible resource use and address climate change’s adverse impacts. However, the conceptualization of net zero carbon varies across scales and

sectors. For example, territorial approaches, which calculate emissions within national borders, are widely used at the national scale for carbon accounting.
By contrast, the conceptualization of net zero emissions at the city level faces two practical challenges. First, inventory data at the city level is often unavailable. Second, cities present specific complexities due to their “smaller spatial scale and embeddedness within larger-scale social, ecological and infrastructural systems.”6 For instance, urban energy and economic systems depend on long-distance exchanges. Accounting for these transboundary carbon flows is challenging when considering the city as an analytical unit for carbonmeasurements.7 Anetzerocarboncitycanbeimagined quite differently depending on the focus of carbon accounting approaches—whether net zero territorial emissions, net zero community-wide physical provisioning systems, net zero household expenditures, or net zero trade.8

Recent research warns against undue optimism with regards to net zero scenarios.9 Current climate simulation models may effectively simplify (and thus downplay) social and political realities affecting the actual impacts of climate change.10 The concept of net zero may also distract attention
from the urgency of emission reductions by shifting faith onto unrealistic carbon removal measures.11 Such technologies are still developing and not yet available for large-scale applications.12 The promise of carbon removal technologies bolsters market environmentalism narratives that strengthen capitalism and reinforce existing social and spatial inequalities.13 The stabilization of emissions is a necessary but insufficient condition to manage climate change, and reaching zero emissions will not cancel climate impacts.14
Net zero urban futures depend on the development of net zero scenarios at the national level and how such influence urban thinking. Scenario modelling assists decision-making in climate policy.15 The latest generation of climate models informs the urgency to reach net zero emissions.16 These models also outline physical and policy pathways to net zero emissions, including measures to reduce the use of carbonintense materials (such as substituting materials, facilitating recycling, introducing carbon pricing and removing energy subsidies), support research and development of decarbonized technologies, and sunset policies for obsolete high-carbon facilities.17
Net zero decarbonization requires country-specific strategies that take into account each nation’s development priorities.18 In the UK, for example, a study suggests that achieving net zero emissions before 2050 will require more vigorous mitigation efforts than those currently envisaged by national policy.19 Lines of action should include commercialscale deployment of carbon capture and sequestration technologies, a quicker phase-out of fossil-based generation, higher deployment of wind and nuclear power, and more radical reductions in emissions from the transport and building sectors. In Latin America and the Caribbean, wellproven strategies can support net zero pathways, including urban electrification for households and transport, transport mode shifting, and the combination of intensive sustainable agriculture with afforestation.20
Achieving net zero ultimately depends on subnational and city-level action. Several net zero planning models are currently under development. Building-level carbon budgets, for instance, provide consistency across temporal and spatial dimensions of carbon reductions.21 Planning for net zero cities depends on having appropriate climate information as part of the evidence base, but this information is not always available. Climate projections can inform decisions in urban planning, which points towards the increasing role that planning can play in shaping urban futures.22 Innovative models that could support multi-objective decision-making in urban planning and governance, such as scenario-based planning,23 multiperiod planning,24 and multi-objective decision-making25 are in the early stages of development but offer significant promise.
Scenarios can inform protective decisions to mitigate risks. For example, recent modelling shows that over the next 50 years. climate change will likely increase cross-species viral transmission risk, as mammals are driven to cooler regions.26 Scenarios can also inform proactive decisions to seize opportunities.Theycanalsocontributetoconsensusbuilding among many actors, broadening support for a complex net zero transition.27 However, despite the popularity of climate simulation models, policy decisions should not rely solely on the outcomes of quantitative scenario modelling.28

Their results depend on subjective framing of objectives, contexts and methodologies.29 Building net zero scenarios is particularly challenging because it involves long time frames and detailed speculation on technological and social changes, with inferences across different sectors and processes.30 Scenario building approaches appear technocratic, limiting actors’ agency and mobilizing simplified assumptions about social and political dynamics.31
The combination of quantitative models with qualitative storylines is an alternative to move beyond simplified narratives that rely solely on computer modelling.32 For example, socio-technical transition theories highlight the co-evolution between social change and technological development. Yet, while such analyses expose the historical trends of socio-technical dynamics, they often cannot predict how such dynamics might develop in the future.33
Socio-technical scenarios help to bridge computer models, and socio-technical systems theories.34 Socio-technical scenarios support speculation on future transition pathways, considering actors’ agency and the interactions between multiple dimensions (both techno-economic and sociopolitical) of a socio-technical system.35 Contributions from the humanities and the creative sector will enhance the creation and deliberation of climate change scenarios towards imaginative futures.36 This perspective highlights the importance of cultural work on climate change that acknowledges scenarios’ historical and cultural roots.37 However, there have been limited applications of multimethod modelling in urban planning and urban governance so far.
5.1.2. Policies for a net zero urban future National and subnational governments, international coalitions and private entities have made increasing net zero emissions pledges in the last few years. In May 2021, the International Energy Agency (IEA) released a special report on the pathways toward a global net zero energy system by 2050. The report sets out more than 400 milestones that need to be achieved to reach the net zero goal in the energy sector by 2050. These include major transformations such as increasing the annual clean energy investment worldwide to around US$4 trillion by 2030, halting sales of new internal combustion engine passenger cars by 2035, and phasing out all unabated coal and oil power plants by 2040.38
According to IEA, more than 50 countries have set net zero emissions targets,39 of which 12 countries have written the net zero target into law, including Germany (2045), Sweden

Net zero decarbonization requires country-specific strategies that take into account each nation’s development priorities
(2045), Canada (2050), Denmark (2050), France (2050), Hungary (2050), Japan (2050), Luxembourg (2050), New Zealand(2050),SouthKorea(2050),Spain(2050)andtheUK (2050). However, some of the strategies have faced criticism ofbeingunrealistic—essentially,being“pie-in-the-sky”—and failing to include policies that would deliver promised cuts in emissions. The UK government, for instance, has been sued separately by two charities—ClientEarth and Friends of the Earth— in this regard.40 Net zero policies have attracted interest but also courted controversy (Box 5.1).
Several countries—including China, European countries, and the US— have developed policy frameworks, sometimes referred to as “Green Deals,” to address the twin challenges of climate change and pandemic recovery, emphasizing job creation and infrastructure investment.41
A new infrastructure bill adopted in November 2021 by the US will invest US$1 trillion in ports and transportation systems, high-speed internet, clean water, roads and bridges, mass transit, and clean energy infrastructure, creating millions of jobs. The European Commission also adopted a European Green Deal (EGD) in 2019, later coordinated with the COVID-19 recovery plans in NextGenerationEU, with a strong emphasis on digital technologies.42
However, there are questions about the extent to which infrastructure investments are the best approach to deliver a transition, particularly what kind of actions these frameworks will foster at the local level. In the US, ten state and local governments have adopted subnational versions of the Green New Deal, including Austin, Texas; Los Angeles, California; New York City; and Boston, Massachusetts.
In the European Green Deal, cities play a central role in specific strategies such as the Circular Economy Action Plan, the Biodiversity Strategy for 2030, the Farm to Fork Strategy and the Renovation Wave.43 In 2020, the European Commission announced an EU mission on Climate-Neutral and Smart Cities to deliver 100 climate-neutral and smart cities by 2030 that can act as experimentation and innovation hubs.44
Delivering the net zero transition depends on cities, and many cities are willing to work towards net zero. At least 1000 cities worldwide have committed to net zero objectives under the UNFCCC-led Race to Zero campaign.45 Cities can deliver critical actions to advance social changes, such as modal shifts, infrastructure upgrades, energy efficiency and low-carbon urban forms.46 However, cities accommodate a fragmented landscape of infrastructure and technology ownership that often cuts across urban boundaries. A net zero transition at the urban level requires both autonomy and coordination.47 Thus, urban transitions to net zero need to be supported by horizontal integration (multi-actor) and vertical coordination (multilevel).48
Policiesathigherlevelgovernancescales(e.g.regional,national and international) can serve as a guiding framework for citylevel actions.49 An analysis of the climate action plans of 296 cities with net zero targets showed that cities’ approaches to net zero evolve within broader governance contexts.50 Cities in lower-income countries are more likely to rely on local and community actions and focus on climate adaptation and risk management that echoes national-level climate strategies. In contrast, cities in higher-income countries tend to highlight climate actions in transport, buildings and lighting by focusing on efficiency and leadership.51 Support from national governments is essential (Figure 5.1).52
Figure 5.1: National-level pillars for supporting local climate action
City-level, place-specific climate action
Clarifying governance competences
National-level areas of support
Financial and institutional support
Source: Coalition for Urban Transitions, 2019.
Coordination of multiple actors Experimental, participatory culture
The Sustainable Development Goals are another arena of national commitment that requires local implementation. Cities can coordinate net zero action with localized action to deliver the SDGs. For countries in Africa and South Asia facing dire energy access challenges, delivering a net zero transition must go hand in hand with alternatives that provide energy access to populations with some of the lowest carbon footprints in the world. In 2019, despite progress in advancing SDG7 on energy, an estimated 759 million people still lacked access to electricity and 2.6 billion people lacked access to clean cooking facilities.53 The IEA forecasts that, as population growth continues in Africa, energy access challenges will continue unabated. While electricity access rates are higher in urban areas, urban dwellers still face energy access challenges related to affordability and reliance, particularly in rapidly growing urban peripheries. Local governments and other urban actors have an essential role in linking the urban net zero transition with other sustainable
development objectives such as energy access. Carbon mitigation policies for off-grid energy or energy efficiency directly alleviate some of the energy access challenges.
Moreover, urban areas can help accelerate the net zero transition. For example, the EU’s 2050 net zero strategy considers cities as experimentation centres in sectors such as energy, transport, and construction.54 Different models of low-carbon, sustainable cities developed over the years have been implemented in practice, with rich lessons for net zero cities.55
However, existing models of urban development that favour net zero action (as illustrated in Figure 5.2) cater to wellestablished cities with access to financial resources and advanced technologies such as Singapore, Stockholm or Vancouver, among others. There is less understanding of what net zero will mean for rapidly urbanizing areas
and the growing urban peripheries in Latin America and the Caribbean, Africa, the Middle East, South Asia and SoutheastAsia.Yet,rapidlyurbanizingareasareaccumulating experiences that will become increasingly relevant in the net zero transition.
Net zero action must balance localized interventions in buildings and neighbourhoods with citywide approaches seeking to deliver concerted action. There are several examples of successful localized interventions. The building sector, in particular, is a crucial arena for advancing net zero in cities (Table 5.1). In the European Union, the EU Energy
Adoption of building codes at the national level

Energy efficiency measures
Integrated approaches to cooling
Urban electrification
Performance of Buildings Directive (EPBD) requires that all new buildings constructed since the beginning of 2021 must be nearly zero-energy buildings. Achieving such a goal depends on designs with significant energy-saving features, such as efficient heating, ventilation, and air-conditioning (HVAC), and lighting technologies.56
At the same time, the retrofitting of the existing building stock constitutes a significant challenge to reducing the GHG emissions of the building sector.57 Retrofitting the current building stock is often considered a cost-efficient way of reducing building energy consumption.58 The move from single buildings to the district scale—for example, in Net Zero Energy Districts (NZED)—has shown potential for large-scale emission reductions.59 NZEDs require innovative solutions for street lighting, urban mobility, waste collection, and public safety.60 A scenario study in Belgium, for example, identified the importance of building renovation, sustainable mobility, and the integration of local renewable energy
Building codes are generally used in the context of safety but are also helpful in reducing emissions by regulating energyrelated components such as thermal performance and wall thickness. They also have dividends for residents, making houses more comfortable and reducing energy bills.
Energy efficiency includes measures to reduce the amount of energy that provides a similar level of service, for example, by changing the technology and materials used or optimizing the system through digital systems. Changing an incandescent lamp to a more efficient LED lamp is one of the simplest examples of energy efficiency measures. The IEA estimates that energy efficiency could provide more than 40 per cent of the emissions reductions needed by 2040.
The use of energy for cooling, especially air conditioning systems, has skyrocketed. As global average temperatures increase, the use of energy for cooling is likely to increase. Ways to prevent excessive cooling include developing integrated cooling systems and changing perceptions of thermal comfort.
The Global Alliance for Buildings and Construction says that 18 new countries have adopted building codes since 2017 and building codes are frequently cited in Nationally Determined Contributions. The alliance also reports that green building certification increased 13.9 per cent between 2019 and 2020.
The Global Alliance for Buildings and Construction estimates that global investment in the energy efficiency of buildings increased an unprecedented 11 per cent in 2020. Still, investments remain concentrated in the EU, and it is thought to be insufficient to bring about a systemic change.
The WGIII report of the IPCC states: “electrification of energy end uses in cities and efficient energy demand for heating, transport and cooking through multiple options and urban infrastructure has an estimated mitigation potential of at least 6.9 GtCO2-eq by 2030 and 15.3 GtCO2-eq by 2050”, but also requires the decarbonization of the energy supply.
Sources: UNEP, 2021a; UNEP, 2021b; IEA, 2021a; IPCC, 2022a.
The Cool Coalition recommends reducing need for mechanical cooling through better building design and urban planning, improving equipment efficiency, shift to renewables and protecting vulnerable populations. While progress in these areas is slow, notable highlights include: 14 cooling suppliers joined the Race to Zero campaign, representing 28 per cent of the residential AC market; 53 enhanced Nationally Determined Contributions have integrated sustainable cooling.
The use of heat pumps, photovoltaic energy or electric cookstoves improves energy efficiency and may enable the active decarbonization of the energy supply. Urban electrification may also help reconfigure supply networks more sustainably through smart grids. However, while evidence of the successful electrification of urban transport is apparent, widespread urban electrification in buildings is less clear.
Table 5.1: Reducing emissions in the built environment, examples of actions
Net zero action must balance localized interventions in buildings and neighbourhoods with citywide approaches seeking to deliver concerted action
sources to achieve net zero at the neighbourhood level.61 There is considerable potential for district-based approaches to net zero. Still, they face two challenges: to move beyond experimental stages in well-resourced cities into broad models that can provide workable alternatives elsewhere and to interrogate how district-based action can be integrated into citywide plans that reflect the changing needs of both city centres and urban peripheries.
The COVID-19 pandemic showed the potential feasibility of net zero ambitions, but public health measures in response to the virus had short-lived effects on reducing carbon emissions. It also demonstrated that efforts to reduce carbon emissions should go hand in hand with ameliorating people’s vulnerabilities (see section 5.3). Lockdowns and disruptions in the global supply chain led countries like China to consider measures that effectively decarbonized the economy.62 In urban areas, COVID-19 ‘forced’ residents to interact with their cities in a more sustainable way, as people shifted to walking and cycling63 and rediscovered the value of green spaces.64 However, as emissions have picked
up, economic recovery has been prioritized at the expense of net zero investments. A comparison of the economic recovery packages of 149 countries found that investments in net zero transitions are minimal compared with pandemicrelated stimulus funds while fossil fuel production support remains strong (Box 5.2).65
Lasting reductions in greenhouse emissions require social change.66 Demand-sidesolutionsformitigatingclimatechange include strategies targeting technology choices, consumption, behaviour, lifestyles, production-consumption infrastructures and service provision.67 Demand-side mitigation strategies are critical to meet emission reduction targets and often entail fewer environmental risks than many supply-side measures.68 Since they depend on interactions between technological efforts to reduce carbon emissions should go hand in hand with ameliorating people’s vulnerabilities

and social change,69 net zero transitions are value-laden and depend on societal preferences.70 Social change manifests in individual-level social behaviours, practices (e.g. everyday eating or mobility), and broader social relations and structures.71 The IEA, for example, has proposed changes in urban areas, such as phasing out internal combustion engine cars and promoting ridesharing for all urban car trips.72
However, the contributions of behavioural change to net zero are limited. Behavioural change in urban areas (e.g. replacing car trips with walking, cycling or public transport, or foregoing long-haul flights) could provide around 4 per cent of cumulative global emissions reductions.73 Alternatively, urban communities can play an active role in transition processes e.g. through spawning urban innovation, participating in political coalitions for change or redefining
how they engage with infrastructure and markets.74 Such a transition would require moving away from conceptualizing urban dwellers as consumers who influence the transition via consumer choices and instead recognize people as active makers of their urban environments.
Net zero transitions also involve a broader change in the cultural, legal and institutional frameworks that guide the production and use of technology, the everyday practices of organizationsandconsumers,anddesignchoicesforproducts and infrastructures.75 In addition, social movements may foster innovation and transitions towards net zero.76
Market-based incentives and voluntary agreements are insufficient to bring about this kind of social change in urban areas.77 Instead, local governments should implement
Evidence suggests that amidst the call for greener urban futures, global green spending is so far incommensurate with the scale of ongoing environmental crises. A recent study by UNEP of the 50 largest national economies found that only US$368 billion of US$14.6 trillion COVID-induced spending—or just 2.5 per cent of total spending (both rescue and recovery)—in 2020 was green while only 18 per cent of recovery spending was considered so.
Moreover, reports also show that 15 major producer countries continue to provide significant policy support for fossil fuel production; their production plans and projections would lead to about 240 per cent more coal, 57 per cent more oil, and 71 per cent more gas in 2030 than would be consistent with limiting global warming to 1.5°C.
Recovery spending over the course of the pandemic with total green spending, 2020

effective public policy measures such as carbon taxes, building codes, congestion zone charging and subsidies for renewable consumption.78 However, these measures alone are not sufficient to cause wider social change and they may have negative consequences for vulnerable populations. Ultimately, inclusive planning has a crucial role in fostering a societal transition to net zero (see section 5.5).
Greenhouse gas emissions from transport are increasing faster than any other energy-using sector. The transport sector accounted for 27 per cent of global emissions in 2019.79 While the restrictions and lockdowns associated with COVID-19 pandemic resulted in a fall in CO2 emissions from the global transport sector, rebounding demand and anticipated growth are resulting in a steady rise of emission to pre-pandemic levels. Of special concern are road transport emissions, as three-quarters of current global greenhouse gas emissions from the transport sector are generated by road transport alone.80
Securing greener urban futures will require planning for sustainable transport and mobility within and beyond cities to reduce energy consumption, air pollution, noise and GHG emissions. Sustainable mobility can also improve people’s health and well-being, for instance, through active travel
modes like cycling and walking and by reducing commuting time. Sustainable urban mobility depends on the provision of low-carbon transport infrastructure, the introduction of energy-saving technologies and the design of adequate transport planning frameworks.
The pursuit of greener urban futures calls for transport policies that encourage a shift from private cars to public transport, shared vehicles or active travel. Yet, data for 2020 from 1,507 cities from 126 countries shows that, on average, only about one-half of the urban population has convenient access to public transport (Figure 5.3). Often, most people in cities are unable to access sustainable transport options, public or private, due to lack of appropriate infrastructures or individual conditions (e.g. living with disabilities, old age or gender-based restrictions), among other reasons.
Moreover, it is often the poorest communities who depend on cycling and walking. In cities like Addis Ababa, Nairobi, Dar es Salaam or Lagos, more than 40 per cent of the populationdependoncyclingandwalkingfortheirmobility.81 Thus, sustainable transport futures require looking beyond regulated transport infrastructure provision and planning for diverse mobility needs.82 Holistic approaches will require more than just “magic bullet” technologies like electric vehicles. The expansion of transportation networks will require strategies that mix public transport options and carsharing, as well as incentives to encourage non-motorized
travel and reduce the need to travel over long distances (Table 5.2). Addressing cities’ reliance on private transport requires the consideration of complex mobility needs of urban communities. Challenges in the shift to clean transportation include affordability, convenience, ease of travel, availability of different options, the distance between housing and workplaces and personal safety issues.
Traffic congestion and air pollution represent key health challenges for cities worldwide, as urban areas expand to accommodate a growing population. Unplanned urban expansion, the public’s reliance on motorized road transport and high volumes of freight transport to meet urban consumption contribute to maintaining high levels of air pollution.83 According to the World Health Organisation (WHO),airpollution—ambientandhouseholdairpollution— is linked to 7 million premature deaths, annually.84 WHO estimates also show that 99 per cent of the world population breathes air containing a high level of pollutants (exceeding WHO guideline limits), with in low- and middle-income countries more affected.85
Urban air pollution can result in adverse health outcomes, such as heart attacks, strokes, cancer and chronic obstructive pulmonary disease. There is growing evidence that air pollution affects children’s neurological development. In a 2018 report, WHO estimated that 93 per cent of the world’s children are exposed to toxic air daily, putting their health at risk.86 Acute lower respiratory infections caused by polluted air has been linked to the death of 600,000 children in 2016. Vehicular traffic congestion poses other public health risks, including exposure to excessive noise, elevated ambient air temperatures and reduced physical activity.87 Researchers estimate that around 2.1 million deaths can be attributed to insufficient physical activity every year,88 while accidents involving motorized vehicles are responsible for approximately 1.35 million deaths annually.89
Reducing traffic congestion can positively impact emissions reductions objectives and urban dwellers’ health. Measures to reduce traffic congestion include reallocation of road space to non-motorized transport, congestion charging to reduce the presence of polluting vehicles in cities, incentives for walking and cycling, public transport provision improvements and carfree days (Box 5.3). Integrating health impact scenarios into
Rapid Transit Systems
Rapid transit systems operate on a fixed route that increases the service’s speed, capacity and reliability. They include rail transit systems (overground and underground) as well as bus systems operating on segregated lanes (not accessible to cars)
Ease traffic congestion
Investments in low-carbon bus rapid transit systems, light rail and underground systems
Vehicle and Fuel Switching
Vehicle switching refers to incentives (subsidies or taxation) that encourage switching to low-carbon private cars and public transportation systems.
Reduce GHG emissions and air pollution
Subsidies for electric cars; introduction of low-emission zones (extra charge for diesel vehicles driving in certain areas), developing charging stations for electric vehicles, public investments into electric/hydrogen-fuelled public transport systems (e.g. buses), etc.
Active Travel Promotion
Active travel promotion refers to initiatives that encourage walking and cycling for daily trips and discourage private cars.
Reduce GHG emissions and air pollution, enhance public health, disincentivize private car use for short trips.
Reallocation of road space for walking and cycling; regular road closure to create “play streets”; car-free days.
Shared/ collective transport
Collective transport represents an alternative to private car ownership and public transportation for trips not well covered by existing public transportation networks.
Address gaps in public transportation networks; disincentivize private car ownership.
Digitally enabled carpooling and car-sharing, but also regulated and informal collective taxis or mini-buses.
While no major city has banned cars permanently, a combination of policy responses to energy price shocks, advocacy for humanscale urbanism and strong mayoral leadership have strategically limited when and where cars can occupy streets and other urban public spaces. In 1973, the governments of Denmark, the Netherlands, Switzerland and West Germany enacted a series of “car-free Sundays” to conserve scarce gasoline during the OPEC oil embargo. The next year, Bogotá (Colombia) residents petitioned their government for bicycle-only paths on Sundays. That effort planted the seeds for what in the 1990s became an expanded car-free Sunday known as Ciclovía (Spanish for “cycle way”), which closes approximately 120 km of streets to cars and opens them up to people for cycling, walking, rolling, vending, exercise and other non-motorized uses.
The car-free Sunday concept spread beyond Bogotá and has proven exceptionally popular in cities across the developing world where urban residents traditionally have less access to leisure and recreation opportunities. Jakarta (Indonesia) adopted car-free Sundays in 2012, while several Indian cities have tried with mixed results. In Africa, Kigali (Rwanda) introduced car-free Sundays as a monthly event in 2016 which, due to its popularity, became fortnight occurrence. The Ugandan cities of Kampala and Jinja take an explicit stance with the theme “I am the solution to pollution and traffic in my city,” while the car-free days are annually observed in Addis Ababa and other major cities in Ethiopia.
This enthusiasm in the developing world is matched by increasing efforts in developed world cities to remove cars from certain parts of cities. In recent years, Paris has banned cars from a roadway along the Seine River, Oslo and Amsterdam have removed parking spaces from the city centre, and Barcelona has pioneered the “superblock” urban design model that prioritizes people over cars on certain blocks. The need for social distancing during the COVID-19 pandemic provided additional motivation to allocate public space for people rather than cars. Milan announced the reallocation of 35 km of streets and road space to walking and cycling, while Paris announced the conversion of 50 km of roads into cycling infrastructure.
Meanwhile, in a flashback to the 1970s, the IEA has proposed car-free Sundays as a measure to reduce oil consumption during the oil price shock of 2022. This recommendation illustrates how much the car-free city concept resonates in public discourse about energy savings and improving urban environments. However, scientific analysis of car-free days is scant, with little empirical evidence on how much such events reduce environmental degradation, even if they capture the public’s imagination.
Source: Whitney, 1973; Guillermoprieto, 2019; UNEP, 2020a; Peters, 2020; IEA, 2022; Glazener et al, 2022; COVID Mobility Works, n.d.
sustainable transport planning is essential to secure greener, healthier and safer futures for everyone.
Urban dwellers are unevenly affected by the negative impacts of congestion and air pollution, as low-income groups, children, women and girls, and the elderly are often more vulnerable. Environmental justice research shows that schools in low-income neighbourhoods are more likely to be located near polluting infrastructure.90 Low-income groups also face limited transport and mobility options and endure longer and more expensive commutes relative to their income.91 Women and sexual minorities are more likely to face harassment in public spaces and public transport, during the day and night. The mobility of people living with disabilities, the elderly, and children is also significantly hindered in many cities.
Therefore,equityandsafetyissuesmustinforminterventions that encourage active travel and public transport. In addition, modelling tools and future scenario assessments that account for differentiated mobility needs and uneven access to different transport modes are required to make cities safer, more sustainable and liveable for everyone.
Transport planning requires navigating uncertain futures shaped by climate change, economic instability, travel demand,changesinindividuals’behavioursandpreferences, technological disruption and global pandemics. Designing sustainable transport systems in cities requires a mix of qualitative and quantitative tools involving a wide range of stakeholders in order to define collective futures. Decisionmakers can design policy with the help of tools that can
anticipate future travel demand and measure the impact of particular interventions. Quantitative tools include model sensitivity analysis, stochastic modelling, Monte Carlo simulations and Bayesian Networks. Qualitative tools include Delphi methods, road mapping, backcasting and scenario planning.


A high degree of flexibility and adaptability is required to navigate deep uncertainty.92 Quantitative transport planning tools such as forecasting (anticipating future travel demand based on past trends) do not cope well with the uncertainty brought about by unexpected events like the COVID-19 pandemic, long-term trends with a wide range of potential impacts like global climate change and rapid urbanization, and accelerated technological innovation in the transport sector. A review of 210 infrastructure projects across 14 countries concluded that forecasters often overestimate future transport demand.93
Scenario planning is a means to shift current sustainable mobility and transport planning practices from regimecompliant (adhering to past trends in the transport sector and transport policy) to regime-testing (making transgressive policy decisions for sustainable futures).94 Scenario planning integrates both quantitative and qualitative planning tools to design transport interventions and stakeholders’ views.95 Traditional forecasting methods are used alongside more qualitative assessments of plausible and desirable futures. A complementary technique is backcasting, which identifies desirable objectives (e.g. achieving zero-carbon emissions through mobility planning or enhancing access to reliable and affordable transport) and works backward to build a series of steps and interventions to achieve those over a specific timeframe.96
Achieving sustainable transport systems in complex urban environments requires integrating transport planning with other policy domains. For instance, health impact assessments (HIAs) are integrative modelling tools to mainstream public health concerns into policy. However, urban dwellers are rarely involved in the development of HIAs for urban and transport planning.97 Involving people in decisions relating to public health improves the efficacy of any interventions and,
in the case of sustainable mobility, can help include people as active agents in a collective modal shift towards active travel.
Synergistic scenario planning integrates transport planning within broader planning efforts towards carbon neutrality at the city and regional scale.98 Such integrative tools conceive transport as one aspect in the large-scale socio-technical transformation of the energy, transport, industry and building sectors.99 Synergistic scenario planning creates bridges between different policy domains that play a role in securing greener urban futures—including transport—and helps align actors’ interests to build partnerships and share goals. The involvement of stakeholders is essential to identify drivers of change (e.g. energy prices, technological costs, people’s preference for different transport modes) and to assess the feasibility of different scenarios. Urban dwellers’ participation intransportplanningisessentialtoavoidanover-emphasisona small set of transport options and one-size-fits-all prescriptions that bear very little relevance to the implementation sites.
Practicalexperiencesshowthatscenarioplanningforland-use and transport decisions has mixed results, especially without inclusiveandparticipatoryframeworks,clearimplementation plans and resources, and adequate institutional structures.100 Most practical experiences in scenario planning are in North American and European cities, where they rarely address the challenges of informality and rapid urban growth. As a result, most future visions on urban transport emphasize technological solutions, whose effectiveness is not always proven: freight or passenger transport with small airborne vehicles such as drones, flying cars or taxis;101 smart traffic management systems that enable vehicle-to-infrastructure communication to ease congestion and facilitate intermodal travel;102 and autonomous vehicles, connected cars on shared mobility platforms.103
However, the most effective responses are relatively low-cost and/or low-tech: better planning regulations; introduction of low-emission zones; support for cycling and walking; and rapid transit systems. Low-cost responses are particularly relevant in highly unequal cities where most people do not have access to private cars or public transport and thus rely on walking, cycling or informal taxis. The COVID-19 crisis has also fostered low-tech, low-cost measures such as pedestrianizing streets, expanding cycle lane networks or implementing low-traffic neighbourhoods as means to encourage safer, healthier and less polluting forms of travel.
In conclusion, scenario planning is a promising tool to navigate uncertain futures. Still, it only works alongside
Achieving sustainable transport systems in complex urban environments requires integrating transport planning with other policy domains
inclusive, participatory processes that ensure all urban dwellers— particularly those with limited access to different travel options—can take part in the definition of urban futures.104 Travel demand forecasting tools do not easily capture many mobility practices, such as informal transport and active modes of travel. Low-tech interventions should have a prominent role alongside other widely promoted high-tech solutions. Future transport planning will need to integrate, above all, adaptability and flexibility through consistent evaluation frameworks to guide decisions in a context of uncertainty.105 Importantly, holistic transport planning approaches and frameworks such as Sustainable Urban Mobility Plans (SUMPs) as well as the embrace of concepts like the 15-minutes neighbourhood (discussed in Chapter 6) should be viewed and promoted as vital to securing a greener urban future.
Achieving greater justice and sustainability through future transport and mobility planning will require decision-makers to recognize that not everyone can access transport and

mobility options in the same way. Thus, there is greater interest in developing transport strategies with groups whose experiences have traditionally not been included in traditional transport planning, which tends to assume that users of urban mobility are able-bodied males.106 For instance, not everyone can shift transport options depending ontheirincomeoravoidtravelentirely.DuringtheCOVID-19 pandemic, informal and essential workers in urban areas had no choice but to go to work on public transport.
Local governments can make a big difference in opening cities and urban areas to cater to diverse mobility needs with minor neighbourhood investments. Simple measures make a tangible difference, such as street and sidewalk repairs, pavement widening, ramp installation, step-free access to public transport, and well-designed wayfinding signage to facilitate access for people with specific mobility needs, from wheelchair users to caregivers with pushchairs to older persons to the visually or aurally impaired.
In addition to physical infrastructure improvements, affordable fares facilitate public transport access. Many cities have free or subsidized fares for low-income riders, youth and older persons. Tallin (Estonia) introduced free transport for its residents in 2013. The initiative was so successful that it was expanded nationally in 2018. However, undesirable effects included shifts from active travel to public transport
Low-tech interventions should have a prominent role alongside other widely promoted high-tech solutionsBicycle sharing station in New York
for some users, new pressures on the network to meet new users’ needs, and limitations on revenues for further improvements.107
Informal transport systems exist alongside or instead of formal, public or private transport provision systems. Whether run by independent operators or larger cartels, informal transport typically operates outside regulatory frameworks as few developing countries have resources to enforce rules and requirements for transport sector.112 However, operators often self-regulate through “unions” that “police” operations on specific routes or terminals.
Safety is vital to sustainable mobility. Ensuring that streets and public transport are safer for everyone is a challenge that requires urban design interventions. Some groups like women, sex workers, and gender and sex non-conforming people face exclusion from public spaces and roads because they are unsafe. Several cities have started to act on those issues, particularly addressing street harassment against women and harassment in public transport. Torreón, Mexico, has partnered with women’s groups, municipal workers, and UN Women to develop new mobility regulations that safeguard women and girls’ safety in public transport. The mobility regulations serve as a code of conduct for transport authorities, staff, and passengers and entails compulsory training on gender violence for public transport workers. 108 The city of Cairo, Egypt, includes gender assessments in transportation design, facilitating the creation of safer routes for women using public transport. These efforts range from collecting new data (e.g. sex-disaggregated data that reflects women passengers’ experiences), promoting women’s view in the decision-making process and designing genderresponsive interventions (e.g. last-mile safe footpath to bus stops).109

Often, mobility planning tools struggle to account for informal transport systems. Informal transport and paratransit systems (e.g. shared taxis operating based on riders’ destination and minibuses operating on fixed routes) are central to support the mobility needs of millions of people.110 In cities like Kayseri, Turkey, the informal sector may account for 60 per cent of urban trips, and in some African cities such as Dakar or Freetown, over 90 per cent of daily trips depend on informal transport.111 The rise of private-sector app-based ride-hailing services such as Careem, Grab and Uber poses challenges with regards to the nature and dynamics of formalization that is required in urban transport.
Informal and paratransit systems tend to be used by the urban poor and the middle class, especially when public transport options are limited. They play a fundamental role in filling the gaps in peripheral urban areas, which are often overlooked in public transport networks. For example, mothers and caregivers in Abidjan tend to use informal collective transports to drop their children at school.113 Informal transport offers urban dwellers different vehicle types, including minibuses, collective taxis and both motorized and non-motorized two or three-wheelers (Table 5.3). However, the informal transport sector faces safety and pollution issues because vehicles are not regularly replaced or maintained.
Informal transport networks should be integrated into future transport planning, with adequate provisions to support improvements in safety and reduction of polluting emissions. Combining formal and informal transport provision may be effective. Informal transport networks can link urban dwellers living in underserved areas to public transport hubs, avoiding the need to expand public infrastructure networks and building on what already exists.
Countries such as Senegal and the Philippines have introduced stricter regulations to force minibus drivers to buy less polluting vehicles. While these measures can encourage the decarbonization of popular transport modes, they also jeopardize the livelihoods of drivers and operators, for instance, without adequate subsidies and financial incentives to switch vehicles. Local governments can work with operators, drivers, and passengers to plan safer, more efficient routes or to facilitate upgrades to cleaner vehicles and fuels.
Informal transport networks should be integrated into future transport planning, with adequate provisions to support improvements in safety and reduction of polluting emissions
Safety is vital to sustainable mobility. Ensuring that streets and public transport are safer for everyone is a challenge that requires urban design interventions
Minibus/JitneyOperates on fixed routes, following semi-fixed schedules. Can accommodate 12 to 24 passengers and operate across long distances (beyond the neighbourhood)
Microbus/Pick-upOperates on fixed routes, following semi-fixed schedules. Can accommodate 4 to 11 passengers and operate across long distances (beyond the neighbourhood)
Three-wheeler/Motorcycle/Collective Taxi Operates on variable routes at variable schedules, demand driven. Can accommodate 1 to 4 passengers and operates at the neighbourhood level).
Pedicab/Horse cartOperates on variable routes at variable schedules, demand driven. Can accommodate 1 to 6 passengers and operates at the neighbourhood level).
Examples of minibus/jitneys include cars rapide (Dakar), matatu (Nairobi), jeepneys (Manila), dolmus (Istanbul)
Examples of microbus include mikrolets (Jakarta), Selman (Hanoi)
Examples of three-wheelers include bajajs and bemos (Jakarta), rickshaws (Dhaka)
Examples of pedicabs include becaks (Jakarta)
Examples of hores carts include calesas (Manila)
Policymakers face three options to manage the informal transport sector:114
Ban operations and run the risk of displacing service provision to new locations.
Accept the existence of informal transport systems without addressing the challenges they pose, particularly air pollution and congestion.
Integrating and improving existing systems into urban and metropolitan mobility planning and service provision.
The third option will be the most effective to deliver inclusive and sustainable mobility.
The 5th IPCC Assessment Report highlighted the vulnerabilities of urban areas to climate change impacts and identified opportunities for incremental and transformative adaptation.115 The Special Report on Global Warming of 1.5°C pointed towards risks in urban areas, particularly in unplanned and informal urban settlements.116 The contribution of Working Group I to the Sixth Assessment Report of the Intergovernmental Panel on Climate states that human influence on the climate system is now “an established fact” and its impacts are already apparent.117
Urban areas will be affected directly (for example, by frequent extreme climate events, sea-level rise and increased probability of flooding) and indirectly (for example, by largescale ecosystem and social processes such as migration or disruptiontosupplychains).Newfindingsontherelationship between regional and urban climate suggest that unplanned and unsustainable urbanization patterns also exacerbate impacts such as heatwaves and precipitation.
5.3.1. Safety and resilience in urban policy Safety and resilience have become essential themes in urban sustainability policy. The Global Commission on Adaptation argues that an investment of US$1.8 trillion from 2020 to 2030 could generate US$7.1 trillion in total net benefits.118 Urban areas already require investments in climate-resilient infrastructure to improve housing, transport, water, sanitation, drainage and waste management. Whether or not urban areas can meet adaptation challenges, adaptation actions will not happen without consequences and differential impacts are already palpable across urban areas.
Adaptation and resilience agenda is interlinked with development agendas. The 2030 Agenda for Sustainable Development tied “sustainable cities and communities” to both safety and resilience (SDG 11). The New Urban Agenda highlighted cities’ importance to “reduce vulnerability, build resilience and responsiveness to natural and human-made hazards and foster mitigation of and adaptation to climate change.” Adaptation will likely be a salient challenge for cities in the 21st century.
Adaptation is also redefining the urban economy. Local and regional governments, businesses, and citizens will seek to protect human lives, livelihoods and material assets. Many are working to transform adaptation burdens into financial and innovation opportunities. However, adaptation and resilience are intrinsically linked to the need to deliver fairer, more inclusive urban futures.


Disadvantaged groups bear a disproportionate burden of environmental risks in cities. The urban poor worldwide experience higher exposure to health risks through lack of access to clean water119 and exposure to outdoor air pollution,120 toxic materials,121 waste,122 and indoor air pollution due to limited access to clean fuels.123 Lowincome neighbourhoods also frequently have less access to environmental resources, such as green space124 and clean energy.125 The depictions by country in Map 5.1 to Map 5.4 paint a highly unequal landscape of access to water and sanitation.
The risks to the urban poor are likely to worsen in the future. The urban poor are more vulnerable to the impacts of climate change as they often live on sites that are more exposed to extreme weather events (e.g. flooding, landslides, extreme heat and cold) and with limited access to secure

housing and other protective amenities (e.g. health care, water and sanitation services, and social protection).126 Climate impacts are linked to many different risks, which disproportionately affect informal settlements and lowincome neighbourhoods, such as water scarcity127 and exposure to infectious diseases.128 Groups that are exposed to these risks include children,129 women,130 the elderly131 and communities suffering racial or ethnic exclusion.132 Environmental risks also disproportionately impact groups already experiencing a lack of security, for example, due to low and unstable incomes, exclusion from social protection systems,orexposuretoviolence,includingurbanrefugees133 and migrants.134
The latest IPCC report documents the impacts of climate change on urban areas, which will suffer extreme events such as heatwaves, sea-level rise, storm surge from tropical cyclones and intense rainfall. The combination of more frequent extreme events and future urban development suggests that climate change adaptation has become the main priority for local governments.
Moreover, the latest IPCC report documents the complex interactions that influence the expression of climate impacts in urban environments, for example, in the heat island effect or the alterations of the water cycle in urban environments. It highlights the compounded risks that are also likely to affect cities, such as the intensification of warming and mean precipitation. Additionally, a combination of increases in relative sea level and storm surge from tropical cyclones increases the probability of coastal city flooding.
Source: Global Commission on Adaptation, 2019; IPCC, 2021.
adaptation and resilience are intrinsically linked to the need to deliver fairer, more inclusive urban futuresFlooded street in Dhaka, Bangladesh © Shutterstock
Map 5.1: Percentage of urban population with access to basic sanitation facilities by country
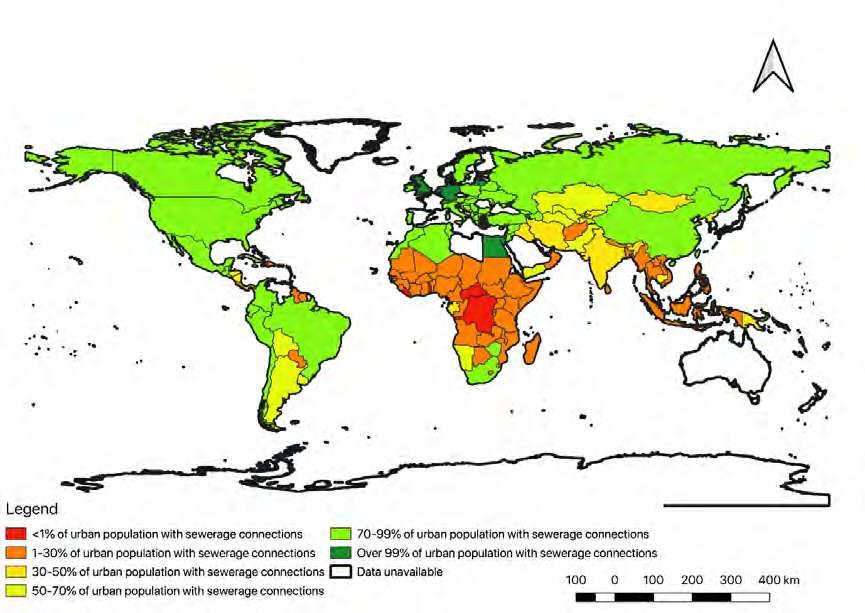
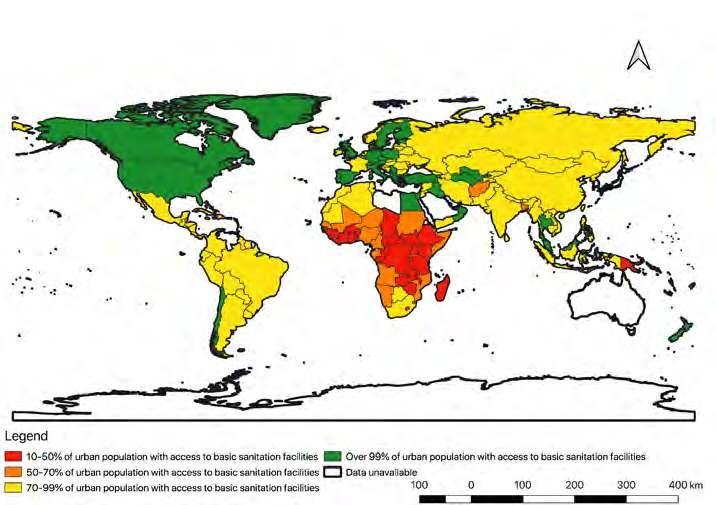
Map
of urban population
sewerage
by country
Map
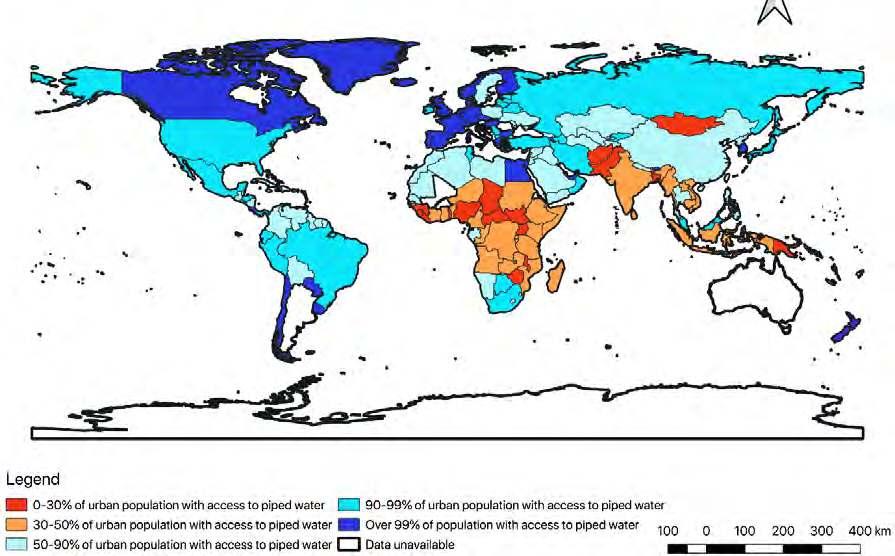
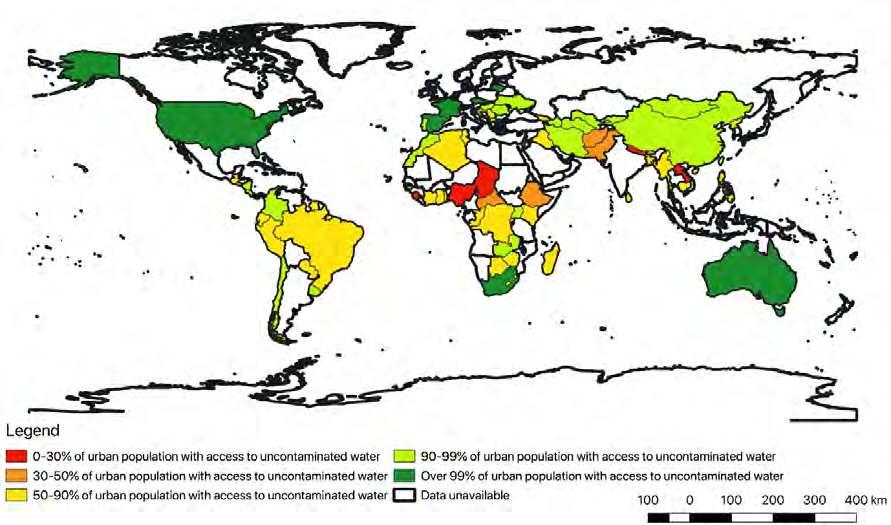
Map
Source:
Urban climate adaptation planning is “the purposeful development by local governments of activities and strategies designed to reduce the effects of climate change on natural, built, and social systems.”135 There are multiple options for climate adaptation in cities, such as water management, land-use planning and green infrastructure.136 Cities have no choice but to adapt to climate change.137 A new paradigm is emerging in adaptation planning that recognizes climate change as an ongoing, dynamic phenomenon in contemporary societies requiring multiple actions, feedback and adjustments. As the well-being of the city entails multiple dynamic processes (economic transactions, social interactions, resource use) and a diverse set of actors, the pursuit of a climate-resilient future requires adaptation planning that works for everyone (Figure 5.4).
the
A central challenge to this paradigm is the amount of available urban land and how it is used, which influences
the potential to address environmental impacts as well as urban inequality.138 Global data on urbanization patterns indicate a continuous rate of urban expansion, also known as urban sprawl, as cities consume land at a faster rate than the growth of their populations. As such, building denser urban areas is generally understood as a more sustainable urban growth model.139 However, density also influences the patterns of infrastructure distribution and shapes urban inequities (see Chapter 2).140
Planning for resilience must also take into account the physical and institutional context of urban planning. A recent study of climate-resilient cities in India examined urban climate action plans developed by thirteen municipal corporations (Table 5.4).141 Such plans usually emerge with support from national or international funding or as part of broader developmental agendas. While each plan focuses on differentproblemareas(suchasenergy,carbonsequestration or urban green spaces), these plans rarely reflect the contextual peculiarities of the city but rather reproduce statements made by the National Action Plan on Climate Change (NAPCC). Most of these plans rely on technological and built infrastructural interventions while overlooking the potential of nature-based solutions or consideration of local knowledge bases, ecologies and processes.
Action-oriented
Ongoing
Strategic
Plan
Process
Carbon neutral city plans
City development plans
PuneRenewables, Carbon sequestration
NagpurPollution Water Gardens Open spaces Disasters Climate change Sustainable development
Resilient city plansGorakhpur Indore Chennai Kolkata Surat Vizag
Water Health Disasters Solid wastes Energy Transport Low carbon Green cover Resource stress Non renewables
Disaster management plans KoraputFloods Fire Drought Heat
Environment status reports Chandrapur Nanded Pollution Solid waste Mining Health
Heat action plansAhmedabad Hazaribagh
NAPCC – National Action Plan on Climate Change
Urban agenda State centre relationships
International relationships
PM Council on Climate ChangeUrban agendaState/Centre relationships International relationships
NAPCC/SAPCC/Asian cities climate resilience network/ ADB funding strategy
Urban agenda State centre relationships
State/Centre relationships International relationships
Disaster Management Act, 2005 Urban agenda State/centre relationships
MoEF directives MPCB directives
International relationships
Urban agendaState/Centre relationships International relationships
HeatDisaster Management Act, 2005 Urban agenda State/Centre relationships
International relationships
Urban adaptation responses often emphasize the development of climate-resilient infrastructure.142 Climate-resilient infrastructureisplanned,designed,built,andoperatedinways that take into account climate-related variability to withstand future climate-changed conditions.143 Resilience will involve measures related to the design of new infrastructures and the retrofitting of old ones, from ICT networks to housing. Digitalization, for example, is increasingly seen as mediating more responsive infrastructure systems but exposes infrastructures to new risks and dependencies.
Standard urban adaptation measures include water storage, flood defences, and water supply and sanitation, alongside housing and spatial planning. For example, basic
infrastructures such as water and sanitation remain a significantconcernbecauseoftheirimpactonachievingother SDGs and because they impact directly on people’s ability to copewithdisasters.AsMap5.1toMap5.4show,thereisstill a substantial deficit in water and sanitation access in several regions of the world, especially Sub-Saharan Africa. Figure 5.5 and Figure 5.6 further shows that urban populations have the highest rates of access. Still, these statistics hide highly uneven patterns of access, as heterogeneous systems of provision dominate the urban environment. Moreover, the definitions of improved access may range widely and includes many people who depend on water kiosks or tanks or having shared facilities: facilities may exist in the proximity but that does not automatically guarantee that urban populations have their needs covered.144
Urbanadaptationalsorequiresabroaderrangeofmeasures, including the development of prevention measures to tackle vulnerability and develop early warning systems, alongside efforts to contain and mitigate disasters, and measures to facilitate rebuilding and adjustment—for example,throughthedevelopmentofnimbleinfrastructure networks. Urban adaptation needs to be considered at the planning stage, in new infrastructures, in retrofitting existing infrastructures, and in examining the additional infrastructure needs that climate change generates. A ‘capability’ approach to urban design seeks to understand actions in the built environment that build resilience while also delivering co-benefits (Table 5.5).
Community-based adaptation (CBA) represents interventions led by communities to build resilience against the impacts of
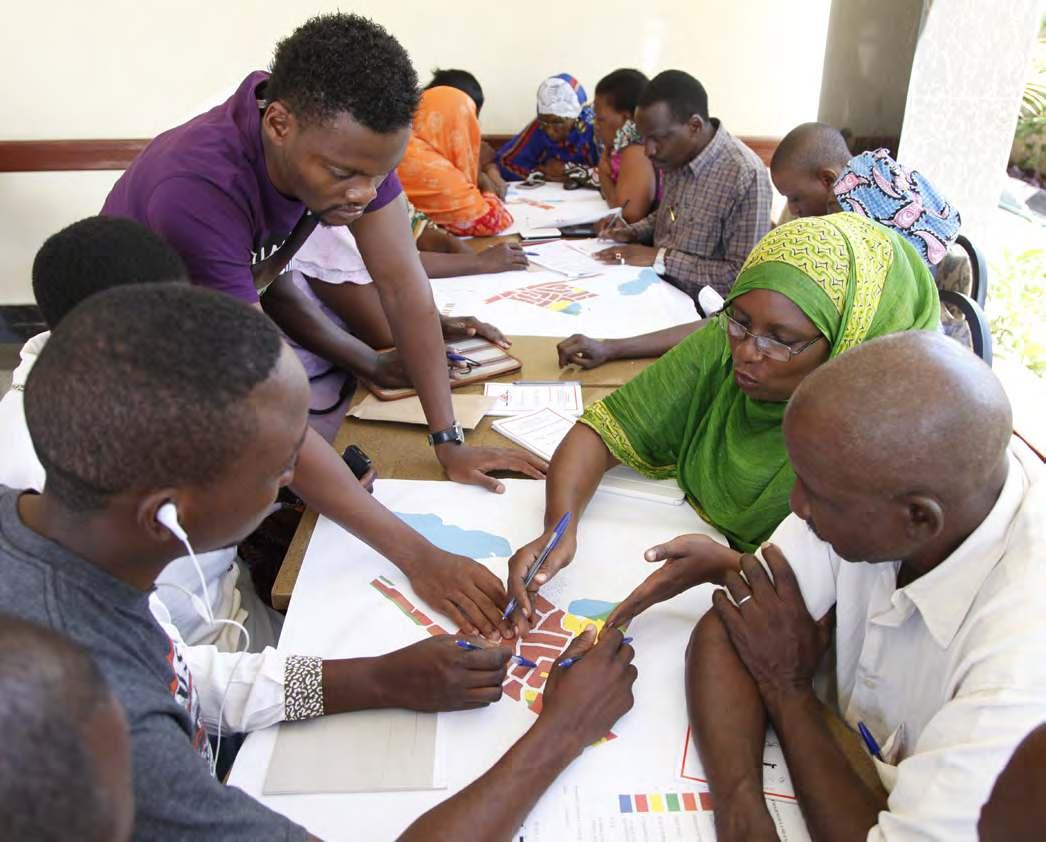
climate change145. CBA is especially important in settings where formal institutions overlook the vulnerability of informal settlements and urgent action is required to address issues like flooding and service delivery146. CBA helps recognizing local capabilities and can be conducted through various participatory methods, including participatory mapping,147 vulnerability indices,148 community engagement inriskcommunication,149 andcommunity-basedvulnerability assessments.150
Urban adaptation needs to be considered at the planning stage, in new infrastructures, in retrofitting existing infrastructures, and in examining the additional infrastructure needs that climate change generates
Health
Outdoor environmental quality at multiple scales (global to neighbourhood)
Indoor environmental quality including air, sound and light quality, physical integrity
Outdoor thermal adequacy
Indoor thermal adequacy
Minimize environmental costs (proximate and distal) of all infrastructure
Ensure low-carbon building does not compromise indoor environmental quality
Seek to reduce outdoor thermal stress imposed through the built environment, including microclimatic characteristics
Recognize potential implications of mitigation policy on indoor thermal adequacy
Protect proximate and distal landscapes and built environment from climate change impacts (e.g. heatwaves, droughts, floods, storms etc.)
Enhance access to spaces of high indoor environmental quality; ensure efforts to enhance indoor environmental quality do not impose stress on outdoor environmental quality
Protect or enhance mechanisms for low-carbon outdoor thermal comfort
Enhance access to domestic low-carbon thermal comfort control; ensure efforts to enhance indoor thermal comfort do not negatively affect outdoor thermal comfort and/or generate additional greenhouse gas emissions
Home Building and operation practices that provide high-quality, low-carbon, affordable housing
Care settings (e.g. care homes and extra-care homes)
Work/school/public life
Accessibility and mobility
Building and operation practices that provide high-quality, low-carbon care provision
Building and operation practices that provide high-quality, low-carbon infrastructure for employment, education and public life
Implementing low-carbon, safe and accessible mobility services; reduce non-human-powered mobility needs overall
Minimize vulnerability of permanent and temporary residential areas to extreme climate events and long-term impacts
Minimize vulnerability of care settings to extreme climate events and long-term impacts
Minimize vulnerability of workplaces, schools and public institutions to extreme climate events and long-term impacts
Ensure low-carbon transportation infrastructure, including humanpowered mobility systems, is accessible and functioning through extreme climate events
Public spaces
Sacred sites and cultural amenities
Water and sanitation
Food systems
Public health
Building high-quality, low-carbon public spaces (including protecting adequate green space) designed to nurture public and cultural life
Avoid damaging sacred or culturally significant sites or amenities when developing low-carbon infrastructure; reduce emissions related to sacred sites or cultural activities
Ensure protections and inclusive access for public space in order to meet the diversity of needs this space addresses in the face of extreme climate events and long-term impacts
Develop meaningful strategies for managing the irreversible loss of sacred or culturally significant sites (including landscapes)
Ensure low-carbon, safe and adequate water and sanitation services
Invest in human and material infrastructure to reduce greenhouse gas emissions of food systems through the entire supply chain
Ensure adequate low-carbon and accessible public health, including minimizing transportation needs
Protect and/or redesign water and sanitation services for resilience in the face of extreme climate events and long-term impacts
Protect and/or redesign food systems infrastructure (including for subsistence production) for resilience in the face of extreme climate events and long-term impacts
Ensure public health infrastructure (and access to it) is protected from extreme climate events or long-term impacts
A key element of adaptation planning is the identification of vulnerable urban populations. Vulnerabilities are often linked to inequalities. Urban populations may see their capability to respond to climate change compromised because of their gender, age, ability, caste, race, sexual orientation and gender
conformity. Many of these identities have been observed to have the potential influence aspects of institutional, cultural, and structural environments that affect people’s everyday lives. However, each experience must be understood in its own unique way.
Table 5.5: Maintaining build environment capabilities for climate change mitigation and adaptationSource: Klinsky and Mavrogianni, 2020.
Theslogan“nothingaboutuswithoutus”151 emergesfroman Eastern European tradition of political struggles. The slogan has served many groups that are identified as vulnerable to claim their voice in policy processes that purport to respond to their needs. The disability rights movements, for example, use this slogan as a means for people to claim a voice in political debates and demand control over their lives, which may be limited by the dependencies generated by powerlessness, poverty, and institutionalization.152 An open city that responds to the needs of people with disabilities— and hence everyone—would require the active involvement of those very people.153
resilience depends not only on facilitating innovation but also on not adding to existing burdens

The slogan has also been adopted by other groups claiming their right to the city, from waste pickers to sex and gender non-conforming people. With this slogan, different people groups claim urban space and display their capacity to influence their environment and quality of life. Moreover, the slogan is a powerful reminder that resilience depends not only on facilitating innovation but also on not adding to existing burdens. The demands for politically redressing existing injustices in the urban environment call for collaborative processes that build resilience through challenging the drivers of inequality.
Informality shapes the vulnerability of people, and as urban areas continue to grow, the gap between infrastructure available and needs will likely grow. However, perhaps the most significant challenge faced by people living in informal settlements is the recognition of their capacities, and sometimes, even their existence. Yet, their capacities in community-led profiling of their neighbourhoods holds great promise (see Chapter 10). There is a need to understand what just urban adaptation—or, more generally, a just transition— looks like from the perspective of an informal settlement.
Often, relatively cheap and straightforward responses (such as waste collection to reduce flooding, housing designs that facilitate cooling, green public space, transitions to streetlights with solar power, access to clean fuels, and collective maintenance of green spaces, among other measures) may have an enormous impact. Yet, climate finance tends to concentrate on large, prestige-oriented infrastructure projects.
Another challenge which has already highlighted in the previouschaptersofthisreportistheexclusionoftheinformal economy. Governing institutions tend to exclude it without recognizing the potential supporting role that informal economy opportunities may provide to ensuring an inclusive green growth, one that also supports social groups already suffering discrimination, exclusion and poverty. Notably, past research has shown that only 25 per cent of countries (or 15 of 60 countries) make explicit mention of the informal economy in their national green economy plans.154
Lastly, it is important to take cognizance of the paradigm shifts in climate change planning processes. While research on climate change planning initially emphasized local authorities’ capacities and institutions, the focus has shifted progressively towards planning as a collaborative and collectiveproject.155 Multipleactors,suchascivilsociety,the private sector, representatives of professional associations and academia, communities, and citizens, are involved in collaborative planning processes that can deliver adaptation planning (see section 5.5.2 for a discussion of various means of involvement).
There are two interpretations of resilience: one is functional and relates to optimizing the process of recovery; the other focuses on the structural challenges and relates to coupling endurance and recovery to demands for justice. Part of the challenge relates not only to the complexity of resilience as a problem to be addressed with current resources but also to the proliferation of climate responses that only entrench and reproduce existing inequalities, and that safeguard some populations at the expense of others:
Climate justice means calling out “false” solutions to mitigating climate change that seek to ease the energy transition for the fossil industry and privileged populations.Manyofthesefalsesolutions involve mining, new infrastructure and exploitative profit and labour schemes that will generate further environmental and climate injustice.156
In that context, delivering resilience is closely linked to our ability to challenge structural drivers of discrimination— be it discrimination resulting from historical legacies of racism, colonialism; discrimination related to sex, gender, age, ability; or other less visible forms of discrimination encountered in everyday life. In that sense, building
resilience requires engaging with the historical processes that have produced vulnerability in contemporary cities. Many of these vulnerabilities are manifest in the spatial configuration of cities, for example:
The spatial division in urban areas between neighbourhoods that are better serviced than others, with lower-income populations being hosted in areas where access to basic services such as water, mobility, or energy are compromised.157

The creation of areas of privilege safeguarded at the expense of others, for example, in the creation of new enclaves of privilege. In Africa, for example, there is a proliferation of “urban fantasies” in urban projects and masterplans that do not only fail to recognize the realities of urban development in African contexts but also impact negatively on the lives and livelihoods of urban populations, even when those projects are not even constructed.158
The privatization of services and public space, reducing the urban commons for everyone.159
The displacement of people who are prized out of certain neighbourhoods, after the environmental quality of those neighbourhoods raises local prizes in multiple manifestations of gentrification.160
The differentiation of areas with different levels of risks,161 that often end up accommodating vulnerable populations and new migrants.162
The siting of large infrastructures in areas considered of less value, normally inhabited by less powerful black or indigenous communities—and the creation of sacrifice zones163 in processes long documented in indigenous struggles and environmental racism that claim for different frames of reference beyond development.164
Inclusive greener futures can be secured though active practices of building resilience through community innovation and collaborative planning (see section 5.5 ) and through the prevention of processes that negate peoples’ lives and existence through the implicit privileging of some lives over others—what the philosopher Achille Mbembe has called necropolitics.165 These are all processes directed through infrastructure and spatial planning and through policymaking, which can be actively prevented in the quest for just urban adaptation (see also section 5.5.1).
Nature-based solutions (NBSs) are a potential mechanism to manage the impacts of climate change in urban spaces. NBSs are promising in the context of halting biodiversity loss and restoring urban ecosystem services in economically viable ways.166 The International Union for Conservation of Nature (IUCN) defines NBSs as “actions to protect, sustainably manage, and restore (create) natural or modified ecosystems” that simultaneously address social challenges, providing both human well-being and biodiversity benefits.167 The European Commission explains that because they are inspired and supported by nature, NBSs are cost-effective and provide environmental, social, and economic benefits.168
Ecosystem services
Focus on the benefits that the natural environment and ecosystem provide to humans and societies
Regulating the provision of water, food and services
Facilitating nutrient cycling
Biomimicry
Biomimicry involves approaches that emulate nature to develop responses to human challenges, for example, in urban design
Ecosystem-based adaptation and mitigation
Use of ecosystem services to reduce vulnerabilities to climate change impacts and to reduce carbon emissions
Fibbers that mimic spiders’ silk
Imitation of algae for water purification
Building materials that imitate the structures of mycelium
Restoration of coastal habitats such as mangroves
Restoration of wetlands and peatlands
Green and blue infrastructure
The vegetational- and water-related elements that structure the built environment and provide additional services
Ecosystem approaches
Strategies that focus on the integrated management of land and nature, which consider humans part of the ecosystem
Involve a range of infrastructures including blue (rivers, canals, ponds, wetlands, floodplains, water treatment facilities) and green (trees, lawns, hedgerows, parks, fields, urban forests)
Activities that involve people, value ecosystems, and understand ecological processes
NBSs highlight the importance of biodiversity and ecosystems toaddressurbanchallengessuchasadaptingtoclimatechange, enhancing food security and or facilitating water access. NBSs are aligned with the United Nations 2030 Agenda for Sustainable Development and follow a tradition of designing with nature to respond to human challenges (Table 5.6).169
While NBSs offer several benefits, they can also pose some challenges for urban areas. First, NBSs such as greening and artificial wetlands for sewage treatment require significant provision of land and physical space. Land-intensive responsestoenvironmentalcrisesmaynotbepracticalormay generate additional challenges, especially when they displace existing land uses. Second, if not guided by a right-based approach, NBSs may displace local economies dependent upon the urban landscape—thereby perpetuating systemic or structural violence. Third, NBSs are not always the most effective means to address certain challenging problems, such as soil and water pollution. Fourth, NBSs may conflict with larger technological or economic development agendas,
requiring careful integration into the region’s urban planning goals. Lastly, the long-term implications of NBSs, especially in terms of social and ecological change in the places where they are implemented, remain unknown (Figure 5.7).
Urban blue and green spaces provide multiple ecosystem services that are essential for human wellbeing, for example:170
Providing basic ecosystem services, such as food and water
Enabling cultural ecosystem services, such as recreational and spiritual benefits
Supporting regenerative ecosystem services such as nutrient recycling, soil conservation and microclimate regulation
Both urban sprawl and densification (due to the urban heat island effect) pose challenges to public health, natural systems and ecosystem services.171 Rapid urbanization has placed additional demands on urban ecosystem services, thus driving a scarcity of material and biological resources. At the same time, ecosystems are functioning at reduced capacity due to pollution and extraction.172 The pressures of urbanization and increasing population often render urban green and blue infrastructure vulnerable.173 Urban inequalities manifest in differentiated access to ecosystem services, such as less access to green spaces and a reduced urban tree canopy for lower-income urban dwellers.174 These inequalities can have deadly ramifications as climate change impacts urban health.

Urban planning policies across the globe continue to focus on built infrastructure and technological improvements with limited consideration of ecosystems and biodiversity.175 For example, the large-scale conversion of biodiverse areas to farmland or housing impacts negatively on ecosystem services.176 Moreover, urban planning rarely integrates biodiversity and ecosystem services into service and design, aside from demonstration projects.177 Even when focusing on these challenges, urban planning tends to focus on symptomatic short-term and incremental treatments to problems that require transformative planning and long-term solutions.178
Integrating NBSs in policy and planning further suffers from a lack of clarity in the underlying science and the very complexity inherent in the dynamics of urban socialecological systems.179 NBSs may arise through collective motivation in the peripheries of cities that lack access to critical infrastructures for water, sanitation, mobility and energy.180 However, NBSs are often perceived as inferior to centralized physical infrastructure (such as electricity networks or large waterworks) and are usually overlooked when these regions receive connectivity through more extensive city-based networked infrastructures.181
Rural and urban dichotomies persist, despite being challenged on the ground by substantial differences between jurisdictional and administrative boundaries, resource flows andbuilt-upspaces.182 Somefieldsofstudy,suchaslandscape ecology, have moved beyond these dichotomies to recognize gradients of rurality and urbanity—in other words visualizing landscapes where the rural melds into the urban, forming rural-urban continuums.183 Such approaches examine periurban regions’ social and ecological dynamics, especially in developing contexts where centralized infrastructure for critical ecosystem resources such as water and energy provision may often be fragmented, missing or deleterious. However, these approaches are still rare.
Benefits and limitations of nature-based solutions
5.4.2. Building resilience with NBSs NBSs support societal development and enhance human well-being in ways that reflect the plural cultural values of urban society while enhancing urban resilience and the capacity of cities to provide essential ecosystem services.184 Indeed in many urban areas, NBSs have been associated with positive effects on urban biodiversity and human health.
Studies in cities in the US and India have demonstrated that daytime air temperature is significantly reduced in urban areas with a greater tree canopy cover, especially on the hottest days of the year and times of the day.185 Globally it has been shown that green spaces within cities (such as parks or other tree lined areas) are on an average 0.94°C cooler than build up areas without greenery.186
NBSs involving the establishment of wetlands and green urban spaces in Italy have reduced urban flood risk with a reported 10 per cent greater reduction in downstream flood events and a 7.5 per cent reduction in peak flow when compared with non-NBS-based infrastructural
interventions.187 The success of NBSs for flood control in São Paulo (Brazil) have encouraged municipal authorities to include them in the city’s Climate Action Plan in the context of stormwater management.188 Rewilding of parts of Slovenia’s Mediterranean coastline has improved soil quality, thus positively impacting the region’s ability to sequester carbon and store water, as well as its overall biodiversity capacity.189 An NBS approach adopted within Copenhagen after a 2011 flooding event was highly effective in reducing urban flood risk, though the implementation of NBSs in the city has since been highly contested.190
Real estate values often increase dramatically as properties get closer to urban green and blue spaces.191 The effect of this increases may be mixed, as nature-based projects may also drive processes of urban gentrification that intensify inequalities.192 NBSs may provide local employment and business opportunities with beneficial outcomes for society, environment and public health.193 A recent study shows that ecosystem restoration creates 3.7 times as many jobs as oil and gas production per dollar (Box 5.5).194
Box
Building
Industrial
Geothermal
Solar
Upgrades
Wind
Hydropower
Pedestrian-only
Bicycle-only
Mass
Railways
Electric
Battery
Electric
Ecosystem
US$1
US$1
US$1
US$1
US$1
US$1 million
US$1
US$1
US$1
US$1
NBSs, therefore, present an approach to developing sustainable solutions that focus on human well-being, while at the same time being responsive to long-term environmental changes and associated hazards.195 Often, they provide economically viable and inclusive responses.196 They can be integrated in planning processes that not only value nature beyond benefits and services to humans, but also incorporate diverse perspectives relating to nature and community that emerge within plural cultural contexts.197 UN-Habitat and UNEP, with the support of European Union, is currently implementing the Go Blue Project across six counties in Kenya’s coastal region (Kilifi, Kwale, Lamu, Mombasa, Taita Taveta and Tana River). The project aims to unlock opportunities in urban centres in these counties for sustained and inclusive economic growth, while mainstreaming conservation and sustainable use of the coastal and marine environment.198
5.4.3. NBSs for sustainable urban futures
Ecological considerations should be an integral part of urban planning processes. Integrating NBSs in urban planning and policy requires appropriate capacities to respond to the fundamental changes that societies face while keeping nature at the centre of planning processes and frameworks. The city of Manizales, Colombia, for instance, is mainstreaming biodiversity solutions into its planning policy and legal frameworks, supported by UN-Habitat and University of Michigan.199
NBSs can also be integrated into the circular economy to restore existing relations with nature in urban environments and incorporate nature into sustainable business models.200 “Bioconnections” are strategies that promote reconnections between society and nature with efforts aimed at stewarding, regenerating and maintaining biodiversity and ecosystem services to support the circular economy.201 Examples of bioconnections include traditional methods like reforestation for carbon sequestration and experimental methods like using microalgae photobioreactors to extract nutrients from wastewater, produce oil, generate biomass and electricity.202
The use of engineered wood or bamboo from reforested sources could create carbon sinks in urban spaces as it has been shown that materials such as bamboo can remove five to six times more carbon from the atmosphere in comparison to conventional timber-based construction material,203 although globally, the extent to which construction materials can remove carbon emissions also depends on how forests are managed.204
Restorationandprotectionofbiodiversitythroughgreenbelts, regenerative farming, permaculture and pollinator gardens are important components of NBSs for urban planning.205 NBSs to regulate ecosystem services include the use of compost from organic waste in urban agriculture to promote nutrient recycling, nitrogen and phosphorus recovery through cultivated wetlands that recycle wastewater, and nutrient loss reduction through stormwater drainage and rooftop gardening.206
NBSs can also be integrated into large infrastructural projects. For example, water-efficient cityscapes promote flood control through green infrastructure, thus reducing surface runoff, increasing groundwater retention and filtering pollutants.207 Guidelines for integrating NBSs into urban planning must consider the sustainable sourcing of raw material required for NBSs, further involving measures for resource traceability and exchanging industrial infrastructure and other by-products.208
Participatory governance can support the creation of social networks to support, develop and maintain NBSs.209 NBSbaseddesigncansupporttheco-creationofspeciallydesigned and equitable spaces for different social groups, addressing questions of age, ability, gender, sexual orientation, or race. A study in Berlin showed that supportive social networks facilitate the access of elderly people to green spaces.210 Cities may have a certain potential to buffer the impacts of change, enhance human well-being and contribute to global sustainability and resilience.211 However, these strategies require an understanding of the social, ecological and economic peculiarities of urban spaces in order to assess the suitability of proposed NBSs, beyond standalone interventions.212 In sum, NBSs must be part of inclusive planning processes for sustainable urban futures.
Envisioning and realizing a greener urban future require inclusive planning processes. Addressing existing vulnerabilities and inequalities213 and delivering just and transformative outcomes necessitates the involvement of diverse perspectives.214 This section focuses on, first, identifying existing inequalities and injustices in urban environmental decision-making and, second, proposes a set of approaches to include diverse perspectives in environmental decision-making. A recent joint publication by UNEP and UN-Habitat highlights the importance of seeking equity and justice across all local environmental action and
programming—emphasizingthattheseconsiderationsshould not be addressed as an afterthought. The report further calls for “ensuring that those most affected by unsustainable ‘business as usual’ approaches are heard, that their needs are taken into consideration, but also, and crucially, that their knowledge of urban dynamics, and their capacity to partner in solution finding and city-making, are taken seriously.”215

Planningforgreenerurbanfuturesrequiresforegroundingthe experiences of vulnerable groups. Yet, many disadvantaged groups lack access to the social and political processes and institutions where environmental decision-making takes place. Decision-making processes must prioritize the needs of disadvantaged populations because an urban environment that serves the needs of vulnerable people is also an urban environment that serves the needs of everyone.
However, urban decision-making processes often exclude the urban poor, who tend to have fewer resources, time and connections than established stakeholders and urban elites, even when those processes are designed to be participatory.216 Likewise, women are often excluded from the urban planning process, partly because of gender norms concerning formal and informalpoliticalleadershipandweakerrepresentationinformal economies.217 Migrantworkersarealsoroutinelyexcludedfrom decision-making processes, despite their exposure to socioenvironmentalrisks.218 Otherformsofpoliticalexclusioninclude discrimination based on race,219 ability,220sexuality221 and socio-political background (e.g. marginalization of refugees).222 All strategies for inclusion require careful consideration of how exclusion has shaped experiences of citizenship and belonging and how to facilitate political recognition, for example, through dialogue, the establishment of mutual respect and different forms of reparation.223
Sometimes environmental policies and programmes in cities lead to the entrenchment of existing inequalities and vulnerabilities is a rights-based approach is not applied. For example, investment in green urban spaces can cause negative impacts on lower-income and marginalized communities by
increasing property prices and contributing to gentrification processes.224 Infrastructure investment to build urban resilience can concentrate wealth in enclaves for the benefit of urban elites.225 Investment on adaptation projects in cities can also lead to evictions and displacement of the urban poor and slum dwellers, resettlement on land exposed to risks, and disruption of informal livelihoods.226 These insights align with a long-standing understanding of how urban development visions,especiallyformaleconomicandspatialplansdeveloped through top-down and expert-led processes, often are poorly aligned with the needs of low-income groups and even directly detrimental to their lives.227 The impacts of environmental policy on the most disadvantaged must be central to planning for green urban futures.
Epistemic injustice occurs in urban planning when groups and individuals in positions of formal and informal authority downplay and invalidate multiple forms of knowing and living in the world.228 The concept is closely tied to histories of colonization, as the occupation of lands and peoples also involved the subordination of their cosmologies and worldviews.229 In the context of environmental decisionmaking in cities, the legacies of such domination manifest through hierarchies of knowledge, in which some forms of knowing are consistently valued above others.
The marginalization of indigenous knowledge is one form of epistemicinjusticeinurbanplanning.Ontheonehand,there is growing recognition that indigenous knowledge can play a key role in building green cities by contributing to climateresponsive designs.230 Some indigenous communities are highly vulnerable to climate change impacts, particularly those who live with and depend on local ecosystems.231 For instance, Indigenous knowledge of weather patterns can improve early warning systems to reduce flooding.232 Participatory mapping, or other knowledge exchange methods, can incorporate indigenous knowledge in urban risk assessments.233
Incorporating indigenous knowledge into environmental decision-making in cities is not straightforward. Indigenous knowledge is frequently not recognized234or reduced to narrowly defined policy domains (e.g. cultural heritage).235 There is a risk that indigenous knowledge is appropriated when integrated into dominant knowledge systems without consent, through subordination within dominant knowledge systems, especially when disconnected from indigenous values.236 Addressingepistemicinjusticeisnotonlyaquestion of the revaluation of indigenous knowledge systems. It is also a question of recognizing the occupation of indigenous
Sometimes environmental policies and programmes in cities lead to the entrenchment of existing inequalities and vulnerabilities is a rights-based approach is not applied
lands and locating claims to sovereignty, autonomy and land ownership at the heart of urban planning.237
Addressing epistemic injustice also relates to building recognition for local and traditional forms of knowledge. In Finland, local knowledge has contributed to protecting ecosystemsinurbanplanningprocesses,especiallyinpreserving nature of importance to residents.238 Traditional knowledge has played a role in biodiversity preservation in communities in northeastern India, for instance, by maintaining community gardens.239 In Bucharest, Romania, a participatory process compiled residents’ experiences and needs to develop bicycle infrastructure aligned with local preferences.240
Taken together, indigenous knowledge, local knowledge and traditional knowledge provide alternatives to expert-led, technical-scientific planning, more recently captured by the concept of “subaltern knowledge.”241 Subaltern knowledge consists of situated, place-based forms of knowing excluded fromdominantknowledgeproductionandplanningprocesses. Subaltern knowledge can play a crucial role in environmental planning, for example, urban climate adaptation, especially in producing socially just and responsive plans to the needs of diverse communities.242
Urban initiatives to address epistemic injustice support the revaluation of identities and perspectives and the creation of rights for socially or politically excluded people (e.g. based on age, ethnicity, race, migratory status, sexuality, or gender).243 One relatively well-known example is the lack of recognition of waste pickers,244 of which organizations like WIEGO work with such communities to build legitimacy and respect for their work.245
Gender-responsive planning includes strategies to address gendered power relations and make women’s perspectives central to urban planning.246 For example, projects to rediscover and preserve cultural heritage help revalue histories and cultural identities that have been marginalized in a city. Cultural heritage protection can easily be co-opted by global narratives not aligned with local concerns247 or even reinforce inequalities and oppression.248 Methods of “counter-mapping” and artistic production can provide alternative means to redefine the feminist city.249
A partnership between Cities Alliance and Shack/Slum Dwellers International (SDI) established to support informal communities to build resilience in the context of the COVID-19 pandemic provides insights on how to align recovery programmes with the priorities of the urban poor. First, the provision of sanitation is essential in communities that lack access to basic washing facilities. Projects that provide such services can play a role in aligning measures to prevent virus transmission with ensuring long-term access. Second, by strengthening safety nets, communities can reduce vulnerability to multiple kinds of shocks. For example, savings groups can address collective concerns with pooled resources. Third, communities can play a leading role in collecting data and raising awareness. Thus, they can draw attention to urgent needs, formulate collective priorities, build channels of communication and negotiate capacity vis-à-vis government authorities or donors.
Source: SDI, 2021.
A green, sustainable urban future requires delivering environmental benefits across urban areas to reach every segment of the urban population, especially those who are most disadvantaged. Prioritizing the needs of the most vulnerable means creating opportunities within local planning processes to represent their views, a requirement already reflected in the 2030 Agenda for Sustainable Development. Planning needs to be approached as a collaborative process capable of bringing together diverse views and perspectives.250 A variety of formal organizational arrangements enable public participation in urban decision-making (Table 5.7). Many of these tools are regularly used to incorporate participatory designs into urban planning processes.
The popularization of mobile applications has increased the use of participatory tools in urban planning, including as a means to collect environmental information, create local networks and facilitate public dialogues.251 Some models of public involvement and participation are also available in electronic formats, which in some contexts may increase opportunities for access. In China, for instance, such technologies have unleashed a stronger public voice on environmental governance and sustainability issues relating to urban areas.252 However, such advantages are contextdependent and online communication may be most effective in combination with face-to-face interaction.253
Citizen assembliesDecision-making bodies composed of lay citizens tasked with providing a recommendation on specific policy issues. Citizen assemblies are used in urban planning to engage ordinary residents and create deliberation.
Citizen panels or citizen juries
Community councils
Created by a random selection of citizens to provide feedback on policy options or, in the case of juries, provided with information and expert input to make a recommendation on a policy issue
Decision-making body through which residents can influence neighbourhood decisions. They exist in multiple forms (neighbourhood associations, community enterprises, religious congregations), which may be grassroots-led or supported by local authorities. Community councils can provide access to political processes for low-income groups, but in operating outside of formal democratic institutions, they may also be co-opted by dominant local interests.
The Grandview-Woodland Citizens’ Assembly in Vancouver, Canada, involved citizens in a broad range of urban planning decisions showing that an assembly can be a cost-effective way to realize citizen participation. A citizen food assembly organized in York, UK, functioned as a platform for debate and drew attention to food insecurity.
In Spain, citizen juries have increased citizen engagement in social problems; however, they represent limited participation in decision-making systems overall, and their impact on policy may be limited.
In East Jerusalem, community groups perform many social functions, including service provision (e.g. education and culture), community organization, and political representation.
Participatory budgeting
An approach to involve citizens in budget allocation that aims to increase citizen involvement, enhance the accountability of decisions related to local finance, and align planning processes with local needs. It can be used in relation to urban environmental planning.
Experiences from Porto Alegre and Belo Horizonte, Brazil, suggest that participatory budgeting can increase access of previously excluded groups to decision-making, even though the poorest citizens remain excluded. In Porto Alegre, participatory budgeting may have brought environmental benefits by channelling financial resources towards sanitation and wastewater management, public transport, waste collection and green space. Participatory budgeting in Polish cities functioned as a source of creativity and innovation, with potential benefits for environmental management. Participatory budgeting processes in Medellín, Colombia, empowered women, including through enhanced leadership skills and awareness of the political system. In cities in the US, participatory budgeting has played a role in providing access to “traditionally marginalized residents,” including “non-citizens, seniors, people of colour, and youth” (at the same time, the time-consuming character of these processes is identified as a drawback).
Participatory planning
Participatory elements are central to broader urban planning processes, such as master plans or zoning regulations. Participatory planning is also a strategy to address urgent issues in deprived neighbourhoods or informal settlements.
Experiences from São Paulo have shown that participation in master planning and zoning is one way for groups to articulate priorities in planning processes. However, such participation favoured affluent citizens, and they are not guaranteed to deliver socially just outcomes. In Kenya, participatory planning in informal settlements has been used to advance upgrading schemes and identify residents’ priorities. However, in Egypt, participatory exercises in informal settlements have struggled to address underlying drivers of marginalization, such as land ownership and tenure, housing markets, and financing structures.
Consultative processes
In urban planning, consultations can take a range of formats, such as surveys, focus groups, public meetings, or citizen dialogues. These processes can be implemented with varying numbers of participants, in comprehensive urban planning processes or sector-specific issues, and city-wide processes or neighbourhoods.
Participatory methods in Malaysia’s urban planning processes include public hearings, citizen forums, community or neighbourhood meetings, citizen surveys, focus groups, and online public outreach. Some methods are more effective in reaching larger numbers of citizens (e.g. citizen surveys). In contrast, other methods may be less representative but more effective in terms of generating deliberation to address complex questions (e.g. public hearings or focus groups).
Note: Participatory mechanisms extend the definition of citizenship to everyone in a city regardless of their citizenship status, to avoid excluding vital participants such as migrants and refugees
Source: Lacelle-Webster and Warren, 2021; Beauvais, 2018; Doherty et al, 2020; Font and Blanco, 2007; Avn et al, 2021; Souza, 2001; Calisto Friant, 2019; Bernaciak et al, 2017; Park et al, 2018; Hajdarowicz, 2018; Gilman, 2016; Nasca et al, 2019; Caldeira and Holston, 2015; Majale, 2008; Khalifa, 2015; Ismail and Said, 2015.
Table 5.7: Institutions and methods that facilitate participation in urban planning and management
There is a growing interest in participatory visioning, forecasting and scenario planning methods, including approaches that build on arts and creative exercises. This interest emerges from the need to radically rethink cities and urban futures to respond to social and ecological crises.
Participatory scenario planning represents one approach to reimagine urban futures collectively. A scenario is “a coherent, internally consistent, and plausible description of a potential future trajectory of a system.”254 Scenario planning assumes that the future is uncertain; therefore, planning must consider multiple development trajectories with differential impacts on diverse social groups.255 Scenario planning combines quantitative methods (modelling, forecasting, analyses of large datasets) with qualitative strategies to draw on experiential knowledge and imagine different futures.256 The technique is used in relation to natural resource management (e.g. forests, wetlands, coral reefs), but also in the context of urban planning to address complex, long-term socio-ecological issues, incorporate multiple knowledges and build shared understandings (examples of applications in urban or peri-urban planning include cases in Germany, Kenya, South Africa, and the US).257
While the technical skills involved in forecasting and modelling can significantly influence professional stakeholders, the objective is to engage diverse publics and interests.258 Public participation sessions, community workshops, and groups discussions are often used throughout the process to ensure that various preferences are embedded in all stages of scenarios planning, employing tools such as drawing, mental models, maps and creating storylines.259 A key outcome can be to create dialogue about the assumptions and normative principles that underpin data-heavy modelling and projections. The exercise invites dialogue and reflection among stakeholders with different concerns and ideological entry points (e.g. scientists and activists).260
At the same time, achieving participation that is both deep (in-depth involvement in scenario creation) and wide (participation of a large, representative segment of an urban population) is often challenging.261 A comparative analysis of 23 participatory scenario planning processes showed that the average number of participants was around 50 (rarely above 90), there was a lack of diversity of participants, uneven power relations prevented participation on an equal basis, and the impact on policy-making was unclear (monitoring and evaluation were often missing).262
There is also a new toolbox of collective visualization approaches available in urban planning, for example, through maps,263 gaming264 or public participation GIS tools (for public involvement in spatial planning).265 However, it is not clear whether such collective visioning exercises necessarily lead to just and green cities. Creative engagement methods encounter similar forms of challenges with participation as conventional participatory tools. They may, for example, focus on narrowly defined goals or preclude in-depth engagement with the lives of urban residents.266
Collaborative modes of urban governance are today commonplace in cities around the world. Co-production represents approaches to reimagine urban decisionmaking from shared ownership in service delivery and joint knowledge production in planning. In the context of service delivery, co-production reflects the logic that municipal services are more effective and just when both public actors and citizen groups are involved.267 For example, in the delivery of water services in Lilongwe, Malawi, the co-production of services by a public utility and civil society groups addressed inefficiencies
in delivery by the state and built social capital among communities.268
Co-production responds to the complexity of socioenvironmental challenges, which always involve multiple problem frames and possible solutions. Co-production is one way to bring together stakeholders, forms of knowledge, and perspectives in response to this complexity.269 Also, it represents an opportunity for social movements to shape the terms and conditions of planning.270 Co-production as a form of joint knowledge production in decision-making can deliver various outcomes, such as local capacity building, drawing attention to environmental injustice and
increasing public communication and transparency.271 An example of co-production in urban environmental planning is the formulation of the Barcelona climate plan, where co-production opened up the use of new digital platforms to involve citizens, but also raised practical challenges (e.g. with regards to the timing of citizen input, unequal knowledge of participants, and confusion about the meaning of co-production).272
Partnership-based approaches bring different social groups (authorities on multiple government levels, businesses, NGOs, community associations) into urban governance. Urban partnerships exist in a range of organizational forms, including more or less formal arrangements, such as contractual arrangements between public and private actors for infrastructure and service delivery (i.e., publicprivate partnerships, policy coalitions, advisory boards and panels, jointly managed programmes and international networks.273 Partnerships represent a governance strategy that draws on the strengths of different social groups, including capacities for innovation and investment of the private sector and abilities of community engagement and responsiveness of social issues of civil society.
Urban decision-making can also operate through different forms of synergies with activist movements. The inclusion of multiple perspectives in environmental decisionmaking occurs through collaboration and contestation and conflict, even agonism and strife.274 Activist groups play a crucial role in urban environmental politics, including introducing new issues into decision-making agendas, drawing attention to existing forms of injustice, and participating in neighbourhood projects— as long illustrated by environmental justice movements.275 The recent wave of global youth protests in climate politics such as Fridays for Future, Extinction Rebellion and the Sunrise Movement highlights the importance of demonstrations in environmental politics.
The engagement of grassroots organizations, community groups and international environmental movements played a crucial role in adopting declarations of climate emergency by local authorities around the world.276 The rising awareness of the complex interconnections between multiple forms of social and environmental injustice, such as the links between racism, environmental justice and state violence,277 creates a renewed sense of urgency for activist groups and social movements in urban environmental decision-making processes.


The events of the last two years, raising concerns about climate change and the need to deal with the COVID-19 pandemic, have highlighted the need for a global partnership for sustainable development. This is a moment like no other to facilitate cooperation and global solidarities.278 Building partnerships requires an enabling environment capable of sustaining long-term initiatives that recognize every actor, from youth activists to private-sector corporations, as part of the solution.279
Climate politics is dominated by multilateralism, as the UNFCCC orchestrate efforts via voluntary agreements and nationally determined contributions.280 However, the impact of these efforts requires examining action on the ground and gaps between voluntary commitments and emission reductions needed to achieve the goals of the Paris Agreement persist.281 Subnational actors not only can provide additional emission reductions to bridge this gap282 but also can influence global partnerships and advancing global development agendas. 283
Transnational municipal networks (TMNs) facilitate the cooperation on climate change between local governments and other subnational institutions, including regions, and non-state actors that can stir up climate action at the local level.284 These networks have harnessed cities capacities to create a new scene of global environmental governance. 285 City networks cast local governments as mediators between global concerns and place-based solutions.286
TNMs are most often voluntary and non-hierarchical organizations.287 While there is a variety of models of TMNs, multinational membership is a shared characteristic.288 Membership of transnational municipal networks is more common in Europe and North America, but many have global reach.289 TMNs support cities to create and implement policy and planning, practices and voluntary standards that support emission reductions and address vulnerabilities.290 Gaining influence in international arenas is a key motivation for cities to join TNMs.291
The International Council for Local Environmental Initiatives (ICLEI) is a pioneering TMN. It was created after hundreds of local governments gathered at the Congress of Local Governments to a Sustainable Future organized by the United Nations Environmental Programme (UNEP) in New York, in 1989 with 200 local governments from 43 countries. In its inception, ICLEI’s main objective was to support local governments to transform effectively towards a greener economy.292
With currently over 1,750 local and regional governments in more than 100 countries, the organization helped cities embark on a pathway towards low-emission, nature-based, resilient and circular development. ICLEI’s first programs emphasized participatory governance and sustainable local development planning. The Cities for Climate Protection (CCP) campaign, promoted by ICLEI, was the first to support cities in planning climate action to reduce greenhouse gas (GHG) emissions, improve air quality and increase sustainability and habitability. Over the past decade, UN-Habitat and ICLEI have supported local governments as they develop comprehensive urban low-emission development strategies (Urban-LEDS) and climate action plans.
Another bottom up TNM is the C40 Cities Climate Leadership Group (C40), formed in 2005 when the London Mayor Ken Livingstone brought together representatives of 18 megacities to cooperate to reduce greenhouse gas emissions. The group has grown currently including near 100 megacities in every region. C40 has increasingly focused on establishing concrete, measurable goals but its members are also increasingly concerned about the potential of coupling emission reductions with ancillary benefits for resilience and prosperity.
The European Union’s Covenant of Mayors for Climate and Energy (EU CoM) was launched in 2008 with the European Commission’s support.293 As of January 2021, EU CoM has more than 10,600 signatories, mainly from the EU, as well as nearby countries like Morocco and Turkey. The Covenant of Mayors also appears as a key actor in the Urban Agenda for the EU, launched with the Pact of Amsterdam. Other top-down networks have emerged from the cooperation between multiple organizations at different levels. For example, in 2014, the United Nations Secretary-General Ban Ki-Moon and its Special Envoy on Cities and Climate Change, Michael R. Bloomberg, in cooperation with C40 and ICLEI, launched the Compact of Mayors. The Global Covenant of Mayors for Climate and Energy (GCoM) emerged with the combination of efforts in the Compact of Mayors and the EU Covenant of Mayors in 2016, becoming the largest initiative of this kind, with more than 10,500 cities and local governments from 138 countries as of 2021.
Source: Castán Broto et al, 2022; Urban LEDs Project (https://urban-leds.org/)
This chapter engages with the potential to deliver green urban futures. It highlights some aspects of the current state of climate action:
First, delivering green urban futures is a massive challenge of global proportions, and so far, our collective impact on global average temperatures has been limited. A more significant effort is needed to turn around the unsustainable pathways that contemporary cities and urban areas follow.
Second, there is mounting evidence about future scenarios’ development and how future thinking can
inform urban planning. A key lesson is that scenario planning requires input from multiple actors and that forecasting techniques alone are not sufficient to deliver an urban transition to sustainability.
Third, in the post-pandemic context, there are increasing fears that we are losing the window of opportunity to catalyze a green urban transition through the deployment of recovery funds.
Four, inclusive planning processes must recognize multiple forms of knowledge valuable to planning and recognize the need to deliver equity and justice. In the case of informal settlement dwellers and impoverished populations, this means recognizing all urban dwellers not as passive victims of an urbanization process but
as active makers of urban futures that must be given a range of arenas to make their voice heard.


The following policy lessons may contribute to sustainable urban futures:


Invest in participatory methods for scenario planning and combine participatory planning techniques with forecasting techniques.
Prioritize inclusion and the needs of the most vulnerable in the delivery of green urban futures.


Prepare to learn from both transnational experiences of climate and biodiversity action and place-based initiatives.


Build capacities to enable change at scale.


Experiences in energy management, transport, risk management and nature-based solutions demonstrate the potential of people-oriented forms of planning.

1. IPCC,2021.
IPCC,2018.
TheClimateGroup,2022.
IPBES,2019.
IPCC,2018.
Ramaswamietal,2021.
ChavezandRamaswami,2013; Ramaswamietal,2017.
Ramaswamietal,2021.
Hausfather,2021.
Dykeetal,2021.
Lewis,2021;Dykeetal,2021
Smithetal,2016:Dykeetal,2021; Leungetal,2014
Bailey,2007a;Bailey,2007b; Lohmann,2001;Lohmann,2008.
Hausfather,2021.
HughesandStrachan,2010.
Forsteretal,2020.
Bataille,2020.
Batailleetal,2020.
Pyeetal,2017.
Bataille,2020.
Habertetal,2020.
Goodessetal,2021.
Karunathilakeetal,2018.
Karunathilakeetal,2020.
Bakhtavaretal,2020.
Carlsonetal,2022.
HughesandStrachan,2010.
Forsteretal,2020.
Bradfieldetal,2005.
HughesandStrachan,2010.
TyszczukandSmith,2018;Hughes andStrachan,2010;Geels,2005.
Fortesetal,2015;Foxon,2013; Geelsetal,2016;Turnheimetal, 2015.
HughesandStrachan,2010.
Geelsetal,2020.
Hofmanetal,2004.
Hulme,2011;O'Brien,2016.
TyszczukandSmith,2018.
IEA,2021b.
IEA,2021b.
Carrington,2022.
Boyleetal,2021.
Boyleetal,2021.
Gronkiewicz-Waltz,2020.
UNFCCC,2021a.
Setoetal,2021.
Chesteretal,2014;ICLEI,2018.
Hsuetal,2020.
Becchioetal,2018.
MariqueandReiter,2014;Marique etal,2013.
Nematchouaetal,2021.
You,2021.
Harris,
Abdullah,2021.
Andrijevicetal,2020.
Eyreetal,2018.
Creutzigetal,2018.
Edenhofer,2015;Riahietal,2015.
Geelsetal,2016.
Markard,2018.
Köhleretal,2019.
IEA,2021a;IEA,2021b.
IEA,2021b.
Schotetal,2016.
Köhleretal,2019.
AllanandHadden,2017.
77. Mobergetal,2019;Marteauetal, 2021;Highametal,2016.
78. Chenetal,2019;Marteauetal, 2021;Capsticketal,2014.
79. IEA,2021c.
80. IEA,2021d.
81. C40KnowledgeHub,2021.
82. Levy,2013.
83. IPCC,2014a.
84. WHO,n.d.
85. WHO,n.d.
86. WHO,2018a.
87. Nieuwenhuijsenetal,2017.
88. Forouzanfaretal,2016
89. Roadtrafficmortality,TheGlobal HealthObservatorydataportal (https://www.who.int/data/gho/ data/themes/topics/topic-details/ GHO/road-traffic-mortality)
90. Maantay,2007.
91. McArthuretal,2019.
92. Walkeretal,2010.
93. Flyvbjergetal,2006.
94. LyonsandDavidson,2016.
95. Schuckmannetal,2012.
96. Ravetzetal,2021.
97. Nieuwenhuijsenetal,2017.
98. Ravetzetal,2021.
99. Ravetzetal,2021.
100. Bartholomew,2007.
101. Broom,2021.
102. Busch,2017;Cunningham,2017.
103. McKinsey&Company,2020; Heinekeetal,2019.
104. Levy,2013.
105. LyonsandDavidson,2016.
106. Imrie,2000;Sheller,2018.
107. Zhen,2021.
108. UNWomen,2019.
109. UNWomen,2019.
110. Evansetal,2018.
111. UITP,2021
112. CerveroandGolub,2007.
113. Surico,2021.
114. Kumaretal,2021.
115. Revietal,2014.
116. IPCC,2018.
117. IPCC,2021.
118. GlobalCommissiononAdaptation, 2019.
119. Meehanetal,2020;UNESCO,2019; Kjellstrometal,2007.
120. Kjellstrometal,2006;Ganzleben andKazmierczak,2020.
121. Sovacool,2019,BryantandMohai, 2019.
122. KubanzaandSimatele,2016, Gutberletetal,2017.
123. Smithetal,2004.
124. Roeetal,2016.
125. Singhetal,2015.
126. Richmondetal,2018;Dodmanet al,2019;HlahlaandHill,2018;Gran CastroandRamosDeRobles,2019.
127. Grashametal,2019;Adamset al,2020.
128. AbuandCodjoe,2018.
129. Guptaetal,2017.
130. Kheretal,2015.
131. Sanchez-Guevaraetal,2019s 132. MitchellandChakraborty,2014. 133. Creaetal,2017.
134. Zhongetal,2017;Østby,2016; Adgeretal,2021
135. Hughes,2015.
136. IPCC,2018. 137. Susskind,2010. 138. McFarlane,2020. 139. Angeletal,2021. 140. GuzmanandBocarejo,2017.
141. UnnikrishnanandNagendra,2021.
142. GlobalCommissiononAdaptation, 2019;“..upgradinglivingconditions invulnerablecommunities—which mightmeanimprovinghousing, water,sanitation,drainage,and wastemanagement—willbuild resilienceandstrengthentheir adaptivecapacity.”(Rosa-Aquino, 2019.)
143. OECD,2018a.
144. Satterthwaithe,2021.
145. Satterthwaiteetal,2020;Richmond etal,2018,Foxetal,2021;Castán Brotoetal,2015;Dobsonetal,2015.
146. Foxetal,2021.
147. Harveyeal,2017.
148. Lasageetal,2015.
149. Khan,2017.
150. Wilketal,2018.
151. Sometimeexpressedinlatin: Nihil de nobis, sine nobis
152. Charlton,1998
153. Tanabeetal,2018.
154. IIED,2016.
155. Chuetal.,2016;Hughes,2015.
156. Whyte,2021.
157. SeetheAtlasofInformality(https:// www.atlasofinformality.com).
158. Watson,2014.
159. EidelmanandSafransky,2020.
160. Anguelovski,2016;Anguelovskiet al,2019;GouldandLewis,2016;
Riceetal,2020.
161. Mustafaetal,2018;Paneral,2017.
162. Delazerietal,2021;Porstand Sakdapolrak,2018.
163. CastánBrotoandSanzanaCalvet, 2020;Valenzuela-Fuentesetal, 2021.
164. Dorriesetal,2019;McGregoret al,2020.
165. Schipperetal,2021.
166. Dorstetal,2019.
167. Cohen-Shachametal,2016.
168. EuropeanCommission,n.d.
169. UnitedNations,2017;EEA,2021a.
170. Perringsetal.,2009.
171. Haase,2021.
172. Langergraberetal,2020.
173. Unnikrishnanetal.,2020;Girmaet al,2019.
174. Kayananetal,2021;Anguelovski etal,2019.
175. Cilliers,2021.
176. NormanandSteffen,2018.
177. NaturalCapitalGermany–TEEB DE,2017.
178. Swartetal,2021.
179. Dorstetal,2019;Moslerand Hobson,2021.
180. Methetal,2021.
181. Unnikrishnanetal,2020.
182. Seeforexample:Simonetal,2004 183. Gagné,2013. 184. Kabischetal,2016.
185. Ziteretal,2019;Vailsheryetal, 2013.
186. Bowleretal,2010.
187. Liqueteetal,2016.
188. PrefeituradoMunicípiodeSão Paulo,2021.
189. VanHalletal,2017;Romero-Díaz etal,2017.
190. Madsenetal,2017.
191. ŁowickiandPiotrowska,2015.
192. Anguelovskietal,2019;Gouldand Lewis,2016.
193. Nikolaidisetal,2017. 194. WRI,2021. 195. Lafortezzaetal,2018. 196. Elmqvistetal,2015.
197. Randrupetal,2020. 198. GoBlueProject(https://goblue. co.ke/)
199. UN-Habitat,2021c.
200. EuropeanCommission,2020. 201. BenitesandOsmond,2021.
202. Elrayies,2018.
203. Churkinaetal,2020;Hinkleetal, 2019.
204. Pomponietal,2020.
205. HaalandandvanDenBosch,2015; Garrardetal,2018;Rhodes,2017; Parrisetal,2018.
206. Shresthaetal,2020;Wielemakeret al,2020;Haradaetal,2018.
207. Directorate-GeneralforResearch andInnovation,European
Commission,2020;Elyand Pittman,2014.
208. Volans,2020;Debackerand Manshoven,2016.
209. Nesbittetal,2018;Clavinetal, 2021.
210. EnssleandKabisch,2020.
211. Luederitzetal,2015.
212. Albertetal,2019;Almenaret al,2021.
213. Shietal,2016.
214. Ziervogel,2019;Henriqueand Tschakert,2020.
215. UNEPandUN-Habitat,2021.
216. Anguelovskietal,2016;Olazabal etal,2021;CaldeiraandHolston, 2015.
217. Kinyanjui,2014;Chant,2013; Williamsetal,2015;Kivoi,2014.
218. ChuandMichael,2019;Liand Rose,2017.
219. Tretter,2016.
220. Bell,2019,Stafford,2020.
221. IrazábalandHuerta,2016.
222. AllenandSlotterback,2021; Seethaler-Wari,2018.
223. CastánBrotoetal,2021.
224. Anguelovski,2016;Anguelovskiet al,2019;GouldandLewis,2016.
225. BiggerandWebber,2021;Long andRice,2019.
226. Anguelovskietal,2016;Warner andWiegel,2021.
227. Olajideetal,2018;Watson,2009; Kimari,2016.
228. Forexample:MendesBarbosaand Walker,2020
229. deSousaSantos,2015;Pitts, 2017.
230. ChanzaandDeWit,2016; MakondoandThomas,2018.
231. Hooli,2016.
232. AbuduKaseietal,2019.
233. Robinsonetal,2016.
234. AnyumbaandSirayi,2021.
235. PorterandBarry,2015.
236. West,2019;JankeandSentina, 2018;Fordetal,2016
237. Dorriesetal,2019.
238. Yli-PelkonenandKohl,2005.
239. Singhetal,2010.
240. Nițăetal,2018.
241. Olazabaletal,2021;Kothari,2002.
242. Olazabaletal,2021.
243. FincherandIveson,2008.
244. Onyanta,2016;Michaeletal, 2019.
245. Dias,2016.
246. OrtizEscalanteandGutiérrez Valdivia,2015;Huning,2020; Beebeejaun,2017.
247. Fredholm,2015.
248. Weiss,2014.
249. Perryetal,2021.
250. Healey,1997.
251. Ertiö,2015.
252. Heetal,2017.
253. Aichholzeretal,2015.
254. Oteros-Rozasetal,2015.
255. ZapataandKaza,2015;Freeth andDrimie,2016.
256. Oteros-Rozasetal,2015;Malinga etal,2013.
257. Oteros-Rozasetal,2015;Zapata andKaza,2015;Chakraborty, 2011.
258. ZapataandKaza,2015. 259. Oteros-Rozasetal,2015. 260. FreethandDrimie,2016. 261. ZapataandKaza,2015. 262. Oteros-Rozasetal,2015. 263. Mølleretal,2019. 264. Billgeretal,2017. 265. Kahila-Tanietal,2016. 266. Johnetal,2015. 267. MitlinandBartlett,2018. 268. AdamsandBoateng,2018. 269. Perryetal,2018. 270. Watson,2014. 271. PerryandAtherton,2017. 272. Satorrasetal,2020.
273. Harman,TaylorandLane,2015. 274. Pløger,2004 275. PearsallandAnguelovski,2016, Carter,2016 276. Ruiz-Campillo,CastánBrotoand Westman,2021 277. Pellow,2016,Pulido,2020 278. Gornitzaetal,2020.
279. StibbeandPrescott,2020. 280. GordonandJohnson,2017; BäckstrandandKuyper,2017. 281. Rayneretal,2021.
282. Hsuetal,2019 283. UnitedNations,2017. 284. Khan,2013;Melicaetal,2018. 285. Curtis,2018.
286. Fünfgeld,2015. 287. RashidiandPatt,2018. 288. Buschetal,2018. 289. Bansardetal,2017. 290. Lin,2018;Gesing,2018. 291. Domorenoketal,2020. 292. RashidiandPatt,2018. 293. Domorenoketal,2020;Reckienet al,2018;Melicaetal,2018.

1. While there was a significant drop in climate emissions during COVID-19 lockdowns, the numbers are rapidly increasing towards pre-COVID levels upon easing of public health restrictions.
2. Current urban planning approaches have achieved limited success in reducing urban inequality and achieving social inclusion, a trend that may persist in the future without appropriate intervention.
3. Indoor and outdoor spaces need redesigning or retrofitting to be more flexible and resilient to shocks, disruptions or pandemics looking into the future.
4. Compact cities are resilient to pandemics and a wide range of other shocks and threats.
5. Cities are strongly linked to their hinterlands; therefore, integrating urban-rural linkages in future urban planning approaches is key for the resilience of cities.

1. Post-COVID recovery programmes should not only focus on economic recovery but also on social inclusion and climate action.

2. The importance of compact development, managed density and prevention of overcrowding in city resilience should be re-emphasized in view of rising concerns over overcrowding in cities during pandemics.
3. Cities should implement best practices and policy tools such as sustainable neighbourhood planning, the 15-minute city concept and sustainable urban mobility plans (SUMPs) that have been effective in making cities more resilient.
4. Safe, affordable, and reliable public transport systems are sustainable and should be integrated with active mobility.
5. There is an urgent need to focus on strengthening integrated urban and territorial planning approaches that consider interactions between urban, peri-urban and rural areas.
Whiletrendsprojectthatratesofurbanizationwillincreasein many parts of the world in the coming decades, unexpected eventsliketheCOVID-19pandemicortheconflictinUkraine also create unpredictability along that trajectory.1 As such, preparing for multiple futures that still lead to sustainable and resilient cities able to accommodate rapid urban population growth is a major task that lies ahead of urban planners and decision-makers. How existing and new cities will be developed to accommodate nearly 2.5 billion new inhabitants will have major implications for the future of our planet and for achieving the Sustainable Development Goals.
Currently, cities are responsible for more than 70 per cent of global energy consumption and associated greenhouse gas emissions indicating their significance in achieving climate change mitigation targets.2
As Chapter 5 highlighted, cities will also be at the forefront of climate change adaptation efforts in the coming decades. Additionally, cities are exposed to a wide range of natural disasters such as floods, extreme heat and sea-level rise. For instance, results of a recent report show that about 20 per cent of urban residents worldwide would be exposed to a 100-year flood, and more than 600 cities are likely to be completely inundated by a 100-year flood.3 As the urban population in low-lying coastal areas grows, conditions may worsen in the coming decades if cities fail to plan resiliently. Alongside these challenges, cities are also struggling to overcome major inequality issues and provision of equitable access to services and resources to all urban residents.
The COVID-19 global pandemic emerged amidst these challenges and hit many cities hard, underscoring issues related to public health, urban planning and design, and municipal governance. The public health crisis revealed urban vulnerabilities, such as environmental pollution, deep
pointed out in recent UN-Habitat reports, the outcomes of development processes guided by those models and paradigms do not align with the principles of social, economic, and environmental sustainability.5 As a result, while cities have traditionally been centres of innovation and could be part of the solution to global challenges such as climate change, existing urban planning and development models seem to be inadequate for building sustainable and resilient cities.
The pandemic has provided an opportunity to reflect on urban planning and design principles and ideas that have been practised over the past several decades. This reflection is essential to understand what transformations are needed tostreamlinesustainabilitytransitionsandimproveresilience to future pandemics and other stressors looming over cities such as climate change. The pandemic has questioned the fundamental principles of contemporary urban planning and has highlighted social, economic, environmental, and institutional problems that cities have been facing for decades in a new light. Further, it has shown that societies can act quickly and cities can change drastically if needed.
The period from 2020–2022 is not the first time that pandemics have hit cities. Public health crises have always played a significant role in the advancement of urban planning and policy as evidenced by events such as the 1858 Great Stink of London that resulted in sewer management, or the December 1952 smoke-laden fog that was the basis for the introduction and enactment of the 1956 Clean Air Act.6 Indeed, it can be argued that previous epidemics and pandemics such as tuberculosis and the Spanish Flu prompted the birth of modern urbanism. Hygienic measures and non-pharmaceutical interventions such as wastewater treatment, waste management, sewage control, indoor air circulation and lighting, and building height-to-width ratio have emerged in response to such public health threats.7
social inequalities, inadequate and inequitable access to urban services, lack of integrated urban management, limited availability of public transportation infrastructure, and limited access to open and green spaces.4 That many cities have struggled to appropriately plan, prepare for and manage the impacts of the pandemic is a clear indication of the inadequacy of current models and paradigms of urban planning and design that guide urban development in many parts of the world. As
While COVID-19 is not yet endemic and many aspects of the disease are still being explored, a lot of research on cities and the pandemic has been published since early 2020.8 Now is the time to reflect on the impacts of COVID-19 on cities to understand their inherent vulnerabilities and draw lessons for building back in a better and more resilient way that ensures better coping, absorption and recovery capacities when confronted with future shocks. The pandemic has led to many changes to previously normal ways of living. While it is too early to say whether such changes are temporary or permanent, it can be argued that the pandemic will have significant implications for urban life and the way cities will be developed and managed in the future. Indeed, recent
As the urban population in low-lying coastal areas grows, conditions may worsen in the coming decades if cities fail to plan resiliently
 Tyumen region, Russia. Aerial view of the residential area of the suburb of Nizhnevartovsk during the flood of 2015. © Vladimir Melnikov/Shutterstock
trends such as the accelerating uptake of smart solutions and technologies,9 rapid adoption of teleworking, and flight from high-density inner-city neighbourhoods attests that there is a prospect for some major changes in the post-COVID era.10
The critical role of cities in dealing with global challenges and the need to revisit urban planning, design and management were already well-recognized before the pandemic. Since the landmark year of 2007, when the world’s urban population exceeded the rural population for the first time, attention to cities has been growing steadily. This trend is manifested by the allocation of a separate chapter to cities and human settlements in the research of the Intergovernmental Panel on Climate Change since the Fifth Assessment Report in 2014 and agreements on several major international policy frameworks such as the New Urban Agenda, 2030 Agenda for Sustainable Development, Sendai Framework for Disaster Risk Reduction, Addis Ababa Action Agenda, and Paris Agreement on Climate Change, which all have specific relevancy to cities and their future. Amidst such initiatives and efforts to guide future urban planning and development, the pandemic has further highlighted the unsustainable current trajectories of urban growth and development and added a sense of urgency on the need to take concerted actions across different scales and streamline the global urban transition towards more sustainable futures.
The UN-Habitat reports World Cities Report 2020 and Cities and Pandemics: Towards a More Just, Green and Healthy Future highlight how well-planned, managed and financed cities can create value. That value, in turn, can be harnessed for sustainable urban futures and provide the basis for local and regional actions that can be taken to facilitate a better and more sustainable recovery from the pandemic.
and the importance of multi-level and integrated planning approaches that account for dynamic interactions across urban-rural interfaces. While there is a major emphasis on the pandemic, issues discussed in the chapter are not exclusive to it. Rather, other important challenges facing cities are also discussed, such as climate change. Additionally, the chapter avoids providing case-specific recommendations since context is important, and what can work in a specific city may not work elsewhere. Instead, the general ideas and principles discussed here will provide a basis for contextspecific local actions that will enable cities to enhance their resilience to future pandemics and make progress towards achieving the SDGs.
Modern urban planning has traditionally been aligned with state authority and highly influenced by market forces. Therefore, it has tended to favour economic growth and the needs of middle- and high-income people while largely failing to be socially inclusive and protect the environment. As a result, many cities are locked into undesirable and unsustainablemodels.Whilemarketforcesarestilldominant, some paradigm shifts towards more inclusive and sustainable urban development have been made in the past several years. However, urbanization in some developing countries has been so rapid that urban planning and infrastructure have not developed sufficiently to meet the demands of all urban residents in a sustainable and timely manner. Additionally, some countries lack the financial means to support sustainable infrastructure development for all.
This chapter builds on these efforts by focusing on some major planning-related issues that emanate from the recent crisis, namely the need for green, inclusive and sustainable recovery; retrofitting urban infrastructure to allow for safe social distancing when necessary; measures to promote the compact city; the need for sustainable neighbourhood planning and design; the significance of safe, affordable and reliable public transportation systems for the future;
The COVID-19 pandemic is a window of opportunity to evolve revisiting current urban planning paradigms and identifying shortcomings and areas that need improvement to inform a more green and inclusive recovery.11
As arguments on the need for deep decarbonization continue to gain ascendancy, temporary dips in pollution during the early phase of the pandemic illustrate the beneficial outcomes of greening transportation systems and cleaning up heavy industries as discussed in detail in Chapter 5.12 While lockdowns halted urban travel patterns abruptly for knowledgeworkers,thepost-pandemictrendtowardahybrid model where office workers no longer come in five days per week has the potential to reduce peak travel demand and pollution. Furthermore, as will be further discussed later
in this chapter, investment in and promotion of public and active transportation systems especially in cities should be prioritized. Such actions will enhance urban resilience to future adverse events and contribute to climate change adaptation and mitigation in cities.13
In response to the pandemic, many governments worldwide imposed lockdowns and mobility restrictions, the result of which were major improvements in air and water quality. Many cities around the world, especially those in developing countries such as China and India, reported unprecedented reductions in the level of airborne pollutants such as PM2.5, PM10, CO2, NO2 and SO2. Declines were significant in

cities that imposed lockdowns given the dominance of road transportation and associated emissions in urban areas (Figure 6.1).14
However, recent reports on the growth rate of carbon dioxide emissions post-lockdowns do not indicate an ongoing green recovery. As countries eased mobility and activity restrictions and return to pre-pandemic normal emissions increased rapidly (Figure 6.3, Figure 6.2 and Box 6.1) and even reached a record high level in 2021.15 Either recovery packages are not prioritizing green growth, or the pandemic has caused delays in the implementation of some climate action plans.
UrbanPre-lockdown (February-March 2020) Peak-lockdown (April- May 2020) Post-lockdown (June- July 2020)
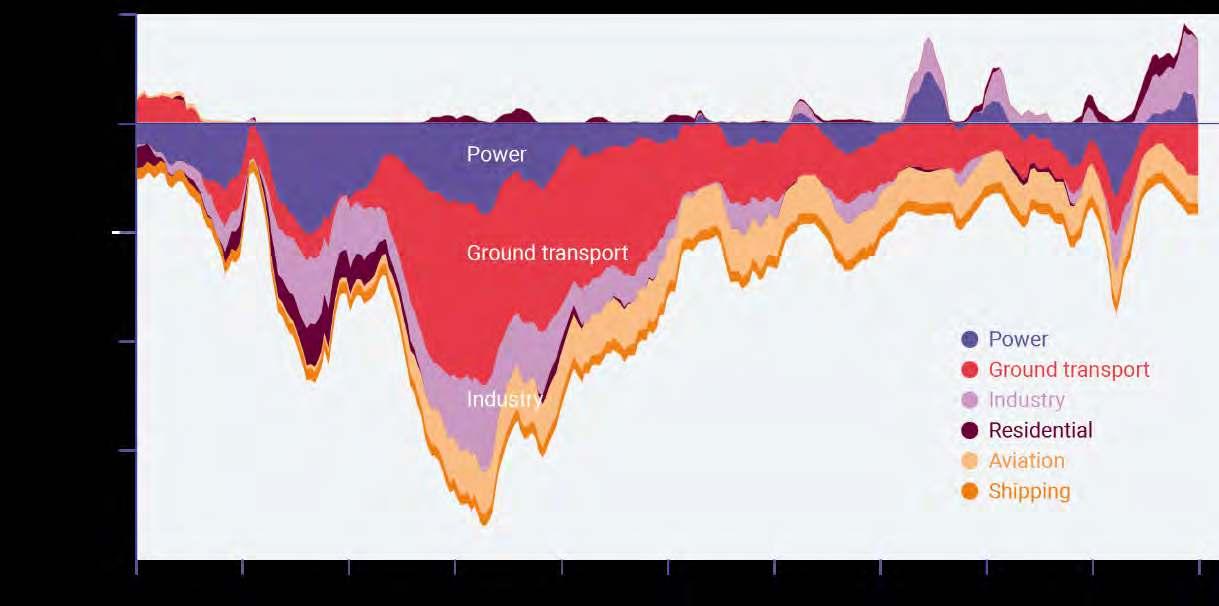
Global CO2 emissions from fossil fuels dropped by 5.4 per cent in 2020, compared to the previous year. But they are set to increase by about 4.9 per cent above 2020 levels in 2021, reaching 36.4 billion tonnes. The fast growth in emissions matches the corresponding large increase in energy demand as the global economy opens, with the help of US$17.2 trillion in economic stimulus packages around the world. CO2 emissions from all fossil fuel types (coal, oil and natural gas) grew in 2021, with emissions from coal and natural gas set to grow more in 2021 than they fell in 2020. Emissions from global coal use were declining before the pandemic hit in early 2020 but they surged back in 2021. Emissions from global gas use have returned to the rising trend seen before the pandemic. CO2 emissions from global oil use remain well below pre-pandemic levels but are expected to increase in the coming years as road transport and aviation recover from COVID-related restrictions.
Source: Canadell et al., 2021.
Based on such observations, experts working at the nexus of science and public policy urge leaders at all levels to align pandemic recovery plans and programmes with global, national and local climate action plans in order to minimize climate risks and provide co-benefits for health and equity.16 One important lesson from the pandemic is that cities that have taken early actions to contain the spread of COVID-19 have been more successful in controlling outbreaks.17 Drawing a parallel between public health measures and urban climate action, it can be argued that timely climate policy at the city level is essential to reduce the future costs associated with climate change adaptation and mitigation in cities and building resilience to pandemics.18
Experts working at the nexus of science and public policy urge leaders at all levels to align pandemic recovery plans and programmes with global, national and local climate action plans
Cities and Pandemics: Towards a More Just, Green and Healthy Future provides city stakeholders with guidelines for planned recovery towards sustainable cities. Cities are encouraged to build resilience to future shocks and stresses by investing in and transforming urban weak spots, both systemic (such as car-based movement systems) and areabased (informal settlements, suburban and peri-urban areas). Additionally, well-designed urban density, at a human scale that includes adequate facilities and functions to balance long-term social, economic and environmental sustainability, can enable a level of resilience to the impacts of pandemics without compromising liveability. Planning for transition away from automobile-oriented models with single land uses towards more pedestrian-oriented, mixed-use, diverse and
Planning for transition away from automobileoriented models with single land uses towards more pedestrian-oriented, mixed-use, diverse and compact city plans will create more flexible and adaptive urban forms to respond to future pandemics
compact city plans will create more flexible and adaptive urban forms to respond to future pandemics.19
Major achievements were made in reducing the share of people living in extreme poverty following the implementation of the Millennium Development Goals. However, the reduction rate slowed down to only about 1.8 per cent between 2015 and 2019. In 2020, the pandemic exacerbated global extreme poverty for the first time in more than 20 years due to a combination of factors such as loss of employment, economic stagnation, and decreased remittance to low- and middle-income countries. This setback added about 120 million people to those living below the poverty line (Chapter 3). Furthermore, foreign direct investment in developing countries dropped by 8 per cent in 2020 compared with 2019.20 Considering these impacts, many cities in vulnerable developing countries are likely to decide to prioritize economic growth. Under such circumstances, international cooperation in providing financial support to facilitate inclusive recovery is indispensable.
Previous pandemics have demonstrated that vulnerable groups such as ethnic minorities, the urban poor, women21 and children are disproportionately affected, making it
difficult to contain the spread of infectious diseases in cities.22 Despite this historical precedent, modern urban planning has achieved limited success in ensuring equitable distribution of resources, and profound inequalities have existed in cities for several decades. Most notably, close to 30 per cent of the world’s urban population lives in slums or slum-likeconditions.23 Compliancewithsocialdistancingand hygiene guidelines recommended for containing the spread of the virus in such contexts is difficult, if not impossible.
Overcrowded environments are not conducive to social distancing. For instance, the average per capita floor area for 60 per cent of urban residents in India is about 6 square metres.24 Peoplelivinginslumsareoftencrampedwithlimited or no access to clean water and sanitation. Consequently, slum dwellers face challenges in following hand-washing guidelines and contaminated water resources may also further increase the risk of pathogen spread. In addition to these issues,
slum dwellers often have precarious livelihood conditions and cannot afford to stay at home during pandemics. In response to a growing volume of requests from both national and local governments to help them prepare for, prevent, respond to and recover from the COVID-19 pandemic in an equitable manner, UN-Habitat adopted a COVID-19 response plan focusing on city-level and community responses to the crisis (Box 6.2). These responses seek to empower local communities to harness local capacities in addressing their immediate challenges as more long term interventions are planned by decision-making stakeholders.
Pandemics have demonstrated that vulnerable groups are disproportionately affected, making it difficult to contain the spread of infectious diseases in cities
Nearly 5,000 school children in two informal settlements in the Kenyan capital are better protected against COVID-19 as a result of an UN-Habitat initiative to expand mask and recycling bins in those often-overlooked areas.
The three-week initiative in Mathare and Kibera informal settlements is in line with UN-Habitat’s commitment not only to upgrade the quality of life in slums worldwide but also to ensure a more equitable distribution of resources to all citizens as a step toward providing more sustainable urban development.
The Youth-led COVID-19 Emergency Response initiative, in partnership with local governments, comes under UN-Habitat COVID-19 Response Plan adopted in April, 2020, which has as one of its main objectives as leveraging on experience, expertise and partnerships to deliver localized solutions. UN-Habitat has an extensive network of youth partners built up over its 20 years of programming with young people globally. Working with these partners on the ground, the organization brought together central and local governments, youth, communities and United Nations agencies to make the COVID-19 response impactful, especially with those in informal settlements and slums.
One key prevention method is masks. The most recent mask initiative facilitated the distribution of 6,577 surgical face masks to 2,226 students in seven schools in Mathare and 8,730 masks to 2,500 students in five schools in Kibera, for a total of 15,307 masks distributed to 4,726 students. To limit the environmental impact of disposable masks and promote economic empowerment among women, the elastic cords from the masks will be reused by women tailoring cooperatives. Along with the masks, recycling bins were also distributed to each of the schools.
The United States Centers for Disease Control and Prevention say students benefit from in-person learning and recommends universal indoor masking for all students.
Source: UN-Habitat, 2022b.

The nature of infectious diseases is such that no one is safe until everyone is safe. Consequently, reducing urban inequalities should be a priority in the post-COVID era. Equitable access to urban infrastructure and services, especially healthcare, has been an important determining factor in the ability of cities to respond to the pandemic effectively.25 Post-COVID recovery should be equitable and inclusive while prioritizing the needs of vulnerable and marginalized groups, including ethnic minorities, urban poor, immigrants, refugees, women26, children and those who are precariously employed or housed.
To seize the pandemic as an opportunity to reform our cities and build back better, it is essential to carefully assess the impacts on marginalized groups and ensure that they are engagedincurrentandfutureplanningprocesses.Ensuringthe engagement of diverse social groups in the planning process is necessarytodevelopinclusiveandequitableplansthatrespect
The engagement of diverse social groups in the planning process is necessary to develop inclusive and equitable plans
the needs and demands of different groups and facilitate equitable access to urban services and amenities such as open spaces and health infrastructure. This approach, in turn, could contribute to better resilience against future threats.27
Given the complexity of urban issues, post-pandemic recovery measures aimed at improving the accessibility of certain social groups to urban services should not undermine the accessibility of other groups. For instance, while as will be discussed in the next section, the need for better access to
green, open and public spaces has been observed in many cities, actions centred on increasing the share of such spaces should not negatively impact those who are employed in the informal sector and are reliant on public spaces for their livelihood. It is estimated that over 2 billion people across the globe are employed in the informal sector, and these people are the main users of streets and public spaces in developing countriescontributingtotheliveabilityandvibrancyofcities.28 In Mexico, for instance, street vendors are an integral part of many cities, and more than 50 per cent of the working population is involved in informal economic activities. Response measures should take the rights of such groups into account.29
Measures aimed at general economic recovery should not worsenthelivingconditionsofvulnerablegroups.Forexample, recovery from the 2008 global financial crisis resulted in unprecedented growth in international urban tourism and led to the displacement of low-income residents from central neighbourhoodstoperipheralurbanareasaspropertyowners converted housing into short-term holiday rentals. Housing advocates fear that returning to pre-pandemic patterns will resultingentrificationbydisplacingtheoriginalresidentsthat can no longer afford higher rents and further exacerbate the existing socio-economic and spatial inequalities in cities.30 However, some municipal authorities took advantage of the pandemic pause in short-term rentals to plan for a betterregulated, more equitable future (Box 6.3).
Measures aimed at general economic recovery should not worsen the living conditions of vulnerable groups
During a gloomy winter in a French capital subdued by the COVID-19 pandemic and missing its usual throngs of visitors, 30 Parisians logged on to a videoconferencing platform over 10 sessions to discuss a once contentious issue: short-term lets. Nearly six months before France would reopen to international tourists, the Citizens Conference on Furnished Tourism Accommodation had gathered to hear a range of perspectives and make a recommendation on one difficult question: to improve access to housing, should regulations on furnished tourism accommodation be stricter? And if so, how?
The Mayor of Paris called the public meeting because her administration had highlighted the growth in short-term lets as a culprit in the city’s housing crunch. “Paris has been confronted for several years now with the frenetic development of these tourist rentals,” said the deputy mayor for housing. “This development has come at the detriment of housing, that is to say we’ve seen housing turned into clandestine hotels.”
These debates have been playing out in cities across a world that experienced a rapid rise in short-term lets during the 2010s, followed by a severe crash during the COVID-19 pandemic and an uncertain future as travel and tourism make an unsteady return. Tourism dollars are sorely missed where local authorities are grappling with ailing municipal coffers, but the spectre of a worsening housing shortage looms large. “Local governments need to find a middle ground between maintaining their cities’ attractiveness to visitors while tackling housing inequalities, protecting long-term residential uses and quality of life,” says a University College of London’s Professor and lead author of a new study on European short-term lets published by the Property Research Trust.
The report analysed 12 European cities and found that in 2019, professional landlords (defined as renting a property for more than 60 nights a year) commanded the lion’s share of Airbnb listings in several popular destinations like Prague, Lisbon, and Rome. In the latter two, over 80 per cent of listings appeared to consist of professional landlords and in all four of these European destinations, some two-thirds of listings could be traced to hosts with multiple properties on the platform.
Catching up has been a challenge for cities caught unawares by sophisticated technology platforms that have rapidly scaled up the number of short-term let listings before regulatory measures like licenses, taxes, and nightly limits have been put in place. Some cities have adopted a zone approach, like Montréal, Canada, which pushes short-term lets off quiet residential streets and onto arterial boulevards. Some cities have taken a tougher approach, with Barcelona, Spain, becoming the first major city in Europe to ban private room short-term rentals altogether.
Urban outmigration may intensify patterns of gentrification outside central cities and further exacerbate housing and wealth inequalities across the urban-rural continuum
Avoiding gentrification is essential to ensure that all urban dwellers’ right to the city is respected, as elaborated31 in Chapter 8. This aspiration can be achieved by adopting integrated planning mechanisms that address urban issues through systemic approaches, such as policies requiring the social function of property. Similarly, based on urban exodus trends observed in contexts as diverse as Hyderabad, India32 , and London, in the absence of measures to support existing residents of suburban and rural areas, urban outmigration may intensify patterns of gentrification outside central cities and further exacerbate housing and wealth inequalities across the urban-rural continuum.
The pandemic and associated guidelines for safe social distancing have transformed the way people perceive the built environment, especially building interiors. COVID-19 has prompted a rethinking of the human relationship to green, open and public spaces. It has increased the demand
for multi-purpose and flexible spaces that can adapt to new situation, which is a major shift from traditional urban planning practices like single-use zoning that often overlook flexibility and adaptability. This section is focused on issues related to the retrofitting of indoor and outdoor spaces to allow for social distancing, a trend that has softened in 2022 but that may have lasting effects for commercial design. However, it should be mentioned that planning to retrofit urban infrastructure is also needed to futureproof against other adverse events like climate change impacts, seismic risks and terrorist attacks.33 Furthermore, as insufficient indoor and outdoor spaces have been identified as risk factors to human distress during the pandemic, retrofitting indoor and outdoor spaces has also been linked to urban dwellers’ health and well-being demands34 .
Architects, interior designers, and facility maintenance managers have rushed to retrofit indoor spaces since 2020 both to improve ventilation as well as to accommodate changing work and lifestyle patterns that have led many urban dwellers to spend more time at home. Indoor residential environments are no longer only spaces for living, but also must accommodate other needs related to work and leisure. This sudden shift revealed the lack of versatility and flexibility of modern building design and indicated that changes in the design layout of buildings may be necessary35 .
Consequently, property analysts believe there will likely be long-term demand for adaptable residential designs that can accommodate the changing needs of citizens during emergencies such as pandemics (e.g. garages that can be turned into office space). This design preference will increase demand for suburban and peripheral housing stock with gardens, garages and off-street parking.36 Such consumer demand away from dense, multifamily housing will cause affordability issues, and worsen economic inequalities given the difficulties prompted by the pandemic. As a result, wealth inequalities in society may further deepen as some will own multiple homes while others will find it challenging to own or rent a single home.37
Accordingly, developing policies and strategies to provide affordable housing should be further prioritized to mitigate housing inequality and its potential associated risks for public health. In this regard, lessons can be learned from successful examples such as the The Million Homes Programme implemented in Sweden in the post-war era.38 Another risk is that increased interest in suburban and rural areas,withlesspopulationdensityandmoreflexiblehousing that can accommodate the need for working from home, may lead to new waves of suburban urban development.39 As will be discussed later in this chapter, teleworking or remote work may undermine efforts to promote compact cities.
Affordable housing should be further prioritized to mitigate housing inequality and its potential associated risks for public health
During the peak of the COVID-19 pandemic, many temporary measures were taken to reduce contagion risk in indoor environments, such as separating upward and downward staircases,makingshopaislesoneway,limitingindooroccupancy and reducing elevator passenger loads. As the pandemic recedes,theseregulatoryresponsesarelikelytorecede,ifthey havenotalready,astheyreducetheefficiencyofindoorspaces. Other measures are more capital-intensive and thus will likely remain once installed, such as ventilation system upgrades, body temperature scanners and anti-microbial finishings.40 However, these measures are costly and may not be affordable to all social groups.
The pandemic is also likely to transform the configuration of offices (Figure 6.4) and commercial spaces such as shopping malls. Regarding office spaces, measures mentioned above to avoid overcrowded indoor environments can be combined with further adoption and promotion of teleworking to allow for better social distancing and more economically feasible ventilation of indoor working environments. Survey results show that support for remote work has increased among both employers and employees after the pandemic. Teleworking also helps reduce transport-related energy consumption and associated GHG emissions and could facilitate social benefits such as job satisfaction and better work-life balance.41 Additionally, reducing office size could provide opportunities for re-allocating the freed spaces to other purposes such as green and open spaces. However, telework should be combined with in-person work to maintain the innovation advantage inherent in cities and sustain the economies of central business districts, which provide jobs to small business owners and low-wage workers.

• Maintaining a 6ft. distance when walking in between back to back workstations is a challenge.
• Maintaining a 6ft. distance when walking along a corridor is a challenge.
• Being aware of your surroundings is imperative in these situations.
Working in between stations
Walking along the corridor
Source: Harrouk, 2020
Over the past few decades, large indoor shopping malls and hypermarkets have become common in many cities. The temporarydisruptionoftheCOVID-19pandemichasshuttered some malls, although as the pandemic recedes shoppers have returned to these large indoor spaces. Moreover, these facilities are typically owned by well-capitalized property firms that have adequate balance sheets to withstand a downturn. However, the pandemic-era consumer preference for outdoor spaces has helped the fortunes of open-air shopping centres and traditional high streets and commercial corridors.42 Neighbourhood-oriented mixed-use development can offer opportunities for the revival of such shops. Evidence based on perception surveys in Istanbul shows that due to concerns overtheeffectivenessofartificialventilationinshoppingmalls, somecustomersarelikelytoavoidsuchprivately-ownedpublic spaces in the future and shift to traditional shopping streets.43 This trend presents an opportunity to revive neighbourhood shopping streets as welcoming public spaces that contribute to local economies, facilitate social interactions, cultivate a sense of community, encourage walking and cycling, and reduce travel demand and associated GHG emissions.44
Urban planners should support neighbourhood shopping districtswitheasierpermitting,permissiontousesidewalksand streets to extend storefronts, street beautification efforts and
support for business improvement associations, where enabling legislation allows. Neighbourhood retail faces headwinds from online shopping, which saps urban vitality and contributes to congestion through increased delivery vehicles. New property uses like ghost kitchens, which prepare meals for delivery but do not drive foot traffic, should be regulated closely so that they do not occupy prime commercial real estate.
As evidenced by SDG 11, the need for adequate provision and universal access to safe green, open and public spaces wasalreadyrecognizedbeforethepandemic.TheNewUrban Agenda highlights the profound roles that multi-functional green, open and public spaces such as streets, pedestrian spaces, cycling networks, squares, parks and green spaces can play in driving economic development and contributing to human health and well-being. The pandemic brought about more desire for green, open and public spaces, which is likely to change the distribution patterns of such spaces in the coming years. Many argue that the pandemic will have significant implications for the way urban residents will see and use green, open and public spaces in the future.45 This preference is likely to increase the demand for such spaces, leading to urban form and landscape changes.
Effectivestrategiestoensurecontinuoususeofparksandopen spaces by citizens are critical for maintaining their mental and physicalhealth.Outdoorphysicalactivityisessentialforhealthy child development, avoiding cardiovascular and respiratory diseases, reducing obesity rates and building children’s social and emotional skills. During lockdowns many people were alienated from their work and leisure places as well as from other people, which heightened stress and anxiety among urban residents. Results from a survey completed by people from nine countries show that contact with nature and green spaces is essential for overcoming depression and anxiety during lockdown periods.46
Despite this benefit, in many cities around the world, use of such spaces was largely restricted during the pandemic. Better designmeasures,allocatingmorespacetoparksandimproving accessibilityarecriticaltoavoidsimilarconditionsinthefuture.47

As will be further discussed later in this chapter, the pandemic
has increased interest in active transportation like cycling and walking. This change offers an unprecedented opportunity to restructure cities in such a way that more space is devoted to developing cycling and pedestrian infrastructure. It will allow better opportunities for compliance with social distancing during future respiratory pandemics and provide spaces for further social activities and social interaction that could strengthen resilience. Further, it will have co-benefits for health and climate change mitigation.
Following the increased interest in active transportation, the global movement to reconfigure streets making them more pedestrian- and cyclist-friendly has gained considerable momentum (Box 6.4).48 More cities should seize this opportunitytostarttransformingurbanenvironment,including streets. and open and public spaces. Indeed, it should be acknowledged that streets should not just be allocated to cars and need to be reconfigured in a people-centred manner. In so doing, careful attention to the principles of resilient urban
During lockdowns many people were alienated from their work and leisure places as well as from other people, which heightened stress and anxiety among urban residents
New Urban Agenda highlights the profound roles that multi-functional green, open and public spaces can play in driving economic development and contributing to human health and well-being
Like many low-and middle-income countries, Ethiopia is confronted with a very high road-related fatality rate, with 26.7 road deaths per 100,000 inhabitants recorded each year, according to WHO data. In comparison, high-income countries have an average of 8.3 road traffic deaths per 100,000 people. Death rates from traffic crashes are higher in Africa than anywhere else.
In Addis Ababa, pedestrians and cyclists represent more than half of road users and about 80% of all road victims. Building safe and inclusive walking and cycling infrastructure is crucial to reduce road injuries and mortality.
Since May 2019, UN-Habitat, supported by the United Nations Road Safety Fund and in partnership with the Institute for Transportation and Development Policy (ITDP), the Ethiopian Ministry of Transport, the Ministry of Urban Development and Construction, the Federal Transport Authority and the Addis Ababa Transport Bureau, with support from other national, international and local agencies, have partnered on the Scaling Up Safe Street Designs in Ethiopia project to help the authorities tackle this key road safety challenge.
The project has now reached its completion, delivering results and impact which have exceeded all its initial goals. The project provided technical support to local and national government officials in their ongoing efforts to design, install and upgrade footpaths and bicycle lanes and corridors, supported by the harmonization of street design guidelines. Based on this expertise, the project partners provided technical review assistance to the design of ongoing infrastructure projects, and promoted and co-organized street-level activities to raise awareness around the importance of walking and cycling for all, and road safety issues.
The project resulted in the adoption of a Non-Motorized Transport Strategy for Ethiopia and Addis Ababa, and a five-year implementation plan for 69 cities and towns with harmonized street design guidelines guiding investments in safer facilities for walking and cycling. The Strategy emphasizes the need to consider all residents in the plans and budgets, including women, children, and persons with disabilities.
Source: UNECE, 2021b.
The global movement to reconfigure streets making them more pedestrian- and cyclistfriendly has gained considerable momentum
form should be made to ensure designing open and public spaces in a redundant, multi-functional, and flexible manner that allows adaptability to various types of adverse events.
Ample provision of open and public spaces increases urban flexibility and resilience. Such spaces can be converted into sitesforartisticactivities,outdoordining,temporaryshelteror medicalemergencysitesduringadverseevents.49 Forinstance, during the recent pandemic large-scale open and public spaces were converted into makeshift hospitals in Wuhan, China. Open and public spaces have also been used for similar purposes in other countries like Japan. Such practices and other measures based on the principles of tactical urbanism can be used to enhance the resilience of urban form.50
Integrating green infrastructure into the design of streets and other public spaces is an effective way to enhance their flexibility and multi-functionality. Indeed, creating networks of green areas and open spaces will allow better responses to future pandemics while also providing co-benefits like climate change adaptation and ecological restoration. Networksofblueandgreeninfrastructurecanalsobufferand regulate interactions between humans and wildlife, reducing the risk of zoonotic diseases.51 But planning for this type of infrastructure requires a change from business-as-usual practices, which historically defer to hard infrastructure in order to solve urban development challenges. Major barriers are limited funding and expertise, maintenance costs, and inadequate support from local governments.
To ensure that green infrastructure networks can contribute to transformative solutions for better urban futures, these barriers should be overcome by, among other things, better engagement of different stakeholders for co-design and
This urban-scale diagram depicts opportunities for seating in the public realm, shared delivery and processing infrastructure, and localized food production.


Localize food production in underutilized spaces like roofs and vacant plots to minimize supply chain hand-offs.
Alleys can provide overflow space for delivery, storage, and even dining.
Roofs can house open or covered dining and exchange.
Dining can expand into the sidewalk and street parking lane.
co-implementation of projects, knowledge production and capacity building, and using assessment and monitoring tools forobjectivecommunicationofthebenefits.52 Urbanresidents’ recent interest in green spaces provides a key opportunity to garner support for the extension of green infrastructure networks, which could help overcome some barriers.
One important issue that needs to be considered when reconfiguring green, open and public spaces is that they should be designed and distributed properly so that physical accessibility for all social groups, including children and youth, women, older persons, and people with mobility restrictions, can be guaranteed. Planning for marginalized populations avoids taking response measures that will exacerbate the living conditions of vulnerable groups. For instance, allocating more space to walking and cycling could negatively impact the accessibility of other groups such as essential workers who need rapid mobility. Such essential workers are often from low-income and marginalized groups who cannot work from
Creating networks of green areas and open spaces will allow better responses to future pandemics while also providing co-benefits like climate change adaptation and ecological restoration
home. Therefore, street reallocation programmes should be implemented so as not to exacerbate inequality.53
A recent study conducted in Seattle, US; Washington, D.C., US;,andVancouver,Canada,demonstratesthatsuchinitiatives have been implemented in neighbourhoods home to recent immigrants, low-income families, people with disabilities and racial minorities. Therefore, while temporary reallocation is helpful for meeting resident needs during the pandemic (e.g. social distancing and daily exercise), their permanent implementation should be analysed through an equity lens.54
The adoption of the New Urban Agenda in 2016 codified a global vision of compact urban development that would check unplanned urban expansion and so-called suburban sprawl. Such development patterns became common with the advent of the automobile and have led to a number of adverse consequences. This land-intensive pattern contributes to environmental degradation, deforestation and habitat loss. By engineering long distances between work, home, commerce, school and leisure, dispersed urban development leads to social isolation, less physical activity and increased

GHG emissions per capita. Serving fewer residents with the same amount of roads, sidewalks and utilities leads to higher public cost burdens to maintain infrastructure. Allowing more affluent residents to wall themselves off in gated communities or distant suburbs defined by exclusionary single-use zoning engenders socio-spatial segregation and worsens social cohesion.55 Finally, in the wake of the COVID-19 pandemic, urban development that encroaches on wild places increases the risk of exposure to zoonotic diseases.56
New Urban Agenda in 2016 codified a global vision of compact urban development that would check unplanned urban expansion and so-called suburban sprawl
There are now concerns that the COVID-19 pandemic could result in a new wave of suburbanization due to perceptions of higher contagion risk in high-density areas, the need for morespacetofulfilworkandleisureneedsduringlockdowns, and the accelerated trends of remote working that reduce the need to commute to central business districts. Expensive mega-cities in land-rich countries saw population loss as some residents moved to ensure better access to open and green spaces and avoid overcrowded urban life.57 While it is still too early to say whether these trends are temporary or people will start to move back to big cities as the pandemic slows down, there is an urgent need for urban planners to examine the performance of compact cities during the pandemic and take necessary actions to ensure that compact cities will not lose their appeal.
Concerns over the role of density in the spread of contagious diseases date back decades. The link between population density and public health was one of the main themes of the First International Congress for Sanitation and Housing Health Safety held in Paris in 1904. Studies in the past have shown an association between infectious disease mortality (tuberculosis) and housing density as social distancing is challenging in poorly designed, high-density areas that could lead to overcrowding.58 Research results reported on the association between density and the number of COVID-19 cases and death are inconclusive. Some studies have shown an overlap between population density and COVID morbidity and mortality rates in countries such as China, Iran and Chile.59 However, in most cases there is no compelling evidence that density is a risk factor.60 Similarly, there is no strong evidence suggesting that larger cities are more vulnerable. Comparing
mortality rates in different cities shows that except for some outliers, there is no special relationship between city size (population) and mortality rates.61
Overall, existing evidence on the association between built environment factors and COVID-19 infection/mortality rate shows that density and city size per se are not influential factors and their impacts are mediated by other socioeconomic, contextual, and behavioural factors such as income, social structure, degree of connectivity, quality and distribution patterns of urban infrastructure, and the extent of compliance with social distancing and hygiene measures.62 For instance, while people in a poor neighbourhood of a compact city are likely to be vulnerable due to the lack of access to infrastructure, limited floor area, and the difficulties of compliance with stay home and social distancing measures, those who live in better-off neighbourhoods with better access to infrastructure and can afford staying at home during lockdown periods are less likely to be vulnerable.
In many parts of the world (both developed and developing countries), low-income areas have been hit harder by the pandemic. In New York, for example, mortality rates in lowincome neighbourhoods were about two times higher than those in better-off neighbourhoods. This discrepancy could be explained by the fact that low-income households live and work in smaller spaces, making it more difficult to observe socialdistancingrules.Inaddition,theirprecariouslivelihood conditions make it difficult for them to stay home for a long period.63 There is ample evidence suggesting that housing inequality has made it difficult to control the spread of the pandemic in cities such as Mumbai, India. In crowded slums and informal settlements, households have limited access to adequate infrastructure, are deprived of basic services such as clean water and sanitation, and are exposed to high levels of indoor and outdoor air pollution. These conditions make them more vulnerable to infectious diseases and cause challenges for following protective measures such as social distancing and practicing good personal hygiene.
Housing inequality may become further exacerbated during pandemics or other adverse events, resulting in higher rates of unemployment and sluggish housing supply, reducing housing affordability. Accordingly, urban planners should develop policies and strategies to provide affordable housing in order to mitigate housing inequality and its potential associated risks for public health.64
Connectivity is another mediating factor that can play an important role. Some have argued that connectivity has
played a larger role in the initially higher rate of pandemic spread in larger and more dense cities rather than city size or density. Such cities are often characterized by a large network of connections with other cities locally, regionally and internationally, leading to more human interactions and the spread of the virus at higher rates.65Accordingly, early actions to restrict mobility or taking measures to ensure safer mobility could be effective in reducing contagion risk in such dense areas.
Generally, suburban areas proved to be less resilient to adverse events due to limited accessibility to emergency and response services.66 Similarly, the lack of healthcare and medical services in low-density suburban areas could indeed
make them more vulnerable to pandemics. This hypothesis is supported by evidence showing that the mortality rate from infectious diseases such as flu is higher in suburban and rural areas than in urban areas, which offer better access to medical services and higher rates of compliance with public health measures.67

Housing inequality may become further exacerbated during pandemics or other adverse events, resulting in higher rates of unemployment and sluggish housing supply, reducing housing affordability
Overall, urban planners should make the case that welldesigned and well-managed compact cities featuring characteristicssuchasequitabledistributionofinfrastructure and services, mixed uses, walkable access to open and green spaces, and support to vulnerable residents during adverse events (e.g. economic support packages, and delivery of food andbasicservices)aresafeandnotmorevulnerablethanlowdensity suburban or rural areas.68 Considering that certain levels of compactness are needed to support economies of scale, minimize unregulated intrusion in ecosystems, and facilitate other sustainable urban development measures such as multimodal transportation, it is imperative to regain public confidence in compact urban form.
Well-designed and well-managed compact cities are safe and not more vulnerable than low-density suburban or rural areas
Even as public health fears diminish, the accelerated trends of teleworking, decreased demand for commercial office space and less investment in urban regeneration due to potential decline in inner-city property markets are other likely threats to the future of compact cities.69 According to global research, 65 per cent of people have been working from home, and around 50 per cent of those plan to continue remote working post-pandemic.70 To ensure that compact cities do not lose their appeal amidst such transformations, these changing trends and potential decline in land values could be seized as an opportunity to provide affordable housing in inner-city areas.71 However, measures should be taken to ensure such areas’ economic and social vitality. As already practiced in cities like San Francisco (Box 6.5), amending zoning regulations to facilitate the flexible design of outdoor spaces, redesigning streets and open spaces in a more people-centric manner, and promoting micro-mobility options could be effective in helping compact cities emerge more liveable and affordable in the coming years.72
6.3.3. Sustainable neighbourhood planning and the 15-minute city
What makes a city compact are its constituent parts: neighbourhoods. Neighbourhood planning and regeneration has been a major concern for urban planners and designers
since the early 20th century.73 Indeed, neighbourhood planning has been the major focus of various urban planning concepts and movements such as garden cities, neighbourhood unit, traditional neighbourhood development, transit-oriented development, smart growth, urban village, New Urbanism, and ecological urbanism. These over 100 years of efforts have been successful in delineating the underlying principles and characteristics of sustainable neighbourhood planning and design. There is now consensus
Box 6.5: San Francisco makes four Slow Streets permanent

San Francisco launched the Slow Streets programme in April 2020 amid the pandemic, ultimately closing 31 streets to through traffic and giving residents safe spaces to walk, bike and socially distance. People living on the streets and emergency vehicles still have access. The San Francisco Municipal Transportation Agency (SFMTA) later voted to keep four Slow Streets beyond the COVID-19 emergency order, starting the process to determine which of the city’s streets will permanently remain pedestrian friendly.
Multi-block stretches are the first corridors the board decided will welcome cyclists and pedestrians for the long-term. Design measures have been taken in the four streets to improve safety. Wayfinding signs and crosswalks are planned and new vehicle turn restrictions are slated to reduce through traffic, for example.
SFMTA is evaluating all Slow Streets “for a post-pandemic future” to develop a network of pedestrian- and bicyclist-friendly corridors that lasts beyond the pandemic. The process includes surveying residents who live within a quarter mile of a slow street and collecting pedestrian, bicycle and vehicle counts.
Source: Graff, 2021.
that sustainable neighbourhoods should have a certain level of density, be inclusive and socially mixed, follow principles of mixed-use development, allow walkable access to daily needs, feature a well-designed network of streets and open/green spaces, promote modularity and the circular economy though integration of renewable energy technologies as well as green infrastructure systems that minimize resource consumption and facilitate recycling. Such neighbourhoods are expected to be climate resilient and offer co-benefits in terms of equity and justice.74
Context-specific conditions make it difficult to recommend prescriptive standards and design measures. However, there is consensus that attention to measures such as adequate provision of green, open and public spaces; efficient design of streets and street networks; appropriate levels of density; land use mix; and social mix are elements conducive to developing neighbourhoods that can contribute to addressing urbanization challenges such as inequality, congestion, biodiversity loss, urban sprawl and inefficient resource consumption.75
More detailed and context-specific measures and standards have been recommended in an increasing number of design frameworks and assessment tools developed to guide sustainable neighbourhood planning and design. For instance, Leadership in Energy and Environmental Design for Neighbourhood Development (LEED-ND) is a US designation that governs standards for various neighbourhood planning and design factors such as smart location and linkage, neighbourhood pattern and design, and green infrastructure and Buildings. While LEED-ND has been mainly developed to promote neighbourhood regeneration and curb urban sprawl in the United States, it has also been used in other countries that lack their own framework.76 In addition, the Building Research Establishment Environmental Assessment Methodology (BREEAM) and the Communities and Comprehensive Assessment System for Built Environment Efficiency (CASBEE) for urban development are other widely known frameworks that originated from the United Kingdom and Japan, respectively.77 ‘
Design standards introduced by these frameworks are context-specific and may not be applicable to all contexts without customization. While much of the future world urban population growth will occur in the cities of developing countries, they often lack their own context-specific neighbourhood design standards, which could result in undesirable neighbourhood development patterns, directed by market forces.
Despite the vast body of knowledge on sustainable neighbourhood planning principles, there is still a mismatch between the theory and practice of sustainable neighbourhood planning.78 This mismatch has been further highlighted during the recent pandemic when in most cases, neighbourhoods failed to respond to resident needs during the mobility restriction periods. COVID-19 has, therefore, further revealed the need for better accessibility to amenities at the neighbourhood scale. In addition to mobility restrictions, during pandemics and other adverse events, lack of accessibility to essential services and amenities such as neighbourhood health centres, pharmacies and supermarkets could affect the quality of life of residents, particularly those that do not own private vehicles. The importance of neighbourhood medical centres for conducting timely primary response measures (e.g. screening) has been demonstrated in countries such as the Republic of Korea.79 In the absence of such neighbourhoodbased facilities, municipal and regional health centres could be overcrowded, as has been observed in Italy.80 This will undermine their performance and capacity to test and treat patients. Additionally, overcrowding may lead to the further spread of the virus.81
Neighbourhood planning based on the principles of walkability, cyclability, accessibility, mixed use, and compactness and through integration of green infrastructure can provide multiple co-benefits for health, equity, and climate change adaptation and mitigation. The pandemic highlighted the need for walkability and access to green and open spaces. There is evidence suggesting that compact and well-designed neighbourhoods increase physical activity, thereby contributing to health improvements such as reducing obesity.82 Urban agriculture can also provide better access to healthy food, especially in so-called “food deserts” that lack such access.83
Many of the benefits of sustainable neighbourhood planning have been repackaged since 2020 under the banner of the 15-, 20- or 30-minute city. The concept, applicable to both existingandnewdevelopments,advocatesforneighbourhood


Adequate provision of green, open and public spaces; efficient design of streets and street networks; appropriate levels of density; land use mix; and social mix are elements conducive to developing neighbourhoods
design that allows residents to meet most of their daily needs within a fixed timeframe by foot or bicycle. Paris popularized the 15-minute city (Figure 6.6). Melbourne, Australia, and Portland, US aspire to the 20-minute city (Figure 6.7). Adding public transport to the mix, Sydney promotes the 30-minute city model. While the nomenclature is new, the underlying idea of a 15-, 20- or 30-minute city is not completely new and builds on previous ideas and movements described at the beginning of this section that emphasize walkable, self-contained, and mixed-used neighbourhoods that mix working, living and leisure. The 15-minute neighbourhood design allows for decentralized cities with a more polycentric
Neighbourhood planning based on the principles of walkability, cyclability, accessibility, mixed use, and compactness and through integration of green infrastructure can provide multiple cobenefits for health, equity, and climate change adaptation and mitigation

structure. Such patterns enable better resilience to adverse events. For instance, centralized wholesale food markets proved ineffective during the pandemic when accessibility was limited due to mobility restrictions.84
While the concept of a 15-minute city is promising, the idea is yet to be fully investigated in real-world contexts. The history of urban planning indicates that similar utopian visions like the garden city model have had limited success in solving societal issues due to their failure to consider the multiple forces that shape cities. Planners should learn from previous movements and take smart measures to ensure that 15-minute neighbourhoods do not exacerbate spatial inequalities in cities by becoming enclaves for wealthy urbanites segregated from the overall urban structure. Another important issue is that planners and policy-makers should not adopt the concept without considering the context-specific conditions of cities. Each city has unique characteristics, which should be duly considered when planning 15-minute cities.
Local employment opportunities
Well connected to public transport, jobs and services within the region
Local public transport
Safe Cycling networks
Walkability
Housing diversity
Ability to age in place
Local Shopping centres Local Health Facilities and services
Local schools
Lifelong learning opportunities
Features of a 20-minute Neighbourhood
Locall playgrounds and parks
Green street spaces
Community gardens
Affordable housing options
Sports and recreation facilitiesSafe streets and spaces
Safe and convenient access to public transportation is one of the indicators of sustainable development, as highlighted in SDG 11.2. The importance of safe, affordable, and reliable public transport systems for sustainable development and equitable participation of all social groups in urban activities has also been underlined across the New Urban Agenda. Accordingly, many efforts to promote public transportation have been made in recent years. The pandemic, however, is reshaping urban transport and, due to its impacts, mobility options are likely to be dramatically changed in the future.
Public transport has been recognized as an essential service during the COVID-19 pandemic as it ensured the mobility of essential workers. It helped to guarantee access to services for many people around the world. However, due to concerns over the safety of public transport and the ability of knowledge workers to work remotely, transit ridership
experienced an all-time low since 2020.85 Declines were particularly significant during the lockdown and depressed ridership figures have persisted even as restrictions have been lifted (Figure 6.8). According to the International Association of Public Transport (UITP), many governments actively discouraged the public from using public transport. This complete reversal from decades of efforts to promote public transport impacted urban mobility patterns. Evidence now shows that public transport can be “COVID-safe” when measures recommended by health departments are implemented accordingly.86 But as public transit ridership declined, two major trends emerged. One is increased car dependency and the other, growing interest in active mobility modes such as walking and cycling.
In some countries like India, car dependency increased since the emergence of COVID-19, and people formerly interested in active and public transportation shifted towards private cars.87 These trends show that in the absence of safe, affordable, and reliable public transportation systems, the future of urban mobility could continue to be dominated by private motorized vehicles. If this scenario emerges, it
Checulin et al.,
have major implications for climate change
and could exacerbate already challenging issues such as air pollution, congestion, and road safety. Productivity loss due to congestion is already estimated to be about 1 per cent of global GDP.
also leads to other issues such as traffic accidents and health impacts associated with air pollution (Figure 6.9).
Dependence on private vehicles and associated
Evidence shows that cities with efficient and modern public transport systems are safer and have less road fatalities as compared to car-oriented cities.
Given those statistical dynamics, sustaining public transport while ensuring walking and cycling access is vital for avoiding a spike in traffic fatalities, addressing climate emergencies, and improving equity as the urban poor may not be able to afford private vehicles. It is estimated that about 80 per cent of the total vehicle kilometres travelled are made by about 10 per cent of the global population.
About 80 per cent of the total vehicle kilometres travelled are made by about 10 per cent of the global population
Most of the world’s population only rarely travel by car.91 To retain confidence in public transport, a combination of measures is necessary such as enhancement of accessibility and reliability standards, modernization of business models and public-private partnerships for public transport operations, the introduction of tax increases on private vehicles and incentive packages for transit use, improvement of hygiene standards, and use of high-efficiency particulate air filters and better ventilation techniques.92 While overcrowding was a recurring pre-pandemic concern on public transport, travel demand has been reduced through the adoption of flexible working arrangements that allow both teleworking and working at the office.93
While overcrowding was a recurring prepandemic concern on public transport, travel demand has been reduced through the adoption of flexible working arrangements that allow both teleworking and working at the office
The second major transportation trend brought on by the COVID-19 pandemic is increased momentum for active transportation. When urban residents were discouraged from riding public transport, many turned to walking and cycling. With less motorized traffic, urban planners responded nimbly by creating additional spaces for these activities as well as other purposes such as eating at outside restaurants in a widespread implementation of a technique known as “tactical urbanism.”94 This quick action was necessary, and cities must act fast in order to build on the momentum and drive lasting transformation in urban mobility in the post-pandemic era.
ThetacticalurbanismimplementationmodalityduringCOVID19, in which bicycle lanes were literally installed overnight, provides great insights on the needed response partnerships between city governments, civil society and private sector.
Lima, Peru, with a high population of informal workers who make their livelihood in public spaces, established 50 km of emergency cycle lanes early in the pandemic to facilitate safe urban mobility. By late 2020, the city pushed to make the infrastructure permanent and in June 2021, the Ministry of Transport and Communication of Peru accelerated the approval of national legislation that promotes and regulates the use of the bicycle as a sustainable mode of transport.95 In this regard, actions such as redesigning streetscapes and reallocating underutilized spaces to provide protected cycling and pedestrian lanes, promoting bicycle ownership and cycling infrastructure, and expanding smart bike-sharing programmes to facilitate synergistic benefits are recommended.96
Whenbicyclesweredifficulttofindinstores,citieslikeNewYork with robust bike-sharing programmes saw substantial increases in use. As public transport ridership recovers, integrating bike sharing with mass transit could provide opportunities to further reduce reliance on private automobiles and taxis for last-mile connections and lead to more low-carbon transportation.97 Evidence from Boston, US, shows that bike-sharing reduces car ownership per household by over 2 per cent, per capita vehicle miles travelled by more than 3 per cent and GHG emissions per capita by about 3 per cent.
Bike-sharing is found to be one of the most resilient transportation modes. For instance, while subway ridership has not returned to pre-COVID levels in many cities like New York, data shows that bike-sharing ridership returned to normal soon after mobility restrictions were eased.98 However, to enhance its effectiveness, bike-sharing systems should cover all parts of cities, including low-income areas, and offer affordable pricing.99
As the need for private automobiles will not go away immediately, the promotion of shared mobility (car-sharing) is an effective strategy to reduce emissions. Further uptake of shared, electric and autonomous vehicles through so-called “mobility as a service” schemes are also recommended to ensure seamless connectivity, multimodality and innovation in the transport sector. Simultaneously, a shift towards renewable energy is also pivotal to reducing the sector’s reliance on fossil fuels.
Integrating bike sharing with mass transit could provide opportunities to further reduce reliance on private automobiles and taxis for last-mile connections and lead to more low-carbon transportation
To enhance its effectiveness, bike-sharing systems should cover all parts of cities, including low-income areas, and offer affordable pricing
Guided by the New Urban Agenda, cities must align their transport, climate, energy and urban development plans to achieve both the Sustainable Development Goals and the Paris Agreement commitments.
Overall, there is a need for a paradigm shift toward humancentric and environmentally friendly mobility options. Currently, the transport sector accounts for about onequarter of global energy-related CO2 emissions and air pollutionkillsabout7millionpeopleannuallyofwhichalarge number can be traced to pollution from vehicular traffic.100 Road traffic accidents also kill about 1.3 million people every year.101 The world urban population is projected to reach 6.68 billion by 2050, up from 4.2 billion in 2018. If private vehicles fuelled by non-renewable energy sources remain the dominant mode of transportation by then, the number of cars on streets is likely to reach about 2 billion vehicles,102 with significant implications for socioeconomic and environmental sustainability and climate change mitigation.
To avoid this scenario and accelerate the transition of sustainable urban transport, future mobility options should move away from the private car and rather focus on a strong multimodal public transport system that comprises good facilities for walking and cycling and share mobility options. The increased environmental awareness and interest in active transportation driven by the pandemic along with advances in technologies that provide alternative mobility options such as smart bike-sharing, or shared and electric mobility, or mobility as a service (MaaS), provide opportunities to lure people away from reliance on private automobiles and towards active transportation, shared mobility and public transit.103

To achieve these goals, cities can adopt sustainable urban mobility plans (SUMPs) to guide short- and long-term mobility planning and involve stakeholders in the process.104
Future mobility options should move away from the private car and rather focus on a strong multimodal public transport system that comprises good facilities for walking and cycling and share mobility options
They are widely used by local authorities to access funding in India, Brazil and France. Sustainable urban mobility planning, specifically, is a strategic approach to transport planning that focuses on the mobility needs of people and businesses in cities following three principles: integration, participation and evaluation.105 Municipal governments use SUMPs to shift investments from infrastructure development prioritizing people’s and businesses’ mobility needs. SUMPs help prioritize low-cost measures alongside capital-intensive projects in plans suited to the specific urban needs of each city. SUMPs may also be practical tools to align urban goals with those set up at the regional and national levels.
The main objectives of SUMPs are to ensure access to transport servicesforall,improvesafetyandsecurity,reducepollutionand energy consumption, improve efficiency and cost-effectiveness of the transport system and contribute to the attractiveness and quality of the urban environment.106 The emphasis of SUMPs is on interdisciplinary dialogues that enable participation in transport decisions, expanding the range of long-term goals of transport planning, and incorporating key challenges such as wellbeing, nature conservation, and equity (Figure 6.10).
SUMPs benefit from quantitative and qualitative information on responses to modifications in transport supply and demand,107 user preferences, mobility needs and existing practices. User surveys and focus groups to collect data also serve as engagement exercises, helping a wide range of stakeholders inform SUMPs. Scenario planning processes integrate information and support the development of planning strategies. The main challenges are ensuring disaggregated data collection that includes data on different groups’ mobility needs and practices, developing scenario validation methods, and facilitating the participation of a broad set of stakeholders.108
The Avoid-Shift-Improve (ASI) framework summarizes general practical lessons from experiences on sustainable urban mobility. The ASI framework focuses on three interventions:
AVOID: disincentivize polluting private vehicles and unnecessary trips
SHIFT: encourage active travel, shared mobility, or public transport
IMPROVE: facilitate technological and institutional improvements in the current system
A detailed analysis of the impacts of each action is also needed. For example, a shift in public transport may have different components, including low-carbon public transport using waterways, electrified road or rail infrastructure, and bikes for local deliveries. The COVID-19 pandemic has called for rethinking the future of public transportation as more people have turned to more remote activity and less travel. Where shifts are not possible in the short term, improving existing options may be the most immediate answer for decarbonization, for example, investing in electric vehicles. However, changing technologies alone will be insufficient to achieve net-zero without significant impacts on people’s well-being and mobility needs. As the framework shows,
Avoid
Urban
form
Identify
Milestone:
Develop
provision,
pedestrianization. Land use and
that enable or hinder
transport and mobility.
In its 2013 report Planning and Design for Sustainable Urban Mobility:
Report on Human Settlements, UN-Habitat
for a “conceptual leap” in transport
Rather than focusing on extending infrastructure
people’s movements
long distances,
travel
No desire or need to travel
Transport
Walking cycling
Public motorized Transport
Individual motorized Transport
Car, taxi, motorcyclePublic transport (bus, rail)
Avoid to reduce travel or the need to travel
Planning Instruments Regulatory Instruments
Land-use planning/ providing for pubic transport and nonmotorized modes
Norms and standards (emissions, safety), organization (speed limits, parking, road space allocation, production process)
Source: Transformative Urban Mobility Initiative (TUMI), 2019.
Shift to more energy efficient modes
Economic Instruments
Fuel taxes, road pricing, subsidies, purchase taxes, fees and levies, emissions trading
Improve efficiency through vehicle technology
the report argued for bringing people, places, and activities closer together. These ideas are not new but have regained traction in proposals to facilitate the recovery from the COVID-19 pandemic.111 The Avoid-Shift-Improve framework exemplifies the need to move beyond specific tools, to integrate action across policy domains and facilitate placemaking interventions that support the integration of different activities in proximity (housing, employment, education, leisure and entertainment) and reduce the need to travel.
Cities do not exist in isolation. In addition to being connected to the global markets, they have strong ties with their hinterland areas. They are always dependent on other cities and rural areas in their hinterland to provide urban services and commodities and multiple types of ecosystem services.
Information Instruments Investment Instruments
Public awareness campaigns, mobility management, marketing schemes, co-operative agrremetns, ecodriving schemes
Fuel improvement, cleaner technologies, end-of-pipe control devices, cleaner production
Accordingly, trade, species, humans, and other actors and elements constantly flow in and out of cities in dynamic and non-linear patterns. Further, urban agglomerations, where several cities are closely interrelated and function as integrated economies, are common in many parts of the world.112 The high density of internal connections between cities in such agglomerations provides multiple benefits for establishing a strong local economy.
However, such high connectivity levels may have implications for resilience as shocks and disruptions in one part of the system could rapidly spread to the other parts. For instance, water contamination at the point source in rural areas can have major implications for urban residents living in downstream locations;113 or, loss of connectivity between cities and their hinterland areas could lead to supply chain disruption. Accordingly, since the urban-rural interface is highly interconnected, planning processes for urban and rural areas should not occur in isolation from one another. Urban planning should instead consider issues that cross official municipal boundaries.114
International policy frameworks like the SDGs and NUA emphasize the need for multi-level governance, regional coordination and integrated approaches that acknowledge interactions between urban, peri-urban, and rural areas. Despite these frameworks, urban-rural interlinkages are often overlooked in urban planning and decision-making practices. This oversight has resulted in major problems such as degrading ecosystem services and encroachment on natural habitats.
Urban-rural interlinkages are often overlooked in urban planning and decision-making practices
Unregulated peri-urban development that increases human interaction with other species may increase zoonotic diseases through virologic mutation, as observed in many rapidly urbanizing countries of Asia, such as China and Vietnam.115 Virologists have argued that the convergence of three processes, namely, urbanization, agricultural intensification and habitat alteration has increased the emergence and spread of infectious diseases. For instance, evidence suggests links between emerging infectious diseases and rapid urbanization in China and other rapidly urbanizing developing countries. In other words, rapid urbanization has triggered and accelerated the spread of infectious diseases. It is estimated that about half of zoonotic diseases that emerged since 1940 could be linked to periods of major forest loss and habitat encroachment.116
In rapidly urbanizing contexts that are going through land use transition in peri-urban areas (from agricultural to urban), effective siting decisions need to be made to, in addition to minimizing negative impacts on natural ecosystems, regulate the human-livestock interface and ensure their comingling does not lead to “host-jumping and pathogen spread among humans.”117 In addition to mitigating environmental impacts, regional interventions that manage and regulate urbanization, agricultural intensification and habitat alteration processes through land-use planning and spatial planning can reduce the risk of human exposure to zoonotic agents, thereby facilitating more effective control of virus transmission and contagion risks. Regional planning
Unregulated peri-urban development that increases human interaction with other species may increase zoonotic diseases through virologic mutation
approaches allow planning to play its role as a preventative tool (in contrast to biomedical approaches that are mainly focused on responses).118
Adopting a regional and territorial approach means acknowledging that cities are socio-ecological systems, and their management requires integrated approaches instead of silo-based ones.119 For this purpose, in some contexts, regional and territorial planning has been utilized.120 However, the current planning systems based on political or administrative boundaries often do not lend themselves to the proper consideration of dynamic interactions between urban and rural settlements that are nested within an integrated spatial network. It is, therefore, suggested that planning system boundaries should be determined based on community and/or functional criteria. While defining functional boundaries could be challenging in some contexts due to data limitations, readily available data from satellite imagery and population grids can be used to develop standardized methods for defining functional boundaries.121
Adopting a regional and territorial approach means acknowledging that cities are socioecological systems, and their management requires integrated approaches instead of silobased ones
Ensuring proper planning in such a functionally-defined system requires adopting a multi-level governance system that can coordinate activities across different types of human settlements.122 Instead of fragmented systems where each city operates in isolation, in integrated governance systems, networks of cities are formed, and dynamics and impacts beyond individual municipal boundaries are taken into account in planning and decision-making processes. Multi-level governance that facilitates cooperation across scales also contributes to achieving the New Urban Agenda’s objectives and enhances socio-economic and environmental values of sustainable urbanization, as is explained in the World Cities Report 2020.123
While multi-level governance involves multiple issues, the food supply chain offers a tangible example. The issue of food security and cities’ dependence on their hinterland provides a strong justification for promoting multi-level governance systems. While cities can meet part of their food needs through urban agriculture, they will remain dependent on their peri-urban and rural areas and international supply chains to ensure food security. Adverse events such as
While cities can meet part of their food needs through urban agriculture, they will remain dependent on their peri-urban and rural areas and international supply chains to ensure food security
pandemics can result in food insecurity in cities due to food processing, distribution and delivery disruptions. Multi-level governance at the regional scale is needed to respond to such disruptions and engage multiple actors and stakeholders in planning for better regional resilience. Such multi-level governance will ensure improved management of interlinkages and interdependencies among different settlements in a city-region.124
Based on the principles of multi-level regional planning and governance, the Food and Agriculture Organization (FAO) has proposed the City-Region Food Systems (CRFS) approach that provides opportunities to address challenges “inherent to the industrial capital-driven food system” that can result in supply chain disruptions and food insecurity during adverse events (Figure 6.12).125 Key features of CRFS are

its abilities to strike a balance between regional dependency and local self-sufficiency (Box 6.5) and to foster and strengthen collaboration among different local governments and stakeholders.126 Having collaborative networks is critical for community resilience against different shocks, including pandemics. CRFS also provides multiple benefits for sustainability. It contributes to enhancing availability and accessibility to quality locally grown food, thereby providing health benefits; helps protect the ecosystem by nurturing soil and improving watershed management; strengthens the local economy by increasing money recirculation with the region; and increases social capital by providing more opportunities for interactions and collaboration between different stakeholders.127
Overall, for cities to be more resilient against pandemics and other threats, multi-level governance approaches and coordinated policies and actions across different scales and sectors are needed. Such approaches facilitate better management of the transitional spaces between urban and rural areas and can enhance efficiency, minimize conflicts and trade-offs, and maximize co-benefits and synergies between different measures and strategies.
When COVID-19 began developing in 2020, Victory Garden Initiative, an urban farm in the Harambee neighbourhood, Milwaukee, US, pivoted. The 1.5-acre farm nestled between Concordia Avenue and Townsend Street went from being for members only to allowing access to anyone who wants fresh vegetables that are grown on the site. It has operated as a community-supported agriculture farm since 2017 when the initiative acquired the land. People pay a yearly fee to receive a share or box of the farm’s harvest. Urban gardens or farms like Victory Garden Initiative have increasingly stepped up to fill the food access void, providing fresh fruits and vegetables during the pandemic. They’ve become pivotal in countering food insecurity, especially of Black and Latinx families.
Source: Lynch, 2021.
The COVID-19 pandemic could be a catalyst for major transformations in cities. Indeed, cities have often survived adverse events throughout history and developed innovative solutions to recover stronger. Therefore, while the pandemic has raised serious questions about the sustainability and resilience of cities, it has also provided multiple insights for reflection on the way forward as summarized below:
The most important lesson is that current urban development patterns are unsustainable in numerous ways. The pandemic revealed that major transformations in the energy and transportation sectors are needed to achieve deep decarbonization, which is essential for dealing with climate change, a pressing challenge looming over cities.
There is an urgent need for stimulus and recovery plans that ensure both socio-economic recovery and alignment with climate targets. Further investments in green and renewable technologies and solutions across all sectors, especially energy and transport, are needed. Such recovery efforts should be inclusive to minimize societal inequalities that are blamed for disproportional impacts of adverse events such as pandemics and climate-induced disasters on different social groupings in our cities.
It is essential to retrofit and redesign urban infrastructure, both indoor and outdoor, to enhance its resilience to pandemics and crises. The COVID-19 pandemic has shown the need for multi-purpose and flexible spaces that can adapt to new scenarios, which is a major shift from traditional urban planning practices like single-use zoning that often overlook flexibility and adaptability.
Compact development remains crucial for supporting economies of scale, minimizing unregulated intrusion in ecosystems, and facilitating other sustainable urban development measures such as creating cities of short distances such as sustainable neighbourhood planning, 15-minute and 20-minute cities. Well-designed and wellmanaged compact cities with equitable distribution of infrastructure and services, mixed uses, walkable access to open and green spaces, and support to vulnerable residents during adverse events (e.g. economic support packages, and delivery of food and basic services) are safe and resilient to pandemics.
There is a need to reduce car dependence and continue efforts to promote sustainable public transport and active mobility. There are tools that are readily available such as the Sustainable Urban Mobility Plans (SUMPs) and Avoid-Shift-Improve (A-S-I). Additionally, integrated transportation policies are needed to establish seamless connections between public transportation and walking/ cycling networks. In combination with measures aimed at increasing shared mobility and enhancing the safety and affordability of public transportation, such policies could effectively reduce car dependence in cities.
Urban and territorial planning should be enhanced to include a keener focus on urban-rural and food system interlinkages. Cities do not exist in isolation and planning efforts should reflect this.
1. UnitedNationsDepartmentof EconomicandSocialAffairs,2019.
2. Setoetal.,2013.
3. OECDandEuropeanCommission, 2020.
4. SharifiandKhavarian-Garmsir,2020.
5. UN-Habitat,2016a.
6. laGrecaetal.,2020.
7. Fezi,2020.
8. SharifiandKhavarian-Garmsir,2020.
9. Sharifietal.,2021.
10. ÅbergandTondelli,2021;Sapraand Nayak,2021.
11. Campbell,2018.
12. Venteretal.,2020.
13. Sharifi,2021.
14. SharifiandKhavarian-Garmsir, 2020.
15. UNEP,2021e.
16. UNEP,2020b.
17. SharifiandKhavarian-Garmsir,2020.
18. Klenertetal.,2020.
19. UN-Habitat,2021a.
20. MartínezandShort,2021;UNEP, 2021.
21. UN-HabitatandGlobalUtmaning, 2021.
22. Wade,2020.
23. UnitedNationsDepartmentof EconomicandSocialAffairs,2019.
24. BiswasP.P.,2020.
25. Mogliaetal.,2021.
26. UN-HabitatandGlobalUtmaning, 2021.
27. Zhuangetal.,2021.
28. MartínezandShort, 2021.
29. Honey-Rosésetal., 2020.
30. AlexandriandJanoschka, 2020.
31. SapraandNayak, 2021.
32. GallentandMadeddu, 2021.
33. Bayulkenetal.,2021.
34. Ballingetal.,2021.
35. Ferdous,2021.
36. GallentandMadeddu, 202
37. GallentandMadeddu, 202
38. HallandVidén,2005
39. Kangetal.,2020.
40. UN-Habitat,2021a.
41. Fezi,2020. 42. Fezi,2020.
Paközetal.,2021.
44. Fezi,2020.
45. AlexandriandJanoschka, 2020.
46. Pousoetal.,2021.
47. deLannoyetal.,2020..
48. Devine-Wrightetal.,2020.
49. Fangetal.,2020.
50. Silva,2016.
51. UN-Habitat,2021a.
52. Bayulkenetal.,2021.
53. Firthetal.,2021. 54. Firthetal.,2021.
55. Sharifi,2019. 56. Sharifi,2019.
57. GallentandMadeddu,2021;Kakderi etal.,2021;SapraandNayak,2021.
58. Fezi,2020.
59. Laketal.,2021;Rivera-Córdova, 2021;Youetal.,2020.
60. Boterman,2020;Federgruenand
Naha,2021;Khavarian-Garmsiret al.,2021.
61. UN-Habitat,2021a.
62. SharifiandKhavarian-Garmsir,2020. 63. Kangetal.,2020. 64. Kangetal.,2020.
65. UN-Habitat,2021a.
66. Sharifi,2019.
67. Hamidietal.,2020;Kangetal., 2020;Magallón-Botayaetal.,2021.
68. SharifiandKhavarian-Garmsir,2020; UN-Habitat,2021a.
69. LaiS.etal.,2020. 70. Saint,2021. 71. Chernicketal.,2020. 72. Kakderietal.,2021. 73. Sharifi,2016. 74. Morenoetal.,2021;Sharifi,2016. 75. Sharifi,2016;UN-Habitat,2015a. 76. SharifiandMurayama,2013. 77. SharifiandMurayama,2013. 78. Sharifi,2016. 79. Kangetal.,2020. 80. Odoneetal.,2020. 81. Kangetal.,2020. 82. Sallisetal.,2020. 83. SallisandGlanz,2009. 84. Blay-Palmeretal.,2021. 85. Shokouhyaretal.,2021. 86. UITP,2020b. 87. ThombreandAgarwal,2021. 88. Mogliaetal.,2021. 89. Mogliaetal.,2021. 90. UITP,2020a. 91. Simsetal.,2014. 92. Fezi,2020. 93. Barbarossa,2020;Bojovicetal., 2020;Hörcheretal.,2021. 94. MartínezandShort,2021.
95. Cities4Health,2020. 96. Mogliaetal.,2021. 97. Paseetal.,2020. 98. WangandNoland,2021. 99. Paseetal.,2020. 100. IPCC,2014b. 101. WHO,2021f. 102. IPCC,2014b. 103. Ceder,2021. 104. GIZ,2014. 105. Eltis,2021. 106. EuropeanCyclists’Federation,2020. 107. Okraszewskaetal,2018. 108. Eltis,2021. 109. Liimatainenetal,2018;Stegand Gifford,2005. 110. StegandGifford,2005. 111. UN-Habitat,2013.
112. AngelandBlei,2020. 113. Bhowmicketal.,2020. 114. UN-Habitat,2021a. 115. Spenceretal.,2022. 116. Azevedoetal.,2020;UN-Habitat, 2021a. 117. Spenceretal.,2022. 118. Spenceretal.,2022. 119. Murganteetal.,2020. 120. Gruehn,2017;Todes,2004. 121. AngelandBlei,2020;OECDand EuropeanCommission,2020. 122. AngelandBlei,2020. 123. UN-Habitat,2020a. 124. Sukhwanietal.,2020. 125. Blay-Palmeretal.,2021. 126. Blay-Palmeretal.,2021. 127. Blay-Palmeretal.,2021.

1. Climate change has overtaken disease as the foremost urban health threat and risks leading to the high damage urban future scenario.
2. The causes of mortality and ill health in cities have shifted significantly in the past 20 years with the rising toll of Non-Communicable Diseases (NCDs) in both low-income and higher-income cities.
3. COVID-19 amplified cities’ entrenched health inequities with racial/ethnic minorities, women, displaced populations, residents of informal settlements, precarious workers, and other marginalized groups disproportionately affected.
4. Rising levels of depression, anxiety and other mental health impacts have been linked to COVID-19, particularly for essential workers, those with heightened caring duties (especially women), racial/ethnic minorities and other vulnerable groups.
5. In six of the most disruptive conflicts currently waging in the world today, major cities have been active battlegrounds leading to immediate and long-term devastating impacts on urban health and future development.

1. When health is recognized and acted upon as a priority across all urban interventions, there are vital possibilities to achieve multiple benefits for well-being and foster inclusive, resilient, and sustainable urban futures.
2. Ongoing disaggregated data collection is essential to reveal the true picture of multi-layered rapidly changing urban health risks for effective policy formulation and action to ensure policymakers “leave no one behind.”
3. Challenges of health inequity—often rooted in geographic, political and socioeconomic exclusion—can be tackled via place-based initiatives co-developed with residents to promote health in marginalized neighbourhoods and support more equitable urban futures.
4. Expanding Universal Health Care is a key priority in advancing health for inclusive, resilient, and sustainable urban futures as well as strengthening health system preparedness for a future of epidemics and pandemics.
5. Responsive, accountable local governments play a pivotal role in developing effective holistic place—based interventions that can generate multiple co-benefits for health, inclusion and climate change mitigation.
Health in all its multifaceted dimensions has surged to the forefront of public dialogue, especially discussions of cities, in the last two years. But the reinvigorated movement for healthy cities to achieve the optimistic urban future scenario urgently needs multisectoral approaches extending far beyond the health sector. Such wide-ranging approaches are necessary because health is an essential component of sustainable urbanization given its impact on and interrelation with social, economic and environmental factors. Rather than existing as a standalone priority, health can serve as a catalyst that unifies several SDGs and generates multiple farreaching benefits beyond the absence of disease.
Indeed, health should not be so narrowly understood. The Constitution of the World Health Organization (WHO) defines “health” broadly as “a state of complete physical, mental and social well-being and not merely the absence of disease or infirmity.”1 More recently, WHO has championed the “healthy cities” global movement to inform city governments of the important role of social, spatial and physical factors in supporting health and well-being for all.2 The approach also emphasizes the pivotal overarching role of responsive, accountable local governance in supporting social determinants of health including fostering safety, promoting social cohesion, enhancing living conditions and creating access to decent work.3
Improved access to healthcare; water, sanitation, and hygiene (WASH); and other health-promoting infrastructure and services are the necessary minimum components to support well-being in urban areas. However, in the wake of present-day challenges, health interventions for sustainable urban futures will need to incorporate considerations of climate change, which poses the foremost contemporary urban health threat.4 Climate-relatedhealthimpactswillneedtobeaddressedacross several sectors and levels, including at the home, workplace, neighbourhood, city, metropolitan and regional scales.
Analyses of rural and urban health data have often suggested there are better health outcomes in urban areas and that urban residents typically “enjoy better health on average than their rural counterparts.”5 However, when household wealth is taken into account, the “urban advantage” in health often disappears.6 Based on recent data on children’s survival and well-being from 77 low- and middle-income countries, the “poorest and most vulnerable urban children fare worse than their peers in rural areas.”7
More generally, in many urban centres, the same health risks are experienced and acted upon in starkly different ways due
to racial divides, gendered discrimination, xenophobia and other sources of disadvantage. Known as “health inequities,” such differences in health outcomes are “not only unnecessary and avoidable, but in addition, are considered unfair and unjust.”8
Improved understanding of how multiple factors contribute to urban health disparities at several levels and sites (including homes, workplaces and neighbourhoods) will be key to effective interventions that can avoid entrenching urban health inequities. Additionally, there is a crucial need for ongoing, disaggregated data collection to understand and address urban health inequalities. Findings on health risks by residents themselves (so-called “citizen scientists”), including those in informal settlements, can help fill data gaps while also informing effective, equitable interventions.
The COVID-19 pandemic exacerbated cities’ profound health inequalities, with racial/ethnic minorities, women, people with disabilities, residents of informal settlements, precarious workers and other marginalized groups bearing an especially heavy toll.9 In the wake of COVID-19, it will be essential to develop strategies that promote healthy urban futures while also fostering climate resilience, social inclusion and more inclusive development pathways in order to avoid the high damage urban future scenario.10 Promoting health for sustainable urban futures will require a holistic multisectoral approach to address the interrelated social, economic, political, and environmental factors influencing health in cities. Such interventions can simultaneously address the complex set of determinants of urban health as well as generate co-benefits toward these goals.
This chapter will therefore focus on opportunities for generating multiple co-benefits for health, inclusion and climate change mitigation by placing health at the core of urban interventions. This requires a holistic understanding of the factors influencing health in cities as well as addressing the roots of health inequities. The question guiding the chapter is: How can cities effectively promote and secure health for inclusive, resilient, and sustainable urban futures?
Section 7.1 illustrates the multilayered, rapidly changing nature of urban health risks and analyses data on the shifting causes of mortality in urban areas. The section also examines howhealthoutcomescanvarymarkedlybasedonrace,gender, disability, income levels, residence and other differences within and between cities. It also discusses the intersectional nature of urban health inequalities and the necessity of developing inclusive, contextually rooted strategies.
Section 7.2 considers recent innovative strategies for addressing urban health inequities. The section presents place-based interventions being implemented in cities across the world that are fostering equitable health and well-being such as telemedicine, “citizen science”, partnerships with civil society organizations, and urban redesign.
While health equity - promoting initiatives are necessarily place-specific, the forward-looking section 7.3 reflects on the overarching vision to create healthy cities and thus generate inclusive, resilient and sustainable urban futures.
The section identifies nine interrelated priorities: 1) the “health in all policies” approach; 2) ongoing, disaggregated data collection 3) developing holistic, place-based strategies; 4) pursuing climate and health co-benefits; 5) enhancing universal health coverage and complementary social programmes; 6) strengthening health system preparedness; 7) supporting healthy diets and active lifestyles; 8) enhancing health at the workplace; and 9) promoting mental health. The chapter concludes in section 7.4 with five lessons for policy to promote and secure health for inclusive, resilient and sustainable urban futures.

This section elaborates the multilayered, rapidly changing nature of urban health risks and highlights how disadvantages linked to race, gender, disability, income levels, residence and other differences in urban areas generate intersectional inequalities.Toimproveurbanhealtheffectively,policymakers will require ongoing, disaggregated data collection with attention to emerging inequalities and the diversity of the urban context.
While the text will discuss recent data on urban health risks, there are inevitably major gaps in our understanding (especially in cities located in low- and middle-income countries and for vulnerable groups) that remain a priority for future research and interventions.
Long before the appearance of COVID-19, the world was already on track to a pessimistic urban future scenario for health. Studies had already confirmed how land-use change, extraction activities and migration altered and fragmented natural habitats, thus broadening the interface for humanwildlife interactions and increasing the chances of novel infectious diseases.11 The negative impacts of climate
change on the interface between natural and human habitats is linked to zoonotic diseases that pass from animals to humans, such as COVID-19, Ebola, bird flu, H1N1 flu, Middle East respiratory syndrome (MERS), SARS and Zika. This has led to a situation where one new infectious disease appears in humans every four months.12 While HIV/AIDS is not a zoonosis, it remains a key concern in cities globally (Box 7.1). Cities are often where HIV/AIDS prevalence rates are highest despite better services and active civil society organizations addressing the epidemic.13
Even as the world was preoccupied with the COVID-19 pandemic, several outbreaks of the Ebola virus were reported in the Democratic Republic of the Congo and Guinea; major outbreaks of cholera struck Bangladesh, Yemen, Haiti, Niger and Nigeria in 2021;14 and Chikungunya and dengue epidemics were confirmed in the Americas, Africa, Asia, Europe and Oceania.15 While COVID-19 recently heightened public health awareness, the spread of communicable diseases within unhygienic conditions has long been proven historically, with those living in close contact to domestic animals and without access to running water and separate toilet facilities at heightened risk of infection.
While disease has historically been the foremost urban health threat, the 20th century saw public health improvements that dramatically reduced disease risk and increased life expectancy.Climatechangeisnowtheforemosturbanhealth threat leading to the high damage urban future scenario due to more frequent, intense and longer-lasting extreme weather events, particularly floods and heatwaves among
Globally, approximately 37.7 million people were living with HIV in 2020. Of them, 27.5 million were accessing antiretroviral treatment. Some 680,000 people died from AIDS-related illness in 2020. There are notable regional differences of people living with HIV/AIDS. In sub-Saharan Africa, as many as 63 per cent of all new HIV infections in 2020 were amongst women and girls.
By contrast, outside of sub-Saharan Africa, 93 per cent of new infections occurred among key populations – such as sex workers and their clients; gay men and other men who have sex with men; and transgender people – who together accounted for 65 per cent of HIV infections globally.
Rates of HIV/AIDS are often elevated amongst marginalized groups such as racial/ethnic minorities, migrants and intravenous drug users.
Source: UNAIDS, 2021.
other disasters.16 These climate related risks translate to several significant urban health burdens that vary regionally and within cities (Chapter 5).
Climate change is already having major impacts on cities’ WASH provision and food security via more intense, severe or frequent flooding and droughts. Many coastal or low-lying citiesarefacedwithrisingsealevelsandmoreintenseflooding due to climate change.17 Flooding risks can be exacerbated
Climate change is now the foremost urban health threat leading to the high damage urban future scenario due to more frequent, intense and longerlasting extreme weather events
by shortfalls in drainage, poor solid waste management and lack of all-weather roads.18 In turn, urban floods may result in rising levels of waterborne illness; escalating food prices and food insecurity; injuries, mortality, displacement and lost livelihoods amongst affected residents as well as broader economic burdens.19 With further impacts on health and livelihoods, climate change is contributing to droughts and urban water insecurity while interacting with population pressures,watergovernancechallengesandcompetingwater uses. An estimated 25 per cent of cities globally already face water stress,20 and the challenges of water management will only increase with rising temperatures.
Additionally, climate change worsens the urban heat island effect, which has resulted in cities being warmer on average than nearby rural areas attributed to transformations in
the built environment (e.g. dense buildings with limited reflectivity or greenspaces that promote cooling) and greater heat from vehicular transport and buildings.21 More frequent and intense heatwaves are resulting in major health burdens, especially amongst the elderly, children and other vulnerable groups in urban areas.22 The 2020 Carbon Disclosure Project survey of 670 cities (mainly in the North America and Europe) indicated heat-related illness as the most commonly reported health concern.23Annually, an estimated 7 million people die prematurely due to air pollution (both indoor and outdoor) while also causing a substantial reduction in years of healthy life. 24
Air pollution, which is inextricably linked to climate change, can penetrate the bloodstream and affect all organ systems. Impacts can be either transitory (e.g. coughing) or long-term and irreversible, ranging from cardiovascular and respiratory disease, lung and other cancers, asthma and other noncommunicable diseases (NCDs), poor birth outcomes and developmental challenges.25 Urban air pollution is often linked to motor vehicles and local fuel consumption (e.g. household heating), as well as to industrial activities, refuse burning and biomass consumption. In 2021, the WHO substantially tightened its air quality guidelines for the first time since 2005.26 Efforts to uphold the new guidelines would sharply reduce premature mortality and morbidity. If the WHO’s new stringent standards are met in 1,000 European cities with a total population of over 168 million people, an estimated 109,188 deaths could be prevented annually due to particulate matter (PM2.5) and another 57,030 premature deaths due to nitrogen dioxide (Table 7.1).
Additional health burdens linked to motorized vehicles are road traffic injuries, which are the leading cause of mortality
in cities globally. Annually, an estimated 1.35 million people die from road traffic accidents, with accidents now the leading killer of people aged 5 to 29 years old.

In Thailand, an estimated 22,000 people die annually due to road traffic injuries, many of whom live in cities. Highlighting the multilayered nature of urban health risks, many highly polluted cities also have limited access to safe walkways,

Highlighting the multilayered nature of urban health risks, many highly polluted cities also have limited access to safe walkways, cycling lanes or parks
cycling lanes or parks. The provision of these can encourage active lifestyles, combat obesity, improve mental health and reduce air pollution and NCDs.28
Rapid urbanization, food system transformations (especially the consumption of ultra-processed foods with high levels of fat and sugar) and changing activity patterns towards more sedentary lifestyles are leading to significant shifts in disease profiles towards diet-related health risks.29 Recent findings indicate that “unhealthy diets pose a greater risk to morbidity and mortality than does unsafe sex, and alcohol, drug, and tobacco use combined,” while food systems are already pushing beyond safe ecological boundaries.30 Meanwhile, there is a negative environmental footprint from industrial agriculture (particularly
meat and dairy production), which has been associated with rising water scarcity, major reductions in biodiversity, and emissions of methane and other greenhouse gases.31
A growing urban health concern is the increase in mental related illnesses. Mental disorders are in the top 10 leading causes of disease burdens globally, and the number of disability-adjusted life years (DALYs) lost due to mental illness has increased sharply from 80.8 million in 1990 to 125.3 million in 2019.32 Access to mental healthcare is especially rare in low- and middle-income countries, where there are few studies on past interventions.33 Rising levels of depression, anxiety and other mental health impacts have been linked to COVID-19, particularly for essential workers, those with heightened caring duties (especially women), racial/ethnic minorities and other vulnerable groups.
7.1.2
Longitudinal analysis has revealed the changing causes of mortality in cities, underscoring the rising toll of NCDs in both low-income and higher-income cities. In 2019, the three leading causes of death globally were cardiovascular diseases,includingstrokesandischaemicheartdisease(IHD), respiratory diseases such as lower respiratory infections and chronic obstructive pulmonary disease (COPD), and neonatal conditions, with 7 out of the 10 top causes due to NCDs (Figure 7.1). For the lowest-income nations, in 2019, the two leading causes of death were neonatal conditions and lower respiratory infections, followed by IHD and stroke; diarrhoeal diseases and malaria were ranked fifth and sixth. But across other regions, the leading cause of death is the same: ischaemic heart disease.
Higher consumption of fats and processed sugars alongside reduced activity profiles are linked to increasing prevalence of obesity, diabetes, hypertension, heart disease and dietrelated cancers that lead to premature mortality in urban areas.34 Urban diets and activity patterns are strongly shaped by the built environment and city planning decisions. For example, the pessimistic scenario for urban futures is already a reality for low-income urban residents who live in so-called “food swamps” or “food deserts.” In food swamps, there is an abundance of unhealthy food for sale from fast food outlets and convenience stores. Food deserts have limited access to grocery stores that sell fresh produce or other sources of affordable, healthy foods.35
As a result of these socio-spatial patterns that inhibit healthy diets, some urban residents suffer from a complex challenge known as the double burden of malnutrition, defined as the
“simultaneous manifestation of both undernutrition and overweight/obesity.” Although patterns vary worldwide, residents in the lowest income quintiles are increasingly overweight and obese, including in Latin American and Asian cities.36 An estimated one-third of stunted children globally live in urban areas.37 Moreover, due to the prevailing genderinequitable division of labour, women are usually tasked with providing and preparing food, which can impose major time and health burdens (especially in low-income areas without adequate WASH and refrigeration).38 There is potentially a vicious circle, where gendered burdens as well as income poverty, unsanitary living conditions and malnutrition reinforce each other.
Kisumu, Kenya, offers a specific portrait of changing urban health threats in the developing world. Malnutrition was the leading behavioural cause of death in 1990, but malnutrition fell to the fourth leading behavioural cause by 2019 (Figure 7.2). Unsafe sex, high blood pressure, air pollution, high body mass and other dietary risks had grown increasingly important in Kisumu by 2019. These changes underscore the rising impacts of NCDs and air quality. There was also a heightened burden linked to HIV/AIDS, which rose starkly from 14 per cent of Kisumu’s total deaths in 1990 to 26 per cent in 2019. Confirming the ongoing dietary changes, Kisumu’s total deaths due to stroke and IHD increased from six per cent to eleven per cent from 1990–2019, while protein-energy malnutrition deaths fell from eleven per cent to less than four per cent of deaths.
Although Jakarta is a far larger and wealthier city than Kisumu, Jakarta’s causes of mortality have also undergone a comparable change with the rise of NCDs and falling levels of malnutrition from 1990–2019. Malnutrition was Jakarta’s leading behavioural cause of mortality in 1990, but by 2019 it had been replaced by high blood pressure, high body mass and high fasting plasma glucose, issues which are all linked to changing diets (Figure 7.3). In 2019, stroke and IHD each comprised up to 16 per cent of total deaths in Jakarta, with another 8 per cent due to diabetes.
Meanwhile, detailed data from London reveals the shared challenge of NCDs across low- and high-income areas (Figure 7.4). In 2019, IHD, stroke and COPD were among the leading causes of death in both London’s high-income boroughs of Kensington and Chelsea as well as the poorer Tower Hamlets. However, deaths linked to drugs, self-harm, Alzheimer’s and other factors still differed between the two boroughs.
Source:
Unsafe sex
pollution
WaSH
blood pressure
use
risks
body-mass
Kidney
Intimate
environmental
Non-optimal temperature
bone mineral density
physical
Kisumu,Both sexes,all ages,
Unsafe sex
Air pollution
Malnutrition
body-mass index
High fasting plasma glucose
Alcohol use Dietary risks
High blood pressure Tobacco
WaSH
HIV/AIDS & STIs
Respiratory infections & TB
Enteric infections
NTDs & malaria
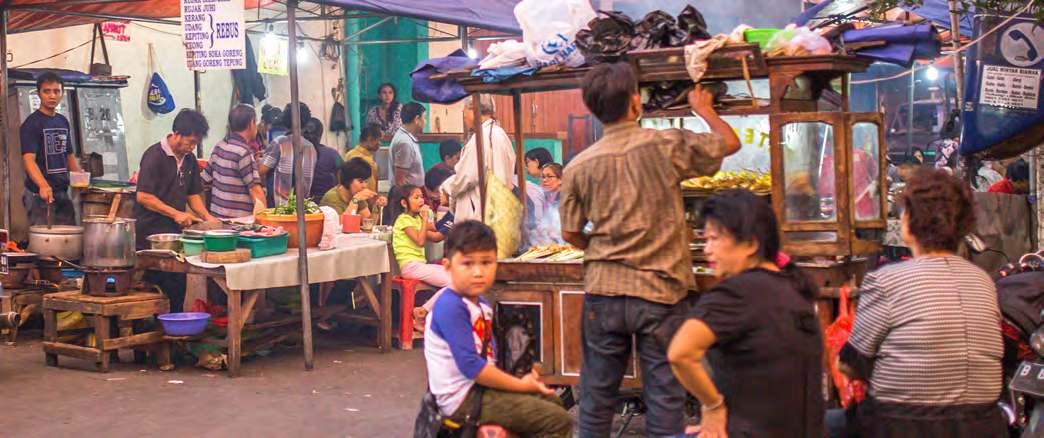
Kidney dysfunction
Intimate partner violence Occupational risks
High LDL Drug use Other environmental
Non-optimal temperature
Low bone mineral density
physical activity
sexual abuse and bullying
Other infectious Maternal & neonatal Nutritional deficiencies
Neoplasms
Cardiovascular diseases Chronic respiratory Digestive diseases
Neurological disorders Mental disorders
Percent of
deaths
Jakarta,Both sexes,all ages, 1990
Jakarta,Both sexes,all ages, 2019
Dietary risks High fasting plasma glucose
Air pollution WaSH
Malnutrition
High blood pressure Tobacco
Dietary risks
High body-mass index
Occupational risks
High blood pressure Tobacco Alcohol use
High fasting plasma glucose High body-mass index Kidney dysfunction
Air pollution WaSH
HIV/AIDS & STIs
Kidney dysfunction
High LDL Drug use
Non-optimal temperature Low bone mineral density
Unsafe sex
Other environmental
Low physical activity Childhood sexual abuse and bullying
Intimate partner violence
Percent
Source: Institute for Health Metrics and Evaluation, 2022.
Occupational risks
Low physical activity
Malnutrition Unsafe sex
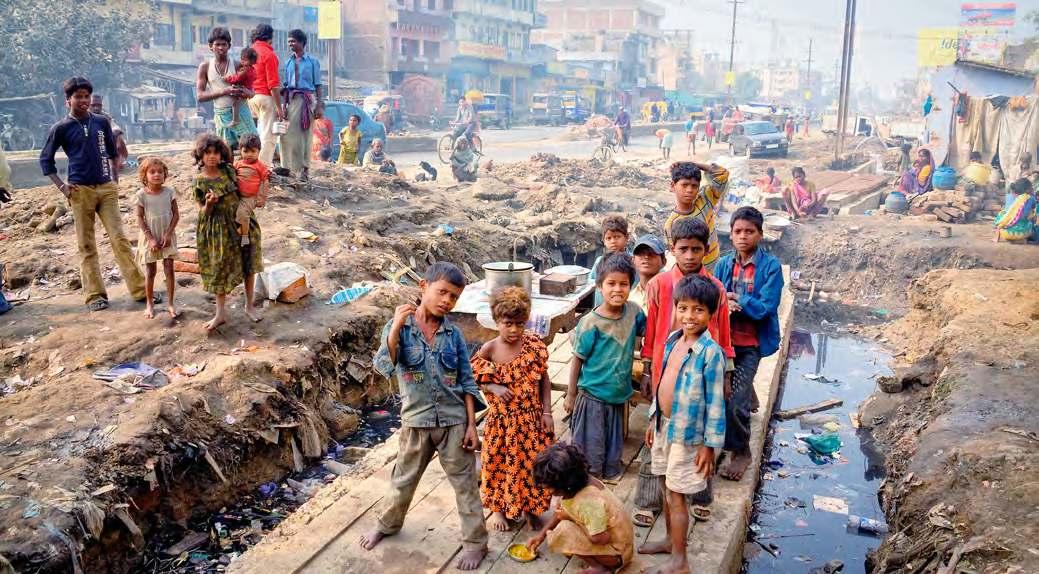
High LDL Drug use Other environmental
Non-optimal temperature Low bone mineral density
Respiratory infections & TB Enteric infections NTDs & malaria Other infectious Maternal & neonatal Nutritional deficiencies
Alcohol use
Intimate partner violence
Childhood sexual abuse and bullying
Percent of total deaths
Neoplasms
Cardiovascular diseases Chronic respiratory Digestive diseases Neurological disorders Mental disorders
In many urban centres, the same health risks are experienced and acted upon in starkly different ways. For instance, racial discrimination and segregation often negatively affect health by reducing minority groups’ access to healthcare while heightening the concentration of poverty and exposure to environmentalhazards.
us on a path to the pessimistic or even high damage urban future scenario.
An intersectional view can uncover how factors such as race, gender, disability,
and
Definedas“healthinequities,”such differences in health outcomes are “not only unnecessary and avoidable, but in addition, are considered unfair and unjust.”
If left unchecked, these health inequities will lead
status, among others, may interact to shape life experiences (e.g. access to healthcare, livelihoods, and housing) and to heighten health risks or deepen disadvantages in cities. Intersectional analyses can help to understand “diverse individuals and social groups, [who] experience the intersection of different structuraldriversofexclusioninuniqueandsituatedways.”
As intersectionality remains a nascent area of urban health research, this sub-section offers illustrative findings and seeks to motivate future health-promoting interventions that truly leave no one behind. A gender-sensitive intersectional approach may spark interventions with marginalized groups that better meet their healthcare needs. This approach can also help to amplify their voice in decision-making.
Individual city dwellers’ health risks and outcomes are influenced by a complex array of factors. Many cities have entrenched differences in health outcome linked to socioeconomic, environmental and political factors that together contribute to complex urban disadvantages. For instance,studiessuggestthatblackandotherracialminorities experience poorer health outcomes throughout the course of their lives. Low-income black women in Brazilian cities may face especially acute challenges in accessing healthcare; struggle to combine caring duties with lengthy commute times and precarious, low-paid employment; and grapple with racial discrimination and intergenerational poverty.42 Meanwhile, transgender people of colour in Chicago often
struggle to find adequate healthcare, which is linked both to racism and transphobia. Although some respondents sought healthcare providers that cater for LGBTQI residents, they also were concerned by these providers’ racism.43
Rich and poor city dwellers in many low- and middle-income countries may differ markedly in their levels of infectious diseases and in rates of maternal and child mortality.44 The poor are typically compelled to live in the least developed areas of a city, often places that are poorly integrated to the urban fabric, where dilapidated environments contribute to worse health outcomes and greater risk of premature deaths. This phenomenon is known as the urban health divide. According to a review comparing tuberculosis rates in slums to national prevalence rates, slum dwellers may be five times more likely to have this disease,45 which is often linked to overcrowded shelter alongside minimal access to affordable, high-quality healthcare.46 Increasingly, there are also major disparities within cities in the incidence of non-communicable diseases.47 Although patterns vary worldwide, residents in the lowest income quintiles in Latin America and Asian cities exhibit higher incidences of the double burden of malnutrition.
Disparities in measles vaccination rates likewise illustrate the urban health divides (Figure 7.5). Inequitable access to vaccines was especially profound in Haiti, where in 2017,
48.2 per cent of slum dwellers were vaccinated compared to 79.1 per cent of non-slum urban residents (a difference of 20.9 per cent). Promisingly, the gap in measles vaccination rates for India fell from 2006 to 2016 (from 17.6 per cent to 7.5 per cent) as rates in India’s slums rose from 67 per cent to 80.2 per cent and those in non-slum urban areas rose slightly from 84.6 per cent to 87.7 per cent.
Access to skilled birth attendance can again vary markedly between and within cities, as well as over time (Figure 7.6). From 2003 to 2017, Filipino women in slums increasingly gave birth in a health facility (rising from 40.3 per cent to 79.3 per cent), but this rate remained far below the levels of women in non-slum urban areas, whose access to health
facilities rose from 74.8 per cent to 92.5 per cent over the same period. Notably, Filipino mothers’ levels of access to health facilities in 2017 were far higher in Manila, where nearly 100 per cent of women gave birth in health facilities (across slum and non-slum areas).
Other findings on urban child nutrition have uncovered enduring inequalities, even as there can be some progress over time. As seen in Figure 7.7, in Bangladesh from 2004 to 2018, levels of child stunting in slums fell almost by half from 44.2 per cent to 23.5 per cent, although this improvement was still double the levels of stunting in non-slum urban areas (where levels declined from 17.1 per cent to 11.7 per cent over the same period).
Cities are increasingly home to displaced populations including refugees, economic migrants and internally displaced people, whose health challenges remain poorly understood. The ongoing conflict in Ukraine triggered yet another global refugee crisis as millions of Ukrainians fled. Globally, an estimated 60 per cent of refugees reside in cities (rather than in refugee camps or rural areas), with many living in informal settlements or other urban areas with lowquality shelter.48 Forcibly displaced residents in cities may face xenophobia or other discrimination; language barriers and employment restrictions (as if they live refugee camps, they are often expected to remain there); and limited access to healthcare, mental health services or other much-needed assistance to cope with trauma.49
Cities are increasingly home to displaced populations including refugees, economic migrants and internally displaced people, whose health challenges remain poorly understood

Another growing concern that could lead to the high damage scenario for urban futures is the shift of battlegrounds to urban environments (Box 7.2). While open field battle away from human settlements dominated warfare for centuries, World War II saw modern warfare fight over towns and cities. The use of heavy weaponry in towns and cities inevitably leads to heavier civilian casualties as well as the destruction of basic infrastructurethatisvitalforthefunctioningandbasichealthof communities such as water, sanitation, gas and electricity lines, leaving fragile communities vulnerable to infectious diseases.50
Theresultingdisruptionsfromarmedconflictsweakenhealth systems in multiple ways including the physical destruction

of hospitals, flight of healthcare workers as well as the interruption of child vaccination and communicable disease surveillance programmes. These damaged infrastructure and health systems require intense time and resource investments to rebuild, thus creating prolonged instabilities and intractable poverty as resources are diverted away from development.51 The health impacts disproportionately affect women and children with over 60 per cent of preventable maternaldeathsand45percentofneonataldeathsestimated to occur in these fragile conflict burdened settings. 52
In six of the most disruptive conflicts currently waging in the world today, major cities have been active battlegrounds: Kabul in Afghanistan; Adwa, Bora, Dessie and Kombolcha in Ethiopia; Aleppo, Dier, Ezzour and Damascus in Syria; Mariupol and Kharkiv in Ukraine; and Sanaa and Aden in Yemen. There is evidence of subsequent devastating effects on health. For instance, Yemen recorded the world’s worst cholera outbreak of the twenty-first century between 2015 and 2017 with over 2 million identified cases. There have also been spikes of diarrhoea in Syrian cities during periods of intense violence. In the Ethiopian region of Tigray, it is estimated that healthcare workers did not provide any child vaccinations nor deliver any antenatal or postnatal care in the first 90 days of conflict. With nearly two decades at war, Afghanistan experiences cyclical outbreaks of measles, with regular spikes reported in Kabul.
Source: IRRC, 2022; Gesesew et al, 2022; WHO, 2022e.
Finally, broader socioeconomic trends contributing to urban health inequalities may include globalization, market-led policy reforms and distribution of assets that in turn influ ence urban service provision and economic development trajectories (Figure 7.8). At the urban level, access to infra structure, service provision, and city planning decisions (linked to inclusive or exclusionary forms of governance)
can significantly shape health outcomes. Meanwhile, at the individual level, a gender-sensitive, intersectional approach can help develop tailored strategies to tackle these complex sources of disadvantage. Urban decisionmakers can draw on community assets and develop inclusive, context-specific strategies to address the drivers of urban health divides across several scales.

The importance of addressing intersectional disadvantages is especially clear in informal settlements, where residents often face hazardous shelter, heightened vulnerabilities to disasters and multiple social, economic and political exclusions. Residents of informal settlements typically encounter environmental health risks linked to inadequate living conditions (e.g. low-quality housing, unclean energy and unsafe WASH) that contribute to elevated risks of communicable diseases including tuberculosis, dengue, cholera and other waterborne illnesses.53 For slum dwellers, the high damage and even pessimistic scenarios for urban futures could lead to catastrophic health outcomes.
Furthermore,informalsettlementsareoftenhighlyvulnerable to climate change and consequent extreme weather events as a result of low-quality shelter and infrastructure, risky locations (e.g. floodplains, steep slopes), and meagre access to emergency services.54 These vulnerabilities can result in heightened “everyday” risks as well as small-scale and largescaledisastersthatoftencontributetocommunicabledisease outbreaks and to deepening poverty.55 With limited incomes, low-quality housing and few physical assets, residents of informal settlements often struggle to recover from disasters or everyday risks.56 Ongoing floods, fires or other disasters may lead to a vicious circle of poverty and ill-health. According to research in Niamey, Niger, repeated small disasters can have a so-called “erosive effect” on household assets in informal settlements.57 Underscoring the need for climate justice, low-income urban residents cumulatively contribute the least to greenhouse gas emissions but often lack the capacities to adapt effectively and require additional support58 (see Chapter 5).
Tenure insecurity in slums contributes to poor health outcomes and exclusions via various pathways, including burdens linked to evictions and highly inadequate infrastructure provision. Evictions may result in disrupted livelihoods and social networks, escalating stress and mental illness, and lost physical assets (all linked to rising poverty and exclusion), as well as injuries or even deaths.59 Many official agencies will not invest in areas with unclear land ownership, and in turn, tenure insecurity may lead to poorer health outcomes because of limited access to WASH, electricity or other services and infrastructure. Moreover, electricity access in informal settlements is often influenced by tenure security: although many cities have higher overall levels of power access than rural areas, slum dwellers may be unable to access legal electricity (due to tenure insecurity, onerous registration processes and/
or cost barriers) and instead may rely on polluting solid fuels or hazardous illegal electricity connections.60 Tenure insecurity in Mumbai is associated with worse health outcomes: residents of non-notified slums (with greater tenure insecurity than Mumbai’s notified slums) had poorer child health and adult nutrition outcomes, likely due to curtailed access to services and infrastructure with deeper roots in slum dwellers’ political marginalization.61 Residents of informal settlements may also face heightened levels of HIV/AIDS, as well as injuries due to road traffic and interpersonal violence, although such risks vary widely between and within these neighbourhoods.62
Attention to gender, age, disability and other differences is crucial to understand health vulnerabilities in informal settlements. Inadequate infrastructure and services provision often has gender-inequitable impacts. Due to gendered division of labour, women in informal settlements, who are often tasked with utilizing fuels to cook, are at an elevated risk of respiratory and cardiovascular disease due to lack of access to clean energy.63 Inadequate sanitation has often disproportionately affected women and girls. Women and girls in African and Asian informal settlements often walk to public toilets at night-time in poorly lit, insecure settlements (thereby risking rape or assault), or else they must resort to degrading, improvised solutions such as plastic bags at home.64
Children are especially susceptible to communicable diseases including pneumonia and diarrhoea; the ensuing care burdens typically fall disproportionately on their mothers, who in the absence of adequate WASH often struggle with rising stress, mental health impacts and lost earnings.65 Along with missed schooling, repeated outbreaks of childhood diarrhoea can contribute to malnutrition,
Underscoring the need for climate justice, lowincome urban residents cumulatively contribute the least to greenhouse gas emissions but often lack the capacities to adapt effectively
long-term cognitive impairments and reduced productivity in adulthood.66 Holistic WASH solutions are essential to support women and other vulnerable groups including the elderly and people with disabilities (PWDs), especially in areas where the environment and its attendant risk and harms leads to worse health outcomes and greater risk of premature deaths.
Disaggregated data even within a small urban locale can offer
into the gendered experience of urban health threats in slums. According to surveys in two Nairobi informal settlements, Korogocho and Viwandani, with about 2,500 adults (aged 15 and older), HIV/AIDS was the cause of 24.5 per cent of women’s deaths but just 12.3 per cent of men’s deaths from 2002–2012 (Figure 7.9).
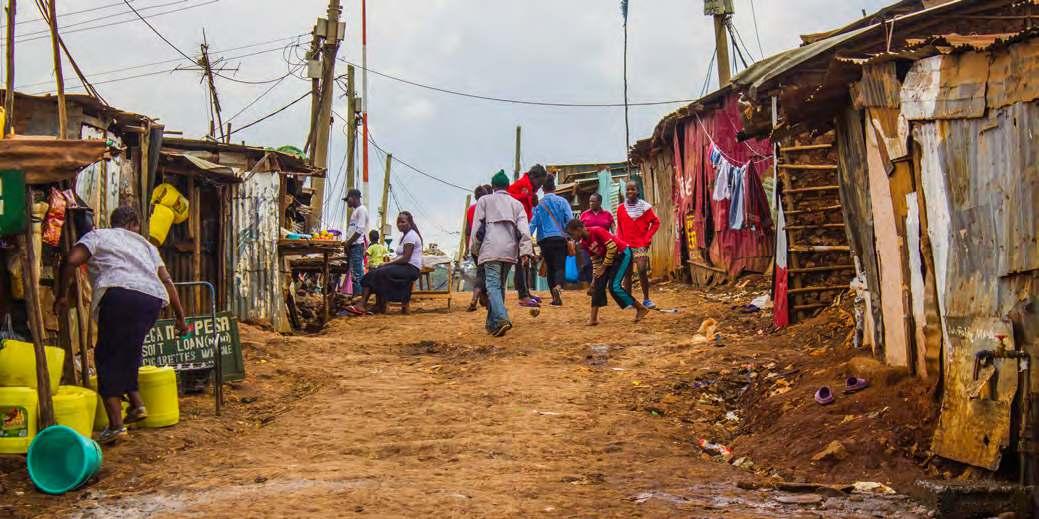
Meanwhile, over 30 per cent of men’s deaths were due to injuries as compared
just 7.2 per cent of women’s deaths. Injury patterns were again highly gendered: assault was the leading cause of men’s injury mortality (58 per cent), as compared to 30 per cent amongst women’s injury deaths. Another 30 per cent of women’s deaths were caused by fire, as compared to 12 per cent of men (likely due to gendered differences in cooking), and women were twice as likely to die from intentional selfharm as men (10 per cent vs. 5 per cent).
Thissectionconsidersrecentpromisingstrategiesforaddressing urban health inequities considering the multiple pathways of deprivations and exclusions that contribute to differential health outcomes. The fundamental causes of health inequities are found in social, political and economic conditions. Action to address these underlying causes and tackling the pathways throughwhichtheyinfluencehealthoutcomescansubstantially help to promote equitable well-being in cities and arrive at the optimistic scenario for urban futures.
Health inequities eliminate the so-called “urban advantage” as a health crisis cuts through economic, social and geographical barriers
The COVID-19 pandemic brought to the fore the urgency of addressing urban health inequities. Health crises have historically been pivotal moments of transformation for urban areas. Health inequities eliminate the so-called “urban advantage” as a health crisis cuts through economic, social and geographical barriers. It therefore follows that enhancing equitable access to healthcare, as well as the social, spatial and physical factors that promote equitable urban health outcomes, should be a priority of urban planning for sustainable urban futures.

Novel strategies are needed to promote accessible, highquality healthcare, and cities are increasingly adopting ICTenabled strategies to support accessibility and inclusivity. Research on telemedicine (the provision of medical care via telecommunication technology) has found several benefits, including for patients with NCDs. According to evidence from the United States, telemedicine has improved health outcomes for patients with stroke and heart failure, as well as helping to manage diabetes and other chronic conditions.
Recently, COVID-19 has accelerated the uptake of digital technologies, and there are encouraging examples of how technology was leveraged to ensure that no one was left behind. Rising levels of depression, anxiety and other mental health impacts have been linked to COVID-19, including for key workers, those with heightened caring duties (especially women), racial/ethnic minorities and other vulnerable groups. Many countries have enhanced helplines during
COVID-19 to provide mental health services (e.g. in Nigeria, Indonesia) including call-in lines tailored to healthcare workers in the Maldives and South Africa, or for South Asian migrants in Gulf countries.68 In Karachi (Pakistan), the Aga Khan University initiated free, online training sessions in parent-mediated therapy to support children with disabilities that was available nationwide.69
Telemedicine was also used to support older persons and people with dementia during the pandemic and bridge the unequal access to healthcare in Gangdong-gu, South Korea (Box 7.3).
Drawing upon the 2014 Ebola response, Liberia’s mHero communication system that is operated on a basic talk-andtext pattern (no smartphone needed) was used to update healthcare workers about COVID-19 outbreaks. Likewise, within one month after its first reported COVID-19 case on 14 March 2020, Rwanda was able to deploy the use of drones in the city of Kigali and the secondary cities of Rubavu and Rusizi targeting densely populated, hard-to-reach areas that presented high-risk nodes in the management of the pandemic. The country coordinated a multi-sectoral response that leveraged technology alongside healthcare worker deployment in targeted hotspots.70 The ability of Rwanda to leverage technology for effective interventions
Box 7.3: Using technology to bridge access to dementia care in Gangdong-du City, Republic of Korea
Gangdong-gu, a municipality on the outskirts of Seoul, has a longstanding commitment to serving people with dementia, including a safe village and public guardianship for people with dementia. During COVID-19, the Centre for Dementia initiated remote clinical assessments by staff who offered technical support and expanded access to web- and phone-based consultations (both for families and dementia patients). Gangdong-gu also offered dementia classes online, cognitive stimulation kits and tailored case management for addressing needs such as nutrition, housing, and emotional support throughout the pandemic. Using disaggregated data, the municipality was able to identify 261 people living alone and/or on basic incomes, which enabled tailored case management that considered emotional and daily living support.
Source: WHO, 2021d.
during the pandemic enabled the capital to remain on course in implementing its Kigali Master Plan 2050 that aspires for a green, efficient, inclusive, vibrant and productive city.71
There is urgent need, however, to overcome the digital divide facing disadvantaged populations, and few studies have considered how telemedicine can reach persons with disabilities or other excluded urban groups (Chapter 9).72 Sometimes the anonymity of mobile consultin can be beneficial in discussing sensitive topics, but there are nevertheless concerns around lack of regulation, affordability, appropriateness and privacy.73 There are again concerns about inclusion in “smart cities” strategies, which may overlook health equity concerns.74 While digital solutions are a key element of healthy urban futures, these will need to be combined with other innovative strategies to reach vulnerable groups.
There is an essential need for ongoing, disaggregated data collection with attention to multiple disadvantages to ensure thatnooneisleftbehind.75 However,theremaybelimiteddata available for marginalized residents including the homeless, refugees and residents of informal settlements who may be excluded in census taking or other official data.76 Findings on health risks by residents themselves, including those in informal settlements, can help to fill data gaps while also informing effective place-based interventions. This “citizen science” is an essential complement to official data sources.
There is an essential need for ongoing, disaggregated data collection with attention to multiple disadvantages to ensure that no one is left behind
Members of the global network Shack/Slum Dwellers International (SDI) have gathered in-depth findings on shelter provision, access to services and other determinants of health in their own neighbourhoods.77 SDI’s informal settlement profiles and mapping exercises have explored residents’ access to housing, WASH, electricity, solid waste management, health clinics and fire stations (if available), alongside local demographics, eviction threats and locational hazards (e.g. recent experiences of natural disasters). These surveys have provided much-needed disaggregated findings and fostered effective health promotion strategies when acted upon.
In many cities, community health workers (CHWs) are essential service providers of inclusive health systems, but in urban settings policymakers do not recognize their contributions as much as those in rural areas. Where adequately supported in skills and resources, CHWs play a central role in urban health equity, including promotion of maternal and child health, enhancing health literacy and addressing both NCDs and communicable diseases.78 In cities in low- and middle-income countries, CHWs typically provide health education, outreach, and direct service
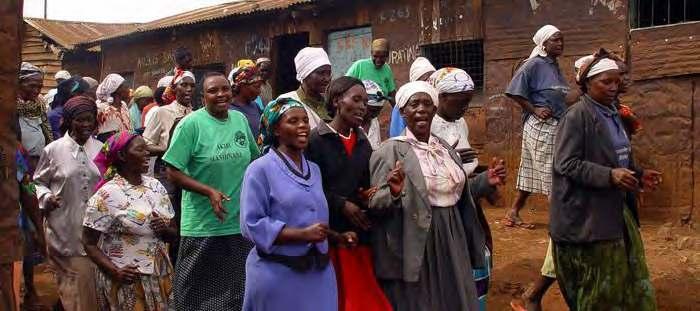
provision such as home visits. During COVID-19, CHWs were essential in promoting community sensitization and contact tracing, providing referrals and assisting patients in self-isolation.79 In Ethiopia, CHWs conducted outreach via digital megaphones and audio messages in local languages; Viet Nam created a telemedicine platform to reduce CHWs’ exposuretopatientswhilestillraisingpublicawarenessabout COVID-19.80 To build CHWs’ capacities and strengthen their future contributions, policymakers will need to enhance their training in digital and other skills, offer significantly improved compensation and benefits (e.g. support with housing, transport, and PPE), and provide prizes or other recognition.81 With women comprising the majority of CHWs, it will be fundamental to support the empowerment of these women and enhance the profile of these crucial but unsung agents of inclusion and change.


Promising initiatives that blend strategies for enhancing urban built environments and upgrading informal settlements with other social goals have improved several health outcomes among vulnerable groups while also promoting climate resilience, poverty reduction, and youth livelihoods. Improving access to affordable adequate housing, WASH, roads and drainages and other vital infrastructure can significantly reduce the risks of disasters and communicable disease transmission, while also enhancing access to healthcare and emergency services. Furthermore, equitable upgrading partnerships with strong grassroots participation can improve the social determinants of health such as safety, social cohesion, and empowerment.
Adequate housing is considered key in promoting health and building resilience to systemic shocks.82 People experiencing homelessness often face barriers to accessing healthcare and several interrelated disadvantages, such as racial or gender-based discrimination, behavioural health issues and substance abuse. Additionally, homeless populations are especially exposed to extreme weather events, and their physical and mental health is likely to be affected by climate change.83 The policy approach known as “housing first” recognizes the importance of providing a safe, secure dwelling before tackling health and other challenges of homeless people. Several European and North American cities have adopted this policy with initiatives to provide rapid housing but, importantly, not requiring abstinence from substance use. Findings suggest that this approach may improve health in the short term.84 Compared to the control group, participants in housing first programmes had
fewer emergency department visits and were more likely to be housed at 18–24 months; it remains unclear whether the improved health outcomes will be sustained over the longer term. It is also vital to develop integrated initiatives that extend beyond improving housing and healthcare access to support mental health, access to social services and combat the stigma surrounding homelessness.
Urban safety is another social determinant of health. In Cape Town, South Africa, the Violence Prevention through Urban Upgrading (VPUU) initiative has helped de-escalate violence in the township of Khayelitsha. VPUU has prioritized youth employment, vigorous community participation and social inclusion; it also utilized urban design strategies to promote passive surveillance and create integrated community centres.85 By combining improvements in infrastructure with social programmes and strong local participation, this holistic initiative led to a 34 per cent reduction in exposure to interpersonal violence from 2013–2015.86
Reliable street lighting can generate several gains in health, safety and livelihoods by extending the amount of time that local businesses can operate in the evening, with particular benefits for women working from home and others working within informal settlements.87 In over 40 cities in Brazil, the Efficient Community Programme has enhanced access to fluorescent lamps and energy-efficient refrigerators, as well as supporting behavioural change using local youth as agents to enhance outreach and uptake in low-income areas.88 Chilean cities and Santo Domingo, Dominican Republic, have supported climate resilience through low-carbon building designs (including incremental construction that supports affordability), and selective relocation away from flood-prone areas.89
Climate change mitigation schemes can improve the social determinants of health. Cape Town retrofitted 2,300 houses with solar water heating and roof insulation as part of a lowincome housing project funded by the Clean Development Mechanism, a United Nations carbon offset scheme.90 In additiontoloweringemissions,thisprojecthasreducedpoverty byloweringheatingexpenditures,improvedrespiratoryhealth outcomes by adding home insulation and provided on-the-job
“Housing first” recognizes the importance of providing a safe, secure dwelling before tackling health and other challenges of homeless people
training to local residents who implemented the retrofits.91 In Richmond, US, the city’s climate action plan provided free or subsidized solar power and home energy efficiency programmes; the related programme RichmondBUILD trained young people (often ex-offenders) in building trade skills to install the new solar and home energy equipment.92 More generally, cooler housing designs can reduce heat stress and lower energy consumption, with particular benefits for older persons, children, people with pre-existing health conditions and other vulnerable groups.93
Meanwhile, efforts to promote cycling and pedestrianization can support access to work or education, improve local economies due to enhanced footfall, and may enhance
disaster resilience by providing all-weather paths in informal settlements (Figure 7.10). For instance, Nairobi’s largescale upgrading programme in Mukuru known as a Special Planning Area (SPA) has created inclusive transport solutions thanks to strong collaborations between local officials, academics, civil society and community residents.94 For the upgraded transport network, the widest road will be 12 meters rather than 48 meters (as per Kenyan planning standards for roads), thus displacing far fewer residents than would have occurred if using conventional roads. At the same time, the SPA has prioritized improving non-motorized transport (an appropriate choice as most Mukuru residents are pedestrians), which also fosters healthy and low-carbon mobility patterns.

Age-friendly strategies are increasingly important in cities with sizable populations of older persons, and integrated approaches can offer meaningful improvements in health, mental wellness and inclusion. WHO’s Age-Friendly Cities programme has highlighted the importance of changing perceptions of older persons, involving a wide range of stakeholders (e.g. community organizations, universities and businesses) and developing multisectoral approaches.95
Forinstance,theAge-FriendlyManchesterCultureProgramme brought together 19 cultural organizations (including museums, orchestras and theatres) to ensure these activities are more accessible to older persons. The UK city sought to address social isolation and racial exclusion by partnering with organizations representing older people from black, Asian, and minority ethnic groups. Manchester also established an AgeFriendly Assembly and Older People’s Board that promotes participation and inclusive decision-making.96
In the Turkish municipality of Besiktas (population of 181,000, with 20 per cent age 60 and above), integrated social centres have helped enhance older persons’ cognitive skills and social integration, as well as offering group therapy and counselling services.97 The centres provided several opportunities to join cultural activities such as concerts and seminars, as well as gardening, games and various crafts. Individuals participating in Besiktas’ centres had lower levels of depression and higher social support levels than those receiving home-based assistance.
Finally, in Valencia, Spain, the city council worked with the Older People’s Association to create eight “bio-healthy parks” that simultaneously promote healthy exercise, access to green spaces and enhanced socialization.98 Each Park has several types of exercise equipment tailored to older people’s needs (e.g. to maintain agility and balance), and the initiative
also benefited from cross-sectoral collaboration within the city council.
7.2.6 Health as a catalyst for social and environmental justice Health can catalyse interventions that generate far-reaching gains in social and environmental justice. Air quality is strongly linked to climate change, environmental injustices and multiple shortfalls in urban planning. The health burden disproportionately falls upon low-income residents and neighbourhoods who have typically contributed the least to greenhouse gas emissions but often lack the capacities to adapt effectively and require additional support (Box 7.4).99 As discussed in Chapters 5 and 6, building infrastructure to support non-motorized transport and planning for 15-, 20- and 30-minute cities are among the ways that cities can achieve
Health can catalyse interventions that generate far-reaching gains in social and environmental justice

In Greater Accra recent findings highlighted the inequitable, far-reaching impacts of air pollution. Amongst patients hospitalized due to air pollution or road traffic injuries, the poorest two quintiles were over-represented, accounting for 45 per cent of admissions. The majority were informal workers and the associated medical costs, most of which they bore out of pocket, represented up to double their annual earnings. Furthermore, indirect costs of air pollution were often extremely high for lung cancer, ischemic heart disease and road traffic (due to lost incomes), making the impacts of air pollution even more unmanageable for the poorest residents.
Source: Lampert et al, 2021.
simultaneous co-benefits, such as reducing greenhouse gas emissions, creating healthier neighbourhoods and reducing per capita expenditures on public infrastructure maintenance.
How cities respond to endemics like HIV/AIDS are also health catalysts for social justice. In 2014, UNAIDS launched the 90-90-90 Initiative with the following targets: 1) 90 per cent of people living with HIV know their HIV status, 2) 90 per cent of people who know their HIV-positive status are accessing treatment, and 3) 90 per cent of people on treatment have suppressed viral loads. In making strides to achieve these goals, cities and municipalities are increasingly adopting a social justice approach to design initiatives tackling exclusions and intersectional inequalities.100
Over 300 cities and municipalities have joined UNAIDS in this effort. Collectively they are known as Fast-Track Cities and have achieved impressive results. Kigali, nearly reaching the global treatment targets (currently 91-94-89),101 has prioritized reducing HIV infections among adolescents, supports female sex workers (e.g. with condoms and access to information), and is developing coordination mechanisms with stakeholders such as faith-based organizations, the judiciary, and civil society groups focused on genderbased violence and human rights. In Amsterdam, a broad consortium of stakeholders involved in HIV prevention and caredevelopedanintegratedstrategythatsuccessfullyhelped to reduce transmission. Amsterdam’s highest-risk groups are migrants and men who have sex with men (MSM); the HIV TransmissionEliminationAmsterdaminitiativetargetedthese groups to help reduce new diagnoses, while also including affected communities and interdisciplinary specialists on the project’s team.102 Key interventions in Amsterdam include same-day testing and treatment, focused awareness-raising campaigns and enhanced access to preexposure prophylaxis (PrEP). New York City’s “status neutral” approach has sought to tackle HIV-related stigma and offers social marketing for PrEP, anti-stigma programmes targeting LGBTQI youth and enhanced HIV surveillance.103
This forward-looking section will highlight initiatives that can foster several gains in health, reduce intersectional inequalities, promote climate resilience and advance other SDGs in urban areas, thus avoiding the high damage or pessimistic scenarios for urban futures and instead, chart a course toward the optimistic scenario. While health-
promoting initiatives are necessarily place-specific, this section will identify an overarching vision for action towards healthy urban futures focusing on nine interrelated priorities: 1) the “health in all policies” (HiAP) approach; 2) ongoing, disaggregated data collection 3) developing holistic, place-based strategies; 4) pursuing climate and health co-benefits; 5) enhancing universal health coverage and complementary social programmes; 6) strengthening health system preparedness 7) supporting healthy diets and active lifestyles; 8) enhancing health at the workplace; and 9) promoting mental health.
Recognizing the need to promote health across all urban interventions, cities are increasingly adopting a “health in all policies” (HiAP) approach to mainstream health in decisionmaking across all sectors and levels.104
Cities are increasingly adopting a “health in all policies” (HiAP) approach to mainstream health in decision-making across all sectors and levels
HiAP is the governance mechanism seeking to add a health perspective across all policies and embed health literacy into the city planning system, land-use decisions and other relevant sectoral interventions.105 Past examples of HiAPinformed interventions include the provision of urban greenspaces in Barcelona and open street initiatives in severalLatinAmericancitiestoprovidelow-carbonandactive transport alongside health-promoting behaviour changes.106 Factors that can support HiAP uptake are stable funding, long-term political support, open communication, clear mechanisms for public engagement, established taskforces and legal obligations that compel policymakers to apply the HiAP approach.107
One way of implementing the HiAP approach is through the preparation of a health impact assessment (HIA), a tool that can facilitate intersectoral action and analyse a proposed intervention’s impacts on population health and the distribution of such effects. HIAs have been used in a range of regions including Canada, New Zealand, Thailand and across the WHO’s European Healthy Cities Network.108 HIAs are useful mechanisms to support decision-making and can be used collaboratively across stakeholders, with successful examples benefiting from local political support, HIA trainings and collaborations with academic or public health institutions. However, some HIAs may be too narrowly defined, and it may be useful to develop other strategies that can mainstream
Box 7.5: Lessons from the health in all policies approach in Richmond, US to foster health equity and climate resilience, reduce violence and discrimination, and promote social justice
The local government in Richmond adopted a comprehensive HiAP approach to reduce violence and health inequalities while supporting inclusive economic development and climate resilience. In this working-class community of 115,000 in the San Francisco Bay Area of California, many residents faced elevated levels of morbidity and mortality due to hazardous exposures from a nearby oil refinery, rampant gun violence and systemic racism.
Following mobilizations by local environmental justice advocates, officials in Richmond approved the United States’ first HiAP ordinance in 2014 focused on addressing toxic stresses and building upon three years of collaborative discussions amongst community organizations, academics, health officers and other local officials.
Subsequently, health indicators in Richmond markedly improved and an array of initiatives helped promote multiple benefits for health and social inclusion. For instance, three neighbourhood-specific action plans were developed with low-cost but health-promoting actions such as urban gardens, mobile clinics, slowing traffic and creating sports courts. Underscoring the multi-sectoral strategies needed to support well-being, the city adopted a living wage ordinance of US$15 per hour, prepared a climate action plan and pursued activities to reduce violence via mentorship with ex-offenders and employment promotion. Key lessons include 1) the importance of institutionalizing health equity goals, 2) focusing on underlying causes of poor health, 3) working collaboratively with racial/ethnic minorities, ex-offenders, and other marginalized groups, 4) supporting inclusive economic development, and 5) flexible, learning-bydoing strategies.
Source: Corburn, J., 2020; City of Richmond, 2022.
health into decision-making across all sectors.109 Richmond illustrates how an ambitious, multisectoral HiAP approach can meaningfully address multiple inequalities while promoting health and social justice (Box 7.5).
Since urban health risks are multilayered and change rapidly, policymakers require ongoing data collection with attention toemerginginequalitiesandthediversityofhealthchallenges in urban areas. Using disaggregated data to inform inclusive interventions, policymakers can develop holistic initiatives that address complex urban health inequalities and support locally rooted solutions. Disaggregated data is needed to uncover health disadvantages in cities, which may be based on factors such as age, disability, gender, occupation, race/ethnicity, migration status and/or sexuality as well as residence in marginalized neighbourhoods.
City authorities can leverage digital technology such as telemedicineplatformsanddronestogeneratedatainlocations that are inaccessible using other data collection methods. Citizen science, through which communities lead in data collection, offers a useful tool for producing localized data and fostering participation among marginalized and hard-to-reach
groups thus enhancing effectiveness of place-based health interventions. A complementary mechanism that is expanding across world regions is the urban health observatory model that collates disaggregated data to reveal and analyse health inequalities and support effective place-based interventions as well as build capacity with interdisciplinary researchers.
Rather than merely prioritizing a single disease or vulnerable group of city dwellers, policymakers will need to recognize that health outcomes are deeply rooted in social, economic, environmental and political factors across several scales.
Urban health inequities are often stubborn and pervasive, yet such concerns are not immune to change. Challenges linked to the built environment—themselves often tied to political and socioeconomic exclusion—can be tackled via placebased initiatives and complementary strategies produced in alignment with marginalized residents and local organizations.
Action on the underlying causes of differential health outcomes and tackling the pathways through which they influenceurbanhealthcansubstantiallyhelptopromotewellbeing in cities.110 Some of the very same sources of urban
risk can be transformed into opportunities for well-being. To take one example, urban form itself can “either promote or hinder healthy behaviours” via the provision (or absence) of infrastructure, healthy food options and neighbourhood connectivity amongst other factors.111
Holistic, participatory upgrading interventions can offer a potent mechanism and an inclusive process for enhancing residents’ well-being, with extensive possibilities to support healthy, equitable, and sustainable transformations.112 By improving WASH, durable housing, all-weather roads and other vital infrastructure, upgrading can significantly help to reduce the risks of disasters and communicable disease transmission, while also enhancing access to healthcare and emergency services. Furthermore, equitable upgrading partnerships with strong grassroots participation can promote the social determinants of health such as safety, social inclusion and empowerment. Prior upgrading partnerships in cities including Medellín, Ahmedabad and Nairobi indicate that upgrading can also enhance equitable governance and accountability between
Health outcomes are deeply rooted in social, economic, environmental and political factors across several scales
formerly marginalized residents, local governments and service providers.113 Achieving such gains will require multisectoral action and the development o inclusive, contextually rooted strategies that can address cities’ complex health inequalities. Holistic approaches are inevitably complex, and efforts to support the underlying determinants of health will not be rapid or easy to achieve. But placing health equity at the core of urban policy (as in HiAP and related approaches) can create unparalleled opportunities for urban transformations and unify multiple progressive agendas, thus generating far-reaching gains in social and environmental justice.
Leading researchers argue that the climate and ecological emergencies present the most urgent contemporary health challenges. As an Aga Khan University expert argues: “The greatest threat to global public health is the continued failure [to] keep the global temperature rise below 1.5°C and to restore nature.”114 In turn, there is a pressing need for sizeable investments in climate-resilient infrastructure and related health-promoting interventions, whose benefits would far exceed their costs. As the expert notes: “Better
Holistic approaches are inevitably complex, and efforts to support the underlying determinants of health will not be rapid or easy to achieve
air quality alone would realize health benefits that easily offset the global costs of emissions reductions.”115 Alongside massive gains in air quality, there are important opportunities to promote physical activity, improve the built environment and foster dietary changes that can simultaneously support urban health and climate resilience.116
There is a wide array of climate-related interventions with strong potential to improve health including via shelter initiatives, compact city planning and nature-based solutions (Chapters 5 and 6). Improving access to low-carbon, resilient infrastructure and other climate-friendly strategies can help to advance several SDGs in addition to creating major health benefits. Enhanced access to clean energy and climateresilient infrastructure (SDGs 7 and 9) can simultaneously improve health, (SDG 3), tackle poverty (SDG 1) and foster gender equality (SDG 5) by overturning the genderinequitable impacts of inadequate infrastructure.
There are also multiple health benefits from pursuing holistic strategies such as access to green spaces and active transport (i.e., improving cycling lanes, supporting pedestrianization) because such initiatives can enhance air quality, lower risks of obesity and NCDs, and improve mental health thanks to improved environmental quality and activity levels.117 Parks and other green spaces can reduce urban temperatures and floodrisks(byslowingrunoffandretainingexcesswater),while also enhancing air quality and encouraging greater physical activity.118 Entry points for interventions can range from the building and neighbourhood levels up to the district, city and regional scales. Figure 7.11 illustrates how supporting health at several interventions goes hand-in-hand with inclusive, equitable and sustainable urban development. Another model can be found in a framework called Towards Health uRbanism: InclusiVe Equitable Sustainable (THRIVES), which advances health beyond the individual to the community, ecosystem and planetary levels (Figure 7.12). It highlights the layers of interconnected benefits when health is placed at the centre of
Enhanced access to clean energy and climateresilient infrastructure (SDGs 7 and 9) can simultaneously improve health, (SDG 3), tackle poverty (SDG 1) and foster gender equality (SDG 5) by overturning the gender-inequitable impacts of inadequate infrastructure
Figure
Nature
greening
nature
Infrastructure
Urban
Housing
Knowledge perception & behavior
Monitoring, Evaluation
Source: Sharifi et al, 2021.
Maintain and
water treatment, sewage and sanitation
Integrated approach across
Mainstreaming adaptation and mitigation into local
Improve
Prioritizing equity in adaptation planningN/A
of co-benefits and actions to protect healthN/A
Support
plans to protect vulnerable groupsN/A
local monitoring of climate parametersN/AN/A
Note: Shades of green represent co-benefits, while those in orange represent trade-offs; darker colours represent the greater confidence attached to the association. Blank boxes currently have insufficient evidence.
urban planning and design to secure inclusive, equitable and
urban
7.3.5
“Leave no one behind” is the central transformative principle underpinning the SDGs and the New Urban Agenda. It represents the unequivocal global commitment by leaders to ensure that sustainable development is experienced by all. In the urban health context, consequently, there is growing consensusoftheurgencytoprovideuniversalhealthcoverage
(UHC) for the 4 billion people who currently lack such guaranteed care.119,120 Universal health coverage means that “everyone receives quality health services, when and where they need them, without incurring financial hardship.” This social policy represents a key element of resilient, inclusive societies, as it can simultaneously support social justice, equitable economic development and the realization of human rights (Box 7.6).121 Although important advances toward universal health coverage have been achieved since 2000, stubborn challenges remain in many settings.122
In the wake of COVID-19 pandemic, the value of social protection systems was demonstrated in not only supporting the most vulnerable but also reinforcing the collective health and well-being for all.

Even before COVID-19, countries struggled in expanding access to universal health coverage; there were already rising levels of catastrophic health expenditure (i.e., when households spend over 10 per cent of their budgets on health).123 From 2015–2017, households with catastrophic health expenditures rose from 940 million to 996 million. The elderly and people with intergenerational households typically have the highest incidence of catastrophic health
spending; medicines are usually a key driver of out-of-pocket spending and financial hardship.
Although strategies to expand universal health coverage will depend on local contexts, politics and financial considerations, a range of promising approaches have demonstrated how to leave no one behind including strong political commitment and the use of general tax revenue in Thailand and Mexico; making pregnant women universally eligible in Ghana; leveraging co-operative societies as intermediaries for informal workers in India; and providing subsidies to informal workers, schoolchildren, ethnic minorities and other vulnerable groups in Viet Nam.124
While universal health coverage is a key policy concern and may be achieved via several mechanisms, local initiatives and policy incentives to reach marginalized city dwellers will also be necessary. Pro-poor strategies to expand universal health coverage include:
• Reducing administrative obstacles by eliminating documentation requirements and/or enrolment fees and establishing automatic enrolment in universal health coverage as is the case in the Vajpayee Arogyashree scheme of Karnataka state (India).125
• Reducing or eliminating co-payments, such as in Thailand’s UHC schemes.
• Addressing other barriers facing marginalized groups such as migrants/refugees (Chile and Thailand), informal workers (Viet Nam) and those with less education126
To support equitable improvements in provision, it is also crucial to offer comprehensive benefit packages for both inpatient and outpatient services and to fund universal health coverage with public sources. If universal access is not financially viable at first, policymakers can pursue “progressive universalism” such as prioritizing vulnerable groups and expanding coverage of high-priority health services to all.


COVID-19 is not the first nor will it be the last pandemic that cities will face; new outbreaks of other pandemics and major health emergencies are likely to occur.127 In this reality, policymakers must reinvigorate health systems to address future shocks via an equitable, coordinated approach from the local to global levels.
The Independent Panel for Pandemic Preparedness and Response has identified several interrelated priorities such as investing in preparedness; enhancing surveillance and alert systems; and strengthening leadership and collaboration across the health sector and all levels of government, including at the highest levels. Expanding access to longterm funding streams will be essential both for preparedness and early response capacity.128
TheWHOhasfoundthatpreparednessisaffordable,129 which can help to spark cost-effective interventions to avoid future pandemics. To address emerging zoonotic diseases, there is a need for jointly tackling animal and environmental health surveillance, as proposed by the One Health Commission, with further collaborations across several sectors including transport, migration and WASH.
While global monitoring is generally the purview of national and international health agencies, adequate funding, human resources and trainings for local governments and municipal health providers in emergency response and preparedness will be crucial to support effective urban preparedness and
response.Strongcollaborationwithcommunityorganizations and community health workers can play a key role in reaching residents, engendering trust in health systems during health emergencies and disseminating communication clearly, regularly, and transparently including in local languages and tailored to grassroots needs to help tackle misinformation and support health literacy.130
Local and national governments will need to continue expanding universal health care, which must be recognized as a crucial aspect of health systems preparedness. As underscored by COVID-19, barriers to healthcare provision may have catastrophic, persisting knock-on effects during emergencies.
Alongside health-promoting policy interventions, policymakers will need to promote behaviour change and technological transformations to foster healthy, sustainable urbanization.131 Such behaviour change interventions also
Local and national governments will need to continue expanding universal health care, which must be recognized as a crucial aspect of health systems preparedness
need to recognize social, cultural and other factors that may strongly shape behaviours such as consumer preferences.
Urban diets and food systems represent critical priorities for intervention, as efforts to support healthy diets may generate a wealth of benefits for urban health, climate resilience and environmental sustainability more generally. Recent findings indicate that “unhealthy diets pose a greater risk to morbidity and mortality than does unsafe sex, and alcohol, drug, and tobacco use combined,” while food systems are already pushing beyond safe ecological boundaries.132
Based on findings from cities in the United States, expanding access to grocery stores or limiting the growth of fast-food outlets may be necessary but insufficient; there is also a need to promote demand for healthy foods. South Los Angeles instituted a yearlong ban on new fast-food restaurants, but no changes in consumption were found over five years, likely
due to longstanding norms and preferences. Complementary outreach strategies are therefore needed to support the desirability and affordability of healthy foods.133
Further health benefits may be achieved by combining dietary initiatives with holistic strategies like to access to green spaces as well as promotion of active lifestyles and active transport (i.e., improving cycling lanes, supporting pedestrianization). Such initiatives portend co-benefits that enhance air quality, lower risks of obesity and NCDs, and improve mental health thanks to better environmental quality and activity levels.134

There is vigorous discussion of the “future of work” following COVID-19 but further consideration is needed of health, climate resilience, and co-benefit interventions
with greater attention to multiple exclusions and the need to develop inclusive strategies. The pandemic’s health and economic outcomes have markedly differed amongst wealthier urban knowledge workers (who can work from home with access to food and services) and those with heightened exposures like frontline health workers, factory workers and essential service providers.135 Workers’ access to insurance, healthcare and other benefits have also proved decisive in the pandemic’s outcomes, with many precarious workers lacking social protections beyond (at best) shortterm emergency relief measures.136
COVID-19 has demonstrated that occupational health risks are often gendered and racialized, with many of these disadvantages overlapping to heighten risks and entrenching illhealthamongstracial/ethnicminorities,migrantworkersor along other intersectional axes of difference.137 Additionally, low-income women have overwhelmingly shouldered caring burdens while facing rising risks of gender-based violence and heightened job losses, as they were overrepresented in hospitality and other hard-hit sectors during COVID-19.138 Many occupational health risks predate the pandemic and are especially acute amongst informal workers in cities in lower- and middle-income countries. Globally, an estimated 2 billion people work in the informal economy,139 which is defined as all livelihoods lacking legal recognition or social protections.140 As a result of their unregistered and unrecognized status, informal workers often remain invisible in official data and are neglected by health-promoting interventions.141
Future interventions are needed to develop holistic strategies to foster health and livelihoods of precarious workers, including migrants and youth. This could also explore how recent forms of equitable engagements can be built upon to enhance health and well-being at the workplace. For instance, during the initial phases of COVID-19, some cities created inclusive partnerships and enhanced recognition for informal workers. Food vendors in Kenya, Zimbabwe and other African nations were declared “essential” service providers during the health crisis, which sometimes stemmed from mobilizations by informal trader organizations.142
Improving access to mental health programmes and developing holistic strategies to address mental illness remain a key concern globally, especially in the wake of COVID-19. Without robust action, mental health problems will “contribute to human suffering, premature mortality,
and social breakdown, and will slow down economic recovery,”143 making this field an urgent priority not only for supporting health and dignity but also for continued economic and social development.
Keyprioritiesforequitable,inclusivementalhealthinitiatives are additional investments in mental healthcare providers, ensuring that mental health is covered under universal health coverage and primary healthcare interventions, offering additional capacity-building to health providers, and providing tailored, inclusive support to help meet service users’ needs.144
There are often contextual specificities requiring locally rooted strategies to support mental health in urban areas. For instance, low-income migrants in cities may face heightened challenges in accessing mental health services. A review of Chinese rural-urban migrants’ mental health indicated that migrant children averaged poorer mental health scores than urban children, which may reflect migrants’ lower incomes, limited social networks and reduced access to services as compared to urban residents.145 A focus on children and young people, as well as creating broader coalitions and countering stigma facing those with mental illness will again be vital to ensure healthier urban futures.
More broadly, it will be essential to move beyond biomedical approaches to mental healthcare and instead seek to address the social determinants of health; interventions also need to actively engage people with mental illnesses, including to provide peer support, foster empowerment and inform future strategies.146
The optimistic scenario for urban futures envisions brave commitments to make transformative progress for achieving the SDGs in the decade of action by tackling structural inequalities and creating conditions that foster social, economic and spatial inclusion to ensure that no one is left behind. Chapter 7 proposes that health can serve as a catalyst that unifies several SDGs and generates multiple farreaching benefits beyond the absence of disease.
The multilayered, rapidly changing nature of urban health risks necessitates holistic multisectoral strategies that are complementary and additive. To be effective these strategies need to be informed and progressively refined by ongoing,
disaggregated data collection to reveal gendered as well as intersectional disparities for timely place-based interventions that will ensure no one is left behind. By mainstreaming the health in all policies approach with a focus on health equity throughout urban interventions, policymakers can help to address the underlying sources of health disadvantages and create unparalleled opportunities for inclusive, equitable and sustainable urban futures.
The facts and arguments presented in this chapter generate five key lessons for securing healthy urban futures:


Urban policymakers should undertake multi-sectoral approaches (extending far beyond the health sector) to effectively address the social, economic political and environmental factors influencing health in cities. By mainstreaming health across all urban interventions (a HiAP approach), cities can realize multiple benefits and unlock synergies between health and sustainable development pathways.


Ongoing, disaggregated data collection with attention to intersectional disparities and emerging health challenges in urban areas is essential for timely and effective interventions to address the multilayered, rapidly changing nature of urban health risks. City governments can leverage on technology and partnership with grassroot organizations to help fill data gaps while also amplifying the voice of marginalized groups in decision making.
To effectively promote and secure health for inclusive, resilient, and sustainable urban futures, policymakers urgently need to address the root of urban health inequities entrenched in racial divides, gendered discrimination, xenophobia and other sources of disadvantage. Action to address these underlying causes and tackle the pathways through which they influence health outcomes can substantially help to promote equitable well-being in cities and arrive at the optimistic scenario for urban futures.
Local and national governments need to prioritize achieving universal health coverage as a pathway of strengthening health systems preparedness. Additionally, policymakers need to work with and strengthen a diverse array of urban health providers—including community health workers—to enhance healthcare options especially for marginalized and vulnerable groups. As underscored by COVID-19, barriers to healthcare provision may have catastrophic, persistent knock-on effects during emergencies.

Responsive, accountable local authorities are pivotal in actualizing the optimistic scenario for urban futures through investing in urban services that improve the social determinants of health including fostering safety, promoting social cohesion, enhancing living conditions and creating access to decent work and address urban health inequities. To achieve this, cities need sufficient technical capacities and financial resources to develop and implement these holistic, place - based strategies.

1. WHO,2022d.
2. WHORegionalOfficefor Europe,2022.
3. Frieletal,2011.
4. Craneetal,2021;Pineo, 2020.
5. Dye,2008,p.766.
Dye,2008,p.768.
7. UNICEF,2018,p.3.
Whitehead,1992.
9. Corburnetal,2020a;United Nations,2020a;Kabeeret al,2021.
10. UN-Habitat,2021a.
11. Plowrightetal,2020.
GraceandJones,2011.
TheLancet,2019;UNAIDS, 2019.
14. ECDC,2022.
ECDC,2021.
PatzandSiri,2021;Atwoli etal,2021.
McGranahanetal,2007.
ForDaresSalaam,see Kiunsi,2013.
Gasperetal,2011.
McDonaldetal,2014.
Ebietal,2021,pp.703-4.
Romanelloetal,2021.
Romanelloetal.2021, p.16.
WHO,2021g.
Samet,2019.
WHO,2021h.
WHO,2018b.
Tainioetal,2021.
WHORegionalOfficefor Europe,2019.
Willettetal,2019,p.447.
Willettetal,2019.
GBD2019MentalDisorders Collaborators,2022.
Espondaetal,2020.
BartlettandTacoli,2021.
WangandOtis,2019.
Popkinetal,2020.
BartlettandTacoli,2021, p.5.
Tacoli,2017.
39. Williamsetal,2019.
40. Whitehead,1992.
41. RigonandCastánBroto, 2021,p.2.
42. Hoganetal,2018.
Howardetal.2019.
44. UNICEF,2018.
45. Noykhovichetal,2019.
46. Subbaramanetal,2020.
47. Willettetal,2019.
48. Earle,2016.
49. Earle,2016;Guterresand Spiegel2012.
50. Cole,2014.
51. Johnson,2017.
52. Shawet.al,2021.
53. Ezehetal,2017;Corburn andRiley 2016.
54. Dodmanetal,2019(‘A spectrumofmethodsfor aspectrumofrisk:Generating evidencetounderstandandreduce urbanriskinsubSaharanAfrica’).
55. SatterthwaiteandBartlett 2017;Vojnovicetal,2019.
56. Moser,2011.
57. Boubacaretal,2017.
58. Reckienetal,2017.
59. MohindraandSchrecker, 2013.
60. Baruah2015;Sovacool, 2011.
61. Subbaramanetal,2012.
62. Muggah,2014;Moserand McIlwaine2014.
63. WHO,2016.
64. Sommeretal,2015; CorburnandKaranja2014.
65. Chant,2013.
66. BartlettandTacoli,2021.
67. Mberuetal,2015.
68. Kolaetal,2021.
69. Kolaetal,2021.
70. WHORwanda,2020.
71. CityofKigali,2020.
72. ZhouandParmanto2019.
73. Griffithsetal,2020.
74. Buttazzonietal,2020.
75. UnitedNations,2015a.
76. Satterthwaiteetal,2019.
77. Satterthwaiteetal,2019; Beukes,2015.
78. Wahletal,2020.
79. Bhaumiketal,2020.
80. Ferozetal,2021.
81. Ludwicketal,2020.
82. UN-Habitat,2021a.
83. Bezgrebelnaetal,2021.
84. Baxteretal,2019. 85. Ewingetal,2015. 86. Matzopoulosetal,2020. 87. Sheridan,2018. 88. GNESD,2014. 89. ColladoandWang,2020. 90. Simon,2015. 91. Simon,2015,p.460. 92. CorburnandGriffin,2019. 93. Sharifietal,2021. 94. Sverdliketal,2020. 95. Rémillard-Boilardetal, 2021.
96. WHO,2022c. 97. WHO,2022a. 98. WHO,2022b. 99. Reckienetal,2017. 100. UNAIDS,2019. 101. UNAIDS,2019. 102. DeBreeetal.2019; UNAIDS,2019. 103. TheLancet,2019. 104. WHO,2015. 105. UN-HabitatandWHO2020, p38.
106. Ramírez-Rubioetal.2019, p17.
107. VanVliet-Brownetal, 2018.
108. Guglielminetal.2018. 109. VanVliet-Brownetal, 2018.
110. WHOandUN-Habitat, 2016;DiezRoux,2021.
111. Vojnovicetal,2019,p.3.
112. Hensonetal,2020;Lilford etal,2017;Corburnand Sverdlik,2017;Colladoand
Wang,2020.
113. Corburnetal,2020; Baruah,2015;Horn2021.
114. Atwolietal,2021,p.2.
115. Atwolietal,2021,p.2.
116. Sharifietal,2021.
117. Tainioetal,2021;Sharifiet al,2021.
118. Lindleyetal,2018.
119. UnitedNations,2021a
120. UN-Habitat,2021a.
121. GitahiandCashin2020, p.1613.
122. WHOandIBRD/WorldBank, 2021,pp.viiand 12-14.
123. WHOandIBRD/WorldBank, 2021,viand30.
124. Vilcuetal.2016.
125. Watsonetal,2021.
126. Anjorinetal,2021,pp.7-8.
127. Zakaria,2020.
128. IndependentPanelfor PandemicPreparedness andResponse,2021.
129. WHO,2021a.
130. Wilkinson,2020.
131. Craneetal,2021,p.6.
132. Willettetal,2019,p.447.
133. Westburyetal,2021.
134. Tainioetal,2021;Sharifiet al,2021.
135. Acuto,2020;UN-Habitat, 2021a.
136. Razavietal,2020.
137. Smithetal,2021;Kabeer etal,2021.
138. Smithetal,2021.
139. ILO,2018.
140. ChenandCarré,2020;ILO, 2018.
141. Lundetal,2016.
142. BamuandMarchiori,2020.
143. Kolaetal,2021,p.545.
144. Espondaetal,2020.
145. Zhangetal,2019.
146. Kolaetal,2021.

1. Through the lens of spatial justice, effective multi-level governance plays a key role in ensuring that global shocks like the pandemic do not disproportionately impact vulnerable groups.
2. The Covid-19 pandemic has accelerated the digitalization of urban governance, which provides an opportunity to use new data, but also threatens to increase the digital divide.
3. City diplomacy and international city networks provide an emerging opportunity for cities to contribute learning and experience and adapt governance approaches to their own context.
4. Effective decentralization, local fiscal autonomy, adequate local capacity and links between National Urban Policies and cities have not progressed enough.
5. While many cities are engaging in innovative participatory processes, globally, space for civil society is shrinking.

1. In an age of global threats and disruptions, such as pandemics, natural disasters and armed conflicts, urban governance needs to be flexible and adaptable.
2. With cities being more culturally mixed, and with bigger distance between citizens and government, building trust and legitimacy are essential, including protecting data privacy.
3. Governments need to have adequate political and institutional legitimacy, clearly defined roles and need capacity and resources that meet their responsibilities.
4. There is a need for clearer and more decentralized regulatory frameworks to enable more own-source revenue, municipal borrowing and bond-issuance and more regular government transfers.
5. Government must revision their relationship between the private sector and civil society, with special attention to underrepresented groups to co-create strategies such as re-municipalization, community-led finance and forms of co-production of urban services.
Aspiration and opportunity coexist with destitution and disaster as a defining feature of our world. With an estimated 90 per cent of all reported COVID-19 cases, cities were the epicentre of the pandemic.1 Meanwhile, cities bear the brunt of armed conflict and subsequent displacement, such as the ongoing conflicts in Ethiopia, Myanmar, Syria, Ukraine and Yemen. These crises have made explicitly clear the need for just and effective urban governance. While the pandemic caused harm beyond the ability of governments to manage, it catalysed a sense of urgency and a window of opportunity to reimagine urban governance for more just, green and healthy urban futures.
The global health emergency has reinforced that no local governmental entity, regardless of its level of development or income, can achieve sustainable and resilient urban development in isolation. Indeed, urban governance is not entirely under the purview of local institutions and actors, but also highly influenced by the frameworks and enabling environment set by national governments.2 Whether and how economic opportunities; supportive social networks; and access to land, infrastructure and services are accessible to the urban poor is largely dependent on the efficacy of urban governance and institutional arrangements. Urban governance remains central to effective crisis response and sustainable urban development.
Chapter 7 of the World Cities Report 2020 discusses the importance of public health for local governments. This chapter augments the discussion on local government by extending the frame of reference to urban governance more broadly. Through the New Urban Agenda, Member States agreed that sound urban governance is a critical tool for people-centred urban development. Such development patterns better protect the planet and are age- and genderresponsive. They also enhance the realization of all human rights and fundamental freedoms, help to end all forms of discrimination and violence, reduce social and economic inequalities, and empower individuals and communities while enabling their full and meaningful participation.3
The concept of governance recognizes that power exists inside and outside of the formal institutions of government and that decisions are influenced by the relationships and priorities of multiple actors.4 In this light, and in line with previous UN-Habitat publications, this chapter defines urban governance as the sum of the many ways in which individuals and institutions, public and private, plan and manage the common affairs of the city, metropolitan area or region.5
The chapter progresses as follows: The first section explores key lessons for urban governance from the challenges and systemic disruptions to communication, core functions and service delivery as a result of the COVID-19 pandemic. The secondsectiondiscussescrucialurbangovernanceapproaches that drive and sustain resilient urban futures. Third, through the lens of emerging urban governance challenges, the section reviews current promising governance practices that address each challenge. The fourth section presents divergent urban governance scenarios and the consequences associated with each imagined approach. Finally, the chapter presents concluding remarks and lessons for policy.
How cities responded to the recent COVID-19 pandemic and related shocks indicates flaws in the current model of urbanization. The COVID-19 pandemic provides an opportunity to reflect on how urban governance can evolve to promote a more just, green and healthy future for cities. While many of the lessons of the ongoing pandemic are covered extensively throughout this report, there are unique lessons for governance.
The pandemic exposed and amplified several long-standing urban inequalities in public health, housing and working conditions that cause disproportionate impacts on vulnerable and marginalized populations,6 who have less capacity to adhere to public health and social measures.7 Decisions made at the national or provincial level to limit the spread of COVID-19 through lockdowns and curfews left municipal leaders in the difficult position to enforce policies that were both unmanageable and detrimental to urban residents without adequate housing.
Urban governance responses to the pandemic varied around the world in their effectiveness for vulnerable populations, but included several commonly enacted pro-poor policies. City authorities promulgated rent freezes, eviction moratoria and bans on demolishing informal settlements that in many instances lasted for the duration of the health crisis. These crucial governance decisions attempted to mitigate the disproportionate impacts the pandemic had on vulnerable communities. Given both the common nature of the threat andtheneedtoactquickly,effectivegovernanceresponsesto the COVID-19 pandemic included city networking initiatives
like Cities for Global Health, in which United Cities and Local Governments (UCLG), Metropolis and UN-Habitat collaborated to set up a knowledge exchange platform for cities to share their protocols, plans and intitiaties.8 Such city networks are elaborated on in section 8.2.3.


When city authorities acted to protest vulnerable communities, they were pursuing “spatial justice,” the spatial version of social justice, which strives to realize the fair distribution of burdens and benefits of urban development across geographic spaces. This complementary idea to the more broadly known “right to the city” is a response to the inequality embedded within urban planning and the built environment globally, regionally and locally.9
Beyond the temporary measures taken at the onset of the pandemic, a spatial justice approach requires more targeted action including pro-poor decisions around zoning rules and spatial planning processes, the acquisition of land for urban redevelopment programs, affordable housing development, slum upgrading, relocation of vulnerable communities and provision of access to urban amenities and services.10
Aspatialjusticeapproachpromisesthatplanningcanfunction as a tool for the fair redistribution of burdens and benefits from urban development. Through procedural dimensions like participatory budgeting and decision-making, a spatial justice approach can also strengthen democracy and the public sphere. For cities to avoid the high damage scenario noted in Chapter 1, local governments must invest in infrastructure where new development and informal growth is occurring and address vulnerable residents’ specific needs.
The COVID-19 pandemic has demonstrated the value of high-quality individualized data for public health measures like contact tracing and for research purposes like evaluating the effectiveness of specific virus containment measures.11 While countries mobilized quickly to repurpose emerging data sources (i.e. mobile phone records) to monitor viral spread and public behaviour, they have simultaneously struggled to protect against privacy concerns and the risk of misuse.12 There are two key data governance lessons that emerged from the pandemic.
First, deficits in the quality and quantity of high-value data exist throughout cities globally and are accentuated within cities in low- and middle- income countries, which can obscure certain populations even as decision-makers push forward with crisis response and investment decisions.
A spatial justice approach promises that planning can function as a tool for the fair redistribution of burdens and benefits from urban development
However, as the World Data Report 2021 states, simply gatheringmoredataisnottheanswer,ifdataisnoteffectively linked to improve development outcomes. Global examples include the use of global spatial location from mobile phones, social media and online search data to predict and trace viral outbreaks as well as the use of online media and user-generated content to map flood events in real time for water management and food security.13
Second, access to private and public data is necessary for urban governance institutions to coordinate emergency responses that are grounded in data, geospatial mapping and real-time analysis of conditions.14 Data governance considers who makes decisions, how they are made and how the decision-makers are held accountable in the collection, use, sharing and control of urban governance data, which is often owned by various institutions. Data governance systems are needed to ensure data is available to inform policies and actions from city and territorial initiatives to national strategies and multilateral cooperationwhilecontinuingtomaintainprivacyandsecurity.15
Chapter 9 explores the various technologies available for urban governance and their associated risks while revealing the need for data governance amongst key stakeholders. Uruguay’s whole-of-government data governance approach highlights the benefits of institutionalizing governance arrangements and adopting legislation and regulations to complement infrastructure and technology investments.16 Similarly, the Netherlands created Urban Data Centres as a partnership between the country’s national statistical office and local governments in order to enable data sharing in a way that maintains data integrity and privacy for residents.17 At the international level, organizations such as the OECD and the United Nations Economic Commission for Europe (UNECE) have supported efforts by national and local governments to collect, analyse and make evidence-informed decisions for urban governance through the creation of subnational indicators for the Global Goals.18
The COVID-19 pandemic emphasized the need for effective governance to manage risk, including investments and frameworks for preparation and prevention. The Sendai Framework for Disaster Risk Reduction recognizes the need to strengthen governance in risk reduction strategies in order to improve preparedness, enhance coordination and leverage the recovery process to “Build Back Better.”19 The pandemic taught us the importance of embedding climate and public health measures into national urban policies in order to enhance the ambition and accountability of government.20 For example,
Rwanda’s 2015 National Urbanization Policy provided the basis for more balanced development in the urban-rural continuum, promoting sustainable agricultural practices, and lowering urban sprawl into protected nature zones.
Evidence from the COVID-19 pandemic suggests that preexisting institutionalized governance mechanisms have advantages over ad hoc bodies formed for emergency purposes.21 Indeed, governments that initiated preparation and prevention planning as a result of prior emergencies were better equipped to respond to COVID-19. For example, Viet Nam’s response was informed by previous encounters with SARS (2003) and avian influenza (2004 and 2010). These past experiencesledtoawhole-of-governmentandwhole-of-society approach that includes strong central coordination, mobilizing neighbourhoods and engaging multi-sectoral stakeholders in decision-making, in addition to a well-developed public health system, emergency operations centres and contact tracing systems.22 Despite the apparent benefits of models like Viet Nam, many countries did not use existing institutions and created parallel structures instead.23 A key lesson emerging from the COVID-19 pandemic for urban governance is the importance of investing in preparedness by developing the economic, social, environmental and institutional resilience to respond to a wide range of shocks, including having contingency plans for the most vulnerable groups.24
Current modes of urbanization are environmentally, socially and economically unsustainable,25 thus diminishing the inherent value of urbanization.26 Top-down and centralized forms of government, which are still prevalent, have significant limitations in their ability to address societal and governance challenges in complex urban systems. As recognizedinChapter7oftheUN-HabitatWorldCitiesReport 2020, relationships between national, subnational and local governments need to be more integrated and collaborative, with an emphasis on institutionalized yet flexible and innovative frameworks for effective implementation of the Sustainable Development Goals and the New Urban Agenda.
Emerging and existing smart technologies require similarly smart and adaptive governance. New technologies for communication, core services, data collection and resident engagement are reshaping urban governance and can be harnessed to achieve sustainable urban futures. For at least a
decade, city authorities have been integrating more open and inclusive forms of smart city technology in order to improve urban governance, decision-making and service provision. Chapter 9 discusses the breadth of new technologies used in urbangovernanceacrossallsectorslikewater,sanitation,waste management and environmental management. The focus here is narrower, specifically the pandemic-induced acceleration of the global transition toward public-facing technologies.
Undoubtedly, the impact of digital technology will be uneven across cities in low-income countries, but the availability of geospatial technologies and the resultant data will influence governance even in the most remote urban areas. Recent empirical case studies from rural districts in Bangladesh to urbanareasinZimbabweandUgandahighlighttheubiquitous impacts of new technologies.27 Emergency notifications, health-check apps, and WhatsApp-based information bots have become prominent features of government operations around the world. The most effective technologies for urban governance will emerge from locally-identified needs and within the context where it will be used. For example, after repeated challenges with externally-developed platforms, Mutare, Zimbabwe, engaged in a partnership with the Harare Institute of Technology to pilot the Local Authorities Database System. One of the components of the system was an innovative chatbot built within WhatsApp, the success of which is credited to multilevel governance (Box 8.1).
As Chapter 9 explores, COVID-19 exacerbated the digital divide by shifting employment, schooling and social life into the virtual environment. The emerging digital divide
presents an issue of governance, particularly in providing universal access and maintaining affordability. Only 47 per cent of people in developing countries and 19 per cent of people in least developed countries have internet access.28 However, the digital divide is not just a low-income country challenge, but also a disparity between affluent and poorer residents in higher-income countries. For example, the NYC Internet Master Plan states that 46 per cent of New York City households living in poverty do not have broadband at home and 18 per cent (more than 1.5 million residents) do not have home or mobile connection.29
Additionally, the digital divide also has a social component, as women are disproportionately excluded from access to digital toolsandplatforms,withmenbeing21percentmorelikelyto beonlinethanwomenglobally,increasingto51percentmore likely in least developed countries.30 The gender disparity also has an economic impact with countries missing out on an estimated US$126 million in GDP in 2020 as a result of the limitations and exclusion of women from digital access.31
Over40percentofcountriesdonotdemonstratemeaningful policy actions to close the gendered divide.32 The Alliance for Affordable Internet has developed the REACT Framework, which highlights five domains for policy development aimed at eliminating the gendered digital divide (Figure 8.1).33 “Open smart cities” is an emerging framework that guides the use of new technologies in cities and strives to ensure all actors, including urban residents, collaborate in mobilizing data and technologies to develop their communities through fair, ethical and transparent governance that balances economic development, social progress and environmental
Similar to governments around the world, the challenges of COVID-19 overwhelmed the ability of the local government in Mutare to deal with incoming service requests while maintaining physical distancing recommendations. To manage resident needs for official services, the city of Mutare developed an intelligent chatbot called Taurai Katsekaera to provide services such as bill payments, service requests, balance inquiries, waiting list applications, complaints and payment plan services. The chatbot, attached to a larger systemwide digital platform, allowed for real-time access to services without in-person visits. These visits could be leveraged to increase risk awareness among urban residents in the longer term, just like health and prevention measures could provide the foundation for better sanitation practices across cities. The implementation of the chatbot was supported by the central government, developed by a local academic institution and piloted in Mutare with the intention of scaling across Zimbabwe.
Source: Chatwin, 2022.

Protect and enhance everyone's rights onlineRights
Ensure relevant and empowering content for women is available and used.
Deliver affordable - or freeaccess to an open web

Set and measure concrete gender- equity targets
Use education to equip everyone - especially women - with the skills they need to access and use the web
responsibility. An example that reflects this framework is an initiative in India to set up free high-speed Wi-Fi hotspots in areas such as bus stops, hospitals and railway stations.34 Cities across Canada are exploring ways to address the growing digital divide through free public Wi-Fi and distribution of computer equipment to ensure that residents are able to participate fully in society.35
Effective multilevel governance is embedded within the New Urban Agenda and is instrumental to achieve the Sustainable Development Goals. For cities to attain the optimistic scenario indicated in Chapter 1, a whole-ofgovernment approach is needed, which would ensure that policymakers “get [the] political economy right to avoid piece-meal policymaking leading to both unfilled promises and unintended consequences."36 Multilevel governance describes how power is spread vertically between multiple levels of government and horizontally across quasigovernment and non-governmental organizations and actors.
Chapter 7 of the World Cities Report 2020 exam ined the global trend toward decentralization, which according to the OECD is among the most impor tant governance reforms of the past 50 years.37 Decentralization is not an end in itself, but rather a means to achieve greater political accountability and more efficient delivery of services. Multilevel governance within countries relies on a balance between decentralization and central control. It involves three interdependent dimensions: polit ical, administrative and fiscal.
Effective decentralization requires a clarification of roles based on the level of government best positioned to be effective, meaning subsidiarity must be the guiding prin ciple. COVID-19 reinforced this imperative and stresses the need for a clear identification of who does what, at which scale, and how. Without this clarification, com plexity in the distribution of responsibilities leads to com peting and overlapping competences, thus resulting in institutional wars and a lack of accountability. In several countries from Asia-Pacific such as Australia, Malaysia, Korea, Japan and the Philippines, there is a frequent overlap in responsibilities both vertically and horizontally.38 In contrast, the Council of Australian Governments, the Local Government Commission in New Zealand, the Union of Local Authorities in the Philippines and the Municipalities Unions in Turkey developed multilevel governance mecha nisms that formalize role differentiation.
Globally, multilevel governance is most effective in countries with higher degrees of decentralization that have entrenched processes for spatial planning, climate adaptation and mitigation, infrastructure and transport, and technology.39 Decentralization, in addition to being a critical factor for multilevel governance, equips local governments to respond to the needs and desires of residents within crisis situations and beyond. For example, Gauteng province in South Africa institutionalized coordination mechanisms for emergency response, which enables high levels of data collection and analysis as well as flexible approaches to emergency budgeting in order to rapidly address local vulnerabilities.40 Though local action is central to realizing the SDGs, national governmentisnotirrelevantinthedesignandimplementation oflocaltransformations.Onthecontrary,nationalgovernment action is crucial to create enabling macroeconomic policies, streamline institutional environments and effectively devolve authority to local levels for contextual implementation. Effective decentralization can only be realized if fiscal authority is reconciled with the delivery of functions expected from local governments by their national governments. The limited fiscal autonomy of local governments, dependency on central government fiscal transfers, and competition for resources between subnational governments are factors that limit effective decentralization. More detail on fiscal decentralization can be found in section 8.2.6.
Effective decentralization requires a clarification of roles based on the level of government best positioned to be effective
Multilevel governance also includes horizontal cooperation between cities and local governments along the urban-rural continuum. Urban challenges do not recognize jurisdictional boundaries and often require the pooling of resources and expertise, particularly in extended urban agglomerations.41 Further, the nonlinear and intersectional influences of trade, migration, water supplies, air quality and food security necessitate coordination between cities, regions and territories. For example, the Jing-Jin-Ji metropolitan region that encompasses Beijing, Tianjin and Hebei in China has been instrumental in addressing the region’s environmental problems, particularly air pollution.42
Evidence suggests that metropolitan areas with institutionalized frameworks are more likely to optimize their coordination, provide timely outreach to the whole population, and include rural communities in their mitigation, adaptation and recovery measures in response to shocks.43 One such approach is a multi-stakeholder engagement process that uses an inclusive and participatory approach to develop partnerships that promote a greater sense of ownership over the pursuit and realization of desired outcomes.44 Another approach is the United Nations Development Programme ART Global Initiative (Articulation of Territorial and Thematic Networks of Cooperation for Human Development), whose methodology supports the strengthening and expansion of linkages for knowledge sharing and joint strategy formulation for local and regional governments.
Plurality defines the future of metropolitan governance as it takes different forms across the world. Metropolitan
governance in Europe and the Americas often focusses on polycentric governance networks and involves less structural change. The number of metropolitan governance authorities in the OECD has increased over the past decades with over two-thirds of the metropolitan areas having an institutionalized governance body, like the Valle de Aburrá in Colombia (Box 8.2).45 By contrast, metropolitan governance in many Asian countries relies on a strong central and local government, in which vertical integration takes precedence over horizontal interactions between governments and non-state actors.46
In China, central government, rather than cities, often take the initiative for metropolitan governance as they upscale governance from individual cities to city regions.47 In several countries across Africa and Central Asia, including Azerbaijan, Kyrgyzstan, Senegal and Benin, among others, metropolitan governance is promoted in the constitution.48
Metropolitan governance can be arranged in at least four different ways (Figure 8.2).49 Of these schemes, the most common is voluntary cooperation among municipalities withoutanyregulatorypowers.50 Whilevoluntarymetropolitan associationscanbelimitedintheirabilitytoachieveconsensus on regional action due to their lack of binding authority, intermunicipal cooperation mechanisms between large central cities and surrounding suburbs create associative schemes that include the oft-forgotten needs and perspectives of smaller municipalities on the urban periphery.51
The success of these metropolitan cooperation mechanisms is largely dependent on enabling environments that include

clear fiscal and administrative structures. Establishing their political legitimacy remains one of the biggest obstacles to metropolitan governance.52 Metropolitan governance reforms are challenged by conflicting interests, competing aims, reduced planning and development responsibilities, and less fiscal and borrowing autonomy than that which is present in individual cities.53 Currently, many metropolitan structures are fiscally dependent on the participating local governments and require consensus building. A promising
example comes out of France, a country with a long tradition of institutionalized inter-municipal cooperation, in which all municipalities are part of an inter-municipal structure with an own-source tax, forming a fourth level of quasigovernment.54 Similarly, Sri Lanka has articulated an urban vision for competitive, environmentally sustainable and welllinked cities, by connecting the countries five metro regions with district and provincial capitals and towns.55
Examples: Many cities in Brazil; Ruhr, Germany; Turin and Milan, Italy; Paris, France; Greater Toronto, Canada; Los Angeles County, USA; Valle de Aburra, Columbia.
Type A: Metropolitan Council of govenments
Established through voluntary organization
Established through amalgamation of local governments or annexation of territory
Example: Municipalities in South Africa; Turkey, City States(Singapore)
Established as a separate metropoliitan local government for coordination/ selective fucntions(type A) or established by a higher level government for metropolitan area (type B)
Examples: Sao Paulo, Brazil ; Bologna,Italy;Montreal, Canada; numerus examples in the United States.
Type B: Planning & Service Delivery Authority
Examples: Canadian examples such as Greater Vancouver Regional Service District (GVRSD) and Metropolitan Transport Authority (ARTM) in Montreal . Lyon and Marseille, France; Lagos MegaCity Development Authority, Nigeria; "Developemnt agencies" in Delhi, India and Dhaka, Bangladesh.
Type A: A higher -level metropolitan local government
Type B: Regional government
Examples: Quito, Ecuador, Dar es Salaam, Tanzania; Abidjan, Cote d'Ivoire(until 2001); Barcelona, Spain; London, UK; Budapest,Hungary; Stuttgart, Germany;Toronto, Canada(1954-98); Portland, USC; Shanghai(all large Chinese cities)
Examples: Abndjan, Cote d'Ivoire (from 2001); Madrid, Spain;Manila,Philippines
The Metropolitan Area of Valle de Aburrá (AMVA) was established in 1980 and is composed of Medellín and nine other municipalities, home to 4 million people. The AMVA is governed by a metropolitan board, composed of the mayor of Medellín, the mayors of the other member municipalities, and various councilors and representatives from NGOs and the national government. The AMVA has adopted more than 150 metropolitan agreements over the last 10 years covering metropolitan public policies, territorial plans, financing mechanisms, budgets and administrative decisions in areas including transport, environment and security.
The AMVA’s main functions include integrated sustainable metropolitan development through infrastructure like public spaces, social facilities and housing as well as the management of metropolitan public transport. To enable these roles, the AMVA has adopted a development vision with medium- and long-term horizons, including a long-term development strategy entitled Metrópoli 2050: The Supercity of Medellín. Another important role of the AMVA is environmental management. For example, the AMVA recently adopted a metropolitan plan on air quality that links all stakeholders and commits them to meet goals for reducing polluting emissions. To support the processes of institutional management and regional planning, the AMVA also launched an observatory to monitor and visualize indicators on a range of strategic issues within the metropolitan area.

Source: UN-Habitat, 2020b.
The future of effective multilevel governance must be attentive to the equitable representation of women. From a survey of 127 cities (self-reporting), it emerged that only a very small percentage of municipalities have balanced participation between men and women in their local councils (Figure 8.3).56 However, in recent years, the Ibrahim Index of African Governance notes a positive trend in the political power and representation of women in Africa.57 The most progressive forms of empowerment of women often come from civil society, such as the self-help organization Kudumbashree, which has over 4 million female members and played an instrumental role in removing absolute poverty from the state of Kerala, India.58
The future of effective multilevel governance must be attentive to the equitable representation of women

 Furniture shop in Kerala, India.
© Kerstin Milhann/ UN- Habitat
Furniture shop in Kerala, India.
© Kerstin Milhann/ UN- Habitat
For cities to escape the pessimistic scenario described in Chapter 1, effective multilevel governance also needs to acknowledge and work with various forms of parallel governance in cities. Parallel governance may emerge when governments cannot provide the urban services that residents need, if the quality of those services is lacking, or if thetransactioncostsofaccesstothoseservicesistoogreat.59 The largest non-governmental development organization in the world, BRAC, fulfils many government roles traditionally associated with the government, and has become the main provider of services in small towns in Bangladesh.60
Parallel governance often emerges out of traditional governance and relies strongly on informal patron-client networks.61 In the African context, traditional leaders often play an important role in regards to land allocation in the urban periphery and are often more accessible to residents than elected politicians.62 In Old Fadama, one of the largest slums in Accra, Ghana, the local association of community leaders has assumed tasks that the government has failed to implement, such as setting rules to reduce the risks of fire or flooding.63 While violations of planning regulations that promote sustainable urbanism are often seen as a failure of implementation or a result of corruption, they often originate from conflicting sets of parallel governance.64
From driving global prosperity to achieving the Sustainable Development Goals and advancing the New Urban Agenda, local governments are integral to building a better world. This positions cities and its leaders at the forefront of sustainable development.65 Cities have nevertheless found themselves ill-prepared and lacking the political, fiscal and administrative capacities to adequately respond to pressing global challenges like rising urban poverty, massive inequalities, public health emergencies and the looming climate crisis.66 With 93 per cent of COVID-19 cases reported in cities at the end of 2020, the COVID-19 pandemic is a vivid illustration of how cities are vulnerable to external shocks.67 Without appropriate tools, cities struggle to respond to future shocks and stresses, especially in poor countries. Global partnerships can help strengthen the capacity of national and local governments, such as the lack of trained urban planners. While developed countries have 1 planner for every 1,000–3,000 people, developing countries such as Indonesia have just 1 planner for every 80,000 people. Online open access learning materials and peer-topeer learning and mentoring have emerged both nationally and internationally.
Professional associations that are interested in a rights-based approach to sustainable urban development can consider involving underrepresented groups such as youth, women and minority groups in their governance and decisionmaking. This type of effort requires a commitment of these associations on behalf of their members to be aware of and integrate global commitments into their culture and advocate for the rights of residents to be involved in urban planning and development processes.68
City diplomacy is reconfiguring international politics as cities engage in external relations on an international stage with the aim of representing themselves and their interests. Higher representation raises political visibility, facilitates policy negotiations, and increases the possibility of acquiring more resources and knowledge for policy action.69 These international cooperation opportunities expose participants to the art of the possible. They can discuss common barriers and share their experiences of how to work through or overcome them.
The rise of city diplomacy has manifested in the snowballing of local government networks, often in collaboration with civil society and international organizations. Formal networks include C40 Cities, United Cities and Local Governments, ICLEI–Local Governments for Sustainability, Metropolis–World Association of the Major Metropolises, Global Resilient CitiesNetwork,OECDChampionMayorsforInclusiveGrowth andMayorsMigrationCouncil,amongothers.70 Whilein1985 there were just 55 city networks, today there are over 200 with multiple sub-groups emerging from the parent networks as well.71 The COVID-19 pandemic pivoted the focus of many city networks to issues of health and pandemic response.72
These networks can be far-reaching with on-the-ground impact. For example, since 2011, 1 in 12 people globally have been affected by nearly 10,000 climate and sustainability initiatives that came from C40 Cities.73 The Making Cities Resilient 2030 Platform currently hosts 500 cities representing over 262 million residents.74 This platform fosters peer-to-peer learning and helps cities fill the gap in order to build their resilience in financing, capacity building or tools for developing a more robust risk management framework. The Federation of Canadian Municipalities’ international programming has helped Canadian local elected officials and staff share knowledge and build relationships with their counterparts in Asia, Africa, the Middle East, Latin America, the Caribbean and Eastern Europe.75 As Chapter 5 highlighted, addressing climate change effectively, requires building global urban partnerships.
The rise of city diplomacy has not been a straightforward processbutratherischaracterizedbyuncertaintyonthelevel of recognition and participation of local governments. The Second United Nations Conference on Human Settlements (Habitat II) held in 1996 is remembered as groundbreaking in terms of the participation of local authorities, the private sector, NGOs and other development partners in the design and implementation of the Habitat Agenda.76 Yet, in 2000, with the adoption of the Millennium Development Goals, the international community was silent on the role that local governments should play. This situation changed more in the transition to and the adoption of the Sustainable Development Goals when a wide coalition of organizations supported a so-called urban goal, which culminated in the endorsement of SDG11.77
While many dimensions of the SDGs require action at the local level, national governments adopted the 2030 Agenda for Sustainable Development. Consequently, national governments are responsible for reporting their progress toward the goals in a process known as the voluntary national review (VNR). To complement VNRs, some local governments, starting with New York City, prepare voluntary local reviews (VLR) as a global tool for cities to report on their progress towards the SDGs and the Paris Agreement.78 While some Member States’ commitment to achieve their global commitments is insufficient, the VLR process has demonstrated that cities are more than willing to lead the way. For example, in Europe, less than 10 per cent of the Member States have submitted VNRs by 2021, while the region has the highest number of VLRs.
These reviews highlight the willingness of local, regional and national governments to engage in the global agenda and can act as an entry point to strengthen institutional capabilities.79 At present, only 40 per cent of local governments co-create their VLRs with their national governments.80 Strengthening the co-creation of VLRs could therefore provide a low-hanging fruit in making progress on better coordinated action to achieve the SDGs. While the VLRs emerged out of, and are prevalent in, situations of mismatched national and local government priorities, Finland used the VLR to revitalize multilevel dialogue to inform and update their national review in line with key drivers of the New Urban Agenda. The VLR process has also demonstrated its value in developing countries, as evidenced in the city of Freetown, Sierra Leone, which used a VLR as a tool to map the synergies between local development targets and the SDGs.81 Globally, 106 subnational governments submitted VLRs by October 2021 and 230 cities are signatories on the New York City Voluntary Local Review Declaration.82
8.2.4. Co-production: integrating the experiences and resources of non-governmental institutions


Governmentsarenotsolelyresponsibleforurbandevelopment, planning and implementation.83 No local government, regardlessoftheincomeanddevelopmentlevel,canaddressall urban challenges in isolation. Accordingly, urban governance involves a plurality of public and private stakeholders, and should be cross-sectoral, including private companies, civil society, community associations, local residents and youth-led organizations. Co-production describes the idea that cities are produced through the intersection of different actors and that service delivery benefits from forms of shared ownership and joint knowledge production.84
Formalized relationships between government and civil society strengthens communities, particularly those who are underrepresented, poor or living in informal settlements. Parallelgovernancestructures,aselaboratedoninsection8.2.2, can be incorporated into the government. The Communist Party of China has advanced deeply into grassroots society and developed relations with non-governmental organizations.85 One approach emerging globally are local strategic partnerships that bring together a broad network of non-governmental organizations to define effective community-led projects with a proactive approach to improve the quality of life of individuals and communities within their jurisdiction.86 Examples include RegionalInnovationCouncilsinNorwayandMedicalInnovation Centres in the Czech Republic.
These collaborations bring together cities, universities, nongovernmental organizations and businesses to promote innovation.87 An excellent example of formalized relationships with civil society from the developing world, is the aforementionedKudumbashree,whichoperatesasafederation of self-help groups that is led by the government of Kerala.88 Kudumbashree also provides a cautionary tale in integrating non-governmental organizations, as during India’s Jawaharlal Nehru National Urban Renewal Mission, the government
burdened the NGO with responsibilities that outstripped its capabilities.89 As civil society assumes different roles – as service providers, agents for civic engagement, enforcers of social accountability and financiers through philanthropy – the

future of urban governance needs to ensure regulation better reflects the different roles civil society plays in society.90
Within national guidelines, local and territorial governments are largely responsible for creating the enabling environment for collaborative governance with adjacent jurisdictions and non-governmental actors. Indeed, one of the areas of biggest innovation in response to COVID-19 was cooperation and collaboration across key urban stakeholders including the introduction of effective measures to facilitate joint action between actors from the public sector, private sector, civil society organizations and community associations.91 For example, Madrid, Spain, challenged local start-ups to develop innovative solutions that addressed the impacts of the pandemic, find solutions to increase the connectivity of residents with special needs.92 In Kenya, a collaboration between local government and a number of international and private organizations partnered to establish the Youth-led COVID-19 Emergency Response Coalition which established hygiene stations, isolation centres and education programs in informal settlements across the country.93
Another expression of co-production is the emergence of living labs or city labs (Box 8.3), which are platforms where a plurality of stakeholders, often with conflicting opinions, co-create projects, foster innovation and build capacity through experimentation. The Baltic Urban Lab project for example experimented with a “public-private-people partnership” approach for the redevelopment of brownfield sites in participant cities.94
Theinstitutionalizationofcollaborationbetweengovernment and non-governmental actors is important for building trust, understanding and a commitment to collaboration. For instance, civil society organizations can connect with marginalized residents that do not trust local authorities. In Canada, this plays out in the relationships between urban indigenous populations and local governments. For over a decade, the city of Hamilton, Canada has provided block funding directly to indigenous-serving organizations to identify and address community needs.95
A living lab is an experimental site where “active and collaborative people can meet other interested actors and work together towards innovative solutions to public problems.”96 First established at the Massachusetts Institute of Technology, the living lab concept has been spreading globally.97 While the European Network of Living Labs only had 20 members in 2006, by 2020 it noted 474 registered living labs across Europe, as well as examples in other countries such as the Smart Safety Living Lab in the Republic of Korea or the Future Self Living Lab in Australia.98 By putting conflict front and centre and equipping participants with a “license to fail,” living labs respond to a key challenge for participatory urban development, namely that different actors can have highly conflicting viewpoints.

A particularly noteworthy living lab is De Ceuvel in Amsterdam, a once polluted site at a former shipyard that has become a “cleantech playground” where social enterprises experiment with circular economy ventures like aquaponics, solar energy, biofilters and composting toilets. The city of Amsterdam awarded four plots via tender with a mandate to clean up the site. At its pre-pandemic peak, De Ceuvel saw over 35,000 visitors annually and has received numerous design and sustainability awards99 Future tenants and volunteers participated in the construction process, which generated a sense of community.100
As Chapter 5 of this report described, co-production of urban services with the involvement of public actors and citizen groups can overcome persistent challenges. Many governments are indeed revisioning their relationship with private service providers, and are returning public service provision to municipal control, especially in urban contexts where the privatization of public goods has hindered access by low-income households.
The term “re-municipalization” captures the trend of governments reversing the privatization trend of the 1980s and taking back ownership of assets and services that had previously been outsourced.101 Re-municipalization is often associated with the water and energy sector,102 but re-municipalization extends to transportation, waste management, cleaning, housing, childcare and other broad service delivery areas.103 Such re-municipalization is often supported by labour unions, civil society organizations and community associations.104 In fact, many flagship re-municipalization efforts in France have given seats on the boards of the new public operators to residents and civil society representatives.105 Barcelona was a signatory with nine other Spanish cities in the Declaration for the Public Management of Water, which broadly states that the cities will assume the responsibility for the provision of and the protection of water as a common good.106
Re-municipalization is not mere change in ownership. Rather it is a new form of urban governance that reflects collective aspirations for social and environmental justice and the democratic management of public services.107 The Barcelona en Comú coalition, which has governed Barcelona since 2015, distilled these aspirations into a political philosophy called “municipalism,” in which cities are at the forefront
of addressing social, political and environmental challenges through concrete public-led and feminist solutions. In the latest manifestation of city-to-city diplomacy as outlined in section 8.2., Barcelona en Comú now has a network of 50 municipalist organizations from 19 countries.108
Over the last 20 years, re-municipalization has been documented in 1,600 cities in 45 countries.109 Europe is at the forefront of this movement, but examples can be found globally. Paris is a well-known example having reverted water service back to public ownership in 2010 and developing partnerships with public service providers in Morocco, Mauritania and Cambodia.110 However, challenges to re-municipalization remain; austerity measures have forced some governments to abandon plans for re-municipalization, and resistance from powerful multilateral actors make it difficult to sustain as a coherent policy movement.111 The city of Berlin provides an instructive case of the lengths that private forces will go to resist re-municipalization as private providers fought for a significant financial compensation from the government and in doing so imposed a large burden on the new public operators and residents.112
It has become more difficult for nongovernmental organizations to establish and operate freely without repression or persecution
Effective governance for better services and urban development often emerge outside of formal procedures and official administrative structures and bodies. A salient example is the support given by local and international civil society organizations that advocate for the rights of slum dwellers such as the People’s Dialogue on Human Settlements, Centre on Housing Rights and Evictions, Ghana Federation for the Urban Poor and the Shack/Slum Dwellers International.113 These organizations, in addition to bridging the gap between the state and excluded groups through participative mechanisms, can also advocate for human rights, rule of law, equal justice for all and collective action towards common goals.114
“Re-municipalization” captures the trend of governments reversing the privatization trend of the 1980s and taking back ownership of assets and services that had previously been outsourced
Unfortunately, the reality on the ground does not always reflect an environment conducive to collaboration between government and non-governmental actors. It has become moredifficultfornon-governmentalorganizationstoestablish and operate freely without repression or persecution.
The Bertelsmann Transformation Index (BTI), which traces processestowarddemocracy,hasforthefirsttimesince2004 recorded more autocratic states than democracies around the world.115 The 2021 annual assessment by Freedom House of political rights and civil liberties documented the biggest democratic deterioration since 2006, with political rights and civil liberties declining in 73 countries, representing 75 per cent of the global population.116 According to the Varieties of Democracy research group, civil society across the G20 countries has deteriorated.117 The Mo Ibrahim Report states that the African continent has been going through an erosion of civil society and the pandemic has worsened the situation.118 Indeed, 38 countries in Africa have seen their civic space deteriorate and only 15 have seen an improvement.119 The CIVICUS Monitor, which annually tracks the rights of civil society organizations in each country, highlights that only 4 per cent of the world’s population lives in countries where the rights of civil society organizations to operate freely are widely respected.120 For example in Latin America, the National Council of Cities in Brazil, a multi-sectoral and participatory platform for urban policymaking, was recently abolished.121
Cities in particular, are places where civil liberties are tested, when people voice dissent through protests or challenge government practices through other disapproving behaviour. People living in cities are more likely to translate dissatisfaction with service delivery into discontent with their government than citizens further out on the urban periphery.122
Despite unwelcoming environments, civil society organizations continue to demonstrate creative ways to participate in civic issues and advocate for the rights of vulnerable populations. In South Sudan, civil society organizations use elements of performance art and theatre to demonstrate how to hold those in power accountable.123 In Palestine, civil society organizations use theatre to encourage participation in political processes. In the Democratic Republic of the Congo, civil society organizations held an election for the leaders of a new network to demonstrate that it was possible to hold an election despite repeated delays from the government.124
Despite the challenging context for civil society highlighted in the prior section, meaningful civic participation is closely linked to achieving SDG 1 (no poverty), SDG 3 (good health and well-being), SDG 10 (reduced inequalities) and SDG 17 (partnerships for the SDGs).125 The New Urban Agenda aims to move beyond perfunctory participation and towards urban governance that identifies residents and communities as important agents of the economic and social development of cities. This transformation requires a revision of established financial mechanisms to position communities as expert actors in the urban development process.126 The upgrading of the Ga Mashie district in Accra provides a good example of how residents were enabled to take charge of the improvement of their own neighbourhood (Box 8.4). When residents contribute to urban strategies it positively affects the success of initiatives, particularly in the implementation phase.127
Many urban areas suffer from an imbalance of political power and insufficient inclusiveness and participation. Women, youth, minorities and the urban poor are often excluded from decision-making.128 Across Africa, resident participation has deteriorated significantly over the period of 2015–2019, with more than half of the countries following a negative trajectory.129 This deterioration disproportionately impacts women who already face barriers to participation. In fact, the guarantee of civil liberties to African women has continued to deteriorate substantially since 2015.130
Meaningful participation between residents and their respective local governments requires an invest ment of time and relationship development. Participa tion can be driven by a need of the local government to generate better policies or earn legitimacy for its decisions, but also as an attempt to bring social move ments into the state apparatus and reinvent participa tory structures to pursue transformative aspirations.131 However, state-initiated participation is often disre garded in crisis situations. In the future scenarios facing cities, as described in chapter 1, much of the policy making will take place in crisis situations, thus causing a conflict between those in power and the public.132 Online participation, which became popular during the COVID-19 pandemic, has strengths and drawbacks. It can widen access to residents who could not previously attend in-person gatherings, but it can also be co-opted by nondemocratic urban governance forces. In this scenario, the public is presented with alternatives that have been
Under the aegis of UN-Habitat’s Participatory Slum Upgrading Programme (PSUP), the old town of Accra has been upgraded since 2008 through community participation in three different ways. First, the community was closely involved in setting the goals for the upgrading, namely improvement of roads, sewerage networks and sanitation. Second, the community was put in charge of managing the funds for the upgrading through the Ga Mashie Development Committee. This democratically elected body manages a fund through which community groups apply for grants to implement projects in the settlements and has set up a micro-finance guarantee facility with a local bank for affordable business loans to benefit youth and women. Thirdly, an important component of its community participation is the training and capacity building of its residents. Through training and hiring, local residents are employed and gain the skills to become craftspeople. By 2019, the Ga Mashie Development Committee had more than 5,000 members and had improved public space, urban safety and flood risk for over 100,000 residents.
defined by the government and exclude proposals from citizens or nongovernmental actors, so that participation becomes tokenistic and does not meaningfully influence the decision-making process.133

Participatory planning can invite Not In My Back Yard (NIMBY) rhetoric. For example, new affordable housing developments in the United States are often challenged and impeded through participatory processes whereby existing residents register their objections to new construction.134 A key challenge for the future of urban governance is how to balance genuine residents’ concerns to protect their quality of life with necessary transformations in transportation and housing while taking into account historical socioeconomic inequalities.
These concerns highlight the need for a combination of participatory processes between those that are instituted by government and those that are catalysed by residents. Urban governance for the future of cities will need to be more communicative, transparent and participatory in order to rebuild a social contract between the state and the public that is strong enough to withstand multiple and complex challenges in the future. A promising example that has withstood the test of time and continues to evolve is participatory budgeting. By providing residents with an opportunity to peer into city budgets and deliberate over how to allocate funds, cities build social capital and public buy-in on the most basic of government functions: raising and spending revenue. Participatory budgeting originated from Brazil, but has since sparked countless iterations globally, both in the developed and developing world. For example, Boston youth have allocated $1 million of public funds annually since 2014 for capital projects on city property.135 More recently, the city of Seattle earmarked
$30 million for a participatory budgeting exercise focused on dismantling systemic racism through investments in housing, education and healthcare in minority communities that will begin in 2022.136 Both the Republic of Korea and China have mandated participatory budgeting, though there continues to be variability in specific applications of this tool.
Box 8.4: How community participation built new roads for Old AccraInterchange in Ghana © Shutterstock
As highlighted in Chapter 3, slum upgrading in partnership with informal settlement communities helps to harness their skills and lived experiences. Similarly, effective participatory upgrading is hard to achieve in isolation and is enabled by other transformations of urban governance. The participatory upgrading of Mukuru in Nairobi (see also chapter 7) provides a clear example of the enabling role of decentralization and legal frameworks. Mukuru’s participatory upgrading was enabled by decentralization introduced much prior under the 1998 Local Authorities and Transfer Fund, which redistributed 5 per cent of national tax revenues to local authorities.137 The 2015 Nairobi City County Public Participation Act and the 2016 Community and Neighbourhood Associations Engagement Act provides a clear legal framework that shifted the top-down nature of earlier participatory processes, which were initially dominated by local chiefs and leaders, to a more inclusive form of participation.138
The New Urban Agenda highlights that participatory processes should recognize the specific needs of those in vulnerable situations. Local governments are strategically positioned to facilitate the role of intermediaries or access points and act as a conduit for the marginalized and disadvantaged groups within urban settings to meaningfully participate in the decision-making that impacts their lives.139 In some situations, the most effective role for local government is to create a space for collaboration around a locally identified need and then allow for other local actors to takethelead.However,thisisnotacallfortheprivatizationof services which dramatically undermine cities’ inclusiveness and sustainability.140 In Langrug, an informal settlement in Stellenbosch, South Africa, a citywide urban poor platform and finance mechanism was created to fund projects identified and prioritized by residents. Each block within Langrug oversaw project implementation like the installation of flush toilets or the creation of play areas.141 In contexts where participation is not meaningful or invited, civil society organizations have an opportunity to demonstrate and agitate for forms of participatory, deliberative and direct democracy.142
The scale and ambition of the SDGs and the New Urban Agenda require new thinking on how urban development is financed, as addressed in chapter 4, which covers the diversification of municipal finance in detail. Insufficient budgets and fiscal uncertainty are among the biggest urban governance challenges cited globally.143 An appropriate combination of endogenous financing and intergovernmental
fiscal arrangements are prerequisites for and indicators of effective urban governance.144 The bare minimum for effective urban governance is that available budgets meet the scope of responsibilities assigned to local governments through decentralization, but ideally would also include revenue for investment in development and growth. The COVID-19 pandemic has highlighted that limited autonomy lowers local government’s ability to respond quickly in the best interest of urban residents. After suffering from pandemic-induced economic contraction, Johannesburg, South Africa, provides a promising example as the national government’s relaxation of spending restrictions allowed local decision-makers to reallocate some budget items to meet emergent and urgent needs.145
The key message in financing for sustainable urban governance is that the revenue local governments can raise through taxes will always be insufficient to keep up with the required infrastructure and service delivery needs. The municipal financing gap in Africa alone is estimated at US$25 billion per year.146 Prior to the pandemic, it was estimated that LIDCs need to increase their spending by roughly 12 per cent of GDP to achieve the SDG’s. The economic setbacks caused by the pandemic now put that number at roughly 14 per cent of GDP.147
The revenue sources for local governments generally fall into three broad categories: grants and subsidies, tax revenue, and user charges and fees. On average, tax revenue represents 32.7 per cent of local government funding (Figure 8.4). In OECD countries, fiscal decentralization over the last few decades has given subnational governments greater economic importance.148 However, in some countries, such as Uganda, Kenya and Tanzania, tax revenue accounts for less than 5 per cent of subnational revenue.149 As discussed in Chapter 8 of the World Cities Report 2020, property taxes have significant potential as they are under-utilized in many cities, primarily in low- and middle-income countries (Figure 8.4), in part because of limited human resources as well as out-of-date property registers and cadastral maps.
National governance frameworks often limit local governments in their ability to expand local revenues. According to a 2016 database, 36 per cent of city governments could not change or introduce new local taxes, and only 15 per cent of cities had the mandate to both introduce and change local taxes, with the remainder dependent on higher levels of government.150 When local taxes are subsumed by the national government, such as in China, local governments often seek their own revenue
through speculative land development to fill the gap.151 This type of incentive should be avoided and local governments should instead focus on tax collection efficiency, as well as promote transparency, accountability, participation and performance-based incentives to build autonomy.152
To supplement revenues, governments must lean into financing from the private sector, debt financing and pooled borrowing.153 Most of these mechanisms require subnational governments to achieve creditworthiness and national governments to relax rules regarding local government borrowing. Less than 20 per cent of the 500 largest cities in developing countries are deemed creditworthy and less than 20 per cent of all cities in developing countries can issue bonds to local investors.154 Even when cities do have their financial house in order, they can face obstacles from national government for political reasons. For example, the Ministry of Economy and Finance of Senegal blocked the city of Dakar from issuing its first-ever municipal bond in 2015. This move came despite a local public expenditure and financial accountability review, and after Dakar had improved its credit rating and secured a 50 per cent partial risk guarantee.155
From a 2016 survey of 127 cities (self-reporting), 87 per cent of cities had borrowed money over the last 10 years, yet only 21 per cent of these cities could borrow without legal limit set by their national government.156 Green bonds have gained traction to finance climate action, more than quadrupling between 2016 and 2021.157 In 2013, Johannesburg became the first city in the C40 Cities Climate Leadership Group to issue a green bond. However, green bonds are primarily issued by national governments and
cities in development countries are responsible for only 2 per cent of all green bonds issued since 2007.158
The consequences of a national government assessing the risk and cancelling access to municipal debt markets highlights the need for clearer and more effective regulatory frameworks.159 The risks associated with borrowing can partially be alleviated by developing funding sources and policies in parallel to developing a vision for intervention and investment.160 Multilevel governance can also lower risks, as the involvement of multiple orders of government and alignment with a national urban policy provides national governments confidence to relax rules around borrowing at the local level. In fact, smaller and secondary cities may need to pool their credit requirements or enhance their credit quality through bond banks, loan pools and guarantees to reduce risk and attract lenders.161 A simple, innovative example has emerged out of Colombia in their public ratings of municipalities’ subnational debt.162 Borrowing is prohibited for so-called “red-light municipalities” whose ratio of interest to operational savings exceeds 40 per cent and whose ratio of debt stock to current revenues exceeds 80 per cent. “Green-light municipalities” can borrow uninhibited and “yellow-light municipalities” can borrow with approval from the central government.
Local government finances are supplemented with grants and subsidies from higher levels of government, international organizations (e.g. European Union) and international aid, which combined represent on average 51 per cent of their income (Figure 8.4).163 However, only 1.3 per cent of total bilateral development assistance is provided to cities and regions. 164
In light of this low figure, new city-to-city networks are pioneering decentralized development cooperation as an innovative form of participatory cooperation that bypasses central governments.165 With an estimated 70 per cent of cities across donor and developing countries engaged in peer-to-peer exchanges, including cross-border partnerships, the enabling environment for decentralized development cooperation is growing.166 While the liminal nature of decentralized development cooperation can lower accountability and potentially exacerbate inequality, there are innovative approaches that deserve pursuit. For example, the European Committee of Regions organized a so-called “decentralized stock exchange” that pools members’ expertise and promotes access to subnational financing in developing countries through financing instruments that reduce the risk of investment.167
Despite their poor record of delivery, privatization and publicprivate-partnerships are still widely promoted as solutions for cash-strapped local governments in low-, middle- and highincome countries.168 In middle- and high- income countries, privatization has increased alongside austerity policies. In lowincome countries, privatization is promoted under the guise of development aid, forcing governments to engage in complex and costly PPPs instead of building effective public services.169 One response to these concerns is the shift towards publicprivate-people partnerships (4P), which institutionalize the involvement of people into development projects. The World Urban Forum 9 report suggests that international institutions should promote public ownership, public banks and in-house government management of essential urban public services rather than public-private partnerships, private sector financing, city benchmarking and philanthropy.170
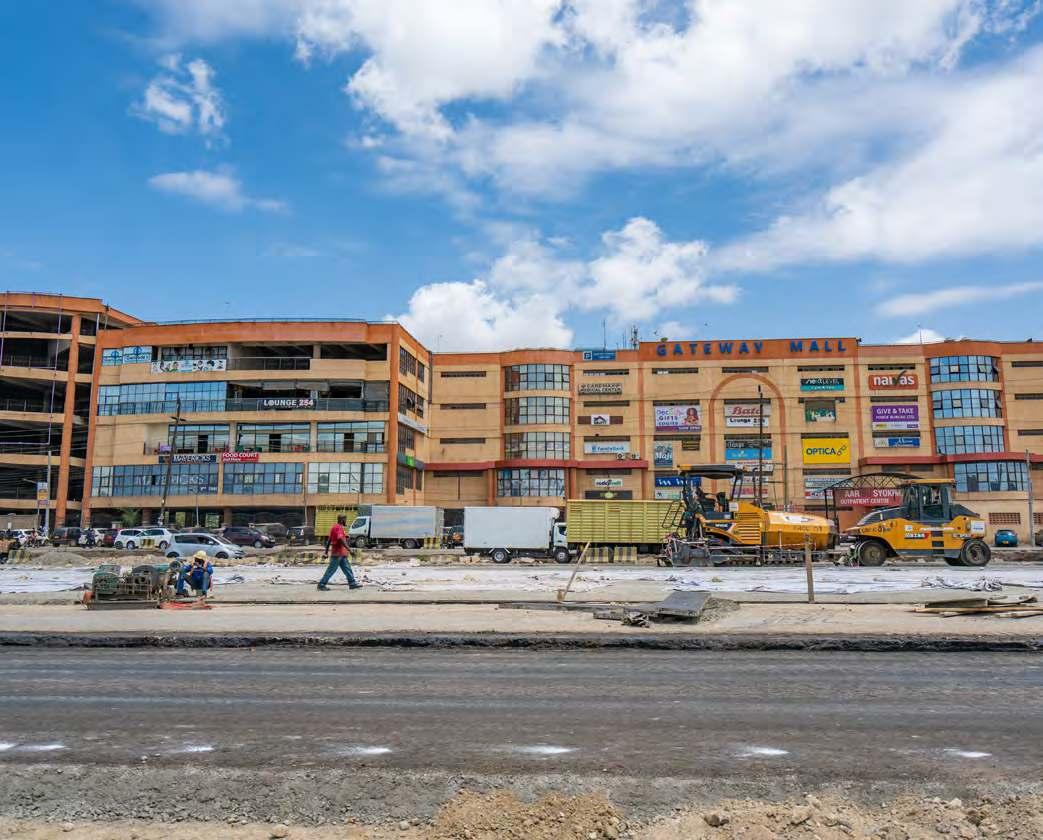
The pace and scale of global urbanization continues to outpace the ability of governments to plan and provide services for all, especially in low- and middle- income countries. Current modes of urbanization are stretching the boundaries of cities, blurring jurisdictional lines and leading to a lack of clarity about who handles emerging challenges. UN-Habitat identified four major shocks facing cities globally, namely climate change, extreme poverty and inequality, the fourth industrial revolution and COVID-19. In order to steer cities towards the optimistic scenario outlined in Chapter 1, the necessary urban governance responses to these shocks must also acknowledge the reality of unplanned growth and the blending of urban, peri-urban and rural areas.171 While the human impact of each of these shocks, individually and collectively, are discussed in other chapters, they provide a framework to explore emerging urban governance strategies to ensure local government is prepared to address them.
Urban extension has surpassed urban population growth globally and, due to that expansion, many cities have grown beyond the boundaries of their central municipality.172 Neighbouring municipalities have agglomerated into contiguous urban regions and peri-urban and rural hinterlands have become more connected. Chapter 2 highlighted the rise of these urban areas, while Chapter 6 discussed sprawl as a driving factor for this spatial extension. Bridging geographic scales is increasingly difficult when the administrative boundaries do not match the functional integration of metropolitan regions.173 In Africa, the ability of local governments to control urban sprawl is often limited by lands being under the customary ownership and authority of traditional leaders.174 Informal settlements on the edge of urban jurisdictions are vulnerable to eviction due to unclear regulatory frameworks, as was demonstrated by a recent large-scale eviction in India.175 Sustainable urban governance can only be achieved when effective regional planning systems are institutionalized, such as through metropolitan governance or through national urban policies.
The global metropolitan phenomena that impact cities of any size and territorial characteristics force us to revisit and adapt urban governance and management frameworks. New approaches based on cooperation, solidarity and collective action between local and neighbouring governments are
essential to cope with the most pressing challenges of sustainable development, namely pandemics and other health crises, climate change, the risk of armed conflict, extreme poverty, socioeconomic inequalities and rapid technological advancement, among others. To be sure, these challenges do not recognize political nor jurisdictional boundaries. Cities with integrated metropolitan governance and management systems are better prepared to plan for, prevent and respond to urban challenges. COVID-19 reinforced metropolitan governance as a necessary approach for advancing balanced and sustainable urban and territorial development.176 The territorialization of the COVID-19 response through regional planning and the use of small and secondary cities as subregional health responses to reach out to rural communities served as a key mechanism to respond to the pandemic.
One approach to improving clarity within multilevel governance for urban development is the development and implementation of a national urban policy (NUP). The World Cities Report 2020 showed that NUP’s gained prominence as important guiding instruments to promote coherent and consistent urbanization within a country’s boundaries. Both the 2030 Agenda and the New Urban Agenda advocate for the importance of NUPs. While NUPs are an important first step, the 2022 Quadrennial Report on the Implementation of the New Urban Agenda observed that an uptick in adoption of NUPs has not yet translated to impact on the ground. In much of Africa urban plans are being used to attract the private sector both locally and internationally to invest in sustainability projects that unfortunately do not substantially improve public infrastructure.177 This mismatch indicates that policy coherence through a NUP is a necessary but insufficient condition for effective multilevel governance.
There are however also promising examples. The 2015 National Urbanization Policy of Rwanda exemplifies country-level response. That NUP is further echoed in the Urbanization and Rural Settlement Sector Strategic Plan 2018-2024, which promotes better management of urban sprawl into peri-urban and rural areas.178 The plan aims to achieve that goal through improvements to transport services that connect urban and rural areas and by enhancing the opportunities presented by the increasing demand for horticultural and livestock products while mitigating the resource depletion and other environmental impacts at the edge of urban sprawl.179 Additionally, Rwanda has a national roadmap for green secondary cities that was developed and aligned with the aforementioned plans.180
ThecurrentCOVID-19pandemicisnotthefirst,norwillitbethe last, major crisis that will challenge urban governance systems. Chapter 1 discusses the rise of zoonotic diseases as new layers of health risks that the world is increasingly experiencing and will be an ongoing feature of urban governance.
A threat anywhere is a threat everywhere and no one is safe until everyone is safe.181 Indeed, the World Health Organization highlights both the moral imperative and the practical considerations in ensuring equitable urban governance towards managing current and future pandemics and health crises.182
Health equity, as highlighted in chapter 7, is an urban governance challenge that requires a multilevel approach with better collaboration between government departments and non-state actors supporting monitoring and evaluation in expenditures and service delivery. A scoping survey by the Emergency Governance Initiative, which included 57 cities in 35 countries, revealed that difficulty of working across different tiers of government was the most pressing challenge in dealing with the pandemic (Figure 8.5).183 Politicized response to the pandemic in Brazil and the United
States, led to low levels of national coordination between state level responses.184 While lockdowns were often initiated by national or state governments, it was ultimately up to local governments to enforce them.
The pervasive presence of public health emergencies globally indicates the need for accountability and transparency in public health governance to ensure health equity. However, based on recent representative research, it is estimated that around 800 million people pay bribes to health services every year.185 Corruption in the health sector is estimated to kill approximately 140,000 children annually and impedes the global fight against diseases like HIV/AIDS.186 A recent publication estimates that US$500 billion in public health spending is lost globally to corruption every year, enough to achieve universal health coverage.187
Evidence has shown that cities with a more equitable and accessible distribution of basic services were better able to protect vulnerable and high-risk communities from the beginning. Equitable and well-planned cities that address spatial inequalities and provide equitable access to basic services and infrastructure are more resilient to the shocks caused by pandemics.188 Research has noted that cities with

more autonomy in local government are better positioned to respondtohealthcarecrisiswithcontextualizedknowledgeand experiment with different approaches and service delivery.189 Forexample,Guangzhou,China,hirednearly80,000residents to conduct community patrols for containment measures and countries like Germany and Republic of Korea allowed local governments to undertake healthcare implementation.190
National urban policies are an urban governance tool that supports balanced and coherent urban development. They help bridge policy silos and can be leveraged to anticipate and respond to the implications of COVID-19 and future public health related shocks.191 They are especially important for secondarycitiesandtheiraccesstonationallevelsupportsand territorial cooperation in the face of public health challenges. For example, one key to the National Urban Development Policy 2018-30 of Costa Rica is the articulation of a network of intermediate cities to allow sharing and capitalize on best practices, learning and financing opportunities.192
Government interventions in the interest of public health can cause economic and social costs as well as impact urban residents’ routines, mental health and social security. While curfews, lockdowns and restricting where people gather have proven effective at limiting the spread of COVID-19, less costly and more trust-based approaches have only been marginally less effective. These include risk communication strategies, promoting social distancing and workplace safety measures, encouraging self-isolation when symptomatic, and travel warnings. Inclusive urban governance needs to assess the risks and costs for all urban residents of responses to health crises.
As discussed in Chapter 5, greenhouse gas emissions continue to rise globally, of which cities are responsible for over 70 per cent. While addressing global emissions will require national and supranational actions, cities are central to adaptation and mitigation efforts. The optimal level of decentralization of climate policy is context-specific with local governments facing restrictions to environmental taxes and weak capacity to deliver on climate mandates.193 The Coalition for Urban Transitions suggests that by 2050 local governments can reduce urban emissions by one-third through their own actions and another one-third through collaboration with national governments.194 In developing countries, climate policy is not a well understood area of practice to many local governments and as a result, very few stakeholders understand the importance of considering climate change in city planning.195 Further, the time horizons are not aligned with government timeframes and electoral cycles provide political cover for inaction.
Chapter 5 also discusses climate-related extreme disasters, which have increased significantly in recent years,196 while the number of globally displaced people rose above 65 million in 2017, almost twice the level from 20 years
Research

ago,197 which poses severe governance challenges. The Mayors Migration Council (MMC), a mayor-led advisory and advocacy organization on migration and displacement, has called for a range of actions in the realm of urban resilience, urban inclusion and urban transformation to address climatechange induced migration, such as the need to “modify national legislation to allow the integration of informal workers – including migrants and displaced people – into green development plans.”198
A further urban governance challenge is to (re)invent public services for the future of cities to address the challenges of meeting basic needs while adapting and mitigating climate change impacts. Co-production and re-municipalization are two governance tools to ensure that energy, water, waste and transport are simultaneously meeting the needs of the most vulnerable residents and reducing the environmental footprint of cities. In contrast to the ever-increasing prices and environmental impacts of corporate operations in the energy sector, new local public companies and co-operatives, like Hamburg Energie (Hamburg, Germany) and Kauai Island Utility Cooperative (Kauai, US) have been developing renewable energy sources in a way that lowers cost and improves service to all residents.199
Climate and environmental challenges require co-ordination beyond local, regional and national territorial scales and into supranational policy frameworks.200 A recent survey on national urban policies found unique supranational policy frameworks in distinct contexts that respond to local needs. For example, Luxembourg is engaged in a cross-border co-operation policy with France in response to the joint needs of the Alzette Belval conurbation.201 The Netherlands has had country-to-country agreements for many years focused on river management and urbanized delta areas.202 In these emerging supranational agreements, national urban policies play an important role in providing a basis to guide the priorities of the international policymaking process.203 A risk-based decision-making model favouring integration and long-term planning with appropriate local, community, national and supranational governance structures is essential for mitigating and adapting to climate change.
As highlighted in Chapter 3, extreme poverty and inequality remain pervasive urban challenges. With outdated territorial demarcations due to unplanned urban expansion, public interests are poorly represented and the urban poor are often geographically, economically and socially excluded and most vulnerabletochallenges.204 Inmanypartsoftheworld,urban governance arrangements are attuned to middle classes, while the urban poor are left behind. Land that is illegally occupied by affluent residents may be tolerated, while the urban poor are evicted from slums that have been formally
A further urban governance challenge is to (re) invent public services for the future of cities
Land that is illegally occupied by affluent residents may be tolerated, while the urban poor are evicted from slums that have been formally registered for decades
registered for decades. The term “aesthetic governmentality” refers to urban governance that manipulates the law based on standards of appearance and nuisance, rather than the rights of the urban poor.205
It is pertinent for governments to fully acknowledge and invest in slum dwellers and their organizations as true development partners. For example, Shack/Slum Dwellers International and the Asian Coalition for Housing Rights alone have over 800,000 members and operate across 698 cities in 48 countries.206 The Poverty Reduction Fund of Lao PDR recognized the importance of collaboration with slum dwellers and invested in community-led initiatives that resulted in nearly 900,000 slum dwellers with increased access to basic services.207
Non-governmentalinstitutionsincludingformalorganizations andloosemutualaidassociationshavealsocreatedinnovative forms of governance while both collaborating with and operating outside of formal government.208 Micro-finance and community savings groups play a role in closing the gaps caused by insufficient public and private investment. Many mutual aid networks stepped in during the pandemic to coordinate and distribute critical resources that address government and market failures. For example, in Thailand, over1,400foodpantriesemergedprovidingaplaceforpeople to donate food and supplies to those in need.209 Others are collaborating with the public authorities, like Mask Map in Taiwan, which is driven by government-provided mask and pharmacy data to provide real-time information on mask availability. This information by public authorities is taken by a civic hacking organization and coordinated, maintained and published for public consumption.210
While access to, and the availability of, frontier technologies are uneven in cities around the world, this is undoubtedly a global issue for urban governance to address in the pursuit

It is pertinent for governments to fully acknowledge and invest in slum dwellers and their organizations as true development partners
of sustainable and inclusive cities. Technologies create exciting possibilities to enhance the well-being of residents, improve environmental management and contribute to economic development. The positive and negative disruptive consequences of social media and other big tech platforms, artificial intelligence, the internet of things, big data and blockchain will play out in urban areas and influence city management and service delivery.
Governments, especially in low- and middle-income country contexts, cannot be passive recipients of technological innovation. National leaders recognize that intersectoral city planning requires good statistical and geospatial data, which is not currently accessible to local governments. The normative advantages to technology too often lead to technological solutionism, or finding a problem for an externally devised solution.211 Technological solutionism is also connected to the fantasy of the smart city as a magical solution to all urban problems, which ends up making the governance of core urban problems even more opaque.212 Given that regulating technology is often outside of the jurisdiction of local governments, this challenge reiterates the need for multilevel governance.
In addition to governing through the use of technologies as discussed in Chapter 9, the potential abuse of technology will create challenges. Globally there are already examples of exploitation of big data and usage beyond its original and agreed upon scope, increasing privacy and security concerns.213 The absence of public oversight and accountability on the extensive data records of individuals and communities raises concerns around privacy,
surveillance, data sovereignty and individual autonomy. Human rights obligations apply online as they do offline. Using principles like those found in the Open Smart Cities Guide, the result of a year long collaborative research project in Canada, ensures that emerging technologies are governed in a way that is ethical, collaborative, accountable and transparent regardless of the urban stakeholders that own the initiative.214 The OECD highlights the need for re-regulation over deregulation in the era of emerging technologies.215
Long-term prospects as outlined in Chapter 2 point to a world that will continue to urbanize, with urban areas expected to absorbvirtuallyallfuturepopulationgrowthglobally.Arecent report defines transformative change in urban governance as “lasting change that enhances access to urban services and opportunities while improving institutional practices and outcomes across multiple urban sectors and enduring across political administrations.”216 These scenarios introduce potential urban futures based on current urban governance trends that have the potential for increasing resilience and sustainability in line with the optimistic scenario of Chapter 1 or causing dire consequences that would lead to the high damage scenario of Chapter 1.
Smart city technology promises to generate economic, social and environmental value through a connection of urban services and infrastructure by emerging and existing technologies. While the possibility of realizing this value exists, there is limited evidence that smart technologies are enhancing social well-being, building just and equitable communities and reducing environmental degradation.217 Technology in and of itself is neutral, but its development and application is full of human bias. For example, facial recognition algorithms have been demonstrated to have racial bias that is already causing problems in its application.218 Chapter 9 highlights an important distinction for the governance of smart cities, namely the development of new infrastructure versus the improvement of existing infrastructure. This debate is the macro-level expression of the linear production model (“take-make-dispose”) versus a closed production cycle emphasizing repair, recover, reuse and recycle.219 Already, there is a global annual deficit of infrastructure investment worth US$3.3 trillion.220
An emerging question is how does “smart” technology investment contribute to sustainable development rather than take away from it? Creating completely new “smart cities” instead of investing in the upgrading of infrastructure in existing cities drains the capacity of local government and competes with resources from the rest of the city.221 For example, Konza Techno City outside of Nairobi and Hope City in the Greater Accra Region take away from investment in existing urban areas.222 Critically, smart cities are often developed through the parallel governance of newly established corporations and often lack accountability to the public the way an elected government is.223 So, what does the future of technology in urban governance look like in the future? Are technology and democracy locked in conflict? There are two predominant scenarios for the future application of technology in urban governance.
First,private-sectorledgrowththatprioritizesnewtechnology leads to increased investment directed away from core services and increased risk of privacy consequences. Chapter 6 of the World Cities Report 2020 indicated that the global demand for smart cities was growing rapidly, reaching US$1 trillion in 2019 and an estimated US$3.48 trillion by 2026. There is also the tendency for the design of online services and infrastructure to be guided by the technologies available rather than resident needs.224 The deification of technology occupies mainstream policy and has resulted in a close union between governments and private technology companies that are driven by entrepreneurialism and profit-seeking public-private partnerships.225 As discussed in Section 8.3.5, combatting this tendency will require a combination of new regulations and adapting existing regulations to ensure that corporate players do not have inappropriate access to data and unfair advantages in the competition to supply the public sector with technology. 226
The second and more preferable scenario is that of smart, sustainable cities that facilitate healthier and more inclusive cities. The application of ICT in cities requires care to avoid empowering corporate interests and further exclude those already marginalized by prevailing technocratic and entrepreneurial approaches to urban governance.227 Technology development and use that is fit for purpose, inclusive,transparentandaccountablecanleadtosustainable and resilient urban futures, but it is a process that will take time and it will not be as flashy as corporate-led investments. For example, a more inclusive approach to smart city governance may lie in the development of “digital twins” of existing cities, or virtual models that allow for real-time urban management.228
Centralization or decentralization, which one has proven to be more effective during the COVID-19 pandemic and what approach will countries take to build sustainability and resilience against future shocks? Two divergent scenarios may unfold: one with accelerated decentralization to city-led urban governance and one of recentralization to national or centralized metropolitan governments.
Decentralizationhaslongbeenupheldasatrendthatenhances democracy as well as ushers in greater accountability, proximity and civic participation. A decentralized approach means there is no single point of failure as is the case in centralized governance.229 This holds true from a public health and an economic perspective as local governments are well-positioned to support entrepreneurs and business in mitigating the economic consequences of global shocks.230 In their manifesto, Fearless Cities, the Global Municipalist Movement argues that decentralization has not gone far enough.231 In re-establishing closer connections between residents and governments, decentralizing governance to the city level may not be enough, as some large metropolitan governments, such as Chongqing, China, and Tokyo, Japan, have populations larger than most countries. The United Nations University suggests that beyond public health, decentralization is imperative for migrants as the negative impact on global GDP will cause more people to move in search of safety and opportunity.232 Research demonstrates that the overall effectiveness of local government has a direct impact on anti-immigrant sentiment and well-managed services contribute to positive intergroup relations.233
While decentralization has been described as a “revolution” in governance and a priority for global institutions and literature for the past three decades, the results have been unequal. A pervasive argument against decentralization is that some of the worst examples of corruption are found at the local level where politicians and administrators enjoy minimal oversight.234 Oversight by higher levels or different spheres of government can provide accountability in the planning process, but the line between oversight and corrupt interference is slippery.235 The technical staff within a government responsible for planning and the daily management of services risk being ousted by local political elites when their interests do not align.
The impact of decentralization to enhance economic growth has been questioned since the early 2000s.236 Later, the 2008 global financial crisis tested countries’ commitment to
decentralization with some explicit recentralization reforms, primarily as a result of austerity policies.237 Hungary is a frequently used example in its recentralization efforts between 2011 and 2012, with the central government rewriting the Local Government Act and retaking control of many functions previously exercised by subnational governments.238 While recentralization is largely considered a regression for urban governance, there are suggestions that the enhanced control of national government has boosted bargaining power of subnational jurisdictions as well as increased their ability to influence national policymaking.


Crises test people’s trust in their governments and institutions, especially as they persist without a clear end in sight causing social and economic impacts to deepen and individual freedoms are restricted. Indeed, the COVID-19 pandemic has demonstrated that trust in urban governance institutions is crucial for the success of the responses against impending threats. This section poses two divergent scenarios: one of a future with trust in public institutions and one with a continued erosion of that trust.
Political stability and attempts to mitigate crisis are undermined when residents encounter corruption and lose faith in their government’s ability to provide basic services.239 Even prior to the current pandemic, there was a lack of trust globally in most urban governance institutions, including business leaders, civil society organizations and the media.240 Violations of land and housing rights put a major strain on building trust. Despite calls by the international community to halt displacements,241 evictions continued throughout the COVID-19 pandemic. The Housing and Land Rights Network documented the forced eviction of close to 10 million people between January and October 2020 alone.242 As long as such practices continue, trust between residents and government will not be regained. Citizens that live further out in the urban-rural periphery tend to trust their governments more and are more likely to evaluate both local and national officials positively.243 When trust in municipal urban governance is lost, residents can turn to parallel forms of governance (section 8.2.2).244
8.4.2. Can decentralization survive global pandemics and climate change?
Despite calls by the international community to halt displacements, evictions continued throughout the COVID-19 pandemic
Evidence of corruption or a mishandling in the interest of a select few can undermine the ability to effectively respond to crisis situations and deepens the social and economic impact.245 Further, even the perception of corruption has a negative impact on trust in, or the perceived legitimacy of, governance institutions.246 A survey indicated that over 60 per cent of responding city governments in Africa and Latin America and the Caribbean, considered “lack of trust in local government” and “risks of corruption” relevant to highly relevant as an urban governance challenge247. According to a recent study, nearly half of South African and almost three-quarters of Zambian urban planners surveyed are faced with pressure to ignore or violate planning rules, policies or procedures.248
According to Wellcome Global Monitor 2020, trust in public institutions is highly variable around the world and does not neatly align to income categories (Figure 8.6).249 Improving trust is not dependent on increased economic performance and trustworthy institutions can be built regardless of the countries income level. A recent survey of local governments

across 35 countries on all continents indicated that many governments have been focusing on finding new ways to assure residents that they can be relied upon in times of crisis.250 One recent pathway for governments to rebuild trust is the Open Government Partnership Local initiative,251 which assists governments in their efforts to turn to open government principles, expand and facilitate access to public information, increase transparency and accountability of decision-makers and introduce co-creation into public policies with the ultimate goal of creating or rebuilding trust in the public sector. 252
Building trust also means building capacity of local planning offices. When there are few qualified planners and public pay is low and irregular, there is increased risk of planners working on private commissions alongside their public responsibility.253 The integration of mechanisms to ensure transparency and the protection of the common good are importantwithinsituationsofcrisistoensurethatemergency measures are accountable and proportional. Other means for building trust are reflected in the Open Contracting
Figure 8.6. Share of people who trust their national governmentSource: Wellcome Trust,
Partnership254 or to commitments made around data and information transparency like the Open Data Charter.255


The disruptive nature of COVID-19 is a stark reminder that urban governance needs to be prepared for a dynamic and unpredictable future. The fluid nature of the pandemic exposed existing resource and capacity deficits in cities alongside their vulnerability to public health and climate change shocks. The disproportionate impact that systemic disruptions have on people with multiple deprivations highlights the need for a spatial justice lens to be applied to future urban planning and service design to ensure that benefits and vulnerabilities are distributed proportionately across distinct geographies and income levels. Globally, urban governance must become better prepared to predict, prevent, detect, assess and effectively respond to public health and climate change shocks in a highly coordinated, yet localized manner. National urban policies and effective legal frameworks have demonstrated effectiveness in both aligning urban development priorities within member states, but also lending structure to international agreements to combat the challenges like climate change that do not respect jurisdictional authority. No single government or multilateral agency can address such threats alone.
There is evidence that systems and structures built in response to previous pandemics and weather-related disasters were effective in mitigating the impacts of COVID19. Many of these systems and structures rely on data and digital technologies to increase the ability of governments to make real-time, evidence-based decisions. It is imperative that international support and national urban plans centre the creation, use and reuse of data and the creation of data governance frameworks so that urban governance organizations build their capacity across the data lifecycle.
The battle for sustainable development will be won or lost in cities. While urban governance is a multilevel, cross-sectoral and integrated project, a country’s level of decentralization, especially fiscal autonomy, will affect local government’s ability to effectively facilitate the required collaboration and cooperation. There is an emerging consensus in the benefit and necessity of public-public cooperation whereby decisionmaking for urban development is stewarded by the level

of government and their networks closest to the people. In some cases, that means the development priorities are community-led and community financed with a hands-off approach by government. Globally, cities are learning from, and in some cases being funded by, international networks and cooperation. These networks, in addition to providing knowledge exchange opportunities, are also providing smaller cities with a platform to have their perspectives heard and advocated for.
Collaboration across levels of government, private sector, civil society, academia and other stakeholders is surely to be part of the new norm and must be initiated to bridge the capacity constraints of each stakeholder group to respond individually to urban challenges. This type of collaboration will require recognition that values the strengths individual institutions bring to the collaboration. It will also require local governments to rethink the relationship between state actors and non-governmental actors, including residents. As global shocks and uncertainty arises, the need for legitimacy and trust in institutions is crucial. Rebuilding trust requires a commitment from all urban governance organizations to effective and open communication, meaningful participation opportunities that centre systemically excluded populations, andaccountabilitystructuresbuiltintointegratedgovernance relationships. There is a need to both institutionalize resilience planning strategies and create space for urban governance models to adapt and be flexible in how they allocate resources.
1. UN-Habitat,2020f
2. Avis,2016.
3. SeeNUAparagraphs11-13ofthe NewUrbanAgendafordetailsof thisvision.
4. UnitedNations,2014.
5. UN-Habitat,2020k.
6. WHO,2021c,p.13.
7. WHO,2021c,p.iv.
8. CitiesforGlobalHealth,2022.
9. UNESCOandUN-Habitat,2009.
10. UNESCOandUN-Habitat,2009.
11. EmergencyGovernanceInitiative, 2020.
12. WorldBank,2021c.
13. WorldBank,2021c.
14. OpenNorth,2021.
15. UN-Habitat,2021a.
WorldBank,2021c,p.266.
17. CentraalBureauvanStatistiek,2022.
OECD,2019a.
19. UnitedNations,2015.
20. OECD,UN-HabitatandUNOPS,2021, p.45.
21. OECD,2020e.
Haetal,2021.
23. UN-Habitat,2021a.
Puttkamer,2020.
UN-Habitat,2016a.
UN-Habitat,2020a.
Chatwin,2022.
28. WorldEconomicForum,2020a.
NYCMayorsOfficeoftheChief TechnologyOfficer,2020,pp.i-ii.
AllianceforAffordableInternet,2021.
AllianceforAffordableInternet,2021.
AllianceforAffordableInternet,2021.
AllianceforAffordableInternet,2021.
UN-Habitat,2021a,p.76.
OpenNorth,2022.
OECD,2018b,p.131.
OECD,2019d.
OECDandUCLG,2019.
OECDandUCLG,2019.
EmergencyGovernanceInitiative, 2020.
UN-Habitat,2021d,p.14.
Cui,2020.
UN-Habitat,2020h.
UN-Habitat,2021d,p.14.
OECDandUCLG,2019.
HarrisonandGu,2021.
OECDandUCLG,2019.
GIZandUN-Habitat,2015
Ahrendetal,2014.
UN-Habitat,2021d.
UnitedNations,2020b.
UN-Habitat,2018a.
BerggruenInstitute,2021.
Amiri2021.
Kosovacetal,2020;Acuto,2016.
BoyceandKatz,2021.
Acuto,2016.
UNDRR,2022.
FederationofCanadianMunicipalities,2022.
76. IISD,1996.
77. UN-Habitat,2016c.
78. CityofNewYorkandUN-Habitat, 2021,p.13.
79. OECD,2021b.
80. Bilskyetal,2021.
81. CityofNewYorkandUN-Habitat, 2021,p.23.
82. CityofNewYorkandUN-Habitat, 2021.
83. EmergencyGovernanceInitiative, 2020.
84. MitlinandBartlett,2018.
85. WuandZhang,2021.
86. UN-Habitat,2021d,p.16.
87. Evansetal,2021.
88. Williamsetal,2011.
89. Williamsetal,2019.
90. Anheier,LangandToepler,2019.
91. EmergencyGovernanceInitiative, 2020.
92. OECD,2020e,p.34.
93. UN-HabitatYouth,2020.
94. OliveiraeCosta,Aaltonenand Rusanen,2018.
95. CityofHamilton,2019.
96. ManziniandStaszowksi,2013.
97. Hillgren,2013.
98. EuropeanNetworkofLivingLabs, 2020.
99. DeCeuvel,2022.
100. SteenandvanBueren,2017.
101. Demuthetal,2021.
102. PetitjeanandKishimoto,2017,p.159.
103. KishimotoandPetitjean,2017.
104. Beveridgeetal,2014.
105. PetitjeanandKishimoto,2017.
106. CitiesforPublicWater,2016.
107. Cliftonetal,2021;McDonald,2018.
108. BarcelonaEnComú,2019.
109. KishimotoandPetitjean,2017.
110. McDonald,2018,p.52;Petitjean, 2017,p.67.
111. McDonald,2018,p.48.
112. PetitjeanandKishimoto,2017,p.169.
113. Obeng-Odoom,2016.
114. UN-Habitat,2021d.
115. HartmannandThiery,2022.
116. FreedomHouse,2022.
117. Anheieretal,2019.
118. MoIbrahimFoundation,2020.
119. MoIbrahimFoundation,2020.
120. CIVICUS,2018.
121. UN-Habitat,2022a.
122. Brinkerhoffetal,2018.
123. CIVICUS,2018,p.30.
124. CIVICUS,2018,p.30.
SwapanandKhan,2021.
AmmannandForster,2018,p.62.
StaceyandLund,2016.
Sundaresan,2019.
Biggeri,2021.
UCLG,2021.
125. GlassandNewig,2019.
126. Shand,2017,p.2.
127. UN-Habitat,2021h.
128. UN-Habitat,2016a.
129. MoIbrahimFoundation,2020.
130. MoIbrahimFoundation,2020.
131. Blancoetal,2020.
132. MeyerandAuriacombe,2019.
133. Schlaufer,2021.
134. McNeeandPojani,2021.
135. Augsbergeretal,2016.
136. CityofSeattle,2021.
137. RoseandOmolo,2013.
138. Hornetal,2021.
139. Lee,2013.
140. UN-Habitat,2018d,p.99.
141. Hambleton,2015.
142. CIVICUS,2018.
143. LSECities,UN-Habitat,UnitedCities andLocalGovernments,2016. 144. OECDandUCLG,2019. 145. UN-Habitat,2021a.
146. OECD,2019c,p.5.
147. Sachsetal,2021.
148. OECD,2019d.
149. OECDandUCLG,2019.
150. LSECitiesetal,2016. 151. WuandZhang,2021. 152. UNCDF,2020.
153. Mutukuetal,2019,p.293.
154. InternationalBankforReconstruction andDevelopmentandTheWorld Bank,2019.
155. Gorelick,2018. 156. LSECitiesetal,2016.
157. ClimateBondsInitiative,2021.
158. Oliver,2016,p.3.
159. Martinez-VazquezandVulovic,2017. 160. Gorelick,2018.
161. GlobalPlatformforSustainableCities andWorldBank,2018,p.35.
162. GlobalPlatformforSustainableCities andWorldBank,2018,p.37.
163. OECDandUCLG,2019,p.73.
164. OECD,2019b.
165. UnitedNationsUniversity,2020.
166. UCLG,2016,p.23.
167. OECD,2019b.
168. PetitjeanandKishimoto,2017.
169. PetitjeanandKishimoto,2017.
170. UN-Habitat,2018d,p.100.
171. UN-Habitat,2021a.
172. UN-Habitat,2016c.
173. Cruzetal,2019.
174. AmmannandForster,2018,p.65.
175. Rajagopaletal,2021.
176. ForeroandSietchiping,2022.
177. Obeng-Odoom,2016.
178. OECD,UN-HabitatandUNOPS,2021, p.46.
179. OECD,UN-HabitatandUNOPS,2021, p.46.
180. OECD,UN-HabitatandUNOPS,2021, p.155.
181. GhebreyesusandvonderLeyen, 2020.
182. WHO,2021c,p.v.
183. EmergencyGovernanceInitiative, 2020.
184. EmergencyGovernanceInitiative, 2021b.
185. Bruckner,2019,p.9.
186. Bruckner,2019.
187. Bruckner,2019,p1.
188. UN-Habitat,2021a.
189. WangandRodríguez-Pose,2021.
190. Collieretal,2020;Wangand Rodriguez-Pose,2021.
191. OECDb,2021.
192. OECDb,2021,p.118.
193. WorldBank,2010,p.335.
194. CoalitionforUrbanTransitions,2019.
195. Lassa,2019.
196. IPCC,2018.
197. Bentonetal,2021.
198. MayorsMigrationCouncil,2021.
199. Demuthetal,2021,p.161.
200. OECD,UN-HabitatandUNOPS,2021, p.43.
201. OECD,UN-HabitatandUNOPS,2021, p.43.
202. OECD,UN-HabitatandUNOPS,2021, p.43.
203. OECD,UN-HabitatandUNOPS,2021, p.44.
204. Avis,2016.
205. Ghertner,2010.
206. ShandandColenbrander,2018.
207. ShandandColenbrander,2018.
208. McGuirketal,2020.
209. EmergencyGovernanceInitiative, 2021b.
210. McGuirketal,2020.
211. OpenNorth,2022.
212. Forfurtherdiscussion,seesection 8.4.1
213. UNHabitat,2021a. 214. OpenNorth,2022. 215. OECD,2020e. 216. Mahendraetal,2021,p.18. 217. Cavadaetal,2016. 218. Salem,2021.
219. StartUsInsights,2021.
220. McKinseyGlobalInstitute,2016. 221. Prasadetal,2021.
222. NoorloosandKloosterboer,2018. 223. Prasadetal,2021.
224. Gabrys,2014.
225. Evansetal,2019. 226. OECD,2020f. 227. Hollands,2015. 228. Dengetal,2021. 229. RosselloandDewitte,2020. 230. Naude,2020. 231. BarcelonaEnComú,2019. 232. UnitedNationsUniversity,2020. 233. ZillerandGoodman,2020. 234. CIVICUS,2018.
235. Alexanderetal,2022.
236. Rodriguez-PoseandBwire,2004. 237. Allain-Dupre,2017.
238. OECD,2020e. 239. Stephenson,2015; 240. CIVICUS,2018.
241. UnitedNationsHighCommissioner forHumanRights,2020. 242. Abdelkaderetal,2020. 243. Brinkerhoffetal,2018. 244. SwapanandKhan,2021. 245. IMF,2021.
246. WorldBank,2010,p.3.
247. LSECitiesetal,2016.
248. Alexanderetal,2022.
249. WellcomeTrust,2021.
250. EmergencyGovernmentInitiative, 2020.
251. OpenGovernmentPartnership,2022. 252. OpenGovernmentPartnership,2020. 253. Alexanderetal,2022.
254. OpenContractingPartnership,2022. 255. OpenDataCharter,2022.

1. Innovation and technology play an increasingly central role in planning for sustainable urban futures.
2. Digitalization and automation are rapidly transforming urban economies.
3. The urgency to decarbonize urban economies is driving the convergence of green and smart technologies.

4. The demand for smart city systems and solutions is estimated to increase annually by 25 per cent, with an overall market value of approximately US$517 billion.
5. Technological advances risk exacerbating existing, and generating new, socioeconomic inequalities.
1. The deployment of innovation and technology should be tailored to suit the diversity of the urban context.
2. Cities need to consider the negative environmental externalities when investing in lowcarbon, digital and connected technologies.
3. Urban economies need to be adequately prepared for the effects of advancing automation and digitalization.
4. To avoid top-down, one-way communication, the deployment of digital tools to address urban challenges needs to be inclusive, collaborative and empowering.
Since the World Cities Report 2020, two major areas of sociotechnical development have continued to accelerate and taken an even more prominent stage in planning for urban futures. The first area is the growing urgency for “unprecedented, aggressive decarbonization.”1 One proposed solution in the fight against global climate change is a series of green technological innovations that harness renewable energy sources, reduce energy consumption and protect other environmental assets. These innovations are key to creating sustainable cities and, as such, will not only significantly reshape urban infrastructure—buildings, transport systems, energy grids, etc.—but also exercise significant influence on urban daily life. The second technological development relates to unparalleled advancements in the digital world. Digitalization encompasses various smart technological innovations that enable ubiquitous computing, big data collection from widespread deployment of sensors and devices, large-scale data analytics, machine learning and autonomous decision-making.Theseconnectedanddigitaltechnologiesfind expression in the “smart city,” which is now a major paradigm ofurbanpolicyand,increasingly,everydayreality.Eachofthese technological fields is significant on its own but, crucially, it is the confluence of the two that at present creates unique technological momentum with fundamental implications for the way in which future cities are governed and planned.
Cities are not mere bystanders in these technological transformations, but rather are both the setting for and protagonists in how these processes are played out. For one thing, it is predominantly in urban areas that environmental and smart technological innovations will be applied, with city governments and other urban actors expected to implement large-scale infrastructure renewals and building retrofit programmes. For another, the likely disruptive effects of technological innovation, such as rising precarious work and social inequalities, may be particularly pronounced in urban areas and, consequently, require careful assessment and context-specific intervention. Moreover, cities are not only implementorsofnewtechnology,butalsodriversofinnovation: they play an important role in facilitating collaborations among universities, start-up companies, technology firms, social enterpriss,andcommunitygroups.Theyevenactasinnovators themselves, for example as commissioners of utility services, building owners and land developers.
A key focus of this chapter, therefore, is on the opportunities and responsibilities that cities have in steering and managing thesemajorsocio-technicaldevelopmentstoprepareforurban futures. This stewardship requires as much attention to social, cultural and institutional factors as it does to technology itself.
Consequently, it also requires careful consideration of local conditions and contexts, since the impacts of technological innovations will be felt differently across towns and cities. Throughout, the guiding question should be how to achieve inclusive urban development in the interest of citizens’ wellbeing and environmental protection.
In exploring the role of cities as places of innovation, Section 2 highlights the necessary interplay between technological, social and organizational innovation, and sets out four challenges for innovation in the name of the smart city. Section 3 provides an overview of emergent frontier technologies centring upon the convergence of green and smart technology, and how these may be variously adapted to local contexts. Section 4 takes a closer look at how the combined forces of digitalization and automation are transforming the world of work and how this will likely affect cities. Section 5 examines how cities can respond to both the digital divide and environmental divide arising from technological innovations, which risk creating new, as well as exacerbating existing, urban inequalities. Section 6 turns to the opportunities of connected and digital technologies to enhance participatory governance through more open e-government, civic engagement and community technology making. Section 7 draws attention to the benefits of responsible innovation as a tool for assessing both opportunities and risks of technology. Finally, Section 8 concludes with seven policy lessons for inclusive sociotechnical innovations for urban futures.
Theroleofcitiesasplacesofinnovationarisesfromtwokeyurban characteristics. The first relates to the concentration of people and organizations in dense space which creates the conditions for dynamic resource sharing, networking and collaboration. This agglomeration effect has been shown to be critical for enabling and driving innovation (Chapter 4).2 Consequently, cities play an important role as hosts in providing an enabling environmentforinnovation.Thesecondcharacteristicrelatesto cities’ own role as innovators. This is most obvious in relation to the development and improvement of physical infrastructures,

Cities are not mere bystanders in these technological transformations, but rather are both the setting for and protagonists in how these processes are played out
including buildings, energy, transport, water, waste, and green andpublicspace.Itisalsoincreasinglyevidentinrelationtosoft infrastructure,wheredigitaltechnologicalsystemsarekeytothe delivery of various public services. Urban innovation, however, goes beyond the technological, encompassing essential social and institutional aspects. Furthermore, it requires a contextspecific, localized approach.
The thriving cities of the future will likely be ones that recognize and harness opportunities to act as platforms for innovation. Consequently, they will facilitate locally grounded innovation ecosystems by supporting the co-location of research organizations, start-up companies, investors, industries, and business and social enterprises. A 2018 survey showed that committed leadership and dedicated staff support are important enabling factors (Figure 9.1). They will use various instruments, including grants, subsidies, competitions and regulations, to incentivize and steer innovation towards sustainable urban development practices. They may establish innovation districts, living labs or other neighbourhood-scale amenities to provide an enabling environment for creative thinking, design, development and, ultimately, the applications of solutions to societal challenges. Finally, they will tailor innovation to local conditions taking into account, for example, available resources, capacities, and social and cultural practices.
In the present day, however, investment in innovation by city governments is still a relatively new phenomenon and remains a marginal practice according to a 2019 OECD report.3 Of the surveyed cities, just over half had stated innovation goals and fewer than half had adopted innovation strategies. Those that did were found to approach innovation more holistically and were more open to pursuing change. In response to
the findings, 60 mayors from the OECD Champion Mayors for Inclusive Growth Initiative adopted the Athens Road Map, which aimed to provide guidance on increasing cities’ innovation capacity and capabilities and, in turn, fostering prosperity and well-being.4 The initiative emphasizes the importanceofpursuinginnovationnotinnarrowtechnological terms, but with close regard to wider socioeconomic and cultural needs and conditions. As such, it urges cities to invest concurrently in three interlinking types of innovation:
Technological and digital innovation that contributes to increased well-being in urban areas through smart transformations of public services, ranging from e-government solutions to the use of sensors to address environmental pollution. Participating cities also commit to supporting underserved residents with better access to digital services.
Social innovation to create better social outcomes through the provision of community services for disadvantaged communities, the creation of targeted employment and activation programmes, and the encouragement of social enterprises and community-building activities.
Public sector innovation to put the interests of diverse local communities more centre-stage. Recommendations include participatory budgeting, public innovation labs, or citizen-led monitoring to increase engagement of citizens in urban decision-making processes. City governments are equally encouraged to promote public-private partnerships and collaboration between municipalities.
An important recognition in recent research and policy is the need for localized and inclusive approaches to fostering innovation. This conclusion was reflected in a collection of discussion papers by UN-Habitat on technological innovation for future cities.5 Similarly, a recent report by OECD called for the broadening of innovation policies for cities and regions.6

By broadening, the OECD referred to the need to go beyond a conceptually and spatially narrow approach to innovation (concentrated around a few clusters of excellence) and instead support innovation diffusion through the involvement of a broader set of urban actors and better use of local assets. This approach recognizes the heterogeneity of innovation capacities,withimplicationsforhowinnovationisorchestrated nationally and implemented locally.
Such an approach considers different spatial and territorial dimensions at work.7 On one hand, developing a city-regional approach is considered important if the aim is to broaden the innovation ecosystem and scale up efficiencies (e.g. shared infrastructures and services). On the other, recent research has focused on the neighbourhood as a useful unit at which to support smaller-scale, adaptive innovation practices with local expertise. This scale makes particular sense where the sustainabilitytransitioncallsformoredecentralizedapproaches. Forexample,theJointProgrammingInitiativeUrbanEuropehas a programme to plan and deploy 100 positive energy districts and neighborhoods across 20 European countries by 2025. These districts and neighbourhoods will produce more energy than they consume, through combing a diverse range of energy sources and energy transfers (Figure 9.2).8
A further direction in recent urban innovation policy and practice is the strategic alignment of innovation activities with grand societal challenges. This concern recognizes that innovation can result in destructive creation that leads to greater inequalities and environmental degradation.9 Instead, cities are expected to steer innovation towards the sustainability transition and use it to tackle urban challenges, such as environmental pollution and rapid urbanization.
In summary, it is possible to define some qualitative indicators of what kind of innovation policy and practice can be envisaged for future cities. Accordingly, municipal governments would strive to:
Align innovation policy and practice with grand societal challenges, including climate change, pollution, poverty, and inequalities as identified in various chapters of this Report
Support urban agglomeration, and in particular the colocation of complementary resources and organizations, through territorial and socio-economic planning and regulation (see Chapter 6)
Create a conducive environment for technology and entrepreneurial start-up companies, especially in the green and smart technological sectors
Facilitate partnerships involving a variety of actors (including intermediaries) within and outside the public sector
urban experimentation (pilots, incubators, living labs) aimed at addressing societal problems
training and skills development, including upskilling to green jobs and digitalization
or support “future labs” that engage stakeholders and communities in vision-making and scenario-building

evaluations of innovation programmes to assess impact and ensure feedback for
improvement, learning and capacity building
The “smart city” has become a globally popular catchphrase and major policy paradigm for technology-driven urban innovation and development. It emerged rapidly from the late 2000s onwards to jockey for local authorities’ attention alongside other key urban conceptual paradigms, such as the “compact city,” “resilient city” or even the longtime dominant “sustainable city.”10 Within just five years (2015–
2019), the scientific output on smart cities rose tenfold. This picture of rapid growth is mirrored in the global market, where the demand for smart city systems and solutions is estimated to increase annually by 25 per cent, with an overall market value of approximately US$517 billion.11 It is further reflected in the popularity of diverse smart city initiatives around the world. According to a recent global survey, 27 cities currently lead the field as smart city champions, followed by numerous others that have launched initiatives under the smart city banner.12 Of course, having an explicit smart city agenda is not a precondition for cities adopting connected and digital technologies: indeed, some local governments have implemented artificial intelligence (AI) technology without specific reference to smart city.13
Nevertheless,manymunicipaladministrationschoosetoadopt a smart city agenda, to provide strategic and programmatic direction for urban development. They are often encouraged by national governments that use competitions to entice cities to invest in smart city programmes, as illustrated by India’s 100 Smart Cities Mission and the Republic of Korea’s Smart Challenge. National and international standards organizations have joined in by issuing indicators and frameworks aimed at guiding cities’ work on the ground.14
What transpires from many of the recent smart city initiatives is that they place great importance on promoting governance innovation, alongside the more technical rollout of digital technologies such as public Wi-Fi, smart street furniture and open data portals. For example, Amsterdam Smart City styles itself as an “open innovation platform” aimed at connecting people and supporting collaborative approaches to find solutions to urban challenges.15 Similarly, Melbourne’s smart city programme comprises a CityLab, described as a space to prototype new city services with the community, and an annual Open Innovation Competition, which seeks to tap into the creativity and expertise of the community to solve a given city issue (e.g. waste and the circular economy in 2020).16 In the case of Santiago de Chile’s Shared Street for Low-Carbon District initiative, which was spearheaded by an NGO in collaboration with the municipality and the smart cities unit of the Ministry of Transportation, the aim was to combinecitizenparticipationandexperimentationtosupport tactical interventions for more inclusive and sustainable road use.17 Altogether, rather than starting from a fixed model of the smart city, many recent initiatives emphasize an experimental, open-ended approach to developing solutions to localized urban issues with the involvement of multiple stakeholders.
Nevertheless, smart city initiatives have faced significant criticism, highlighting the risk of an overly technological approachtoinnovationwithoutdueregardtodiverseurbanand social contexts. Therefore, cities wishing to implement smart city strategies need to contend with four main challenges.
Respect city-specific contexts, otherwise smart city projects risk being divorced from the reality of ordinary cities if they subscribe to a form of smart urbanism that espouses a clean slate view of a city run on hyperefficient urban technology.18 In response, researchers and practitioners have urged a more grounded approach, which situates the smart city within specific locales and socio-political contexts, thereby relating it to the messy reality of urban policy and practice.19
Adopt a people-centred perspective to avoid the risk of an overly technocratic approach to how smart city initiatives are conceived and implemented.20 There is broad acknowledgement that, initially at least, smart city initiatives too often acted in the service of technology and corporate interests aimed at expanding new urban markets for digital technologies. Consequently, a more people-centred approach has been recommended, which emphasizes that smart cities should more explicitly serve the interests of citizens and give them an active role in how these technologies are planned and implemented.21 However, if such a commitment is to be more than cursory and paternalistic, it requires serious engagement with questions of social justice, the social good and political participation, for example by operating under the right to the city framework.22
Provincialize smart cities in order to view the smart city from a different perspective than that of the Global North. The predominant view is problematic when smart city practices developed in Western cities with knowledge-based economies and concentrations of global capital are uncritically assumed to be suitable for, and therefore superimposed on, cities in developing countries. In response, critical scholarship has highlighted the need to provincialize smart cities; that is, to develop more grounded approaches to how smart city discourses and practices can emerge from global peripheries, often in the form of small projects (in contrast to typically large-scale, capital-intensive interventions in the Global North).23
Ensure environmental sustainability as there is a major concern that current smart city discourse insufficiently


The “smart city” has become a globally popular catchphrase and major policy paradigm for technology-driven urban innovation and development
Many municipal administrations choose to adopt a smart city agenda, to provide strategic and programmatic direction for urban development
engages with environmental sustainability issues. On one hand, smart city initiatives can be criticized for often prioritizing economic goals—expressed, for example, in terms of seizing global marketshare—and, consequently, marginalizing environmental goals.24 On the other hand, the environmental costs of smart city projects are frequently overlooked, when there is growing evidence that technological innovations may be carbon intensive and environmentally damaging.25 Recent years have, therefore, seen a shift towards more explicitly aligning the smart city with the goals of the sustainable city.26
Overall,thediscussionofwhatinnovationpolicycitiesshould pursue highlights the importance of a concerted approach that interrelates technological, social and public sector innovation. It further highlights the need for a variegated approach that pays attention to different types of cities and urban contexts, in order to achieve thriving, locally grounded innovation practices. It also underscores the importance of aligning innovation policy with major social policy goals, such as ensuring adequate housing, tackling poverty and
improving sanitation. These insights are increasingly recognized in the development and application of emergent urban technologies, as the following section outlines.


Urban futures will be defined to a significant extent by a series of frontier technologies, particularly relating to the green and smart technology sectors. Frontier technologies are innovations in science, technology, engineering and mathematics which are no longer in the research and development phrase but have yet to see mainstream market penetration and public adoption (Box 9.1). Their application in the urban realm has the potential to reconfigure urban development in radical and disruptive ways. The adoption of frontier technologies is not limited to large, global cities, but is increasingly relevant in lower-tiered cities and even informal settlements. This is because frontier technologies can be designed to be relatively low-cost and suitable for local adaptation. Still, a significant problem remains that some technological innovations, driven by global corporate interests, are either unattainable in resource-poor contexts or in their application exacerbate social inequalities, thus leaving some cities behind. Consequently, urban institutions and stakeholders should be actively involved in deciding how urban technologies are designed and adapted locally in pursuit of sustainable urban development.
Smart city initiatives have faced significant criticism, highlighting the risk of an overly technological approach to innovation without due regard to diverse urban and social contextsCo-workers at the iHub, a working space for technology entrepreneurs, Nairobi, Kenya. © rvdw images/Shutterstock
• Artificial intelligence, or machine learning: Increasingly deployed by municipal governments in the form of virtual agents like chatbots for issuing parking permits and in road traffic management.27
• Blockchain, or distributed ledger technology: For secure, decentralized exchange of data among network partners. Used by transport operators to deliver shared mobility services, or by city governments to issue residents with digital identifiers for accessing local services.28
• Digital twins: Virtual representations of urban objects at various scales (building, neighborhood, district, etc.) used as planning tools. Supports diagnostic and prognostic analysis and model-making. Dependent on completeness and accuracy of underlying data known as “digital thread.” 29
• 3D printing, or additive manufacturing: Allows for offsite fabrication of building components, thus potentially lowering construction costs of new buildings.30
• Electric vehicle (EV) technology: With a global target of 60 per cent EV cars by 2030, a rapid uptake is required given the current share of just 4 per cent. (In comparison, EVs already make up 39 per cent of buses.) A key technological challenge is the roll-out of electric charging networks. To date, 15 countries and 31 cities are committed to phasing out the sale of combustion-engine vehicles.31
• Internet of Things (IoT): Broad range of applications by embedding a multitude of sensors, smart meters and computer processors in urban infrastructure and objects (buildings, electricity grids, street furniture, water grids, etc.) and connecting these to digital management systems via cloud computing (remote storage and analysis system over the internet)32
• Renewable energy technologies: Deployed for clean energy production, using various renewable energy sources (solar, wind, hydro, biomass, geothermal). Potential to be applied in tandem, e.g. large bioenergy and waste-to-energy plants with distributed networks of solar panels.33
• Robotics: Multiple urban applications, including drones for last-mile delivery and connected autonomous vehicles (CAVs). Dependent on 5G/6G technology to deliver high-speed broadband, ultra-reliable connectivity (for low latency) and ability to connect to a multitude of devices simultaneously.34
BNEF.
‘ETS’
BloombergNEF, 2021.
The rise of various green technologies corresponds with the scale and urgency of environmental challenges (Chapter 5). According to the World Energy Outlook only 40 per cent of the CO2 emissioncutsrequiredtoreachthe2050netzerotargetwill be achieved with current measures.35 Therefore, the uptake of environmental technologies (currently increasing by over 8 per centannually,asmeasuredbyinvestment)willneedtoaccelerate significantly in the coming years.36 The decarbonization of energy grids, the electrification of transportation and the application of renewable energy technologies to commercial and domestic buildings are among the most important areas that require innovation and implementation.
For its part, the smart technology sector has grown exponentially based on rapid advancements in digital and connected technologies and their ubiquity in everyday life. The speed with which cities are adopting smart technology is illustrated by strong demand for Internet of Things (IoT) technology, with over 20 per cent annual growth forecast for the coming years.37 Similarly, blockchain technology is predicted to grow by over 30 per cent in the next few years.38 AI technologies are increasingly deployed by municipal governments in the form of virtual agents like chatbots.39 Overall, the market for smart city systems and solutions is estimated to be US$517 billion.40
More than their individual contributions, however, it is the convergence of green and smart technologies that creates the basis for major, and potentially disruptive, urban change. For example, the application of IoT and blockchain technologies
in combination with renewable energy technologies makes it increasingly technically feasible and financially affordable to set up virtual power plants. These are decentralized, local energy grids that can utilize multiple renewable energy sources and, thus, reduce CO2 emissions and increase energy resilience. Likewise, modern district heating systems combine renewable technologies(wasteheat,heatpumps,thermalstorage,etc.)with digital and connected technologies to achieve increased energy efficiency. According to the United Nations Environmental Programme, they are “a secret weapon for climate action and human health,” with potential to reduce primary energy consumption by up to 50 per cent compared with conventional systems.41 Both examples point to the opportunity for smallscale, localized approaches (also known as “off-grid” energy), with technology configured to suit specific local conditions.
A similar technological interplay is required to realize the goals of the circular economy, which seeks to change the prevailing linear production mode (so-called “take-makedispose”) to a closed production cycle where product owners repair, recover, reuse and recycle their goods.42 Cloud computing and business-to-business matching platforms are enabling technologies to connect waste producers with waste recycling and remanufacturing industries. Blockchain technology can improve the traceability and transparency of
products by verifying the origins of products and assuring related sustainability claims.


The example of virtual power plants demonstrates that frontier technology need not necessarily be unaffordable. Such plants can be designed to allow individual households, groups of residents or neighborhoods to sell surplus electricity to the wider electricity grid, thus generating local income for residents alongside their contribution to decarbonizing the energy system.


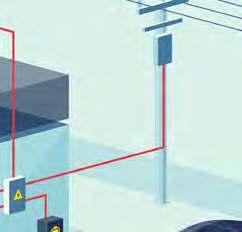

While the costs of new infrastructure development are typically high—and as such may be out of reach for less well-resourced cities—a focus on improving existing infrastructure is often more appropriate and less costly. According to a report by McKinsey on infrastructure options for future cities, even relatively simple and inexpensive digital overlays—such as low-cost automated utility meters and air quality monitors, low-power Wi-Fi communication for intermitted data-streaming, and advancements in solar panel battery technology delivering more power at lower cost—can render existing infrastructure “smart” at affordable prices.43
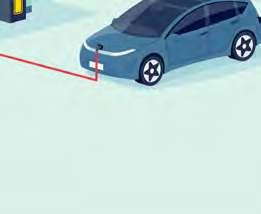
The question of high-versus-low costs also applies to waste management. At the high end, a study by the European Environment Agency argues that the future of waste management will be characterized by the convergence of five technological innovations, namely: (a) robotics that use image

recognition for pneumatic sorting; (b) AI and machine learning for waste classification, such as CAV refuse trucks; (c) IoT for sensor-supported waste containers (e.g. smart bins); (d) cloud computing for storing and processing sensor data as well as workflow management; and (e) data analytics to evaluate performance and model alternative options (figure 9.3).44
The report, however, acknowledges several potential deterrents: high investment costs, the requirement for advanced digital skills, the prospect of generating additional electronic waste and increasing energy consumption. Echoing this concern, a World Bank report emphasized that appropriate technological solutions to tackling waste may not be the newest or most advanced, depending on context.45 This is important given that 90 per cent of solid waste is openly dumped or burned in low-income countries, and worldwide 33 per cent of municipal waste is not managed in an environmentally safe way, partly due to the high cost of waste management.46
Similarly, the availability of affordable technological solutions totacklethegrowingproblemofwaterscarcityandsanitation is a recognized challenge. There are some noteworthy case studies that demonstrate how technology can be applied in resource-poor settings, thus providing clean and affordable water to local communities.47 Here again, increasingly several technologies interact, with digital overlays adding remote sensing and smart metering capabilities. The trend is towards more small-grid and hybrid-grid water management systems aimed at increasing efficiency and resilience.48
Figure 9.3: Five technological innovations that will shape the future of waste management
Advancements in the pneumatic sorting process as a result of autimation technology allow producing defined waste streams of high purity (over 90%)
Machine learning-using neural networks based on the use of data or examples to solve problems without explicit programming-is used for classification and pattern recognition in the waste management context, improving the efficiency of sorting.
As more and more devices are connected to the internet or other networks,sensor supported containers can collect data and transfer it to central units.
Storing and processing of sensor data and cloud based software solutions make it easy to optimize workflowsw and document failure to collect,failure in sorting or detect waste bins that are not paid for.
Storing and processing of sensor data and cloud based software solutions make it easy to optimize workflowsw and document failure to collect,failure in sorting or detect waste bins that are not paid for.
Robots that are able to identify and sort recyclables and critical materials through image recognition/IR scanning/AI vision systems when dismantling used phones/electronics.
Source: EEA, 2021b.
Autonomous,self-driving street sweepers,refuse trucks
Smart waste bins with identification systems,weighing systems,level sensors,software for optimizing logistics

Cloud based software for:
- Connection,standardizing and optimizing internal procedures.
- Real-time order management route planning and optimization,customer selfservice,order tracking and evaluation.
- Electronically supported disposition of waste collection vehicles.
- Evaluation of sensor data for automated sorting plans.
- Control of waste incineration plants
- Drone based data collection on landfills.
Concomitant with a focus on small-scale, localized approaches, technological innovations are increasingly characterized by flexible and modular designs. A case in point is mobile air quality monitoring, in response to the worldwide problem of urban air pollution which afflicts 9 out of 10 people on a daily basis.49 The example of Breathe London, a recent pilot study undertaken by the Environmental Defense Fund, demonstrates the feasibility and flexibility of lower-cost and more portable monitoring using sensor pods, as alternative to more costly traditional environmental monitoring technology.50 The approach is particularly suitable for generating high granularity of data for targeted, hyper-local action, such as dealing with pollution
hotspots, and measuring the impacts of intervention. The underlying technological approach has been made available as a blueprint for use in other cities.51
Modularity and flexibility are also characteristic of new approaches to urban transportation. Enabled by technological innovations, including electric and connected autonomous vehicles, the future of urban transport will be more multimodal with emphasis on mobility-as-aservice (on-demand ridehailing and car-sharing), micromobility (e-scooters, e-bikes and e-light freight vehicles), last-mile and last-minute delivery (drones and robots), and active travel (walking and cycling). This will require both integrated physical infrastructure and interconnected
transport management systems. It will also require attention to multiple aims, including reducing air/noise pollution, increasing safety and improving congestion.52
If a key feature of future urban technologies is small-scale designs and local adaptability, then the need for on-the-ground partnershipsbecomesapparent.Onesuchexamplecomesfrom Norway,where11townsmakinguptheRoglandregionteamed up to upgrade street and park lighting using LED technology.53 Rather than opting for outsourcing, the project was developed by an industrial company owned by the municipalities, and it is based on an open system design to allow for future IoT functionalities to be added. It resulted in the installation of 18,000 LED lighting poles that are interlinked via a central management system. Elsewhere, the need for cooperation is also critical to achieving more sustainable building design and operations. Buildings contribute an estimated 37 per cent of global CO2 emissions and account for 36 per cent of global energy consumption.54 Approximately one-third of emissions stems from construction activities and two-thirds relate to building operations. These sources highlight the importance of applying life-cycle assessment to the building sector: design, planning, construction, operation, renovation and demolition. Apart from environmental technologies (e.g. active and passive solar power; recycled materials for insulation; green roofs), smart technologies are used for building operation as well as to optimize energy efficiency and monitor performance. This essentially requires the active involvement of, and cooperation from, building operations managers and users, whether residents or commercial tenants.
Digital technologies can be used to enhance collaborative planning and decision-making (Chapter 6). Municipal governments and other urban actors have access to growing amounts of large-scale and high-resolution data harvested from diverse sources, including from distributed sensors, closed-circuit television cameras and social media. Digital twin technology is increasingly used in urban design and planning. Geographic digital twins are virtual representations of urban objects at various scales. As digital counterparts of the urban fabric, they can be used as planning tools, by providing diagnostic and prognostic analysis and enabling model-making. The technology, however, is dependent on the completeness and accuracy of the digital thread, the underlying data-driven architecture.
While recognizing the limits of technological sovereignty, city governments have an opportunity to pursue an active role in setting the technological agenda for urban futures. In doing so,
the focus should be on supporting technological development and finding technological solutions that are attuned to local conditions, tackle pressing urban challenges, and are socioeconomically and culturally inclusive. Cities need to be prepared for, and actively address, technological advances and their likely impacts, such as those arising from automation and digitalization, as the following sections sets out.
According to the World Economic Forum (WEF), by the year 2025, machines will equal humans in terms of time spent on tasks at work.55 Automation, alongside digitalization and new hybrid forms of work, are expected to transform established modes of labour and employment and, consequently, change urban economies. Digital platforms, for example, create new digital-urbanconnectionswithvisibleimpactsonstreetscapes and urban trade and services. The COVID-19 pandemic has accelerated these emergent transformations. The WEF report aptly speaks of a “double disruption” confronting the world of work: one caused by connected and digital technologies; the other by the pandemic rupture. City governments, as policymakers, regulators and employers, have a stake in the discussion about how technological innovation should shape the future of work and knowledge-based urban development.
City governments, as policymakers, regulators and employers, have a stake in the discussion about how technological innovation should shape the future of work
The future of work, in the form of the ubiquitous use of connected and digital technologies, has already arrived for a large proportion of the white-collar workforce.56 Many public and private sector organizations routinely use cloud computing and big data analytics while consumer-oriented businesses have increasingly embraced e-commerce. Algorithmic management, which relies on data collection and surveillance technology to remotely track and manage workforces, is becoming more commonplace, especially in developed countries.57
In emerging and developing countries, the evidence of the impact of digitalization is not yet conclusive, according to the German Agency for International Cooperation (GIZ).58
Microwork platforms have attracted growing interest as a promising tool to support work in the informal economy and in areas of high unemployment. They give users access to various short-term Internet-based microtasks, such as transcribing short texts, moderating content and tagging images. Work can be carried out one task at a time from home, thus offering flexibility and remote access. In an experiment on the outskirts of Windhoek, researchers designed a simulation of a range of microtasks for which payment was made.
The aim was to find out what livelihood assets are needed to allow people to pursue microwork, and whether doing so results in improved livelihood outcomes. Volunteers were given training to act as technology mediators so that they themselves could train and support their community. The project concluded that several conditions had to be met for microwork to be a viable option, including: English language skills and digital literacy; physical access to electricity and the Internet; email and bank account ownership; and financial means to pay platform membership fees.
Source: Keskinen et al, 2021.
It cites evidence from five Association of Southeast Asian Nations (ASEAN) countries showing that, in the formal economy, up to 56 per cent of jobs are threatened by digitalization and automation. Corresponding data on the informal economy are more difficult to come by because it is expansive and diversified, encompassing an estimated 2 billion workers across the Global South.59 Nevertheless, GIZ highlights employment opportunities in the platform economy,60 and improvements in productivity flowing from technological innovation.
For the G20 intergovernmental forum, digitalization offers an unprecedented opportunity for self-employed individuals as well as small and medium enterprises.61 Connected and digital technologies can facilitate access to financial services, seen as critical for supporting inclusive and sustainable development. The G20 policy guide highlights the scale of the task, since 1.7 billion adults worldwide lack access to a basic bank or mobile money account. Particularly, women should benefit from digital connectivity, since they make up the largest group across different sectors within the informal economy.
An example of the importance of digital tools for female entrepreneurship is reported in a case study of informal markets in Ghana.62 There, ICTs, and in particular mobile phones, form an essential part of women’s trading practices, providing access to banking services and information on farm pricing, as well as supporting multiple social networks which are central to managing their micro-enterprises. In Namibia, where well over 50 per cent of the work takes place in the informal economy, the benefits of microwork were explored in a community-based experiment in Windhoek (Box 9.2).63
Digital labour platforms epitomize the advancing digitalization across formal and informal economies. They exhibit a strong urban dimension: platforms benefit from high population density and spatial proximity between platform users and workers.64 This dynamic is so significant that captured by the termplatformurbanism’.65 Citygovernmentsthemselvesoften become involved, for example in an oversight and regulatory capacity to provide licenses to drivers and food safety certificates to restaurants. Indeed, some city governments have participated in legal challenges, for example to force ridehailing platforms to be treated as transportation companies rather than merely as technology enterprises.66
Yet, there are growing concerns that digital labour platforms create a precarious class of underpaid urban workers with little social protection.67 Research in South-Eastern Asia and Sub-Saharan Africa has shown that platform work can result in irregular worktime, overwork, sleep deprivation, and social isolation, apart from generating low pay.68 Of particular worry for cities must be the prospect of increased inequality between a growing group of precarious platform workers and a high-income class of residents.69 These concerns, however, have to be set against the attractiveness—typically emphasized by platform workers themselves—of flexibility, autonomy, additional income and low-entry barriers to urban labour markets.70
There are growing concerns that digital labour platforms create a precarious class of underpaid urban workers with little social protection
Alongside digital transformations, the substitution of human workers with technology is advancing rapidly. In developing countries, two-thirds of jobs could be automated, particularly in formal economies where wages and rates of technological adaptation are high.71 Similar trends can be observed in developed countries. In the US, up to 47 per cent of employment is estimated to be at risk of automation, particularly affecting jobs in the services and administrative sectors.72 In the UK, following the example of multinational technology company Amazon, two major national supermarket chains began trialing automation technology in 2021, including camera surveillance and automated billing, that would dispense with retail staff. In municipal service provision, automation plays a growing role. For example, chatbots or virtual agents increasingly replace municipal staff, such as in Helsinki, Finland, where chatbots help process residents’ parking permit applications.73 Another area of application is waste collection based on automated air suction systems and underground pipes.74 The city of Yavne, Israel, boasts one of the world’s most advanced automated waste collection systems, covering homes, schools and public bins.75 In urban public transport, driverless buses are rapidly becoming common features, such as in Malaga, Spain, and Wuxi, China.76


TheCOVID-19pandemicwilllikelyhavealastingeffectonthe world of work by accelerating automation and digitalization. The need for social distancing hastened the introduction of self-service customer kiosks and the use of service robots in customer interaction areas.77 Additionally, the pandemic also changed the spatiality of work from the predominant physical mode of work fixed in one place to flexible, hybrid work practices. Despite the difficulty of predicting the winners and losers among cities of the pandemic’s long-term effects,78 it is possible to consider at several scenarios for the future of work and urban development.
The double disruption, as described by the World Economic Forum, is likely to continue to reshape the labour market. The International Labour Organization emphasized the likely further increase in inequalities between low- and high-paid workers arising from the type of job losses generated by the pandemic.79 This will necessarily lead to changes in the mix of occupations and, therefore, require retraining and upskilling.80 Changes in the retail sector may be particularly pronounced. The high street “retail apocalypse,”81 already underway before the pandemic, is likely going to make more jobs in large service sectors obsolete. The increase in online retail from 16 per cent of total sales pre-pandemic to 19 per cent globally is likely to accelerate further.82 The McKinsey Global Institute highlights the need for preparedness for changes in the mix of occupations: it estimates that 25 per cent of workers will need to switch occupations, with jobs in warehousing and transportation increasing, while those in customer-facing sales falling. On their part, digital platforms can be expected to grow and diversify which, while providing work opportunities across developing and developed economies, may add to the precarity of workers.
The COVID-19 pandemic will likely have a lasting effect on the world of work by accelerating automation and digitalization
The enforced lockdowns and subsequent sudden shift to remote working resulted in an abrupt decrease in transportation, coupled with a reduction in air pollution and greenhouse gas emissions (Chapter 6).83 This led some to predict that new modes of hybrid working will have positive environmental externalities.84 However, recent evidence points to a rebound effect, as more people switched from public transport to private car use since social distancing is easier to maintain.85 In addition, growing demand for online shopping and last-mile delivery have led to an increase in road traffic.86 City administrations, thus, need to analyze how these trends may require investment in sustainable micro-mobility solutions.
In developing countries, twothirds of jobs could be automated, particularly in formal economies where wages and rates of technological adaptation are high
As remote and hybrid working practices allow people to live and work at greater distance from urban centers where offices and headquarters are concentrated, smaller cities and suburbanareasmaybenefitrelativetolargerones.87 However, this depends on the availability of suitable infrastructure such as broadband coverage and co-working spaces. Indeed, smaller cities and suburban areas may use the opportunity of the pandemic to invest in urban improvements to increase their attractiveness to footloose remote workers.
Yet, according to a US study, smaller cities may also be expected to experience negative long-term consequences, as they are home to a larger proportion of jobs that can be automated, thus leading to job losses.88 By the same analysis, large cities may be less affected, given the concentration of highly skilled technical and managerial professions that are less prone to automation. Other research on European and Northern American urban economies predicts a more polarized scenario among large cities, depending on the economic specialization and skillsets of local workforces: cities with higher shares of jobs considered low-skilled (such as in certain service sectors) or high-skilled (for example in biosciences and engineering) may enjoy greater resilience, while those with large medium-skilled workforces (such as in manufacturing or administration) could face high unemployment.89 The various options for city governments to enhance the attractiveness of locations for businesses and workers include tax incentives and making targeted infrastructure investments.90
While the implications of the pandemic’s double disruption for urban development are yet to crystallize fully, cities would be well advised to prepare urban workers for potential negative impacts. For example, Calgary promotes the reskilling of residents through a dedicated technological skills development programme, in response to the decline of its traditional fossil fuel industries.91 The government of Singapore offers SkillsFuture, a retraining programme that consists of short modular courses in emerging areas, such as advanced manufacturing, data analytics and urban solutions.92 Citizens each receive an allowance of SG$500 to sign up for a SkillsFuture course, with more than 431,000 Singaporeans benefitting to date.93
Basic income trials are another possible policy intervention, by providing an unconditional monthly income to alleviate the need to engage in precarious and short-term work. For instance, the city of Stockton in the US undertook a two-year trial by offering a selected group of low-income residents a monthly basic income of US$500, which resulted in lower unemployment and improved well-being (Chapter 1).94 In Madrid, workers have set up platform cooperatives in response to the rise of corporately-owned digital labour platforms. Owned and run by workers, the cooperatives aim to offer better working conditions than established platforms by providing regular pay and paid leave.95 Despite the uncertainties surrounding the pandemic’s long-term effects, cities have several tools at their disposal to manage the
economic and social effects of digitalization and automation and to support their citizens’ participation in the knowledgebased economy.
The COVID-19 pandemic demonstrated the opportunities afforded by digital technologies which allowed society to adapt quickly to remote online working, education, health care, retail and entertainment. At the same time, the pandemic revealed that a lack of access to smart technology could exacerbate existing socio-economic inequalities. For instance, in New York access to technology emerged as a fundamental determinant of access to health and social care.96 Residents on lower incomes, from ethnic minorities, the elderly and immigrants, had significantly lower access to broadband and the Internet than the average population, coupled with lower digital literacy.
This is an example of the digital divide, which not only highlights the challenge that some may benefit more from technological innovations than others but, worse, that the introduction of new technology can further entrench existing socio-economic and cultural disparities, as UN-Habitat has repeatedly highlighted.97 If, therefore, the aim of urban development as stated in the New Urban Agenda98 is to promote inclusivity and ensure that all inhabitants have access to various urban services, then active steps need to be taken to avoid technological innovations having adverse effects. This similarly applies to environmental technologies, where the risk of “eco-gentrification” and the emergence of a “climate precariat” are well recognized.99
Technological divides are not a problem exclusively for cities in the developing world. Cities in the developed world are also confronted with the challenge of addressing digital and environmental divides among their populations. This section seeks to highlight how various cities (and countries) have responded to the challenge with initiatives aimed at making the applications of technological innovations more inclusive.
The digital divide is more than physical access to digital infrastructure, including broadband and the Internet.100 It encompasses the affordability of smart technology, the skills required for digital literacy, and whether digital engagement translates into new opportunities, such as employment, education, and social and cultural engagement:
Access consists of two aspects: the availability of digital infrastructures and digital tools and the affordability of using digital services. The former highlights that digital infrastructure may be unevenly distributed across urban space, with gaps in broadband coverage which, therefore, puts underserved communities at a disadvantage. The latter highlights that, even where physical access is available, there may still be a barrier to accessing digital services on cost grounds. Figure 9.4 shows how even in a city like New York, many households are without internet. Expanding the spatial reach of digital infrastructure is seen as the most fundamental requirement to counteract the digital divide.101 Improving physical access to digital infrastructure alone will not suffice; questions related to affordability, skills development and the productive use of digital tools for economic activity need to be addressed. Still, physical access remains important: in developing countries, in 2018, about 40–42 per cent of people had access to the Internet compared to 70–98 per cent in developed countries.102


Skills: Even if everyone had physical access to digital tools, inequalities would remain if potential users lacked digital literacy to use digital services and create their own content. This is one of the main challenges identified in the UN-Habitat playbook People-Centered Smart City.103 This framework points to the importance of skills training. Evidence shows significant inequalities concerning digital literacy and skills afflicting particular social groups. For example, research shows that age, income and level of education were important determinants of people’s ability to access and use ICTs in Barcelona.104 In Magelang, Indonesia, the gulf between digital haves and digital have-nots has widened with over one-third of the city’s poor having no access to mobile phones. Additionally, they did not have the skills for advanced use, such as logging on, conducting online searches and retrieving information.105
More recent research has focused on the outcomes of computer and Internet use in terms of who is benefitting, and in what way.106 This research shows that those on the right side of the digital divide (young, male, well-educated, employed) generally report more positive outcomes economically, socially, politically and culturally, and are better at coping with the negative aspects of Internet use, such as cybercrime, disinformation, and online addiction. For those on the wrong side of the divide (older persons, female, those with low-level education and occupation), the situation


is reversed. In least-developed countries the uptake of digital technologies for production, rather than mere consumption, still lags significantly behind more developed countries.107
Examples of the digital divide from across the world, as well as initiatives that seek to enahnce digital inclusion are presented in Table 9.1. Concerning the former, not only is there compelling evidence of the urban poor being disproportionally affected, as exemplified by the case of Magelang, but there is also a strong gender factor at play: across low- and middle-income countries, women are 20 per cent less likely than men to use mobile Internet, according to the United Nations Conference on Trade and Development (UNCTAD).108 Research on Indian urban slums revealed in more detail that women in poor settings are disproportionally affected by a lack of Internet access, not owning an access device (mobile phones, computer), and not knowing how to send text messages.109
Another study from India highlighted the digital marginalization of elderly people, who experience multiple barriers to using digital services, including difficulty in understanding technical instructions, concerns over cyber security, and a lack of supportive learning environment.110 A case study of Dar es Salaam found that a change in mobile phone regulations (mandatory registration of SIM cards) disproportionallyaffectedthoselivingininformalsettlements by disrupting users’ informal financial transaction methods, with detrimental effects on their livelihoods.111 Elsewhere, research on Internet exclusion in Santiago and Medellín revealed that households who could afford Internet access and had the necessary user skills nevertheless experienced exclusion for want of sufficient digital infrastructure.112 This study points to network disadvantage that is institutionally generated. Altogether, these studies highlight the complexity of digital exclusion, requiring urban actors to consider multiple levels of intervention to provide redress.
Still
Magelang:
Indian
SantiagoandMedellín:sparseInternetaccessevenifhouseholdscouldaffordit
Nigeria/Senegal/Tanzania: access to, and use of, digital technology to improve
Johannesburg: short training sessions close to public Wi-Fi
Cities Coalition for Digital Rights: a coalition of 45 cities around the
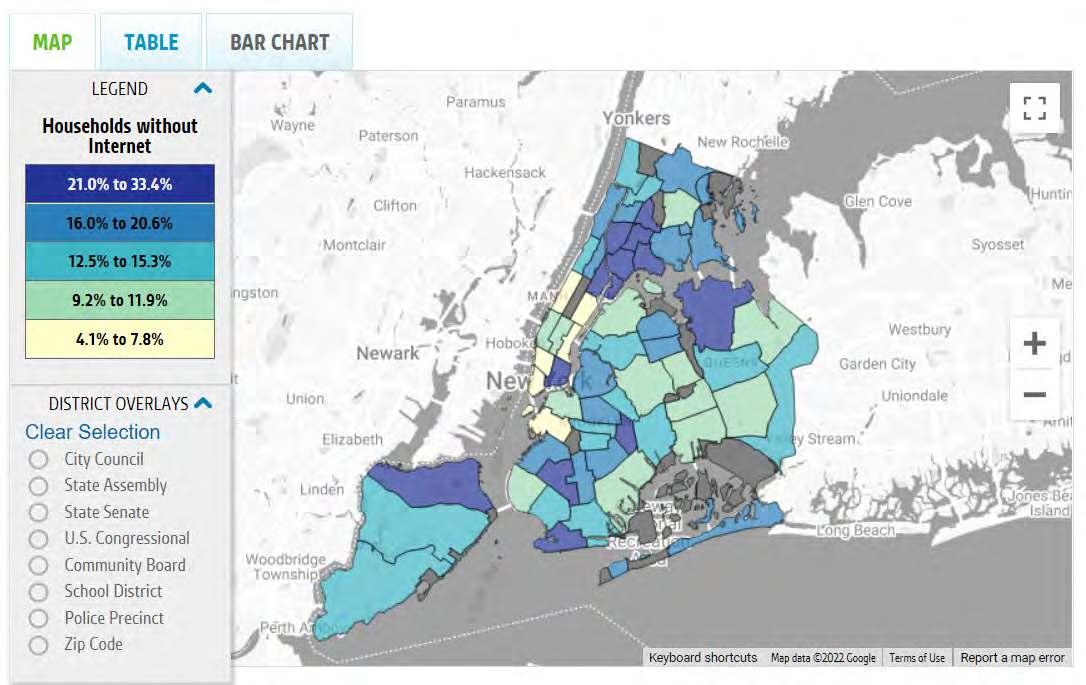
the
In terms of the measures to
Nigeria, Senegal and Tanzania
a World Bank study
that both Internet availability and the use of more sophisticated digital technologies led to more and better jobs for lower-income, lower-skilled people.
force
and wage employment increased significantly after three years in areas where Internet access had been
introduced. The importance of skills training was recognized in a smart city project in Johannesburg: in addition to rolling out free Wi-Fi access points near public hospitals, libraries and along public transport routes across the city, 85 trained Jozi Digital Ambassadors were deployed over a three-month period to train and enroll residents in Internet use.
In North America, several cities have sought to overcome the digital divide.122 For instance, in Chattanooga, US, the city took the lead in installing a citywide fiber network through its own municipal electricity utility company, thus providing affordable gigabit speed to previously underserved communities. During COVID-19, low-income students were granted free Internet access to enable them to participate in online learning. The initiative also helped the city attract new investment, with
many tech companies choosing to locate there. Box 9.3 shows how the Toronto is bridging the digital divide, which creates significant barriers for the most vulnerable and marginalized residents in accessing vital services and supports.123 Apart from these examples, urban actors seeking to access knowledge and guidance on how to facilitate digital inclusion may find the declaration of the Cities Coalition for Digital Rights, agreed between 45 cities, a useful resource.124
All of Toronto has access to some form of Internet coverage, yet not everyone is able to afford quality access due to high prices. As of 2020, 39 per cent of the city’s residents did not have Internet speeds that met the standards of the Canadian Radio-television and Telecommunications Commission. This was due to either poor infrastructure or inability to afford quality service. Over one-third of Toronto households indicated that they were able to afford high-quality Internet only at the expense of other purchases like food or clothing. Canada has among the most expensive Internet costs globally; even high-income households tend to spend at least 9 per cent of their income on expenses related to Internet connectivity. Over half of the people surveyed by the Toronto Public Library indicated that the public library was the only source of Internet access.
This digital divide creates significant barriers for Toronto’s most vulnerable and marginalized residents in accessing vital services and supports. Residents without consistent internet access cannot access information, resources, supports, educational tools and social platforms to stay connected. Businesses trying to compete in a digital-first world are set back by insufficient Internet access and are unable to have staff effectively work from home.
To address the digital divide and Internet affordability issue, the Toronto undertook several pilot projects:
• 25 residential tower apartments were planned to be connected to free Internet for a year, covering 13,000 residents
• Public Wi-Fi in shelter sites
• Distribution of 400 connectivity kits that include a laptop and an Internet receiver
• Donation of 5000 smartphones to indigenous populations, each with six months of free data and calls
• Free Wi-Fi access expanded in parks and recreational areas
In early 2021, the government concluded that the measures taken were effective, but hardly scalable and not economically sustainable. A more ambitious programme, ConnectTO, was therefore initiated as a city-driven collaborative programme that aims to leverage the use of municipal resources and assets to help bridge the increasing digital divide by expanding access to affordable, high-speed Internet to underserved Toronto residents.
ConnectTO also aims to streamline and update existing city processes to ensure Internet connectivity planning, such as installing public Wi-Fi and laying fibre conduits in existing construction work, is embedded in the planning and execution of various city initiatives moving forward. ConnectTO recommends a phased delivery to effectively build the proper foundation for citywide deployment.
Access to reliable and affordable internet improves socioeconomic opportunities and access to city services for equity-seeking groups and vulnerable populations, nurtures innovation, stimulates Toronto’s economic recovery and growth by enabling the digital economy, supports the city’s long-term fiscal health by creating valuable city assets, and contributes long-term benefits related to the COVID-19 recovery plan.
Source: UN Habitat, 2021e.; City of Toronto, 2021.
Eco-gentrification is the process by which urban greening raises property values and drives out existing residents. Like the digital divide, the environmental divide can be considered in terms of the three criteria of access, skills, and outcomes: which urban population groups in which cities have access to environmental technological solutions; whether they have the requisite skills to make use of these; and whether the outcomes such as reduced air pollution, low-carbon infrastructure benefit them equally.
Cities’ efforts to mitigate and adapt to climate change can exacerbate processes of exclusion: the climate privileged benefit from low-carbon investments, green infrastructure and amenities; whereas for the climate precariat, climate action may result in rising housing and living costs.125
Thus, urban climate policies may produce a distinct form of gentrification, with middle- and upper-income residents making choices that afford them access to low-carbon infrastructure and favourable mixed-use neighborhoods.126 Similar dynamics will be at work between cities, with some disadvantaged by a lack of resources to deploy environmental technologies, and others able to address the climate crisis by using environmental innovation to render their cities more prosperous and livable places. A further problematic dynamic between cities across global regions arises from the shipment of technological waste to far-away places. A case in point is Agboloshie in Accra, one of the world’s largest sites of electronic waste dumping, including a growing number of electric vehicle batteries.127 Low-income residents in that area bear the toxic burden of the low-carbon transition accelerating elsewhere.
Urban actors need to be aware of the convergence of green and smart technological innovations, and how this potentially multiplies technological divides. A study of the social effects of eco-innovation in smart city projects in the city region of Milan shows that certain social groups were not only disadvantaged due to the eco-gentrification effect, but were also excluded due to a lack of digital literacy.128
The primary motive for addressing digital, environmental and other divides caused by technological urbanism is evidently to prevent new inequalities from arising and existing ones being further exacerbated. Beyond this, the effort to bridge these divides should yield wider economic, social, and environmental benefits. Enabling digital technology positively enhances labour force participation and, thus, reduces poverty.129
In a World Bank report on citizen-driven innovation in cities, the term Government 2.0 denotes an advanced mode of municipal government where citizens, developers, city administrations and other actors form partnerships to deliver improved, transparent public services.130 This thinking reflects a growing trend in policy and practice that emphasizes the benefits of involving citizens and stakeholders in local government. ICT and digital technologies are considered important enablers of more inclusive policy- and decision-making. Consequently, many cities have put in place various e-government initiatives. While some follow a more conventional approach consisting of one-way communication to service users, others pursue more interactive, multi-stakeholder engagement as part of a drive towards participatory e-governance (Chapter 8). Significantly, ICT and digital tools are also increasingly used to create opportunities for public participation beyond municipal government: civic engagement, e-government and newer concepts like “community technology making.”
Technology, however, is no panacea: the potential of technology-enabled participation depends on the suitability of technological tools and techniques in particular contexts. Furthermore, public engagement initiatives risk being empty exercises, unless they are properly related to policy and decision processes, and are supported with relevant skills training to allow participants to engage properly.
The potential of technology-enabled participation depends on the suitability of technological tools and techniques in particular contexts
E-government is typically considered at the national level, but its relevance is felt at the municipal level.131 People often have a invested interest in what happens in their local communities, and local governments deal directly with issues affecting residents’ daily lives. Findings from a global survey of 100 cities found that fewer than half had advanced e-government practices, such as deliberative forums, consultations and polls. Instead, most portals heavily relied on social media networks, such as YouTube, Facebook and Twitter.132 Cities need to embrace a more comprehensive e-government vision and strategy, coupled with sufficient financial investment. A commitment to
the use of open data, and attention to data quality and interoperability, are necessary stepping stones to realizing broader collaboration.133
City dashboards showcase the potential of ICT to increase transparency in municipalities. As city administrations gather and process increasing amounts of diverse data on urban environmental and socioeconomic indicators, dashboards help to visualize and organize these data in accessible fashion.134 Types of data presented include census data, data collected through citizens’ mobile phones, and sensor-based measurements of noise or pollution, as exemplified by the city dashboard in Bandung, Indonesia (figure 9.5).135 Yet, in order to ensure the usefulness of such visualization tools, digital and data literacy of residents needs to be promoted.136

There are numerous examples of cities deploying ICT and digital technologies creatively to enable residents and stakeholders to become actively engaged. For instance, the city government of Jakarta introduced QlueMyCity, a mapbased integrated reporting and monitoring platform which utilizes citizen participation to identify problems across the city: citizens may report faulty streetlights, clogged drains, waste disposal issues and other infrastructure in need of repair (figure 9.6).137 The mobile app subsequently displays information on how the problem was resolved, and allows for further feedback.
In the US, a study of public engagement platforms used by local governments identified several approaches to including residents, such as consulting them on proposed decision options, inviting them to make suggestions, and involving them directly in decision-making.138 Examples include: IdeaScale (Atlanta), which lets participants submit ideas, comment as well as vote on them; and BudgetAllocator (Bayswater), used for participatory budgeting. The study also highlighted the interrelationship between these online platforms and offline consultation and engagement processes used by local governments. Communities that experiment with participatory digital platforms are typically ones that have a pre-existing commitment to, and a track-record of, citizen engagement. Mexico City is further example of the innovative use of technology to realize participatory e-government.139
9.5.2. Giving voice through civic engagement
Technology-based methods are also used for engagement activities within communities. One such approach is citizen science, which encourages ordinary people (non-experts) to participate in community-based research on relevant issues. The benefits are twofold: first, tapping into local knowledge, which can inform research and policy by contributing new insights; and second, strengthening the capabilities of individuals and communities. A practical example of citizen science, and the supportive role played by digital technology, stems from the city of Eskilstuna, Sweden (Box 9.4).
Eskilstuna is a mid-sized Swedish city home to several neighbourhoods where a majority of residents are foreign-born or have foreign backgrounds as refugees from wartorn countries like Somalia and Syria. In ethnically homogenous Sweden, these communities have struggled to integrate and their youth population have higher rates of criminal activity, including gang affiliation and drug trafficking, that have led these neighbourhoods to be stigmatized in the popular imagination. Researchers enlisted young men in two deprived neighborhoods to serve as citizens scientists, who would use a smartphone app to collect data about their neighbourhood and its residents. The aim was to engage young people to produce local knowledge about the experience and everyday challenges of living in marginalized communities. The rationale was that, as citizen scientists, the participating young people could generate unique knowledge by capturing their surroundings through pictures on their mobile phones and commenting on the significance of certain sites for their neighborhoods, knowledge that external researchers may otherwise not easily access. In turn, this could help overcome the gap between the external perceptions of these neighborhoods and the on-the-ground, lived experience of young people. Insights from this citizen science project were presented to residents and politicians from Eskilstuna’s municipality at a public event.
Source: Fell et al, 2021Citizen science projects are increasingly being used in the implementation and monitoring of the SDGs at the local level. Since the SDG indicators are officially reported at the national level, and municipal governments often do not have the required data to assess progress in achieving the SDGs, citizen science can offer a useful tool for producing localized data. A study of 139 citizen science projects on SDGs in developing countries noted that a strength of the approach is the ability to generate data using a wide range of methods in locations that are inaccessible with other methods.140 Another strength was the opportunity to involve
marginalized and hard-to-reach groups, thereby increasing their representation in datasets. However, there are several challenges, especially in the context of developing countries, such as low literacy levels; language barriers between organizers and participants; insufficient organizational capacity to run citizen science projects effectively; and poor infrastructure to support civic engagement.
Digital tools can enable inclusion and community-building among elderly population groups who often miss out on the benefits of digitalization. One example is the organization of


digital games in Vancouver, where the participation of older citizens in a citywide virtual bowling tournament allowed them to partake in activities which they would otherwise not be able to join. Crucially, the digital game helped them build new social relations that continued after the tournament.141
Another example of digitally-enabled civic engagement can be found in Berlin, where the grassroots GoVolunteer app facilitates participation in civic and social projects by listing over 1,800 volunteering opportunities.142
Public participation can also take the form of “community technology making,” which involves residents creating their owndigitalortechnologicalsolutionstourbanchallenges.This concept covers a range of formats, including hackerspaces, makerlabs, hardware incubators and fixer collectives, all of which have in common the aspiration that better urban technologies and environments can be built by their users.143
One example is Richmond MakerLabs in London, which describes itself as an inclusive “community workshop,” and offers access to various technologies, including electronics, 3D printing and laser cutting.144 “Urban living lab” is an umbrella term used for projects that seek to involve citizens
in creating tools and applications. A review of urban living labs in four European cities identified several ways in which participating citizens got involved, including measuring local environmental data, testing smart products and developing technological devices to improve local services.145 The European Network of Living Labs is the largest partnership of such urban labs and has extend its network globally (see figure 9.7). The study, however, identified as a relative weakness the exclusion of the participants from the wider governance of the smart city initiatives with which the living labs are associated.

A study of civic hackathons in European cities found that, unlike conventional hackathons which mainly cater to highskilled software developers, these civic versions tend to include a demographically and socially more diverse set of local participants.146 The main purpose of the hackathons studied was to involve citizens in analysing open data as a basis for informing how their neighbourhoods could be improved.
The question of who gets involved not just in hackathons, but also in other forms of shared technology making is critical, since too often they tend to attract predominantly male participants with pre-existing technical knowledge.147 In response, some organizers actively seek to include a diverse range of participants, thereby promoting a greater equality of gender, race and class. This also opens up opportunities for alternative visions for, and approaches to, technology making in and hacking of the smart city.
Digital tools can enable inclusion and community-building among elderly population groups who often miss out on the benefits of digitalizationSource: Battistoni
The preceding sections demonstrate that innovation and technologyharbourrisksaswellasbenefitsforcities.Frontier technologies often raise complex ethical, legal and planning issues. Automation is a case in point: while connected-andautonomous vehicles (CAVs) promise to bring benefits to consumers and society at large, there are several technical, ethical, and legal barriers to their adoption in cities.148 This includes legal challenges and ethical controversy concerning CAVs’ independent decision-making on the distribution of harm between passengers and other road users, like pedestrians and cyclists, in the event of traffic accidents. A separate concern is the potential of mass surveillance arising from the technical necessity of continuous location tracking of CAVs. Another example is public unease caused by robots deployed to patrol anti-social behaviour, such as smoking in an unauthorized area or incorrect parking of bicycles, as recently illustrated in Singapore.149 As discussed earlier, there are concerns that the automation of jobs will lead to a rise in urban unemployment and, consequently, exacerbate inequalities and strain social cohesion.
Cities, therefore, need to anticipate systemic changes and major impacts resulting from technological innovations and, importantly, be proactive about assessing and managing them. This should include addressing environmental externalities, such as resource depletion and habitat loss,
A responsible innovation approach should involve a wide range of urban stakeholders, including citizens, who can provide essential local knowledge and practice perspectives
as well as carefully considering negative socioeconomic impacts of new technology. To this end, “responsible innovation” offers a promising approach to engage a wide range of stakeholders in assessing the ethical acceptability and societal desirability of technological developments.150 Responsible innovation has been defined in relation to cities as “a collective commitment of care for the urban futures through responsive stewardship of science, technology and innovation in the present.”151
Responsible innovation goes beyond technology assessment focused on determining quantifiable risks and social impacts; it equally pays close attention to ethical questions and issues of moral ambiguity.152 It also pays heed to the possibility of unintended consequences arising from digital technology developed for one purpose subsequently being used for other purposes (for example, if drones designed to monitor traffic were used to track individuals).153 Consequently, a responsible innovation approach should involve a wide range of urban stakeholders, including citizens, who can provide essential local knowledge and practice perspectives. Such an approach should, therefore, also create spaces for the public scrutinyoftheconsequencesoftechnologicalinnovations.154 An example of a collaborative approach to shape the future of urban technology is Flying High, which focused on drones in cities (Box 9.5).
Urban actors can now consult several frameworks for responsible innovation. The Montréal Declaration for Responsible Innovation of Artificial Intelligence, launched in 2018, provides urban actors with a set of underlying ethical principles and practical guidelines for accomplishing digital transitions.155 Cities could also adopt a “technological sovereignty” approach as used by Barcelona in its Digital City Plan. Based on three principles—the use of free software; the interoperability of systems; and the use of open standards— Barcelona has attempted to lessen the dependence on global technology companies in its provision of digital services.156
Importantly,responsibleinnovationraisesessentialquestions about the social and environmental risks of urban frontier technologies and, conversely, how innovation and technology can be deployed inclusively and sustainably.

Flying High is an initiative run by the UK’s National Endowment for Science, Technology and the Arts since 2017. It brought together city leaders, regulators, public services, businesses and industry in a dialogical process of exploring systemic requirements for integrating drones in cities. Five cities and metropolitan regions Bradford, London, Preston, Southampton and West Midlands were engaged to situate the technology assessment within real-world contexts. Among participants, there was strong support for future drone use where this provided clear social benefits, such as medical deliveries, support for fire and rescue services, and the monitoring of traffic incidents. Support for commercial uses, such as parcel delivery, was more muted.
The benefits were set against several significant concerns around safety, security and privacy, with agreement that an appropriate regulatory environment would need to be established to allow autonomous flight in large numbers and over long distances. Furthermore, regulation should be undergirded by a shared societal vision of what is, or is not, acceptable, for example relating to noise pollution, safety and commercialization. Tellingly, the assessment revealed that technology developers and regulators had not previously considered involving cities in the discussion, even though the application of drones is anticipated to be concentrated in urban areas and as flight in low-altitude airspace directly impacts urban environments.
Source: Nesta, 2018.
Cities need to consider distinct risks that may arise from digital transformations, like security vulnerabilities in smart city technologies.157 Beyond technological threats, social and ethical challenges require careful consideration. One major concern is that fundamental human rights may be at stake as human activity is increasingly subjected to hyperconnectivity, datafication and algorithmization.158
Threats to human rights can arise from digital surveillance, the power of dominant digital platforms and the increasing use of AI in decision processes. In response, the notion of “digital rights” has gained traction, in an effort to integrate the smart city and its technologies with ethical principles.159 Four risks of digitalization are highlighted in Table 9.2, alongside examples of cities’ responses.
Erosion of privacy: As highlighted by the United Nations Human Rights Council, digital innovations risk eroding privacy and related freedoms, including free movement and speech160
Biases of automated and AI-enabled processes: Software developed by tech firms has been found to discriminate against people of colour, ethnic groups, or religious minorities.162
Threat of exclusion: Increasing reliance on algorithms can exclude citizens from decision-making processes, while digital and environmental divides can exclude urban dwellers from the benefits of innovation.
Data misuse: Data can get processed and analyzed for other purposes than originally intended, such as facial and number plate recognition software used to surveil citizens’ movements.
Hamburg data strategy mandates the anonymization and aggregation of data to ensure the protection of sensitive personal data.161
Helsinki has begun to compile its own datasets for training AIenabled services to avoid reliance on global software developers unfamiliar with the city’s demographic composition.163
Medellin’s smart city initiative Medellín Ciudad Inteligente complements Wi-Fi rollout in public parks and schools with digital literacy training for 10,000 residents per year, prioritizing those living in deprived neighbourhoods.164
Portland defines and justifies clear targets that data collection shall support and collects only the minimum quantity of data necessary to fulfil those purposes.165
Table 9.2: Four risks of digitalization, and examples of mitigation measures
The four risks of digitalization may be heightened in developing countries and cities for three related reasons. First, automated and digital solutions designed in developed countries can exacerbate the risks of discrimination, bias and surveillance when the technology is applied in cities in developing countries. 166Second, low- and middleincome countries may not have the necessary resources and institutions to redress inequalities arising from digital transformations, and to protect marginalized people’s rights. Third, due to a comparably weak research and development base and limited resource capacities, they risk becoming technologically dependent on corporations from the Global North.167 In order to understand the repercussions of digital innovations in cities in emerging economies, digital ethicists have suggested that bespoke impact assessments be carried out where technology developed in the Global North is to be deployed in the Global South.168 Another recommendation is to trial new tools and processes first in specified districts in emerging cities, before scaling them up to the citywide level.169
The case for low-carbon technologies is by now wellestablished: they are essential for clean energy generation and for the decarbonization of urban infrastructure systems, such as transportation (Chapter 5). Yet, their associated environmental externalities, as well as potential health risks, should not be overlooked. In encouraging the adoption of low-carbon technologies, urban actors need to be aware of negative impacts and consider how to mitigate these. Several key risks are highlighted below, while Box 9.6 discusses innovative mitigation measures from the circular economy in both high- and low-tech contexts.
Reliance on critical raw materials: According to the United Nations Environmental Programme’s International Resource Panel, an estimated 600 metric tons of metal resources will be needed by 2050 to meet the demands of additional infrastructure and wiring.170
Generation of toxic waste: Arises from both the production of low-carbon technologies such as semiconductors for photovoltaic solar panels, wind turbines and end-of-life decommissioning.171 Toxic waste management disproportionally affects citizens’ health in developing countries.172
Adverse impacts on biodiversity: The electrification of transportation and the rollout of CAVs require new types of infrastructure, such as charging stations and vehicle
depots, with the likely loss of habitat and increased urban sprawl.173 Electrification should rely on electricity from clean sources.174
Energy consumption of smart technology: There is a heightened risk of a rebound effect for ICTs, whereby energy-saving gains are cancelled out by growing consumption patterns.175 For instance, the annual energy consumption of Bitcoin cryptocurrency is higher than that of Ireland, accounting for 0.5 per cent of global electricity demand in 2018. 176
Box 9.6: Mitigation measures for environmental risks.
The circular economy offers a possible framework to address some of above-mentioned environmental risks by ensuring the responsible use of resources in cities and promoting sustainable innovation.177 An example is the Park 20/20 office complex in Amsterdam, where, following the cradle-to-cradle concept, construction materials and green technology can be dismantled and fully repurposed at the end of a building’s lifespan.178 Elsewhere, the Togolese innovation laboratory WoeLab launched the HubCité project in the capital, Lomé, to demonstrate that the circular economy is neither confined to global cities nor contingent on large financial investments. By providing technological equipment and training through two innovation spaces, WoeLab encourages residents to create collaborative hyper-local urban projects and find low-tech solutions to challenges, including waste management and recycling, in their neighbourhoods.179 In order to ensure that innovation and technological development are not pursued just for their own sake, but rather in a socially responsible manner to enable sustainable urban development, a key question to ask is to what extent do urban technological innovations result in better outcomes for residents and the environment? Moreover, technology assessment should consider the distribution of benefits and costs to determine whether certain social groups and certain places benefit more, while others bear disproportionate risks.180 This analysis matters for relations both within cities as well as between cities if the goal of urban technology is to engender equitable and just development.
The acceleration and convergence of various green and smart technological innovations are being widely witnessed in contemporary urban planning and development and are set to be a dominant force determining our urban futures. City governments and other urban stakeholders have an active role to play in deciding how innovation and technology are adapted in ways that suit specific urban contexts and benefit sustainable development. There are significant opportunities for localized approaches, given the trend towards flexible and modular technological innovations, as exemplified by micro-grid renewable energy systems and community digital platforms. At the same time, cities need to address systemic threats, such as the prospect of rising socioeconomic inequalities caused by automation and digitalization. Altogether, this highlights the need for ongoing social and institutional innovation to accompany technological developments, including investment in skills training and support for community partnerships.
The evidence presented in this chapter prompts seven key lessons for sustainable urban futures. These point to an overarching commitment to the inclusive deployment of technologyforthewell-beingofcitizensandtheenvironment and emphasize the agency of cities as hosts, initiators and implementors of innovation and technology.
City governments should utilize their convening power to foster a thriving innovation ecosystem and support locally embedded socio-technical development. This can be achieved with territorial planning, fiscal incentives and other measures to support the co-location of research organizations, start-ups, industry and social enterprises. Innovation should also be encouraged in the informal sector, mainly in developing countries, by recognizing and supporting informal entrepreneurs within the community.
Cities embedded within wider regional and national innovation systems, can act as innovators and implement technology to steer sustainable urban development. This relates to both the delivery of public services and the development and management of various urban infrastructures. The example of the Rogland region in Norway, where 11 municipalities jointly developed an integrated LED street and park lighting system using their own industrial company, illustrates cities’ role as innovators. It also demonstrates the benefits of cooperation and knowledge exchange among cities.
The likelihood of new inequalities arising from technological developments, and existing ones becoming more entrenched, requires careful attention and active intervention. There is strong evidence of digital marginalization disproportionally affecting poor people, the undereducated, women and older persons, especially, though not exclusively in developing countries. Digital labour platforms, while offering accessible and flexible work, may expose workers to precarious conditions without some regulatory safety nets. Inequalities can also arise if environmental technologies unevenly benefit certain groups of residents and neighborhoods. Conversely, some urban communities are at greater risk of environmental harm caused by technology.
Skills development and training have emerged as critical areas of action. This issue partly relates to the workforce in some formal sectors, where digitalization and especially automation are on course to make a growing number of tasks undertaken by humans redundant. Here, the example of Singapore demonstrates the opportunity for retraining and upskilling to allow workers to shift to jobs not at risk of automation. It also relates to the informal economy, where the provision of basic skills training and digital literacy are essential to enable people to use mobile Internet and microwork platforms. The deployment of digital ambassadors or technology mediators can prove useful to achieve strong community participation. Beyond work, digital skills training is essential to allow otherwise disenfranchised groups to benefit from digital services, such as telehealth care.
Connected and digital technologies offer city governments a range of opportunities to improve openness and actively engage with residents. The evidence shows that e-government is too often used merely for one-way communication, though there are flourishing examples of cites using technology more innovatively, for example with interactive apps and online platforms that allow active citizen participation. Beyond city administrations, technology can be used to strengthen civic engagement and community technology making.
Cities need to take into account negative environmental externalities when investing in various low carbon and ICT technologies. There is a significant risk of a rebound effect, whereby energy savings achieved by connected and digital technologies are cancelled out by increasing consumption. Additionally, there is particular concern about the energy intensive nature of blockchain
which is seen by many as integral to the next generation of smart cities.
given the need to weigh benefits and risks of new technology, cities should commit to undertake a
IRP,2017.
Lietal,2019;Zhangetal,2019.
OECD,2019
OECD,2019
UNHabitat,2020g.
OECD,2019c.
Rosenthaletal,2020.
JPIUrbanEurope,2022
OECD,2020d.
Schravenetal,2021
AlliedMarketResearch,2018
Jossetal,2019
Yigitcanlaretal,2021
ISO,2020.
CityofAmsterdam,2022
CityofMelbourne,2022
Tironietal,in:Karvonenetal,2019
Sheltonetal,2015
Karvonenetal,2019;Aurigietal, 2021.
Jiangetal,2020;Kitchinetal,2017
UN-Habitat,2021g.;Trencher,2019.
Cardulloetal,2019;Cardulloetal (eds.),2019;Willis,2019
Burnsetal,2021.
Martinetal,2018.
2019;Curranetal,2021
Tuckeretal,2020.
ononlinemarketplaceswherethe operatorsbringtogethervendors andcustomers.Theplatform economycreatesnewemployment opportunitiesforthosewhowork intheinformaleconomybutitcan alsomeannewdependenciesand discrimination(GIZ,2020b)
G20,2018.
Kwami,2015.
Keskinenetal,2021.
Sadowski,2020.
Barns,2020;RodgersandMoore, 2018;Repetteetal,2021.
Reuters,2021;Universityof CincinnatiLawReview,2021.
Bauriedletal,2020;Standing,2018.
68. Woodetal,2019.
69. Batesetal,2019.
70. Batesetal,2019;ILO,2019.
71. WorldBank,2016.
72. Freyetal,2017
73. VanNoordtetal,2019;Ryanetal, 2019.
74. Fernándezetal,2015.
75. WorldBank,2018c.
76. Mira-Bonnardel,2021;WEF,2021c.
77. McKinseyGlobalInstitute,2021.
78. Kunzmann,2020.
79. ILO,2019;ILO,2021b.
80. Lundetal,2021.
81. Floridaetal,2021.
82. TheGuardian,2021a;UNCTAD, 2021b.
83. IEA,2021c
84. Rachmawatietal,2021.
85. Huetal,2020.
86. Feichtingeretal,2021
87. Lundetal,2021.
88. Franketal,2018
89. Hilpert,2021.
robust technology assessment relating to ethical, legal, social and environmental aspects. The example of aerial drones demonstrates both the complexities of issues raised and the importance of cities’ involvement in assessing and regulating technological innovations.
90. Lundetal,2021.
91. WEF,2020b.
92. Axios,2019 93. GovernmentofSingapore,2021. 94. BusinessInsider,2021;Westetal, 2021 95. Bellomoetal,2020. 96. Erachaluetal,2021. 97. UNHabitat,2021e. 98. UnitedNations,2017. 99. Robinetal,2021. 100. VanDijk,2020. 101. UNCTAD,2021a 102. ITU,2018. 103. UNHabitat,2021e. 104. AjuntamentdeBarcelona,2021. 105. Mulyaningsihetal,2020. 106. VanDeursenetal,2018;VanDijk, 2020. 107. UNCTAD,2021a 108. UNCTAD,2021a 109. Mulyaningsihetal,2020;Joshietal, 2020.
110. Bakshietal,2021. 111. Stark,2021. 112. Valenzuela-Levi,2021. 113. VanDijk,2020. 114. WorldBank,2021b. 115. Mulyaningsihetal,2020. 116. VanRensburgetal,2019. 117. Joshietal,2020 118. CitiesCoalitionforDigitalRights, 2021 119. Valenzuela-Levi,2021. 120. Jakimowicz,2021. 121. WorldBank,2021b 122. Jakimowicz,2021;Cityof ChattanoogaOfficeofEconomic Development,2019;NEXTpittsburgh, 2015.
123. CityofToronto,2021. 124. CitiesCoalitionforDigitalRights, 2021;UNHabitat,2020j. 125. Robinetal,2021. 126. Riceetal,2019. 127. Sovacooletal,2020. 128. Beretta,2018 129. WorldBank,2021b. 130. Eskelinenetal,2015.
UNDESA,2020a. 132. UNDESA,2020a 133. DeFilippietal,2020.
134. Youngetal,2021. 135. Vilaetal,2018. 136. Youngetal,2021. 137. Allenetal,2020. 138. Choetal,2021. 139. CruzRuiz,2021. 140. Patemanetal,2021. 141. Schelletal,2017 142. Mos,2021. 143. Rosneretal,2014. 144. RichmondMakerLabs,2022. 145. Nesti,2020. 146. Jaskiewiczetal,2020. 147. Perng,2019. 148. Gill,2021. 149. Euronews,2021;TheGuardian, 2021b.
150. Nagenborg,2020.
151. Yigitcanlaretal,2021(citingOwen etal,2013). 152. VanLenteetal,2017. 153. Whittlestoneetal,2019 154. Calvo,2020. 155. Université deMontréal,2018. 156. Fothetal,2021. 157. Kitchinetal,2019. 158. Calvo,2020;Karppinenetal,2020 159. Calzadaetal,2020 160. UNHRC,2021. 161. Ryanetal,2019. 162. Yigitcanlaretal,2021. 163. Ryanetal,2019. 164. IrazábalandJirón,2020 165. CityofPortland,2021. 166. Arun,2020 167. GIZ,2020a. 168. Arun,2020 169. GIZ,2020a. 170. IRP,2017 171. Matatieleetal,2016. 172. Robinetal,2021 173. Goddardetal,2021. 174. IRP,2017. 175. IRP,2017;Hedbergetal,2019. 176. Ghoshetal,2021. 177. Lakatosetal,2021 178. CradletoCradleCertified,2017. 179. Agbodjinou,2020 180. Yigitcanlaretal,2021.
1. Building resilience for sustainable urban futures requires integrated linkage of the various pillars of the global sustainable development agenda.
2. Building urban resilience is a multisectoral, multidimensional, multi-stakeholder process that requires a clear change of trajectory from previous paths.
3. Effective urban resilience capacity building requires mainstreaming across local governments.
4. Governments have a roadmap to urban resilience in the global sustainable development agenda.
5. Cities, subnational governments and other urban actors should urgently prioritize bottom-up approaches when designing urban resilience interventions.
6. Building resilience requires innovative, and sustainable financing instruments beyond the traditional fiscal tools at the disposal of cities and national governments.
7. Integrated urban planning is an essential component and prerequisite for resilient urban futures.
8. Extending social protection to informal sector workers is critical for inclusive development and resilient urban futures.

9. Investing in key urban infrastructure must be a prerequisite for building sustainable and resilient urban futures.
10. Policymakers must match urban risk assessments with appropriate solutions.
11. Visioning and implementation of urban resilience plans must prioritize the poorest and most vulnerable communities.
12. Building urban resilience will not succeed without public participation.
The world’s cities find themselves at a crossroads of uncertainty as to which scenario of urban futures awaits them. Will they embark on an optimistic path of more just, green and equitable cities? Will business as usual lead them down a pessimistic path of a widening gap between the urban rich who can adapt to twenty-first century challenges and the urban poor who will suffer? Or will they nosedive into a high damage scenario of catastrophic destruction at the hands of cascading public health emergencies, climate crises and armed conflicts? While many factors influence these pathways, resilience is key to determining urban futures.
Since the World Cities Report 2020 was published in the early days of the COVID-19 pandemic, the world has become a more uncertain place punctuated by localized events with globalconsequence.Nohumansettlementwasleftuntouched by COVID-19, even with widespread, if unevenly distributed, access to safe and effective vaccines. Although many, but certainly not all, cities find themselves in 2022 figuring out how to live with COVID-19, they are now facing other shocks. Persistent and new armed conflict have acute direct impacts in cities across Afghanistan, Ethiopia, Syria, Ukraine and Yemen. Spikes in food and energy prices, as well as runaway inflation, have created new economic stresses for municipal finances and urban household budgets alike. China’s zero-COVID policy has disrupted supply chains in the world’s secondlargest economy. Meanwhile, the long-term stress of climate change continues to threaten the world’s cities as extreme weather events and climate disasters like heatwaves, wildfires, hurricanes and typhoons become more frequent and intense.
ThesufferingcausedbytheCOVID-19pandemichassetback economic and social development and undermined some sustainability efforts in the short term. Beyond that, it has exacerbated inequalities and poverty as shown in Chapters 1 and 3. The global rise in inequality since 2020 profoundly underlines the unsustainability of many current lifestyles, consumption patterns and livelihoods and thus the urgency of transitions and transformations to build resilience for more equitable and sustainable urban and societal futures.
The pandemic emerged suddenly and transformed the world dramatically through 2020 and 2021. Although recovery gathered momentum during the first half of 2022, its geographically and socially very uneven complexion, determined in large part by the availability and uptake of vaccines, means that the pandemic’s shadow will linger far longer. Indeed, the emergence and rapid global spread of the highly transmissible but fortunately less virulent Omicron variant at the end of 2021 exposed the fragility of recovery
and highlighted the highly unequal access to vaccines and people’s willingness to accept them. Recent experience demonstrate that other epidemics and pandemics should be anticipated in both emergency and longer-term sustainability and resilience planning.
The effects of COVID-19 have dramatically exposed urban fault lines and highlight that building resilience will require a stronger, more effective multilateral system capable of complementing and reinforcing national and local efforts to put the world firmly on the trajectory of sustainable development. Accordingly, the objectives of this final chapter are to offer clear policy directions for governments and relevant national, regional and local stakeholders in diverse contexts to build resilience, which lies at heart of sustainable urban futures; and to strengthen and integrate the narratives in previous chapters, presenting strong recommendations, especially regarding the complementary roles of national and local governments. The term “urban futures” is used here in recognition of the various potential future scenarios explored in Chapters 1 and 2 but equally importantly, the diverse culturally and locally specific forms that human settlements may take in the future.
In pursuit of these objectives, two key messages are emphasized through this chapter. First, that building resilience for sustainable urban development requires integrated linkage of the various pillars of the global sustainable development agenda. These are the 2030 Agenda for Sustainable Development the New Urban Agenda, Sendai Framework for Disaster Risk Reduction, Addis Ababa Action Agenda and the Paris Agreement on Climate Change. Second, buildingurbanresilienceisamultisectoral,multidimensional, multi-stakeholder process that requires a clear change of trajectory from previous paths. This approach entails more than just building back better, if doing so would occur on the same lines that perpetuate inequalities and injustice.
In essence, it is about building back differently. From this mindset, it follows that poverty and inequality are incompat ible with sustainability and resilience since they undermine the basis of urban stability and potentially the fabric of society.
The next section examines the concept of resilience in detail, but it is important here to clarify two related terms, vulnerability and adaptation. Both are used in relation to many different hazards, risks, shocks or threats, including climate change, environmental degradation, COVID-19 and other infectious diseases, economic change, political uncertainty and instability, and armed conflict. Vulnerability refers to
an inadequate ability to withstand or resist one or more of these shocks and stresses because of health status, deficient resources, or particular characteristics of an individual, group, location, infrastructure, etc. Adaptation is how individuals or groups respond by changing behaviour, such as making new investments, adjusting building standards, relocating facilities or creating early warning and rapid response systems in order to increase their ability to resist, cope with and otherwise learn to live with the hazard or risk in question.
Although resilience is key for cities to move toward the optimistic scenario of urban futures laid out in this Report, the term itself deserves consideration. Resilience, like sustainability, has a complex history and is often used imprecisely and with diverse meanings in different communities of practice and contexts, even within the urban arena.1 This imprecision is unhelpful both analytically and in terms of implementation. Indeed, despite their distinct meanings, sustainability and resilience are often conflated or used interchangeably, including in some documents of the global sustainable development agenda.2
It is noteworthy that, despite mentioning resilience a total of 17 times, the New Urban Agenda does not define the concept, which implies an assumption that its meaning is clear and universally understood. Yet this is certainly not the case since the proliferation of definitions and widespread lack of clarity regarding measurement of resilience “leads to crippling disconnects.”3 Particularly in urban contexts, which are the main focus here, this can be problematic. One difficulty is that some narrow definitions of sustainability focus principally on increased resource efficiency, perhaps even excluding social justice and equity (including intergenerational equity), even though these have been central to sustainability discourse since at least the Brundtland Commission report in 1987.4 Such narrow uses of sustainability lead to the reduction or elimination of one key dimension of resilience, namely redundancy,5 which is fundamental to recoverability.
Early formulations of resilience—as reflected in the Global Report on Human Settlements 20116—were framed in terms of the ability to withstand and recover from an external shock and were popularized by the phrase “bouncing back.” Following criticism that bouncing back meant restoring the
previous status quo, regardless of how unequal and unjust it was, the requirement of progressive changes to reduce poverty, inequity and injustice was added more recently.7
Anaddeddifficultyisthat,likesustainability,resilienceisoften considered to represent stability or equilibrium. However, that implies rigidity and a lack of flexibility to change and adapt as the environment and other circumstances change. Even dynamic equilibrium implies more flexible stability within certain boundaries, which may be appropriate for natural ecosystems or even farming systems, though even there the evidence shows that the severity of shocks and recovery time are not clearly related.8 In social sciences and in urban contexts, which are entirely human artifacts, dynamic equilibrium fails adequately to capture the major rethinking and restructuring now required.
It is important, therefore, to define and use these terms clearly and consistently. Accordingly, here urban resilience is framed as coping with and recovering from a shock by “bouncing back differently” to emphasize the need for substantive change in view of the urgency of meeting the various targets of the SDGs by 2030 and attaining net zero emissions by 2050 at the latest. Many relatively simple and low-cost adjustments, such as equipping streetlights with LED bulbs, have already been widely made, so there are often fewer low-hanging fruit left to pick in the transition to urban sustainability and resilience.
As the IPCC9 and other authoritative recent reports10 have warned starkly, progress to date has been inadequate. In order to increase the rate and scale of change needed to achieve these objectives, incremental progress is no longer sufficient andmoresubstantiveurbantransformationsarenowrequired.
The rest of this chapter explores this imperative in greater detail, disaggregating the concept into its economic, social, environmental and institutional elements for greater clarity and precision. This builds on the approach refined by UN-Habitat in recent years: “Both the UN-Habitat and the ‘just sustainabilities’ approaches to urban resilience look beyond the natural environment, and take in other dimensions such as long-term, participatory in-situ slum and infrastructure upgrading, relocation to improved sites, institutional development and building both awareness and local capacity to respond and adapt.”11
Urbanresiliencecannotbeachievedinisolationfromresilience ofthewiderterritoriesandsocietiesofwhichurbanareasform integralelements.AstheCOVID-19pandemichasunderlined,
this requires both a holistic perspective on resilience and effective multi-scale collaborations and integration. National border closures affected urban populations, while citywide lockdown measures had impacts on national economies. In areas like food systems, reliable regional logistics were essential to maintaining food supplies during the crisis.12
In these respects, it is also pertinent to reiterate the key messagesfromtheWorldCitiesReport2020,whichhighlighted in detail the various dimensions of the value of sustainable urbanization, the urgency of tackling climate change, and the importance of using the New Urban Agenda and Sustainable Development Goals—especially Goal 11 on sustainable urban areas and communities—as accelerators.13 As the recent IPCC and other reports cited above indicate authoritatively, the urgency has only increased over the last two years, with the continuing ravages of COVID-19 in urban areas underscoring the structural vulnerabilities and need to build resilience:
The pandemic has also put cities to the test, revealing that even apparently affluent and highly developed urban centres are only as resilient as their most vulnerable areas and communities. Furthermore, COVID-19 has highlighted the urgent need for inclusive access to services and amenities for all urban dwellers: all too often, the current emergency has only made more visible the profound inequalities in health, housing and income that divided many cities long before the pandemic began.14
Upscaling ambition to move from incremental urban transitions to substantive urban transformations—and to bridge the gap between bold city visions and coherent programmes of actions to achieve the objectives15—is therefore essential in order to achieve the optimistic scenario of urban futures. In practical terms, however, it is essential to understand, measure and operationalize urban resilience gaps and strategies in relation to the relevant administrative
boundaries. These are usually the individual local government unit, although in large cities this is likely to be the strategic citywide or metropolitan authority. Increasingly, however, it is recognized that planning should be multiscalar and include the scale of the city region, embracing the surrounding peri-urban and rural areas comprising the functional region integral to the city for food, resources, waste disposal, travel to work and the like. To be effective at this scale requires multilevel governance, both horizontally among local government units but also vertically, between national, regional and local levels.16
Various initiatives have sought to provide comprehensive approaches to resilience planning through integrated and territorial programming and scorecard methodologies. These include the City Resilience Program, a partnership between the World Bank and Global Facility for Disaster Reduction and Recovery, launched in 2017 to “catalyse a shift toward longer term, more comprehensive multidisciplinary packages of technical and financial services, building the pipeline for viableprojectsatthecitylevelthat,inturn,buildresilience.”17 There is also the proprietary Plan Integration of Resilience Scorecard, which has recently been applied comparatively to two contrasting modest-sized cities in the US.18
Arguably the most sophisticated, relevant and widely deployed measurement schema to date is the City Resilience Index (CRI) developed by Arup for the Rockefeller Foundation’s 100 Resilient Cities programme (which disbanded in 2019) as a tool for measuring implementation of the City Resilience Framework (Box 10.1).19 Given the index’s comprehensiveness, all the themes in this Report are represented by a dimension or goal in local combinations, and it is to more detailed consideration of the economic dimension that this chapter now turns.
The CRI was intended for all member cities to adopt and implement as a tool for measuring progress towards overall resilience over time. Represented by a circle, the CRI comprises four dimensions: health and well-being; economy and society; infrastructure and ecosystems; and leadership and strategy. Each of these, in turn, has 12 goals subdivided into a total of 52 indicators designed to capture the many complementary elements of resilience (Figure 10.1). The four dimensions correspond well to the components of resilience examined in the successive sections of this chapter.20 The extent to which the CRI had been implemented by the time of the programme’s end in mid-2019 varies, but some examples are given in later sections of this chapter.21 A key part of the process has been aligning local strategies with locally relevant elements of the global sustainable development agenda, especially the SDGs, although only a proportion have so far done this explicitly.22
Dive
n
oo
nt
Eff e


Urban economic resilience refers to the ability of a city’s economy to withstand and recover from turbulence and shocks (Chapter 4). However, in view of the foregoing discussion in Section 10.1, it is essential not just to focus on economic activity as such, but to incorporate poverty reduction and more equitable distribution of economic opportunities and rewards as key characteristics. Only by so doing can the socio-spatial disadvantages and constraints facing the poorest and weakest residents be tackled. In other words, economic justice is an essential component of economic resilience. Similarly, the multidimensional nature of poverty and inequality, as examined in Chapter 3, means thatthesealsoconstitutesocialandenvironmentalchallenges that are dealt with in the respective sections below.
An optimistic version of the post-pandemic24 and climateresilient era, which this Report seeks to assist local governments in achieving, requires a different structure and balance of urban economic activities, driven increasingly by renewable energy, circular economic activity and green employment. Chapter 4 notes that the need for economic diversification and structural transformation has never been more urgent because of the multiple crises confronting cities. Economic diversification and structural transformation safeguard urban economies against future shocks and provide a more stable and progressive path toward inclusive growth. The pandemic underscored the risks of depending solely on a single driver such as tourism or mining, since any economic downturn could have catastrophic and lasting impacts on the urban economy. As we move into the future, cities should pursue policy measures that enable economic diversification, such as smart urban regulations, strategic investment incentives, green infrastructure development, skills training, innovation districts, and enterprise support and finance, particularly for small and medium-size enterprises —which are the engine of most economies. Collectively, these measures create competitive and vibrant cities that can turn around the economic fortunes of urban areas and more easily adapt to unanticipated changing dynamics.
Economic diversification requires urban leaders who are forward-looking and strategic in formulating policies that strengthen urban economic resilience and prioritize building of productive urban futures that work for all. The COVID-19 pandemic is a wake-up call for both cities and subnational governments on the importance of developing economies
The pandemic underscored the risks of depending solely on a single driver such as tourism or mining
that can withstand and recover from multiple crises while at the same time moving towards equitable and inclusive growth. In cities that are experiencing urban shrinkage, economic diversification should be accompanied by proactive broader economic policies and programmes, with targeted economic restructuring that is aimed at strengthening the competitiveness of new and emerging sectors (most notably knowledge-based industries) in line with the current and future economic realities. As the world moves towards the 2030 deadline to achieve the SDGs, policymakers at all levels cannot afford to remain indifferent to the fragility and vulnerability of urban economies to unanticipated shocks and crises, which can potentially reverse development gains accrued over the years.
Earlier concerns that economic greening would cause large-scale job losses and impose a heavy economic price have now been allayed by the growing evidence that such losses are more than compensated for by the increasingly diverse productive and commercial opportunities required to enable the green transition.25 Although some declining or “sunset” industries continue to resist change, the majority are switching production increasingly into green, recyclable and renewable commodities and energy systems through a mixture of fiscal measures and straightforward profitable opportunities as the scale and rate of the green shift accelerate (see below and Chapter 5).
Additionally, increasing net employment, which often includes considerableinformalincome-generatingopportunities,isbeing generated by new construction to comply with green building codes and the retrofitting of existing homes, industrial and commercial premises with insulation, low-energy lighting and renewable energy generating facilities, as well as installation and maintenance of green roofs and walls. The same applies

Economic diversification requires urban leaders who are forwardlooking and strategic in formulating policies that strengthen urban economic resilience
at the neighbourhood and urban scales with installation and maintenance of green-blue infrastructure to reduce urban heat island effect, increase water runoff retention and grey water recycling, and enhance other nature-based solutions and urban biodiversity. All of these are important areas for appropriate local government leadership and collaboration with other stakeholders to leverage complementary investment and maximize a sense of shared ownership.
Alongside improvements in efficiency of space and resource utilization, increased productivity, wages and employment conditions are important, since “[s]ustainable urbanization and productive cities go hand in hand. In seeking to enhance the economicvalueofurbanization,effortsshouldbemadetoensure that economically productive cities are also environmentally sustainable, resilient, socially inclusive and safe.”26
Research increasingly emphasizes the importance of understanding enhanced productivity not just in conventional terms but very much as an integral component of holistic urban sustainability. One recent conceptual urban productivity framework comprises the different categories of capital—natural, socio-cultural, human, economic and physical—which should be addressed by means of systemic thinking, equity, justice, co-production, governance and regeneration, all of which are values consistent with the
integrated perspectives of this Report.27 Although not yet tested in detail, this approach appears to hold promise.
10.2.2. The circular economy as a frontier for resilient urban futures
The COVID-19 pandemic is a tipping point that proves the need to adopt the circular economy as an alternative model of resilient and sustainable urban futures, with the potential for unlocking significant social, economic and environmental benefits (Chapter 4). In some contexts, cities were already experimenting with the concept of circular urban economies to promote economic resilience in their urban systems. For instance, London, Paris and Amsterdam were already champions in adopting circular economies to reposition their cities to emerging trends. Such initiatives have the potential to generate new green jobs offering decent work. The effort of individual cities is boosted by the broader European Green Deal, which aims to make Europe the first climateneutral continent, while ensuring that no one is left behind in the transition. It is important, however, to note that the transition to a circular economy must be carefully planned, considering different factors such as social, economic and political dynamics in each country. There is no one-sizefits-all approach to this transition; each city has a unique urban ecosystem and therefore any repositioning of the local economy should factor in local contextual factors.
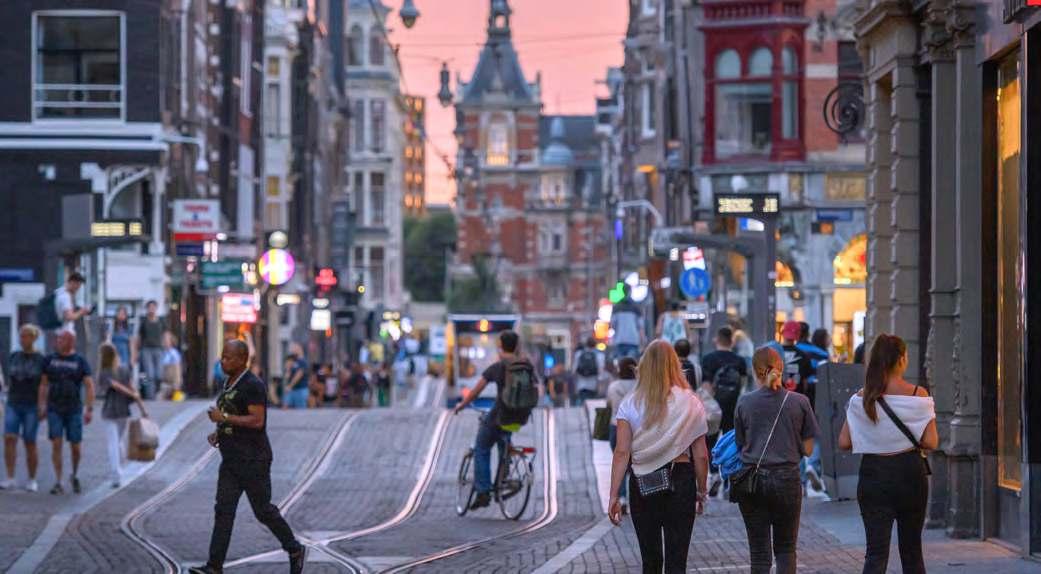
A resilient and inclusive urban future hinges on a transformative and just urban economic agenda, which must be driven by policy and programmatic support for the informal sector, particularly in developing regions.
Going forward, city and national governments should make urban policies and plans inclusive by recognizing the contribution of the informal sector to urban economies. The pandemic and other crises have exposed the stark vulnerabilities and structural impediments that continue to undermine the productivity of the informal sector in the absence of tailored support measures. Therefore, a critical element of the transformative urban economic policy is targeted support for informal activities by means of
A critical element of the transformative urban economic policy is targeted support for informal activities by means of appropriate interventions
appropriate interventions to address specific vulnerabilities and insecurities of income and livelihood that undermine the resilience of such activities. This also constitutes an effective way for local governments to reduce poverty and promote economic justice for some of the most vulnerable economically active urban residents, especially women, young people, migrants, refugees, and disabled participants, among other vulnerable groups (Chapters 3 and 4).28 In many cities, informal traders and entrepreneurs are still stigmatized, while their activities are often criminalized and subjected to hostile and repressive urban policies and practices, all of which make it difficult to earn a living in a dignified manner (Chapter 3). Spatial restrictions—often enacted at the behest of formal shopkeepers fearful of being undercut by alleged unfair competition—also preclude them from the areas of highest footfall and should be removed. Any relocations should be carried out only after substantive participatory discussions and negotiations with those affected, as explained below.
Underlying such restrictions are outdated beliefs that informality is somehow inherently bad, inappropriate, parasitic or at odds with modernity. Such views are characterized by the pessimistic scenario of urban futures discussed in Chapter 1. In practice, the informal sector is very diverse, with most actors being poor, often unskilled or only semi-skilled, and trying to earn a livelihood with whatever means they have in a situation of widespread
poverty and unemployment. Some activities are gendered, reflecting cultural norms and values in different situations.
Municipal interventions to improve informal economies includeestablishingmoreandinclusivelegitimateworkspaces, facilitating the integration of informal economic actors in urban and regional supply chains and markets, upgrading facilities and improving sanitary and health conditions by building covered markets and manufacturing workshop hubs with suitable water and related infrastructure, and providing access to shared or hired equipment. Even well-intentioned interventions may have the same unintended negative effect if these facilities are located away from main thoroughfares, bus depots, rail stations and interchanges, which is where potential sales and client accessibility are highest. Sanitation andhealthfacilitiesandregulationsshouldalsobeappropriate to the nature of the diverse forms of informal enterprises to encourage and facilitate improvements and upgrades instead of forcing them out of business or displacing them. These measures should also consider the heterogenous nature of informal businesses so that their specific needs and priorities are adequately addressed.
Any such new facilities and regulations need to be designed and constructed in consultation with the informal or small entrepreneurs on a participatory or co-design basis so that their requirements can be met, and the process can provide a foundation for developing more positive working relations. Indeed, a helpful way to achieve this is to regard informal enterprises as one category of micro-enterprises. Small, affordable user charges for services that informal traders
Municipal interventions to improve informal economies include establishing more and inclusive legitimate workspaces
feel are appropriate and helpful can help to offset municipal costs. These practical guidelines conform to the principles of good practice for inclusive local economic development within integrated urban planning developed by UN-Habitat.29 In addition to these measures, it is prudent for governments to accelerate the implementation of ILO recommendation 204 towards formalization of the informal economy to tackle the mounting decent work deficits and structural constraints that confront informal sector workers.30
This integration should be done in the spirit of social dialogue to create a win-win situation so that the economic fortunes
and productivity of the informal economy can be boosted and their contribution to thriving urban economies enhanced. The transition to formalization should be backed by a combination of different incentives which might include increasing access to social security for business owners and their workers and to businessservicesandpublicprocurementforformalizedmicro and small enterprises. These policy measures should be locally contextualized and based on the prevailing social, economic and political circumstances in each country. Moreover, such a transformative urban economic policy agenda requires significant political will on the part of elected officials at the national, subnational and local levels.
Building resilience and productive urban futures is not an automatic process; it requires innovative, resilient and sustainable financing instruments
At the urban level, local governments generally face increasingly severe financial constraints (Chapter 4). Building resilience and productive urban futures is not an automatic process; it requires innovative, resilient and sustainable financing instruments beyond the traditional fiscal tools at the disposal of cities and national governments. The pandemic has reinforced the need for cities to diversify their revenue portfolios outside traditional property taxes and other related municipal rates and charges. Green municipal bonds represent a growing tool for leveraging the scale of capital required for major new green and circular investment schemes to promote sustainability and resilience. Examples range from specific green-blue infrastructure to financing of neighbourhood efficiency and resilience programmes like retrofitting and district heating or combined heat and power. Gothenburg, Sweden’s second city and industrial hub, was the first to launch a municipal green bond in 2013 and now has a robust framework for such instruments.31 In April 2021, Ghaziabad became the first Indian city to issue a successful municipal green bond to fund a water treatment plant to turn wastewater into drinking quality and to extend the piped water network. Kanpur, Agra and Varanasi, also in India, intend to follow Ghaziabad’s example and issue such bonds as well.32 In these contexts, enhancing infrastructural reach and reliability represent important programmes to meeting basic needs securely and achieving the relevant SDGs as contributions to overall urban sustainability and resilience.
The municipal green bond concept has proven increasingly popular in diverse contexts where local governments have the financial autonomy, legal power and creditworthiness
The municipal green bond concept has proven increasingly popular in diverse contexts where local governments have the financial autonomy, legal power and creditworthiness to issue bonds, and the ability to avoid unaffordable debt overhangs.Localgovernmentsattractedtosuchopportunities should examine their legal ability to do so and, if necessary, seek legislative changes to provide them with the necessary powers or at least basis for offering legal surety as a key prerequisite for bond raising. In order to increase funding available to cities more generally and systematically, clear arguments for a green cities development bank have been articulated but, to date, have not been acted upon.33
Cities and subnational governments should create enabling environments for effective and sustainable public-private partnerships (PPPs) to finance ambitious urban infrastructure projects, particularly in contexts where public resources are limited. PPPs are becoming a popular mechanism to fund large scale infrastructure investments as these are critical for building resilient urban futures. As noted in World Cities Report 2020, and reinforced in the current Report, cities and national governments cannot do this alone; there is the need to unlock private sector financing through the creation of incentive schemes that attract the participation of private sector players in urban programmes. Additionally, as the World Cities Report 2020 points out, the value of sustainable urbanization cannot be achieved without improving municipal financial mechanisms.34 Yet, improved municipal finance alone will not provide an adequate basis for achieving economic resilience. Diverse innovative fiscal incentive schemes are being developed and implemented to promote these changes and to promote climate and disaster risk resilience.
These schemes can operate at different scales. At the household and firm level, local governments should provide municipal grants for retrofitting homes with insulation and installation of renewable energy sources (such as rooftop solar panels).35 Water and sewerage companies, can offer service discounts for properties with rainwater harvesting facilities and permeable surfaces to encourage rainwater infiltration, as available in the UK. Poor households and communities, including those in informal settlements, can access a growing range of individual or neighbourhood/ community-level micro-loans or grants to develop enterprises
and undertake neighbourhood risk reduction activities that also enhance public health as proactive interventions.36
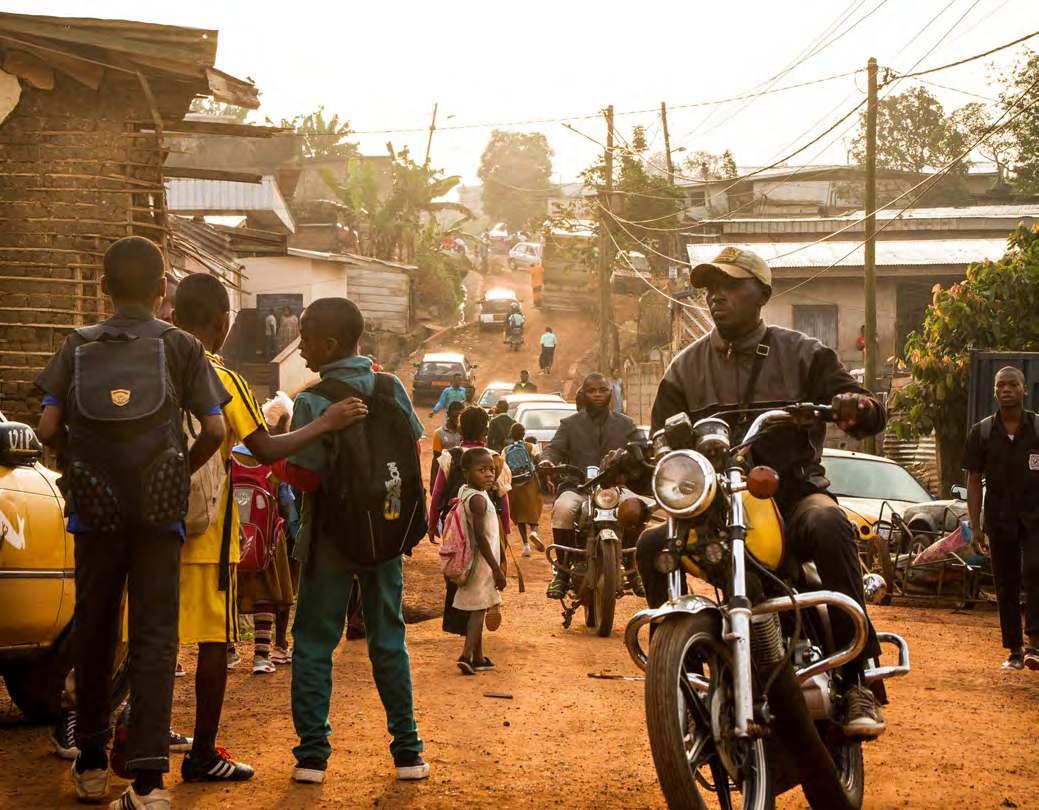
For urban areas to achieve the optimistic scenario, investing in key urban infrastructure must be a prerequisite for building sustainable and resilient urban futures. The current infrastructure investment gaps are a huge impediment for building thriving and productive cities in both developed and developing regions. For example, if cities and subnational governments prioritize investments in public transport systems this could generate more economic benefits, particularly for the poor urban residents whose access to jobs is affected by socio-spatial segregation.
Cities should prioritize extending basic infrastructure and services to underserved communities as this could have citywide transformative impacts. For instance, current projections reveal that that a dollar invested in developing water and sanitation infrastructure generates between US$4 and $34 in benefits by improving health outcomes, saving times, and boosting urban productivity.37 If such incremental gains are realized the current negative trends could be reversed and action will be galvanized towards building inclusive, thriving, resilient and productive urban futures in sync with SDGs and the New Urban Agenda. If national and local governments fail to urgently tackle the current underinvestment in infrastructure, this could undermine urban economic resilience and negatively affect the productivity of cities.
As explained in Chapter 3, the multidimensional nature of poverty and inequality necessitates comprehensive cross-sectoral approaches. These represent urgent shortto medium-term interventions as essential prerequisites for increasing ambition towards urban transformations to sustainability and resilience.
TheCOVID-19pandemichasunderlinedtheinterdependence betweenindividualandpublichealth,withthehighlyunequal epidemiologicalpatternsofmorbidityandmortalityreflecting underlying urban socio-spatial inequalities (Chapter 7). In essence, the built environment has a clear impact on health outcomes. Poorer people, who are more likely to have weaker nutritional and health status, tend to live disproportionately in housing and neighbourhoods that have poor or inadequate infrastructure, public open space, and other amenities and services. Such vulnerabilities also have age, gender and other intersectional dimensions. Hence, context-specific interventions are required to safeguard vulnerable and marginalized urban groups (Chapter 4). The importance of extended family structures, wider social cohesion, and the extent of social and cultural capital can also be crucial factors in mitigating such effects.38
National and urban governments have responded in diverse ways; those acting most effectively at first have often been those with recent experience of epidemics like SARS and various strains of bird influenza. Previous experience meant that they had early warning and rapid response capacity as well as important aspects of resilience. In terms of postCOVID-19 recovery, inclusive and integrated policies are requiredthatbothtackletheimmediateneedsandsymptoms, and the deeper underlying bases of poverty, inequality and inadequate infrastructure and services in a way that balances socioeconomic rights to achieve social justice.39
As we move into the future, cities, subnational governments and other urban actors should urgently prioritize bottom-up approaches when designing urban resilience interventions and in key urban programming. At-risk communities must be placed at the centre of decisions that impact their lives so that new opportunities for tackling urban poverty and inequalities can be unlocked. The failure to prioritize at-risk urban communities means that the 2030 agenda of leaving no one behind will not materialize.
The most successful strategies to create social resilience are likely to combine three elements: neighbourhood-scale interventions to improve physical infrastructure and basic services; necessary upgrades to sub-standard dwellings; and responsive social protection schemes tailored to household requirements. The current COVID-19 pandemic provides an opportunityforgloballeaderstorethinktransformativeurban policies and programmes that can radically tackle poverty and inequalities in all its forms and dimensions. The 2021 UN-Habitat report Cities and Pandemics: Towards a More Just, Green and Healthy Future advocates for a “new social contract” in the form of universal basic income, universal health coverage and universal housing and basic services. This new social contract challenges cities and subnational governments to re-imagine what public and social goods they should deliver and under what conditions. At the same time, the pandemic has exposed the gaps in social protection, given the disproportionate impact of COVID-19 containment measures on some of the most vulnerable groups in cities.
Urban-sensitive social protection schemes are potentially, a powerful tool to redistribute wealth, address income inequalities and tackle multiple vulnerabilities that affect the most marginalized groups (Chapter 1). Some social protection schemes, like universal basic income schemes and affordable health insurance, are normally national government responsibilities, although some devolved federal or similar systems provide health insurance at the regional level. Cities and subnational governments should design tailored social protection interventions for informal workers. Extending social protection to informal sector workers is critical for inclusive development and resilient urban futures. Governments at all levels should design policies and programmes to support the formalization of informal businesses and enterprises with access to social protection; extending statutory coverage to previously uncovered workers; adapting benefits, contributions, and administrative procedures to reflect the needs of informal workers; and subsidizing contributions for those with very low incomes. Doing so will ensure livelihood and income security, especially when faced with economic disruptions and other external shocks and stresses.
Cities, subnational governments and other urban actors should urgently prioritize bottomup approaches when designing urban resilience interventions and in key urban programming
In designing social protection interventions for informal sector workers, cities and subnational governments should consider gender-related risks since women and other vulnerable social groups bear the brunt of economic hardships and vulnerabilities associated with informal work. Moreover, resilient, and equitable urban futures could be realized if governments ensure access to subsidized basic services for the most vulnerableurbanhouseholdsandensureaccesstoadequateand


affordable housing for all. Cities and subnational governments should formulate tailored strategies that respond to different form of vulnerabilities. Social protection interventions should be nuanced and wide-ranging to ensure the different risks and vulnerabilities associated with gender, age, ethnicity, migratory status, and other characteristics are effectively identified and tackled in urban welfare programming.
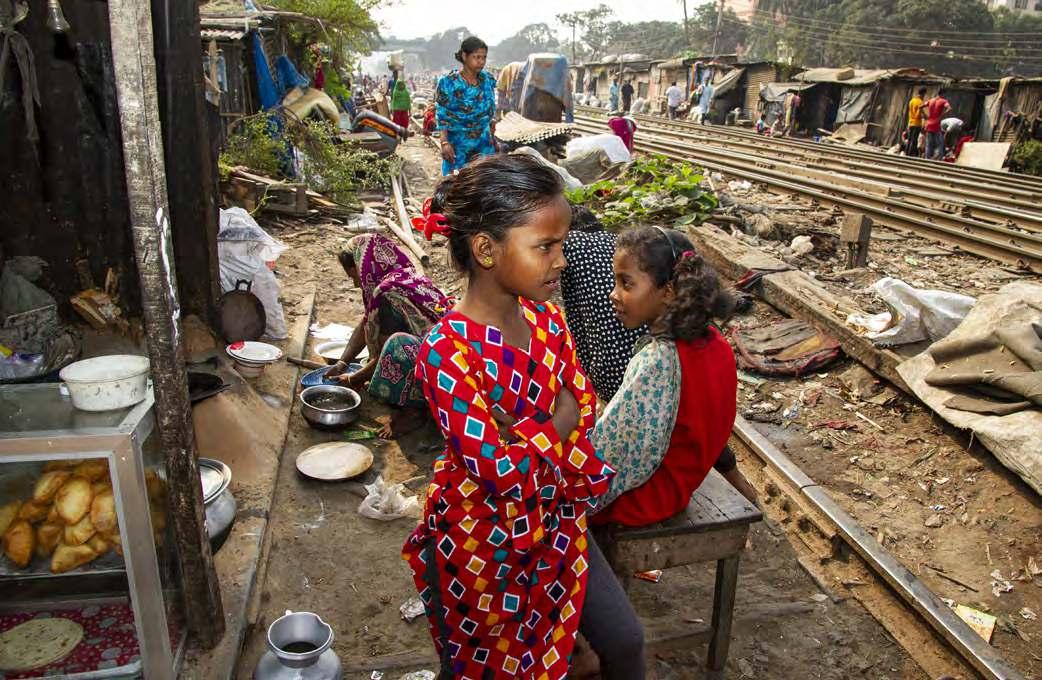

Integrated urban planning should be an instrument for promoting social and spatial integration and inclusion, especially by improving access to all areas within the city and its territory. Greater connectivity means that all inhabitants, including the poor, marginalized, displaced and migrants can benefit from the socioeconomic opportunities, services, public spaces and other facilities in a city, and contribute to its social and cultural life. Integrated urban planning also protects and values all elements of cultural heritage, not just in a backward-looking sense but, crucially, in terms of how contemporary cultures, identities and heritages can play valuable roles in promoting locally appropriate urban sustainability and resilience.40
Neighbourhood or larger scale municipal interventions to foster behavioural change, reduce vulnerability and promote well-being can include brownfield redevelopments and design of mixed housing areas in new developments to avoid social and economic segregation that reinforce disadvantage and undermine resilience of the most vulnerable social groups. Beyond basic infrastructure
and services, access to appropriate green space is also an important element of well-being.41
Although not cited explicitly as an objective of integrated urban planning guidelines, social and cultural resilience is indeed an outcome of their appropriate implementation by strengthening geographical proximity between residential, livelihood and social activities. Proximity in line with the principles of the 15- or 20-minute city enhances residents’ sense of belonging to a neighbourhood or district, improves quality of life and reduces economically-based residential segregation across metropolitan areas. These benefits also constitute a key element of the social equity and justice dimension of urban sustainability and resilience.42
Notwithstanding the assertion by some critics that urban sustainability and resilience are often used almost synonymously, as discussed earlier, the following quote from UN-Habitat is explicit that the attributes of environmental sustainability are likely to facilitate integration and resilience: “Environmentally sustainable cities are likely to be more productive, competitive, innovative and prosperous. These cities are able to draw a healthy balance between economic growth and the environment, in the process facilitating integrated development and resilience.”43
One fundamental and inescapable characteristic of cities and urban systems is their complexity, especially in terms of the human environment and the relationships and interactions that underpin them. While cities are human artefacts, their health, sustainability and resilience are critically dependent on these relationships. Indeed, they may be conceived as complex social-ecological-technical systems.44 Accordingly, much attention now focuses on fostering nature-based solutions and ecosystem services as essential to reducing urban heat island effect, controlling pests, reducing rainfall run-off and erosion, increasing food production, and making cities more liveable and just for all inhabitants.45
As research into the impacts of the COVID-19 pandemic has recently shown, green and public open space is inequitably distributed across the urban fabric, with the poorest, most densely populated areas generally least well served and having access to far less land per person. The logic of urban greening and environmental improvement, particularly to enhance environmental justice and equity, might therefore seem indisputable. However, initiatives to restrict land
uses or to increase green and blue space are often highly controversial and can be hotly contested by different stakeholders, particularly when other land uses might be regarded as having higher values or greater importance, not least for livelihoods and homebuilding by and for the poor. Spatial, social, economic and environmental justice issues must therefore be taken fully into account as part of integrated transformative urban planning.46
This section highlights two areas of intervention shown by increasing volumes of recent research to be important in promoting environmental resilience as part of integrated strategies, namely investing in green-blue infrastructure, and in sustainable renewable and cleaner energy.
The concept of green infrastructure, used to denote the use, expansion and conservation of parks, riverbanks and other wetlands and green open spaces within urban areas on account of their ecosystem services, has been widened to green-blue (or blue-green) infrastructure (GBI) in recognition of the intimate interrelationships between landbased and aquatic biodiversity. Treating both green and blue natural systems as essential elements of environmentallyfriendly infrastructure respects the fact that vegetation and waterways often weave integrated networks through an urban area. This lens facilitates planning and sustainable utilization, as well as the enhancement of biodiversity.
Conversely, a lack of coherent planning and clear, transparent governance (including over land) leads to fragmented outcomes and loss of green spaces—up to 80 per cent in the case of Kumasi, Ghana, from 1991 to 2019.47 The rapidity of changesingreenspacecoverageandcomposition—whichare effective proxies for biodiversity and environmental value— has been widely documented in different contexts, including through use of a comprehensive assessment methodology using remote sensing and GIS in Chinese cities.48 With appropriate interventions as part of integrated planning, this coverage and quality can increase, as illustrated by detailed studies of drivers and processes—including the political dimensions involved—in Shanghai and the Australian cities of Canberra, Melbourne and Sydney.49
With the frame widened to GBI, the positive effect can be further amplified, especially if participatory and co-productive processes are used to convince water users of the benefits in terms of improved water and riparian quality.50 Until recently, research and policy on GBI was concentrated in North America, Europe and Australasia, but has become almost
universal since its importance for climate change mitigation, adaptation and resilience has become widely appreciated. Pertinentwell-documentedcasestudiesincludetheEbroDelta and Empordà in Spain, New York’s Staten Island Bluebelt, Seattle’s Thornton Creek Water Quality Channel, the Serra do Mar project in Baixada Santista Metropolitan Region (Brazil), ecosystem-based adaptation in Cape Town and Singapore, the Gazelle Valley Park Conservation Programme in Jerusalem, and Transforming for Life in Medellín.51 A recent review has found some commonalities—such as a persistent focus on individual categories of green space—but also national and regional differences in terms of the extent, uses and development approaches towards such infrastructure across Latin America, Africa and Asia.52
Governance arrangements for GBI are evolving with international assistance through bilateral and multilateral initiatives. Global city networks are building awareness and enhancinglocalcapacitytoutilizeeffectivelythetoolsafforded by international treaties and conventions on biodiversity protection and enhancement. In fact, city collaborations and city networks involving the environment have grown rapidly and constitute the largest share of such networks globally.53 In addition to global networks such as C40 Cities and the Global Resilient Cities Network, smaller and regional research and learning networks have proved valuable (Box 10.2).
A set of globally applicable core principles for GBI has been distilled by combining conceptual issues with lessons from the available case study literature. GBI should be multifunctional; needs to be connected (as opposed to comprising isolated pockets); integrate green, blue and grey elements; and have multiple scales; while it is developed through strategic, inter- and transdisciplinary processes that are socially inclusive and reflexive.55 These features are explicit so that they can serve to integrate GBI spatially and in governance terms with other sectoral resilience agendas on poverty, inequality and justice.
As energy quite literally drives or enables all facets of human settlements, having equitable access to adequate clean and sustainable energy is fundamental to achieving overall urban sustainability and resilience. What makes energy clean and sustainable comprises two closely related dimensions, namely the fuel source of the energy and the nature of the supply infrastructure in relation to actual and suppressed demand. Debates over the unsustainability of finite, non-renewable and polluting fossil fuels use are well known, and the nature of alternatives will be discussed below, but urban planning for an optimistic future scenario must take account of recent developments in renewable energy generation that enable different and more resilient supply infrastructures. Already
ICLEI Africa’s Urban Natural Assets for Africa Programme ran from 2014–2020 as an excellent example of a regional GBI learning network across Addis Ababa, Cape Town, Dar es Salaam, Lilongwe, Kampala, Kisumu, Entebbe (Uganda), and Nacala and Quelimane (Mozambique). This network shared understanding and experience about rivers, coasts and overall resilience, augmented by access to current international thinking and practice.
The fundamental objective was to promote “human well-being and climate resilience by integrating nature-based solutions into land-use planning and decision-making processes.” It operated through very reflective and adaptive learning and knowledge exchange mechanisms that enabled the tailoring of experience elsewhere and principles of good practice to local contexts through co-production processes. In turn, the participating cities shared their practices and lessons, while ICLEI helped disseminate these practices regionally and globally, hence enabling bidirectional cross-scale knowledge sharing.
Key findings included that identification of appropriate decision-making entry points was inadequate. Instead, cities needed to embark on continual learning, knowledge production and critical reflection as part of a fundamental reorientation of planning processes away from expert knowledge towards co-design and co-creation. Innovative learning and exchange formats, including games and interactive exercises, proved important devices for achieving this goal by helping to level the power dynamics and other differences among participants. For instance, the network brought land-use planners and environmental officers in Lilongwe City Council in Malawi together across departmental silos to share perspectives and explore their conflicting disciplinary and professional rationalities around these issues.54
in 2009, the UN-Habitat report Planning Sustainable Cities identified the potential in this regard of decentralized systems:
Decentralized energy production systems offer a number of benefits, including energy savings, given the ability to better control power production, lessen vulnerability and achieve greaterresilienceinthefaceofnaturalandhuman-madedisaster (including terrorist attacks). Clever integration of these small systems within a grid can be achieved with new technology control systems that balance the whole system as demand and supply fluctuates. A number of such small-scale energy systems arebeingdevelopedtomakecitiesmoreresilientinthefuture.56
Most major cities are taking leading roles in seeking to meet the Paris target through ambitious emissions reduction targets
Over the 14 years since that was written, progress has been remarkable, driven by growing urgency, the increasing obsolescence of older fossil fuel power stations, rapidly growing demand for electricity through population growth, rising incomes, and the vast expansion of electronic equipment and now also electric vehicles. Technical progress and the plummeting cost of photovoltaic (solar) panels, wind turbines of different scales, and early commercial tidal energy installations are all playing important roles in the rapid and impressive increases in renewable energy capacity around the world, even in countries that appear to favour fossil fuel industries or minimize the climate change threat. Given obsolescence and capacity constraints facing conventional national or regional energy grids and the scale of investment required to address these, urban distributed and decentralized energy systems for climate-resilient, post-COVID recovery are vital elements of resilient urban futures.57
Globally, the International Energy Agency has now charted a clear pathway towards net zero by 2050, demonstrating the importance of a portfolio of energy sources and supplies, underpinned by a rapid transition out of fossil fuels to the range of renewables and appropriate financing funds to assist developing countries and promote energy justice at different scales.58 These issues are also addressed substantially in Chapter 5. By contrast, commitments at COP26, including the agreement to curtail methane emissions and a doubling of financial assistance, provide a first but insufficient step in this direction. Most low- and middle-income countries, along with some high-income countries, strongly favour

substantial increases in the voluntary Nationally Determined Contributions to emissions reductions. However, some large emittersandmajorfossilfuelproducersresisted,andthesum total of Nationally Determined Contributions announced will not reduce temperature increases over pre-industrial levels below 2.4–2.7°C, a considerable and damaging amount way short of the 1.5°C Paris target.
Most major cities are taking leading roles in seeking to meet the Paris target through ambitious emissions reduction targets, increasingly as part of integrated strategies embracing mitigation and adaptation as transformative commitments to sustainability and resilience. City networks, including UCLG, ICLEI, C40 and the Global Resilient Cities Network, are playing leading roles in generating collective will and sharing good practices, as is the biennial One Planet City Challenge run by WWF Sweden on behalf of WWF International.59 Cities not already engaged in global networks of local governments for climate action should no longer sit on the sidelines if they wish for their city to achieve the optimistic scenario for urban futures, as these networks support and encourage individual mayors and top officials, who can make a real difference individually in their respective cities’ agendas in bridging the gap between vision and action.60
In urban contexts, the importance of strategic assessments of energy systems and greenhouse gas inventories as the basis for concerted action is now well established.61 A series of recent studies of macro-metropolitan São Paulo also identifies the many political constraints and contradictions impeding successful energy transitions, and what further potential exists.62 Suchissuesexistalmostuniversally,notleastinterms of vested interests contesting the basis or rate of transition to sustainable and renewable energy, although the changing economics of renewables is starting to prove a game changer.
Moreover, the new opportunities presented by the surge in renewables are particularly important as old power plants are retired and efforts to expand affordable access to electricity among the poor and in underserved localities increase. Combinations of off-grid, local mini-grid and on-grid solutions are now possible, though sometimes limited by regulations. Scalability is also very important, so that individual households, community organizations and firms in many countries can invest affordably to generate some or all of their own electricity. Depending on the precise technology, this can either be stored for use at night or sold to the grid. Donor agencies, NGOs and community-based organizations are also funding innovative schemes to install power in informal and low-income settlements that are not
connected to the wider urban grid. As mentioned above, such investments are important because of their economic and social dimensions, in terms of employment creation and impact on reducing poverty, inequality and ill-health. While some schemes are grant-based, others require affordable repayments over a stipulated period, with repaid funds sometimes being recycled into new loans on the principles of a rotating credit scheme.
This potential to fill gaps in grid coverage and provide affordable renewable energy constitutes a key element of poverty reduction and health improvement as part of an integratedurbansustainabilitystrategy.Thesetypesofenergy also avoid the safety and health risks, as well as emissions, associated with use of kerosene, paraffin, candles and firewood in extremely low-income households. In situations where electricity grid supply is unstable or unreliable, having off-grid or local mini-grid supplies may be more reliable and sustainable, as well as resilient. Citywide rooftop solar schemes, such as in Palmas, Brazil, are demonstrating the scalability of renewable energy and various co-benefits.63 Access to alternative sources and supplies also provides the redundancy that is an important component of resilience. As older solar panels come to the end of their working lives or need repair, issues around the right to repair—which could provide many new semi-skilled employment opportunities— and the growth of a new form of e-waste also need to be considered.64
10.4.3 Raise awareness of different local urban risks and identification of feasible disaster prevention and preparedness
Sustained research on chronic hazards and longer-term climate change risks facing different groups of residents and localities within urban areas have informed urban risk profiles. Many local governments have undertaken comprehensive vulnerability assessments and established disaster risk reduction and climate change mitigation and adaptation strategies, including early warning systems for floods, landslips and droughts. Awareness and preparedness raising exercises appropriate to the particular contexts are important, so that residents know where to obtain reliable and up-to-date information and how to respond to the various categories of emergency.
In Shimla, Himachal Pradesh, India, for instance, the local authority, with assistance from ICLEI and 100 Resilient Cities, has formulated comprehensive landslide and earthquake disaster and resilience strategies, with public engagement. In BuenosAires;Malmö,Sweden;andSheffield,UK,attentionhas
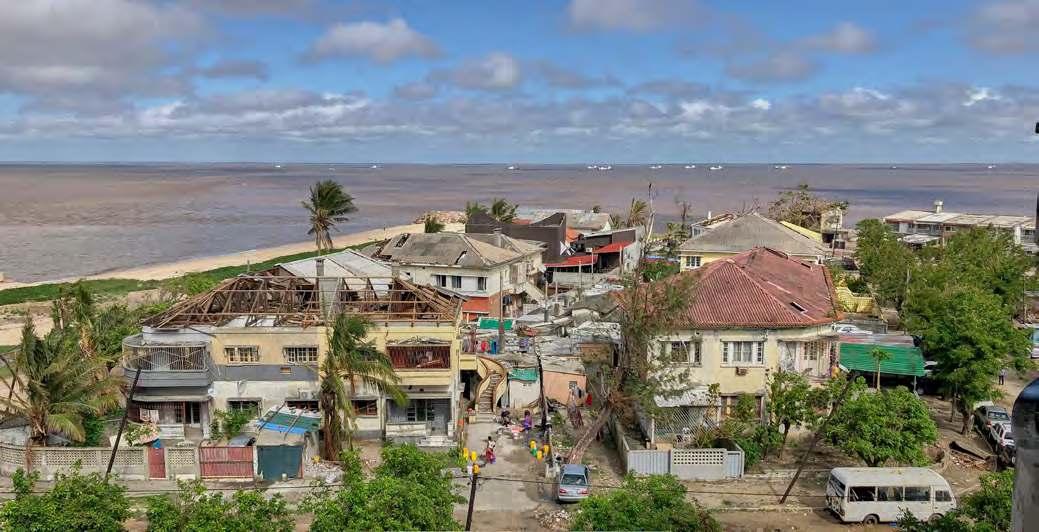
focused principally on flood risk, with imaginative awareness raising strategies and mitigation strategies including a shift from traditional hard engineering solutions towards naturebased solutions and ecosystem services such as restoring and expanding riverine vegetation and floodplains, as well as enhancing run-off retention and water infiltration of the soil.65 Particular issues often arise in respect of informal settlements and their inhabitants, where legitimate community-based organizations play important roles in mapping, data collection, negotiations and providing mutual assistance.
A key requirement for effective, integrated citywide planning and resilience building—which is discussed more broadly below—is that it should promote socio-spatial and economic equity. This means explicitly including areas and social groups facing particular vulnerabilities and high risks, most of whom are relatively and often absolutely marginalized and impoverished,livingininformalhousingandsurvivingthrough informal economic activities (Chapter 3). Informality exists universally but in many developing countries it characterizes substantial segments of the built-up area and population.66 These planning processes must be seen as legitimate among slum and informal settlement dwellers, many of whom are only too aware of the chronic daily risks and hazards of their lived experience but also lack the resources to resolve them independently. A vital step to promote such policy legitimacy
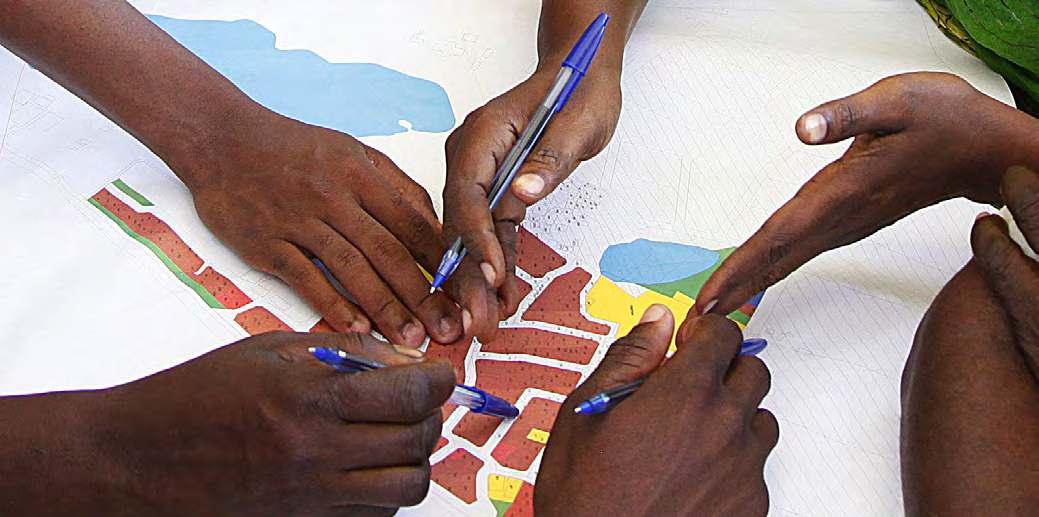
and remove a major source of vulnerability among the most marginalized groups is for local governments to cease the still widespread use of demolition or eviction (Chapter 3). Rather than literally being planned out of urban areas, such areas should be planned into towns and cities through the inclusive and equity-promoting policies advocated here.
A wealth of experience has been built up through community-based initiatives worldwide, using diverse approaches but generally through shared labour and selfhelp processes, childcare and education enterprises, rotating credit and collective savings schemes and the like. During high-risk periods, wardens or lookouts can watch for approaching floods, impending landslips, storms, firestorms and other hazards to provide early warning to residents. Many of these modest initiatives—sometimes supported by external NGOs—provide elements of resilience that can be enhanced and integrated with wider multisectoral urban programmes if trust and collaborative relations with officials and the planning system can be developed (Chapter 8). This will take time and goodwill on all sides, which underlines the value of multistakeholder engagement, making use of skilled external facilitators and demonstrating to residents that their knowledge and experiences are valued alongside those of other, more powerful groups and professional planners. Many participatory and co-design, co-creation and co-production techniques have been developed in diverse urban contexts worldwide to help foster such processes.67
The Know Your City programme of the Federation of Shack and Slumdwellers International (SDI), in collaboration with United Cities and Local Governments of Africa, is well-established and engages residents as citizen scientists to map and collect data on their neighbourhoods as the basis for negotiations and collaborations to provide and upgrade services and infrastructure and improve disaster risk reduction capacity and resilience (Chapter 6).68 Ideally, individual neighbourhood initiatives should be “joined up” so that drainage and stormwater improvements are accompanied by enhancements to pathways, access routes and other infrastructure, including water supply and sanitation, to make them more resilient to storms, floods, fires and other locally important extreme events.
Such initiatives have provided an important basis for rapid interventions during the COVID-19 pandemic to raise awareness and improve emergency or more durable facilities for handwashing and related personal hygiene and sanitation measures to prevent or slow contagious spread of the coronavirus in high-density areas with inadequate facilities.69 These, in turn, point to longer term interventions required as part of upgrading and integrated planning initiatives to promote public health and environmental resilience in such areas (Chapter 6).

Informal and formal low-income dwellings can be made more resilient to heavy rain and flooding through improved roof overhangs, rainwater harvesting and strengthened footings to protect the base of the walls. Resilience to heat and cold can be enhanced through cost-effective ceiling insulation, perhaps accompanied by affordable and appropriate energy generation through solar water heaters, as demonstrated by the Kuyasa scheme in Cape Town, to maximize co-benefits.70 Reducing fire risk in homes constructed from flammable materials like wood, cardboard and plastic, particularly because many inhabitants also rely on open fires, candles and paraffin or kerosene for cooking and heating, is also crucial to promoting resilience at this scale.
Such interventions have been documented and supported through other initiatives, as well as the Asian Coalition for Community Action, and collaborative efforts in and with informal settlement dwellers from Buenos Aires to Kisumu to addresscommunityprioritiestoreducefloodrisk,vulnerability, water and sanitation and other sources of daily and climate change vulnerability and to build resilience. These initiatives are crucially important in engaging active participation and, in some cases, co-design and co-creation with residents and other beneficiaries. This generates buy-in and community
sense of ownership, while reducing alienation or dependence. The quality and adequacy of the schemes may vary but local ownership might make them more durable and encourage maintenance beyond what conventional local government interventionsgenerallyachieve.Ultimately,itisimportantthat these are not seen as purely filling gaps or as substitutes for official action, but that they become integrated with the latter as part of comprehensive urban planning and action to build holistic, multistakeholder and cross-sectoral urban resilience, as elaborated on in the next section.
Informal and formal lowincome dwellings can be made more resilient to heavy rain and flooding through improved roof overhangs, rainwater harvesting and strengthened footings

The UN-Habitat Global Report on Human Settlements 2007, focusedonthethemeofhumansafetyandsecurity.Eventhen, the report’s scope included extreme events and disasters in terms that remain both valid and important today. Specifically, the report underlined the key message that governance structures and processes are only as good as their weakest component: “Disasters reveal the resilience and capacity of governments. The performance of infrastructure is a reliable indicator of how well public agencies are doing their jobs. Similarly,theperformanceofdepartmentswithingovernment, as well the performance of leaders, is deeply revealing of the strength and character of public institutions.”71
Put differently, this means that the sudden and severe shocks that constitute disasters, rather than the performance of ordinary daily functions, show how effective, efficient, flexible and responsive governments and their capacities are. Whereas rigid, bureaucratic and unaccountable systems usually falter when faced with substantial emergencies because they tend to alienate rather than involve or have the confidence of most inhabitants, more flexible, efficient, wellorganized and responsive systems often have preparedness and can respond in a timely fashion. At the same time, it is important to bear in mind that resilience cannot be created by economic resources and wealth alone. Above all, there is no substitute for good governance.
AsthisReporthasdemonstrated,knowledgeandunderstanding of different natural and anthropogenic hazards, risks, vulnerabilities and how to build capacity to mitigate, adapt and resilience has grown immeasurably over the last 15 years. However, even where sufficient political commitment and resourcing exist, there remain substantial implementation and capacity gaps. A large recent international study of some 200 cities revealed little evidence of just sustainability principles yet having been implemented on the ground.72
The rate and scale of climate change, as well as our understanding of its impacts, have also increased over the interveningyears,withtheresultthattheurgencyandnature of adaptive transformations now required to achieve just and sustainable urban resilience are commensurately greater. This transformation can only be achieved with greater resolve and commitment by all government institutions, including local government leaders.
Climate change, pandemics, sustainability and resilience are classic examples of “wicked problems,” a concept in planning and policy that refers to problems difficult or near impossible to solve. Given that scale of challenge, no level or tier of government—nosingleministry,departmentoragency—can address them alone. Indeed, all must collaborate effectively. The necessity of this level of collaboration underpins the entire global sustainable development agenda, particularly the SDGs and the New Urban Agenda, because of the difficulty in tackling multidimensional poverty, inequality and vulnerability.73
Establishment and operation of effective and efficient multilevel governance requires clear divisions of labour, powers, responsibilities and resources among national and subnational government entities.74 It also requires multistakeholder collaboration among government institutions,privatefirms,civilsocietyandotherNGOs,higher education institutions and the like. Collaborative governance also builds confidence and trusting relationships. Indeed, early optimism on this score regarding urban governance in the few years after the COP15 summit in Copenhagen was subsequently replaced by greater pragmatism.75
Effective multilevel governance may be difficult to achieve, particularly in situations where cross-scale relations are historically fraught or complicated by authoritarianism, lack of transparency and/or political rivalries when different parties or interest groups control the respective levels of
government institution. Moreover, changes in political control, particularly when combined with strong executive power vested in a president, regional minister or executive mayor,canchangedynamicsrapidlyandevenreverseprevious gains and thus undermine resilience directly or indirectly. This reality highlights the importance of engaging proactively with the politics of climate change and resilience, including both sharpened contestations and innovative collaborations and coalitions to exploit and develop areas of common interest, as well as everyday politics by those outside the corridors of power, especially informal community-based institutions of the poor and marginalized.76
Since the funding and revenue cuts, and increased demands on, urban local governments triggered by the 2008-9 global financial crisis, the ability of European cities to innovate and govern economic change and social challenges has depended largely on the existence of supportive multilevel governance.77 Another important cautionary example is provided by the fate of climate change measures and progress with emissions reduction and decarbonization under successive Brazilian presidents. Important gains during the first decade of the 2000s have subsequently been undermined and reversed through a combination of political resistance, bypassing regulations, direct legislative change, and the weakening or closure of specialist institutions.
This experience applies equally to collaborative multilevel governance and the role of urban institutions, with climate changeandresilienceagendasmainstreamedacrossallmandates rather than being the preserve of specialist departments or institutions. One important strategy for tackling policy volatility across local electoral cycles and reducing the vulnerability of localgovernmentprogrammestochangesinnationalorregional policy is to seek cross-party agreement on the importance of urbansustainabilityandresiliencesothatmeasuresimplemented during one cycle are consolidated and built upon in subsequent cycles rather than reversed. This type of institutionalization of resilience policy has been done successfully in countries with proportional representation electoral systems where governance usually takes place through coalitions, particularly in Scandinavia, but such broad agreements can be achieved even under other systems if the respective leaderships accept the importance of doing so.
Effective multilevel governance may be difficult to achieve, particularly in situations where cross-scale relations are historically fraught or complicated by authoritarianism


Local governments, especially in urban areas, are on the frontline of addressing climate change and COVID-19 and having to reduce vulnerability and enhance resilience. Yet they frequently suffer from longstanding shortages of personnel, resources and implementational capacity relative to their legal mandates and responsibilities, let alone to address the substantial and substantive transformational changes now required. The most common challenges are a lack of local revenue raising ability and heavy dependence on central and/or regional governments for disbursements, and additional tasks and roles being assigned to local government without appropriate funding—sometimes referred to as unfunded mandates.78 This may reflect inadequate central government revenues or political centralism that means that allocated resources are not transferred to lower tiers of government.
The phenomenon of unfunded mandates has been widespread during the COVID-19 pandemic, when local governments have been called upon to intervene in diverse ways. The weakened fiscal capacity of cities and subnational governments, which in turn affects their capacity to tackle persistent and emerging urban challenges is indicative of the disastrous scenario of urban futures described in Chapter 1. Even many historically well-funded local governments in OECD countries have suffered successive financial cuts since the financial crisis (Chapter 4); the larger Nordic cities are notable exceptions.
Fundamentaltoovercomingthissituationaretwogovernance requirements. The first is to clarify an appropriate balance of complementaryroleswithrespecttoclimatechange,disaster riskreductionandresiliencebuildingacrossnational,regional and local governments. The second is to reach an equitable resolution of the mismatches between the powers, roles and responsibilities of urban local governments on the one hand, and their resourcing on the other. This may be very difficult to achieve in strongly centralized and authoritarian systems. If internal democratic pressure is inadequate, international agencies or city networks might be able to help facilitate dialogue and some form of national debate or consultative mechanism to assist national governments to find the means to address and meet international conventions or agendas to which they have signed up.
The most appropriate solution will also differ according to local circumstances, such as existing institutional capacity of local governments of particular categories and their ability
to raise revenue locally from property, vehicle and/or local income or sales taxes, service provision, and sale of utilities such as water and electricity. The higher the proportion of total revenue that can be raised locally, the greater the level of de facto autonomy a local government will have, the better it will be able to develop and implement coherent strategies, and the more responsive it can be to local priorities and hence accountable to residents. Therefore, these solutions should be promoted; some can be addressed by local governments alone, but most will require multilevel governance negotiations since they affect divisions of labour and resources among them.
10.5.3. The role of new technologies in steering urban resilience Technologies continue to evolve very rapidly, creating new potentialstoaccelerateurbanchangeandtransformationsbut also new challenges about their appropriateness to diverse contexts and their wider impact on equity, justice and wellbeing (Chapter 9). This is the essence of the social dimension in socio-technical approaches and the understanding of cities as socio-technical-environmental systems.79
The rapidity of technological evolution can make it difficult to judge appropriateness in the short term, as cost, availability andaccessibilitycanchangeovertime.Twogoodexamplesare solar panels and mobile phones. Initially they were expensive as well as required supporting infrastructure, installation and maintenance capacity that rendered them accessible mainly to the elite and middle classes in large cities. However, dissemination and technological refinement have been rapid, even in low-income countries, with the result that both are now widely available and accessible at affordable cost, so that both now make important contributions to resilience at individual, household, neighbourhood and hence urban scales. (Solar panels were discussed earlier.) Mobile phones connect traders to customers, provide access to instant market information from different locations, facilitate maintenance of social contacts among family and friendship networks, enable money transfers cheaply at a distance, enhance personal safety, assist female entrepreneurs to overcome gender barriers and can be a source of early warning of impending extreme events and disasters.
Many historically wellfunded local governments in OECD countries have suffered successive financial cuts since the financial crisis
Related developments in digital technologies also facilitate citizen science and community mapping as part of participatory and co-productive neighbourhood upgrading and planning negotiations, which is consistent with the idea of civil technology (Chapter 9).80 Networked data sensors and closed-circuit television cameras measuring air quality, traffic and pedestrian flows and many other elements of urban metabolism, as well as antisocial behaviour and crime, are increasingly integral to environmental monitoring and mobility management to cut airborne pollution, congestion and ultimately promote urban sustainability and resilience.
However, as noted in Chapter 9, the equity and justice dimensions to such technological deployments are often overlooked. Who benefits and who suffers when constraints and monitoring are introduced? There are costs and benefits of, for example, traffic detours through neighbouring streets when pedestrianization schemes are introduced or policing abettedbytechnologicalsurveillance.Similarissuessurround the enthusiasm for smart cities, which are often held up as the future of urban sustainability but which, to date, are largely high-tech and high cost in ways that encapsulate
many elements of unsustainability and exclusion, particularly of the urban majority and poorer developing countries. This has prompted efforts to embrace open data and opensource technologies as part of community involvement as mentioned above. Social aspects of smart city living are also now receiving more attention, with Tampere in Finland, for example, adopting a more citizen-focused phase after their initially strong technological emphasis.81
Carbon capture and storage represents another controversial potential example, where, as a result of greater urgency and technological progress, perceptions are shifting from it being unrealistically expensive and large-scale to having possibilities at different scales. However, this could thus become a mechanism for extending or perpetuating business as usual approaches based heavily on fossil fuel combustion rather than accelerating transitions to renewable energy. In this context, the importance of transforming privatesector business models to align with urban sustainability requires a change in underlying parameters of added value and how private costs and benefits are calculated relative to externalized social costs and benefits.82
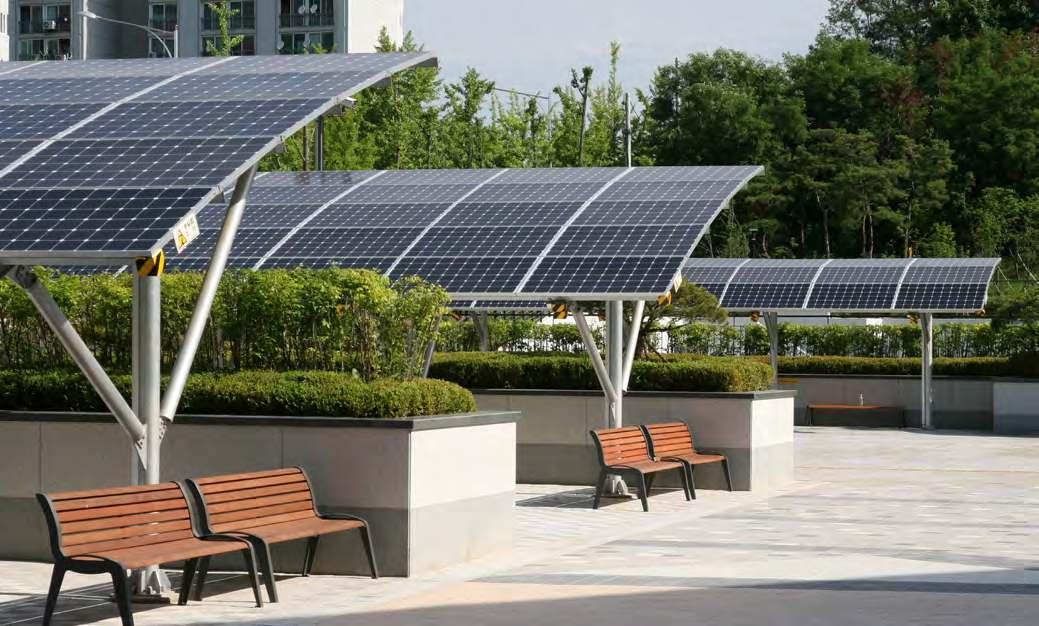


Integrated urban planning is an essential component and prerequisite for resilient urban futures. Sometimes called “joined-upplanning,”itrequiresbringingtogetherthevarious sections or departments of a local government to discuss and negotiate their respective priorities, proposals, plans and associated budgetary needs into an overall framework that also includes a spatial or territorial dimension so that the entire urban area can be addressed coherently and the whole becomes more than the sum of the respective sectoral and
Integrated urban planning is an essential component and prerequisite for resilient urban futures
locality-specific parts.83 Apart from the missed opportunity of such added value, failure to integrate at the city or city regional scale risks contradictions and gaps between various locality and sectoral plans, and may even increase vulnerability. A city region embraces the functional urban area, which is larger than the urban built-up area. This is more useful in terms of resource flows and sustainability, as well as transport and mobility planning, but adds complexity as such regions include peri-urban and some rural areas.84
In simple terms, this helps to avoid a situation where individual departments prioritize development or rehabilitation work in different localities or in the same locality at different times. Such situations lead to inefficiency, greater disruption and cost, and suboptimal outcomes. Instead, effective coordination means that the various elements of infrastructure, buildings or services are designed, delivered or upgraded together. This approach maximizes complementarities and efficiency. The number of cities undertaking such exercises is increasing,partly through the catalytic role of international membership organizations, though Cape Town has been working on disaster risk reduction and climate change mitigation and adaptation at the city scale for over a decade, gaining invaluable experience that bears out the arguments being made here.85
Holistic urban resilience requires that proactive responses to climate change, pandemics and disaster risk are mainstreamed into the annual and multiyear workplans and design standards of all departments, and not undertaken as an extra bolt-on to other work or concentrated in one
Holistic urban resilience requires that proactive responses to climate change, pandemics and disaster risk are mainstreamed into the annual and multiyear workplans and design standards
specific department. In turn, this requires effective forwardlooking design and planning frameworks that factor in local forecasts of future climatic, environmental and public health conditions so that infrastructure, buildings and services are built or retrofitted to appropriate standards to withstand best estimates of conditions that will prevail over the coming decades. The New Urban Agenda provides appropriate parameters and guidelines for this.86
Urgent direct attention is required to change the form and function of existing urban areas to promote comprehensive sustainability and resilience (Chapter 5), just as new urban construction needs to accord with the latest design principles, construction techniques and sustainable materials in any given context to avoid locking in unsustainability for decades to come. This is essential to integrate the economic, environmental, social and institutional dimensions of resilience within the urban fabric.
One key element of this is the imperative to rethink urban land-use and transport systems and requirements in order to reorganize large, mainly single-use and mobility-based urban areas into more nucleated, 15- or 20-minute cities or communities (Chapter 6).87 They embody the step changes needed to match the scale of our looming challenges but have yet to be retrofitted or tested in practice outside a few recent model smart city neighbourhoods that are not likely to be widely replicable. Ironically, perhaps, there will be greater potential to upgrade and modernize infrastructure and facilities without large-scale redesign and reconstruction of the built environment in older, central areas of cities and towns in some low- and lower-middle-income countries where multifunctional land uses have survived from the colonial era. In some high-income countries, inner-city neighbourhoods often retain mixed land uses and have integrated infrastructure like district heating and integrated transport systems, enabling them to function both as 15- or 20-minute districts and as integral parts of the larger city.
A crucial example of the kind of reorientations of thinking and urban design required to make such step changes in practice is provided by recent research into the relationships between residential densities and construction materials. The longstanding conventional wisdom has
been that maximum urban efficiency in terms of land use, infrastructure and service delivery is provided by increasing residential density through fuller ground coverage and especially more extensive vertical development—high-rise, high-density development. This perception, however, has been based largely on the operational costs and efficiency of buildings after construction. When the full life cycle of buildings is considered, including construction materials, actual construction processes88 and subsequent operation, the picture changes considerably. Instead, high-density, low-rise urban designs are optimal in terms of minimizing life cycle emissions and maximizing population capacity.89 When social dimensions and overall liveability are taken into account, the arguments against maximizing residential density as an objective in and of itself become even stronger.
Only a full life cycle approach is entirely compatible with achieving urban sustainability and resilience. This should certainly be a medium-term objective, though it will require considerable preparation in all but the bestresourced and capacitated local governments. As with 15or 20-minute cities or neighbourhoods, detailed practical experiments are still awaited but the concept should serve as an invitation to experiment.
The language and terminology, as well as available technologies and our understandings of climate change interactions with the built environment and the implications, continue to evolve. However, the essential message about comprehensive change being essential was already identified by UN-Habitat in 2009: “While greening buildings, developing renewable fuel sources
and creating more walkable communities are critical elements of the sustainable city, investing in viable, accessible transit systems is the most important component for them to become resilient to waning oil sources and to minimize the contribution of urban areas to climate change.”90 While there has been undoubted progress in many towns and cities, including on renewable energy and decarbonization, the urgency is now even greater. Modest, incremental changes are no longer adequate; instead, more ambitious and comprehensive transformative adaptations— sometimes referred to as adaptive transformations—have now become essential.
10.5.5. Building required capacity for sustainable urban futures
Examples of how integrated planning capacity and frameworks can be developed as part of initiatives led by international city networks are provided by Buenos Aires and Cape Town, which took advantage of their membership in the Rockefeller Foundation’s 100 Resilient Cities network to formulate their city resilience strategies (Box 10.3). Rather than being top-down efforts that were externally driven by the global network, these were both essentially internal municipal undertakings, using their considerable internal skills and capacities to bring together the various previous fragmented and sectoral policies and strategies, updating and adapting them for coherence at the same time to fit into the integrated framework, and amenable to monitoring in terms of the City Resilience Index.91 The examples in Box 10.3 demonstrate how local governments in diverse contexts can formulate comprehensive resilience strategies, whether framed by the CRI or other tools.
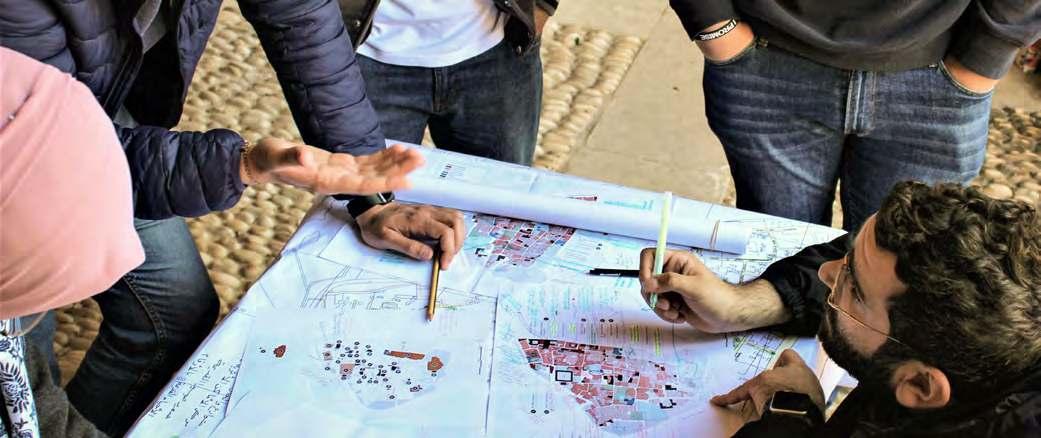
Some 70 per cent of Buenos Aires’ population live in one of 11 stream basins crossing the city, with about 25 per cent vulnerable to extreme flooding. This feature constitutes the principal environmental and climate change risk in the metropole, resulting from modification of and encroachment into the riverine zones, along with most of the water flows having been piped. The Rockefeller Foundation’s 100 Resilient Cities initiative stimulated the city’s resilience strategy, which is focused around four key issues of becoming a green city, an integrated city, a city of opportunities and a safe city. These key issues are intersected by three crosscutting themes (a metropolitan perspective, citizen participation, and a digital city), all supported by five pillars: diversity, gender and co-existence; innovation, talent and opportunities; environment and sustainability; social and urban integration; and security and risk management.92
Cape Town also regularly faces heavy flooding in low-lying, high-density areas, including informal settlements, as well as cyclical droughts and water shortages. Recognizing the challenges of climate change, it had previously formulated policies and plans on a sectoral basis, with separate mitigation and adaptation strategies. These have now been integrated and organized thematically, along with other dimensions of resilience-building that take account of financial constraints and the unique local environment, which underscores the importance of introducing ecosystem-based adaptation.93 An important feature of Cape Town’s City Resilience Strategy is its explicit alignment with relevant SDGs to facilitate internal monitoring and external reporting, including by means of the city’s new Voluntary Local Review process.94
While not a city network member, Gothenburg, Sweden’s second-largest city and industrial hub, with a population of over 500,000, has developed and implemented many comprehensive sustainability, climate change and resilience policies and programmes. It too faces flood risks in lower-lying central river and canal environs and associated backfill areas, exacerbated by a combination of urbanized hard, impervious surfaces and a soil type that inhibits water infiltration, thus generating runoff. As a Swedish pioneer of climate change action, it undertook thorough studies of vulnerability and risk, including from extreme weather in the first decade of this century. These plans are currently being updated to reflect changing conditions and urban priorities as well as national environmental standards. This work is also being geared to addressing the key challenges of resource consumption and climate change; residential and social segregation between immigrant minorities and the rest of the population; and steering urban growth with the vision of Gothenburg becoming a climate-smart and resilient city with limited environmental impact.95
All these reasonably progressive examples, however, have been compiled and are being implemented by means of principally internal top-down and technocratic processes, with limited public engagement or participation, let alone co-production. Levels of citizen awareness, let alone buy-in or senses of shared ownership, are therefore limited, as is the planned role for citizens in implementation. This illustrates one key area in which the important capacity of residents is not yet being adequately mobilized or harnessed, if at all, so that overall resilience is unlikely to be maximized. It is therefore recommended that appropriate training for local government officials and experienced facilitators be utilized as they are often important in bringing together and building common ground among diverse and sometimes historically antagonistic stakeholders.96 The following section provides some pointers to how this might be successfully addressed in terms of realistic transformative ambitions.
The human impacts on the planet and on the future of human development are now inescapable.97 The importance of the current context of unprecedented uncertainty and global societal challenges—climate/environmental change, pandemics and epidemics, economic restructuring, human security and the like—cannot be ignored. Yet, exploiting the uncertainty to delay action will only exacerbate the rate, scale, difficulty and cost of subsequent action required to tackle climate change and transform urban areas for sustainability and resilience. Instead, as world leaders reaffirmed at the United Nations Framework Convention on Climate Change summit in Glasgow in November 2021, the time to act, and act decisively, is now.
This urgency applies equally to local governments, and is key to achieving the optimistic urban future first outlined in
Chapter 1. Urban futures can go in any number of directions and the duty of urban actors is to steer our cities toward the most optimistic future, as outlined in the Sustainable Development Goals and the New Urban Agenda. Cities can continue on an unsustainable path of widening income inequality, worsening air quality, continuous urban sprawl, and growing slums and informal settlements that do not provide safe, adequate housing. Or they can change course and chart the path of well-planned, managed, and financed cities that create better becomes for all of their residents, including the most vulnerable.
In pursuit of the optimistic scenario for urban futures, it is helpful to reiterate the key messages of this chapter:
The global sustainable development agenda, comprising the 2030 Agenda for Sustainable Development, the New Urban Agenda, Sendai Framework for Disaster Risk Reduction, Addis Ababa Action Agenda, and Paris Agreement on Climate Change, provides a coherent framework for integrated, multilevel action that recognizes the importance of subnational entities, particularly local governments, in meeting the challenge. As the lead United Nations agency for human settlements, UN-Habitat’s flagship biennial World Cities Report provides dispassionate guidance for decision-makers and planners at all levels based on evidence and lessons from around the world. Following the 2020 Report on the value of sustainable urbanization, the current Report focuses on how to build resilience for sustainable urban futures in the context of the COVID-19 pandemic, accelerating climate and environmental change, inequality and poverty, and armed conflict.
The current Report focuses on how to build resilience for sustainable urban futures in the context of the COVID-19 pandemic, accelerating climate and environmental change, inequality and poverty, and armed conflict
The COVID-19 pandemic has had profound impacts on urban areas worldwide, with their extent and severity reflecting a complex mixture of socio-cultural and demographic and health characteristics intersecting with inequalities within the built environment. The Omicron variant has demonstrated the ability of new mutations to behave very differently from previous ones, being far more transmissible but, for vaccinated people at least,
less virulent. Whether it, together with increasing if still highly unequal vaccination rates, will provide the basis for mass immunity against future variants remains unknown. A high degree of uncertainty in this respect remains.98 However, the implications of what we already know about COVID’s urban epidemiology are clear and reinforce the urgency of concerted action to tackle multidimensional poverty and inequality, and to improve the urban fabric in poor neighbourhoods. Only by tackling the underlying conditions that foster the spread and heighten the impact of COVID-19 and other pandemics and epidemics, will comprehensive urban resilience that incorporates social justice be built. This does not require a dedicated programme in addition to all existing investment programmes. However, it does demand accelerating the pace of transformative actions to increase overall sustainability and resilience substantially.
Initiatives to build comprehensive urban resilience must therefore be forward-looking, proactive, and inclusive of all stakeholders, including the marginalized and poor. They must also be integrated rather than sectoral or piecemeal. In other words, they should be multisectoral, multidimensional and multi-stakeholder—and about building back differently, not just building back better along the same lines that perpetuate existing inequalities and injustice. As with urban sustainability, this approach is about increasing equity while reducing poverty and injustice.
Although incremental and transformational adaptation are often juxtaposed in a false dichotomy, in practice there is no clear dividing line. Moreover, it is important to acknowledge that if the prevailing balance of political power and vested interestsresultedinafailuretomakestepchangesinambition and practice thus far, this almost certainly reflects selfinterest as well as possible resource and capacity constraints. Hence, it is unlikely that transformational adaptation will suddenly become feasible and without substantive reform or realignment of those governance institutions and processes. Moreover, such changes are often complex and slow.
Conversely, substantive gains can be made under broadly existing arrangements, promoted by appropriate champions among officials and elected representatives, without demanding unrealistic institutional reinventions as a prerequisite. This can be achieved through a set of interventions targeting continuous transformational change, which can be grouped as follows:
provide the basic conditions to enable small steps or wins, which are easier to conceptualize and implement with existing momentum;
amplify small wins through sense-making, coupling and integrating—activities that explain the changes and their significance in relation to transformational change, linking the changes to cognate ones in other departments or levels of institution, and connecting these changes and experiences to existing institutions so that they benefit and participate in the ongoing transformations; and
unblock stagnations by confronting social and perceptual obsessions with innovative and counterintuitive interventions that demonstrate the potential of alternatives, provided that officials and elected representatives are willing to engage critically, learn and adapt procedures and behaviours.99
Consistent with this approach and specifically in urban contexts, at least five pathways to urban transformation can be discerned as the basis for formulating and implementing effective climate action (Box 10.4). These pathways are also consistent with key messages of this chapter and this Report as a whole—including the nine pathways to sustainable urban futures framed in Chapter 1, in which the New Urban Agenda provides the integrating framework. They focus on the need for integrated territorial planning and accountable governance with a justice or rights focus to tackle climate change, pandemics, economic insecurity and other societal challenges, coupled with a realistic perspective on how local governance institutions operate (Chapter 1). Two of the five pathways in Box 10.4 focus explicitly on resilience but all contribute to building and enhancing it.100 The urgency of taking action and building overall urban resilience applies to all the scenarios articulated in Chapters 1 and 2. None avoids the difficult challenges articulated in this chapter.
Pathway 1: Integrate mitigation and adaptation, as actions that reduce greenhouse gas emissions while integrating increasing resilience are a win-win
Pathway 2: Coordinate disaster risk reduction and climate change adaptation as together these are the cornerstones of resilient cities
Pathway 3: Co-generate risk assessments and climate action plans with the full range of stakeholders and scientists for the most effective outcomes
Pathway 4: Focus on disadvantaged populations as the needs of the most disadvantaged and vulnerable citizens should be addressed at the forefront of climate change planning and action
Pathway 5: Advance governance, finance and knowledge networks as city creditworthiness, developing robust city institutions and participating in city networks all facilitate climate action
Source: Rosenzweig et al, 2018, pp. 607–608; Simon and Solecki, 2018.
Two final observations about the pathways in Box 10.4 are required. The first is to flag the importance of matching more accurate, localized and downscaled risk assessments as per Pathway 3 with appropriate remedial steps and solutions if policymakers and individual citizens are to be engaged actively rather than left despondent. The second is to underscore the urgency of Pathway 4 to prioritize and address the poorest and most vulnerable communities and localities because they are facing the brunt of hazards and risk and are disproportionately experiencing cascades or chains of increasingly frequent and often severe impacts that are compounding the undermining of their assets and resilience (Chapter 3).
These observations also apply to the broader set of pathways in Chapter 1, since they emphasise equity, inclusion, appropriateness and the challenges of matching short and medium to long-term interventions to tackle multidimensional poverty and vulnerability and to promote integrated sustainability and resilience. The prospects for success will be considerably enhanced if cross-party agreement on the vital importance of this objective, so that successive electoral cycles focus on consolidating and building on previous gains instead of changing direction or reversing them.
1. Simonetal,2018.
2. Elmqvistetal,2019,p.268.
3. Pimmetal,2019,p.895.
4. WorldCommissiononEnvironment andDevelopment,1987.
5. Elmqvistetal,2019,p.268. Redundancyreferstohavingsome sparecapacityorresourcestoact asabufferorsafetynet.
6. UN-Habitat,2011b.p.5;seealso Simonetal,2018.
7. Olssonetal,2015;Ziervogeletal, 2017;Elmqvistetal,2019.
8. Olssonetal,2015;Pimmetal, 2019.
9. IPCC,2021.
10. UKEnvironmentAgency,2021.
11. UN-Habitat,2016a.p.90;this indicatesthecloserelationship betweenthetwoconceptsinUNHabitat’sapproach.SeealsoCastán BrotoandWestman,2021.
12. UN-Habitat,2021a.p.16.
13. UN-Habitat2020a.
14. UN-Habitat,2021a;McMillanetal, 2021.
15. Huxleyetal,2019.
16. FAO/RUAF,2015;LeckandSimon 2019;Croeseetal,2020;Simon, 2021
17. WorldBank,2020.
18. Berkeetal,2021.
19. RockefellerFoundationandArup, 2018.
20. Valenciaetal.2021,p.3.
21. Themembercitiesarenow organizedintoalegacyorganization, theGlobalResilientCitiesNetwork, whichseekstoco-ordinateand makeprogressontheurban resilienceagenda.
22. Croeseetal,2020,p.7.
23. Croeseetal,2020,p.11.
24. Thisincludesthescenarioofhaving achievedsufficientlyhighlevels ofvaccinationand/orimmunityto permitlivingwithCOVID-19.
25. Simon,2016a;UN-Habitat,2020a, pp.96–106,277–280.
26. UN-Habitat,2021a.p.279.
27. SpiliotopoulouandRoseland,2021.
28. UN-Habitat,2020a,pp.94–95.
29. UN-Habitat,2015a,pp.17-19.
30. ILO,2015.
31. CityofGothenburg,2019.
32. GIZ,2017;TheHindu,2021.
33. Andersonetal,2019.
34. UN-Habitat,2020a.p.280.
35. Insomecountries,thisfallsunder thejurisdictionofregionalor nationalgovernments.
36. UN-Habitat,2007,p.203.
37. UNESCO,2016.
38. UN-Habitat,2020a.
39. UN-Habitat,2020a,pp.299–301; DeGrootandLemanski,2020; Andersonetal,2021;Glaeseret al,2021;Pieterse,2021;Simonet al,2021a;SverdlikandWalnycki, 2021;UN-Habitat,2021a,pp.61–62, 163–164;WorldEconomicForum, 2021.
40. UN-Habitat,2015a,pp.14–16.
41. Cinderbyetal,2021.
42. Simon,2016;Reckienetal,2016, 2020;CastánBrotoandWestman, 2021.
43. UN-Habitat,2021a,p.xv.
44. Albertietal,2018.
45. Simon,2016b;Tozeretal,2020; FrantzeskakiandMcPhearson, 2021;McPhearsonetal,2018.
46. Simon,2016b,Ziervogeletal,2017; Reckienetal,2018;Saldarriagaet al,2020;Tozeretal,2020;Pauleitet al,2021.
47. CobbinahandNyame,2021.
48. Quianetal,2015.
49. Wuetal,2019;Alexandra,2019; Saldarriagaetal,2020.
50. Itshouldbenotedthatsome sourcesincludeblue—and sometimesalsogrey—infrastructure undertheumbrellaofgreen
infrastructure,Pauleitetal,2021.
51. McPhearsonetal,2018.
52. Pauleitetal,2021.
53. Acuto,2016.
54. Simonetal,2021,pp.405–409; Smitetal,2021.
55. Pauleitetal,2021,pp.108–110; Simonetal,2021.
56. UN-Habitat,2009,p.118.
57. RCNandARUP,2021;seealso Roberts,2018.
58. IEA,2021;Jacobson,2021.
59. WWF,2020.
60. Huxleyetal,2019;Fraseretal, 2022.
61. Marcotullioetal,2018.
62. Collaçoetal,2019a,2019b;Lampis etal,2021.
63. ICLEI,2021.
64. Samarakoonetal,2022.
65. Valenciaetal,2021,pp.17,20–21.
66. UN-Habitat,2018a.UN-Habitat, 2020a.
67. Hemströmetal,2021;Sheikhand Bhaduri,2021.
68. SDIandKnowYourCity,2018–2021.
69. Simonetal,2021.
70. Simon,2013,p.209.
71. UN-Habitat,2007,p.38.
72. CastánBrotoandWestman,2021.
73. UnitedNations,2017.paras.9,15, 29,42,75,81,90–91.
74. Graute,2016;LeckandSimon 2018;Romero-Lankaoetal,2018a; Bulkeley,2019;Croeseetal,2020; Simon2021;UN-Habitat,2021a.,pp. 127–155.
75. Hausknostetal,2018;CastánBroto andWestman,2020;RestrepoMieth,2021.
76. Burchetal,2018;Romero-Lankao etal,2018b;UN-Habitat,2018a.; Paller,2021;Restrepo-Mieth,2021.
77. CuccaandRanci,2021.
78. Parnell,2020;UN-Habitat,2021a. pp.138–153.
79. Albertietal,2018;UN-Habitat, 2020a.
80. UN-Habitat,2020a.pp.183–184.
81. UN-Habitat,2020a.pp.192-198; CitiesToday,2021.
82. BurchandDiBella,2021.
83. UN-Habitat,2018a.UN-Habitat, 2020a.Effatetal,2021.
84. UN-Habitat,2015a.Berkeetal, 2021;Simon,2021.
85. Cartwrightetal,2012;Scottetal, 2019.
86. Ravenetal,2018;UN-Habitat, 2018a.Effatetal,2021.
87. Ravenetal,2018,pp.141–144, 147–162;C40andArup,2021.
88. Thesetwocategoriestogether areoftenreferredtoascomprising embodiedemissions.
89. Pomponietal,2021;Saintand Pomponi,2021.
90. UN-Habitat,2009,p.126.
91. Croeseetal,2020;Valenciaetal, 2021,pp.7–11.
92. GobiernodelaCiudaddeBuenos Aires2018;Valenciaetal,2021,pp. 7–9.
93. Valenciaetal,2021,pp.9–11.
94. Croeseetal,2020,TableA1,pp. 12–14.
95. GöteborgsStad,2020;Valenciaet al,2021,pp.11–15.
96. Hemströmetal,2021pp.31–47.
97. UNDP,2020.
98. See,forexample,theUN Secretary-General’sstatementon theInternationalDayofEpidemic Preparedness:https://www. un.org/en/observances/epidemicpreparedness-day/messages.
99. LeckandRoberts,2015;Termeer etal,2017,pp.562-570;RomeroLankaoetal,2018b;Simonand Solecki,2018;PerryandRussell, 2020;Pattersonetal,2021.
100. Rosenzweigetal,2018,pp.xx,6078;Valenciaetal,2021,pp.3-4.
General Disclaimer: The designations
presentation of the data in the Statistical Annex do not imply the expression of any opinion whatsover
the part of the Secretariat
boundaries.
city
area of its authorities, or concerning the delimitation of its frontiers
Urban Population at Mid-Year
(thousands)
Country,
Average Annual Rate of Change of the Urban
Region,subregion,countryorarea201520202025203020352015-
Country, 20152035 (per
2030 20302035
Percentage of Population at MidYear Residing in Urban Country and Area, 2015-2035
Average Annual Rate of Change of the Percentage Urban by Country, 20152035 (per cent)
2020 20202025 20252030 20302035
Moredevelopedregions 979,089 1,003,6401,027,0971,049,699 1,070,804 0.50 0.46 0.44 0.40 78.1 79.1 80.2 81.4 82.7 0.24 0.27 0.30 0.32
Lessdevelopedregions 3,002,409 3,375,3543,747,5494,117,558 4,485,029 2.34 2.09 1.88 1.71 49.0 51.7 54.3 56.7 59.0 1.09 0.97 0.88 0.80
Leastdevelopedcountries 305,951 372,038 449,498 538,529 639,204 3.91 3.783.61 3.43 32.0 34.6 37.4 40.4 43.4 1.60 1.56 1.50 1.43
Lessdevelopedregions,excluding leastdevelopedcountries 2,696,458 3,003,3153,298,0513,579,029 3,845,826 2.16 1.87 1.64 1.44 52.1 55.1 57.8 60.4 62.8 1.10 0.97 0.87 0.79
Lessdevelopedregions,excluding China 2,201,145 2,473,2762,763,1043,071,076 3,396,290 2.33 2.22 2.11 2.01 46.8 48.8 50.9 53.1 55.4 0.82 0.83 0.85 0.86
High-incomecountries 955,213 988,5861,019,3991,048,879 1,075,813 0.69 0.61 0.57 0.51 80.9 81.9 82.8 83.9 85.0 0.22 0.24 0.26 0.27
Middle-incomecountries 2,825,252 3,144,8873,456,4253,756,587 4,045,091 2.14 1.89 1.67 1.48 50.8 53.7 56.5 59.0 61.5 1.11 0.99 0.90 0.82
Upper-middle-incomecountries 1,659,611 1,821,0361,957,2232,068,825 2,157,098 1.86 1.44 1.11 0.84 64.1 68.2 71.7 74.8 77.3 1.23 1.01 0.82 0.66
Lower-middle-incomecountries 1,165,641 1,323,8511,499,2021,687,762 1,887,993 2.55 2.49 2.37 2.24 39.2 41.6 44.2 47.0 49.9 1.16 1.20 1.22 1.21
Low-incomecountries 198,536 242,877 296,030 358,848 431,837 4.03 3.96 3.85 3.70 30.9 33.2 35.7 38.3 41.2 1.40 1.44 1.45 1.44
Sub-SaharanAfrica 375,827 458,670 555,123 666,165 792,225 3.98 3.82 3.65 3.47 38.8 41.4 44.2 47.0 49.8 1.33 1.28 1.22 1.15
AFRICA 491,531 587,738 698,149 824,014 966,330 3.58 3.44 3.32 3.19 41.2 43.5 45.9 48.4 50.9 1.09 1.08 1.06 1.04
EasternAfrica 106,096 132,520 164,482 202,579 247,131 4.45 4.32 4.17 3.98 26.6 29.0 31.6 34.5 37.5 1.74 1.75 1.74 1.69
Burundi 1,232 1,637 2,147 2,780 3,569 5.68 5.43 5.17 4.99 12.1 13.7 15.5 17.6 19.9 2.53 2.51 2.48 2.42 Comoros 221 255 296 345 401 2.87 2.97 3.06 3.00 28.5 29.4 30.7 32.5 34.6 0.63 0.89 1.14 1.21 Djibouti 718 781 844 906 965 1.67 1.56 1.42 1.27 77.4 78.1 78.9 80.0 81.2 0.17 0.22 0.26 0.30 Eritrea 1,852 2,246 2,699 3,210 3,782 3.86 3.67 3.47 3.28 38.2 41.3 44.6 47.8 51.0 1.58 1.50 1.40 1.29 Ethiopia 19,403 24,463 30,487 37,496 45,488 4.63 4.40 4.14 3.86 19.4 21.7 24.2 26.9 29.7 2.21 2.16 2.11 2.03 Kenya 12,120 14,975 18,372 22,383 27,026 4.23 4.09 3.95 3.77 25.7 28.0 30.6 33.4 36.5 1.74 1.77 1.78 1.75 Madagascar 8,529 10,670 13,200 16,102 19,328 4.48 4.26 3.97 3.65 35.2 38.5 41.9 45.2 48.5 1.81 1.68 1.53 1.37 Malawi 2,867 3,535 4,407 5,551 7,022 4.19 4.41 4.62 4.70 16.3 17.4 18.9 20.9 23.3 1.32 1.66 1.96 2.20 Mauritius 516 519 527 539 554 0.11 0.28 0.45 0.56 41.0 40.8 41.0 41.9 43.2-0.12 0.14 0.39 0.63 Mayotte 113 125 139 157 179 2.05 2.19 2.41 2.62 47.0 45.8 45.3 45.7 47.0-0.53-0.18 0.18 0.53 Mozambique 9,636 11,978 14,811 18,195 22,168 4.35 4.24 4.12 3.95 34.4 37.1 39.9 42.9 46.0 1.50 1.47 1.44 1.39 Réunion 858 893 927 956 980 0.82 0.73 0.62 0.50 99.3 99.7 99.8 99.9 99.9 0.06 0.03 0.01 0.00 Rwanda 1,977 2,281 2,660 3,144 3,769 2.86 3.07 3.34 3.63 17.0 17.4 18.3 19.6 21.5 0.50 0.96 1.40 1.82 Seychelles 52 55 58 61 63 1.26 0.99 0.81 0.70 55.4 57.5 59.7 61.7 63.8 0.76 0.72 0.69 0.65 Somalia 6,015 7,431 9,169 11,229 13,626 4.23 4.20 4.05 3.87 43.2 46.1 49.1 52.1 55.2 1.30 1.25 1.20 1.13 SouthSudan 2,240 2,749 3,378 4,164 5,137 4.10 4.12 4.18 4.20 18.9 20.2 21.9 24.1 26.8 1.38 1.66 1.90 2.08 Uganda 8,856 11,775 15,431 19,914 25,273 5.70 5.41 5.10 4.77 22.1 25.0 28.0 31.2 34.4 2.47 2.31 2.15 1.98 UnitedRepublicofTanzania 17,035 22,113 28,245 35,529 44,001 5.22 4.89 4.59 4.28 31.6 35.2 38.9 42.4 45.9 2.16 1.96 1.76 1.56 Zambia 6,747 8,336 10,257 12,549 15,220 4.23 4.15 4.03 3.86 41.9 44.6 47.5 50.5 53.5 1.26 1.25 1.22 1.17
Zimbabwe 5,109 5,700 6,430 7,370 8,581 2.19 2.41 2.73 3.04 32.4 32.2 32.9 34.2 36.4-0.09 0.38 0.83 1.24
MiddleAfrica 73,632 90,619 110,579 133,728 160,150 4.15 3.98 3.80 3.61 47.9 50.6 53.4 56.2 59.0 1.11 1.07 1.03 0.97
Angola 17,676 21,937 26,848 32,437 38,691 4.32 4.04 3.78 3.53 63.4 66.8 69.9 72.5 74.9 1.04 0.89 0.75 0.64
Cameroon 12,463 14,942 17,740 20,857 24,291 3.63 3.43 3.24 3.05 54.6 57.6 60.5 63.2 65.9 1.06 0.98 0.90 0.81
CentralAfricanRepublic 1,831 2,077 2,452 2,918 3,455 2.52 3.32 3.48 3.38 40.3 42.2 44.7 47.6 50.8 0.93 1.14 1.29 1.29 Chad 3,154 3,830 4,701 5,819 7,246 3.88 4.10 4.27 4.39 22.5 23.5 25.0 27.1 29.8 0.87 1.25 1.60 1.89
Congo 3,274 3,857 4,524 5,290 6,156 3.28 3.19 3.13 3.03 65.5 67.8 70.1 72.3 74.4 0.69 0.65 0.62 0.57
DemocraticRepublicoftheCongo 32,567 40,848 50,723 62,343 75,773 4.53 4.33 4.13 3.90 42.7 45.6 48.7 51.8 54.8 1.31 1.29 1.23 1.16
EquatorialGuinea 830 1,028 1,232 1,445 1,660 4.28 3.62 3.18 2.78 70.6 73.1 75.3 77.2 78.9 0.69 0.59 0.50 0.43 Gabon 1,701 1,938 2,171 2,403 2,636 2.61 2.27 2.03 1.85 88.1 90.1 91.6 92.7 93.5 0.44 0.33 0.24 0.17
SaoTomeandPrincipe 137 162 188 215 242 3.33 2.96 2.67 2.38 70.2 74.4 77.6 80.0 81.8 1.16 0.85 0.62 0.44
NorthernAfrica 115,705 129,068 143,026 157,849 174,104 2.19 2.05 1.97 1.96 51.4 52.5 53.8 55.3 57.2 0.41 0.49 0.58 0.66 Algeria 28,248 31,951 35,292 38,232 40,882 2.46 1.99 1.60 1.34 70.8 73.7 76.2 78.3 80.0 0.80 0.66 0.54 0.44
Egypt 40,123 44,041 48,427 53,613 59,988 1.86 1.90 2.03 2.25 42.8 42.8 43.4 44.8 46.8-0.00 0.31 0.60 0.87 Libya 4,942 5,376 5,780 6,140 6,460 1.68 1.45 1.21 1.02 79.3 80.7 82.2 83.6 85.0 0.36 0.37 0.34 0.32 Morocco 21,164 23,552 25,869 28,069 30,127 2.14 1.88 1.63 1.42 60.8 63.5 66.2 68.7 71.0 0.88 0.81 0.75 0.68
Sudan 13,099 15,349 18,220 21,775 26,089 3.17 3.43 3.56 3.62 33.9 35.3 37.2 39.7 42.8 0.79 1.07 1.31 1.49 Tunisia 7,672 8,281 8,854 9,372 9,848 1.53 1.34 1.14 0.99 68.1 69.6 71.2 73.0 74.8 0.44 0.47 0.49 0.50
Urban Population at Mid-Year
Region,subregion,countryorarea201520202025203020352015-
Average Annual Rate
of the Urban
Country,
Percentage of Population at MidYear Residing in Urban Country and Area,
Average Annual Rate of Change of the Percentage Urban by Country, 20152035 (per
2.34 2.08 1.86 86.5 86.8 87.3 87.8 88.5 0.07 0.10 0.13 0.15 SouthernAfrica 39,358
WesternSahara 455 519 583 647 710
1.61 1.43 62.1 64.6 67.1 69.4 71.6 0.81 0.75 0.68 0.61 Botswana 1,484 1,712 1,937
2,353 2.87 2.47 2.10 1.79 67.2 70.9 74.1 76.8 79.1 1.08 0.89 0.72 0.59 Lesotho 585 674 774 887 1,014 2.83 2.77 2.71 2.69 26.9 29.0 31.4 34.0 36.9 1.52 1.56 1.60 1.61
Namibia 1,138 1,403 1,684 1,972 2,261 4.20 3.64 3.16 2.74 46.9 52.0 56.7 60.8 64.2 2.08 1.71 1.39 1.11
SouthAfrica 35,844 39,551 43,113 46,457 49,631 1.97 1.72 1.49 1.32 64.8 67.4 69.8 72.1 74.2 0.76 0.71 0.65 0.59 Swaziland 307 348 393 442 498 2.48 2.42 2.38 2.37 23.3 24.2 25.2 26.5 28.1 0.73 0.87 1.00 1.11
WesternAfrica 156,740 191,842 232,162 277,949 329,187 4.04 3.82 3.60 3.38 44.5 47.7 50.7 53.6 56.3 1.39 1.25 1.11 0.98 Benin 4,833 5,869 7,076 8,461 10,024 3.89 3.74 3.57 3.39 45.7 48.4 51.2 54.1 57.1 1.16 1.13 1.10 1.05 BurkinaFaso 4,986 6,398 8,113 10,163 12,559 4.99 4.75 4.51 4.23 27.5 30.6 33.8 37.1 40.4 2.12 1.99 1.86 1.72 CaboVerde 343 378 414 450 484 1.97 1.83 1.65 1.45 64.3 66.7 68.8 70.9 72.7 0.72 0.64 0.58 0.52 Côted’Ivoire 11,426 13,532 16,022 18,912 22,231 3.38 3.38 3.32 3.23 49.4 51.7 54.1 56.7 59.4 0.89 0.92 0.93 0.93 Gambia 1,171 1,435 1,731 2,055 2,403 4.07 3.75 3.43 3.12 59.2 62.6 65.7 68.5 71.0 1.10 0.97 0.84 0.72 Ghana 14,918 17,626 20,539 23,641 26,912 3.34 3.06 2.81 2.59 54.1 57.3 60.5 63.4 66.1 1.17 1.06 0.95 0.83
Guinea 4,249 5,071 6,083 7,300 8,744 3.54 3.64 3.65 3.61 35.1 36.9 39.0 41.4 44.2 0.96 1.10 1.22 1.30 Guinea-Bissau 746 884 1,038 1,209 1,397 3.41 3.22 3.03 2.89 42.1 44.2 46.3 48.5 50.7 0.96 0.94 0.91 0.89
Liberia 2,242 2,659 3,150 3,722 4,372 3.41 3.39 3.33 3.22 49.8 52.1 54.6 57.3 60.1 0.89 0.94 0.97 0.96 Mali 6,986 8,907 11,191 13,850 16,846 4.86 4.57 4.26 3.92 40.0 43.9 47.7 51.2 54.4 1.87 1.64 1.42 1.21
Mauritania 2,137 2,647 3,207 3,808 4,444 4.28 3.84 3.44 3.09 51.1 55.3 59.2 62.7 65.7 1.59 1.35 1.14 0.94
Niger 3,233 4,003 5,068 6,542 8,581 4.27 4.72 5.11 5.43 16.2 16.6 17.4 18.7 20.5 0.46 0.94 1.40 1.84
Nigeria 86,673 107,113 130,312 156,300 184,888 4.23 3.92 3.64 3.36 47.8 52.0 55.8 59.2 62.2 1.65 1.41 1.19 0.99
SaintHelena 2 2 2 2 2 0.73 0.98 1.12 1.06 39.5 40.1 41.1 42.7 44.8 0.27 0.52 0.75 0.95
Senegal 6,869 8,277 9,904 11,778 13,929 3.73 3.59 3.47 3.35 45.9 48.1 50.6 53.2 56.0 0.96 1.00 1.02 1.02
SierraLeone 2,955 3,454 4,017 4,651 5,351 3.12 3.02 2.93 2.81 40.8 42.9 45.3 47.8 50.6 1.00 1.06 1.11 1.13 Togo 2,974 3,588 4,296 5,106 6,021 3.76 3.60 3.46 3.30 40.1 42.8 45.6 48.6 51.6 1.30 1.29 1.26 1.21 ASIA2,119,873 2,361,464 2,589,655 2,802,262 2,998,511 2.16 1.84 1.58 1.35 48.0 51.1 54.0 56.7 59.2 1.26 1.10 0.98 0.88 EasternAsia 977,010 1,078,435 1,160,857 1,222,479 1,263,838 1.98 1.47 1.03 0.67 59.8 64.8 69.2 72.8 75.7 1.63 1.31 1.02 0.79 China 775,353 875,076 956,5541,017,847 1,059,619 2.42 1.78 1.24 0.80 55.5 61.4 66.5 70.6 73.9 2.03 1.58 1.21 0.91 China,HongKongSAR 7,246 7,548 7,769 7,987 8,127 0.82 0.58 0.56 0.35100.0100.0100.0100.0100.0 0.00.00.00.0 China,MacaoSAR 601 652 701 746 784 1.63 1.46 1.23 0.99100.0100.0100.0100.0100.0 0.00.00.00.0 China,TaiwanProvinceofChina 18,064 18,802 19,421 19,902 20,210 0.80 0.65 0.49 0.31 76.9 78.9 80.8 82.4 83.9 0.52 0.46 0.40 0.35 Dem.People’sRepublicofKorea 15,469 16,120 16,816 17,531 18,220 0.82 0.85 0.83 0.77 61.3 62.4 63.8 65.6 67.6 0.36 0.45 0.54 0.60 Japan 116,944 116,100 114,646 112,710 110,450-0.14-0.25-0.34-0.41 91.4 91.8 92.2 92.7 93.2 0.09 0.10 0.10 0.11 Mongolia 2,031 2,203 2,363 2,514 2,666 1.63 1.40 1.24 1.17 68.2 68.7 69.5 70.6 72.1 0.12 0.23 0.33 0.42 RepublicofKorea 41,302 41,934 42,587 43,241 43,762 0.30 0.31 0.30 0.24 81.6 81.4 81.6 82.0 82.9-0.05 0.03 0.12 0.20 South-CentralAsia 661,808 745,069 835,323 931,437 1,032,413 2.37 2.29 2.18 2.06 35.0 37.1 39.4 42.0 44.9 1.17 1.23 1.28 1.31 CentralAsia 33,057 35,681 38,432 41,414 44,820 1.53 1.49 1.49 1.58 48.1 48.3 49.1 50.5 52.5 0.09 0.33 0.56 0.76 Kazakhstan 10,151 10,829 11,494 12,186 12,963 1.29 1.19 1.17 1.24 57.2 57.7 58.6 60.0 61.9 0.17 0.32 0.48 0.61 Kyrgyzstan 2,098 2,323 2,574 2,862 3,201 2.03 2.05 2.12 2.24 35.8 36.9 38.6 40.9 43.9 0.59 0.90 1.18 1.40 Tajikistan 2,286 2,606 2,988 3,444 4,009 2.62 2.73 2.85 3.03 26.7 27.5 28.8 30.8 33.3 0.56 0.94 1.30 1.61 Turkmenistan 2,800 3,167 3,541 3,917 4,297 2.46 2.23 2.02 1.85 50.3 52.5 55.1 57.9 60.8 0.86 0.95 1.00 0.97 Uzbekistan 15,720 16,756 17,836 19,005 20,349 1.28 1.25 1.27 1.37 50.8 50.4 50.7 51.8 53.5-0.13 0.13 0.40 0.65
SouthernAsia 628,751 709,388 796,892 890,024 987,592 2.41 2.33 2.21 2.08 34.5 36.6 39.1 41.7 44.6 1.22 1.27 1.31 1.33 Afghanistan 8,368 9,904 11,705 13,818 16,279 3.37 3.34 3.32 3.28 24.8 26.0 27.6 29.6 32.0 0.96 1.18 1.38 1.55
Bangladesh 55,305 64,815 74,838 84,689 93,958 3.17 2.88 2.47 2.08 34.3 38.2 42.0 45.6 49.0 2.14 1.90 1.67 1.44
Bhutan 305 353 401 444 482 2.98 2.51 2.05 1.64 38.7 42.3 45.6 48.6 51.1 1.80 1.51 1.25 1.02
India 429,069 483,099 542,743 607,342 675,456 2.37 2.33 2.25 2.13 32.8 34.9 37.4 40.1 43.2 1.27 1.36 1.42 1.46 Iran(IslamicRepublicof) 58,217 63,421 67,760 71,205 74,092 1.71 1.32 0.99 0.79 73.4 75.9 78.1 80.1 81.9 0.67 0.59 0.51 0.43
Maldives 161 187 210 231 250 2.93 2.34 1.88 1.66 38.5 40.7 42.8 45.0 47.3 1.08 1.04 1.00 0.96
Nepal 5,318 6,226 7,266 8,408 9,623 3.15 3.09 2.92 2.70 18.6 20.6 22.8 25.4 28.1 2.07 2.09 2.09 2.06
Pakistan 68,227 77,438 87,777 99,360 112,484 2.53 2.51 2.48 2.48 36.0 37.2 38.7 40.7 43.1 0.62 0.81 0.99 1.15
SriLanka 3,781 3,945 4,193 4,528 4,967 0.85 1.22 1.54 1.85 18.3 18.7 19.6 21.1 23.1 0.49 0.97 1.42 1.83
South-EasternAsia 299,412 334,419 369,699 404,497 438,119 2.21 2.01 1.80 1.60 47.2 50.0 52.8 55.6 58.3 1.16 1.09 1.03 0.96 BruneiDarussalam 320 348 374 397 417 1.66 1.44 1.21 1.00 76.7 78.3 79.7 81.1 82.4 0.41 0.37 0.34 0.31 Cambodia 3,443 4,050 4,721 5,458 6,272 3.25 3.06 2.90 2.78 22.2 24.2 26.5 29.0 31.8 1.76 1.80 1.82 1.82 Indonesia 137,635 154,189 170,361 185,755 200,062 2.27 1.99 1.73 1.48 53.3 56.6 59.8 62.8 65.6 1.21 1.09 0.98 0.87
LaoPeople’sDemocraticRepublic 2,206 2,600 3,019 3,452 3,889 3.28 2.99 2.68 2.38 33.1 36.3 39.6 42.9 46.2 1.84 1.73 1.61 1.49 Malaysia 22,801 25,362 27,845 30,109 32,067 2.13 1.87 1.56 1.26 74.2 77.2 79.7 81.8 83.5 0.78 0.64 0.52 0.43 Myanmar 15,647 17,068 18,722 20,615 22,714 1.74 1.85 1.93 1.94 29.9 31.1 32.8 35.0 37.6 0.84 1.07 1.26 1.43 Philippines 47,078 52,009 57,606 63,844 70,692 1.99 2.04 2.06 2.04 46.3 47.4 49.0 50.9 53.3 0.48 0.64 0.79 0.91 Singapore 5,535 5,935 6,157 6,342 6,480 1.39 0.74 0.59 0.43100.0100.0100.0100.0100.0 0.00.00.00.0 Thailand 32,746 35,698 38,344 40,676 42,609 1.73 1.43 1.18 0.93 47.7 51.4 55.0 58.4 61.6 1.51 1.35 1.20 1.05
Urban Population at Mid-Year by Country, 2015-2035 (thousands)
Average Annual Rate of Change of the Urban Population by Country, 20152035 (per cent)
Percentage of Population at MidYear Residing in Urban Country and Area, 2015-2035
Average Annual Rate of Change of the Percentage Urban by Country, 20152035 (per cent)
2015202020252030203520152020 20202025 20252030 20302035 Timor-Leste 366 433 511 600 701 3.35 3.31 3.23 3.10 29.5 31.3 33.2 35.2 37.3 1.20 1.18 1.16 1.14 VietNam 31,635 36,727 42,039 47,248 52,216 2.98 2.70 2.34 2.00 33.8 37.3 40.9 44.5 47.9 1.99 1.83 1.66 1.50 WesternAsia 181,644 203,541 223,776 243,848 264,141 2.28 1.90 1.72 1.60 70.4 72.3 73.8 75.4 76.9 0.55 0.41 0.42 0.41
Region,subregion,countryorarea2015202020252030203520152020 20202025 20252030 20302035
Armenia 1,840 1,861 1,882 1,906 1,934 0.22 0.23 0.25 0.30 63.1 63.3 64.1 65.5 67.5 0.07 0.26 0.43 0.58
Azerbaijan 5,262 5,696 6,101 6,491 6,883 1.58 1.38 1.24 1.17 54.7 56.4 58.4 60.8 63.4 0.61 0.71 0.79 0.84
Bahrain 1,221 1,520 1,679 1,828 1,941 4.38 1.99 1.71 1.20 89.0 89.5 90.1 90.8 91.5 0.11 0.14 0.15 0.14
Cyprus 777 807 838 873 912 0.75 0.76 0.81 0.87 66.9 66.8 67.2 68.1 69.4-0.04 0.11 0.26 0.39
Georgia 2,270 2,318 2,359 2,394 2,426 0.42 0.35 0.30 0.26 57.4 59.5 61.6 63.9 66.2 0.69 0.71 0.72 0.72
Iraq 25,252 29,423 34,039 39,208 44,985 3.06 2.91 2.83 2.75 69.9 70.9 72.1 73.6 75.2 0.28 0.34 0.40 0.44
Israel 7,434 8,068 8,698 9,337 9,994 1.64 1.51 1.42 1.36 92.2 92.6 93.0 93.5 94.0 0.09 0.10 0.10 0.11
Jordan 8,267 9,333 9,802 10,364 11,113 2.43 0.98 1.12 1.39 90.3 91.4 92.4 93.2 93.9 0.26 0.21 0.17 0.14
Kuwait 3,936 4,303 4,603 4,874 5,111 1.78 1.35 1.14 0.95100.0100.0100.0100.0100.0 0.00.00.00.0
Lebanon 5,155 5,353 5,033 4,864 4,875 0.75-1.23-0.68 0.05 88.1 88.9 89.8 90.6 91.4 0.19 0.19 0.18 0.17
Oman 3,417 4,443 4,990 5,407 5,703 5.25 2.32 1.61 1.07 81.4 86.3 89.5 91.7 93.1 1.18 0.74 0.47 0.30
Qatar 2,455 2,770 3,011 3,217 3,389 2.41 1.66 1.32 1.04 98.9 99.2 99.4 99.5 99.6 0.06 0.04 0.02 0.01
SaudiArabia 26,249 29,256 31,843 34,143 36,170 2.17 1.69 1.40 1.15 83.2 84.3 85.4 86.5 87.5 0.26 0.26 0.25 0.24
StateofPalestine 3,514 4,083 4,708 5,371 6,069 3.00 2.85 2.64 2.44 75.4 76.7 78.2 79.7 81.3 0.36 0.38 0.39 0.39
SyrianArabRepublic 9,774 10,498 13,736 16,423 18,657 1.43 5.38 3.57 2.55 52.2 55.5 58.7 61.7 64.6 1.23 1.12 1.01 0.91
Turkey 57,617 63,803 67,446 70,951 74,481 2.04 1.11 1.01 0.97 73.6 76.1 78.3 80.2 81.9 0.67 0.57 0.49 0.41
UnitedArabEmirates 7,843 8,542 9,207 9,865 10,492 1.71 1.50 1.38 1.23 85.7 87.0 88.2 89.2 90.1 0.32 0.27 0.23 0.19
Yemen 9,361 11,465 13,802 16,330 19,007 4.06 3.71 3.36 3.04 34.8 37.9 41.1 44.4 47.6 1.72 1.63 1.51 1.40
EUROPE 547,147 556,684 565,026 572,890 580,282 0.35 0.30 0.28 0.26 73.9 74.9 76.1 77.5 79.0 0.28 0.32 0.36 0.39
EasternEurope 203,146 203,296 203,360 203,271 203,286 0.01 0.01-0.01 0.00 69.3 69.9 70.9 72.2 73.9 0.18 0.28 0.37 0.45
Belarus 7,321 7,484 7,590 7,631 7,629 0.44 0.28 0.11-0.01 77.2 79.5 81.5 83.3 84.8 0.59 0.50 0.43 0.36 Bulgaria 5,311 5,253 5,179 5,082 4,965-0.22-0.28-0.38-0.47 74.0 75.7 77.4 79.0 80.6 0.45 0.44 0.42 0.40
Czechia 7,791 7,875 7,953 8,009 8,052 0.21 0.20 0.14 0.11 73.5 74.1 74.9 76.1 77.4 0.16 0.23 0.30 0.36
Hungary 6,898 6,922 6,938 6,940 6,919 0.07 0.05 0.01-0.06 70.5 71.9 73.5 75.1 76.8 0.40 0.43 0.44 0.45
Poland 23,065 22,782 22,598 22,533 22,568-0.25-0.16-0.06 0.03 60.3 60.0 60.5 61.5 63.2-0.08 0.14 0.35 0.54
RepublicofMoldova 1,728 1,722 1,729 1,749 1,778-0.07 0.09 0.23 0.33 42.5 42.8 43.9 45.5 47.8 0.17 0.46 0.74 0.98
Romania 10,711 10,507 10,431 10,456 10,554-0.38-0.15 0.05 0.19 53.9 54.2 55.1 56.6 58.7 0.11 0.34 0.54 0.72
RussianFederation 106,549 107,486 108,062 108,337 108,569 0.18 0.11 0.05 0.04 74.1 74.8 75.8 77.1 78.6 0.19 0.27 0.34 0.40 Slovakia 2,931 2,931 2,955 2,998 3,054-0.00 0.17 0.28 0.37 53.9 53.8 54.3 55.6 57.6-0.05 0.22 0.47 0.70 Ukraine 30,841 30,335 29,924 29,537 29,198-0.33-0.27-0.26-0.23 69.1 69.6 70.5 71.7 73.2 0.16 0.25 0.34 0.41
NorthernEurope 83,943 87,488 90,892 94,053 96,959 0.83 0.76 0.68 0.61 81.4 82.6 83.8 85.0 86.1 0.30 0.29 0.28 0.26 ChannelIslands 51 52 54 56 59 0.46 0.68 0.88 1.06 31.0 31.0 31.4 32.2 33.4 0.00 0.26 0.52 0.76
Denmark 4,979 5,108 5,248 5,389 5,516 0.51 0.54 0.53 0.47 87.5 88.1 88.8 89.4 90.2 0.13 0.15 0.15 0.16
Estonia 900 900 899 895 891 0.01-0.03-0.08-0.09 68.4 69.2 70.2 71.4 72.8 0.24 0.29 0.33 0.37 FaeroeIslands 20 21 22 23 25 0.74 0.89 1.05 1.13 41.6 42.4 43.4 44.8 46.4 0.36 0.48 0.60 0.71
Finland 4,672 4,772 4,874 4,970 5,054 0.42 0.42 0.39 0.33 85.2 85.5 86.0 86.6 87.4 0.07 0.11 0.14 0.17
Iceland 309 322 334 345 355 0.81 0.74 0.64 0.54 93.7 93.9 94.1 94.4 94.8 0.04 0.05 0.06 0.07
Ireland 2,939 3,111 3,295 3,484 3,691 1.14 1.15 1.12 1.15 62.5 63.7 65.1 66.8 68.7 0.35 0.44 0.51 0.57 IsleofMan 43 45 48 50 53 0.89 0.97 1.04 1.10 52.2 52.9 54.0 55.4 57.2 0.25 0.39 0.53 0.65
Latvia 1,355 1,293 1,250 1,222 1,197-0.93-0.68-0.46-0.40 68.0 68.3 69.0 69.9 71.2 0.10 0.19 0.28 0.36
Lithuania 1,971 1,941 1,929 1,920 1,909-0.31-0.12-0.10-0.11 67.2 68.0 69.2 70.6 72.4 0.24 0.33 0.41 0.48
Norway 4,217 4,522 4,830 5,130 5,409 1.40 1.32 1.20 1.06 81.1 83.0 84.6 86.1 87.3 0.46 0.40 0.34 0.29
Sweden 8,451 8,905 9,309 9,669 9,977 1.05 0.89 0.76 0.63 86.6 88.0 89.2 90.3 91.2 0.33 0.28 0.24 0.20
UnitedKingdom 54,035 56,495 58,799 60,899 62,822 0.89 0.80 0.70 0.62 82.6 83.9 85.1 86.3 87.4 0.31 0.29 0.27 0.25
SouthernEurope 107,618 109,342 110,832 112,280 113,554 0.32 0.27 0.26 0.23 70.6 72.1 73.8 75.4 77.2 0.43 0.44 0.45 0.45
Albania 1,679 1,827 1,949 2,038 2,090 1.69 1.29 0.90 0.51 57.4 62.1 66.1 69.5 72.2 1.57 1.25 0.99 0.77
Andorra 69 68 68 69 69-0.31 0.11 0.12 0.15 88.3 87.9 87.7 87.8 88.2-0.10-0.04 0.02 0.08
BosniaandHerzegovina 1,668 1,715 1,768 1,824 1,876 0.55 0.61
Croatia 2,379 2,369 2,375 2,394 2,421-0.08
Gibraltar
0.56 47.2 49.0 51.2 53.6 56.2 0.77 0.85 0.92 0.96
0.22 56.2 57.6 59.3 61.5 63.9 0.49 0.61 0.70 0.77
0.18100.0100.0100.0100.0100.0
79.7 81.3 82.8 84.1 0.42 0.39 0.36
0.26 69.6 71.0 72.6 74.3 76.0 0.42 0.44 0.45 0.46
0.11-0.08
94.7 95.1 95.4 95.7 0.07 0.07 0.07 0.07
0.37 0.28 65.8 67.5 69.2 70.9 72.5 0.50 0.49 0.48 0.47 Portugal 6,617 6,776 6,926 7,049 7,135 0.47 0.44 0.35 0.24 63.5 66.3 68.9 71.4 73.6 0.86 0.78 0.69 0.61 SanMarino 32 33 34 34 34 0.67 0.41 0.28 0.17 96.7 97.5 98.0 98.4 98.6 0.16 0.11 0.07 0.05
Serbia 4,930 4,913 4,924 4,953 4,993-0.07 0.04 0.12 0.16 55.7 56.4 57.6 59.3 61.3 0.27 0.42 0.56 0.68 Slovenia 1,116 1,148 1,179 1,211 1,244 0.56 0.54 0.53 0.53 53.8 55.1 56.8 58.8 61.1 0.49 0.60 0.70 0.77
Urban Population at Mid-Year by Country, 2015-2035 (thousands)
Average Annual Rate of Change of the Urban Population by Country, 20152035 (per cent)
Percentage of Population at MidYear Residing in Urban Country and Area, 2015-2035
Average Annual Rate of Change of the Percentage Urban by Country, 20152035 (per cent)
2015202020252030203520152020 20202025 20252030 20302035 Spain 36,933 37,544 37,996 38,420 38,785 0.33 0.24 0.22 0.19 79.6 80.8 82.1 83.3 84.6 0.30 0.31 0.30 0.30 TFYRMacedonia 1,194 1,221 1,259 1,303 1,342 0.45 0.61 0.69 0.58 57.4 58.5 60.3 62.7 65.4 0.37 0.61 0.80 0.83 WesternEurope 152,441 156,558 159,942 163,286 166,483 0.53 0.43 0.41 0.39 79.4 80.2 81.2 82.2 83.4 0.21 0.24 0.26 0.28 Austria 5,009 5,159 5,338 5,531 5,727 0.59 0.68 0.71 0.70 57.7 58.7 60.1 61.8 63.8 0.35 0.46 0.56 0.64 Belgium 11,048 11,397 11,614 11,811 11,984 0.62 0.38 0.34 0.29 97.9 98.1 98.3 98.4 98.6 0.04 0.04 0.03 0.03 France 51,343 53,218 55,019 56,789 58,489 0.72 0.67 0.63 0.59 79.7 81.0 82.3 83.6 84.9 0.33 0.33 0.32 0.31 Germany 63,078 63,930 64,346 64,871 65,466 0.27 0.13 0.16 0.18 77.2 77.5 78.0 78.9 80.1 0.07 0.15 0.23 0.29 Liechtenstein 5 6 6 6 7 0.81 1.15 1.44 1.69 14.3 14.4 14.8 15.5 16.5 0.16 0.54 0.91 1.27 Luxembourg 511 552 593 629 663 1.55 1.43 1.17 1.07 90.2 91.5 92.4 93.2 93.8 0.28 0.22 0.17 0.12 Monaco 38 39 40 41 42 0.51 0.50 0.52 0.52100.0100.0100.0100.0100.0 0.00.00.00.0
Region,subregion,countryorarea2015202020252030203520152020 20202025 20252030 20302035
Netherlands 15,274 15,847 16,319 16,671 16,895 0.74 0.59 0.43 0.27 90.2 92.2 93.7 94.8 95.5 0.45 0.32 0.22 0.15 Switzerland 6,133 6,409 6,668 6,937 7,208 0.88 0.79 0.79 0.77 73.7 73.9 74.5 75.4 76.6 0.05 0.15 0.24 0.32
LATINAMERICAANDTHE CARIBBEAN 505,392 539,427 571,254 600,480 626,673 1.30 1.15 1.00 0.85 79.9 81.2 82.4 83.6 84.7 0.31 0.30 0.28 0.27
Caribbean 30,319 32,251 34,069 35,729 37,157 1.24 1.10 0.95 0.78 70.0 72.2 74.3 76.2 78.0 0.61 0.57 0.52 0.47 Anguilla 15 15 16 16 16 0.90 0.47 0.28 0.14100.0100.0100.0100.0100.0 0.00.00.00.0
AntiguaandBarbuda 25 26 27 28 30 0.55 0.87 1.15 1.40 25.0 24.4 24.4 24.8 25.7-0.46-0.06 0.35 0.74 Aruba 45 47 48 50 53 0.67 0.77 0.87 0.89 43.1 43.7 44.7 46.2 48.0 0.27 0.46 0.63 0.79 Bahamas 320 339 356 373 387 1.13 1.02 0.89 0.76 82.7 83.2 83.9 84.7 85.7 0.12 0.16 0.19 0.22 Barbados 89 90 92 95 100 0.20 0.46 0.70 0.93 31.2 31.2 31.7 32.8 34.5-0.04 0.32 0.67 1.00
BritishVirginIslands 14 16 17 19 20 2.42 1.73 1.52 1.31 46.6 48.5 50.6 52.8 55.0 0.81 0.84 0.85 0.81
CaribbeanNetherlands 18 20 21 21 22 1.37 0.88 0.81 0.75 74.8 75.0 75.6 76.5 77.6 0.08 0.16 0.23 0.29
CaymanIslands 60 64 68 71 74 1.27 1.13 1.00 0.87100.0100.0100.0100.0100.0 0.00.00.00.0 Cuba 8,813 8,874 8,957 9,048 9,112 0.14 0.19 0.20 0.14 76.9 77.2 77.8 78.7 79.9 0.08 0.16 0.23 0.29 Curaçao 141 146 150 154 158 0.62 0.57 0.52 0.48 89.4 89.1 89.1 89.3 89.9-0.07-0.00 0.06 0.12 Dominica 51 53 56 58 59 0.94 0.84 0.67 0.48 69.6 71.1 72.6 74.2 75.7 0.43 0.43 0.42 0.41
DominicanRepublic 8,272 9,169 9,950 10,618 11,170 2.06 1.64 1.30 1.01 78.6 82.5 85.5 87.8 89.4 0.99 0.71 0.51 0.37 Grenada 38 40 42 44 46 0.76 0.86 0.87 0.95 36.0 36.5 37.5 38.9 40.7 0.30 0.52 0.72 0.91 Guadeloupe 443 442 441 442 441-0.08-0.04 0.04-0.02 98.4 98.5 98.6 98.7 98.8 0.01 0.02 0.02 0.02 Haiti 5,616 6,492 7,343 8,144 8,870 2.90 2.47 2.07 1.71 52.4 57.1 61.3 64.9 68.0 1.70 1.41 1.16 0.94 Jamaica 1,575 1,640 1,707 1,770 1,827 0.82 0.79 0.73 0.64 54.8 56.3 58.2 60.3 62.8 0.53 0.65 0.74 0.80 Martinique 343 344 344 344 344 0.02 0.03 0.00-0.03 89.0 89.1 89.5 90.1 90.8 0.04 0.08 0.13 0.15 Montserrat 0 0 1 1 1 0.64 0.94 1.20 1.52 9.0 9.1 9.4 9.9 10.6 0.16 0.58 0.98 1.38 PuertoRico 3,439 3,416 3,395 3,376 3,345-0.14-0.12-0.11-0.19 93.6 93.6 93.7 94.0 94.4-0.01 0.03 0.06 0.09 SaintKittsandNevis 17 18 18 20 21 0.92 1.06 1.22 1.37 30.8 30.8 31.4 32.4 34.0 0.01 0.34 0.66 0.96 SaintLucia 33 34 36 38 40 0.80 0.98 1.14 1.27 18.5 18.8 19.5 20.4 21.6 0.35 0.64 0.92 1.19 SaintVincentandtheGrenadines 56 59 62 64 67 1.03 0.94 0.84 0.75 51.0 53.0 55.2 57.3 59.4 0.80 0.78 0.76 0.73 SintMaarten(Dutchpart) 39 41 44 46 48 1.31 1.16 0.98 0.80100.0100.0100.0100.0100.0 0.00.00.00.0 TrinidadandTobago 725 733 742 753 768 0.22 0.23 0.30 0.41 53.3 53.2 53.7 54.8 56.5-0.04 0.19 0.40 0.60 TurksandCaicosIslands 32 35 37 40 42 1.77 1.46 1.24 1.05 92.2 93.6 94.6 95.3 95.8 0.30 0.21 0.15 0.10 UnitedStatesVirginIslands 100 101 100 99 96 0.10-0.11-0.29-0.44 95.4 95.9 96.4 96.8 97.0 0.12 0.10 0.07 0.06 CentralAmerica 127,304 138,768 149,898 160,493 170,368 1.72 1.54 1.37 1.19 73.7 75.4 76.9 78.5 80.0 0.44 0.41 0.40 0.38 Belize 163 183 205 230 256 2.32 2.30 2.23 2.17 45.4 46.0 47.1 48.6 50.5 0.27 0.46 0.63 0.78
CostaRica 3,695 4,074 4,391 4,647 4,846 1.95 1.50 1.14 0.84 76.9 80.8 83.7 85.8 87.3 0.99 0.71 0.50 0.34 ElSalvador 4,400 4,759 5,085 5,371 5,595 1.57 1.33 1.09 0.82 69.7 73.4 76.6 79.2 81.2 1.05 0.84 0.66 0.52
Guatemala 8,121 9,284 10,568 11,963 13,452 2.68 2.59 2.48 2.35 50.0 51.8 54.0 56.4 59.1 0.73 0.82 0.88 0.92
Honduras 4,943 5,672 6,421 7,169 7,892 2.75 2.48 2.20 1.92 55.2 58.4 61.4 64.3 67.0 1.13 1.02 0.92 0.82
Mexico 99,813 108,074 115,926 123,198 129,795 1.59 1.40 1.22 1.04 79.3 80.7 82.1 83.5 84.8 0.36 0.35 0.33 0.31
Nicaragua 3,521 3,787 4,071 4,387 4,709 1.45 1.45 1.49 1.41 57.9 59.0 60.5 62.3 64.3 0.38 0.49 0.58 0.66
Panama 2,647 2,935 3,230 3,528 3,824 2.06 1.92 1.77 1.61 66.7 68.4 70.3 72.2 74.2 0.51 0.53 0.55 0.55
SouthAmerica 347,768 368,409 387,288 404,258 419,148 1.15 1.00 0.86 0.72 83.5 84.6 85.6 86.5 87.5 0.25 0.24 0.23 0.22
Argentina 39,728 41,920 44,010 45,994 47,853 1.07 0.97 0.88 0.79 91.5 92.1 92.7 93.2 93.8 0.13 0.13 0.12 0.11
Bolivia(PlurinationalStateof) 7,335 8,095 8,887 9,700 10,520 1.97 1.87 1.75 1.62 68.4 70.1 71.9 73.7 75.5 0.50 0.50 0.50 0.49
Brazil 176,654 186,217 194,452 201,296 206,743 1.05 0.87 0.69 0.53 85.8 87.1 88.2 89.3 90.2 0.30 0.27 0.23 0.21
Chile 15,517 16,206 16,850 17,446 17,962 0.87 0.78 0.69 0.58 87.4 87.7 88.2 88.8 89.5 0.08 0.11 0.14 0.16
Colombia 38,469 40,892 43,011 44,804 46,258 1.22 1.01 0.82 0.64 79.8 81.4 82.9 84.3 85.6 0.41 0.37 0.33 0.30
Ecuador 10,235 11,124 12,063 13,049 14,077 1.66 1.62 1.57 1.52 63.4 64.2 65.3 66.7 68.5 0.24 0.34 0.44 0.52
FalklandIslands(Malvinas) 2 2 2 2 2 0.76 0.53 0.34 0.19 76.3 78.5 80.4 82.0 83.4 0.58 0.48 0.40 0.33
FrenchGuiana 227 261 296 334 373 2.78 2.55 2.38 2.21 84.5 85.8 87.0 87.9 88.8 0.31 0.26 0.22 0.19
Guyana 203 212 223 236 250 0.83 1.01 1.12 1.20 26.4 26.8 27.5 28.6 30.0 0.26 0.51 0.76 1.00 Paraguay 4,033 4,394 4,771 5,154 5,538 1.71 1.64 1.55 1.44 60.8 62.2 63.8 65.7 67.7 0.47 0.53 0.58 0.61 Peru 24,272 26,082 27,880 29,643 31,327 1.44 1.33 1.23 1.11 77.4 78.3 79.4 80.5 81.8 0.24 0.27 0.29 0.31 Suriname 365 382 399 417 435 0.90 0.88 0.86 0.83 66.1 66.1 66.7 67.6 69.0 0.03 0.16 0.28 0.39
Urban Population at Mid-Year by Country, 2015-2035 (thousands)
Average Annual Rate of Change of the Urban Population by Country, 20152035 (per cent)
Percentage of Population at MidYear Residing in Urban Country and Area, 2015-2035
Average Annual Rate of Change of the Percentage Urban by Country, 20152035 (per cent)
Region,subregion,countryorarea201520202025203020352015-
2020-
20252030 20302035
2020 20202025 20252030 20302035 Uruguay 3,262 3,338
0.33 0.26 95.0 95.5 95.9 96.3 96.6 0.10 0.09 0.08 0.07 Venezuela(BolivarianRepublicof) 27,465
0.94 88.2 88.3 88.6 89.0 89.6 0.03 0.07 0.10 0.14 NORTHERNAMERICA 290,616
0.92 0.84 81.6 82.6 83.6 84.7 85.8 0.22 0.24 0.26 0.27 Bermuda 62 61 60 59 58-0.44-0.20-0.26-0.36100.0100.0100.0100.0100.0 0.00.00.00.0 Canada 29,212 30,670 32,164 33,663 35,120 0.97 0.95 0.91 0.85 81.3 81.6 82.1 82.9 83.8 0.07 0.13 0.19 0.23 Greenland 49 50 51 51 51 0.42 0.41 0.21 0.02 86.1 87.3 88.4 89.3 90.1 0.28 0.24 0.21 0.19 SaintPierreandMiquelon 6 6 6 6 6 0.36 0.75 0.75 0.66 89.9 90.0 90.2 90.5 91.0 0.02 0.05 0.08 0.10 UnitedStatesofAmerica 261,288 273,975 287,421 301,001 313,969 0.95 0.96 0.92 0.84 81.7 82.7 83.7 84.9 86.0 0.24 0.26 0.27 0.27
OCEANIA 26,938 28,919 30,860 32,831 34,832 1.42 1.30 1.24 1.18 68.1 68.2 68.5 68.9 69.4 0.03 0.07 0.11 0.16 Australia/NewZealand 24,381 26,095 27,724 29,319 30,867 1.36 1.21 1.12 1.03 85.8 86.3 86.9 87.7 88.5 0.12 0.14 0.16 0.18 Australia 20,397 21,904 23,335 24,740 26,110 1.43 1.27 1.17 1.08 85.7 86.2 86.9 87.6 88.4 0.13 0.15 0.17 0.18 NewZealand 3,984 4,191 4,388 4,579 4,756 1.01 0.92 0.85 0.76 86.3 86.7 87.2 87.8 88.6 0.08 0.12 0.14 0.17
Melanesia 1,903 2,138 2,418 2,757 3,172 2.33 2.46 2.63 2.81 19.2 19.6 20.3 21.4 22.8 0.46 0.72 1.01 1.31 Fiji 488 529 567 601 632 1.62 1.37 1.17 0.99 54.7 57.2 59.7 62.0 64.1 0.90 0.83 0.76 0.69
NewCaledonia 187 205 224 242 259 1.89 1.72 1.56 1.40 69.4 71.5 73.5 75.3 76.9 0.61 0.54 0.48 0.43
PapuaNewGuinea 1,031 1,168 1,351 1,592 1,909 2.51 2.91 3.28 3.63 13.0 13.3 14.1 15.2 16.8 0.51 1.04 1.55 2.03
SolomonIslands 131 160 191 225 261 3.91 3.57 3.28 3.00 22.4 24.7 26.9 29.1 31.2 1.97 1.76 1.56 1.36
Vanuatu 66 75 85 97 111 2.55 2.55 2.58 2.62 25.0 25.5 26.3 27.4 28.7 0.45 0.62 0.80 0.96
Micronesia 353 375 397 421 443 1.21 1.18 1.14 1.03 67.9 69.2 70.4 71.5 72.6 0.37 0.33 0.31 0.30 Guam 153 160 167 173 178 0.92 0.84 0.72 0.58 94.5 94.9 95.3 95.7 96.0 0.09 0.08 0.07 0.07
Kiribati 58 68 78 88 97 3.19 2.77 2.36 2.02 51.6 55.6 59.1 62.2 64.8 1.48 1.23 1.01 0.82
MarshallIslands 40 41 43 45 48 0.61 0.61 1.09 1.36 75.8 77.8 79.5 81.1 82.4 0.52 0.44 0.38 0.32
Micronesia(Fed.Statesof) 23 25 27 29 32 1.05 1.52 1.86 1.90 22.5 22.9 23.7 24.9 26.5 0.42 0.70 0.96 1.21 Nauru 11 11 11 11 12-0.06 0.18 0.22 0.13100.0100.0100.0100.0100.0 0.00.00.00.0
NorthernMarianaIslands 50 51 52 53 53 0.29 0.36 0.35 0.16 91.4 91.8 92.3 92.8 93.3 0.10 0.10 0.11 0.11 Palau 17 18 20 21 22 1.77 1.59 1.36 1.08 78.2 81.0 83.3 85.0 86.4 0.71 0.55 0.43 0.33 Polynesia 301 312 321 334 350 0.67 0.57 0.83 0.92 44.5 44.4 44.5 45.0 45.7-0.04 0.05 0.22 0.30 AmericanSamoa 48 49 49 50 51 0.07 0.26 0.37 0.40 87.2 87.2 87.3 87.8 88.5-0.02 0.04 0.10 0.16
CookIslands 13 13 14 14 14 0.37 0.52 0.48 0.40 74.4 75.5 76.6 77.8 79.1 0.29 0.30 0.31 0.32
FrenchPolynesia 171 180 186 195 203 1.01 0.65 0.91 0.87 61.7 62.0 62.6 63.5 64.7 0.09 0.19 0.29 0.39
Niue 1 1 1 1 1 1.69 1.43 1.61 1.34 42.6 46.2 49.5 52.5 55.0 1.64 1.38 1.15 0.95 Samoa 37 36 36 37 39-0.47-0.03 0.51 1.30 18.9 17.9 17.4 17.3 17.7-1.11-0.61-0.07 0.47 Tokelau - - - - -0.00.00.00.00.00.00.00.00.00.00.00.00.0 Tonga 25 26 27 29 31 0.71 0.99 1.36 1.67 23.3 23.1 23.3 23.8 24.8-0.15 0.15 0.47 0.77 Tuvalu 7 7 8 9 10 2.27 2.08 1.83 1.51 59.7 64.0 67.6 70.5 72.8 1.39 1.09 0.84 0.64 WallisandFutunaIslands - - - - -0.00.00.00.00.00.00.00.00.00.00.00.00.0
Source: United Nations, Department of Economic and Social Affairs, Population Division (2018). World Urbanization Prospects: The 2018 Revision.
CountyYear
Afghanistan201142.985.282.94.577.966.198.053.842.747.394.486.867.0 Afghanistan201530.492.174.09.969.255.689.661.329.449.894.293.081.8
Albania200097.5100.099.394.898.4...99.5......67.7......... Albania200582.299.998.797.299.497.799.697.391.683.883.6...70.9 Albania200971.499.098.089.599.297.599.998.095.689.396.6...86.1 Albania201853.199.297.891.199.098.499.799.296.793.098.1...90.7 Algeria201276.094.6... 91.797.791.522.691.797.174.697.599.399.8 Angola200643.094.914.71.484.0...87.8.........45.966.686.3 Angola201162.095.9...19.388.7...88.385.797.861.892.882.988.5 Angola201552.086.658.611.787.360.976.972.298.064.586.366.480.3 Argentina200196.699.1...46.899.1...95.893.595.585.327.6...96.4 Argentina201186.398.2............97.6......91.588.688.6... Armenia200098.198.440.989.790.184.361.8............99.490.4 Armenia200599.199.574.493.999.097.675.9......87.945.999.999.2 Armenia201097.999.995.195.898.197.083.798.699.292.693.499.899.8 Armenia201698.7100.0 98.595.396.796.288.593.799.894.798.2100.099.7 Azerbaijan200677.697.476.471.092.282.021.293.398.875.667.199.798.9 Bangladesh200430.297.1......50.1...48.170.595.664.1...77.833.1 Bangladesh200728.899.6...8.661.241.156.880.097.568.257.882.937.4 Bangladesh201143.499.595.210.973.846.967.088.398.775.191.090.347.5 Bangladesh201429.899.692.210.884.453.866.389.899.575.594.590.847.4 Bangladesh201938.199.699.229.590.264.575.366.799.680.297.697.257.7 Barbados201299.199.930.27.098.595.185.190.998.297.894.899.199.8 Belarus200596.299.899.685.699.591.279.599.399.996.464.1100.099.7 Belarus201293.8 99.899.886.199.496.389.399.499.297.295.2...99.8
Belize200638.099.236.124.296.189.990.888.999.485.572.398.495.1 Belize201126.399.599.822.798.392.970.790.198.589.294.396.996.5
Belize201621.997.397.419.396.892.974.787.399.089.297.697.495.3
Benin200166.878.071.66.135.914.480.862.688.7......51.21.8
Benin200661.779.474.10.127.210.078.164.490.369.1...54.77.3 Benin201162.184.179.7...22.4...80.874.487.059.566.710.7
Benin201455.476.873.70.853.022.282.370.692.366.791.8...7.0
Benin201847.275.670.0...49.022.581.172.894.470.3...54.28.0
Bhutan201099.3 99.699.411.278.563.498.484.198.373.498.497.5 Bolivia200091.795.926.468.878.4...99.2......63.0.........
Bolivia200185.894.7...81.381.3............63.2......86.2 Bolivia200489.693.243.756.956.917.085.361.940.162.235.893.890.1
Bolivia200893.896.929.555.279.756.075.196.297.868.680.297.694.1
BosniaandHerzegovina200692.899.699.580.198.598.094.498.596.597.568.699.781.5
BosniaandHerzegovina201293.199.798.883.399.298.699.898.898.996.795.8...56.7
Botswana201596.898.2...36.374.3...96.192.297.777.2...79.271.4
BurkinaFaso200386.494.282.48.277.844.393.4............53.910.1
BurkinaFaso200687.6 98.4......9.58.796.754.696.679.358.761.914.3
BurkinaFaso201078.194.785.41.981.949.386.275.892.176.887.350.214.1
BurkinaFaso201479.394.070.01.792.351.983.274.796.076.496.959.425.3
BurkinaFaso201876.292.479.5...91.452.188.677.598.681.3...62.430.2
Burundi200569.579.972.311.747.328.558.072.396.358.935.947.62.5
Burundi201077.186.479.66.974.238.165.883.595.270.576.753.40.7
Burundi201292.197.591.811.192.545.671.283.598.978.383.260.8... Burundi201789.798.489.63.281.046.472.490.098.780.487.261.80.4
Cambodia200035.067.024.335.835.830.535.584.4.........62.016.0
Cambodia2004 55.164.6...75.577.9............48.275.883.736.1
Cambodia201054.994.7...41.087.979.991.786.498.054.391.991.749.6
Cambodia201453.598.2...40.892.685.293.689.399.158.397.197.361.0 Cameroon200467.785.573.915.757.236.675.9......80.446.676.922.6
Cameroon200568.386.5...22.397.4...80.284.695.175.2...79.529.2
Cameroon200667.689.4...1.751.137.772.9...94.880.859.382.324.0
Cameroon201165.290.375.91.583.355.482.183.694.879.689.987.428.2 Cameroon201460.194.384.80.383.756.081.283.796.481.296.388.332.3
Cameroon201854.294.886.52.983.759.184.883.495.777.595.489.237.5
CentralAfricanRepublic 200052.188.164.41.923.8...37.193.471.899.9...19.9...
CentralAfricanRepublic200656.688.865.60.765.842.033.597.974.199.825.725.41.1
CentralAfricanRepublic201050.285.345.90.173.441.735.364.573.897.873.627.20.4
Chad200055.559.80.935.4...79.1......56.6.........
Chad200444.959.639.07.019.5...21.395.482.261.9...20.2...
Chad201023.252.421.40.815.310.57.053.521.895.846.66.41.7 Chad201448.787.567.90.052.527.730.370.779.556.887.936.613.2
Colombia200097.898.559.789.0 95.579.094.5......82.7...99.494.4 Colombia200591.998.131.191.097.812.792.892.5...84.0...99.495.1 Colombia201091.998.345.090.698.089.061.093.4...88.494.599.496.5 Colombia201589.798.761.692.998.692.796.095.0...93.597.899.898.5 Comoros201282.797.689.57.452.840.473.883.290.572.188.885.28.7 Congo200984.196.6...6.776.317.992.571.998.475.191.153.319.9 Congo201178.895.878.92.559.417.991.076.499.467.793.758.925.5 Congo201468.798.692.523.776.031.594.188.699.4100.096.980.239.2
DemocraticRepublicoftheCongo200043.566.164.44.157.4...99.975.495.835.3.........
DemocraticRepublicoftheCongo200760.880.657.9 14.953.621.449.4...74.0...51.138.910.8
DemocraticRepublicoftheCongo201061.883.117.40.935.913.955.571.481.661.669.944.78.7
DemocraticRepublicoftheCongo201436.384.958.90.856.524.451.567.379.560.282.443.25.3
DemocraticRepublicoftheCongo201769.791.277.42.053.619.863.774.286.261.579.157.89.8
CostaRica200098.099.1...34.797.9...98.2......98.6...99.296.1
CostaRica201199.599.799.731.597.295.093.791.297.494.794.499.798.8
CostaRica201899.199.899.828.998.696.297.988.599.597.198.399.9...
Coted’Ivoire200068.595.879.928.165.7...76.8......56.2.........
Coted’Ivoire200669.396.116.26.284.840.297.392.897.199.262.688.527.9
Coted’Ivoire201273.396.5 92.115.046.7...97.5.........94.389.7...
Coted’Ivoire201674.595.06.911.077.148.498.495.395.7100.097.493.153.5
Cuba200682.598.344.552.897.192.7.....................
Cuba201084.698.691.556.796.292.8.....................
Cuba201486.498.186.658.895.891.6.....................
DominicanRepublic200034.697.595.674.681.0...97.992.599.581.0...99.41.6
DominicanRepublic200228.798.880.270.489.081.997.194.939.380.7...98.995.4
DominicanRepublic200718.599.497.678.396.186.898.395.747.086.278.298.995.0 DominicanRepublic20137.099.290.582.696.586.498.095.347.086.393.499.593.2 DominicanRepublic20146.4 98.444.827.894.784.198.592.599.588.995.099.095.4 Egypt200098.899.781.055.158.857.595.1......93.0...99.495.0 Egypt200399.699.992.163.964.964.896.2......95.8...99.898.0 Egypt200598.499.986.367.969.568.897.6......95.540.199.798.9 Egypt200898.7100.074.074.575.875.398.1......96.456.499.9... Egypt201496.899.888.391.799.898.998.7......92.294.999.9... ElSalvador200791.798.1...56.162.7...86.892.565.980.969.194.92.7 ElSalvador201468.199.285.553.899.089.891.591.399.682.596.898.291.3 EquatorialGuinea200018.860.445.830.692.3...82.9......68.6......... Eswatini2006 86.693.371.149.260.442.697.487.899.078.278.165.269.5 Eswatini201087.791.891.036.194.150.699.089.099.382.095.5...76.0
Ethiopia200080.385.357.22.44.22.233.6...86.8......77.41.7
Ethiopia200589.593.575.81.452.322.654.618.193.849.914.586.12.5 Ethiopia201185.694.669.82.845.418.449.819.194.158.567.283.74.2
Ethiopia201686.897.659.12.851.520.366.524.993.364.490.192.425.9
Fiji 200797.298.7......99.6......73.4...87.681.993.3... Fiji 201496.999.3...93.999.6......73.1......96.597.046.3 Gabon200092.493.477.431.858.7...89.996.799.176.1...90.880.0 Gabon 201294.897.362.538.064.640.992.599.399.776.697.497.890.6
Gambia200090.794.646.119.147.6...81.569.996.375.4...51.0... Gambia200687.591.260.07.793.350.793.975.097.672.474.555.23.0 Gambia201089.894.891.24.990.950.592.577.799.378.397.1...1.6 Gambia201383.593.790.82.377.154.867.292.998.965.996.773.00.3 Gambia201884.792.290.52.073.955.895.993.399.381.798.776.41.8 Georgia200591.199.098.880.498.796.098.397.399.389.169.698.581.8 Georgia201893.699.398.989.098.696.597.898.897.594.098.799.898.7 Ghana200867.196.488.73.886.717.995.590.597.065.880.483.823.0 Ghana201146.669.6...2.972.618.094.195.382.370.391.081.824.2 Ghana201441.596.586.712.985.620.498.189.498.668.893.790.335.2
Ghana201642.696.089.30.988.522.787.783.798.568.496.189.934.0 Ghana201837.695.894.23.880.724.698.293.698.461.695.789.926.9 Ghana201934.898.495.82.887.523.197.491.099.269.996.993.735.2 Guatemala200289.096.6...69.294.4...84.685.598.870.8...94.53.6 Guatemala201449.599.480.473.489.978.986.384.899.673.293.696.562.2 Guinea200566.377.968.97.659.925.890.5............63.10.6 Guinea201270.295.274.2 7.586.139.594.192.496.868.995.675.40.6 Guinea201664.398.446.12.787.443.397.397.497.258.896.783.41.6 Guinea201852.997.482.94.686.444.593.692.196.470.597.686.65.7 GuineaBissau200036.471.548.02.811.62.399.892.677.543.8......... GuineaBissau200645.782.356.112.928.821.775.944.687.855.656.736.62.5 GuineaBissau201458.791.771.61.649.325.975.919.996.767.398.135.91.4 Guyana200655.198.097.88.799.489.488.294.299.579.771.581.863.4 Guyana200930.498.671.611.796.190.773.295.796.085.490.890.275.9 Guyana201434.099.048.97.497.891.087.795.999.786.496.093.880.7 Haiti200651.993.1 81.83.051.027.889.692.499.161.037.569.25.7 Haiti201236.394.285.72.082.338.886.585.693.659.392.872.76.1 Haiti201725.397.491.40.679.547.090.591.596.666.292.376.48.7 Honduras200550.696.646.857.087.777.147.074.799.269.554.4...65.0 Honduras201239.798.450.560.391.380.150.376.499.075.893.2...68.1 India200669.596.185.028.177.154.780.089.392.353.038.093.159.3 India201667.997.788.722.485.371.284.992.792.763.797.297.679.5 Indonesia200229.382.872.8...83.4...86.077.396.9......98.019.8 Indonesia200728.482.140.6...88.677.488.799.198.8......98.221.5 Indonesia201218.4 63.039.5...90.7...91.297.698.384.793.699.373.6 Indonesia201713.896.695.95.195.1...97.995.799.687.696.399.088.0 Iran 200684.092.1...98.498.4...32.5......90.6...97.791.0 Iraq 200690.092.492.434.698.278.898.596.094.649.564.899.692.8 Iraq 201169.583.583.238.899.296.298.152.594.854.198.9...99.8 Iraq 201853.876.6......99.696.498.163.598.799.9......... Italy200193.999.2......99.0............99.5......... Jamaica200585.595.940.110.797.283.2.................. Jamaica201188.199.277.214.598.687.888.885.999.690.797.695.589.7 Jordan200771.6 99.7...64.699.896.899.999.4...69.193.599.099.9 Jordan200961.299.8...67.4100.098.6100.099.8...74.898.799.599.8 Jordan201252.399.8...68.799.999.7100.099.799.076.799.299.5100.0 Jordan201858.899.999.673.199.998.299.999.299.176.698.5...99.9 Kazakhstan200690.099.498.460.799.596.896.782.399.593.450.799.991.4 Kazakhstan201192.099.498.763.699.896.997.488.596.1100.094.4...96.8 Kazakhstan201587.490.7...65.399.997.699.793.099.592.998.4100.099.8 Kenya200370.277.951.539.150.425.777.5...89.666.5...51.513.3 Kenya200876.893.075.433.982.835.088.279.696.469.985.164.922.8 Kenya2014 65.988.770.018.275.330.980.269.297.065.794.765.122.6 Kenya201560.491.665.921.176.838.283.067.895.772.796.672.6... Kiribati201859.596.395.718.374.250.667.426.280.545.187.178.416.8
Kyrgyzstan201292.196.094.535.598.791.781.272.976.688.297.699.893.7
Kyrgyzstan201496.397.7...35.399.694.698.871.399.283.699.199.989.6
Kyrgyzstan201898.099.999.747.7100.096.697.296.598.588.798.6...92.8
LaoPeople’sDemocraticRepublic200622.284.283.86.883.679.293.583.893.673.273.493.17.5
LaoPeople’sDemocraticRepublic201119.392.692.41.391.387.693.987.896.580.096.997.511.7
LaoPeople’sDemocraticRepublic20176.896.796.61.394.191.295.691.998.976.098.099.516.2
Lebanon 201153.499.998.291.097.897.699.797.699.772.481.999.899.7
Lesotho200488.694.979.98.447.324.993.1............28.765.9
Lesotho200982.490.768.93.359.631.295.389.697.773.989.148.673.1
Lesotho201492.896.381.13.794.149.394.093.297.580.496.565.178.5
Lesotho201893.998.394.43.387.345.996.395.098.178.097.272.0...
Liberia201114.584.676.01.253.219.484.078.195.152.281.77.90.4
Liberia20135.090.278.01.758.226.376.771.795.560.683.817.00.2 Liberia201614.995.185.62.067.730.181.378.197.060.881.432.00.4 Madagascar201169.287.4...0.221.29.264.768.576.957.773.763.71.6 Madagascar201354.980.9...1.335.214.862.348.774.158.470.060.51.8 Madagascar201671.387.373.60.932.213.067.169.181.857.873.468.21.4
Madagascar201853.272.568.91.541.215.174.856.172.755.872.164.41.9
Malawi201269.391.983.014.245.132.869.395.082.173.976.737.110.3
Malawi201484.495.987.714.152.229.178.394.089.077.281.347.49.9
Malawi201488.798.684.92.484.948.876.982.988.398.385.648.010.4
Malawi201686.098.286.72.896.049.376.188.191.886.287.850.411.9
Maldives200956.999.334.199.299.997.598.898.499.661.399.699.999.3
Maldives201727.199.699.5 98.299.899.199.496.499.264.599.099.799.6 Mali 201274.494.091.26.886.545.364.370.288.075.895.277.31.5 Mali 201581.396.192.92.489.057.474.284.793.471.498.685.10.8 Mali 201577.793.588.53.581.952.874.684.686.9100.097.879.02.2 Mali 201876.995.392.45.285.144.879.084.693.274.797.085.71.3 Mauritania200746.495.287.92.368.154.373.083.146.048.383.873.460.7 Mauritania201158.097.585.44.373.753.067.383.082.751.195.979.293.5 Mauritania201567.097.488.75.374.465.677.179.378.054.296.9...64.1 Mexico200094.996.7...81.488.3...92.694.278.076.2...98.493.6 Mexico200595.097.9 ...82.793.7...93.6......77.6...98.1... Mexico201517.899.799.691.399.094.998.198.086.484.093.299.5... Moldova200573.398.9...67.191.684.788.199.599.195.957.499.599.0 Moldova201270.195.794.466.495.284.576.998.099.896.289.999.899.3 Mongolia200540.695.688.432.795.464.419.348.246.451.560.298.436.2 Mongolia201036.095.289.923.697.664.525.865.927.374.897.096.039.4 Mongolia201343.791.7...32.692.764.144.758.071.586.299.497.963.2 Mongolia201841.098.094.440.898.678.160.165.674.475.199.799.867.7 Montenegro200596.997.297.266.598.295.590.095.691.682.079.492.780.8 Montenegro201392.6 100.098.663.498.397.296.595.397.791.999.099.666.4 Montenegro201894.5100.099.759.799.298.199.897.399.388.6100.099.9... Morocco200496.198.0...98.098.691.392.6......78.5...94.899.1 Mozambique200963.279.8...4.254.042.458.468.163.882.760.047.76.0 Mozambique201171.784.867.90.047.439.357.949.069.978.771.859.39.4 Mozambique201576.592.284.826.047.340.368.959.479.176.084.373.22.8 Mozambique201878.989.484.22.969.559.569.271.280.284.887.172.213.5 Myanmar201611.393.382.00.978.967.654.552.393.667.294.292.857.7 Namibia200097.998.188.378.780.657.186.2......73.2...74.673.8 Namibia2007 96.597.484.273.180.261.983.381.881.177.879.578.476.3 Namibia201396.697.985.763.673.853.578.591.192.680.495.974.172.0 Nepal200647.795.792.320.477.042.568.179.193.967.923.689.843.4 Nepal201253.096.394.726.587.858.076.682.696.681.292.896.964.1 Nepal201461.098.596.924.993.762.780.283.697.684.397.797.476.2 Nepal201650.395.994.611.286.364.950.258.553.483.195.894.644.1 Nicaragua200190.395.947.029.271.866.967.461.798.954.311.894.356.1 Niger200690.893.484.26.940.924.760.1......51.840.550.53.1 Niger201294.197.072.12.877.940.272.240.856.754.884.862.73.9 Nigeria 201315.789.874.98.676.942.785.086.096.566.589.183.04.6 Nigeria201517.192.684.314.375.848.187.488.893.066.791.282.09.1 Nigeria201616.991.483.411.577.649.484.189.896.365.091.086.316.9 Nigeria201814.390.986.46.173.844.285.789.698.166.595.681.722.5
OccupiedPalestinianTerritory201054.399.1...62.099.591.399.3......85.820.7...99.2 OccupiedPalestinianTerritory201457.098.4...62.099.798.599.999.399.973.748.799.997.8 Pakistan201258.998.785.668.695.187.391.995.892.442.295.699.885.2 Pakistan201427.387.8...40.381.672.782.188.381.354.087.290.069.5 Pakistan201844.590.587.464.995.588.892.095.292.147.497.999.487.8 Panama201096.397.8...44.477.273.394.394.489.680.791.797.095.0 Panama201398.099.988.645.496.088.395.899.9100.086.195.898.5... PapuaNewGuinea201857.183.882.432.862.552.489.670.589.264.190.657.139.4 Paraguay200268.486.6...15.884.1...87.378.495.877.244.095.465.3 Paraguay201671.698.671.514.895.791.893.194.699.387.798.499.982.8 Peru200492.495.293.683.989.678.678.474.190.778.9...96.574.6 Peru200781.690.6......89.5...49.284.9...86.354.389.473.5 Peru201286.695.594.580.589.680.079.370.792.284.292.598.486.8 Philippines200366.798.492.192.293.8...73.9.........52.292.2 Philippines200842.998.289.33.593.875.382.379.995.061.983.193.852.2 Philippines201335.598.492.66.994.173.884.380.695.763.292.494.256.0
Philippines201731.298.497.57.095.179.091.877.697.566.794.596.470.3
Rwanda201065.089.263.73.888.156.358.569.198.783.076.147.30.2 Rwanda201373.497.672.40.085.853.662.477.299.786.884.661.90.9
Rwanda201581.490.469.47.486.649.770.469.599.887.488.473.91.3 Rwanda201774.995.688.25.294.153.673.876.299.291.889.784.96.8 SaintLucia201275.699.886.211.093.289.186.068.199.496.094.396.496.8
São Tomé and Príncipe 200996.399.381.2 6.049.542.695.2......78.060.772.80.6
São Tomé and Príncipe 20146.997.886.521.453.244.640.297.799.779.787.278.82.3 Senegal201685.093.745.211.389.765.792.992.398.475.998.289.849.0 Senegal201788.294.893.721.892.569.393.593.994.471.898.991.747.4 Senegal201884.695.393.919.994.672.995.193.397.874.198.893.654.9 Senegal201982.494.894.112.795.173.096.394.799.174.499.495.346.6
Serbia200591.399.799.283.797.394.993.094.397.492.283.5...84.2 Serbia201085.099.799.285.599.898.798.395.998.495.894.4...85.6 Serbia201485.399.698.483.399.398.299.799.298.596.796.899.882.3 SierraLeone201344.688.9 71.20.776.721.981.878.995.560.786.041.70.2 SierraLeone201637.991.481.11.276.828.178.586.793.662.590.443.90.7 SierraLeone201730.186.7...2.072.927.085.180.699.075.389.445.50.9 SierraLeone201830.186.776.72.474.027.087.380.699.174.399.947.81.2 Somalia200652.980.466.020.677.549.365.157.484.254.933.341.80.3 SouthAfrica201697.499.698.481.597.777.998.794.197.883.497.393.790.7 Sudan201061.596.495.33.060.246.822.147.337.054.488.3...56.5 Sudan201465.494.878.92.168.856.426.850.252.955.988.173.048.5
Suriname200091.298.22.584.399.179.799.3.................. Suriname200681.5 98.212.60.698.089.983.097.999.388.681.595.289.7 Suriname201081.399.149.11.797.887.785.898.299.690.196.597.393.7
Suriname201880.199.299.12.598.793.686.394.299.489.499.998.996.1 Syria200687.694.1...91.594.491.393.992.694.578.761.594.599.8
Tajikistan200589.894.7...55.397.989.486.874.491.182.526.399.789.3
Tajikistan201290.095.093.247.698.593.192.981.398.277.196.299.894.8
Tajikistan201791.798.698.050.299.796.094.385.699.180.096.999.297.0
UnitedRepublicofTanzania201058.576.860.01.448.629.576.748.693.077.880.946.94.7
UnitedRepublicofTanzania201170.091.185.52.071.640.978.591.094.581.989.447.12.4
UnitedRepublicofTanzania2015 61.392.382.51.891.054.881.091.894.780.294.055.67.6
UnitedRepublicofTanzania201771.490.085.02.386.749.478.692.196.081.994.257.47.3
Thailand200539.899.098.99.399.895.080.097.199.287.089.299.780.4 Thailand201537.699.799.611.299.697.671.896.399.284.870.599.384.6 Thailand201637.698.798.610.899.696.885.297.699.690.498.299.784.6
Timor-Leste200963.288.685.719.982.965.970.362.993.071.075.684.48.3
Timor-Leste201655.897.094.60.088.976.885.069.195.179.197.598.421.9 Togo201055.187.3...0.473.128.095.293.297.071.186.176.05.6 Togo201349.591.489.10.178.528.096.691.298.868.092.684.112.4 Togo 201751.390.989.01.280.428.097.595.198.869.496.888.815.9 TrinidadandTobago200083.092.79.431.371.062.9...96.8...89.0.........
TrinidadandTobago200683.495.735.119.198.792.180.292.199.594.491.297.599.6
TrinidadandTobago201184.499.599.231.898.493.284.694.798.094.198.0...99.9
Tunisia201169.699.999.682.399.897.899.799.999.790.597.6...99.9 Tunisia201839.599.098.382.799.798.599.999.499.793.1100.099.999.8 Turkey200468.994.612.991.396.995.587.7......83.176.4......
Turkey201357.099.698.596.599.498.696.9......90.198.3......
Turkmenistan200682.999.999.948.999.892.488.098.596.889.814.799.9...
Turkmenistan201954.2100.0100.052.199.497.8100.099.299.991.3100.099.9... Uganda201167.694.079.69.178.225.979.473.691.462.186.954.83.8 Uganda201462.490.684.12.870.031.667.467.791.963.889.350.91.5 Uganda201650.591.578.12.670.031.872.173.990.367.891.257.72.1 Uganda201949.587.775.51.170.037.972.373.293.264.492.570.52.6 Ukraine200591.199.498.896.098.897.683.599.799.797.071.8100.098.0
Ukraine200782.099.6...69.999.295.871.596.897.898.082.499.997.9
Ukraine201282.899.899.174.999.898.282.097.899.898.697.3...97.5 Uruguay200692.399.5...52.997.6...91.098.086.692.157.098.7 93.3 Uruguay201190.795.4...53.893.7...95.594.394.892.588.195.593.7 Uruguay201394.399.993.859.598.494.495.894.898.193.994.899.099.8
Uzbekistan200698.499.8...45.999.997.799.099.098.889.522.099.799.1
Vanuatu200763.397.996.0...91.259.793.493.097.176.575.985.443.7
Venezuela200087.393.092.169.287.990.9100.096.599.580.2......97.2
Venezuela200189.998.0...73.389.7...95.389.491.379.4...97.997.7
VietNam200276.496.925.882.886.5...94.8...97.571.8...99.4...
VietNam200563.798.3...80.886.983.396.294.498.680.5...99.667.4
VietNam200659.199.097.7 2.789.684.894.293.498.689.057.099.471.5
VietNam201054.998.798.63.993.888.997.894.299.488.394.1...81.4 VietNam201353.498.698.52.192.089.499.195.499.484.597.199.978.3 Yemen200653.974.8...39.792.690.482.3......50.761.695.595.4 Yemen201342.096.727.664.590.686.394.292.437.656.095.098.693.9 Zambia200282.790.484.446.949.037.380.1............50.241.7 Zambia200776.382.279.728.472.044.284.491.092.363.768.152.441.5 Zambia201373.389.383.224.973.339.385.792.492.769.591.462.925.1 Zambia201871.491.287.417.279.240.988.084.295.869.391.870.918.1 Zimbabwe200597.599.6 99.085.798.265.199.199.299.679.338.892.188.4 Zimbabwe200976.798.195.085.297.720.697.697.998.878.661.5...84.2 Zimbabwe201076.795.693.176.493.849.997.097.898.876.892.184.774.3 Zimbabwe201565.097.493.675.595.652.397.297.599.181.597.481.373.0 Zimbabwe201965.597.391.784.598.443.098.998.398.984.299.990.182.8
Notes:
a Improved drinking water sources include: piped water into dwelling, plot or yard; public tap/stand pipe; protected spring; rainwater collection; bottled water (if secondary source is also improved); bore hole/tube well; and, protected dug well.
b Basic drinking water services are defined as drinking water from an improved water source whose collection time is no more than 30 minutes for a round trip incluidng queuing.
c Improved sanitation facilities include flush/pour-flush toilets or latrines connected to a sewer septic tank or pit; ventilated improved pit latrine; pit latrine with a slab or platform which covers the pit entirely; and, composting toilets/latrines.
d Basic sanitation services are improved facilities that not shared with other households.
e Durable floor is floor made of the following materials: parquet, carpet, cement, bricks, tablets, mat, adobe, etc.
f Durable wall is wall made of finished materials such as covered adobe, bricks, cement blocks, wood planks, etc.
g Durable roof is roof made of finished materials such as metal, wood, ceramic tiles, cement, roofing shingles, etc.
h Proportion of population living in households in which not more than three people share the same habitable room.
CountyCity
AfghanistanKabul201138.095.292.32.067.148.499.160.737.937.497.289.288.5
AfghanistanKandahar201155.999.299.216.089.881.192.165.857.187.192.193.756.0
AfghanistanKunduz201121.057.055.51.083.778.599.447.177.829.693.570.628.5
AfghanistanKabul201532.495.485.816.678.760.882.669.942.249.294.796.597.9
AfghanistanKandahar201510.297.539.36.764.056.798.346.923.460.197.786.284.6
AlbaniaTirana200960.498.997.599.0100.098.6100.099.899.290.697.9100.097.3
AlbaniaTirana201821.499.497.597.699.198.199.999.799.393.799.1...97.9
AngolaLuanda200649.6100.016.40.593.8...97.2......100.040.374.397.6
AngolaLuanda201155.999.1...19.394.595.795.698.359.597.088.496.1
AngolaBenguela201573.286.755.34.577.847.572.966.898.756.384.456.475.2
AngolaHuambo201544.783.745.78.789.160.765.344.697.651.869.546.373.5
AngolaLuanda201556.195.971.212.897.371.894.596.299.267.594.982.397.1
ArgentinaBuenosAires201170.797.6............98.3......92.089.989.9...
ArgentinaCatamarca201198.399.8............96.0......89.186.286.2...
ArgentinaCórdoba201193.899.6...... ......98.7......93.385.085.0...
ArgentinaCorrientes201196.199.2............95.4......84.591.091.0...
ArgentinaFormosa201188.791.7............91.7......84.189.289.2...
ArgentinaLaRioja201198.498.7............97.0......85.892.592.5...
Argentina Neuquén 201199.099.7............99.5......92.295.295.2...
ArgentinaSalta201198.098.2............89.7......80.276.576.5...
ArgentinaSanJuan201198.799.4............94.9......85.790.790.7...
ArgentinaSantiagoDelEstero201197.699.2............93.0......90.290.990.9...
ArmeniaYerevan200099.499.430.992.192.784.468.4......... ...99.496.5
ArmeniaYerevan200599.599.511.798.899.797.986.0......87.089.999.999.9
ArmeniaYerevan201099.8100.0...99.399.798.490.599.199.491.694.099.799.9
ArmeniaYerevan201699.999.9...98.199.098.494.894.399.794.898.0......
AzerbaijanBaku200688.799.581.688.198.485.129.097.599.879.677.599.599.9
BangladeshDhaka200414.199.3......30.6...38.277.399.657.6...92.223.1
BangladeshRajshahi2004............29.2...22.743.093.763.6...38.13.1 BangladeshDhaka200649.999.799.221.656.438.664.151.798.463.052.288.651.2 BangladeshDhaka200766.1100.0...22.257.935.583.094.6100.056.667.197.071.0 BangladeshRajshahi2007 28.999.5...4.266.140.942.165.599.578.750.473.79.7
BangladeshDhaka201352.699.999.834.484.251.978.567.299.771.096.794.566.8
BelarusVitebsk200588.399.999.576.398.091.758.698.1100.097.961.4100.098.9
BelarusVitebsk201295.699.999.883.999.496.991.799.999.798.392.9...99.3
BelizeBelizeCity200627.999.732.045.497.290.789.283.999.487.172.599.097.2
BelizeCorozal2006...96.745.80.098.692.695.893.5...94.977.299.594.9
BelizeBelizeCity201130.599.899.347.495.189.750.382.599.789.994.197.199.2
BelizeBelizeCitySouthSIde201623.195.096.346.096.692.653.971.899.186.397.498.398.2
BelizeCorozal20162.096.197.35.499.296.6 94.094.499.789.196.097.794.0
BeninCotonou200199.9100.098.212.480.226.097.887.898.8......77.54.7
BeninDjouguo200663.891.184.2...39.120.577.763.194.066.136.351.70.8
BeninPorto-Novo200665.276.585.6...43.814.193.983.693.265.860.068.411.3
BeninCotonou201192.198.798.7...25.1...95.493.890.260.7...91.523.7
BeninCotonou201896.598.398.3...85.534.395.789.299.168.5...86.928.2
BeninDjouguo201832.893.984.8...65.339.585.980.398.965.9...57.51.7
BeninPorto-Novo201859.085.080.8...57.528.695.185.190.274.9...58.69.8
BoliviaCobija200486.586.521.440.040.08.244.399.225.065.936.385.7 92.2
BoliviaCochabamba200483.197.660.265.865.815.992.764.435.672.232.897.294.6
BoliviaLaPaz200487.790.143.154.754.719.079.143.78.859.733.294.391.7
BoliviaOruro200493.294.266.658.858.820.292.320.814.159.425.096.796.7
BoliviaPotosí200496.396.461.871.571.529.689.712.322.557.318.897.298.4
BoliviaSantaCruz200495.696.042.548.348.311.489.190.573.160.448.592.187.2
BoliviaSucre200496.397.252.383.783.729.594.248.564.165.625.995.093.0
BoliviaTarija200496.897.432.172.272.227.790.477.347.265.334.292.288.5
BoliviaTrinidad200459.565.224.233.833.85.546.072.155.952.723.082.263.0
BoliviaCobija200885.587.1 5.331.278.162.244.937.296.075.988.296.292.4
BoliviaCochabamba200883.098.176.963.782.461.489.699.498.872.777.898.694.0
BoliviaLaPaz200897.897.90.075.482.756.653.199.899.771.080.698.797.5
BoliviaOruro200896.397.343.365.168.848.267.599.498.267.573.796.998.2
BoliviaPotosí200897.697.811.378.681.251.271.199.497.861.776.497.898.9
BoliviaSantaCruz200898.999.0...22.778.155.292.795.097.665.986.497.692.9
BoliviaSucre200893.498.564.671.673.050.085.9100.098.267.268.797.391.4
BoliviaTarija200899.599.738.474.388.662.993.097.899.275.584.395.793.3
BoliviaTrinidad200863.266.46.518.467.248.244.459.881.056.765.690.571.4
BosniaandHerzegovinaSarajevo200697.399.699.692.398.298.282.598.296.897.773.1100.095.4
BosniaandHerzegovinaTuzla200672.872.8...89.899.799.6.........98.167.9...96.3
BosniaandHerzegovinaSarajevo2012100.0100.0100.098.399.298.299.999.8100.099.295.7...85.1
BosniaandHerzegovinaTuzla201281.0100.097.193.2100.099.599.796.6100.093.997.9...63.3
BotswanaFrancistown201598.899.0...59.780.2...99.093.799.086.6...77.876.7
BotswanaGaborone201594.796.258.786.9...95.894.295.887.1...85.794.4
BurkinaFasoOuagadougou200396.098.783.414.378.552.296.5............57.116.0
BurkinaFasoOuagadougou200683.899.0......16.715.298.351.599.681.165.966.324.1
BurkinaFasoOuagadougou201093.699.191.32.795.368.389.682.497.973.192.458.125.1
BurkinaFasoOuagadougou201495.695.679.23.499.067.485.382.496.174.697.762.145.8
BurkinaFasoOuagadougou201893.997.390.3... 96.958.290.690.399.984.4...72.656.7
BurundiBujumbura201297.597.891.917.592.938.978.688.2...74.388.969.50.0
CambodiaPhnomPenh200076.898.088.382.582.572.380.098.5.........98.238.1
CambodiaSiemReap2000...58.434.424.724.721.621.082.7.........54.85.0
CambodiaPhnomPenh200481.183.3...86.687.5............51.883.692.756.9
CambodiaSiemReap200417.521.3...70.171.9............40.176.777.828.3
CameroonDouala200677.098.7...5.263.548.375.80.099.384.980.399.248.6
Cameroon Yaoundé 200694.698.4...1.659.141.881.50.098.578.884.999.352.5
CameroonDouala201162.499.090.30.996.261.092.698.499.981.8 97.397.845.2
Cameroon Yaoundé 201184.398.185.72.891.151.993.586.398.281.095.399.256.7
CameroonBafoussam201849.190.284.11.192.066.286.485.199.785.697.695.718.4
CameroonGaroua201842.389.783.01.483.372.377.779.493.273.891.167.77.6
Cameroon Yaoundé 201862.098.592.73.889.952.993.694.796.074.598.099.363.5
CentralAfricanRepublicBangui200081.198.273.83.430.6...50.094.597.299.9...36.1...
CentralAfricanRepublicBangui200682.797.570.21.567.638.045.198.698.799.844.546.62.3
CentralAfricanRepublicBangui201082.096.456.00.395.748.545.470.197.698.391.746.90.7
Chad N’Djaména 200451.267.323.812.235.3...31.698.797.863.9...35.3...
Chad N’Djaména 2010 72.799.414.16.272.642.740.165.790.995.992.242.415.1
Chad N’Djaména 201456.699.891.2...69.832.237.873.498.858.594.954.835.0
ColombiaArmenia200597.799.9...99.099.98.497.490.1...92.2...98.197.7
ColombiaBarranquilla200587.295.928.078.495.013.897.697.8...75.1...99.694.6
ColombiaBogotáD.C.200596.999.828.899.599.916.092.899.1...87.7...99.697.8
ColombiaBucaramanga200595.998.6...94.097.312.584.893.0...90.5...99.994.8
ColombiaCali200598.399.834.197.898.716.996.292.9...88.7...99.997.2
ColombiaCartagenadeIndias200583.595.331.658.991.99.296.491.4...73.0...99.893.3
ColombiaCúcuta200596.398.7...92.497.610.4 96.488.7...80.2...99.795.1
Colombia Ibagué 200598.399.4...98.799.813.096.092.0...84.0...99.195.4
ColombiaManizales200599.599.5...99.899.83.888.976.8...92.7...99.698.3
ColombiaMedellín200591.597.326.795.598.96.293.991.5...86.8...98.996.3
ColombiaMontería200563.892.843.154.094.313.088.189.0...73.1...99.186.7
ColombiaNeiva200599.199.3...97.398.815.191.685.6...84.7...98.790.7
ColombiaPereira200597.997.9...99.399.810.392.576.5...90.4...99.498.1
ColombiaPopayán200580.399.164.893.795.813.978.682.7...86.1...97.288.8
ColombiaRiohacha200566.595.836.575.996.48.981.293.7...73.2...98.9 91.7
ColombiaSantaMarta200579.796.1...63.593.812.696.791.9...67.7...98.785.3
ColombiaSincelenjo200589.497.943.784.394.711.397.880.9...71.9...99.384.1
ColombiaTunja200589.598.6...96.999.411.690.190.5...89.3...99.787.6
ColombiaValledupar200591.499.0...80.391.614.893.895.4...67.3...97.593.3
ColombiaVillavicencio200571.687.2...98.299.317.487.797.2...83.3...99.397.2
ColombiaArmenia201097.2100.0...97.799.593.264.392.9...92.995.398.698.5
ColombiaBarranquilla201095.199.993.080.397.085.748.698.2...83.794.699.797.4
ColombiaBogotáD.C.201098.699.9...99.499.891.878.699.2...93.296.699.599.0
ColombiaBucaramanga201097.298.9 ...95.999.087.068.492.3...92.296.199.296.6
ColombiaCali201096.298.610.195.497.887.070.494.2...92.694.399.397.9
ColombiaCartagenadeIndias201083.195.763.168.992.081.845.390.0...75.492.099.694.4
ColombiaCúcuta201094.397.7...93.098.687.555.391.0...80.494.299.396.0
Colombia Ibagué 201093.498.913.994.096.989.137.491.7...87.190.899.393.9
ColombiaManizales201097.899.70.098.399.691.557.978.3...93.396.9100.098.1
CountyCity
ColombiaMedellín201096.198.820.794.099.195.467.394.0...91.891.699.898.8
ColombiaMontería201073.993.126.543.894.883.622.283.4...76.291.499.585.4
ColombiaNeiva201097.197.1...97.099.289.345.689.7...86.694.299.496.0
ColombiaPopayán201088.698.0...93.299.085.360.385.9...92.295.599.496.3
ColombiaQuibdo201032.799.997.929.974.969.228.968.3...89.393.692.784.0
ColombiaRiohacha201067.598.827.373.092.086.324.984.8...71.094.499.486.3
ColombiaSantaMarta201079.593.236.160.794.185.930.594.7...74.989.999.891.9
ColombiaSincelenjo201077.295.372.670.191.182.925.979.9...69.691.299.482.8
ColombiaValledupar201094.997.9...88.396.489.026.891.9...75.493.298.494.1
ColombiaVillavicencio201059.494.926.697.199.687.452.796.2...87.997.299.196.5
ColombiaArmenia201596.0100.0...99.5100.097.497.693.4...97.998.899.799.1
ColombiaBarranquilla201598.099.7...93.398.486.997.997.7...86.197.099.898.6
ColombiaBucaramanga201597.099.70.098.799.893.399.197.1...97.497.6100.099.3
ColombiaCali201597.099.458.696.398.593.398.396.4...96.097.799.899.0
ColombiaCartagenadeIndias201587.895.360.6 67.595.488.193.490.3...88.197.499.896.8
ColombiaCúcuta201593.199.0...97.999.495.298.194.5...91.397.499.998.4
Colombia Ibagué 201590.699.8...98.198.890.497.394.1...92.197.499.597.6
ColombiaMedellín201595.699.431.296.098.696.298.395.3...95.196.699.999.6
ColombiaMontería201562.897.954.270.898.592.286.790.0...89.097.7100.096.5
ColombiaNeiva201595.599.4...95.898.494.096.891.9...96.099.599.798.7
ColombiaPereira201598.799.9...96.699.295.494.093.7...97.798.799.799.6
ColombiaPopayán201594.299.4...93.599.187.294.889.1...95.098.299.797.2
ColombiaRiohacha201538.399.288.384.397.794.995.192.4... 82.798.1100.095.4
ColombiaSantaMarta201564.897.174.568.797.092.394.996.1...77.997.798.496.0
ColombiaSincelenjo201593.197.943.774.497.091.585.286.7...88.797.899.593.9
ColombiaTunja201576.199.8...99.5100.094.096.796.1...95.999.1100.097.3
ColombiaValledupar201598.399.3...90.397.794.094.494.0...82.497.099.298.0
ColombiaVillavicencio201557.398.3...99.4100.095.498.295.3...95.899.399.799.0
ComorosMoroni201288.299.985.99.026.622.474.886.198.382.793.785.16.1
CongoBrazzaville200985.198.9...6.674.314.592.886.098.975.490.462.417.5
CongoBrazzaville201176.696.278.52.261.817.489.688.099.169.194.163.723.6
CongoBrazaville 201470.498.192.90.079.731.093.989.998.566.497.285.739.1
CongoBrazzaville201470.498.192.925.279.631.093.991.099.4100.097.285.739.1
DemocraticRepublicoftheCongoKinshasa200068.170.369.97.473.8...99.886.597.032.2.........
DemocraticRepublicoftheCongoKinshasa200789.894.173.430.963.016.091.7...98.0...78.984.127.5
DemocraticRepublicoftheCongoKinshasa201078.688.85.60.657.318.590.194.199.555.386.676.315.3
DemocraticRepublicoftheCongoKinshasa201451.899.284.30.864.120.793.292.699.751.095.990.415.4
CostaRica San José 201199.599.599.548.497.295.791.988.996.594.195.099.899.7
Coted’IvoireAbidjan200689.492.718.916.689.839.398.795.298.799.475.592.51.6
Coted’IvoireAbidjan201298.598.995.727.246.8 ...99.1.........96.696.6...
DominicanRepublicLaRomana20028.297.689.660.083.667.896.591.034.071.3...98.495.2
DominicanRepublicLaVega200241.393.970.267.993.286.097.593.431.584.7...99.396.4
DominicanRepublicSanFranciscodeMacorís200219.399.274.361.794.288.798.695.133.090.2...99.696.9
DominicanRepublicSantiago200245.799.982.482.590.987.497.598.539.284.4...99.396.2
DominicanRepublicSantoDomingo200213.199.890.485.388.383.098.297.854.782.0...99.297.9
DominicanRepublicLaRomana20076.799.396.069.693.370.598.192.137.579.979.598.994.7
DominicanRepublicLaVega200731.998.997.379.296.890.798.998.529.389.277.599.096.7
DominicanRepublicSanFranciscodeMacorís200710.299.596.872.695.690.299.197.536.087.878.3 98.495.4
DominicanRepublicSanJuan200753.899.393.455.489.182.090.088.636.285.465.099.779.9
DominicanRepublicSantiago200732.599.299.189.999.294.699.398.548.392.784.799.496.4
DominicanRepublicSantoDomingo20079.099.898.386.696.489.198.495.758.786.882.399.097.8
DominicanRepublicLaRomana20131.9100.0...80.596.378.899.092.547.480.193.999.695.0
DominicanRepublicLaVega201319.399.662.983.396.690.998.196.935.789.391.999.194.0
DominicanRepublicSanJuan201320.596.286.166.394.184.496.496.023.383.891.998.883.0
DominicanRepublicSantiago20138.698.686.587.496.789.798.298.751.089.694.199.594.8
DominicanRepublicSantoDomingo20132.799.491.688.998.189.298.094.552.483.994.3100.096.4
EgyptAlexandria200598.9 99.6...86.186.784.699.7......96.841.099.999.1
EgyptCairo200599.3100.086.875.876.476.099.5......95.051.399.899.0
EgyptAlexandria200899.6100.0...88.489.188.299.5......96.064.899.6...
EgyptCairo200899.9100.0...81.081.981.599.4......95.957.0100.0...
EgyptAlexandria201497.197.195.695.399.999.699.0......93.996.8......
EgyptCairo201499.1100.0...99.8100.098.999.5......94.494.9100.0...
EswatiniMbabane200686.492.572.645.754.645.595.879.999.679.480.862.965.3
EthiopiaAddisAbaba200599.999.990.32.273.326.886.421.699.850.737.097.25.0
EthiopiaAddisAbaba201199.699.681.15.873.224.586.325.298.864.189.598.610.3
EthiopiaAddisAbaba201697.199.775.810.081.629.094.035.497.766.997.599.859.6
GabonLibreville200099.599.792.337.669.244.796.797.999.175.295.792.5
GabonLibreville/Port-Gentil201297.198.469.545.677.147.096.8100.099.775.698.399.596.0
Gambia Banjul200680.380.88.445.596.639.898.976.5...63.081.783.04.7
GambiaBanjul201899.9100.0100.098.499.756.099.897.199.282.099.096.32.6
GeorgiaTbilisi200599.9100.0100.098.099.996.599.397.899.587.076.098.698.6
GeorgiaTbilisi201898.6100.099.898.499.497.297.899.396.793.899.299.999.8
GhanaAccra200662.668.867.74.887.823.299.097.9100.061.477.189.337.1 GhanaAccra200859.499.091.710.293.928.696.096.899.471.891.290.544.2
GhanaAccra201429.399.897.422.792.226.798.890.499.670.996.995.252.3
GhanaKumasi201448.396.188.511.084.820.998.797.1...60.293.993.134.6
GhanaAccra201631.899.998.81.5 95.730.589.088.599.968.896.793.846.1
GhanaKumasi201638.789.379.5...96.224.079.595.999.461.397.189.236.7 GhanaAccra201911.8100.099.52.297.123.599.195.7100.074.197.897.655.1
GhanaKumasi201936.299.399.1...88.736.399.895.699.366.296.790.539.6
GuatemalaGuatemalacity201436.3100.098.986.596.183.592.490.299.978.396.798.989.3
GuineaConakry200591.795.088.812.674.729.597.8............95.50.8
GuineaConakry201286.599.476.67.791.138.394.999.399.959.196.993.80.3
GuineaBissauSAB200052.487.758.71.711.73.099.893.890.334.7.........
GuineaBissauSAB200659.692.164.617.937.127.188.346.494.749.8 67.544.03.4
GuineaBissauSAB201471.296.977.52.263.832.082.525.298.861.198.243.62.0
GuyanaGeorgetown200530.899.599.413.196.382.977.682.798.778.973.079.074.9
GuyanaGeorgetown200914.899.2...17.398.294.476.098.194.684.591.290.985.4
HaitiPort-Au-Prince200660.798.089.54.658.830.096.898.3100.062.252.589.89.6
HaitiPort-Au-Prince201239.297.889.53.885.841.394.092.297.454.993.987.610.0
HaitiPort-Au-Prince201723.299.192.41.185.149.294.893.596.363.392.988.813.2 HondurasTegucigalpa200558.396.858.369.885.170.965.475.498.771.955.5...69.5 HondurasTegucigalpa201249.499.577.774.792.078.267.279.399.174.993.1...71.5 IndiaHyberabad2006 88.299.986.152.679.254.260.086.888.841.937.291.665.9 IndiaJaipur200690.198.950.053.298.765.398.4...99.770.556.9...83.9 IndiaKanpur200643.999.194.938.181.451.083.394.892.949.143.193.665.7 IndiaKolkota200678.899.994.540.198.147.096.795.998.658.246.097.756.3 IndiaMumbai200697.699.190.577.995.850.787.897.199.343.251.899.079.8 IndiaNewDelhi200685.3100.062.273.685.166.596.098.296.955.661.299.482.6 IndiaHyberabad201664.998.194.68.785.477.875.997.095.761.196.199.689.8 IndiaJaipur201677.298.279.420.085.074.188.996.494.167.198.498.778.3 IndiaKolkota201659.398.192.73.986.262.5 80.589.689.572.494.797.458.8 IndiaMumbai201692.398.781.028.983.660.392.394.798.450.897.795.887.4 IndiaNewDelhi201675.799.784.257.593.074.996.797.892.560.198.899.898.1
IndiaSrinagar201686.698.287.618.975.967.893.293.798.383.698.899.789.8
IndonesiaBandung200217.678.868.2...87.0...88.180.899.3......97.912.6
IndonesiaJakarta200240.389.396.1...98.6...97.789.099.6......99.934.4
IndonesiaKediri200230.492.049.8...77.6...93.389.999.6......99.921.3
IndonesiaMedan200237.773.448.7...88.3...95.767.592.1......93.420.3
IndonesiaSurabaya200229.086.497.4...72.9...94.391.3............ 17.7
IndonesiaBandung200719.477.635.5...93.681.793.699.999.9......98.520.1
IndonesiaJakarta200735.595.266.4...96.181.098.399.499.8......99.737.6
IndonesiaMedan200751.682.035.2...95.986.393.299.197.1......99.625.0
IndonesiaPalembang200726.278.153.0...89.377.777.899.494.6......96.222.3
IndonesiaSurabaya200717.586.654.8...84.574.491.199.5.........99.314.3
IndonesiaSurakarta200733.978.140.6...80.269.088.799.999.8......96.614.8
IndonesiaUjungPandang200757.681.571.4...93.784.766.490.597.1......99.326.0
IndonesiaBandung201212.467.335.3...90.5...94.199.099.685.093.399.584.0
IndonesiaJakarta201219.273.2 62.9...99.3...96.498.298.575.098.099.790.9
IndonesiaMedan201223.353.933.1...96.5...96.497.698.878.995.399.473.1
IndonesiaPalembang201238.762.214.1...94.0...88.699.198.479.995.599.887.4
IndonesiaSurabaya201220.864.346.5...86.2...94.598.199.688.993.099.777.6
IndonesiaSurakarta201221.973.239.4...85.0...93.198.399.391.587.899.471.8
IndonesiaUjungPandang201231.043.717.2...92.1...66.085.795.866.495.299.278.1
IndonesiaBandung20179.695.994.65.393.3...98.796.699.988.095.999.093.0
IndonesiaMedan201722.598.698.32.797.0...99.393.899.281.396.199.690.6
IndonesiaPalembang201730.192.991.92.894.2...99.194.198.477.298.199.293.4
IndonesiaSurabaya201710.597.797.55.894.5...96.896.3100.093.595.599.089.6
IndonesiaSurakarta201721.295.494.64.694.3...94.392.399.893.194.398.685.1
IndonesiaUjungPandang201723.098.798.07.795.9...98.294.999.178.397.999.394.5
IraqBaghdad200697.999.899.865.199.772.499.398.196.055.466.599.787.6
IraqBasra20060.73.73.743.391.868.895.971.394.766.978.899.998.3
IraqKirkuk2006.........11.699.883.897.493.892.748.089.1...99.2
JordanAjloun200771.499.3...38.899.997.9100.099.8...63.293.699.5100.0
JordanAmman200769.199.9...79.699.995.3100.099.1...73.294.698.699.9
JordanAqaba200797.1100.0...77.498.597.699.399.2...64.194.098.699.5 JordanBalqa200778.399.2...76.399.798.999.799.6...66.790.199.1100.0
JordanIrbid200762.799.5...37.499.597.6100.099.9...66.493.399.3100.0
JordanJerash200782.399.6... 36.599.696.9100.0100.0...57.389.999.4100.0
JordanKerak200788.0100.0...23.699.493.1100.096.6...58.090.199.699.9
JordanMadaba200784.999.7...63.8100.098.9100.0100.0...63.491.398.899.9
JordanMafraq200788.299.7...36.399.995.2...100.0...59.390.599.5100.0
JordanZarqa200773.199.9...69.999.998.899.999.6...69.193.499.8100.0
JordanAjloun200964.098.9...43.8100.099.2100.0100.0...71.298.299.699.9
JordanBalqa200970.698.5...71.1100.097.0100.099.4...64.797.099.499.9
JordanMadaba200967.4100.0...65.0100.097.0100.099.7...67.598.099.7100.0
JordanMafraq200976.599.8...36.199.997.7...99.8... 69.998.6...99.9
JordanAjloun201241.696.9...43.7100.099.7100.099.499.675.298.999.6100.0
JordanAmman201251.6100.0...78.5100.099.8100.099.799.777.199.499.5100.0
JordanBalqa201265.399.3...73.8100.099.699.999.294.574.699.099.4100.0
JordanIrbid201237.799.9...43.699.699.6...100.099.983.099.199.399.8
JordanZarqa201260.4100.0...85.1100.099.499.899.998.970.999.299.6100.0
JordanAmman201865.0100.0100.083.8100.099.9100.099.499.083.799.0...100.0
JordanBalqa201887.099.799.778.399.696.199.198.697.974.097.4...99.7
JordanIrbid201833.799.699.154.899.996.0100.099.299.672.398.2...99.9
JordanMa’an 201871.1100.0100.047.5100.099.899.998.398.975.297.0...99.4
JordanMafraq201845.1100.098.932.099.898.399.397.498.053.697.1...100.0
Jordan Tafilah 201879.5100.0100.068.099.696.499.9100.0100.068.199.3...99.9
JordanZarqa201873.4100.0100.085.999.997.7100.099.699.471.898.6...99.7
KazakhstanAlmatyCity2006100.0100.099.979.398.296.8100.087.799.894.970.3100.0100.0
KazakhstanAstana201197.999.999.975.399.190.8100.093.097.1100.098.9...99.8
KazakhstanAlmatyCity201582.984.7...64.099.898.099.894.399.996.199.099.999.8
KenyaNairobi200393.395.070.770.972.941.886.9...94.371.0...77.527.2
KenyaNairobi200892.098.781.969.294.6 47.094.588.199.375.392.789.142.4
KenyaNairobi201486.997.987.644.190.129.694.669.099.962.598.088.040.5
KenyaNairobi201574.898.497.838.592.755.899.767.7100.077.299.697.9...
KyrgyzstanBishkekCity201299.799.999.947.699.588.382.382.164.087.196.999.799.7
KyrgyzstanOshCity201489.992.6...38.398.894.496.984.699.686.199.099.992.0
LaoPeople’sDemocraticRepublicLuangPrabang201140.599.199.10.094.989.889.687.295.081.297.291.110.3
LaoPeople’sDemocraticRepublicSavannakhet20115.681.881.80.275.468.992.880.296.866.093.296.93.3
LaoPeople’sDemocraticRepublicVientiane201115.399.599.03.099.395.699.195.599.787.599.399.426.0
LesothoMaseru200085.490.473.15.567.3...84.4......78.2... 17.9...
LesothoMaseru200495.098.388.011.949.625.895.5............39.175.6
LesothoMaseru200983.091.072.03.359.423.697.493.999.471.090.347.079.7
LesothoMaseru201497.999.090.94.695.345.195.395.697.578.995.967.984.9
LiberiaMonrovia200724.790.784.69.953.227.691.074.693.955.674.38.40.1
LiberiaMonrovia200933.897.5...9.366.40.090.688.192.843.382.15.5...
LiberiaMonrovia201124.285.873.61.760.823.790.788.597.849.685.012.50.6
LiberiaMonrovia20139.095.186.52.970.233.790.493.999.856.994.528.30.2
LiberiaMonrovia201619.399.190.53.584.237.495.696.399.956.490.348.80.4
MadagascarAntananarivo200892.0 98.191.30.925.915.079.493.697.450.281.981.35.5
MadagascarAntananarivo201187.096.6...0.01.61.171.489.478.541.660.753.00.1
MadagascarAntananarivo201375.993.7...0.735.713.979.972.377.850.675.369.60.9
MalawiLilongwe201266.985.875.612.542.326.766.093.184.068.876.724.68.2
MalawiBlantyre201493.298.976.60.871.537.681.976.595.197.487.753.412.1
MalawiLilongwe201491.399.491.65.599.850.385.090.794.3100.087.851.014.0
MalawiMzuzucity201493.999.799.41.096.666.476.682.085.893.294.850.97.3
MalawiZombacity201491.794.988.00.391.856.467.176.380.585.784.644.512.1
MalawiBlantyre201679.597.277.92.598.134.678.682.495.586.685.355.37.7
MalawiLilongwe201696.699.689.04.399.950.781.289.395.385.391.250.021.7
Maldives Malé 200956.999.334.199.299.997.598.898.499.661.399.699.999.3
MaliBamako201287.598.794.09.890.847.572.280.995.071.996.484.62.5
MaliBamako201589.898.991.55.293.656.486.695.998.0100.098.391.62.6
MaliBamako201879.399.095.16.790.646.987.895.499.572.698.192.31.2
MauritaniaNouakchott200193.298.969.85.014.510.664.5......34.9...48.348.8
MauritaniaNouakchott200730.398.090.82.277.961.181.395.050.447.286.680.870.4
MoldovaChisinau200589.499.5...90.097.489.093.399.699.096.167.499.799.8
MongoliaUlaanbaatar200543.199.288.735.396.263.021.153.549.749.067.898.939.6
MongoliaUlaanbaatar201049.299.893.732.899.366.037.572.335.473.999.199.347.7
MoroccoCasablanca200499.0100.0...99.299.288.793.7......80.6...99.199.6
MoroccoMarrakech200498.899.7... 99.999.985.293.1......73.6...98.999.6
MozambiqueMaputo200996.999.8...12.984.063.095.294.199.587.190.783.627.7
MozambiqueMaputo201195.499.196.10.066.757.697.393.699.777.996.490.729.9
MozambiqueMaputo201589.599.897.263.581.668.098.693.899.679.095.894.95.6
MozambiqueMaputo201898.3100.099.48.294.585.096.698.099.586.397.897.343.5
MyanmarNaypyitaw201610.198.795.51.093.870.762.144.798.176.195.095.661.8
MyanmarYangon20168.995.479.91.478.565.962.366.899.163.297.198.575.6
NamibiaWindhoek200096.997.082.679.379.755.888.1......71.474.979.5
NamibiaWindhoek200796.697.785.187.189.167.791.186.787.181.4 87.786.889.6
NepalKathmanduCity200660.699.687.767.896.636.592.198.699.263.042.6...70.0
NepalKathmanduCity201656.299.796.055.895.755.294.494.814.287.897.6...91.2
NicaraguaManagua200197.998.370.050.881.075.177.681.899.359.521.599.575.2
NigerNiamey200691.394.289.810.744.823.370.2......52.150.761.63.5
NigerNiamey201295.097.386.05.984.433.983.356.967.061.189.373.54.8
NigeriaAbuja201351.199.697.741.895.265.595.597.299.872.897.593.242.3 NigeriaAkure20137.295.785.812.473.730.298.599.399.270.496.294.23.1 NigeriaIbadan20136.997.793.01.867.620.599.699.6100.065.395.678.41.8 NigeriaLagos2013 21.895.596.17.685.530.098.698.999.554.997.499.510.8 NigeriaZaria201324.982.589.612.992.429.183.181.697.778.692.989.73.9 NigeriaAbuja201534.398.7100.067.8100.087.586.895.877.781.098.594.538.6 NigeriaAkure201514.896.389.625.091.934.097.395.7...74.296.177.515.0
NigeriaIbadan20153.597.797.32.288.845.693.187.496.376.994.885.79.7 NigeriaLagos201520.898.596.829.392.333.999.598.770.048.594.899.718.7
NigeriaZaria201514.685.484.315.972.860.970.377.295.879.762.266.73.1
NigeriaAbuja201845.797.993.60.693.953.899.199.497.860.297.993.631.3
NigeriaAkure201811.697.394.70.073.727.7 96.797.5...73.294.685.533.0
OccupiedPalestinianTerritoryGaza20107.699.9...99.299.995.799.6......77.70.4...99.0
OccupiedPalestinianTerritoryBethlehem201495.297.4...28.998.397.562.9......79.660.8...0.4
OccupiedPalestinianTerritoryHebron201486.699.5...36.199.798.658.899.299.874.344.599.71.0
OccupiedPalestinianTerritoryJerusalem201495.395.3...83.799.098.244.899.499.675.572.899.70.6
PakistanIslamabad201265.298.978.790.897.593.893.596.590.244.995.499.991.6
PakistanKarachi201858.698.494.780.794.387.989.493.892.342.096.199.687.5
PanamaBocasdelToro201385.998.743.89.173.469.160.196.6...71.090.287.2...
PapuaNewGuineaPortMoresby201898.698.897.868.986.271.098.689.399.152.794.687.7 68.7
ParaguayAsunción201649.1100.093.865.395.688.894.096.399.789.698.899.991.7
ParaguayResto201682.099.150.37.794.891.595.697.498.089.898.599.877.6
PeruArequipa200492.298.498.284.789.880.088.299.496.276.8...97.865.4
PeruChimbote200491.991.991.078.183.470.261.467.894.983.0...87.560.5
PeruLima200496.598.998.694.496.585.791.287.893.281.6...99.386.5
PeruPiura200493.794.476.636.059.659.559.674.299.370.0...91.772.0
PeruArequipa201295.497.997.381.491.186.090.894.198.684.697.899.595.7
PeruChiclayo201289.593.191.278.487.678.672.051.784.982.193.098.991.4
PeruChimbote201295.797.0 97.087.393.185.481.272.184.787.993.097.684.4
PeruLima201288.496.995.889.194.886.892.586.693.586.994.199.496.4
PeruPiura201282.391.187.165.578.270.963.076.199.282.586.297.672.9
PeruTrujillo201290.997.297.172.883.178.470.849.578.084.992.698.783.7
PhilippinesCagayan200324.192.480.698.198.1...71.0.........37.471.5...
PhilippinesCebu200364.396.685.884.084.7...69.6.........46.690.4...
PhilippinesMetroManila200375.399.895.297.998.1...76.5.........60.899.0...
PhilippinesBacolod200851.396.272.94.779.670.173.764.487.073.279.886.016.6
PhilippinesCagayan200813.190.577.3...98.870.779.377.793.365.480.092.136.4
PhilippinesCebu200825.999.5......85.557.878.171.898.666.983.194.441.5
PhilippinesMetroManila200848.899.995.44.297.177.888.984.399.057.288.398.175.7
PhilippinesCebu201313.799.894.72.487.168.981.970.994.169.188.489.236.6
PhilippinesMetroManila201341.9100.097.715.194.869.089.283.399.658.595.697.979.9
RwandaKigali200081.083.360.96.348.830.975.4............47.61.6
RwandaKigali200567.370.054.210.067.145.571.1............43.90.6
RwandaKigali200879.881.071.76.434.621.673.5.........72.251.00.0
RwandaKigali201083.393.874.36.595.651.479.577.099.883.290.768.50.4
RwandaKigali201390.099.689.3...95.849.888.991.699.788.497.689.51.6
RwandaKigali201592.796.379.97.895.042.187.283.399.886.295.190.82.0
RwandaKigali201782.896.988.39.194.140.683.782.298.889.693.991.510.9
São Tomé and Príncipe Santana200997.499.466.5 4.519.411.098.8......84.641.270.3...
São Tomé and PríncipeSão Tomé 200999.699.981.35.656.448.993.6......80.469.877.21.0
SenegalDakar201498.9100.094.723.896.467.095.698.194.057.597.095.056.7
SenegalDakar201592.095.375.024.997.259.295.199.299.766.799.595.559.4
SenegalDakar201695.599.365.519.596.365.095.099.199.676.299.493.868.4
SenegalDakar201990.999.899.822.598.965.797.296.999.173.0...97.564.9
SerbiaBelgrade200593.099.599.487.098.197.097.498.996.292.387.8...94.3
SerbiaBelgrade201487.699.999.281.199.097.299.999.198.997.797.7100.094.7
SierraLeoneFreetown200877.296.363.50.684.829.088.371.193.5 63.879.052.30.1
SierraLeoneFreetown201366.493.370.31.181.228.589.480.897.251.991.863.00.2
SierraLeoneFreetown201649.793.781.32.186.332.683.995.587.553.296.862.81.1
SurinameCommewijne201018.196.675.01.192.891.487.3......88.991.991.681.2
TajikistanDushanbe200594.795.9...70.099.391.290.283.592.887.933.799.892.0
UnitedRepublicofTanzaniaArusha201199.1100.097.69.855.828.877.867.7100.078.195.248.314.7
UnitedRepublicofTanzaniaDaresSalaam201159.395.493.10.675.831.796.499.7100.080.593.866.52.6
UnitedRepublicofTanzaniaDaresSalaam201550.397.989.93.398.256.896.099.599.981.696.776.315.7
UnitedRepublicofTanzaniaArusha201786.399.299.2...93.456.885.472.699.688.196.765.832.8
UnitedRepublicofTanzaniaDaresSalaam 201777.294.292.5...94.243.690.198.498.483.197.374.27.9
ThailandBangkok200553.499.499.311.999.993.581.596.599.386.492.499.984.8
Timor-LesteDili200966.598.796.819.493.873.283.275.899.173.487.798.612.8
Timor-LesteDili201650.699.097.6...89.577.290.469.697.277.398.398.923.2
Togo Lomé 200677.290.387.00.478.827.298.697.599.868.160.573.8...
Togo Lomé 201070.789.70.787.932.395.596.897.568.391.583.98.6
Togo Lomé 201345.394.794.10.189.332.098.096.899.864.194.287.917.4
Togo Lomé 201747.695.393.91.991.331.799.499.2...65.598.593.823.8
TrinidadandTobagoArimaBorough200094.494.4...68.793.885.8 ...98.1...96.3.........
TrinidadandTobagoPortFortinBorough200083.488.419.5...51.047.7...97.9...85.5.........
TrinidadandTobagoTobago200090.793.26.449.474.371.3...91.3...92.0.........
TrinidadandTobagoArimaBorough200696.798.6...45.297.993.897.395.7...95.090.999.4...
TrinidadandTobagoPortofSpain200690.198.456.472.696.393.775.883.099.793.889.498.599.3
TrinidadandTobagoPrincesTown200677.297.915.116.597.694.062.595.799.993.890.896.399.5
TurkeyBursa200473.496.1...100.0100.091.7......91.783.2......
TurkeyInstabul200446.193.14.295.299.198.692.5......89.382.0......
TurkeyAdana201386.799.599.594.499.698.499.0......87.299.6......
TurkeyBursa201364.899.399.197.899.798.799.2......96.798.2......
TurkeyGaziantep201386.599.199.198.6100.099.192.3......67.797.3......
TurkeyInstabul201331.399.799.399.899.898.795.1......94.299.2......
TurkmenistanAshgabatcity201930.4100.0100.093.0100.099.2100.0100.0100.093.8100.0100.0...
UgandaKampala201184.697.694.412.994.223.494.088.399.463.894.179.96.2
UgandaKampala201680.899.097.65.793.631.696.695.199.765.397.892.54.7
UgandaKampala201981.198.797.30.686.631.698.394.699.055.298.795.14.5
UkraineKyiv200765.199.1...65.799.495.082.697.599.896.387.6......
VanuatuPortVila200771.297.796.5 ...94.359.396.094.899.276.179.786.948.7
VietNamDaNang200288.698.9..................66.8.........
VietNamHoChiMinh200290.699.0...95.896.2...99.0...99.464.5...99.8...
VietNamHaNoi200586.999.7...97.497.487.5......99.788.7......73.6
VietNamHaiPhong200588.1100.0...92.294.991.398.2100.0100.084.4...100.047.6
VietNamHoChiMinh200553.097.9...99.299.596.399.399.399.866.7......81.3
YemenSana’a200628.651.1...52.799.598.995.2......68.872.599.297.5
YemenAden201386.898.9...81.798.094.895.597.626.148.293.499.495.9
YemenSana’a201318.499.035.070.999.197.399.198.656.172.296.8...98.9
ZambiaLusaka200294.897.791.721.727.618.596.3............48.742.9
ZambiaLusaka200790.591.690.222.585.536.095.297.399.759.874.361.755.5
ZambiaLusaka201389.598.690.615.987.731.997.698.899.866.892.778.633.4
ZimbabweBulawayo200598.599.997.895.699.770.999.699.899.776.740.298.597.9
ZimbabweHarare200595.499.198.687.398.565.599.199.499.777.341.888.586.9
ZimbabweHarare200961.598.093.084.998.220.898.598.899.777.269.3...85.5
ZimbabweBulawayo201099.6100.0...92.097.766.997.698.999.280.294.694.691.8
ZimbabweHarare201065.492.990.370.894.343.697.897.598.976.093.082.776.1
ZimbabweBulawayo201599.199.899.895.098.966.696.6100.099.780.996.596.290.3
ZimbabweHarare201536.997.392.779.297.548.596.795.798.781.198.180.176.3
Notes:
a Improved drinking water sources include: piped water into dwelling, plot or yard; public tap/stand pipe; protected spring; rainwater collection; bottled water (if secondary source is also improved); bore hole/tube well; and, protected dug well.
b Basic drinking water services refer to drinking water from an improved water source whose collection time is no more than 30 minutes for a round trip incluidng queuing.
c Improved sanitation facilities include flush/pour-flush toilets or latrines connected to a sewer septic tank or pit; ventilated improved pit latrine; pit latrine with a slab or platform which covers the pit entirely; and, composting toilets/latrines.
d Basic sanitation services are improved facilities that not shared with other households.
e Durable floor is floor made of the following materials: parquet, carpet, cement, bricks, tablets, mat, adobe, etc.
f Durable wall is wall made of finished materials such as covered adobe, bricks, cement blocks, wood planks, etc.
g Durable roof is roof made of finished materials such as metal, wood, ceramic tiles, cement, roofing shingles, etc.
h Proportion of population living in households in which not more than three people share the same habitable room.
Source: United Nations Human Settlement Programme (UN-Habitat), Global Urban Indicators Database 2020.
2000200220042006200820102012201420162018202020002002200420062008201020122014201620182020 World 31.230.930.129.228.227.326.325.424.624.424.2894,875928,034946,516961,109969,070980,512983,965992,179999,5261,028,0171,059,936 AustraliaandNewZealand 0.10.10.10.10.10.10.10.00.00.00.026272422191613 9778
CentralAsiaandSouthernAsia 56.055.154.253.552.651.750.950.149.348.548.2250,317260,509271,078282,167292,452302,697313,017323,441333,890344,495359,331 EasternandSouth-EasternAsia 37.535.934.232.430.628.827.125.323.622.421.7313,358320,173325,835328,456328,509326,680322,500316,089307,327305,119306,620 EuropeandNorthernAmerica 1.41.41.31.21.00.90.90.80.80.80.710,72510,4799,9239,1618,354 7,6517,0106,3657,1366,6585,909 LatinAmericaandTheCarbbean 31.930.228.226.223.421.819.218.417.017.917.7126,505124,436119,964115,414106,542102,27993,04891,47087,22994,20195,502 Oceania(Exc.AustraliaandNew Zealand) 17.016.016.015.915.715.515.315.014.815.015.3331323334345353362369377387408431
SubSaharanAfrica 64.163.461.660.258.757.355.754.252.751.350.2129,979139,265146,916155,638164,932174,946185,179195,587206,152217,647230,080 WesternAsiaandNorthernAfrica 31.634.432.629.827.425.222.820.318.818.718.763,63372,82172,44069,90767,90765,88162,83058,84157,39959,48262,056
Afghanistan………63.663.664.867.269.772.173.373.3 3,7724,0484,4314,9875,6136,2546,7977,260 Albania 28.125.523.020.517.915.412.910.37.85.32.8 3663463252992682362051701339451
Algeria…………30.830.828.925.021.117.213.3
7,0977,5137,4786,8616,1155,2394,238
Angola 19.719.719.725.831.938.144.250.356.462.662.61,6221,8162,0342,9674,0485,3176,7948,49710,43412,61713,733
Argentina 20.319.618.818.117.416.715.9
6,7036,6366,5576,4646,3576,2416,114
Armenia 12.812.311.811.310.810.49.99.48.98.48.4254240227214201189180172164156156
Austria 4.54.44.44.4 219214214213
Azerbaijan 50.944.938.932.926.926.926.9
2,1261,9261,7171,4951,2591,2991,344
Bangladesh 58.357.757.056.455.755.154.453.853.252.551.918,10019,50121,04222,55224,02525,53327,12628,76030,38932,00433,619
Belarus 17.616.014.513.011.49.98.46.95.33.82.31,2201,1151,009905802702601499393283170
Belize 15.815.815.815.815.715.715.715.715.715.715.71819202122232425262829
Benin 71.971.571.170.770.369.969.569.168.768.367.91,8912,0352,2062,3842,5722,7712,9843,2113,4543,7133,987
Bolivia 57.955.753.451.248.946.646.646.6
2,9863,0253,0523,0693,0763,0723,2143,351
Bosnia&Herzegovina 5.15.15.1 4.94.74.54.34.04.04.0 81838482797672676768
Botswana 58.756.654.452.350.248.146.043.841.739.639.6540549553556581605622631638641678
Brazil 34.731.428.124.821.518.214.914.914.9 49,44146,36642,87739,00234,76630,21325,37326,00826,617
BurkinaFaso 82.276.671.165.559.954.448.843.237.732.126.61,7031,8141,9232,0242,0722,0902,0842,0491,9771,8621,699 Burundi 79.779.777.071.766.361.055.650.244.939.536.8421466506529551569580585585577602
Cambodia 84.879.273.667.962.356.651.045.439.739.739.71,9151,8831,8321,7651,6921,6441,5851,5111,4131,5081,608 Cameroon 65.462.158.855.652.349.045.742.539.235.932.74,5474,6684,7834,8874,9785,0475,0895,0995,0715,0004,882 CentralAfricaRepublic 86.083.180.377.474.671.868.968.968.9 1,2151,2281,2361,2431,2481,2421,2191,2431,286 Chad 91.690.589.388.287.185.984.883.782.682.082.01,6531,7671,8882,0072,1232,2462,3862,5412,7062,9033,141 Chile 14.611.07.37.37.3 1,9201,4841,0151,0351,058 Colombia 21.219.818.517.115.814.513.111.810.49.79.76,3286,1675,9735,7435,4775,1754,8374,4664,0623,8763,967 Comoros 64.565.165.766.366.967.568.068.668.668.6 98104109116123130139 148156165 Congo 87.887.884.778.572.266.059.853.547.344.244.21,6621,7841,8481,8521,8531,8311,7771,6971,6001,5971,704 CostaRica 12.711.810.910.09.08.17.26.35.44.53.5294296293287278265248227203175144 Coted’Ivoire 67.165.564.062.560.959.457.856.354.853.253.24,8305,0065,1625,3325,5225,7335,9676,2176,4716,7297,201 Cuba 2.22.22.23.24.35.36.37.48.49.510.5181183185276367460555650746840935 DemocraticRepublicofCongo…71.971.972.473.374.275.176.177.077.978.4 12,92214,11115,53917,24819,16121,29223,65226,24929,09532,010 DominicanRepublic 30.227.825.423.120.718.316.013.611.211.211.21,5951,5561,528 1,4851,4221,3391,2301,1009529931,031 Ecuador 57.457.857.857.8 4,3724,6224,8034,998
42.236.731.225.720.214.79.23.70.90.9 12,63311,43110,1118,6517,0365,3103,4561,438368382 ElSalvador…49.549.546.540.534.528.522.516.516.516.5 1,7651,8151,7511,5751,3911,191973737762785 Eswatini 55.455.455.447.940.533.125.718.210.810.810.8133134134118103897355343638
92.289.186.082.979.876.773.670.567.464.364.39,0409,4939,94810,39110,95811,64912,35613,04213,71314,36015,733
60616058565350474850
558578599622647674703729777819
56.955.153.351.549.747.946.144.342.540.738.9336359382405428451474497519540558
Georgia 13.613.613.212.411.710.910.19.48.67.87.1338330319298278256235214196180164
Ghana 60.457.053.650.346.943.640.236.833.533.533.55,0225,1435,2505,3365,3965,4165,3885,3075,1715,5315,902
Guatemala 55.553.351.048.846.544.342.139.837.637.637.62,9312,9913,0443,0863,1173,1383,1483,1493,1383,3103,491
Guinea 40.741.542.343.244.044.845.746.547.348.249.01,1061,1911,2851,3881,5041,6301,7651,9132,0812,2722,485
Guinea-Bissau…………75.275.275.271.668.064.460.8 438469504516525533538
Guyana 26.126.125.323.722.020.418.717.115.413.812.15656534945413734322926
Haiti 61.360.058.757.456.154.853.452.150.849.548.91,8652,0632,2302,3542,4782,6012,7212,8362,9453,0433,174 Honduras 44.444.443.240.938.636.233.931.531.531.5
1,3171,4201,4931,5191,5351,5401,5331,5151,6021,694 Hungary 15.414.212.911.610.49.17.97.27.2 1,016940860780706623543496497 India 55.354.653.953.252.551.851.150.449.749.049.0161,101168,051175,430182,790190,103197,240204,193211,207218,417225,832236,771 Indonesia 35.133.531.830.228.526.925.223.521.920.219.431,21031,71932,12332,40132,54232,50832,16031,62030,86229,87229,929 Iraq 33.935.437.038.540.141.643.244.746.247.849.35,4716,0636,6887,3448,0418,8479,82210,91712,06113,25014,517 Ireland 6.26.46.76.97.27.57.78.08.38.58.5141152167180198214223234246258264 Jordan 40.037.735.433.030.728.426.023.721.419.116.71,5981,5601,5331,5871,6671,7541,8351,8801,8301,7171,561 Kazakhstan 24.521.718.916.113.310.57.85.02.20.80.82,0661,8411,6391,4291,20898274849622584 86
Kenya 63.261.660.158.557.055.553.952.450.850.850.83,9534,2164,4914,7825,0885,4055,7356,0786,4286,9987,609
47.242.738.233.729.324.820.315.911.46.92.481975267961054447540332624415457
54.451.047.544.140.737.333.830.427.023.621.8637674706716712700678649616575567 Lebanon…92.492.492.467.342.217.14.54.5 2,8073,0883,2532,4081,598736222239 Lesotho 62.762.758.654.550.346.242.137.933.829.725.6229246246244240234226216204189172 Liberia…75.575.574.672.871.069.267.565.763.963.9 1,0411,0961,1681,256 1,3411,4071,4631,5231,5861,698 Madagascar 91.489.086.684.281.879.477.074.672.269.867.43,9104,1294,3514,6795,0195,3665,7196,0796,4476,8207,194 Malawi 81.477.974.470.967.463.860.356.853.349.849.81,3531,3841,4111,4411,4731,5051,5361,5641,5921,6161,760 Maldives……41.541.541.039.938.737.636.535.434.8 424750535659616365 Mali 83.979.775.571.367.162.958.754.550.346.141.92,6092,7642,9283,0963,2643,4143,5333,6243,6933,7333,734 Mauritania 84.781.377.974.671.267.864.461.157.756.056.08749229781,0331,0861,1401,1941,2461,2891,3651,482 Mexico 32.230.428.727.025.323.621.920.218.417.617.624,44623,94723,36422,78922,20921,53420,72119,78018,71818,44719,021 Mongolia 57.653.649.745.741.737.733.829.825.821.917.9789777762743719692647594534467394 Montenegro 19.119.118.517.316.114.913.612.411.210.08.86971716763605551474237 Morocco 33.230.427.624.822.019.216.413.610.910.910.95,1014,8394,5484,2663,9553,6133,2382,8202,3492,4532,556 Mozambique 90.186.683.179.676.072.569.065.562.058.555.04,7374,8815,0315,1745,3565,5925,8206,0386,2416,4246,583 Myanmar 29.432.635.839.042.245.448.751.955.158.358.33,6624,2104,7805,3635,9576,5847,2607,9848,7619,5989,947 Namibia 42.642.442.342.142.041.841.741.541.441.4 262281303326350378412451492536
Nepal 66.363.460.557.654.751.949.046.143.240.340.32,1092,2182,2732,3122,3342,3502,3632,3722,3702,3562,508 Nicaragua 71.670.369.167.867.267.2 1,9862,0182,0462,0752,1252,195 Niger 70.070.170.270.270.370.370.470.470.470.4 1,2871,3911,4961,6111,7371,8742,0232,1882,3722,582 Nigeria 74.171.669.166.664.161.559.056.554.051.549.031,59033,63135,74137,92140,16342,43544,68446,85848,90150,77952,466 Pakistan 71.269.768.266.665.163.662.160.559.057.556.032,53933,65334,72435,79036,86237,96239,10240,24141,31942,33643,345 Panama 48.744.440.135.731.427.122.818.516.316.3 917877830776713644566479441459 Paraguay 42.039.036.033.030.027.024.021.018.015.115.11,2331,2171,1781,1261,065995919834741639663 Peru 47.445.643.741.940.038.236.334.5 8,9758,9518,9008,8268,7178,5698,4138,240 Philippines 50.048.647.245.844.342.941.540.138.737.336.617,98118,16118,28818,33118,29518,24618,39318,51718,59518,64519,043 RepublicMoldova 26.523.720.818.015.112.39.46.56.56.5 496433373319265214163112112112 Rwanda 71.467.964.561.057.554.050.547.143.640.138.3856973961950945937924906886863875 SaoTomeandPrincipe 61.461.460.458.556.554.652.652.652.6 545963666972758085 Senegal 67.263.660.056.552.949.445.842.338.735.231.62,6762,6852,7172,7502,7742,7922,8012,7942,7622,7042,616 SierraLeone 73.973.972.569.867.164.361.658.956.153.450.61,2021,3231,4441,5231,5751,6151,6521,6851,7111,7331,749 SouthAfrica 27.627.226.826.526.125.725.324.924.624.224.27,1837,4147,6427,8498,0428,2508,4928,7498,9909,2109,571 SouthSudan…99.899.899.899.897.094.294.294.2 ……- 1,2111,3231,4611,6231,7441,8562,0232,200 StateofPalestine…30.030.029.127.225.323.421.419.519.519.5 734766780771762748731 708750796 Sudan…99.199.199.194.088.983.878.773.773.773.7 9,2669,78410,27710,19810,11710,06110,0129,94810,59811,313 Suriname 7.48.39.19.910.811.612.513.314.115.015.82327303337414448525660 Tajikistan 60.355.751.246.642.137.533.028.423.919.317.1993952911865816761700634560478445
Thailand 15.615.615.114.113.012.010.99.98.97.86.83,0843,3733,5473,5773,5723,5303,3733,1812,9592,7062,426 Timor-Leste……56.156.154.050.046.042.037.933.933.9 144155157154151148144137147 Togo 69.366.062.859.556.353.149.846.643.340.138.51,1331,1721,2071,239 1,2691,2951,3171,3321,3391,3361,382 TrinidadandTobago 11.111.111.110.39.58.77.97.57.5 787879736863575455 Tunisia………10.410.410.19.69.18.68.17.6 695715719706691674655633 Turkey 24.623.221.820.419.017.616.214.814.114.1 10,0649,9659,8179,6029,3249,0218,7048,3448,3278,695 Turkmenistan 10.510.510.510.310.09.89.59.39.08.88.5218224231233236241246253259264269
Uganda 80.978.275.572.870.167.564.862.159.456.754.02,8763,1433,4373,7504,0834,4344,8035,1845,5755,9686,360 Ukraine 5.05.04.63.93.22.51.81.11.11.1 1,6401,6141,4681,2361,010785561341338336
UnitedRepublicofTanzania 81.377.172.868.664.360.055.851.547.343.040.96,2016,4126,7467,0977,4507,7818,0758,3178,4938,5849,040
Uruguay 23.723.723.719.916.212.58.85.0 724730733622511398282164
Venezuela 27.826.425.725.7 5,9655,8965,9496,159
Vietnam 45.340.435.430.525.520.615.710.75.85.85.88,8688,4417,8967,2356,4515,5434,4963,2821,8821,9982,118
Yemen 63.861.258.655.953.350.748.145.544.244.2 2,9963,1623,3283,4913,6503,8033,9484,0774,3154,683
Zambia 63.862.260.759.157.656.054.552.951.449.848.32,3382,4552,5932,7382,8903,0543,2313,4213,6173,8174,023
Zimbabwe 27.526.926.325.725.124.523.923.422.822.221.61,1361,1641,1541,1461,1441,1481,1571,1701,1871,2071,229
Country Cities
Proportion ofpopulation livingwithin convenient walking distance topublic transport(%)
Share ofurban area allocated toopen public space
to Open Space
Share ofurban area allocated tostreets (%)
Share ofurban area allocated tostreets &open public space
Proportion of population living within convenient walking distance toopen public space(%)
AfghanistanCharikar77.52.29.912.182.1
AfghanistanFarah69.52.89.412.262.5
AfghanistanHerat50.42.77.29.955.6
AfghanistanJalalabad44.22.213.415.759.0
AfghanistanKabul19.10.513.013.513.0
AfghanistanKandahar43.14.15.29.245.9
AfghanistanKhanAbad82.43.29.412.675.2
AfghanistanLashkarGah56.33.19.913.170.5
AfghanistanMazar-eSharif57.81.613.715.365.6
AfghanistanPol-eKhomri49.02.47.29.656.1
AlgeriaAlgiers48.02.512.414.941.2
AlgeriaAnnaba15.43.111.714.849.6
AlgeriaBatna 45.11.917.619.542.0
AlgeriaBlida41.12.012.714.754.0
AlgeriaChlef26.63.710.914.562.7
AlgeriaDjelfa25.13.421.324.770.6
AlgeriaElKhroub34.13.111.915.067.5
AlgeriaKhemisMiliana43.21.816.218.174.5
AlgeriaMila52.44.016.120.181.6
AlgeriaM’Sila50.92.814.217.065.3
AlgeriaOran45.02.416.619.056.5
AlgeriaTamanrasset32.24.012.816.867.6
AlgeriaTebessa 15.33.710.614.434.9
AlgeriaTiaret38.41.518.119.632.1
AlgeriaTolga95.72.515.017.681.4
AngolaLuanda10.70.618.419.017.3
ArgentinaBahiaBlanca34.73.715.519.176.0
ArgentinaBuenosAires87.31.821.623.449.5
ArgentinaCatamarca59.61.513.114.682.9
ArgentinaComodoro Rivadavia 81.51.717.719.461.7
ArgentinaConcordia54.51.512.013.567.5
ArgentinaCordoba 86.82.213.816.072.0
ArgentinaFormosa51.43.613.116.779.7
ArgentinaLaPlata40.22.316.318.655.3
ArgentinaMendoza94.62.217.419.574.8
Argentina Neuquén 98.03.125.929.091.1
ArgentinaOberá90.62.413.415.780.3
ArgentinaParaná25.33.412.515.948.7
ArgentinaRíoCuarto65.43.418.121.477.1
ArgentinaRioGallegos72.12.64.46.984.4
ArgentinaRosario90.65.015.420.352.8
ArgentinaSanJuan15.72.914.617.559.1
ArgentinaSanMartín18.72.813.316.164.1
ArgentinaSanMiguelde Tucumán 18.53.711.915.743.6
ArgentinaSanPedrode Jujuy 21.54.718.423.192.5
ArgentinaSanSalvadorde Jujuy 68.14.316.020.380.7
ArgentinaSantiagodel Estero 42.01.615.116.771.3
ArgentinaZárate45.82.614.016.754.0
AustraliaAdelaide92.56.212.618.872.2
AustraliaAliceSprings94.69.321.030.3 92.4
AustraliaBrisbane89.18.012.020.180.5
AustraliaBunbury93.911.412.223.696.8
AustraliaCairns77.211.911.923.997.8
AustraliaCanberra84.814.515.229.797.5
AustraliaCessnock93.52.817.620.554.0
AustraliaDarwin91.67.110.117.286.7
AustraliaGeelong89.78.911.120.088.9
AustraliaGoldCoast82.813.514.928.494.3
AustraliaHobartCity95.17.019.226.273.9
AustraliaKingaroy55.74.39.013.375.1
AustraliaLaucenston93.37.517.625.081.0
AustraliaMelbourne88.98.511.920.484.4
AustraliaMuswellbrook66.27.77.915.680.8
AustraliaPerth45.47.613.621.285.6
AustraliaShepparton91.86.718.825.592.3
AustraliaSydney69.62.311.213.533.4
AustraliaWollongong 90.65.114.019.280.6
AustriaVienna97.53.211.714.972.4
AzerbaijanBaku83.14.019.323.357.0
BahrainManama21.21.522.123.517.8
BangladeshBarisal58.61.04.15.259.6
BangladeshBogra37.41.97.79.679.8
BangladeshChittagong61.91.413.715.164.8
BangladeshComilla19.91.45.57.025.6 BangladeshDhaka44.81.312.213.531.4
BangladeshDinajpur76.01.94.26.282.0
BangladeshGazipur21.90.75.25.826.8 BangladeshJamalpur54.82.83.15.954.5
BangladeshJessore67.90.98.59.562.8
BangladeshKhulna68.31.610.512.065.3 BangladeshMymensingh (Nasirabad) 35.40.57.58.029.6
BangladeshRajshahi59.72.16.78.883.6
BangladeshSaidpur60.11.94.16.075.3
BangladeshSylhet56.31.29.410.571.3
BelarusBabrujsk 87.92.311.814.146.7
BelarusBrest 79.82.613.416.150.2
BelarusGomel78.72.312.314.642.1
BelarusHrodna 93.03.420.223.676.5
BelarusKobyrn 54.92.510.813.333.7
BelarusMazyr 75.72.113.816.047.4
BelarusMinsk 91.011.519.030.583.3
BelarusPolack 86.22.312.514.850.8
BelarusSalihorsk 93.76.029.035.077.1
BelarusViciebsk 91.43.720.724.469.0
BelgiumAntwerpen**95.35.017.122.164.4
BeninBohicon22.50.611.612.136.6
BeninCotonou34.20.88.59.350.1
BeninDjougou24.51.512.013.540.7
BeninKandi58.41.412.413.770.4
BeninNatitingou56.61.69.410.965.6
BeninParakou46.21.49.010.481.9
BeninPortoNovo54.51.07.38.252.8
BhutanThimphu33.52.611.914.530.5
Bolivia (Plurinational Stateof) Cochabamba27.21.816.017.863.6
Brazil Aparecidade Goiânia 87.14.717.622.352.8
BrazilAraxá42.64.519.724.282.9
BrazilBarretos67.95.220.425.695.5
BrazilBelem31.23.015.918.929.3
BrazilBeloHorizonte85.85.316.521.841.6
Country Cities
Proportion ofpopulation livingwithin convenient walking distance topublic transport(%)
Share ofurban area allocated toopen public space (%)
Share ofurban area allocated tostreets (%)
Share ofurban area allocated tostreets &open public space (%)
Proportion of population living within convenient walking distance toopen public space(%)
IndiaCoimbatore62.80.411.211.618.8
IndiaHindupur26.10.49.09.524.2
IndiaHyderabad72.01.519.420.940.2
IndiaJaipur47.94.416.821.218.5
IndiaJalna14.60.77.07.720.1
IndiaKanchipuram10.50.514.915.534.3
IndiaKanpur16.12.66.28.819.2
IndiaKolkata54.30.98.69.527.7
IndiaMalegaon48.21.37.08.425.0
IndiaMorena15.50.97.58.439.8
IndiaMumbai80.91.811.313.035.3
IndiaNellore19.70.819.720.635.3
IndiaPali 10.10.65.56.023.3
IndiaParbhani24.80.55.25.710.2
IndiaPatna15.31.610.111.836.8
IndiaPune75.12.212.114.330.8
IndiaSingrauli24.34.98.313.128.0
IndiaSitapur18.54.45.39.728.6
IndiaSurat56.81.09.510.445.0
IndiaThoothukkudi9.90.68.49.024.2
IndiaTumkur12.41.419.120.560.4
IndiaVijayawada70.64.217.121.345.7
IndonesiaBandaAceh29.71.63.65.223.9
IndonesiaBengkulu 48.31.74.05.730.2
IndonesiaKendari27.21.63.55.123.1
IndonesiaParepare7.33.15.99.050.2
IndonesiaPematangsiantar8.02.24.46.639.8
IndonesiaSemarang33.41.74.35.939.4
IndonesiaSurabaya30.60.74.65.321.2
Iran(Islamic Republicof) Ahvaz11.73.112.015.152.3
Iran(Islamic Republicof) Aradabil54.14.118.222.379.4
Iran(Islamic Republicof) Arak66.25.616.822.367.7
Iran(Islamic Republicof) Babol42.40.79.29.828.4
Iran(Islamic Republicof) BandarAbbas36.32.520.022.459.5
Iran(Islamic Republicof) Bojnurd55.72.415.918.345.2
Iran(Islamic Republicof) Dehdasht 62.21.715.216.964.8
Iran(Islamic Republicof) Esfahan43.21.817.018.850.8
Iran(Islamic Republicof) Gorgan12.81.912.314.249.2
Iran(Islamic Republicof) Karaj14.11.911.313.250.6
Iran(Islamic Republicof) Kashan 22.52.913.316.251.4
Iran(Islamic Republicof) Kashmar19.52.313.515.873.3
Iran(Islamic Republicof)
Kerman18.12.015.317.461.9
Iran(Islamic Republicof) KhoramAbad11.64.115.719.868.4
Iran(Islamic Republicof) Mashhad55.24.314.118.454.7
Iran(Islamic Republicof) Nishabur32.22.214.516.864.7
Iran(Islamic Republicof) Piranshahr38.11.411.813.252.5
Iran(Islamic Republicof) Qom22.62.315.317.547.5
Country Cities
Proportion ofpopulation livingwithin convenient walking distance topublic transport(%)
Share ofurban area allocated toopen public space (%)
Access to Open Space
Share ofurban area
Share ofurban area
of population living within
walking distance
public space(%)
Iran(Islamic Republicof) Salmas 50.81.812.914.751.9
Iran(Islamic Republicof) Sanandaj 53.13.913.517.554.8
Iran(Islamic Republicof) Sari38.90.811.812.631.2
Iran(Islamic Republicof) Shadegan40.00.910.611.553.9
Iran(Islamic Republicof) ShahinShahr15.44.515.720.383.9
Iran(Islamic Republicof) Shiraz45.42.815.618.454.7
Iran(Islamic Republicof) Tabriz59.03.416.019.456.3
Iran(Islamic Republicof) Tehran53.34.615.520.161.1
Iran(Islamic Republicof) Varamin20.92.110.812.964.3
IraqBaghdad8.11.313.414.720.3
IsraelTelAviv84.84.312.616.975.8
ItalyMilan77.74.09.013.076.2
ItalyPalermo**93.91.78.610.242.2
JamaicaKingston53.81.89.511.324.0
JamaicaMontegoBay46.42.610.613.263.7
JamaicaPortmore12.02.38.510.823.8
JapanFukuoka95.46.120.726.870.1
JapanOkayama25.08.314.923.264.0
JapanOsaka69.44.723.027.772.2
JapanTokyo74.03.519.723.174.8
JapanYamaguchi20.24.613.418.035.9
JordanAmman10.01.318.019.333.9
JordanIrbid4.60.622.022.655.0
KazakhstanAktobe40.53.013.716.644.8
KazakhstanAlmaty39.12.313.315.628.1
KazakhstanAqtay12.71.113.915.07.6
KazakhstanAstana(NurSultan) 53.74.415.119.526.2
KazakhstanBalqash24.42.610.713.344.8
KazakhstanOral54.02.413.415.833.3
KazakhstanOskemen39.02.312.915.129.5
KazakhstanPavlodar42.83.512.215.738.9
KazakhstanQaragandy53.63.814.418.235.4
KazakhstanQaskelen17.01.411.112.520.3
KazakhstanQulsary20.51.811.513.336.4
KazakhstanRudny53.01.416.317.729.1
KazakhstanSemey31.21.510.712.219.8
KazakhstanShymkent22.21.012.313.37.4
KazakhstanTaldyqorgan20.51.812.013.822.0
KazakhstanTaraz24.11.213.614.811.0
KazakhstanTemirtay49.32.412.314.753.2
KazakhstanTurkistan27.20.714.114.816.6
KenyaEldoret15.20.511.211.710.8
KenyaKisumu27.60.410.010.411.2
KenyaMalaba52.02.64.97.625.2
KenyaMeru18.90.46.87.28.7
KenyaNairobi58.01.011.112.117.9
KenyaNakuru12.90.56.16.514.9
KenyaNyeri23.90.68.28.821.6
KuwaitKuwait39.01.522.524.149.4
Kyrgyzstan Balykchy63.72.311.714.074.7
KyrgyzstanBiškek55.23.814.818.659.5
KyrgyzstanJalal-Abad21.51.210.011.233.9
Country Cities
Proportion ofpopulation livingwithin convenient walking distance topublic transport(%)
Share ofurban area allocated toopen public space (%)
Share ofurban area allocated tostreets (%)
Share ofurban area allocated tostreets &open public space (%)
Proportion of population living within convenient walking distance toopen public space(%)
KyrgyzstanKara-Balta21.81.97.99.836.3
KyrgyzstanKarakol49.22.711.614.349.6
KyrgyzstanKyzyl-Kyja53.82.78.911.662.0
KyrgyzstanNaryn93.45.513.018.589.1
KyrgyzstanOsh39.61.911.413.346.3
KyrgyzstanTalas69.62.910.413.371.2
KyrgyzstanTokmok59.26.311.818.266.7
KyrgyzstanUzgen59.42.711.414.196.1
LebanonBaalbek8.21.012.813.845.1
LebanonBeirut20.00.814.715.520.7
LebanonSidon24.40.912.813.661.2
LebanonTripoli30.91.411.512.972.8
Lebanon Tyre 10.61.59.911.445.9
LebanonZahle49.00.712.112.736.6
LithuaniaKaunas**87.86.415.421.861.4
MadagascarAmparafaravola70.91.55.77.257.5
MadagascarAntananarivo53.60.86.67.420.5
MadagascarAntsirabe65.91.47.99.330.1
MadagascarAntsiranana48.31.114.916.030.2
MadagascarFianarantsoa52.82.47.29.657.0
MadagascarMahajanga46.51.37.79.018.1
Madagascar Marovoay 69.93.87.711.546.1
MadagascarTaolanaro74.13.07.911.068.6
MadagascarToamasina31.11.98.510.431.9
MadagascarToliara54.80.77.88.438.9
MalawiBlantyre15.42.19.111.222.6
MalawiMzuzu21.41.011.812.823.3
MalaysiaIpoh38.11.88.810.551.1
MalaysiaRawang41.11.710.612.322.4
MaldivesMale98.86.413.219.697.7
MaliBamako76.61.410.311.776.7
MaliKayes57.4 5.69.815.494.2
MexicoAcapulco (Acapulcode Juárez) 7.41.88.710.556.5
MexicoApatzingán (Apatzingándela Constitución)
5.82.013.615.653.8
MexicoCampeche(San Franciscode Campeche) 16.12.313.315.681.2
MexicoCiudadJuárez (Juárez) 8.92.212.714.954.8
MexicoCiudadRioBravo9.33.913.217.181.9
MexicoComitánde Domínguez 10.71.36.57.871.4
MexicoCuliacan8.63.613.817.472.5
MexicoEnsenada5.51.112.313.442.9
MexicoGuadalajara21.52.313.315.650.5
MexicoGuanajuato43.91.312.313.645.7
MexicoIrapuato57.72.811.614.485.0
MexicoLeón(Leóndelos Aldama) 86.82.014.416.456.2
MexicoMexicoCity40.43.712.716.446.3
MexicoMonterrey10.74.415.720.172.6
MexicoPuebla(Heróica Pueblade Zaragoza) 61.31.812.013.833.2
MexicoPuertoVallarta94.81.611.413.046.5
MexicoReynosa12.41.310.411.727.8
MexicoSanJuandelRío9.72.111.914.071.8
MexicoTehuacán13.61.711.813.564.3
MexicoTepic12.32.816.118.855.4
MexicoTijuana10.91.523.124.651.9
MexicoVeracruz7.42.414.116.452.5
MexicoVillahermosa59.72.810.613.489.6
MexicoXalapa-Enríquez (Jalapa) 26.65.713.118.860.3
MongoliaUlaanbaatar47.30.88.59.215.1
MoroccoAgadir85.43.412.716.184.1
MoroccoAzrou32.36.916.423.469.9
MoroccoCasablanca66.51.217.919.129.2
Morocco Fes 39.11.417.919.332.5
MoroccoFkihBenSalah52.11.616.918.655.9
MoroccoMaknes31.62.019.020.929.4
Morocco Marrakesh74.81.613.214.961.3
MoroccoMidelt64.41.214.015.354.4
MoroccoOujda15.31.323.825.045.5
MoroccoOuladTeima35.71.49.410.934.8
Morocco Safi 62.14.717.622.355.2
MoroccoSefrou30.03.415.318.763.6
MoroccoSidislimane37.00.510.511.037.4
MoroccoTanger70.82.016.618.646.9
MoroccoTemara34.62.613.816.425.6
MozambiqueAltoMolocue53.71.04.25.223.7
MozambiqueBeira7.91.06.47.428.0
MozambiqueGurue31.60.66.06.631.6
MozambiqueManhica49.50.312.913.210.1
MozambiqueMaputo52.20.815.015.815.3
MozambiqueMaxixe35.70.410.611.125.5
MozambiqueMocuba41.10.19.19.310.8
MozambiqueNacalaPorto26.30.26.26.513.8
MozambiqueNampula10.40.29.910.19.3
MozambiquePemba46.02.114.016.149.9
MyanmarLashio 19.50.26.36.513.6
MyanmarMandalay52.40.49.59.912.7
MyanmarMawlamyine66.61.210.511.737.2
MyanmarMyede31.51.14.75.845.4
MyanmarMyeik61.60.59.29.730.7
MyanmarMyitkyina10.50.74.95.622.7
MyanmarNaypyitaw37.41.38.29.542.5
MyanmarPathein19.10.46.26.516.8
MyanmarTachileik27.51.28.19.324.1
MyanmarTaunggyi66.22.45.88.329.9
MyanmarYangon70.51.011.212.216.2
NepalBharatpur45.81.35.66.921.4
NepalBiratnagar9.90.76.87.623.2
NepalBirendranagar13.91.76.78.429.7
NepalBirgunj13.50.95.86.716.7
NepalButwal16.11.77.59.211.9
NepalDamak18.20.47.07.411.0
NepalDharan18.81.78.310.033.5
NepalItahari23.81.56.07.517.8
NepalJanakpur10.3 0.96.57.423.9
NepalKathmandu56.42.87.210.145.1
NepalPokhara75.84.79.113.774.5
NetherlandsZwolle93.07.415.022.491.9
NewZealandAuckland94.49.216.225.488.4
NewZealandChristchurch90.38.717.726.483.4
NewZealandDunedin94.45.215.120.376.8
NewZealandHamilton96.57.716.424.186.4
Country Cities
Proportion ofpopulation livingwithin convenient walking distance topublic transport(%)
Share ofurban area allocated toopen public space (%)
Share ofurban area allocated tostreets (%)
Share ofurban area allocated tostreets &open public space (%)
Proportion of population living within convenient walking distance toopen public space(%)
NewZealandLowerHutt97.14.816.221.078.1
NewZealandNapier89.48.620.328.890.3
NewZealandPalmerston95.67.613.721.387.1
NewZealandTauranga91.78.015.123.283.9
NewZealandWellington97.79.119.228.382.5
NicaraguaChinandega32.61.39.510.834.2
NicaraguaCiudadSandino60.20.59.39.823.0
NicaraguaGranada40.74.49.914.368.6
NicaraguaLeon64.82.511.413.952.2
NicaraguaManagua70.61.711.713.446.8
NicaraguaMasaya37.51.89.411.269.5
NicaraguaTipitapa38.92.98.811.748.5
NigerAgadez 17.21.217.018.245.8
NigerDosso9.01.215.116.333.0
NigerMaradi16.32.919.122.032.0
NigerNiamey12.50.619.420.126.1
NigerZinder31.00.819.220.113.8
NigeriaGombe7.50.616.417.020.6
NigeriaIbadan11.80.413.513.88.9
NigeriaLagos38.10.513.814.36.9
Nigeria Oyo 20.70.813.013.813.5
Northern MarianaIslands Garapan7.81.69.811.335.6
OmanAl-Buraymi10.00.411.812.213.2
OmanMuscat30.80.718.219.013.2
OmanSalalah18.00.916.817.620.3
OmanSohar52.91.013.914.918.2
PakistanAttock7.80.46.36.712.0
PakistanBhakkar11.81.39.510.817.6
PakistanChishtian17.61.211.012.223.2
PakistanDaska11.10.86.16.916.4
PakistanFaisalabad24.91.313.014.334.1
PakistanGujranwala 5.61.18.69.818.3
Pakistan Hafizabad 19.60.95.76.519.7
PakistanHyderabad72.01.519.420.943.4
PakistanIslamadad19.73.59.913.431.3
PakistanKarachi67.63.115.518.645.4
PakistanKohat7.11.35.16.310.3
PakistanLahore31.22.916.819.647.3
PakistanLarkana19.90.810.010.923.5
PakistanLayyah11.51.38.810.237.1
PakistanMardan13.31.66.98.623.7
PakistanMingawara11.91.54.76.234.3
PakistanMultan32.21.47.38.725.7
PakistanNawabshah23.00.84.85.623.8
PakistanPeshawar6.21.05.76.811.5
PakistanQuetta8.51.56.98.412.8
PakistanSargodha12.91.78.310.028.5
PakistanSheikhupura5.51.011.512.531.9
PakistanShikarpur24.12.64.77.327.8
PakistanSialkot9.90.410.510.914.8
PakistanTurbat8.2 1.06.87.734.2
PanamaArraijan25.40.56.97.426.3
PanamaCiudadde Panama 59.82.710.413.138.7
PanamaLaChorrera11.30.67.48.029.3
PapuaNew Guinea Lae18.31.24.65.913.5
PapuaNew
PapuaNew Guinea
PortMoresby13.91.39.410.740.8
Wewak30.31.07.08.020.3
ParaguayAsuncion18.81.314.115.432.6
ParaguayCiudaddelEste5.02.215.017.334.9
PeruArequipa25.72.314.216.580.1
PeruAyacucho26.33.013.916.974.4
PeruCajamarca29.31.311.412.644.6
PeruChiclayo17.92.315.217.573.4
PeruCusco55.72.413.616.158.9
PeruHuacho15.31.18.89.853.8
PeruHuancayo13.50.710.911.630.4
PeruHuaral9.31.313.414.761.4
PeruIquitos15.51.38.910.249.6
Peru Jaén 26.40.412.112.541.5
PeruJuliaca14.11.614.516.039.2
PeruLima34.24.014.618.680.7
PeruMoquegua19.32.414.917.391.4
PeruPiura8.41.512.914.450.3
PeruTrujillo16.21.712.714.453.5
PhilippinesBacolod13.92.915.58.731.2
PhilippinesCebuCity48.10.714.415.117.7
PhilippinesManila32.51.620.722.228.7
PolandKatowice93.43.722.526.270.8
PolandLodz**93.84.217.121.349.4
PolandLomza**97.03.018.421.567.1
PolandLublin**87.22.919.122.049.1
PolandMielec51.72.510.412.952.3
PolandPoznan**92.97.615.022.661.6
PolandWarsaw**93.56.014.620.564.8
PolandWroclaw**94.64.917.422.356.0
QatarDoha100.02.921.824.735.5
Qatar Mesaieed16.80.311.411.726.6
Republicof Korea
Busan89.65.514.820.348.7
Cheonan35.52.310.612.931.2 Republicof Korea Gwangju87.57.115.622.765.4 Republicof Korea Jinju64.83.47.611.038.4 Republicof Korea Seoul70.63.012.715.748.8
Republicof Korea
RomaniaARad82.43.111.014.151.5
RomaniaBucharest**85.63.59.513.054.1
RomaniaCampiaTurzii83.82.56.08.450.2
RomaniaCraiova**84.84.78.112.860.6
RomaniaFalticeni30.21.55.26.744.5
RomaniaMangalia45.63.110.313.466.8
RomaniaNavodari78.71.37.79.019.6
RomaniaReghin60.44.66.110.748.8
RomaniaTarguJiu38.51.86.38.236.3 Russian Federation Astrakhan73.91.29.610.937.1 Russian Federation Berezniki65.79.413.723.273.7 Russian Federation Dzerzhinsk69.84.412.016.460.8 Russian Federation Moscow85.98.316.224.683.3
Country Cities
Proportion ofpopulation livingwithin convenient walking distance topublic transport(%)
Share ofurban area allocated toopen public space (%)
Share ofurban area allocated tostreets (%)
Share ofurban area allocated tostreets &open public space (%)
Proportion of population living within convenient walking distance toopen public space(%)
Russian Federation SaintPetersburg90.23.221.825.040.9
Russian Federation
Tyumen81.75.118.323.364.2
RwandaButare28.90.212.112.36.4
RwandaCyangugu33.10.010.010.14.8
RwandaGisenyi12.81.115.816.912.2
RwandaGitarama28.91.010.211.221.8
RwandaKayonza26.90.411.111.621.6
RwandaKigali65.21.611.713.348.9
RwandaNyanza24.20.58.79.335.3
RwandaRuhengeri20.00.110.110.29.5
SamoaApia18.80.76.77.417.2
SaudiArabiaAl-Khafji7.50.911.412.314.3
SaudiArabiaAl-Madinah4.41.515.216.617.6
SaudiArabiaArar6.62.312.314.620.7
SaudiArabiaAr-Rass20.13.215.919.147.6
SaudiArabiaMakkah5.50.816.817.622.4
SaudiArabia Rafha 50.82.816.319.153.8
SaudiArabiaRiyadh8.62.413.916.310.3
SaudiArabiaTabuk16.10.717.117.713.4
SaudiArabiaTaif12.91.310.511.823.6
SenegalDakar77.33.113.016.192.5
SenegalDiourbel32.30.921.122.032.0
SenegalKaolack20.71.321.322.644.1
SenegalLouga38.73.118.521.645.8
SenegalMbour38.91.922.124.066.9
SenegalSaint-Louis8.91.523.725.161.0
SenegalThies35.51.120.021.155.7
SenegalTouba60.81.012.213.343.6
SenegalZiguinchor22.41.216.617.844.4
SerbiaBelgrade90.323.412.535.963.8
SerbiaKikinda36.83.05.78.717.7
Serbia Kragujevac33.65.78.514.245.0
SerbiaNis**85.03.710.213.957.2
SerbiaNoviPazar19.63.09.412.573.2
SerbiaNoviSad**76.34.410.715.252.9
SerbiaPozarevac37.03.88.912.637.6
SerbiaZrenjanin32.52.65.68.248.3
SingaporeSingapore94.27.519.426.970.3
Solomon Islands Honiara7.10.66.57.119.0
SouthAfricaJohannesburg20.81.910.812.715.4
SouthAfricaPortElizabeth5.63.49.312.729.1
SpainMadrid**98.46.717.223.963.1
SriLankaAnuradhapura48.52.39.511.851.4
SriLankaBadulla41.42.58.711.258.2
SriLankaBatticaloa26.61.710.812.555.7
SriLankaChilaw,Ferry Street 24.22.85.07.857.6
SriLankaColombo62.60.59.710.215.2
SriLankaEmbilipitiya25.10.95.46.334.7
SriLankaGalle70.52.111.213.238.4
SriLankaHambantota42.81.96.48.347.6
SriLankaHaputale53.61.710.712.433.9
SriLankaJaffna27.40.36.26.417.2
SriLankaKandy65.71.412.413.739.9
SriLankaMatara53.71.29.410.637.3
SriLankaPuttalam34.70.88.69.460.1
SriLankaRatnapura59.65.210.115.355.7
Stateof Palestine Al-Khalil18.00.210.710.913.2
Stateof Palestine Al-Quds52.85.012.317.340.0
Stateof Palestine An-Nusayrat18.70.612.813.423.6
Stateof Palestine Ghazzah7.70.313.213.421.9
Stateof Palestine Jenin21.11.113.414.54.9
Stateof Palestine KhanYunis29.00.213.013.233.4
Stateof Palestine Nabulus(Nablus)15.20.911.412.421.6
Stateof Palestine Rafah23.80.413.714.130.5
SudanAlQadarif18.82.421.123.567.2
Sudan Atbara10.10.420.921.332.1
SudanBurSudan4.51.321.622.944.2
SudanKassala6.90.822.723.430.7
SudanKhartoum18.40.923.224.114.8
SudanSannar5.51.020.321.332.8
SudanSinjah5.61.515.016.661.2
SudanWadMadani10.51.721.323.047.9
SwitzerlandBasel**95.44.516.921.481.8
SwitzerlandBern**94.36.219.625.877.1
SwitzerlandEmmen_Lucerne93.58.015.823.887.8
SwitzerlandFribourg**92.57.715.723.480.3
SwitzerlandLausanne**96.35.118.523.676.9
SwitzerlandNeuchatel89.13.017.320.370.1
SwitzerlandSt.Gallen**97.26.616.322.982.9
SwitzerlandWetzikon97.13.016.419.485.4
SwitzerlandWinterthur**93.74.720.024.781.9
SwitzerlandZurich**96.23.618.322.067.6
TajikistanChkalovsk (Buston) 46.07.29.116.386.8
TajikistanDušanbe [Dushanbe] 40.72.29.211.438.7
TajikistanIsfara48.02.07.69.654.8
TajikistanIstaravshan27.01.65.97.540.4
TajikistanKhorog71.54.810.615.483.4
TajikistanKhujand43.92.99.312.256.5
TajikistanKonibodom49.60.911.312.351.4
TajikistanKulob39.12.75.58.242.7
Tajikistan ūrġonteppa (Bochtar, Kurgan-T’ube) [Qurghonteppa]
30.42.47.29.660.8
TajikistanNurak[Hopak]41.51.64.56.051.6
TajikistanPancakent [Panjakent] 35.01.85.16.941.0
TajikistanTursunzoda36.51.65.87.430.5
TajikistanVahdat23.90.96.37.338.9
ThailandBangkok26.00.714.214.911.8
ThailandCha-Am13.94.28.412.748.0
ThailandChiangMai33.91.413.414.837.0
ThailandChiangRai14.51.311.412.622.3
ThailandChumphon37.80.59.510.016.4
ThailandKhonKaen27.21.914.516.422.2
ThailandPhatthalung37.12.112.815.030.0
Country Cities
Proportion ofpopulation livingwithin convenient walking distance topublic transport(%)
Share ofurban area allocated toopen public space (%)
Share ofurban area allocated tostreets (%)
Share ofurban area allocated tostreets &open public space (%)
Proportion of population living within convenient walking distance toopen public space(%)
TogoLome38.40.710.811.436.5
TunisiaAl-Qayrawan33.71.924.126.066.7
TunisiaBanzart16.11.515.617.141.0
TunisiaMonastir35.32.521.624.171.8
TunisiaQabis30.23.122.425.563.1
TunisiaSafaqis(Sfax)17.20.518.819.335.2
TunisiaSusah45.61.319.420.753.8
Tunisia Tozeur 43.515.021.936.991.0
TunisiaTunis48.52.922.225.145.3
TurkeyAdapazari23.31.820.021.941.8
TurkeyAdiyaman60.12.922.025.084.6
TurkeyAgri45.01.615.116.770.6
TurkeyAnkara 34.05.121.126.276.8
TurkeyAntalya70.83.716.320.069.8
TurkeyBalikesir85.62.729.031.790.3
TurkeyBursa77.82.927.029.970.7
TurkeyCarasamba63.93.015.018.077.3
TurkeyÇerkezköy47.81.218.319.569.2
TurkeyCorum54.72.618.921.580.3
TurkeyDenizli68.33.825.128.976.7
TurkeyElbistan33.61.39.210.660.6
TurkeyGaziantep60.66.027.533.583.1
TurkeyIstanbul91.13.123.826.959.8
TurkeyIzmir83.33.825.829.768.9
TurkeyKayseri41.42.017.819.966.7
TurkeyKonya44.73.019.222.265.3
TurkeyMalatya59.21.015.216.258.8
TurkeyNigde57.81.415.116.571.5
TurkeySamsun42.02.722.725.471.2
TurkeySanliurfa53.44.024.428.583.8
TurkeySivas75.01.821.223.072.0
TurkeyTarsus65.6 2.222.624.870.3
TurkeyUzunköprü88.51.521.222.667.2
TurkeyViransehir30.03.220.023.284.1
TurkmenistanAsgabat60.74.314.919.248.8
TurkmenistanBalkanabat49.22.514.517.070.6
TurkmenistanBaýramaly (Bajram-Ali) 8.20.68.99.612.1
TurkmenistanDasoguz9.10.98.09.020.9
TurkmenistanMary26.91.313.314.527.8
TurkmenistanSerdar (Gyzylarbat,KizylArvat) 8.31.210.411.636.9
Turkmenistan Tejen (Tedžen) 9.21.615.116.752.2
TurkmenistanTurkmenabat24.52.113.515.638.4
TurkmenistanTurkmenbasy11.71.512.814.349.7
UgandaGulu14.74.611.115.876.0
UgandaJinja11.50.38.89.117.3
UgandaKampala48.70.87.48.122.9
UgandaKasese21.50.814.615.420.8
UgandaLira11.21.511.513.033.8
UgandaMasaka8.41.09.010.017.8
UgandaMbale11.62.66.89.428.9
Uganda Mbarara16.61.18.69.818.9
UkraineLviv94.37.015.122.187.0
UkraineNikolaev79.52.413.215.648.0
UkraineRovno75.92.613.115.755.5
UnitedArab Emirates AbuDhabi27.32.719.522.237.6
Access to Convenient Transport
Country Cities Proportion ofpopulation livingwithin convenient walking distance topublic transport(%)
Share ofurban area allocated toopen public space (%)
Access to Open Space
Share ofurban area allocated tostreets (%)
Share ofurban area allocated tostreets &open public space (%)
Proportion of population living within convenient walking distance toopen public space(%)
UnitedArab Emirates AlAin9.81.815.817.641.3
UnitedArab Emirates Dubai41.22.720.523.140.6
United Kingdomof GreatBritain andNorthern Ireland
United Kingdomof GreatBritain andNorthern Ireland
London**94.812.911.924.981.3
Manchester98.49.013.222.281.6
Sheffield 98.25.311.817.158.2 UnitedRepublic ofTanzania Arusha21.70.96.16.916.7 UnitedStates ofAmerica Chicago39.16.19.815.947.8 UnitedStates ofAmerica Clovis63.02.214.116.431.3 UnitedStates ofAmerica Gainesville,FL73.75.313.018.443.1 UnitedStates ofAmerica Killeen,TX28.01.8 6.78.519.4 UnitedStates ofAmerica Manchester98.49.013.222.248.3 UnitedStates ofAmerica Minneapolis59.86.111.818.054.8 UnitedStates ofAmerica Modesto60.62.29.811.941.4 UnitedStates ofAmerica Montgomery35.32.89.812.625.7 UnitedStates ofAmerica NewYork69.89.19.818.971.0 UnitedStates ofAmerica Philadelphia59.22.910.012.937.3 UnitedStates ofAmerica Portland,OR68.34.413.417.857.4 UnitedStates ofAmerica Raleigh33.42.49.612.025.4 UnitedStates ofAmerica Springfield, MA 55.02.97.410.336.8 UnitedStates ofAmerica Tallahasee62.52.815.218.035.5 UnitedStates ofAmerica Toledo98.42.29.311.527.5 UnitedStates ofAmerica Visalia60.53.012.315.465.5 UnitedStates ofAmerica Waco38.53.811.715.548.4
United Kingdomof GreatBritain andNorthern Ireland
UruguayLasPiedras87.50.713.614.349.8
UruguayMaldonaldo92.91.517.118.681.2
UruguayMelo35.00.915.516.469.2
UruguayMercedes62.51.015.616.6 71.2
UruguayMontevideo76.03.814.518.382.7
UruguayPaysandu26.82.213.816.070.4
UruguayRivera23.00.414.114.558.9
UruguaySalto45.91.215.716.968.0
UruguayTacuarembo 51.71.012.713.769.8
UzbekistanAndijan11.61.310.912.327.2
UzbekistanBekobod15.13.28.111.362.7
UzbekistanBesharyk38.32.47.19.560.2
UzbekistanBukhara8.21.37.18.438.9
UzbekistanKokand18.81.46.47.824.6
Country Cities
Proportion ofpopulation livingwithin convenient walking distance topublic transport(%)
Share ofurban area allocated toopen public space (%)
Share ofurban area allocated tostreets (%)
Share ofurban area allocated tostreets &open public space (%)
Proportion of population living within convenient walking distance toopen public space(%)
UzbekistanNamangan27.12.85.98.716.5
Uzbekistan Navoi 19.91.59.010.412.2
UzbekistanNukus41.91.116.017.113.3
UzbekistanQarshi10.01.412.814.215.9
UzbekistanTashkent23.11.011.012.05.6
UzbekistanTermiz21.90.88.69.410.4
UzbekistanTo’rtko’l(Turtkul)9.11.18.19.323.1
UzbekistanUrganch10.03.113.416.524.9
Venezuela (Bolivarian Republicof) Acarigua 39.73.213.516.756.7
Venezuela (Bolivarian Republicof) Altagraciade Orituco 26.33.35.18.446.7
Venezuela (Bolivarian Republicof)
Venezuela (Bolivarian Republicof)
Venezuela (Bolivarian Republicof)
Venezuela (Bolivarian Republicof)
Venezuela (Bolivarian Republicof)
Venezuela (Bolivarian Republicof)
Venezuela (Bolivarian Republicof)
Venezuela (Bolivarian Republicof)
Venezuela (Bolivarian Republicof)
Venezuela (Bolivarian Republicof)
Venezuela (Bolivarian Republicof)
Venezuela (Bolivarian Republicof)
Barcelona99.75.69.715.359.2
Barinas34.72.314.616.943.6
Barquisimeto46.74.912.817.757.8
Cabimas33.13.515.719.286.0
Cabudare54.76.513.620.179.5
Caracas44.45.013.518.538.1
CiudadBolívar35.76.111.717.862.2
CiudadGuayana (GuayanaCity) 45.12.913.816.756.3
CiudadOjeda20.33.49.312.615.6
Coro37.35.613.419.078.6
Cua 33.13.25.78.839.6
Cumaná41.82.612.615.159.2
Venezuela (Bolivarian Republicof) Guarenas& Guatire 24.82.18.610.740.4
Venezuela (Bolivarian Republicof)
Venezuela (Bolivarian Republicof)
Venezuela (Bolivarian Republicof)
Venezuela (Bolivarian Republicof)
Venezuela (Bolivarian Republicof)
Venezuela (Bolivarian Republicof)
Venezuela (Bolivarian Republicof)
LosTeques26.12.58.210.736.3
Maracaibo19.31.914.416.335.5
Maracay22.02.312.514.7 39.7
Mariara44.02.612.214.856.5
SaCarlosDelZulia 36.72.98.010.853.3
SanCristobal46.73.612.115.757.5
SanJuandelos Morros 48.82.08.910.941.4
Venezuela (Bolivarian Republicof)
Venezuela (Bolivarian Republicof)
Venezuela (Bolivarian Republicof)
Venezuela (Bolivarian Republicof)
Access to Convenient Transport
Share ofurban area allocated toopen public space (%)
Share ofurban area allocated tostreets (%)
Share ofurban area allocated tostreets
public
Access to Open Space Country Cities Proportion ofpopulation livingwithin convenient walking distance topublic transport(%)
Proportion of population living within convenient walking distance toopen public space(%)
Tucupita48.26.69.315.874.3
Valencia88.01.712.113.829.1
Valera34.81.79.811.548.0
Yaritagua68.15.311.616.976.3
VietNamHoChiMinhCity68.70.813.914.630.4
YemenAdan24.51.922.924.951.7
YemenAlHudaydah30.30.620.721.239.4
YemenAmran22.70.816.016.827.7
YemenDhamar35.40.810.411.236.2
YemenRada’a55.00.211.712.026.5
YemenSana’a15.20.45.96.312.4
Yemen Taizz40.30.314.815.09.0
YemenTarim44.63.523.026.526.3
YemenYarim59.01.19.911.013.8
ZambiaNdola9.40.311.111.48.0
Access to transport
Indicator is computed as share of population who live within a walking distance (along a street network) of 500 m to a low capacity public transport system (eg bus, tram) and 1000 m to high capacity public transport systems (trains, ferries, etc)
• Only public transport stops which are mapped are included in the analysis and can include both formal and informal stops where available. Many cities have an informal network which is not fully mapped and may thus record higher levels of access to public transport than reported here
• Only public transport modes are considered, which do not include taxisData on public transport stops is sourced from city maps, OSM, GTFS, UITP, Google, and point mapping in some cities. Estimates by DG REGIO are based on data from OSM, TomTom, NSIs, Eurostat, Copernicus Urban Atlas
• Data used to estimate population with access to public transport is based on grid level population disaggregation directly from city/country data, HRSL (Facebook and CIESIN), WorldPop or GHS-Pop.
• City/urban area used in the analysis has been generated using a classification approach based on the Urban Extent or the Degree of Urbanization concepts to city definition.
• Indicator is computed as share of urban land in streets and open public space, as well as share of population who can access/live within a walking distance (along a street network) of 400 m to an open public space.
• An open public space is defined as openly and freely accessible space for all (without any cost implication). Identification of open public spaces are based on data compiled from city land use plans as well as data available from open sources such as OSM and Google.
• Data used to estimate population with access to open public spaces is based on grid level population disaggregation directly from city/country data, HRSL (facebook and CIESIN) or WorldPop. Analysis year is 2019, which in some cases includes population data for 2018.
• City/urban area used in the analyis has been generated using a classification approach based on the Urban Extent or the Degree of Urbanization concepts to city definition.
• The urban/city area used for the indicator computation may be larger or smaller than the official municipality boundaries.
Source: United Nations Human Settlement Programme (UN-Habitat), Global Urban Indicators Database 2020
** Data from European Commission DG REGIO
a) Includes Az-zarqa, Ar-Rusayfah, Al-Quwaysimah,Tila al-Ali, Wadi as-sir, Al-Jubayhah, Khraibat as-suq and Sahab
b) Includes awallī, Al-Farwānīyah, Al-Finās, Al-Jahrā’, Janūb al-Kuwayt, Al-Manqaf, Al-Firdaws and Mubarāk al-Kabīr
Includes Mohammedia town
Includes Bawashar, Matrah and Aseed (Assib)
Includes Jabaiyah, Bayt Lāhīyā
Includes Dayr al Balah
Includes At-Tadamun and Sukrah
Includes Ajman and Ash Shariqa
World 30.230.931.831.931.431.2
AustraliaandNewZealand7.37.67.47.37.27.2
CentralandSouthernAsia58.463.565.772.167.668.3
EasternandSouth-EasternAsia36.939.141.441.237.635.9
EuropeandNorthernAmerica12.911.911.611.011.010.2
LatinAmericaandtheCaribbean19.018.217.717.516.516.2
NorthernAfricaandWesternAsia39.841.142.341.944.643.5
Oceania(exc.AustraliaandNewZealand)9.19.49.49.69.79.9
Sub-SaharanAfrica37.236.437.035.840.139.3
Afghanistan58.163.363.068.263.463.6
Albania24.522.421.421.220.519.3
Algeria 29.029.730.333.133.534.1
Andorra13.211.911.510.110.79.5
Angola 36.735.040.837.439.240.3
AntiguaandBarbuda20.520.420.420.821.121.1
Azerbaijan23.724.422.921.722.423.2
Argentina11.411.212.111.812.212.4
Australia7.47.87.57.47.37.3
Austria 16.915.214.913.614.312.9
Bahamas17.417.417.817.817.617.7 Bahrain59.062.666.557.765.963.3
Bangladesh55.361.762.469.865.564.1
Armenia47.249.545.943.044.145.5
Barbados25.225.024.925.025.925.4
Belgium16.414.814.212.913.812.8
Bhutan31.834.936.539.436.636.9
Bolivia(PlurinationalStateof)26.227.627.828.827.027.3
BosniaandHerzegovina39.235.533.833.832.730.7
Botswana23.323.822.922.328.425.1
Brazil 14.914.213.413.311.911.8 Belize 20.720.320.820.020.520.7
SolomonIslands11.411.911.511.411.611.8
BruneiDarussalam7.07.87.37.27.37.4
Bulgaria27.324.823.124.122.321.1
Myanmar30.733.535.732.931.133.7 Burundi34.936.537.435.936.337.3
Belarus21.821.221.421.520.218.1
Cambodia25.1 28.328.426.025.827.2
Cameroon56.558.057.355.766.864.3
Canada 8.58.58.07.97.76.7
CaboVerde60.764.260.660.072.562.1
CentralAfricanRepublic40.941.342.139.643.942.9
SriLanka21.322.422.620.719.916.8
Chad 57.662.159.354.870.766.8
Chile 24.824.125.925.126.626.3
China 51.753.558.656.354.148.8
Colombia21.020.120.319.919.319.0
Comoros14.714.714.714.816.315.5
Congo 43.142.846.046.143.844.4
DemocraticRepublicoftheCongo42.243.044.543.543.043.3
CostaRica20.619.419.619.218.818.6
Croatia21.919.619.418.818.917.7
Cuba 22.523.022.922.823.022.7
Cyprus 19.718.717.817.117.915.6
Czechia19.818.217.817.916.915.8
Benin 36.434.235.933.039.338.8
Denmark13.311.4 11.011.010.910.1
Dominica20.920.720.720.721.721.6
DominicanRepublic16.616.516.516.616.816.5
Ecuador18.420.219.119.719.519.7
ElSalvador33.531.032.229.829.629.3
EquatorialGuinea40.339.138.239.645.145.0
Ethiopia29.329.728.928.731.531.1
Eritrea 33.433.335.031.235.335.4
Estonia 8.27.98.08.67.26.7
Fiji 11.111.211.111.111.111.1
Finland 8.47.57.07.06.76.5 France 16.214.614.312.613.312.2 Djibouti33.433.533.832.839.238.2 Gabon 37.436.437.339.739.741.5 Georgia27.628.827.025.326.126.9 Gambia54.455.254.457.263.458.4 Germany15.313.713.312.412.911.8 Ghana 50.247.649.543.955.355.6 Kiribati11.111.311.211.211.111.6 Greece 19.918.016.816.316.715.0 Grenada22.722.622.823.123.823.1 Guatemala35.232.834.231.731.230.9 Guinea 50.748.246.645.256.653.8 Guyana25.025.826.525.926.426.8 Haiti 19.519.219.419.519.819.5 Honduras29.727.528.526.025.725.4 Hungary20.618.217.917.717.716.7 Iceland 7.76.96.86.36.35.8 India 65.170.274.281.175.978.2 Indonesia16.418.218.217.117.820.7 Iran(IslamicRepublicof)34.134.333.934.334.533.7 Iraq 62.360.460.750.360.156.4 Ireland 11.110.09.99.09.18.5 Israel 23.522.021.520.120.518.6 Italy 20.218.117.416.317.115.3 Côted’Ivoire53.948.850.844.958.858.5 Jamaica15.015.415.215.315.415.4 Japan 12.913.113.613.813.413.7 Kazakhstan25.826.625.324.124.225.6 Jordan 33.132.535.033.734.032.8 Kenya 23.324.423.924.922.524.1 DemocraticPeople’sRepublicofKorea40.042.446.244.444.339.7 RepublicofKorea24.525.026.826.726.426.5 Kuwait 65.965.470.156.967.465.0 Kyrgyzstan28.729.728.027.026.928.2 LaoPeople’sDemocraticRepublic19.521.922.921.119.621.8 Lebanon30.030.331.831.732.330.7 Lesotho24.2 23.525.328.530.225.8 Latvia 17.216.817.017.915.414.4 Liberia 46.745.043.238.154.952.0 Libya 38.937.645.143.640.546.4 Lithuania14.013.713.814.212.811.7 Luxembourg13.311.911.710.511.110.2 Madagascar16.015.417.716.519.117.9 Malawi25.627.524.725.226.224.6 Malaysia15.017.116.115.316.517.2 Maldives10.811.511.210.310.010.4 Mali 61.258.853.556.366.663.1 Malta 17.215.615.314.014.713.1 Mauritania72.473.772.977.380.778.1 Mauritius8.89.49.89.69.69.5 Mexico25.924.124.823.823.122.8 Monaco15.914.013.612.112.811.5 Mongolia58.861.558.355.355.860.0 RepublicofMoldova17.216.516.416.615.514.1 Montenegro24.922.921.521.420.819.4 Morocco24.122.9 26.226.128.328.6 Mozambique20.621.121.120.221.919.9 Oman 40.141.640.937.844.241.3 Namibia21.419.120.019.323.620.5 Nauru 7.07.17.07.37.78.2 Nepal 68.374.579.887.782.088.0 Netherlands15.613.913.212.413.012.0 Vanuatu11.311.411.411.411.011.1
NewZealand6.86.96.96.86.66.7 Nicaragua25.424.024.423.022.622.6
Niger 82.275.867.165.989.689.4
Nigeria45.443.743.943.449.347.1
Norway10.28.98.68.38.17.6
Micronesia(FederatedStatesof)10.610.510.810.610.910.8
Palau 7.17.57.47.98.68.7
Pakistan54.657.359.464.160.162.6
Panama16.015.115.315.114.814.5
PapuaNewGuinea12.012.512.112.112.012.2
Paraguay14.814.313.113.212.612.0
Peru 30.932.632.033.332.733.3
Philippines22.724.624.522.822.223.7
Poland 27.825.524.123.823.521.9
Portugal11.110.010.19.09.38.4
Guinea-Bissau51.748.850.050.260.255.0
Timor-Leste17.518.217.916.116.217.7
Qatar 77.482.788.873.089.081.6
Romania19.517.416.516.716.215.7
RussianFederation12.912.913.213.011.911.2
Rwanda 36.238.638.338.238.339.4
SaintKittsandNevis8.28.68.58.99.39.7
SaintLucia22.922.822.723.023.822.9
SaintVincentandtheGrenadines22.622.722.722.923.423.1
SanMarino8.68.98.79.19.910.1
SaoTomeandPrincipe35.730.436.535.837.038.4
SaudiArabia62.866.869.058.270.964.0
Senegal56.057.256.560.965.859.8
Serbia 32.429.027.227.826.525.2
Seychelles13.913.612.512.112.813.7
SierraLeone51.449.047.445.158.556.0
Singapore13.315.414.314.217.017.2
Slovakia22.620.320.019.519.218.3
VietNam22.824.525.123.022.523.7
Slovenia20.918.618.718.417.916.8 Somalia22.922.419.621.226.427.7 SouthAfrica26.826.126.826.930.929.4
Zimbabwe23.624.623.624.125.524.6 Spain 12.511.411.09.910.49.5 SouthSudan33.433.332.930.436.534.6 Sudan 39.840.440.835.344.443.0 Suriname28.329.329.429.430.630.2 Eswatini20.419.921.119.923.019.8 Sweden 7.66.66.46.86.36.0 Switzerland13.912.612.111.211.410.3 SyrianArabRepublic34.434.836.036.137.035.6 Tajikistan48.649.746.844.745.546.5 Thailand28.632.033.030.228.431.9 Togo 42.540.641.938.146.546.1 Tonga 10.910.910.910.910.711.1 TrinidadandTobago23.523.624.124.224.924.4 UnitedArabEmirates40.741.842.838.346.042.2 Tunisia28.827.030.431.030.432.5 Turkey 34.135.935.537.138.036.9 Turkmenistan34.836.033.932.432.333.3 Uganda 39.942.140.541.143.945.7 Ukraine17.817.017.217.116.314.9 NorthMacedonia44.040.036.938.435.733.6 Egypt 62.565.971.869.475.373.0 UnitedKingdomofGreatBritainand NorthernIreland 13.312.011.810.610.910.5 UnitedRepublicofTanzania23.224.523.824.224.024.6 UnitedStatesofAmerica9.69.28.88.88.57.7 BurkinaFaso50.448.344.445.456.754.2 Uruguay9.39.29.99.79.910.0 Uzbekistan34.636.234.032.132.233.9 Venezuela(BolivarianRepublicof)22.621.521.521.120.520.1 Samoa 10.810.811.111.211.211.0 Yemen 40.643.342.737.944.640.3 Zambia29.029.629.427.830.029.4
Source: United Nations Statistics Division (UNSD), SDG Indicators Global Database, last update December 2021.
Abdelkader, Y., H. Elaydi, A. Mansour and J. Schechla (2020) A Pandemic of Violations: Forced Evictions and Other Habitat related Human Rights Violations amid COVID 19, Housing and Land Rights Network, Cairo, http://www.hlrn.org/ img/publications/Pandemic_Violations.pdf, last accessed 13 December 2021
Abdullah, H. (ed) (2021) Towards a European Green Deal with Cities: The Urban Dimension of the EU’s Sustainable Growth Strategy, Confederation of Indigenous Peoples of Bolivia (CIDOB), Barcelona
Åberg, H. E. and S. Tondelli (2021) ‘Escape to the country: a reaction-driven rural renaissance on a Swedish island post COVID-19’ , Sustainability 13(22): 12895
Abergel, T. (2021) Lighting, International Energy Agency, Paris https://www.iea.org/reports/ lighting, last accessed 8 November 2021
Abreha, K. G., W. Kassa, E. K. K. Lartey, T. A. Meng istae, S. Owusu and A. G. Zeufack (2021) Industri alization in Sub-Saharan Africa: Seizing Opportuni ties in Global Value Chains, Africa Development Forum, World Bank, Washington, DC
Abu, M. and S. N. A. Codjoe (2018) ‘Experience and future perceived risk of floods and diarrheal disease in urban poor communities in Accra, Ghana’, International Journal Of Environmental Research and Public Health 15(12): 2830
Abudu Kasei, R., M. D. Kalanda-Joshua and D. T. Benefor (2019) ‘Rapid urbanisation and implications for indigenous knowledge in early warning on flood risk in African cities’, 7(2): 183-214
ACF International (2020) Building Urban Resilience: The Moving Urban Poor Communities in the Philippines Toward Resilience (MOVE UP) Model, Action Against Hunger, United States, https://rilhub.org/wp-content/uploads/2020/05/ MOVEUP-Building-Urban-Resilience_compressed. pdf, last assessed 4 May 2022
Acuto, M. (2016) ‘Give cities a seat at the top table’, Nature 537(7622): 611-613.
Acuto, M. (2020) ‘COVID-19: Lessons for an urban(izing) world’, One Earth, 2(4): 317-319
Acuto, M., S. Larcom, R. Keil, M. Ghojeh, T. Lindsay, C. Camponesch, and S. Parnell (2020) ‘Seeing COVID-19 through an urban lens’, Nature Sustainability, 3: 977–978
Adams, E. A. and G. O. Boateng (2018) ‘Are urban informal communities capable of co-production? The influence of community–public partnerships on water access in Lilongwe, Malawi’, Environment and Urbanization 30(2): 461-480
Adams, E. A., J. Stoler and Y. Adams (2020) ‘Water insecurity and urban poverty in the Global South: Implications for health and human biology’ American Journal of Human Biology 32(1): e23368
Adepoju, M. and R. Sen (2021) 100% Renewables Cities and Regions Roadmap Framework, Local Governments For Sustainability and 100% Renewables Cities and Regions Roadmap, Germany, https://renewablesroadmap.iclei.org/ resource/100-renewables-cities-and-regionsroadmap-framework/#, last accessed 11 May 2022
Adger, W. N., R. S. de Campos, T. Siddiqui, M. F. Gavonel, L. Szaboova, M. H. Rocky, M. R. A. Bhuiyan and T. Billah (2021) ‘Human security of urban migrant populations affected by length of residence and environmental hazards’, Journal of Peace Research 58(1): 50-66
Adrian, T. and G. Gopinath (2021) ‘Addressing inflation pressures amid an enduring pandemic’, IMFblog, 3 December, https://blogs.imf. org/2021/12/03/addressing-inflation-pressuresamid-an-enduring-pandemic/, last accessed 6 May 2022
Agbodjinou, S. (2020) ‘African smart cities in 2030’, Field Actions Science Reports 22: 40-43
Agence France-Presse (2021) ‘‘Dystopian world’: Singapore patrol robots stoke fears of surveillance state’, The Guardian, 6 October, https://www. theguardian.com/world/2021/oct/06/dystopianworld-singapore-patrol-robots-stoke-fears-of-surveillance-state, last accessed 6 November 2021
Aggarwala, R. T. and J. Sirefman (2021) ‘Infrastructure options for the future of cities’, https:// www.mckinsey.com/business-functions/operations/our-insights/infrastructure-options-for-thefuture-of-cities, last accessed 8 November 2021
Agyemang, F. S. K, E. E. Silvaa and M. Poku-Boansib (2019) ‘Understanding the urban spatial structure of Sub-Saharan African cities using the case of urban development patterns of a Ghanaian city-region’, Habitat International 85 (March 2019): 21-33
Ahmad, E., D. Dowling, D. Chan, S. Colenbrander and N. Godfrey (2019) Scaling Up Investment for Sus tainable Urban Infrastructure: A Guide to National and Subnational Reform , Coalition for Urban Transitions, London and Washington, DC
Ahrend, R., C. Gamper and A. Schumann (2014) ‘The OECD metropolitan governance survey: A quantitative description of governance structures in large urban agglomerations’, OECD Regional Development Working Papers, No. 2014/04, OECD Publishing, Paris Aichholzer, G., H. Kubicek and L. Torres (2015) Evaluating E-Participation: Frameworks, Practice, Evidence, Springer
Ajuntament de Barcelona (2021) The Digital Divide in the City of Barcelona 2020: Executive Summary, Cities for Digital Rights, https:// citiesfordigitalrights.org/sites/default/files/Executive%20Summary_Digital%20Divide%20Barcelona.2020_0.pdf, last accessed 27 September 2021
Akter, S., Hakim, S. S., and Rahman, M. S. (2021) ‘Planning for pandemic resilience: COVID-19 experience from urban slums in Khulna, Bangladesh’, Journal of Urban Management 10(4): 325–344
Albert, C., B. Schröter, D. Haase, M. Brillinger, J. Henze, S. Herrmann, S. Gottwald, P. Guerrero, C. Nicolas and B. Matzdorf (2019) ‘Addressing societal challenges through nature-based solutions: How can landscape planning and governance research contribute?’, Landscape and Urban Planning 182: 12-21
Alberti, M., T. McPhearson and A. Gonzalez (2018) ‘Embracing urban complexity’, in T. Elmqvist, X. Bai, N. Frantzeskaki, C. Griffith, D. Maddox, T. McPhearson, S. Parnell, P. Romero-Lankao, D. Simon and M. Watkins (eds) Urban Planet, Cambridge University Press, Cambridge, pp. 45-67
Alexander, C., S. Berrisford, L. Nkula-Wenz, D. Ndhlovu, G. Siame, V. Watson, and D. Zinnbauer (2022) ‘Challenges and opportunities of curbing urban corruption and building professional integrity: Experiences of planners in South Africa and Zambia’, Habitat International 122 (in press)
Alexandra, J. (2019) ‘For green cities to become mainstream we need to learn from local success stories and scale up’, The Conversation, 8 July, https://theconversation.com/for-green-cities-tobecome-mainstream-we-need-to-learn-from-localsuccess-stories-and-scale-up-119933, last accessed 11 May 2022
Alexandri, G. and M. Janoschka (2020) ‘“Postpandemic” transnational gentrifications: a critical outlook’, Urban Studies 57(15): 3202–3214
Allan, J. I. and J. Hadden (2017) ‘Exploring the framing power of NGOs in global climate politics’, Environmental Politics 26(4): 600-620
Allain-Dupre, D. (2017) Decentralization trends in OECD countries: A comparative perspective for Ukraine, OECD, https://www.oecd.org/regional/ regional-policy/Decentralisation-trends-in-OECDcountries.pdf, last accessed 25 February 2022
Allcott, H., A. Collard-Wexler and S. D. O’Connell (2016) ‘How do electricity shortages affect industry? Evidence from India’, American Economic Review 106(3): 587-624
Allen, B., L. Tamindael, S. Bickerton and W. Cho (2020) ‘Does citizen coproduction lead to better urban services in smart cities projects? An empirical study on e-participation in a mobile big data platform’, Government Information Quarterly 37: 101412
Allen, R. and C. S. Slotterback (2021) ‘Building immigrant engagement practice in urban planning: the case of Somali refugees in the Twin Cities’, Journal of Urban Affairs 43(6): 740-755
Alliance for Affordable Internet (2021) ‘The Costs of Exclusion: Economic Consequences of the Digital Gender Gap’, Web Foundation, https://a4ai.org/ research/costs-of-exclusion-report, last accessed 25 February 2022
Allied Market Research (2018) ‘Smart cities market by functional area (smart governance & smart educa tion, smart energy, smart infrastructure, smart mobility, smart healthcare, smart building, and others): Global opportunity analysis and industry forecast, 2018-2025’, Allied Market Research, https://www.alliedmarketresearch.com/smartcities-market, last accessed 8 November 2021
Almenar, J. B., T. Elliot, B. Rugani, B. Philippe, T. N. Gutierrez, G. Sonnemann and D. Geneletti (2021) ‘Nexus between nature-based solutions, ecosystem services and urban challenges’, Land Use Policy 100: 104898
Amiri, S. (2021) ‘Toward City Diplomacy 2.0. Centre of Public Diplomacy’, CPD Blog, https://uscpublicdiplomacy.org/blog/toward-city-diplomacy-20, last accessed 25 February 2022
Ammann, C. and T. Forster (2018) ‘African Cities and the Development Conundrum’, International Development Policy Series – 10, Geneva, Boston: Graduate Institute Publications, Brill-Nijhoff, https://library.oapen.org/bitstream/handle/20.5 00.12657/37967/9789004387942_webready_ content_text.pdf?sequence=1#page=74, last accessed 25 February 2022
Amundi Asset Management and International Finance Corporation (2020) Emerging Market Green Bonds Report 2019: Momentum Builds as Nascent Markets Grow, International Finance Corporation, https://www.ifc.org/wps/wcm/ connect/topics_ext_content/ifc_external_corporate_site/climate+business/resources/em-gbreport-2019, last accessed 3 May 2022
Anayi, L., N. Bloom, P. Bunn, P. Mizen, G. Thwaites and I. Yotzov (2022) ‘The impact of the war in Ukraine on economic uncertainty’, Voxeu, https://voxeu.org/article/impact-war-ukraine-economic-uncertainty, last accessed 20 May 2022
Anderson, C., R. McGee, N. J. Nampoothiri and J. Gaventa, with S. Forquilha, Z. Ibeh, V. IbezimOhaeri, A. Jawed, A. Khan, C. Pereira and A. Shankland (2021) Navigating Civic Space in a Time of Covid: Synthesis Report, Institute of Development Studies, Brighton, UK
Anderson, J. and D. Nassiry with S. Barnard, M. Lind field, R. Teipelke and M. Wilder (2019) Financing the Sustainable Urban Future: Scoping a Green Cities Development Bank, C40 and the Overseas Development Institute, https://cdn.odi.org/media/ documents/12680.pdf, last accessed 11 May 2022
Andrae, A. and T. Edler (2015) ‘On global electricity usage of communication technology: trends to 2030’, Challenges 6(1): 117-157
Andrijevic, M., C.-F. Schleussner, M. J. Gidden, D. L. McCollum and J. Rogelj (2020) ‘COVID-19 recovery funds dwarf clean energy investment needs’, Science 370(6514): 298-300
Angel, S. and A. M. Blei (2016) ‘The productivity of American cities: How densification, relocation, and greater mobility sustain the productive advantage of larger U.S. metropolitan labor markets’, Cities 51: 36-51
Angel, S., and A. Blei (2020) ‘Why pandemics, such as COVID-19, require a metropolitan response’, Sustainability 13(1): 79
Angel, S., P. Lamson-Hall and Z. G. Blanco (2020) Anatomy of Density I: Measurable Factors that Together Constitute Urban Density, Working Paper, https://marroninstitute.nyu.edu/uploads/ content/Anatomy_of_Density_I%2C_3_ August_2020.pdf, last accessed 6 April 2022
Angel, S., P. Lamson-Hall, A. Blei, S. Shingade and S. Kumar (2021) ‘Densify and expand: a global analysis of recent urban growth’, Sustainability 13(7): 3835
Anguelovski, I. (2016) ‘From toxic sites to parks as (green) LULUs? New challenges of inequity, privilege, gentrification, and exclusion for urban environmental justice’, Journal of Planning Literature 31(1): 23-36
Anguelovski, I., J. J. Connolly, H. Pearsall, G. Shokry, M. Checker, J. Maantay, K. Gould, T. Lewis, A. Maroko and J. T. Roberts (2019) ‘Opinion: Why green “climate gentrification” threatens poor and vulnerable populations’, Proceedings of the National Academy of Sciences 116(52): 26139-26143
Anguelovski, I., J. J. Connolly, M. Garcia-Lamarca, H. Cole and H. Pearsall (2019) ‘New scholarly pathways on green gentrification: What does the urban ‘green turn’ mean and where is it going?’, Progress in Human Geography 43(6): 1064-1086
Anguelovski, I., L. Shi, E. Chu, D. Gallagher, K. Goh, Z. Lamb, K. Reeve and H. Teicher (2016) ‘Equity impacts of urban land use planning for climate adaptation: critical perspectives from the global North and South’, Journal of Planning Education and Research 36(3): 333-348
Anheier, H. K., M. Lang and S. Toepler (2019) ‘Civil society in times of change: Shrinking, changing and expanding spaces and the need for new regulatory approaches’, Economics: Open-Assessment E-Journal 13(1): 1-27
Anjorin, S. S., A. A. Ayorinde, M. S. Abba, D. Mensah, E. A. Okolie, O. A. Uthman and O.O. Oyebode (2021) ‘Equity of national publicly funded health insurance schemes under the universal health coverage agenda: A systematic review of studies conducted in Africa’, Journal of Public Health, https://doi.org/10.1093/pubmed/fdab316, last accessed 7 June 2022
Annan-Aggrey, E., E. Bandauko, and G. Arku, (2021) ‘Localising the sustainable development goals in Africa: Implementation challenges and opportunities’ Commonwealth Journal of Local Governance, 24: 4-23
Annez, P., R. Buckley and J. Kalarickal (2010) ‘African urbanization as a flight? Some policy implications of geography’, Urban Forum 21: 221-234
Anyumba, G. and M. Sirayi (2021) ‘Indigenous knowledge and historic city formation in Africa: Learning from the past’, in M. Sirayi, M. Kanyane, G. Verdini (eds) Culture and Rural–Urban Revitalisation in South Africa, Routledge, London, pp. 72-89
Araos, M., S.E. Austin, L. Berrang-Ford, and J.D. Ford (2015) ‘Public health adaptation to climate change in large cities: A global baseline’, International Journal of Health Services 46(1): 53-78
Arcadis (2018) Citizen Centric Cities: The Sustain able Cities Index 2018, Arcadis, https://www. arcadis.com/campaigns/citizencentriccities/ images/%7B1d5ae7e2-a348-4b6e-b1d76d94fa7d7567%7Dsustainable_cities_index_2018_ arcadis.pdf, last accessed 19 March 2022
Arimah, B. C. (2010) ‘The face of urban poverty: Explaining the prevalence of slums in developing
countries’ in J. Beall, B. Guha-Khasnobis and R. Kanbur (eds) Urbanization and Development: Multidisciplinary Perspectives, Oxford University Press, Oxford
Armah, F. A., B. Ekumaha, D. O.Yawsona, J. O. Odoib, A-R, Afitiria, and F. E. Nyiekuc (2018) ‘Access to improved water and sanitation in sub-Saharan Africa in a quarter century’ Heliyon, 4(11)
Arun, C. (2020) ‘AI and the global South: Designing for other worlds’, In Dubber, M., F. Pasquale and S. Das (eds) The Oxford Handbook of Ethics of AI, Oxford University Press, Oxford
Asaee, S. R., A. Sharafian, O. E. Herrera, P. Blomerus and W. Mérida (2018) ‘Housing stock in coldclimate countries: Conversion challenges for net zero emission buildings’, Applied Energy 217: 88-100
Atwoli, L.,A. H. BaquiT. Benfield, R. Bosurgi, F. Godlee, S. Hancocks, R. Horton, L. LaybournLangton, C. A. Monteiro, I. Norman and K. Patrick (2021) ‘Call for emergency action to limit global temperature increases, restore biodiversity, and protect health: Wealthy nations must do much more, much faster’, Nutrition Reviews 79(11): 1183-1185
Auethavornpipat, R. and M. Tanyag (2021) Protests and Pandemics: Civil Society Mobilisation in Thailand and the Philippines during COVID-19: Policy Briefing –SEARBO2, Australian National University, Australia, https://openresearchrepository.anu.edu.au/bitstream/1885/238577/2/ SEARBO-Report-Auethavornpipat-and-Tanyag.pdf, last accessed 23 April 2022
Augsberger, A., M. Collins, W. Gecker, K. Lusk and M. Dougher (2016) ‘Youth Lead the Change: Participatory Budgeting’, Boston University Initiative on Cities, https://www.bu.edu/ioc/files/2017/01/ Youth-Lead-the-Change_Report.pdf, last accessed 8 May 2022
Aurigi, A. and N. Odendaal (2021) ‘From “smart in the box” to “smart in the city”: Rethinking the socially sustainable smart city in context’, Journal of Urban Technology 28(1-2)
Avis, W. R. (2016) Urban Governance (Topic Guide), Birmingham, UK: GSDRC, University of Birmingham, https://gsdrc.org/wp-content/ uploads/2016/11/UrbanGov_GSDRC.pdf, last accessed 25 February 2022
Avner, P. and S. V. Lall (2016) Matchmaking in Nairobi: The Role of Land Use, Policy Research Working Paper 7904, World Bank, Washington, DC Avni, N., N. Brenner, D. Miodownik and G. Rosen (2021) ‘Limited urban citizenship: The case of community councils in East Jerusalem’, Urban Geography: 1-21
Azevedo, J. C., S. Luque, C. Dobbs, G. Sanesi, and T. C. H. Sunderland, (2020) ‘The ethics of isolation, the spread of pandemics, and landscape ecology’, Landscape Ecology 35(10): 2133–2140
Bach, T. (2020) ‘The 10 U.S. cities with the largest income inequality gaps’, US News, 21 September, https://www.usnews.com/news/cities/arti cles/2020-09-21/us-cities-with-the-biggest-incomeinequality-gaps, last accessed 6 June 2022
Bäckstrand, K. and J. W. Kuyper (2017) ‘The democratic legitimacy of orchestration: The UNFCCC, non-state actors, and transnational climate governance’, Environmental Politics: 1-25
Bailey, I. (2007a) ‘Climate policy implementation: Geographical perspectives’, Area 39(4): 415-417 Bailey, I. (2007b) ‘Neoliberalism, climate governance and the scalar politics of EU emissions trading’, Area 39(4): 431-442
Baker, J. L. (2008) Urban Poverty: A Global View, World Bank Urban Papers, World Bank, Washington, DC, http: //documents1.worldbank.org/ curated/en/954511468315832363/pdf/430280 NWP0Glob10Box327344B01PUBLIC1.pdf, last accessed 23 April 2022
Bakhtavar, E., T. Prabatha, H. Karunathilake, R. Sadiq and K. Hewage (2020) ‘Assessment of renewable energy-based strategies for net-zero energy com-
munities: A planning model using multi-objective goal programming’, Journal of Cleaner Production 272: 122886
Bakshi, T. and A. Bhattacharyya (2021) ‘Socially distanced or socially connected? Well-being through ICT Usage among the Indian elderly during COVID-19’, Millennial Asia 12(2): 190-208
Balling, C. E., S. C. Napolitano, S. P. Lane, and D. B. Samuel (2021) ‘The impact of personality and lifestyle change on distress during the COVID-19 pandemic’, Collabra: Psychology 7(1): https://doi. org/10.1525/collabra.19525
Bamu, P. and T. Marchiori (2020) ‘Recognition and protection of informal traders in COVID-19’, WIEGO, December, https://www.wiego.org/ resources/recognition-and-protection-informaltraders-covid-19-laws-lessons-africa, last accessed 24 March 2022
Bandauko, E., E. Annan-Aggrey, and G. Arku (2021) ‘Planning and managing urbanization in the twenty-first century: Content analysis of selected African countries - national urban policies’, Urban Research and Practice 14(1): 94-104
Bandauko, E., G. Arku and H. Nyantakyi-Frimpong (2022) ‘A systematic review of gated communities and the challenge of urban transformation in African cities’, Journal of Housing and the Built Environment, 37: 339–368
Bandauko, E., S. K. Kutor, and G. Arku (2022) ‘To leave or not to leave? An analysis of individual and neighbourhood characteristics shaping place attach ment in Harare’s selected informal settlements’, The Canadian Geographer, https://doi.org/10.1111/ cag.12743, last accessed 7 June 2022
Bandauko, E., S. K. Kutor, E. Anna-Aggrey and G. Arku (2022) ‘“They say these are places for criminals, but this is our home”: Internalizing and countering discourses of territorial stigmatization in Harare’s informal settlements’, International Development Planning Review 44 (2): 217–239
Bangalore, M., A. Smith, and T. Veldkamp (2019) ‘Exposure to floods, climate change, and poverty in Vietnam’ Economics of Disasters and Climate Change, 3: 79–99
Bansard, J. S., P. H. Pattberg and O. Widerberg (2017) ‘Cities to the rescue? Assessing the performance of transnational municipal networks in global climate governance’, International Environmental Agreements: Politics, Law and Economics 17(2): 229-246
Barbarossa, L. (2020) ‘The post pandemic city: Challenges and opportunities for a non-motorized urban environment. An overview of Italian cases’, Sustainability 12(17): 7172
Barcelona En Comú (2019) Fearless Cities: A Guide to the Global Municipalist Movement, New Internationalist, https://fearlesscities.com/sites/ default/files/fearless_book_en.pdf, last accessed 7 March 2022
Barkham, R. J., Brown, K., Parpa, C., Breen, C., Carver, S. and Hooton, C. (2013) Resilient Cities: A Grosvenor Research Report, Grosvenor Global Outlook, United Kingdom.
Barns, S. (2020) Platform Urbanism: Negotiating Platform Ecosystems in Connected Cities, Palgrave Macmillan, Singapore
Barrios, S., L. Bertinelli and E. Strobl (2006) ‘Climatic change and rural-urban migration: The case of sub-Saharan Africa’, Journal of Urban Economics 60(3): 357-371.
Bartholomae, F. W., C. W. Nam and A. M. Schoenberg (2017) ‘Urban shrinkage and resurgence in Germany’, Urban Studies 54: 2701–2718
Bartholomew, K. (2007) ‘Land use-transportation scenario planning: Promise and reality’, Transportation, 34(4): 397-412
Bartlett, S. and C. Tacoli (2021) ‘Urban children and malnutrition’, in S. Sabry (ed) Research Series: Cities for Children and Youth, Global AllianceCities 4 Children, Zurich, https://cities4children. org/wordpress/wp-content/uploads/2021/06/ Nutrition-and-Food-Security-20210616.pdf, last accessed 24 March 2022
Baruah, B. (2015) ‘NGOs as intermediaries for propoor urban electrification’, in M. Hodson and S. Marvin (eds) Retrofitting cities: Priorities, Governance and Experimentation, Earthscan, London and New York, pp. 150-170
Basu, R. and J. Ferreira (2021) ‘Planning car-lite neighborhoods: Does bike-sharing reduce autodependence?’, Transportation Research Part D, Transport and Environment 92: 102721
Bataille, C. G. F. (2020) ‘Physical and policy pathways to net zero emissions industry’, Wiley Interdisciplinary Reviews: Climate Change 11(2): e633
Bataille, C., H. Waisman, Y. Briand, J. Svensson, A. Vogt-Schilb, M. Jaramillo, R. Delgado, R. Arguello, L. Clarke and T. Wild (2020) ‘Net-zero deep decarbonization pathways in Latin America: Challenges and opportunities’, Energy Strategy Reviews 30: 100510
Bates, L., A. Zwick, Z. Spicer, T. Kerzhner, A. Kim, A. Baber, J. Green and D. Moulden (2019) ‘Gigs, side hustles, freelance: what work means in the platform economy city/ blight or remedy: under standing ridehailing’s role in the precarious “gig economy”/ labour, gender and making rent with Airbnb/ the gentrification of ‘sharing’: from bandit cab to ride share tech/ the ‘sharing economy’? precarious labor in neoliberal cities/ where is eco nomic development in the platform city?/ shared economy: WeWork or we work together’, Planning Theory & Practice 20(3): 423-446
Battistoni, P., M. Grimaldi, M. Sebillo and G. Vitiello (2022) ‘Living Labs and Open Innovation to Support Local Development Policies’, in E. Borgogno-Mondino and P. Zamperlin (eds) Geomatics and Geospatial Technologies:24th Italian conference, ASITA 2021, Proceedings, Genoa, Italy, 1-2 July 2021, pp. 339–350
Bauriedl, S. and A. Strüver (2020) ‘Platform urbanism: Technocapitalist production of private and public spaces’, Urban Planning 5(4): 267–276
Baxter, A. J., E. J. Tweed, S. V. Katikireddiand and H. Thomson (2019) ‘Effects of housing first approaches on health and well-being of adults who are homeless or at risk of homelessness: Systematic review and meta-analysis of randomised controlled trials’, Journal of Epidemiology and Community Health 73(5): 379-387
Bayulken, B., D. Huisingh and P. M. J. Fisher (2021) ‘How are nature-based solutions helping in the greening of cities in the context of crises such as climate change and pandemics? A comprehensive review’, Journal of Cleaner Production 288: 125569
Beauvais, E. (2018) ‘The Grandview Woodland Citizens’ Assembly: An experiment in municipal planning’, Canadian Public Administration 61(3): 341-360
Becchio, C., M. C. Bottero, S. P. Corgnati and F. Dell’Anna (2018) ‘Decision making for sustainable urban energy planning: An integrated evaluation framework of alternative solutions for a NZED (Net Zero-Energy District) in Turin’, Land Use Policy 78: 803-817.
Beebeejaun, Y. (2017) ‘Gender, planning, and epistemic injustice’, in M. Bevir, K. McKee and P. Matthews, P (eds) Decentring Urban Governance: Narratives, Resistance and Contestation, Routledge, London, United Kingdom, pp. 67-88
Beer, A., V. Akshay, A. Rainnie, W. Veitch and T. Clower (2020) The Impacts of Specialisation and Diversification on Australia’s Mid-Sized Towns, The Regional Australia Institute, Canberra
BEIS (2021) Net Zero Strategy: Build Back Greener, BEIS (Department for Business, Energy and Industrial Strategy), London, https://www.gov.uk/ government/publications/net-zero-strategy, last accessed 19 March 2022
BEIS and C. Skidmore (2019) ‘UK becomes first major economy to pass net zero emissions law’, https://www.gov.uk/government/news/ uk-becomes-first-major-economy-to-pass-net-zeroemissions-law, last accessed 19 March 2022
Bell, S. L. (2019) ‘Experiencing nature with sight impairment: Seeking freedom from ableism’,
Environment and Planning E: Nature and Space 2(2): 304-322
Bellomo, S. and F. Ferraro (2020) Modern Forms of Work: A European Comparative Study, Sapienza Università Editrice, Rome
Benites, H. S. and P. Osmond (2021) ‘Bioconnections as enablers of regenerative circularity for the built environment’, Urban Planning 6(4): 25-39 Benner, C., E. Johansson, K. Feng and H. Witt (2020) On-demand and on-the-edge: Ride-ailing and Delivery Workers in San Francisco, Executive Summary, UC Santa Cruz Institute for Social Transformation, Santa Cruz
Benton, M., J. Batalova, S. Davidoff-Gore and T. Schmidt (2021) ‘COVID-19 and the state of global mobility in 2020’, Washington, DC, and Geneva: Migration Policy Institute and International Organization for Migration, https://publications. iom.int/books/covid-19-and-state-global-mobility2020#:~:text=The%20year%202020%20was%20 a,international%20students%20to%20family%20 reunification, last accessed 25 February 2022
Beretta, I. (2018) ‘The social effects of eco-innovations in Italian smart cities’, Cities 72: 115-121
Berg, J., M. Furrer, E. Harmon, U. Rani and M. Six Silberman (2018) Digital labour platforms and the future of work: Towards decent work in the online world, International Labour Organization (ILO), Geneva
Berggruen Institute (2021) ‘Reimagining the role of cities and city diplomacy in the multilateral order: Workshop summary’, United Nations Foundation, https://www.berggruen.org/activity/ reimagining-the-role-of-cities-city-diplomacy-inthe-multilateral-order-workshop-summary, last accessed 25 February 2022
Berke, P., J. Kates, M. Malecha, J. Masterson, P. Shea and S. Yu (2021) ‘Using a resilience scorecard to improve local planning for vulnerability to hazards and climate change: An application in two cities’, Cities 119: 103408, https://doi. org/10.1016/j.cities.2021.103408
Bernaciak, A., A. Rze ca and A. Sobol (2017) ‘Participatory budgeting as a tool of environmental improvements in Polish cities’, Economic and Environmental Studies 17(4): 893-906
Bernal, V. A. V., M. A. T. Correa and S. A. P. Barón (2020) ‘How to finance Colombian cities during the COVID-19 pandemic’, World Bank Blogs, 21 December, https://blogs.worldbank.org/ latinamerica/how-finance-colombian-cities-duringcovid-19-pandemic, last accessed 27 February 2022
Beukes, A. (2015) Making the Invisible Visible: Generating Data on ‘Slums’ at Local, City and Global Scales, Working Paper, International Institute for Environment and Development (IIED), London, http: //pubs.iied.org/10757IIED, last accessed 24 March 2022
Beveridge, R., F. Hüesker and M. Naumann (2014) ‘From post-politics to a politics of possibility? Unravelling the privatization of the Berlin Water Company’, Geoforum 51:66–74
Bezgrebelna, M., K. McKenzie, S. Wells, A. Ravindran, M. Kral, J. Christensen, V. Stergiopoulos, S. Gaetz and S. A. Kidd (2021) ‘Climate change, weather, housing precarity, and homelessness: A systematic review of reviews’, International Journal of Environmental Research and Public Health 18(11): 5812
Bhaumik, S., S. Moola, J. Tyagi, D. Nambiar and M. Kakoti (2020) ‘Community health workers for pandemic response: A rapid evidence synthesis’, BMJ Global Health 5(6): e002769
Bhowmick, G. D., D. Dhar, D. Nath, M. M. Ghangrekar, R. Banerjee, S. Das, and J. Chatterjee (2020) ‘Coronavirus disease 2019 (COVID-19) outbreak: Some serious consequences with urban and rural water cycle’, Npj Clean Water 3(1): 32
Bigger, P. and S. Webber (2021) ‘Green structural adjustment in the World Bank’s resilient city’, Annals of the American Association of Geographers 111(1): 36-51
Biggeri, M. (2021) ‘A “Decade for Action” on SDG Localisation’, Journal of Human Development and Capabilities 22(4):706-712
Billger, M., L. Thuvander and B. S. Wästberg (2017) ‘In search of visualization challenges: The development and implementation of visualization tools for supporting dialogue in urban planning processes’, Environment and Planning B: Urban Analytics and City Science 44(6): 1012-1035
Bilsky, E., A. C. Moreno and A. Fernández Tortosa (2021) ‘Local Governments and SDG Localisation: Reshaping Multilevel Governance from the Bottom up’, Journal of Human Development and Capabilities, 22(4):713-724
Biswas P.P. (2020) ‘Skewed urbanization and the contagion’, Economic and Political Weekly 55(16): 13–15
Biswas, N. R. (2009) ‘Civil Society Organizations in Global Governance: Reflections on CSOs in Bangladesh’, Society and Change 4(3): 7-29
Biswas, A. K., C. Tortajada and M. Stavenhagen (2018) ‘Managing shrinking cities in an expanding world’, The Conversation, 22 February, https://theconversation.com/managing-shrinking-cities-in-an-expandingworld-91448, last accessed 3 May 2022
Blanco, I., Y. Salazar and I. Bianchi (2020) ‘Urban governance and political change under a radical left government: The case of Barcelona’, Journal of Urban Affairs 42(1): 1–21
Blay-Palmer, A., G. Santini, J. Halliday, R. Malec, J. Carey, L. Keller, J. Ni, M. Taguchi and R. van Veenhuizen (2021) ‘City region food systems: Building resilience to COVID-19 and other shocks’, Sustainability 13(3): 1325
Bloom, D. E., D. Canning and J. Sevilla (2003) The Demographic Dividend, First Edition, United States, RAND Corporation, United States of America, http: //www. jstor.org/stable/10.7249/mr1274wfhf-dlpf-rf-unpf, last accessed 6 April 2022
BloombergNEF (2021) ‘Electric vehicle outlook 2021’, BloombergNEF, 7 July, https://about.bnef.com/electricvehicle-outlook/, last accessed 8 November 2021
Bocquier, P. and R. Costa (2015) ‘Which transition comes first? Urban and demographic transitions in Belgium and Sweden’, Demographic Research 33: 12971332, https://doi.org/10.4054/DemRes.2015.33.48, last accessed 6 April 2022
Bojovic, D., J. Benavides and A. Soret (2020) ‘What we can learn from birdsong: Mainstreaming teleworking in a post-pandemic world’, Earth System Governance 5: 100074
Bolay, J.-C. (2020) Urban Planning Against Poverty: How to Think and Do Better in Cities in the Global South, Springer
Bonato, D. and R. Orsini (2018) ‘Urban circular economy: The new frontier for European cities’ sustainable development’, in W. W. Clark (ed) Sustainable Cities and Communities Design Handbook, Second Edition, Butterworth-Heinemann, London, pp. 235-245, https://doi.org/10.1016/B978-0-12-8139646.00012-4, last accessed 3 May 2022
Boterman, W. R. (2020) ‘Urban rural polarisation in times of the Corona outbreak? The early demographic and geographic patterns of the SARS CoV 2 epidemic in the Netherlands’, Tijdschrift Voor Economische En Sociale Geografie 111(3): 513–529
Boubacar, S., M. Pelling, A. Barcena and R. Montandon (2017) ‘The erosive effects of small disasters on household absorptive capacity in Niamey: A nested HEA approach’, Environment and Urbanization 29(1): 33-50
Bowler, D. E., L. Buyung-Ali, T. M. Knight and A. S. Pullin (2010) ‘Urban greening to cool towns and cities: A systematic review of the empirical evidence’, Landscape and Urban Planning 97(3): 147-155
Boyce, M. and R. Katz (2021) ‘COVID-19 and the proliferation of urban networks for health security’ Health Policy and Planning, 36(3):357–359
Boylan, A. (2020) ‘The future of farming: Hydroponics’, Princeton Student Climate Initiative, https://psci. princeton.edu/tips/2020/11/9/the-future-of-farminghydroponics, last accessed 8 November 2021
Boyle, A. D., G. Leggat, L. Morikawa, Y. Pappas and J. C. Stephens (2021) ‘Green new deal proposals: Comparing emerging transformational climate poli-
cies at multiple scales’, Energy Research & Social Science 81: 102259
Bradfield, R., G. Wright, G. Burt, G. Cairns and K. Van Der Heijden (2005) ‘The origins and evolution of scenario techniques in long range business planning’, Futures 37(8): 795-812
Bradshaw, J. R., F. Bennett, C. Glendinning, B. Tunstall and K. E. Bloor (2021) ESPN Thematic Report on Social Protection and Inclusion Policy Responses to the COVID-19 Crisis United Kingdom, Research Report, European Union, https:// eprints.whiterose.ac.uk/177997/1/ESPN_UK_ policy_responses_COVID_crisis_2020_21.pdf, last accessed 11 April 2022
Bredenoord, J., P. Van Lindert and P. Smets (2014) Afford able Housing in the Urban Global South: Seeking Sustainable Solutions, Routledge, New York
Brinkerhoff, D. W., A. Wetterberg and E. Wibbels (2018) ‘Distance, services, and citizen perceptions of the state in rural Africa’, Governance 31(1): 103-124
Brisbois, B, P. O’Campo and J. Kamalanathan (2019) ‘Ineq uities in cities and in urban health’, in S. Galea, C. K. Ettman and D. Vlahov (eds) Urban Health, Oxford University Press, London and New York
Broom, D (2020) ‘This is how we can save millions of people from extreme poverty after COVID-19’, https://www.weforum.org/agenda/2020/12/this-ishow-we-can-save-millions-of-people-from-extremepoverty-after-covid-19/ last accessed 23 April 2022
Broom, D. (2021) ‘Flying cars and driverless buses – the future of urban mobility has landed’, https://www. weforum.org/agenda/2021/04/low-emission-flyingcars-future-of-cities/, last accessed 19 March 2022
Brückner, M. (2012) ‘Economic growth, size of the agricultural sector, and urbanization in Africa’, Journal of Urban Economics 71: 26-36
Bruckner, T. (2019) ‘The Ignored Pandemic: How Corruption in Healthcare Service Delivery Threatens Universal Health Coverage’, Transparency International, http://ti-health.org/wp-content/ uploads/2019/03/IgnoredPandemic-WEB-v3.pdf, last accessed 25 February 2022
Bryant, B. and P. Mohai (eds) (2019) Race and the Incidence of Environmental Hazards: A Time for Discourse, Routledge, New York
Bulkeley, H. (2019) Accomplishing Climate Governance, Cambridge University Press, Cambridge Buque, L. I. B. and H. Ribeiro (2015) ‘Overview of the selective waste collection with pickers in Maputo municipality, Mozambique: Challenges and perspectives’, Saúde e Sociedade 24: 298-307
Burch, S. and J. D. DiBella (2021) ‘Business models for the Anthropocene: Accelerating sustainability transformations in the private sector’, Sustainability Science 16: 1963–1976
Burch, S., S. Hughes, P. Romero-Lankao and H. Schroeder (2018) ‘Governing urban sustainability transformations: The new politics of collaboration and contestation,’ in T. Elmqvist, X. Bai, N. Frantzeskaki, C. Griffith, D. Maddox, T. McPhearson, S. Parnell, P. Romero-Lankao, D. Simon and M. Watkins (eds) Urban Planet, Cambridge University Press, Cambridge, pp. 303-326
Burnett, R., H. Chen, M. Szyszkowicz, N. Fann, B. Hubbell, C. A. Pope, J. S. Apte, M. Brauer, A. Cohen and S. Weichenthal (2018) ‘Global estimates of mortality associated with long-term exposure to outdoor fine particulate matter’, Proceedings of the National Academy of Sciences 115(38): 9592-9597
Burns, R., V. Fast and A. Levenda (2021) ‘Smart cities: Between worlding and provincialising’, Urban Studies 58(3): 461-470
Busch, H., L. Bendlin and P. Fenton (2018) ‘Shaping local response–The influence of transnational municipal climate networks on urban climate governance’, Urban Climate 24: 221-230
Busch, R. (2017) ‘Disrupting transportation: We need to think bigger than cars’, https://www.mckinsey.com/ industries/travel-logistics-and-infrastructure/ourinsights/disrupting-transportation-we-need-to-thinkbigger-than-cars, last accessed 19 March 2022
Büscher, B., G. Feola, A. Fischer, R. Fletcher, J.F. Gerber, W. Harcourt, M. Koster, M. Schneider, J. Scholtens, M. Spierenburg and V. Walstra (2021) ‘Planning for a world beyond COVID-19: Five pillars for post-neoliberal development’, World Development 140: 105357
Business Insider (2021) ‘A California city gave some residents $500 per month. After a year, the group wound up with more full-time jobs and less depression’, Business Insider, 3 March, https://www.businessinsider.com/stockton-basicincome-experiment-success-employmentwellbeing-2021-3?r=US&IR=T, last accessed 25 October 2021
Buttazzoni, A., M. Veenhof and L. Minaker (2020) ‘Smart city and high-tech urban interventions targeting human health: An equity-focused systematic review’, International Journal of Environmental Research and Public Health 17(7): 2325
Byers, E., M. Gidden, D. Leclère, J. Balkovic, P. Burek, K. Ebi, P. Greve, D. Grey, P. Havlik, A. Hillers, N. Johnson, T. Kahil, V. Krey, S. Langan, N. Nakicenovic, R. Novak, M. Obersteiner, S. Pachauri, A. Palazzo, S. Parkinson, N. D. Rao, J. Rogelj, Y. Satoh, Y. Wada, B. Willaarts, and K. Riahi (2018) Global exposure and vulnerability to multi-sector development and climate change hotspots. Environmental Research Letters, 13(5): 055012.
C40 Cities and Arup (2021) Green and Thriving Neighbourhoods; A pathway to net zero, featuring the ‘15-minute city’, C40 Cities and Arup, London, https://www.c40.org/wp-content/ uploads/2021/10/C40-Arup-GTN-Guidebook_2021.pdf
C40 Knowledge Hub (2020) ‘How to build back better with a 15-minute city’, July, https://www. c40knowledgehub.org/s/article/How-to-buildback-better-with-a-15-minute-city?language=en_ US, last accessed 19 March 2022
C40 Knowledge Hub (2021a) ‘15-minute cities: How to create connected places’, C40 Knowledge Hub, https://www.c40knowledgehub.org/s/ article/15-minute-cities-How-to-create-connected-places?language=en_US, last accessed 21 March 2022
C40 Knowledge Hub (2021b) ‘15-minute cities: How to develop people-centered streets and mobility’, C40 Knowledge Hub, May, https:// www.c40knowledgehub.org/s/article/15-minutecities-How-to-develop-people-centred-streetsand-mobility?language=en_US, last accessed 21 March 2022
Caldeira, T. and J. Holston (2015) ‘Participatory urban planning in Brazil’, Urban Studies 52(11): 2001-2017
Calisto Friant, M. (2019) ‘Deliberating for sustainability: Lessons from the Porto Alegre experiment with participatory budgeting’, International Journal of Urban Sustainable Development 11(1): 81-99
Calvo, P. (2020) ‘The ethics of Smart City (EoSC): Moral implications of hyperconnectivity, algorithmization and the datafication of urban digital society’, Ethics and Information Technology 22: 141–149
Calzada, I. and E. Almirall (2020) ‘Data ecosystems for protecting European citizens’ digital rights’, Transforming Government: People, Process and Policy 14(2): 133-147
Campbell, S. (1996) ‘Green cities, growing cities, just cities?: Urban planning and the contradictions of sustainable development’, Journal of the American Planning Association 62(3): 296–312
Canadell, P., C. Le Quéré, G. Peters, P. Friedlingstein, R. Andrew and R. Jackson (2021) ‘Global emissions almost back to pre-pandemic levels after unprecedented drop in 2020, new analysis shows’, The Conversation, 4 November, https:// theconversation.com/global-emissions-almostback-to-pre-pandemic-levels-after-unprecedenteddrop-in-2020-new-analysis-shows-170866, last accessed 2 May 2022
Capello, R., A. Caragliu and U. Fratesi (2015) ‘Spatial heterogeneity in the costs of the economic crisis in Europe: Are cities sources of regional resilience?’, Journal of Economic Geography 15(5): 951– 972
Capstick, S., I. Lorenzoni, A. Corner and L. Whitmarsh (2014) ‘Prospects for radical emissions reduction through behavior and lifestyle change’, Carbon Management 5(4): 429-445
Cardullo, P. and R. Kitchin (2019) ‘Being a ‘citizen’ in the smart city: Up and down the scaffold of smart citizen participation in Dublin, Ireland’, GeoJournal 84: 1-13
Cardullo, P., C. di Feliciantonio and R. Kitchin (eds) (2019) The Right to the Smart City, Emerald Publishing Limited, Bingley
Carlson, C. J., G. F. Albery, C. Merow, C. H. Trisos, C. M. Zipfel, E. A. Eskew, K. J. Olival, N. Ross and S. Bansal (2022) ‘Climate change increases cross-spe cies viral transmission risk’, Nature 605(7908): 20
Carrington, D. (2022) ‘UK government sued over “pie-in-the-sky” net-zero climate strategy’, The Guardian, 12 January, https://www.theguardian. com/environment/2022/jan/12/net-zero-climatestrategy-uk-government-sued, last accessed 19 March 2022
Carter, E. D. (2016) ‘Environmental justice 2.0: New Latino environmentalism in Los Angeles’, Local Environment 21(1): 3-23
Cartwright, A., S. Parnell, G. Oelofse and S. Ward (2012) Climate Change at the City Scale; Impacts, Mitigation and Adaptation in Cape Town, Earth scan, Routledge, London
Castán Broto, V. and L. Westman (2020) ‘Ten years after Copenhagen: Reimagining climate change governance in urban areas’, Wiley Interdisciplinary Reviews Climate Change 11: e643, https:// doi.org/10.1002/wcc.643
Castán Broto, V. and L. Westman (2021) Urban Sustain ability and Justice: Just Sustainabilities and Environ mental Planning, Zed Books, Bloomsbury, London
Castán Broto, V. and M. Sanzana Calvet (2020)
‘Sacrifice zones and the construction of urban energy landscapes in Concepción, Chile’, Journal of Political Ecology 27(1): 279-299
Castán Broto, V., D. A. Macucule, E. Boyd, J. Ensor and C. Allen (2015) ‘Building collaborative partnerships for climate change action in Maputo, Mozambique’, Environment and Planning A 47(3): 571-587
Castán Broto, V., L. Westman and P. Huang (2021) ‘Reparative innovation for urban climate adaptation’, Journal of the British Academy 9(Supp 8)
Castán Broto, V., L. Westman and X. Ruiz-Campillo (2022) ‘The role of local governments in international climate policy’, in Oxford Research Encyclopedia, https://oxfordre.com/climatescience/view/10.1093/ acrefore/9780190228620.001.0001/acrefore9780190228620-e-842, last accessed 25 May 2022
Cavada, M., D. V. Hunt, and C. D. Rogers (2016) ‘Do Smart Cities Realise their Potential for Lower Carbon Dioxide Emissions?’, Proceedings of the Institution of Civil Engineers-Engineering Sustainability 169(6): 243–252
CBC (2020) ‘Nearly 2,000 TDSB students still waiting to receive laptops, tablets for virtual learning’, https://www.cbc.ca/news/canada/toronto/tdsbstudents-devices-for-remote-learning-1.5766694, last accessed 10 June 2022
CDC Evidence Review (2021) What’s the Impact of Investing in Urban Infrastructure in Africa?, Insight: Impact study 20, CDC Group, https://assets.cdcgroup.com/wp-content/ uploads/2021/06/29140858/Whats-the-impactofinvesting-in-urban-infrastructure-in-Africa.pdf, last accessed 3 May 2022
Ceder, A. (2021) ‘Urban mobility and public transport: Future perspectives and review’, International Journal of Urban Sciences 25(4): 455–479
Centraal Bureau van Statistiek (2022) ‘Urban data centres’, https://www.cbs.nl/en-gb/onzediensten/urban-data-centres, last accessed 8 May 2022
Cervero, R. (2000) Informal Transport in the Developing World, United Nations Commission on Human Settlements, Nairobi
Cervero, R., and A. Golub (2007) ‘Informal transport: A global perspective’, Transport Policy 14(6): 445-457
César, C. (2021) Boosting Productivity in Sub-Saharan Africa: Policies and Institutions to Promote Efficiency, World Bank, Washington, DC, https:// doi: 10.1596/978-1-4648-1550-8, last accessed 3 May 2022
Chakraborty, A. (2011) ‘Enhancing the role of participatory scenario planning processes: Lessons from reality check exercises’, Futures 43(4): 387-399
Chang, C., L. Chiari, Y. Cao, H. Jin, M. Mokhtari and H. Aloulou (eds) (2016) ‘Inclusive smart cities and digital health’, 14th International Conference on Smart Homes and Health Telematics, 25-27 May, Wuhan, China
Chant, S. (2013) ‘Cities through a “gender lens”: A golden “urban age” for women in the global South?’, Environment and urbanization 25(1): 9-29
Chanza, N. and A. De Wit (2016) ‘Enhancing climate governance through indigenous knowledge: Case in sustainability science’, South African Journal of Science 112(3-4): 1-7
Charlton, J. I. (1998) Nothing About Us Without Us: Disability Oppression and Empowerment, University of California Press, Berkeley, CA
Chatwin, M. (2022) ‘Data innovation among local governments in fragile settings’, An unpublished background research paper for the UNDP project: Data Innovation in the Public Sector.
Chavez, A. and A. Ramaswami (2013) ‘Articulating a trans-boundary infrastructure supply chain greenhouse gas emission footprint for cities: Mathematical relationships and policy relevance’, Energy Policy 54: 376-384
Checulin, D., D. Mohr, V. Pokotilo and J. Woetzel (2021) ‘Building a transport system that works: Five insights from our 25-city report’, https:// www.mckinsey.com/business-functions/operations/our-insights/building-a-transport-systemthat-works-five-insights-from-our-25-city-report, last accessed 1 May 2022
Chen, H., L. Wang and W. Chen (2019) ‘Modeling on building sector’s carbon mitigation in China to achieve the 1.5 C climate target’, Energy Efficiency 12(2): 483-496
Chen, M. (2020) ‘COVID-19, cities and urban informal workers: India in comparative perspective’, The Indian Journal of Labour Economics 63: 41–46.
Chen, M. and F. Carré (2020) ‘Introduction’, in M. Chen and F. Carré (eds) The Informal Economy Revisited: Examining the Past, Envisioning the Future, Taylor & Francis, pp.1-27
Chen, M. and V. Beard (2018) Including the Excluded: Supporting Informal Workers for More Equal and Productive Cities in the Global South, Working Paper, World Resources Institute, Washington, DC
Chen, T., E. C. M. Hui, Y. Tu, and W. Lang (2021) ‘Growth or shrinkage: Discovering development patterns and planning strategies for cross-border areas in China’, Journal of Urban Planning and Development 147(4): 05021046
Chernick, H., D. Copeland, and A. Reschovsky (2020) ‘The fiscal effects of the COVID-19 pandemic on cities’, National Tax Journal 73(3): 699–732
Chester, M. V., J. Sperling, E. Stokes, B. Allenby, K. Kockelman, C. Kennedy, L. A. Baker, J. Keirstead and C. T. Hendrickson (2014) ‘Positioning infrastructure and technologies for low carbon urbanization’, Earth’s Future 2(10): 533-547
Chilkoti, A. (2021) ‘The World ahead 2022. The number of people in extreme poverty is falling again’, The Economist, 8 November, https://www.economist.com/the-worldahead/2021/11/08/the-number-of-people-inextreme-poverty-is-falling-again?giftId=7ecccec22b69-44d3-ac30-3e7666df812d, last accessed 5 May 2022
Cho, S., K. Mossberger, D. Swindell and J. Selby (2021) ‘Experimenting with public engagement platforms in local government’, Urban Affairs Review 57(3): 763-793
Chu, E. and K. Michael (2019) ‘Recognition in urban climate justice: Marginality and exclusion of migrants in Indian cities’, Environment and Urbanization 31(1): 139-156
Chu, E., A. Brown, K. Michael, J. Du, S. Lwasa, and A. Mahendra (2019) Unlocking the Potential for Transformative Climate Adaptation in Cities, Background Paper, Global Commission on Adaptation and World Resources Institute, Rotterdam, Netherlands and Washington, DC
Churkina, G., A. Organschi, C. P. Reyer, A. Ruff, K. Vinke, Z. Liu, B. K. Reck, T. Graedel and H. J. Schellnhuber (2020) ‘Buildings as a global carbon sink’, Nature Sustainability 3(4): 269-276
Cilliers, J. (2021) ‘Towards green(er) cities: Contextualizing green benefits for urban spaces and contemporary societies’, Urban Planning 6(4): 1-3 Cinderby, S., D. Archer, V. K. Mehta, C. Neale, R. Opiyo, R.M. Pateman, C. Muhoza, C. Adeline and H. Tukhanen (2021) ‘Assessing inequalities in wellbeing at a neighbourhood scale in low-middle-income-country secondary cities and their implications for long-term livability’, Frontiers in Sociology 6: 729453
Cities Alliance (2021a) Post COVID-19 Sustainable and Regenerative Development of Secondary Cities in Emerging Economies, Cities Alliance, Brussels, https://www.citiesalliance.org/sites/default/ files/2021-03/CA_SecondaryCitiesPostCOVID19-FinalWeb.pdf, accessed 23 April 2022
Cities Alliance (2021b) Secondary Cities Post COVID19: Sustainable and Regenerative Development of Secondary Cities in Emerging Economies, Cities Alliance and UNOPS, Brussels Cities Alliance (2021c) Building Climate Resilient and Sustainable Cities for All, Cities Alliance, Brussels Cities Alliance (2022) The Challenge of Slums—An Overview of Past Approaches to Tackle It’, The Challenges of Slums, Cities Alliance, Brussels, https://www.citiesalliance.org/sites/default/ files/2022-03/Cities%20Alliance_Inforality%20 Paper%20Series_The%20Challenges%20of%20 Slums.pdf, last accessed 23 April 2022
Cities Coalition for Digital Rights (2021) ‘Cities for digital rights: To protect and uphold digital rights at the local and global level’, Cities for Digital Rightsa, https://citiesfordigitalrights.org/, last accessed 30 October 2021
Cities for Global Health (2022) https://www.citiesforglobalhealth.org, last accessed 16 May 2022
Cities for Public Water (2016) ‘Declaration for the Public Management of Water’, conference convened by La Red Agua Pública/the Public Water network in collaboration with the Municipal Council of Madrid, November 3-4 2016, https:// www.tni.org/en/article/consolidation-of-thepublic-water-movementin-spain, last accessed 25 February 2022
Cities Today (2021) ‘Does it spark joy? Tampere rethinks smart city KPIs’, Cities Today, 26 October, https://cities-today.com/does-it-sparkjoy-tampere-rethinks-smart-city-kpis/, last accessed 11 May 2022
Cities4Health (2020) Expanding Cycling Infrastructure to Fight the COVID-19 Pandemic: Lima, Peru, Cities4Health, New York, https://cities4health. org/assets/library-assets/lima_final_oct-2020.pdf, last accessed 1 May 2022
Citizens’ Committee for Children of New York (2019) ‘Households without Internet; Community District; Percent; 2019’, https://data.cccnewyork. org/data/map/1325/household-internetaccess#1325/a/3/1547/62/a/a, last accessed 23 May 2022
City of Bandung (2022) ‘Bandung city dashboard’, http://data.bandung.go.id/dashboard/, last accessed 23 May 2022
City of Chattanooga Office of Economic Development (2019) ‘Why Chattanooga’, City of, https://econ.
chattanooga.gov/why-chattanooga/, last accessed 30 October 2021
City of Gothenburg (2019) Green Bond Framework, https://finans.goteborg.se/wpui/wp-content/ uploads/2019/09/City-of-Gothenburg-GreenBond-Framework-2019-09-12-1.pdf, last accessed 11 May 2022
City of Hamilton (2019) ‘Coming together to end homelessness: Hamilton’s systems planning frame work’, https://www.homelesshub.ca/resource/ coming-together-end-homelessness-hamiltons-sys tems-planning-framework#:~:text=Working%20 from%20a%20rights%2Dbased,of%20Ontario%20 and%20Canada%20respectively, last accessed 25 February 2022
City of Kigali (2020) Kigali Master Plan 2050: Master Plan Report, https://gis.kigalicity.gov.rw/portal/ sharing/rest/content/items/8bf652ea231f4bc5a7 56461a6d487026/data, last accessed 24 March 2022
City of Kitakyushu and Institute for Global Environmental Strategies (2018) Kitakyushu City the Sustainable Development Goals Report 2018, https://www.uncclearn.org/wp-content/uploads/ library/kitakyushu_sdgsreport_en_0713.pdf, last accessed 6 April 2022
City of Melbourne (2020) Economic Impacts of COVID-19 on the City of Melbourne, https:// www.melbourne.vic.gov.au/sitecollectiondocuments/economic-impacts-covid-19-summary.pdf, last accessed 30 April 2022
City of Melbourne (2021) Annual Report 2020–21, https://www.melbourne.vic.gov.au/SiteCollectionDocuments/annual-report-2020-21.pdf, last accessed 29 April 2022
City of Melbourne (2022) ‘Melbourne as a smart city’, https://www.melbourne.vic.gov.au/aboutmelbourne/melbourne-profile/smart-city/Pages/ smart-city.aspx, last accessed 20 May 2022
City of New York and UN-Habitat (2021) ‘Leading locally: The origins and impact of Voluntary Local Reviews’, Mayor’s Office of International Affairs, City of New York, https://www1.nyc.gov/site/ international/programs/leading-locally-vlr.page, last accessed 25 February 2022
City of Portland (2021) ‘Open data: A key component for 21st century digital services’, https://www. portland.gov/what-works-cities/news/2021/5/13/ open-data-key-component-21st-century-digitalservices, last accessed 20 May 2022
City of Richmond (2022) ‘Health in All Policies’, https://www.ci.richmond.ca.us/2575/Health-inAll-Policies, last accessed 15 June 2022
City of Seattle (2021) ‘Participatory budgeting’, Seattle City Council, https://www.seattle.gov/ council/issues/past-issues/participatory-budgeting, last accessed 8 May 2022
City of Toronto (2021) ‘ConnectTO program aims to increase digital equity and access to affordable high-speed internet in Toronto’, https://www. toronto.ca/news/connectto-program-aims-toincrease-digital-equity-and-access-to-affordablehigh-speed-internet-in-toronto/, last accessed 24 March 2022
City of Windsor (2020) Windsor Works – An Economic Development Strategy for the City’s Future Growth, https://www.citywindsor.ca/mayorandcouncil/Documents/Windsor-Works-Report.pdf , last accessed 3 May 2022
Civic Tech Field Guide (2021) ‘Qlue My City’, https:// directory.civictech.guide/listing/qlue-my-city, last accessed 23 May 2022
CIVICUS (2018) ‘Democracy for all: Beyond a crisis of imagination’, https://www.civicus.org/documents/ reports-and-publications/reimagining-democracy/ democracy-for-all-en.pdf, last accessed 25 February 2022
Clavin, A., N. Moore-Cherry and G. Mills (2021) ‘Mapping green Dublin: Co-creating a greener future with local communities’, Urban Planning 6(4): 96-109
Cleave, E., M. Vecchio, D. Spilsbury and G. Arku (2019) ‘Manufacturing change and policy
response in the contemporary economic landscape: How cities in Ontario, Canada, understand and plan for manufacturing’, Regional Studies, Regional Science 6(1): 469-495
Clifton, J., M. E. Warner, R. Gradus and G. Bel (2021) ‘Re-municipalization of public services: trend or hype?’, Journal of Economic Policy Reform 24(3):293-304
Climate Bonds Initiative (2021) Sustainable Debt Market Summary Q3 2021, https://www. climatebonds.net/files/reports/cbi_susdebtsum_ q32021_03b.pdf, last accessed 23 February 2022
Clinton, N., M. Stuhlmacher, A. Miles, N. Uludere Aragon, M. Wagner, M. Georgescu, C. Herwig and P. Gong (2018) ‘A global geospatial ecosystem services estimate of urban agriculture’, Earth’s Future 6(1): 40-60
Coalition for Urban Transitions (2019) Climate Emergency, Urban Opportunity, World Resources Institute (WRI) Ross Center for Sustainable Cities and C40 Cities Climate Leadership Group, London and Washington, DC, https://urbantransitions.global/urban-opportunity, last accessed 19 March 2022
Cobbinah, P. B. and V Nyame (2021) ‘A city on the edge: The political economy of urban green space’, Environment and Urbanization 33(2): 413-435
Cohen, M. and L. Simet (2018) ‘Macroeconomy and urban productivity’ in T. Elmqvist, X. Bai, N. Frantzeskaki, C. Griffith, D. Maddox, T. McPhearson (eds) Urban Planet. Knowledge towards Sustainable Cities, Cambridge University Press, Cambridge, pp. 130-146
Cohen, M., and Habron, G (2018) ‘How does the New Urban Agenda align with comprehensive planning in U.S. cities? A case study of Asheville, North Carolina’, Sustainability 10: 4590
Cohen-Shacham, E., J. Walters, S. Janzen, and S. Maginnis (2016) Nature Based Solutions to Address Global Societal Challenges. International Union for Conservation of Nature (IUCN), Gland, Switzerland
Cole, J. (2014) ‘Polio and the Syrian crisis: The accidental bioterrorist’, https://rusi.org/exploreour-research/publications/commentary/polio-andsyrian-crisis-accidental-bioterrorist, last accessed 4 May 2022
Collaço, F. M. A., L. P. Dias, S. G. Simoes, T. Puksek, J. Seixas and C. Bermann (2019) ‘What if São Paulo (Brazil) would like to become a renewable and endogenous energy-based megacity?’, Renewable Energy 138: 416-433
Collaço, F. M. A., S. G. Simoes, L. Pereira Dias, N. Duic, J. Seixas and C. Bermann (2019) ‘The dawn of urban energy planning – synergies between energy and urban planning for São Paulo (Brazil) megacity’, Journal of Cleaner Production 215: 458-479
Collado, J. R. N. and H. H. Wang (2020) ‘Slum upgrading and climate change adaptation and mitigation: Lessons from Latin America’, Cities 104: 102791
Collier, P., V. Delbridge and S. Wani (2020) ‘Making policy decisions under uncertainty’, International Growth Centre Blog, https://www.theigc.org/ blog/making-policy-decisions-under-uncertainty, last accessed 25 February 2022
Community Organizations Development Institute (2018) ‘The Baan Mankong Collective Housing Program’, https://en.codi.or.th/baan-mankongcollective-housing, last accessed 15 May 2022
Corburn, J. (2020) ‘Health in all policies: Urban development, toxic stressors, and health equity’ in R. Haring, I. Kickbusch, D. Ganten and M. Moeti (eds) Handbook of Global Health, pp. 1-24
Corburn, J. and A. Sverdlik (2017) ‘Slum upgrading and health equity’, International Journal of Environmental Research and Public Health 14(4): 342
Corburn, J. and I. Karanja (2014) ‘Informal settlements and a relational view of health in Nairobi, Kenya: Sanitation, gender and dignity’, Health Promotion International 31(2): 258-269
Corburn, J. and J. S. Griffin (2019) ‘Richmond, California: Health in all urban policies’, in S. Galea, C. K. Ettman and D. Vlahov (eds) Urban Health, Oxford University Press, Oxford, pp. 325-331
Corburn, J., and L. Riley (eds) (2016) Slum health: From the cell to the street, University of California Press, Oakland, California
Corburn, J., Asari, M. R., Pérez Jamarillo, J.and A. Gaviria (2020) ‘The transformation of Medellin into a “City for Life:” insights for healthy cities’, Cities & Health, 4(1): 13-24
Cornell Tech (2021) ‘6 tech transformations that will shape future cities’, https://tech.cornell.edu/ news/6-tech-transformations-that-will-shapefuture-cities/, last accessed 6 May 2022
Corridor Manchester (2020) ‘Digital and smart cities’, Oxford Road Corridor, 11 October, https:// oxfordroadcorridor.com/knowledge/smart-cities/, last accessed 14 November 2021
Cortés-Cediel, M., I. Cantador and M. Rodríguez Bolívar (2021) ‘Analyzing citizen participation and engagement in European smart cities’, Social Science Computer Review 39(4): 592-626
COVID Mobility Works (undated) ‘Find mobility responses to COVID-19’, http: //www.covidmobilityworks.org, last accessed 22 May 2022
Cradle to Cradle Certified (2017) ‘Park 20|20: a leading example for built positive’, https://www. c2ccertified.org/news/article/park-2020-a-leadingexample-for-built-positive, last accessed 20 May 2022
Crane, M., S. Lloyd, A. Haines, D. Ding, E. Hutchinson, K. Belesova, M. Davies, D. Osrin, N. Zimmermann, A. Capon, P. Wilkinson and C. Turcu (2021) ‘Transforming cities for sustainability: A health perspective’, Environment International 147: 106366
Crea, T. M., M. Loughry, C. O’Halloran and G. J. Flannery (2017) ‘Environmental risk: Urban refugees’ struggles to build livelihoods in South Africa’, International Social Work 60(3): 667-682
Creutzig, F., J. Roy, W. F. Lamb, I. M. L. Azevedo, W. B. De Bruin, H. Dalkmann, O. Y. Edelenbosch, F. W. Geels, A. Grubler and C. Hepburn (2018) ‘Towards demand-side solutions for mitigating climate change’, Nature Climate Change 8(4): 260-263
Crivellaro, C., R. Anderson, D. Lambton-Howard, T. Nappey, P. Olivier, V. Vlachokyriakos, A. Wilson and P. Wright (2019) ‘Infrastructuring public service transformation: Creating collaborative spaces between communities and institutions through HCI research’, ACM Transactions on Computer-Human Interaction 26(3)
Croese, S., C. Green and G. Morgan (2020) ‘Localizing the Sustainable Development Goals through the lens of urban resilience: Lessons and learnings from 100 resilient cities and Cape Town’, Sustainability 12: 550 Cruz, N., P. Rode and M. McQuarrie (2019) ‘New Urban Governance: A Review of Current Themes and Future Priorities’, Journal of Urban Affairs 41(1):1-19
Cruz Ruiz, E. (2021) ‘Underrepresented Groups and Constitution-Making: The Mexico City case’, Political Studies Review 19(2): 164-170
Cucca, R. and C. Ranci (2021) ‘Urban policy in times of crisis: The policy capacity of European cities and the role of multi-level governance’, Urban Affairs Review, https://doi.org/10.117 7%2F10780874211041710, last accessed 7 June 2022
Cuesta J., S. Devereux, A. Abdul-Gafaru, J. Gupte, L. P. Ragno, K. Roelen, R. Sabates-Wheeler, and T. Spadafora (2021) ‘Urban social assistance: Evidence, challenges, and the way forward, with application to Ghana’ Development Policy Review 39: 360–380
Cui, J. (2020) ‘The collaborative network among local governments in the Beijing-Tianjin-Hebei metropolitan area in PR China’, in Collaborative Governance of Local Governments in China, Routledge, pp. 91-108
Cunningham, A. (2017) ‘Public transportation of the future: Four new sustainable technologies’ Building Design and Construction, 31 January, https://www.bdcnetwork.com/blog/public-transportation-future-four-new-sustainable-technologies, last accessed 19 March 2022
Curran, D. and A. Smart (2021) ‘Data-driven governance, smart urbanism and risk-class inequalities: Security and social credit in China’, Urban Studies 58(3): 487–506
Curtis, S. (2018) ‘Global cities and the ends of globalism’, New Global Studies 12(1): 75-90
Dachaga, W. and W. T Vries (2021) ‘Land tenure security and health nexus: A conceptual framework for navigating the connections between land tenure security and health’, Land 10(3): 257
Dade-Robertson, M., A. Keren-Paz, M. Zhang and I. Kolodkin-Gal (2017) ‘Architects of nature: growing buildings with bacterial biofilms’, Microbial Biotechnology 10(5): 1157-1163
Das, A. K and R. King (2019) Surabaya: The Legacy of Participatory Upgrading of Informal Settlements, World Resources Report Case Study, World Resources Institute, Washington, DC
Davis, K. (1965) ‘The Urbanization of the Human Population’, Scientific American 213(3): 40-53
de Bree, G. J., A. van Sighem, W. Zuilhof, J. E. van Bergen, J. M. Prins, M. Heidenrijk, M. van der Valk, P. Brokx and P. Reiss (2019) ‘Is reaching 90–90–90 enough to end AIDS? Lessons from Amsterdam’, Current Opinion in HIV and AIDS 14(6): 455-463
de Coninck, H., A. Revi, M. Babiker, P. Bertoldi, M. Buckeridge, A. Cartwright, W. Dong, J. Ford, S. Fuss and J.-C. Hourcade (2018) ‘Strengthening and implementing the global response’ IPCC-The Intergovernmental Panel on Climate Change: 313-443
De Ceuvel (2022) ‘Welcome to De Ceuvel’, https:// deceuvel.nl/en, last accessed 8 May 2022
de Filippi, F., C. Coscia and G. Cocina (2021) ‘Digital participatory platforms for urban regeneration: A survey of italian case studies’, International Journal of E-Planning Research 9(3): 47-67
de Groot, J. and C. Lemanski (2020) ‘COVID-19 responses: Infrastructure inequality and privileged capacity to transform everday life in South Africa,’ Environment and Urbanization 33(1): 255-272, https://doi. org/10.1177/0956247820970094
de Lannoy, L., R. E. Rhodes, S. A. Moore, G. Faulkner, and M. S. Tremblay (2020) ‘Regional differences in access to the outdoors and outdoor play of Canadian children and youth during the COVID-19 outbreak’, Canadian Journal of Public Health, 111(6): 988–994
de Sousa Santos, B. (2015) Epistemologies of the South: Justice against Epistemicide, Routledge, London de Vries, J. (2013) European Urbanisation: 1500-1800, Routledge, London
Debacker, W. and S. Manshoven (2016) D1 Synthesis Report on the State-of-the-art Analysis: Key Bar riers and Opportunities for Materials Passport and Reversible Building Design in the Current System, Buildings as Material Banks, http: //www. bamb2020.eu/wp-content/uploads/2016/03/D1_ Synthesis-report-on-State-of-the-art_20161129_ FINAL.pdf, last accessed 6 June 2022
Deininger, N., Y. Lu, J. Griess and R. Santamaria (2019) Cities Taking the Lead on the Sustainable Development Goals: A Voluntary Local Review Handbook for cities, https://www.brookings. edu/wp-content/uploads/2019/07/VLR_Handbook_7.7.19.pdf, last accessed 6 May 2022
Delazeri, L. M. M., D. A. Da Cunha and L. R. Oliveira (2021) ‘Climate change and rural–urban migration in the Brazilian Northeast region’, GeoJournal: 1-21
Deloitte (2014) Financial Sector Development for Promoting Investment and Sustainable Growth in Dubai, Deloitte, London, https://www2.deloitte. com/content/dam/Deloitte/xe/Documents/
finance/me_DEC_%20Report_23122014.pdf, last accessed 3 May 2022
Deloitte (2020) Urban Future with a Purpose: 12 Trends Shaping the Future of Cities by 2030, Deloitte, London, https://www2.deloitte.com/ content/dam/Deloitte/global/Documents/PublicSector/deloitte-urban-future-with-a-purposestudy-set2021.pdf, last accessed 3 May 2022
Deloitte (2021) Urban Future with a Purpose, Deloitte, London, https://www2.deloitte.com/ content/dam/Deloitte/global/Documents/PublicSector/deloitte-urban-future-with-a-purposestudy-set2021.pdf, last accessed 23 April 2022
Demuth, J., H. Friederiszick and S. Reinhold (2021) ‘Reverse privatization as a reaction to the competitive environment: Evidence from solid waste collection in Germany’, Review of Industrial Organization 60:217–261
Deng, T., K. Zhang and Z. J. M. Shen (2021) ‘A systematic review of a digital twin city: A new pattern of urban governance toward smart cities’, Journal of Management Science and Engineering 6(2):125-134
Department for Transport (2019) Future of Mobility: Urban Strategy, Department for Transport, London
Designing Buildings (2020) ‘3D printing in construction’, https://www.designingbuildings.co.uk/ wiki/3D_printing_in_construction, last accessed 15 November 2021
Devereux, S. and J. Cuesta (2021) ‘Urban-sensitive social protection: How universalized social protection can reduce urban vulnerabilities post COVID-19’, Progress in Development Studies, 21(4): 340-360
Devine-Wright, P., L. Pinto de Carvalho, A. di Masso, M. Lewicka, L. Manzo, and D. R. Williams (2020) ‘“Re-placed” - Reconsidering relationships with place and lessons from a pandemic’, Journal of Environmental Psychology 72: 101514
Dias, S. M. (2016) ‘Waste pickers and cities’, Environment and Urbanization 28(2): 375-390
Diehl, E. (2015) ‘Meta Mesh wants to get mesh network Wi-Fi to neighborhoods throughout Pittsburgh’, NEXTpittsburgh, 22 June, https:// nextpittsburgh.com/business-tech-news/metamesh-wants-to-get-mesh-network-wi-fi-to-neighborhoods-throughout-pittsburgh, last accessed 30 October 2021
Diez Roux, A. (2021) ‘Urban Health Inequalities’, in G. S. Lovasi, A. Diez Roux and J. Kolker (eds) Urban Public Health: A Research Toolkit for Practice and Impact, Oxford University Press, Oxford, pp. 78-105
Dijkstra, L., A. Florczyk, S. M. C. Freire, T. Kemper, M. Melchiorri, M. Pesaresi and M. Schiavina (2021) ‘Applying the degree of urbanisation to the globe: A new harmonised definition reveals a different picture of global urbanisation’, Journal of Urban Economics 125 (September 2021): 103312
Directorate-General for Research and Innovation, European Commission (2020) Nature-based Solutions: State of The Art in EU Funded Projects, European Commission, Luxembourg, https://op.europa.eu/en/publication-detail/-/ publication/8bb07125-4518-11eb-b59f01aa75ed71a1, last accessed 19 March 2022
Dobson, S., H. Nyamweru and D. Dodman (2015) ‘Local and participatory approaches to building resilience in informal settlements in Uganda’, Environment and Urbanization 27(2): 605-620
Dodman, D., D. Archer and D. Satterthwaite (2019) ‘Responding to climate change in contexts of urban poverty and informality’, Environment and Urbanization 31(1), https://doi. org/10.1177/0956247819830004, last accessed 9 June 2022
Dodman, D., I. Adelekan, D. Brown, H. Leck, M. Manda, B. Mberu, M. Pelling, M. Rusca, D. Satterthwaite and F. Taylor (2019) ‘A spectrum of methods for a spectrum of risk: Generating evidence to understand and reduce urban risk in
sub-Saharan Africa’ Area 51(3): 586-594
Doherty, B., Y. Sidhu, T. Heron, C. West, A. Seaton, J. Gulec, P. Prado and P. F. Martinez (2020) ‘Citizen participation in food systems policy making: A case study of a citizens’ assembly’, Emerald Open Research 2(22): 22
Dominguez, H., J. Mowry, E. Perez, C. Kendrick and K. Martin (2019) ‘Privacy and information protection for a new generation of city services’, in Presentation to the 2nd ACM/EIGSCC Symposium on Smart Cities and Communities (SCC 2019), New York, USA
Domorenok, E., G. Acconcia, L. Bendlin and X. R. Campillo (2020) ‘Experiments in EU climate governance: The unfulfilled potential of the covenant of mayors’, Global Environmental Politics 20(4): 122-142
Dorries, H., R. Henry, D. Hugill, T. McCreary and J. Tomiak (2019) Settler city limits: Indigenous resurgence and colonial violence in the urban prairie west, Univ. of Manitoba Press.
Dorst, H., A. van der Jagt, R. Raven and H. Runhaar (2019) ‘Urban greening through nature-based solutions–Key characteristics of an emerging concept’, Sustainable Cities and Society 49: 101620
Du, Z., H. Zhang, Y. Ye, L. Jin and Q. Xu (2019) ‘Urban shrinkage and growth: Measurement and determinants of economic resilience in the Pearl River Delta’, Journal of Geographical Sciences 29(8): 1331-1345
Dye, C. (2008) ‘Health and urban living’, Science 319(5864): 766-769
Dyke, J., R. Watson and W. Knorr (2021) ‘Climate scientists: Concept of net zero is a dangerous trap’, The Conversation, 22 April, https://theconversation.com/climate-scientists-concept-of-net-zerois-adangerous-trap-157368, last accessed 19 March 2022
Dyson, T. (2011) ‘The role of the demographic transition in the process of urbanization’, Population and Development Review 37(Supplement): 34-54 https://doi.org/10.1111/j.17284457.2011.00377.x, last accessed 6 April 2022
Earle, L. (2016) ‘Urban crises and the new urban agenda’, Environment and Urbanization, 28(1): 77-86
Ebi, K. L., A. Capon, P. Berry, C. Broderick, R. de Dear, G. Havenith, Y. Honda, R. S. Kovats, W. Ma, A. Malik, A. and N. B. Morris (2021) ‘Hot weather and heat extremes: Health risks’, The Lancet 398(10301): 698-708
ECDC (European Centre for Disease Prevention and Control) (2021) Communicable Disease Threats Report, 23-29 May 2021, Week 21, https:// www.ecdc.europa.eu/sites/default/files/documents/Communicable-disease-threats-report29-may-2021.pdf, last accessed 24 March 2022
ECDC (2022) Communicable Disease Threats Report, 2-8 January 2022, Week 1, https://www.ecdc. europa.eu/sites/default/files/documents/Communicable-disease-threats-report-8-jan-2022.pdf, last accessed 24 March 2022
ECLAC (United Nations Economic Commission for Latin America and the Caribbean) (2021) Social Panorama of Latin America 2020, https://repositorio.cepal.org/bitstream/handle/11362/46688/8/ S2100149_en.pdf, last accessed 4 May 2022
Edelman (2019) 2019 Edelman Trust Barometer: Global Report, https://www.edelman.com/sites/g/files/ aatuss191/files/2019-02/2019_Edelman_Trust_ Barometer_Global_Report.pdf, last accessed 6 June 2022
Edenhofer, O. (2015) Climate Change 2014: Mitigation of Climate Change, Cambridge University Press, Cambridge
EDF (Environmental Defense Fund) (2021) The Breathe London Blueprint: How Cities Can Use Hyperlocal Air Pollution Monitoring to Support Their Clean Air Goals, Environmental Defense Fund, London, https://www.globalcleanair.org/ files/2021/02/EDF-Europe-BreatheLondon_Blueprint-guide.pdf, last accessed 8 November 2021
EEA (European Environment Agency) (2021a) NatureBased Solutions in Europe. Policy, Knowledge and Practice for Climate Change Adaptation and Disaster Risk Reduction, European Environment Agency, London, https://www.eea.europa.eu/ publications/nature-based-solutions-in-europe, last accessed 19 March 2022
EEA (2021b) ‘Digital technologies will deliver more efficient waste management in Europe’, https:// www.eea.europa.eu/themes/waste/waste-management/digital-technologies-will-deliver-more, last accessed 8 November 2021
Effat, H. A., M. S. Ramadan and R. H. Ramadan (2021) ‘A spatial model for assessment of urban vulnerability in the light of the UN New Urban Agenda guidelines: case study of Assiut City, Egypt,’ Modeling Earth Systems and Environment, https://doi.org/10.1007/s40808-021-01281-7
Eidelman, T. A. and S. Safransky (2020) ‘The urban commons: A keyword essay’, Urban Geography: 1-20
Elgendy, K and N. Abaza (2020) ‘Urbanization in the MENA region: A benefit or a curse?’, https:// mena.fes.de/press/e/urbanization-in-the-menaregion-a-benefit-or-a-curse, last accessed 4 May 2022
Ellen MacArthur Foundation (2015) ‘Circular economy would increase European competitiveness and deliver better societal outcomes, new study reveals’, PR Newswire, 25 June, https://www. prnewswire.com/news-releases/circular-economywould-increase-european-competitiveness-anddeliver-better-societal-outcomes-new-studyreveals-509738211.html, last accessed 3 May 2022
Ellis, P. and M. Roberts (2016) Leveraging Urbanization in South Asia: Managing Spatial Transformation for Prosperity and Livability, South Asia Development Matters, World Bank, Washington, DC
Elmqvist, T., E. Andersson, N. Frantzeskaki, T. McPhearson, P. Olsson, O. Gaffney, K. Takeuchi and C. Folke (2019) ‘Sustainability and resilience for transformation in the urban century’, Nature Sustainability 2: 267-273
Elmqvist, T., H. Setälä, S. Handel, S. Van Der Ploeg, J. Aronson, J. N. Blignaut, E. Gomez-Baggethun, D. Nowak, J. Kronenberg and R. De Groot (2015) ‘Benefits of restoring ecosystem services in urban areas’, Current Opinion in Environmental Sustainability 14: 101-108
Elmqvist, T., X. Bai, N. Frantzeskaki, C. Griffith, D. Maddox, T. McPhearson, S. Pharnell, P. RomeroLankao, D. Simon and M. Watkins (eds) (2018) Urban Planet: Knowledge Towards Sustainable Cities, Cambridge University Press, Cambridge
Elrayies, G. M. (2018) ‘Microalgae: prospects for greener future buildings’, Renewable and Sustain able Energy Reviews 81: 1175-1191
Eltarabily, S. and D. Elghezanwy (2020) ‘Postpandemic cities - the impact of COVID-19 on cities and urban design’, Architecture Research 10(3): 75-84
Eltis (2020) ‘The SUMP Concept’, https://www.eltis. org/mobility-plans/sump-concept, last accessed 25 February 2022
Ely, M., and S. Pittman (2014) Green Infrastructure: Life Support for Human Habitats, Botanic Gardens of South Australia, Australia
Emergency Governance Initiative (2020) Policy Brief #01: Emergency governance for cities and regions, https://www.lse.ac.uk/Cities/publications/ Policy-Briefs-and-Analytics-Notes/Policy-Brief01-Emergency-Governance-Initiative, last accessed 25 February 2022
Emergency Governance Initiative (2021a) Policy
Brief #03: Financing Emergencies in Cities and Regions: Ongoing Lessons from the Pandemic, https://www.lse.ac.uk/Cities/publications/PolicyBriefs-and-Analytics-Notes/Policy-Brief-03-Emergency-Governance-Initiative, last accessed 25 February 2022
Emergency Governance Initiative (2021b) Analytics
Note #04: Multilevel Governance And Covid-19
Emergency Coordination, https://www.lse.ac.uk/
Cities/publications/Policy-Briefs-and-AnalyticsNotes/Analytics-Note-04-Multilevel-Governanceand-COVID-19-Emergency-Coordination, last accessed 05 May 2022
Engie (2020) ‘How smart cities technology can help improve healthcare’, https://innovation.engie. com/en/news/news/smart-cities/smart-citiestechnology-healthcare/13698, last accessed 8 November 2021
Enssle, F. and N. Kabisch (2020) ‘Urban green spaces for the social interaction, health and well-being of older people—An integrated view of urban ecosystem services and socio-environmental justice’, Environmental Science & Policy 109: 36-44
Environment Agency (2021) Living Better with a Changing Climate; Report to Ministers Under the Climate Change Act, Environment Agency, Bristol
Erika C. P., S. Greene, C. Stacy, T. Srini, B. Meixell, S. Brown, and D. Elliott (2018) Inclusive Recovery in US Cities, Research Report, Urban Institute, Wash ington, DC, https://www.urban.org/sites/default/ files/publication/97981/inclusive_recovery_in_us_ cities_0.pdf, last accessed 4 May2022
Ertiö, T.-P. (2015) ‘Participatory apps for urban planning—space for improvement’, Planning Practice & Research 30(3): 303-321
Eruchalu, C., M. Pichardo, M. Bharadwaj, C. Rodriguez, J. Rodriguez, R. Bergmark, D. Bates and G. Ortega (2021) ‘The expanding digital divide: Digital health access inequities during the COVID-19 pandemic in New York City’, Journal of Urban Health 98: 183-186
Eskelinen, J., A. García Robles, I. Lindy, J. Marsh and A. Muente-Kunigami (2015) Citizen-Driven Innovation: A Guidebook for City Mayors and Public Administrators, International Bank for Reconstruction and Development, World Bank and European Network of Living Labs, Washington, DC
Esponda, G. M., Hartman, S., Qureshi, O., Sadler, E., Cohen, A. and R. Kakuma (2020) ‘Barriers and facilitators of mental health programmes in primary care in low-income and middle-income countries’, The Lancet Psychiatry 7(1), 78-92
Euronews (2021) ‘New robots patrolling for ‘anti-social behaviour’ causing unease in Singapore streets’, Euronews, 8 October, https://www.euronews.com/ next/2021/10/08/new-robots-patrolling-for-antisocial-behaviour-causing-unease-in-singaporestreets, last accessed 11 October 2021
European Commission (2018) A Clean Planet For All, a European Strategic Long-Term Vision for a Pros perous, Modern, Competitive and Climate Neutral Economy, European Commission, Brussels
European Commission (2020) Circular Economy Action Plan: For a Cleaner and more competitive Europe, Publications Office of the European Union, Luxembourg, https://ec.europa.eu/environment/ circular-economy/pdf/new_circular_economy_ action_plan.pdf, last accessed 19 March 2022
European Commission (2021) ‘A new step towards setting up of the European Urban Initiative supported by ERDF’, https:// ec.europa.eu/regional_policy/en/newsroom/ news/2021/05/05-10-2021-a-new-step-towardssetting-up-of-the-european-urban-initiative-supported-by-erdf, last accessed 23 May 2022
European Commission (2022) ‘Smart cities’, https:// ec.europa.eu/info/eu-regional-and-urban-development/topics/cities-and-urban-development/ city-initiatives/smart-cities_en, last accessed 6 June 2022
European Commission (undated) ‘Nature-based solutions’, https://ec.europa.eu/info/research-andinnovation/research-area/environment/naturebased-solutions_en, last accessed 6 June 2022
European Commission and LSE (2020) Demographic and health outcomes by degree of urbanisation: Perspectives from a new classification of urban areas, Publications Office of the European Union, Luxembourg, https://data.europa.eu/ doi/10.2776/37532, last accessed 6 April 2022
European Commission, Directorate-General for Environment (2017) The Precautionary Principle: Decision-Making Under Uncertainty, Future Brief in Science for Environment Policy, No. 18, Publications Office of the European Union, Luxembourg, https://data.europa.eu/ doi/10.2779/709033
European Network of Living Labs (2020) ‘2020 Activity Report: A review of the activities of the European Network of Living Labs’, https:// issuu.com/enoll/docs/activity_report_2020, last accessed 12 February 2022
European Space Agency (2022) ‘Air pollution drops in India following lockdown’, https://www.esa.int/ Applications/Observing_the_Earth/Copernicus/ Sentinel-5P/Air_pollution_drops_in_India_following_lockdown, last accessed 20 February 2022
European Union (2021) Local and Regional Finances in the Aftermath of COVID-19, Publications Office of the European Union, Luxembourg, https:// op.europa.eu/en/publication-detail/-/publication/ a97258db-d887-11eb-895a-01aa75ed71a1/ language-en/format-PDF/source-220490275, last accessed 3 May 2022
European Union, FAO, UN-Habitat, OECD, and World Bank (2021) Applying the Degree of Urbanisation — A Methodological Manual to Define Cities, Towns and Rural Areas for International Comparisons, 2021 Edition, Publications Office of the European Union, Luxembourg
Eurostat (2021) 2021 Demography of Europe, Publica tions Office of the European Union, Luxembourg, https://ec.europa.eu/eurostat/cache/digpub/ demography/img/pdf/Demograhy-InteractivePub lication-2021_en.pdf?lang=en, last accessed 23 April 2022
Evans, J., A. Karvonen, A. Luque-Ayala, C. Martin, K. McCormick, R. Raven, and Y. Voytenko Palgan (2019) ‘Smart and sustainable cities? Pipedreams, practicalities and possibilities’, Local Environment 24(7): 557-564
Evans, J., J. O’Brien and B. C. Ng (2018) ‘Towards a geography of informal transport: Mobility, infrastructure and urban sustainability from the back of a motorbike’, Transactions of the Institute of British Geographers 43(4): 674-688
Evans, J., T. Vacha, H. Kok and K. Watson (2021) ‘How Cities Learn: From Experimentation to Transformation’, Urban Planning 6(1): 171-182
Ewing, K., S. Potgieter, H. Duker, D. Pope and C. Comrie (2015) ‘Violence prevention through urban upgrading’, Architecture South Africa (71): 28-30
Eyre, N., S. J. Darby, P. Grünewald, E. McKenna and R. Ford (2018) ‘Reaching a 1.5 C target: socio-technical challenges for a rapid transition to low-carbon electricity systems’, Philosophical Transactions of the Royal Society A: Mathematical, Physical and Engineering Sciences 376(2119): 20160462
Ezeh, A., O. Oyebode, D. Satterthwaite, Y. F. Chen, R. Ndugwa, J. Sartori, B. Mberu, G. J. MelendezTorres, T. Haregu, S. I. Watson and W. Caiaffa, (2017) ‘The history, geography, and sociology of slums and the health problems of people who live in slums’, The Lancet 389(10068): 547-558
Fang, D., S. Pan, Z. Li, T. Yuan, B. Jiang, D. Gan, B. Sheng, J. Han, T. Wang, and Z. Liu (2020) ‘Largescale public venues as medical emergency sites in disasters: Lessons from COVID-19 and the use of Fangcang shelter hospitals in Wuhan, China’, BMJ Global Health 5(6): e002815
FAO (Food and Agriculture Organization) (2022) ‘The City-Region-Food-Systems approach’, https:// www.fao.org/in-action/food-for-cities-programme/ overview/crfs/en/#: ~: text=City%2Dregion%20 food%20system,communities%20can%20be%20 directly%20linked., last accessed 1 May 2022
FAO and RUAF Foundation (2015) A Vision for City Region. Food Systems; Building Sustainable and Resilient City Regions, http://www.fao.org/3/ai4789e.pdf, last accessed 7 June 2022
Farrell, K. (2017) ‘The rapid urban growth triad: A new conceptual framework for examining the urban transition in developing countries’, Sustainability 9(8): 1407 https://doi.org/10.3390/ su9081407, last accessed 6 April 2022
Farrell, K. (2018) ‘An inquiry into the nature and causes of Nigeria’s rapid urban transition’ Urban Forum 29(3): 277-298, https://doi.org/10.1007/ s12132-018-9335-6, last accessed 6 April 2022
Farrell, K. and H. Westlund (2018) ‘China’s rapid urban ascent: An examination into the components of urban growth’, Asian Geographer 35(1): 85-106 https://doi.org/10.1080/10225706.2018. 1476256, last accessed 6 April 2022
Fay, M. and C. Opal (1999) Urbanization without Growth: A Not-So-Uncommon Phenomenon, World Bank, Washington, DC, https://doi. org/10.1596/1813-9450-2412, last accessed 6 April 2022
Federal Ministry of Labour, Social Affairs and Consumer Protection (2014) ‘Social Protection in Austria, 2014’, https://www.sozialministerium.at/ en.html, last accessed 13 Dec 2021
Federation of Canadian Municipalities (2022) ‘Inter national Programs’, https://fcm.ca/en/programs/ international-programs, last accessed 8 May 2022
Federgruen, A. and S. Naha, (2021) ‘Crowding effects dominate demographic attributes in COVID-19 cases’, International Journal of Infectious Diseases 102: 509–516
Feichtinger, S. and M. Gronalt (2021) ‘The environmental impact of transport activities for online and in-store shopping: A systematic literature review to identify relevant factors for quantitative assessments’, Sustainability 13(2918)
Fell, T., T. Rydenstam, B. Geleta Buli, A. King and K. Bälter (2021) ‘Citizen science in Sweden’s stigma tized neighborhoods’, Sustainability 13: 10205
Feltenstein, A and B. K. Dalta (2020) ‘Broad-based subsidies or targeted transfers? Distributional equity vs macroeconomic costs, Journal of Economic Policy Reform: 1–18, doi.org/10.1080/ 17487870.2020.1785299
Ferdous, F. (2021) ‘Redesigning memory care in the COVID-19 era: Interdisciplinary spatial design interventions to minimize social isolation in older adults’, Journal of Aging and Social Policy 33(4–5): 555–569
Fernández, C., F. Manyà, C. Mateu and F. Sole-Mauri (2015) ‘Approximate dynamic programming for automated vacuum waste collection systems’, Environmental Modelling & Software 67: 128-137
Feroz, A. S., A. Khoja and S. Saleem (2021) ‘Equipping community health workers with digital tools for pandemic response in LMICs’, Archives of Public Health 79(1): 1- 4
Fezi, B. A. (2020) ‘Health engaged architecture in the context of COVID-19’, Journal of Green Building 15(2): 185–212
Fincher, R. and K. Iveson (2008) Planning and Diversity in the City: Redistribution, Recognition and Encounter, Macmillan International Higher Education
Firth, C. L., B. Baquero, R. Berney, K. D. Hoerster, S. J. Mooney and M. Winters (2021) ‘Not quite a block party: COVID-19 street reallocation programs in Seattle, WA and Vancouver, BC’, SSM - Population Health 14: 100769
Fisher, E. (2020) ‘Reinventing responsible innovation’, Journal of Responsible Innovation 7(1): 1-5
Fisher-Post, M. (2020) What’s New About Inequality in Australia, Canada, New Zealand, and the United States?, World Inequality Lab-Issue Brief 2020-07, World Inequality Lab, https://wid. world/document/whats-new-about-inequalityin-australia-canada-new-zealand-and-the-unitedstates-world-inequality-lab-issue-brief-2020-07/, last accessed 4 May 2022
Fleming, W. (2021) ‘Europe’s first full-sized selfdriving urban electric bus has arrived’, https:// www.weforum.org/agenda/2021/03/europe-firstautonomous-electric-buses-spain/, last accessed 8 November 2021
Florida, R. (2019) ‘How some shrinking cities are still prospering’, Bloomberg, 13 July, https://www. bloomberg.com/news/articles/2019-06-13/somecities-are-getting-smaller-richer-and-elite, last accessed 23 April 2022
Florida, R., A. Rodríguez-Pose and M. Storper (2020) Cities in a Post-COVID World, Papers in Evolutionary Economic Geography, http: //econ. geo.uu.nl/peeg/peeg2041.pdf, last accessed 23 April 2022
Florida, R., A. Rodríguez-Pose and M. Storper (2021) ‘Cities in a post-COVID world’, Urban Studies 00(0): 1-23
Florida, R., P. Adler and C. Mellander (2017) ‘The city as innovation machine’, Regional Studies 51(1)
Flyvbjerg, B., M. K. Skamris Holm and S. L. Buhl (2006) ‘Inaccuracy in traffic forecasts’, Transport Reviews 26(1): 1-24
Fonseca, E. and M. Whitney (2021) ‘5 ways new monitoring technologies can help cities combat air pollution’, World Economic Forum, https:// www.weforum.org/agenda/2021/04/air-pollutioncities-monitoring-technologies/, last accessed 8 November 2021
Font, J. and I. Blanco (2007) ‘Procedural legitimacy and political trust: The case of citizen juries in Spain’, European Journal of Political Research 46(4): 557-589
Ford, J. D., L. Cameron, J. Rubis, M. Maillet, D. Nakashima, A. C. Willox and T. Pearce (2016) ‘Including indigenous knowledge and experience in IPCC assessment reports’, Nature Climate Change 6(4): 349-353
Forero, R. and R. Sietchiping (2022) ‘Metropolises Overcoming the COVID-19 Pandemic: An urgent call for territorializing global agendas at subnational levels’, in Nunes, C. (Ed), Local Government and the COVID-19 Pandemic: A Global Perspective, Springer International Publishing
Forouzanfar, M. H., A. Afshin, L. T. Alexander, H. R. Anderson, Z. A. Bhutta, S. Biryukov, M. Brauer, R. Burnett, K. Cercy and F. J. Charlson (2016) ‘Global, regional, and national comparative risk assessment of 79 behavioural, environmental and occupational, and metabolic risks or clusters of risks, 1990–2015: A systematic analysis for the Global Burden of Disease Study 2015’, The Lancet 388(10053): 1659-1724
Forster, P. M., A. C. Maycock, C. M. McKenna and C. J. Smith (2020) ‘Latest climate models confirm need for urgent mitigation’, Nature Climate Change 10(1): 7-10
Fortes, P., A. Alvarenga, J. Seixas and S. Rodrigues (2015) ‘Long-term energy scenarios: Bridging the gap between socio-economic storylines and energy modeling’, Technological Forecasting and Social Change 91: 161-178
Fortune Business Insights (2021) IoT in Smart Cities Market Size, Share & Covid-19 Impact Analysis, Fortune Business Insights, https://www. fortunebusinessinsights.com/iot-in-smart-citiesmarket-105029, last accessed 8 November 2021
Foth, M., I. Anastasiu, M. Mann and P. Mitchell (2021) ‘From automation to autonomy: Technological sov ereignty for better data care in smart cities’, in B. T. Wang and C. M. Wang (eds) Automating Cities, Springer Nature, Singapore, pp. 319-343
Fouad, M.N., G.R. Oates, I.C. Scarinci, W.DemarkWahnefried, B.W. Hamby, L.B. Bateman, J.J. Estrada, M. Payton, M. Sims, L. Miele and E.E. Partridge (2017) ‘Advancing the science of health disparities through research on the social determinants of health’ American Journal of Preventive Medicine 52(Supp. 1): S1-S4
Fox, A., G. Ziervogel and S. Scheba (2021) ‘Strength ening community-based adaptation for urban transformation: Managing flood risk in informal set tlements in Cape Town’, Local Environment: 1-15
Fox, S. (2012) ‘Urbanization as a global historical process: Theory and evidence from Sub-Saharan Africa’, Population and Development Review 38(2): 285-310 https://doi.org/10.1111/j.17284457.2012.00493.x, last accessed 6 April 2022
Foxon, T. J. (2013) ‘Transition pathways for a UK low carbon electricity future’, Energy Policy 52: 10-24
Francese, M. and D. Prady (2018) Universal basic income: Debate and impact assessment, Working Paper, No. WP/18/273, International Monetary Fund, Washington, DC, https://www.imf.org/-/ media/Files/Publications/WP/2018/wp18273. ashx, last accessed 11 April 2022
Frank, M., L. Sun, M. Cebrian, H. Youn and I. Rahwan (2018) ‘Small cities face greater impact from automation’, Journal of The Royal Society Interface 15: 20170946
Frantzeskaki, N. and T. McPhearson (2021) ‘Mainstream nature-based solutions for urban climate resilience’, BioScience 72(2): 113-115 https:// doi.org/10.1093/biosci/biab105
Fraser, T., Bancroft, M., Small, A. and Cunningham, L. (2022) ‘Leaders or networkers? The role of mayors in renewable energy transition’, Environmental Innovation and Societal Transitions (42): 301-316, https://doi.org/10.1016/j. eist.2022.01.003
Fratesi, U. and A. Rodríguez-Pose (2016) ‘The crisis and regional employment in Europe: What role for sheltered economies?’, Cambridge Journal of Regions, Economy, and Society 9(1): 33–57
Frederick S. and Pardee Center for International Futures (2022) ‘International Futures Platform’ University of Denver, https://www.ifs.du.edu/ifs/ frm_MainMenu.aspx, last accessed 14 May 2022
Fredholm, S. (2015) ‘Negotiating a dominant heritage discourse. Sustainable urban planning in Cape Coast, Ghana’, Journal of Cultural Heritage Management and Sustainable Development 5(3): 274-289
Freedom House (2022) Freedom in the World 2022: The Global Expansion of Authoritarian Rule, https://freedomhouse.org/report/freedomworld/2022/global-expansion-authoritarian-rule, last accessed 22 March 2022
Freeth, R. and S. Drimie (2016) ‘Participatory scenario planning: From scenario “stakeholders” to scenario “owners”’, Environment: Science and Policy for Sustainable Development 58(4): 32-43
Freire, M.E. Lall, S. and D. Leipziger, (2014) Africa’s Urbanization: Challenges and Opportunities, Working Paper Number 7, The Growth Dialogue, Washington, DC
Frem, J., V. Rajadhyaksha and J. Woetzel (2018) ‘Thriving amid turbulence: Imagining the cities of the future’, https://www.mckinsey.com/industries/public-sector/our-insights/thriving-amidturbulence-imagining-the-cities-of-the-future, last accessed 6 May 2022
Frey, C. and M. Osborne (2017) ‘The future of employment: How susceptible are jobs to computerisation?’, Technological Forecasting & Social Change 114: 254-280
Friel, S., M. Akerman, T. Hancock, J. Kumaresan, M. Marmot, T. Melin and D. Vlahov (2011) ‘Addressing the social and environmental determinants of urban health equity: Evidence for action and a research agenda’, Journal of Urban Health 88(5): 860-874
Fu, X., M. Gomaa, Y. Deng, and Z-R. Peng (2016) ‘Adaptation planning for sea level rise: A study of US coastal cities’, Journal of Environmental Planning and Management 60(2): 249-265
Fuentes, S., E. Tongson and C. Gonzalez Viejo (2021) ‘Urban green infrastructure monitoring using remote sensing from integrated visible and thermal infrared cameras mounted on a moving vehicle’, Sensors 21: 295
Fuller, B. and P. Romer (2014) Urbanization as Opportunity, Policy Research Working Paper No. 6874, World Bank, Washington, DC, https://openknowledge.worldbank.org/handle/10986/18743, last accessed 6 April 2022
Fund for Peace (2021) ‘Fragile states index: Measuring fragility risk and vulnerability in 179 countries’, Fragile States Index, https://fragilestatesindex. org/, last accessed 5 May 2022
Fünfgeld, H. (2015) ‘Facilitating local climate change adaptation through transnational municipal networks’, Current Opinion in Environmental Sustainability 12: 67-73
Furceri, D., Loungani, P. and J. D. Ostry (2020) ‘How pandemics leave the poor even farther behind’, IMF Blog, 11 May, https://blogs.imf. org/2020/05/11/how-pandemics-leave-the-pooreven-farther-behind/, last accessed 23 April 2022
G20 (2018) G20 Policy Guide: Digitisation and informality: Harnessing Digital Financial Inclusion for Individuals and MESMEs in the Informal Economy, Global Partnership for Financial Inclusion, https://www.gpfi.org/sites/gpfi/files/ documents/G20_Policy_Guide_Digitisation_and_ Informality.pdf, last accessed 8 November 2021
Gabriel, K. and W. Endlicher (2011) ‘Urban and rural mortality rates during heatwaves in Berlin and Brandenburg, Germany’, Environmental Pollution 159(8-9): 2044-2050
Gabrys, J. (2014) ‘Programming Environments: Environmentality and Citizen Sensing in the Smart City’, Environment and Planning D: Society and Space 32(1): 30-48
Gagné, S. A. (2013) ‘The distinguishing features of the study of the ecology of urban landscapes’, Geography Compass 7(4): 266-286
Gago, E. J., T. Muneer, M. Knez and H. Köster (2015) ‘Natural light controls and guides in buildings. Energy saving for electrical lighting, reduction of cooling load’, Renewable and Sustainable Energy Reviews 41: 1-13
Gallent, N. and M. Madeddu (2021) ‘COVID-19 and London’s decentralising housing market – what are the planning implications?’, Planning Practice and Research 36(5): 567-577
Ganzleben, C. and A. Kazmierczak (2020) ‘Leaving no one behind–understanding environmental inequality in Europe’, Environmental Health 19: 1-7
Garrard, G. E., N. S. Williams, L. Mata, J. Thomas and S. A. Bekessy (2018) ‘Biodiversity sensitive urban design’, Conservation Letters 11(2): e12411
Gasper, R., A. Blohm and M. Ruth (2011) ‘Social and economic impacts of climate change on the urban environment’, Current Opinion in Environmental Sustainability 3(3): 150-157
GBD 2019 Mental Disorders Collaborators (2022) ‘Global, regional, and national burden of 12 mental disorders in 204 countries and territories, 1990-2019: A systematic analysis from the Global Burden of Disease Study 2019’, The Lancet Psychiatry 9(2): 137-150
Geels, F. W. (2005) Technological Transitions and System Innovations: A Co-Evolutionary and SocioTechnical Analysis, Edward Elgar Publishing, Cheltenham, UK
Geels, F. W., A. McMeekin and B. Pfluger (2020) ‘Socio-technical scenarios as a methodological tool to explore social and political feasibility in lowcarbon transitions: Bridging computer models and the multi-level perspective in UK electricity gen eration (2010–2050)’, Technological Forecasting and Social Change 151: 119258
Geels, F. W., F. Berkhout and D. P. Van Vuuren (2016) ‘Bridging analytical approaches for low-carbon transitions’, Nature Climate Change 6(6): 576-583
Gentilini, U. (2015) Entering the City: Emerging Evidence and Practices with Safety Nets in Urban Areas, World Bank Social Protection and Labor Discussion Paper, No. 1504, World Bank, Washington, DC, https://openknowledge. worldbank.org/bitstream/handle/10986/22482/ Entering0the0c00nets0in0urban0areas. pdf?sequence=1&isAllowed=y, last accessed 4 May 2022
Gentilini, U., S. Khosla, and M. Almenfi (2021) Cash in the City Emerging Lessons from Implementing Cash Transfers in Urban Africa, Discussion Paper, No. 2101, World Bank, DC, https:// openknowledge.worldbank.org/bitstream/ handle/10986/35003/Cash-in-the-City-EmergingLessons-from-Implementing-Cash-Transfers-
in-Urban-Africa.pdf?sequence=1&isAllowed=y, last accessed May 5
Gentilini, U., M. Almenfi, I. Orton, and P. Dale (2020) Social Protection and Jobs Responses to COVID19: A Real-Time Review of Country Measures, World Bank, Washington, DC
Gesesew, H., K. Berhane, E. S. Siraj, D. Siraj, M. Gebregziabher, Y. G. Gebre, S. A. Gebreslassie, F. Amdes, A.G. Tesema, A. Siraj and M. Aregawi (2021) ‘The impact of war on the health system of the Tigray region in Ethiopia: An assessment’, BMJ Global Health 6(11): e007328
Gesing, F. (2018) ‘Transnational municipal climate networks and the politics of standardisation: The contested role of climate data in the new global covenant of mayors for climate and energy’, Politics and Governance 6(3): 126-135
Ghebreyesus, T. A. and U. von der Leyen (2020) ‘A global pandemic requires a world effort to end it – none of us will be safe until everyone is safe’, https://www.who.int/news-room/commentaries/ detail/a-global-pandemic-requires-a-world-effortto-end-it-none-of-us-will-be-safe-until-everyone-issafe, last accessed 6 June 2022
Ghertner, D. A. (2010) ‘Calculating without numbers: Aesthetic governmentality in Delhi’s slums’, Economy and Society 39(2): 185-217
Ghosh, B. and S. Arora (2021) ‘Smart as (un)democratic? The making of a smart city imaginary in Kolkata, India’, EPC: Politics and Space 0(0): 1-21
Ghosh, D. and B. Das (2020) ‘A Study on the Issue of Blockchain’s Energy Consumption’, Advances in Intelligent Systems and Computing 1065: 63-75
Gill, T. (2021) ‘Ethical dilemmas are really important to potential adopters of autonomous vehicles’, Ethics and Information Technology 7: 1-17
Gilman, H. (2016) Engaging Citizens: Participatory Budgeting And The Inclusive Governance Movement Within The United States’, Occasional Paper Series, Harvard Kennedy School Ash Center for Democratic Governance and Innovation, Cambridge, Massachusetts
Girma, Y., H. Terefe, S. Pauleit and M. Kindu (2019) ‘Urban green spaces supply in rapidly urbanizing countries: The case of Sebeta Town, Ethiopia’, Remote Sensing Applications: Society and Environ ment 13: 138-149
Gitahi, G. and C. Cashin (2020) ‘Universal Health Coverage’ in R. Haring, I. Kickbusch, D. Ganten and M. Moeti (eds) Handbook of Global Health Springer, Switzerland, pp. 1611 - 1649
GIZ (2014) Urban Mobility Plans: National Approaches and Local Practices, Gesellschaft für Internationale Zusammenarbeit, New Delhi, https://sutp.org/pub lications/urban-mobility-plans-national-approachesand-local-practices/, last accessed 19 March 2022
GIZ (2017) Green Municipal Bonds in India: Potential, Barriers and Advantages, Deutsche Gesellschaft für Internationale Zusammenarbeit, New Delhi, https://www.niua.org/csc/assets/pdf/RepositoryData/UP_Green_Cover/GIZ_Green_Municipal_ Bonds_eReport.pdf, last accessed 11 May 2022
GIZ (2019) Sustainable Urban Transport: Avoid-ShiftImprove (A-S-I), Gesellschaft für Internationale Zusammenarbeit, New Delhi, https://www. transformative-mobility.org/assets/publications/ ASI_TUMI_SUTP_iNUA_No-9_April-2019.pdf, last accessed 19 March 2022
GIZ (2020a) Artificial Intelligence in Urban Development, Gesellschaft für Internationale Zusammenarbeit, Bonn and Eschborn
GIZ (2020b) Digital transformation in the informal economy: Opportunities and challenges for technical and vocational education and training in development cooperation, Gesellschaft für Internationale Zusammenarbeit, New Delhi, Bonn
GIZ and UN-Habitat (2015) ‘Unpacking Metropolitan Governance for Sustainable Development: Discussion Paper’, Eschborn: GIZ, https://thehagueacademy.com/wp-content/uploads/2016/01/ GIZ-and-UN-Habitat-2015-Unpacking-Metropolitan-Governance-for-Sustainable-Development. pdf, last accessed 25 February 2022
Glaeser, E. and D. Cutler (2021) Survival of the City: Living and Thriving in Age of Isolation, Penguin, New York
Glaeser, E. L. (2014) ‘A world of cities: The causes and consequences of urbanization in poorer countries’, Journal of the European Economic Association 12(5): 1154-1199, https://doi.org/10.1111/ jeea.12100, last accessed 6 April 2022
Glaeser, E. L. and W. Xiong (2017) Urban Productivity in the Developing World, Working Paper, No. 23279, National Bureau of Economic Research, Cambridge, United States of America
Glaeser, E. L., C. Gorback and S.J. Redding (2021) ‘JUE Insight: How much does COVID-19 increase with mobility? Evidence from New York and four other U.S. cities, Journal of Urban Economics 127: 103292, https://doi.org/10.1016/j. jue.2020.103292
Glass, L. M. and J. Newig (2019) ‘Governance for achieving the SDGs: How important are participation, policy coherence, reflexivity, adaptation and democratic institutions?’ Earth System Governance Journal 2:1-14
Glazener, A., J. Wylie, W. van Waas, and H. Khreis (2022) ‘The impact of car-free days and events on the environment and human health’, Built Environment and Health 9: 165-182
Global Commission on Adaptation (2019) Adapt Now: A Global Call for Leadership on Climate Resilience, Global Center on Adaptation and World Resources Institute, Hague, https://cdn.gca.org/ assets/2019-09/GlobalCommission_Report_ FINAL.pdf, last accessed 23 April 2022
Global Infrastructure Initiative (2021) Re-imagining Transit in a Post-COVID World, McKinsey & Company, https://www.mckinsey.com/~/media/ mckinsey/business%20functions/operations/ our%20insights/voices%20on%20infrastructure%20reimagining%20transit%20in%20a%20 post%20covid%20world/voices-gii-june-2021.pdf, last accessed 1 May 2022
Global Platform for Sustainable Cities and World Bank (2018) Urban Sustainability Framework, 1st edition, World Bank, Washington, DC GNESD (Global Network on Energy for Sustainable Development) (2014) Country Report (Brazil). Energy Poverty in Developing Countries’ Urban Poor Communities: Assessments and Recommendations. Urban and Peri-Urban Energy Access III, CENBIO/USP, Centro Clima/COPPE/UFRJ and POLICOM/POLI/UPE
Gobierno de la Ciudad de Buenos Aires (2018) ‘Buenos Aires resiliente’, http://www.buenosaires.gob.ar/jefedegobierno/secretariageneral/ buenos-aires-ciudad-resiliente, last accessed 11 May 2022
Goddard, M. A., Z. G. Davies, S. Guenat, M. J. Ferguson, J. C. Fisher, A. Akanni, T. Ahjokoski, P. M. L. Anderson, F. Angeoletto, C. Antoniou, A. J. Bates, A. Barkwith, A. Berland, C. J. Bouch, C. C. RegaBrodsky, L. B. Byrne, D. Cameron, R. Canavan, T. Chapman, S. Connop, S. Crossland, M. C. Dade, D. A. Dawson, C. Dobbs, C. T. Downs, E. C. Ellis, F. J. Escobedo, P. Gobster, N. M. Gulsrud, B. Guneralp, A. K. Hahs, J. D. Hale, C. Hassall, M. Hedblom, D. F. Hochuli, T. Inkinen, I.-C. Ioja, D. Kendal, T. Knowland, I. Kowarik, S. J. Langdale, S. B. Lerman, I. MacGregor-Fors, P. Manning, P. Massini, S. McLean, D. D. Mkwambisi, A. Ossola, G. P. Luque, L. Pérez-Urrestarazu, K. Perini, G. Perry, T. J. Pett, K. E. Plummer, R. A. Radji, U. Roll, S. G. Potts, H. Rumble, J. P. Sadler, S. de Saille, S. Sautter, C. E. Scott, A. Shwartz, T. Smith, R. P. H. Snep, C. D. Soulsbury, M. C. Stanley, T. Van de Voorde, S. J. Venn, P. H. Warren, C.-L. Washbourne, M. Whitling, N. S. G. Williams, J. Yang, K. Yeshitela, K. P. Yocom, and M. Dallimer (2021) ‘A global horizon scan of the future impacts of robotics and autonomous systems on urban ecosystems’, Nature Ecology & Evolution 5: 219-230
Godfrey, L., W. Strydom and R. Phukubye (2016) Integrating the Informal Sector into the South African Waste and Recycling Economy in the Context of
Extended Producer Responsibility, Briefing Note, Council of Scientific and Industrial Research, South Africa, https://www.wasteroadmap. co.za/download/informal_sector_2016.pdf, last accessed 27 February 2022
Goodess, C., S. Berk, S. B. Ratna, O. Brousse, M. Davies, C. Heaviside, G. Moore and H. Pineo (2021) ‘Climate change projections for sustainable and healthy cities’, Buildings & Cities 2(1): 812
Gordon, D. J. and C. A. Johnson (2017) ‘The orchestration of global urban climate governance: Conducting power in the post-Paris climate regime’, Environmental Politics 26(4): 694-714
Gorelick, J. (2018) ‘Supporting the Future of Municipal Bonds in Sub-Saharan Africa: The Centrality of Enabling Environments and Regulatory Frameworks’, Environment and Urbanization 30(1):103-122
Gornitzka, C. P., R. Piper and U. Modéer (2020) ‘Global solidarity & effective cooperation in the face of COVID-19’, IPS-Inter Press Service, 9 June, https://www.ipsnews.net/2020/06/globalsolidarity-effective-cooperation-face-covid-19, last accessed 19 March 2022
Göteborgs Stad (2020) ‘Granskningsförslag ny översiktsplan’, Göteborgs Stad, https://oversiktsplan. goteborg.se, last accessed, 11 May 2022
Gould, K. and T. Lewis (2016) Green Gentrification: Urban Sustainability and the Struggle for Environ mental Justice, Routledge, London
Gourinchas, Pierre-Olivier (2022) ‘War dims global economic outlook as inflation accelerates’, IMF Blog, 19 April, https://blogs.imf.org/2022/04/19/ war-dims-global-economic-outlook-as-inflationaccelerates, last accessed 6 May 2022
Government of People’s Republic of Bangladesh (2020) Urban Social Protection Strategy and Action Plan in Bangladesh, Social Security Policy Support (SSPS) Programme, Cabinet Division and General Economics Division, Dhaka
Government of Singapore (2021) ‘Skills future Singapore’, Skillfuture Singapore, https://www.skillsfuture.gov.sg/, last accessed 25 October 2021
Government of the Democratic Social Republic of Sri Lanka (2018) State of Sri Lankan Cities 2018 Report, UN-Habitat, Colombo Grace, D. and Jones (2011) Zoonoses: Wildlife Domestic Animal Interactions, Report to DFID, International Livestock Research Institute and Royal Veterinary College, Nairobi and London
Gradín, C, F. Tarp, and M. Leibbrandt (2021) ‘Global inequality may be falling, but the gap between haves and have-nots is growing’, The Conversation, 2 September, https://theconversation.com/ global-inequality-may-be-falling-but-the-gapbetween-haves-and-have-nots-is-growing-159825, last accessed 4 May 2022
Graff, A. (2021) ‘San Francisco makes four Slow Streets permanent’, San Francisco Gate, 4 August, https:// www.sfgate.com/bayarea/article/Slow-Streets-SanFrancisco-permanent-Sanchez-16362886.php#: ~: text=The%20San%20Francisco%20Munic ipal%20Transportation,will%20permanentlyl%20 remain%20pedestrian%20friendly, last accessed 20 April 2022
Gran, C., J. A. and S. L. Ramos De Robles (2019) ‘Climate change and flood risk: vulnerability assessment in an urban poor community in Mexico’, Environment and Urbanization 31(1): 75-92
Grasham, C. F., M. Korzenevica and K. J. Charles (2019) ‘On considering climate resilience in urban water security: A review of the vulnerability of the urban poor in sub Saharan Africa’, Wiley Interdisci plinary Reviews: Water 6(3): e1344
Graute, U. (2016) ‘Local authorities acting globally for sustainable development’, Regional Studies 50(11): 1931-1942
Greater London Authority (2017) ‘London Atmospheric Emissions Inventory (LAEI)’, London Datastore, April, https://data.london.gov.uk/dataset/ london-atmospheric-emissions-inventory-2013, last accessed 11 May 2022
Greater London Authority (2021) ‘The mayor’s ultralow emissions zone for London’, https://www. london.gov.uk/what-we-do/environment/pollution-and-air-quality/mayors-ultra-low-emissionzone-london, last accessed 11 May 2022
Griffiths, F., J. A. Watkins, C. Huxley, B. Harris, J. Cave, S. Pemba, B. Chipwaza, R. Lilford, M. Ajisola, T. N. Arvanitis and P. Bakibinga (2020) ‘Mobile consulting (mConsulting) and its potential for providing access to quality healthcare for populations living in low-resource settings of low-and middle-income countries’, Digital Health 6: 2055207620919594
Gronkiewicz-Waltz, H., Larsson, A., Lisa Boni, A.L., Krogh Andersen, K., Ferrao, P., Forest, E., Jordan, R., Lenz, B., Lumbreras, J., Nicolaides, C., Reiter, J., Russ, M., Sulling, A., Termont, D., Vassilakou, M. (2020) Proposed Mission: 100 ClimateNeutral Cities by 2030 – by and for the Citizens, Report of the Mission Board for Climate-Neutral and Smart Cities, Directorate-General for Research and Innovation Clean Planet, European Commission, Brussels and Luxembourg, https:// op.europa.eu/en/publication-detail/-/publication/bc7e46c2-fed6-11ea-b44f-01aa75ed71a1/ language-en/format-PDF/source-160480388, last accessed 19 March 2022
Grover, A., S. V. Lall and W. F. Maloney (2022) Place, Productivity, and Prosperity Revisiting Spatially Targeted Policies for Regional Development, World Bank, Washington, DC
Gruebner, O., M. A. Rapp, M. Adli, U. Kluge, S. Galea and A. Heinz (2017) ‘Cities and mental health’ Deutsches Ärzteblatt International 114(8): 121–127
Gruehn, D. (2017) ‘Regional planning and projects in the Ruhr region, Germany’, in M. Yokohari, A. Murakami, Y. Hara and K. Tsuchiya (eds) Sustainable Landscape Planning in Selected Urban Regions, Science for Sustainable Societies, Springer, Japan, pp. 215–225
Grunwald, A. (2011) ‘Responsible innovation: Bringing together technology assessment, applied ethics, and STS research’, Enterprise and Work Innovation Studies 7: 9-31
Guglielmin, M., C. Muntaner, P. O’Campo and K. Shankardass (2018) ‘A scoping review of the implementation of health in all policies at the local level’, Health Policy 122(3): 284-292
Guillermoprieto, A. (2019) ‘This city bans cars every Sunday—and people love it’, National Geographic, 27 March, https://www.nationalgeographic.com/environment/article/bogotacolombia-ciclovia-bans-cars-on-roads-each-sunday, last accessed 22 May 2022
Guo, H. D. and C. Chen (2021) ‘Forecasting revenue impacts from COVID-19: The case of Florida municipalities’, State and Local Government Review 53(1): 78-88
Gupta, A. K., S. Wajih and N. Mani (2017) Vulnerabili ties of Urban Poor Children and Urban/Peri-urban Ecosystem Based Resilience, Thematic Paper, Gorakhpur Environmental Action Group and UNICEF, India
Gutberlet, J., J. Kain, B. Nyakinya, M. Oloko, P. Zapata and M. J. Zapata Campos (2017) ‘Bridging weak links of solid waste management in informal settlements’, The Journal of Environment & Development 26(1): 106-131
Guterres, A. and P. Spiegel (2012) ‘The state of the world’s refugees: Adapting health responses to urban environments’, JAMA 308(7): 673-674
Guzman, L. A. and J. P. Bocarejo (2017) ‘Urban form and spatial urban equity in Bogota, Colombia’, Transportation Research Procedia 25: 4491-4506
Ha, B. T. T., L. Ngoc Quang, P. Quoc Thanh, D. M. Duc, T. Mirzoev and T. M. A. Bui (2021) ‘Community engagement in the prevention and control of COVID-19: Insights from Vietnam’, PloS one 16(9)
Haaland, C. and C. K. van Den Bosch (2015) ‘Challenges and strategies for urban green-space planning in cities undergoing densification: A
review’, Urban Forestry & Urban Greening 14(4): 760-771
Haandrikman, K., R. Costa, B. Malmberg, A. F. Rogne and B. Sleutjes (2021) ‘Socioeconomic segregation in European cities. A comparative study of Brussels, Copenhagen, Amsterdam, Oslo and Stockholm’, Urban Geography, https://doi.org/1 0.1080/02723638.2021.1959778, last accessed 7 June 2022
Haase, D. (2021) ‘Integrating ecosystem services, green infrastructure and nature-based solutions – new perspectives in sustainable land management: Combining knowledge about urban nature for action’, in T. Weith, T. Barkmann, N. Gaasch, S. Rogga, C. Straub, and J. Zscheischler, J. (eds) Sustainable Land Management in a European Context. Human-Environment Interactions, vol 8, pp. 305-318, Springer, Switzerland, https:// doi.org/10.1007/978-3-030-50841-8_16, last accessed 19 March 2022
Habert, G., M. Röck, K. Steininger, A. Lupísek, H. Birgisdottir, H. Desing, C. Chandrakumar, F. Pittau, A. Passer, R. Rovers, K. Slavkovic, A. Hollberg, E. Hoxha, T. Jusselme, E. Nault, K. Allacker and T. Lützkendorf, (2020) ‘Carbon budgets for buildings: Harmonising temporal, spatial and sectoral dimen sions’, Buildings and Cities 1(Suppl 1): 429-452
HACT (2020) Do the Smart Thing: The Future of the Social Smart Home, White Paper Series, Housing Associations’ Charitable Trust, London
Hadjiosif, S. (2020) ‘How to design a sustainable city’, Medium, 7 December, https://medium.com/ climate-conscious/how-to-design-a-sustainablecity-367b481d2039, last accessed 6 May 2022
Hajdarowicz, I. (2018) ‘Does participation empower? The example of women involved in participatory budgeting in Medellin’, Journal of Urban Affairs 44(1): 22-37
Hall, T. and S. Vidén (2005) ‘The million homes programme: A review of the great Swedish planning project’, Planning Perspectives 20(3): 301–328
Hambleton, R. (2015) ‘Power, place and the New Civic Leadership’, Local Economy 30(2):167-172
Hamidi, S., S. Sabouri and R. Ewing (2020) ‘Does density aggravate the COVID-19 pandemic?’, Journal of the American Planning Association 86(4): 495–509
Hao, H., D. Hui and D. Lau (2020) ‘Material advancement in technological development for the 5G wireless communications’, Nanotechnology Reviews 9(1): 683-699
Harada, Y., T. H. Whitlow, P. H. Templer, R. W. Howarth, M. T. Walter, N. L. Bassuk and J. Russell-Anelli (2018) ‘Nitrogen biogeochemistry of an urban rooftop farm’, Frontiers in Ecology and Evolution 6: 153
Harman, B. P., B. M. Taylor and M. B. Lane (2015) ‘Urban partnerships and climate adaptation: Challenges and opportunities’, Current Opinion in Environmental Sustainability 12: 74-79
Harris, E. (2018) ‘Remarks at the high-level conversa tion on economic resilience and sustaining peace: Learning from lessons of countries’, United Nations Department of Economic and Social Affairs’, https://www.un.org/en/desa/remarks-highlevel-conversation-economic-resilience-and-sus taining-peace-learning, last accessed 28 April 2022
Harris, S. (2020) ‘Post lockdown London: Parking spaces and traffic lanes to vanish to encourage walking and cycling’, ITV News, 6 May, https:// www.itv.com/news/london/2020-05-06/postlockdown-london-parking-spaces-and-traffic-lanesto-vanish-to-encourage-walking-and-cycling, last accessed 6 June 2022
Harrison, J. and H. Gu (2021) ‘Planning megaregional futures: Spatial imaginaries and megaregion formation in China’, Regional Studies 55:77-89 Harrouk, C. (2020) ‘Perkins and Will creates guideline for a safe return to the office during COVID19’, ArchDaily, 20 May, https://www.archdaily. com/939928/perkins-and-will-creates-guidelinefor-a-safe-return-to-the-office-during-covid-19, last accessed 20 April 2022
Hartmann, H. and P. Thiery (2022) Global Findings BTI 2022, Gütersloh: Bertelsmann Stiftung Harvey, C. A., M. R. Martínez-Rodríguez, J. M. Cárdenas, J. Avelino, B. Rapidel, R. Vignola, C. I. Donatti and S. Vilchez-Mendoza (2017) ‘The use of ccosystem-based adaptation practices by smallholder farmers in Central America’, Agriculture, Ecosystems & Environment 246: 279-290
Hassan, A. M. and H. Lee (2015) ‘The paradox of the sustainable city: Definitions and examples’, Environment, development and sustainability 17(6): 1267-1285
Hausfather, Z. (2021) ‘Explainer: Will global warming “stop” as soon as net-zero emissions are reached?’, CarbonBrief, 29 April, https://www. carbonbrief.org/explainer-will-global-warmingstop-as-soon-as-net-zero-emissions-are-reached, last accessed 19 March 2022
Hausknost, D., W. Haas, S. Hielscher, M. Schäfer, M. Leitner, I. Kunze and S. Mandl (2018) ‘Investigating patterns of local climate governance: How low-carbon municipalities and intentional communities intervene in social practices’, Environmental Policy and Governance 28(6): 371-382
He, C., Z. Liu, J. Wu, X. Pan, Z. Fang, J. Li and B. A. Bryan (2021) ‘Future global urban water scarcity and potential solutions’, Nature Communications 12 He, G., I. Boas, A. P. J. Mol and Y. Lu (2017) ‘E-participation for environmental sustainability in transitional urban China’, Sustainability Science 12(2): 187-202
Healey, P. (1997) Collaborative Planning: Shaping Places in Fragmented Societies, Macmillan International Higher Education, London Hedberg, A., S. Šipka and J. Bjerkem (2019) Creating a Digital Roadmap for a Circular Economy, European Policy Centre, Belgium
Heilakka, R. (2020) ‘How upskilling could help cities rebuild after Coronavirus’, https://www. weforum.org/agenda/2020/11/how-upskillingcould-help-cities-rebuild-after-coronavirus, last accessed 8 November 2021
Heineke, K., A. Ménard, F. Södergren and M. Wrulich. (2019) ‘Development in the mobility technology ecosystem – how can 5G help?’ McKinsey & Company, https://www.mckinsey.com/industries/ automotive-and-assembly/our-insights/development-in-the-mobility-technology-ecosystem-howcan-5g-help, last accessed 19 March 2022
Hemström, K., D. Simon, H. Palmer, B. Perry and M. Polk (2021) Transdisciplinary Knowledge Co-production: A Guide for Sustainable Cities, Practical Action Publishing, United Kingdom
Henderson, J. V. (2000) The Effects of Urban Concentration on Economic Growth, Working Paper 7503, National Bureau of Economic Research, Cambridge, https://doi.org/10.3386/w7503, last accessed 6 April 2022
Henderson, J. V. and S. Kriticos (2018) ‘The development of the African system of cities’, Annual Review of Economics 10: 287-314
Henderson, V. and D. Nigmatulina (2016) ‘The fabric of African cities: How to think about density and land use’, Unpublished paper, London School of Economics
Henrique, K. P. and P. Tschakert (2020) ‘Pathways to urban transformation: From dispossession to climate justice’, Progress in Human Geography 45(5): 1169-1191
Henson, R. M., A. Ortigoza, K. Martinez-Folgar, F. Baeza, W. Caiaffa, A. V. Vergara, A. V. D. Roux and G. Lovasi (2020) ‘Evaluating the health effects of place-based slum upgrading physical environment interventions: A systematic review (2012–2018)’, Social Science & Medicine 261:113102
Hepburn, C., B. O’Callaghan, N. Stern, J. Stiglitz, and D. Zenghelis (2020) ‘Will COVID-19 fiscal recovery packages accelerate or retard progress on climate change?’, Oxford Review of Economic Policy 36(Supp 1): S359–S381
Herbert, B. (2021) ‘Satisfying lodging or illegal hotels? Analyzing the legal issues of AirBnB’, University
of Cincinnati Law Review, 7 July, https://uclawreview.org/2021/07/07/satisfying-lodging-or-illegalhotels-analyzing-the-legal-issues-of-airbnb/, last accessed 8 November 2021
Higham, J., S. A. Cohen, C. T. Cavaliere, A. Reis and W. Finkler (2016) ‘Climate change, tourist air travel and radical emissions reduction’, Journal of Cleaner Production 111: 336-347
Hillgren, P. A. (2013) ‘Participatory design for social and public innovation: Living Labs as spaces for agonistic experiments and friendly hacking’, in Manzini, E., Staszowksi, E. (Eds) Public and collaborative: Exploring the intersection of design, social innovation and public policy, pp. 75-88
Hilpert, Y. M. (2021) ‘Glowing cities and the future of manufacturing in the US and Europe: How digitalization will impact metropolitan areas depending on sectoral dominances and regional skill distribution’, European Planning Studies 29(9): 1672-1689
Hinkle, H., M. McGinley, T. Hargett and S. Dascher (2019) Carbon Farming with Timber Bamboo: A Superior Sequestration System Compared to Wood, BamCore, United States, https://bamcore. com/wp-content/uploads/2019/01/CarbonFarming-with-Timber-Bamboo.pdf, last accessed 19 March 2022
Hlahla, S. and T. R. Hill (2018) ‘Responses to climate variability in urban poor communities in Pietermaritzburg, KwaZulu-Natal, South Africa’, Sage Open 8(3): 2158244018800914
Hodder, A. (2020) ‘New technology, work and employment in the era of COVID-19: Reflecting on legacies of research’, New Technology, Work and Employment 35(3): 262-275
Hoffmann, S., U. Feldmann, P. M. Bach, C. Binz, M. Farrelly, N. Frantzeskaki, H. Hiessl, J. Inauen, T. A. Larsen, J. Lienert, J. Londong, C. Lüthi, M. Maurer, C. Mitchell, E. Morgenroth, K. L. Nelson, L. Scholten, B. Truffer and K. M. Udert (2020) ‘A research agenda for the future of urban water management: Exploring the potential of nongrid, small-grid, and hybrid solutions’, Environmental Science & Technology 54(9): 5312-5322
Hofman, P. S., B. E. Elzen and F. W. Geels (2004) ‘Sociotechnical scenarios as a new policy tool to explore system innovations: Co-evolution of technology and society in the Netherland’s electricity domain’, Innovation 6(2): 344-360
Hogan, V. K., E. M. de Araujo, K. L. Caldwell, S. N. Gonzalez-Nahm and K. Z. Black (2018) ‘“We black women have to kill a lion everyday”: An intersectional analysis of racism and social determinants of health in Brazil’, Social Science & Medicine 199: 96-105
Hollands, R. G. (2015) ‘Critical interventions into the corporate smart city’, Cambridge Journal of Regions, Economy and Society 8(1):61-77
Honey-Rosés, J., I. Anguelovski, V. K. Chireh, C. Daher, C. Konijnendijk van den Bosch, J. S. Litt, V. Mawani, M. K. McCall, A. Orellana, E. Oscilowicz, U. Sánchez, M. Senbel, X. Tan, E.Villagomez, O. Zapata and M. J. Nieuwenhuijsen (2020) ‘The impact of COVID-19 on public space: An early review of the emerging questions – design, perceptions and inequities’, Cities and Health, https://doi.org/10.1080/23748834.2020. 1780074, last accessed 7 June 2022
Hoogeveen, J. G. and G. Lopez-Acevedo (2021) Distributional Impacts of COVID-19 in the Middle East and North Africa Region, MENA Development Report, World Bank, Washington, DC, https:// doi: 10.1596/978-1-4648-1776-2, last accessed 3 May 2022
Hooli, L. J. (2016) ‘Resilience of the poorest: Coping strategies and indigenous knowledge of living with the floods in Northern Namibia’, Regional Environmental Change 16(3): 695-707
Hörcher, D., R. Singh, and D. J. Graham, (2021) ‘Social distancing in public transport: Mobilising new technologies for demand management under the Covid-19 crisis’, Transportation 49: 735–764
Hori, S. (2021) ‘How blockchain can empower smart cities - and why interoperability will be crucial’, World Economic Forum, https://www.weforum. org/agenda/2021/04/how-blockchain-canempower-smart-cities-gtgs21/, last accessed 8 November 2021
Horn, P. (2021) ‘Enabling participatory planning to be scaled in exclusionary urban political environments: Lessons from the Mukuru Special Planning Area in Nairobi’, Environment and Urbanization 33(2): 519-538
Horn, P., J. Kimani, J. Makau and P. Njoroge (2020) ‘Scaling participation in informal settlement upgrading: A documentation of community mobilisation and consultation processes in the Mukuru Special Planning Area’, Nairobi, Kenya, Working Paper, Global Development Institute, University of Manchester Howard, S. D., K. L. Lee, A. G. Nathan, H. C. Wenger, M. H. Chin and S. C. Cook (2019) ‘Healthcare experiences of transgender people of color’, General Internal Medicine 34(10): 2068–2074
Hsu, A., J. Brandt, O. Widerberg, S. Chan and A. Weinfurter (2020) ‘Exploring links between national climate strategies and non-state and subnational climate action in nationally determined contributions (NDCs)’, Climate Policy 20(4): 443-457
Hsu, A., N. Höhne, T. Kuramochi, M. Roelfsema, A. Weinfurter, Y. Xie, K. Lütkehermöller, S. Chan, J. Corfee-Morlot, P. Drost, P. Faria, A. Gardiner, D. J. Gordon, T. Hale, N. E. Hultman, J. Moorhead, S. Reuvers, J. Setzer, N. Singh, C. Weber and O. Widerberg (2019) ‘A research roadmap for quanti fying non-state and subnational climate mitigation action’, Nature Climate Change 9(1): 11-17 Hu, Y., W. Barbour, S. Samaranayake and D. Work (2020) ‘The rebound: How Covid-19 could lead to worse traffic (V2)’, https://lab-work.github.io/ therebound/, last accessed 29 January 2022 Hughes, B. B., T. Hanna, K. McNeil, D. K Bohl and J. D. Moyer (2021) Pursuing the Sustainable Development Goals in a World Reshaped by COVID-19, Frederick S. Pardee Center for International Futures and United Nations Development Programme, Denver and New York Hughes, C. (2018) Fair Shot: Rethinking Inequality and How We Earn, St. Martin’s Press, New York Hughes, N. and N. Strachan (2010) ‘Methodological review of UK and international low carbon scenarios’, Energy Policy 38(10): 6056-6065
Hulme, M. (2011) ‘Meet the humanities’, Nature Climate Change 1(4): 177-179
Huning, S. (2020) ‘From feminist critique to gender mainstreaming—and back? The case of German urban planning’, Gender, Place & Culture 27(7): 944-964
Huxley, R., A. Owen and P. Chatterton (2019) ‘The role of regime-level processes in closing the gap between sustainable city visions and action’, Environmental Innovation and Societal Transitions 33: 115-126
ICLEI (2018) Multilevel Climate Action: The Path to 1.5 degrees, Local Governments for Sustainability, Germany
ICLEI, Cities Network, Cities Alliance and GIZ (2018) Guide on Connecting Green Recovery and Resilience in Cities, Resilient Cities Action Package 2021(ReCAP21), Local Governments for Sustainability, Germany, https://www.citiesalliance.org/ sites/default/files/2022-02/ReCAP21_Guide.pdf, last accessed 3 May 2022
ICRC (International Committee of the Red Cross) (2017) ‘War in cities: What is at stake?’, https:// www.icrc.org/en/document/war-cities-whatstake-0, last accessed 3 May 2022
IEA (International Energy Agency)(2014) Net Zero Energy Solar Buildings, International Energy Agency, Paris
IEA (2021a) World Energy Outlook 2021, World Energy Outlook, International Energy Agency, Paris
IEA (2021b) Net Zero by 2050: A Roadmap for the Global Energy Sector, International Energy
Agency, Paris, https://www.iea.org/reports/ net-zero-by-2050, last accessed 19 March 2022
IEA (2021c) Greenhouse Gas Emissions from Energy: Overview, International Energy Agency, Paris https://www.iea.org/reports/greenhouse-gasemissions-from-energy-overview, last accessed 19 March 2022
IEA (2021d) Tracking Transport 2021, International Energy Agency, Paris, https://www.iea.org/ reports/tracking-transport-2021, last accessed 19 March 2022
IEA (2021e) Global Energy Review 2021: Assessing the Effects of Economic Recoveries on Global Energy Demand and CO2 Emissions in, Global Energy Review, International Energy Agency, Paris
IEA (2021f) World Energy Outlook 2021: Executive Summary, World Energy Outlook, International Energy Agency, Paris
IEA (2022) A 10-Point Plan to Cut Oil Use, International Energy Agency, France
IIED (International Institute for Environment and Development)(2016) Informality and Inclusive Green Growth: Evidence from ‘The Biggest Private Sector’ Event, International Institute for Environ ment and Development, London, https://pubs.iied. org/sites/default/files/pdfs/migrate/17365IIED.pdf, last accessed 13 May 2022
IISD (International Institute for Sustainable Development)(1996) ‘Summary report, 3–14 June 1996 Habitat II’, https://enb.iisd.org/events/habitat-ii/ summary-report-3-14-june-1996, last accessed 13 February 2022
Ijjasz-Vasquez, E. and M. Mukim, (2021) ‘Doubling down on city competitiveness for COVID-19 recovery’, https://www.brookings.edu/blog/ future-development/2021/03/16/doubling-downon-city-competitiveness-for-covid-19-recovery/, last accessed 3 May 2022
ILO (International Labour Organization) (2015) ‘R204 - transition from the informal to the formal economy recommendation, 2015 (No. 204)’ https://www.ilo.org/dyn/normlex/en/f?p =NORMLEXPUB:12100:0::NO::P12100_ILO_ CODE:R204, last accessed 24 May 2022
ILO (2018) Women and Men in the Informal Economy: A Statistical Picture (Third Edition), International Labour Organization, Geneva
ILO (2019) Work for a Brighter Future: Global Commission on the Future of Work, International Labour Organization, Geneva
ILO (2020a) Crisis and the Informal Economy
Immediate Responses and Policy Challenges, https://www.ilo.org/wcmsp5/groups/public/--ed_protect/---protrav/---travail/documents/ briefingnote/wcms_743623.pdf, last accessed 3 May 2022
ILO (2020b) Impact of Lockdown Measures on the Informal Economy: A Summary, https://www. ilo.org/wcmsp5/groups/public/---ed_protect/--protrav/---travail/documents/briefingnote/ wcms_743534.pdf, last accessed 5 May 2022
ILO (2021a) World Social Protection Report 2020-22: Social Protection at the Crossroads - in Pursuit of a Better Future, International Labour Organization, Geneva
ILO (2021b) ILO Monitor: COVID-19 and the World of Work (Seventh Edition), https://www.ilo.org/ wcmsp5/groups/public/---dgreports/---dcomm/ documents/briefingnote/wcms_767028.pdf, last accessed 5 May 2022
ILO (2022) World Employment and Social Outlook: Trends 22, International Labour Office, Geneva
IMD (2021) Smart City Index, Institute for Management Development, Switzerland
IMF (International Monetary Fund) (2017) ‘Chart of the week: The potential for growth and Africa’s informal economy’, IMF Blog, 8 August, https:// blogs.imf.org/2017/08/08/chart-of-the-weekthe-potential-for-growth-and-africas-informaleconomy, last accessed 2 March 2022
IMF (2021) World Economic Outlook: Recovery
During a Pandemic – Health Concerns, Supply
Disruptions, Price Pressures, International Monetary Fund, Washington, DC
Imrie, R. (2000) ‘Disability and discourses of mobility and movement’, Environment and Planning A, 32(9): 1641-1656
Independent Panel for Pandemic Preparedness and Response (2021) COVID-19: Make it the Last Pandemic, https://theindependentpanel.org/ mainreport/, last accessed 24 March 2022
Infiniti Research Limited (2021) Global Blockchain Technology Market 2021-2025, Infiniti Research Limited, India, https://www.reportlinker.com/ p04793539/Global-Blockchain-TechnologyMarket.html?utm_source=GNW, last accessed 8 November 2021
Institute for Health Metrics and Evaluation (2022) ‘Data Visualization’, Healthdata, https://www. healthdata.org/results/data-visualizations, last accessed 2 May 2022
International Bank for Reconstruction and Development and The World Bank (2019) Innovative Finance Solutions For Climate-Smart Infrastructure New Perspectives On Results-Based Blended Finance For Cities, Washington, https://www. gprba.org/sites/gpoba/files/publication/downloads/2019-07/new-perspectives-results-basedblended-finance-cities-innovative-finance.pdf, last accessed 27 May 2022
IOM (2019) World Migration Report 2020, International Organization for Migration, Geneva, https://publications.iom.int/system/files/pdf/ wmr_2020.pdf, last accessed 25 April 2022
IPBES (2019) Global Assessment Report on Biodiversity and Ecosystem Services of the Intergovernmental Science-Policy Platform on Biodiversity and Ecosystem Services, Intergovernmental SciencePolicy Platform on Biodiversity and Ecosystem Services, Germany, https://doi.org/10.5281/ zenodo.3831673, last accessed 19 March 2022
IPCC (Intergovernmental Panel on Climate Change) (2014a) Climate Change 2014: Mitigation of Climate Change. Contribution of Working Group III to the Fifth Assessment Report of the Intergovernmental Panel on Climate Change, Cambridge University Press, Cambridge
IPCC (2014b) Summary for Policymakers in Climate Change 2014 Mitigation of Climate Change, Cambridge University Press, Cambridge
IPCC (2018) Global Warming of 1.5°C, IPCC Special Report, Intergovenmental Panel on Climate Change, Geneva, https://www.ipcc.ch/site/assets/ uploads/sites/2/2019/06/SR15_Full_Report_ High_Res.pdf, last accessed 19 March 2022
IPCC (2019) Summary for Policymakers in Special Report on the Ocean and Cryosphere in a Changing Climate, Cambridge University Press, Cambridge, https://www.ipcc.ch/site/assets/ uploads/sites/3/2022/03/01_SROCC_SPM_ FINAL.pdf, last accessed 6 May 2022
IPCC (2021) Climate Change 2021: The Physical Science Basis, Contribution of Working Group I to the Sixth Assessment Report of the Intergovernmental Panel on Climate Change, Cambridge University Press, Cambridge
IPCC (2022a) Climate Change 2022: Mitigation of Climate Change. Working Group III Contribution to the Sixth Assessment Report of the Intergovernmental Panel on Climate Change, Cambridge University Press, Cambridge https://www.ipcc. ch/report/ar6/wg2/, last accesssed 13 May 2022
IPCC (2022b) IPCC Special Report on the Ocean and Cryosphere in a Changing Climate, Cambridge University Press, Cambridge (UK) and New York
Irazábal, C. and C. Huerta (2016) ‘Intersectionality and planning at the margins: LGBTQ youth of color in New York’, Gender, Place & Culture 23(5): 714-732
Irazábal, C. and P. Jirón (2020) ‘Latin American smart cities: Between worlding infatuation and crawling provincialising’, Urban Studies 58(3): 507-534
IRENA (International Renewable Energy Agency) (2020) Rise of Renewables in Cities: Energy
Solutions for the Urban Future, International Renewable Energy Agency, Abu Dhabi
IRP (International Resource Panel) (2017) Green Technology Choices: The Environmental and Resource Implications of Low-Carbon Technologies, International Resource Panel and United Nations Environment Programme, Nairobi
IRRC (International Review of the Red Cross) (2022) ‘The impact of attacks on urban services II: Reverberating effects of damage to water and wastewater systems on infectious disease’, January 2022, https://international-review.icrc. org/articles/impact-of-attacks-on-urban-servicesii-damage-to-wastewater-systems-infectiousdisease-915#footnote43_h8syz25, last accessed 4 May 2022
Işıldar, A., E.D. van Hullebusch, M. Lenz, G. Du Laing, A. Marra, A. Cesaro, S. Panda, A. Akcil, M.A. Kucuker and K. Kuchta (2019) ‘Biotechnological strategies for the recovery of valuable and critical raw materials from waste electrical and electronic equipment (WEEE) – a review’, Journal of Hazardous Materials 362: 467-481
Ismail, W. A. W. and I. Said (2015) ‘Integrating the community in urban design and planning of public spaces: a review in Malaysian cities’, Procedia-Social and Behavioral Sciences 168: 357-364
ITU (International Telecommunication Union) (2018) Measuring the Information Society Report (Volume 1), International Telecommunication Union Publications, Geneva
Jacobson, M. Z. (2020) 100% Clean, Renewable Energy and Storage for Everything, First Edition, Cambridge University Press, England
Jaimes Torres, M., M. Aguilera Portillo, T. CuerdoVilches, I. Oteiza, and M. Á. Navas-Martín (2021) ‘Habitability, resilience, and satisfaction in Mexican homes to COVID-19 pandemic’, International Journal of Environmental Research and Public Health 18(13): 6993
Jakimowicz, K. (2021) ‘How local authorities and communities are working on better connectivity to bridge the digital divide’, Data-Smart City Solutions, 21 June, https://datasmart.ash.harvard. edu/news/article/how-local-authorities-and-communities-are-working-better-connectivity-bridgedigital, last accessed 27 September 2021
Janke, T. and M. Sentina (2018) Indigenous knowledge: Issues for protection and management, IP Australia, Commonwealth of Australia
Jarzebski, M. P., T. Elmqvist, A. Gasparatos, K. Fukushi, S. Eckersten, D. Haase, J. Goodness, S. Khoshkar, O. Saito, K. Takeuchi, T. Theorell, N. Dong, F. Kasuga, R. Watanabe, G. B. Sioen, M. Yokohari and J. Pu (2021)‘Ageing and population shrinking: Implications for sustainability in the urban century’, npj Urban Sustainability 1(1): 1-11, https://doi.org/10.1038/s42949-02100023-z, last accessed 21 April 2022
Jaskiewicz, T., I. Mulder, N. Morelli and J. S. Pedersen (2020) ‘Hacking the hackathon format to empower citizens in outsmarting “smart” cities’, Interaction Design and Architecture(s) Journal 43: 8-29
Jiang, H., S. Geertman and P. Witte (2020) ‘Smart urban governance: An alternative to technocratic “smartness”’, GeoJournal 87: 1639–1655
Jiang, L. and B. C. O’Neill (2017) ‘Global urbanization projections for the shared socioeconomic pathways’, Global Environmental Change 42: 193-199, https://doi.org/10.1016/j.gloenvcha.2015.03.008, last accessed 6 April 2022
Jiang, L., B. Jones, D. Balk and B. C. O’Neill (2021) ‘The importance of reclassification to under standing urban growth: a demographic decomposi tion of the United States, 1990-2010’, Population, Space and Place: e2562, https://doi.org/10.1002/ psp.2562, last accessed 6 April 2022
John, B., L. W. Keeler, A. Wiek and D. J. Lang (2015) ‘How much sustainability substance is in urban visions?–An analysis of visioning projects in urban planning’, Cities 48: 86-98
Johnson, S. A. (2017) ‘The cost of war on public health: An exploratory method for understanding the impact of conflict on public health in Sri Lanka’, PLoS One 12(1): e0166674
Joint Research Centre (2019) The Future of Cities –Opportunities, Challenges and the Way Forward, Publications Office, Luxembourg, https://publications.jrc.ec.europa.eu/repository/bitstream/ JRC116711/the-future-of-cities_online.pdf, last accessed 6 May 2022
Jones, B., D. Balk and S. Leyk (2020) ‘Urban change in the United States, 1990–2010: A spatial assessment of administrative reclassification’, Sustainability 12(4): 1649, https://doi.org/10.3390/ su12041649, last accessed 6 April 2022
Jongman, B. (2018) ‘Effective adaptation to rising flood risk’, Nature Communications 9: 1986
Joshi, A., B. Malhotra, C. Amadi, M. Loomba, A. Misra, S. Sharma, A. Arora and J. Amatya (2020) ‘Gender and the digital divide across urban slums of New Delhi, India: Cross-sectional study’, Journal of Medical Internet Research 22(6): e14714
Joss, S., F. Sengers, D. Schraven, F. Caprotti and Y. Dayot (2019) ‘The smart city as global discourse: storylines and critical junctures across 27 cities’, Journal of Urban Technology 26(1): 3-34
Kabeer, N., S. Razavi and Y. van der Meulen Rodgers (2021) ‘Feminist economic perspectives on the COVID-19 pandemic’, Feminist Economics 27(12): 1-29
Kabisch, N., N. Frantzeskaki, S. Pauleit, S. Naumann, M. Davis, M. Artmann, D. Haase, S. Knapp, H. Korn, J. Stadler, K. Zaunberger and A. Bonn (2016) ‘Nature-based solutions to climate change mitigation and adaptation in urban areas: Perspectives on indicators, knowledge gaps, barriers, and opportunities for action’, Ecology and Society 21(2)
Kahila-Tani, M., A. Broberg, M. Kyttä and T. Tyger (2016) ‘Let the citizens map—public participation GIS as a planning support system in the Helsinki master plan process’, Planning Practice & Research 31(2): 195-214
Kakderi, C., N. Komninos, A. Panori and E. Oikonomaki (2021) ‘Next city: learning from cities during COVID-19 to tackle climate change’, Sustainability 13(6): 3158
Kamara, A. B., N. Meriggi and W. Prichard (2020) ‘Free town just implemented a new property tax system that could quintuple revenue’, https://www.ictd. ac/blog/freetown-new-property-tax-system-quin tuple-revenue, last accessed 3 May 2022
Kang, M., Y. Choi, J. Kim, K. O. Lee, S. Lee, I. K. Park, J. Park and I. Seo (2020) ‘COVID-19 impact on city and region: What’s next after lockdown?’, International Journal of Urban Sciences 24(3): 297–315
Kantor, S. and A. Whalley (2014) ‘Knowledge spillovers from research universities: Evidence from endowment value shocks’, Review of Economics and Statistics 96(1): 171-188
Karadimas, D., A. Papalambrou, J. Gialelis and S. Koubias (2016) ‘An integrated node for smart-city applications based on active RFID tags; use case on waste-bins’, IEEE 21st International Conference on Emerging Technologies and Factory Automation 1-7
Karppinen, K. and O. Puukko (2020) ‘Four discourses of digital rights: Promises and problems of rightsbased politics’, Journal of Information Policy 10(1): 304-328
Karunathilake, H., K. Hewage, T. Prabatha, R. Ruparathna and R. Sadiq (2020) ‘Project deployment strategies for community renewable energy: A dynamic multi-period planning approach’, Renewable Energy 152: 237-258
Karunathilake, H., P. Perera, R. Ruparathna, K. Hewage and R. Sadiq (2018) ‘Renewable energy integration into community energy systems: A case study of new urban residential development’, Journal of Cleaner Production 173: 292-307
Karvonen, A., F. Cugurullo and F. Caprotti (eds) (2019) Inside Smart Cities: Place, Politics and
Urban Innovation, First Edition, Routledge, Oxfordshire
Kayanan, C. M., N. Moore-Cherry and A. Clavin (2021) ‘Cities under lockdown: Public health and urban vulnerabilities and neighbourhood planning in Dublin’, in B. Doucet, R. Filion, and R. van Melik (eds) Global Reflections on COVID 19 and Urban Inequalities: Housing and Home. Volume 2, Bristol University Press, England, pp: 189-198
Kaza, S., L. C. Yao, P. Bhada-Tata and F. Wan Woerden (2018 ) What a Waste 2.0: A Global Snapshot of Solid Waste Management to 2050, World Bank, Washington, DC, https://documents1.worldbank. org/curated/en/697271544470229584/pdf/ What-a-Waste-2-0-A-Global-Snapshot-of-SolidWaste-Management-to-2050.pdf, last accessed 8 November 2021
Keskinen, P., H. Winschiers-Theophilus, S. ChivunoKuria, A. Müller and M. Nieminen (2021)
‘Digital microwork as a livelihood strategy in a Namibian informal settlement’, The Electronic Journal of Information Systems in Developing Countries 88(1): e12197
Khalifa, M. A. (2015) ‘Evolution of informal settlements upgrading strategies in Egypt: From negligence to participatory development’, Ain Shams Engineering Journal 6(4): 1151-1159
Khan, A. (2020) ‘Cities of missed opportunities: Improving the lives of people in poverty’, https://odi.org/en/insights/cities-of-missed-opportunities-improving-the-lives-of-people-in-poverty, last accessed 7 June 2022
Khan, J. (2013) ‘What role for network governance in urban low carbon transitions?’, Journal of Cleaner Production 50: 133-139
Khavarian-Garmsir, A. R., A. Sharifi and N. Moradpour (2021) ‘Are high-density districts more vulnerable to the COVID-19 pandemic?’, Sustainable Cities and Society 70: 102911
Kher, J., S. Aggarwal and G. Punhani (2015) ‘Vulnerability of poor urban women to climate-linked water insecurities at the household level: A case study of slums in Delhi’, Indian Journal of Gender Studies 22(1): 15-40
Khomenko, S., M. Cirach, E. Pereira-Barboza, N. Mueller, J. Barrera-Gómez, D. Rojas-Rueda, K. de Hoogh, G. Hoekand and M. Nieuwenhuijsen (2021) ‘Premature mortality due to air pollution in European cities: A health impact assessment’, The Lancet Planetary Health 5(3): e121-e134
Kidokoro, T., H. Hsiao and R. Fukuda (2021) ‘Study on the polarization to megacity regions and the urban divide: Focusing on the case of Nishinari Ward, Osaka City, Japan’, Japan Architectural Review 4(1): 117-128
Kimari, W. (2016) We Do Not Want Nny More Masters’: Ruins, Planning and the” Messy Labours” of the Urban Poor, HAL, France
King, R., M. Orloff, T. Virsilas and T. Pande (2017) Confronting the Urban Housing Crisis in the Global South: Adequate, Secure, and Affordable Housing, World Resources Report Working Paper 2, World Resources Institute, Washington, DC, https://files.wri.org/d8/s3fs-public/towards-moreequal-city-confronting-urban-housing-crisis-globalsouth.pdf, last accessed 4 May 2022
Kinyanjui, M. N. (2014) Women and the Informal Economy in Urban Africa: From the Margins to The Centre, Zed Books Ltd, London
Kiran, A. H., N. Oudshoorn and P. Verbeek (2015) ‘Beyond checklists: Toward an ethical-constructive technology assessment’, Journal of Responsible Innovation 2(1): 5-19
Kishimoto, S. and O. Petitjean (2017) ‘Introduction: The Untold Story’, in Dumontier, M., and Doherty, A. (eds), Reclaiming Public Services: How Cities and Citizens are Turning Back Privatization, Transnational Institute, Amsterdam, pp. 11-23
Kitchin, R. and M. Dodge (2019) ‘The (in)security of smart cities: Vulnerabilities, risks, mitigation, and prevention’, Journal of Urban Technology 26(2): 47-65
Kitchin, R., C. Coletta, L. Evans, L. Heaphy and D. M. Donncha (2017) Smart Cities, Urban Technocrats, Epistemic Communities and Advocacy Coalitions, The Programmable City Working Paper, No. 26, SocArXiv, Unites States
Kiunsi, R. (2013) ‘The constraints on climate change adaptation in a city with a large development deficit: The case of Dar es Salaam’, Environment and Urbanization 25(2): 321-337
Kivoi, D. L. (2014) ‘Factors impeding political participation and representation of women in Kenya’, Humanities and Social Sciences 2(6): 173-181
Kjellstrom, T., M. Lodh, T. McMichael, G. Ranmuthugala, R. Shrestha and S. Kingsland (2006) ‘Air and water pollution: Burden and strategies for control’, in D. T. Jamison, J. G. Breman, A. R. Measham, G. Alleyne, M. Claeson, D. B. Evans, P. Jha, A. Mills and P. Musgrove (eds) Disease Control Priorities in Developing Countries, Second Edition, World Bank and Oxford University Press, Washington, DC
Kjellstrom, T., S. Friel, J. Dixon, C. Corvalan, E. Rehfuess, D. Campbell-Lendrum, F. Gore and J. Bartram (2007) ‘Urban environmental health hazards and health equity’, Journal of Urban Health 84(1): 86-97
Klenert, D., F. Funke, L. Mattauch and B. O’Callaghan (2020) ‘Five lessons from COVID-19 for advancing climate change mitigation’, Environmental and Resource Economics 76(4): 751–778
Klinsky, S. and A. Mavrogianni (2020) ‘Climate justice and the built environment’, Buildings and Cities 1(1): 412-428
Knuth, S. and A. Krishnan (2021) Climate Finance for Cities and Urban Governments, The British Academy, London, https://doi.org/10.5871/ bacop26/9780856726743.001, last accessed 3 May 2022
Köhler, J., F. W. Geels, F. Kern, J. Markard, E. Onsongo, A. Wieczorek, F. Alkemade, F. Avelino, A. Bergek, F. Boons, L. Fünfschilling, D. Hess, G. Holtz, S. Hyysalo, K. Jenkins, P. Kivimaa, M. Martiskainen, A. McMeekin, M. S. Mühlemeier, B. Nykvist, B. Pel, R. Raven, H. Rohracher, B. Sandén, J. Schot, B. Sovacool, B. Turnheim, D. Welch, and P. Wells (2019) ‘An agenda for sustainability transitions research: State of the art and future directions’, Environmental Innovation and Societal Transitions 31: 1-32
Kola, L., B. A. Kohrt, C. Hanlon, J. A. Naslund, S. Sikander, M. Balaji, C. Benjet, E. Y. L. Cheung, J. Eaton, P. Gonsalves, M. Hailemariam, N. P. Luitel, D. B. Machado, E. Misganaw, O. Omigbodun, T. Roberts, T. T. Salisbury, R. Shidhaye, C. Sunkel, V. Ugo, A. J. van Rensburg, O. Gureje, S. Pathare, S. Saxena, G. Thornicroft, and V. Patel (2021) ‘COVID-19 mental health impact and responses in low-income and middle-income countries: Reimagining global mental health’, The Lancet Psychiatry 8(6): 535-550
Kosovac A., K. Hartley, M. Acuto and D. Gunning (2020) Conducting City Diplomacy a Survey of International Engagement in 47 Cities, Chicago Council of Global Affairs, https://www.thechicagocouncil.org/sites/default/files/2020-12/ccga_ citydiplomacy_2020_0.pdf.....///, last accessed 25 February 2022
Kothari, B. (2002) ‘Theoretical streams in marginalized peoples’ knowledge(s): Systems, asystems, and subaltern knowledge(s)’, Agriculture and Human Values 19(3): 225-237
Krishnan, S. and L. P. Ganesan (2021) ‘Chapter 1 - smart cities with blockchain technology: A comprehensive survey’, in S. Krishnan, V. E. Balas, E. G. Julie, Y. H. Robinson and R. Kumar (eds) Blockchain for Smart Cities, Elsevier, Netherlands, pp. 1-15
Kroeker-Falconi, C. and R. C. Kettle (2021) Compendium of Best Practices for Housing in Africa, Build Solid Ground: Habitat for Humanity International, Europe, Middle East and Africa, Habitat for Humanity, Africa, https://www.habitat.org/ sites/default/files/documents/compendium_best_
cases_Africa.pdf, last accessed 4 May 2022
Krupnick, M. (2020) ‘How America’s shrinking cities can ‘rightsize’, The Guardian, 13 February, https://www.theguardian.com/us-news/2020/ feb/13/us-shrinking-cities-rightsize, last accessed 3 May 2022
Kubanza, N. S. and D. Simatele (2016) ‘Social and environmental injustices in solid waste manage ment in sub-Saharan Africa: A study of Kinshasa, the Democratic Republic of Congo’, Local Environment 21(7): 866-882
Kulenovic, Z. J. (2015) ‘Competitive cities: Bucaramanga, Colombia – An Andean achiever’, World Bank Blogs, 6 November, https://blogs.worldbank.org/psd/competitive-cities-bucaramangacolombia-andean-achiever, last accessed 3 May 2022
Kulenovic, Z. J. and J. T. Zhu (2016) ‘Competitive cities: Changsha, China – coordination, competition, construction, and cars’, World Bank Blogs, 23 February, https://blogs.worldbank.org/psd/ competitive-cities-changsha-china-coordinationcompetition-construction-and-cars, last accessed 3 May 2022
Kumar, A., S. Zimmerman and F. Arroyo-Arroyo (2021) Myths and Realities of “Informal” Public Transport in Developing Countries: Approaches for Improving the Sector, Sub-Saharan African Transport Policy Program, Washington, DC
Kumar, V. S., K. S. Aggour, P. Cuddihy and J. W. Weisenberg (2020) ‘A federated, multimodal digital thread platform for enabling digital twins’, Naval Engineers Journal 132(1): 47-56
Kunzmann, K. R. (2020) ‘Smart cities after Covid-19: Ten narratives’, The Planning Review 56(2): 20-31
Kurochkin, A. and S. Morozova (2020) ‘Cities in the new media reality: Between freedom of creativity and digital control’, CEUR Workshop Proceedings 2813: 318-326
Kwami, J. (2015) ‘Gender, entrepreneurship, and informal markets in Africa: Understanding how Ghanaian women traders self-organize with digital tools’, in J. Ofori-Dankwa and K. B. Omane-Antwi (eds) Comparative Case Studies on Entrepreneurship in Developed and Developing Countries, IGI Global, Pennsylvania, pp. 19-49
La Greca, P., F. Martinico and F. C. Nigrelli (2020) ‘“Passata è la tempesta...” A land-use planning vision for the Italian Mezzogiorno in the post pandemic’, Journal of Land Use Mobility and Environment 213–230
Lacelle-Webster, A. and M. E. Warren (2021) ‘Citizens’ sssemblies and democracy’, Oxford Research Encyclopedia of Politics, 25 March, https://doi.org/10.1093/acrefore/9780190228637.013.1975, last accessed 19 March 2022
Lafortezza, R., J. Chen, C. K. van den Bosch and T. B. Randrup (2018) ‘Nature-based solutions for resilient landscapes and cities’, Environmental Research 165: 431-441
Lai, S., F. Leone and C. Zoppi (2020) ‘COVID-19 and spatial planning: A few issues concerning public policy’, Journal of Land Use Mobility and Environment 231–246
Lak, A., A. Sharifi, S. Badr, A. Zali, A. Maher, E. Mostafavi and D. Khalili (2021) ‘Spatio-temporal patterns of the COVID-19 pandemic, and placebased influential factors at the neighborhood scale in Tehran’, Sustainable Cities and Society 72: 103034
Lakatos, E. S., G. Yong, A. Szilagyi, D. S. Clinci, L. Georgescu, C. Iticescu and L. Cioca (2021) ‘Conceptualizing core aspects on circular economy in cities’, Sustainability 13(14): 7549
Lakner C., D. G. Mahler, M. Negre and E. P. Prydz (2020) How Much Does Reducing Inequality Matter for Global Poverty?, Global Poverty Monitoring Technical Note 13, World Bank Group, Washington, DC, https://openknowledge. worldbank.org/bitstream/handle/10986/33902/ How-Much-Does-Reducing-Inequality-Matter-for-
Global-Poverty.pdf?sequence=1&isAllowed=y, last accessed 4 May 2022
Lall, S. and S. Wahba (2020) ‘No urban myth: Building inclusive and sustainable cities in the pandemic recovery’, World Bank, https://www.worldbank. org/en/news/immersive-story/2020/06/18/ no-urban-myth-building-inclusive-and-sustainablecities-in-the-pandemic-recovery, last accessed 4 May 2022
Lall, S. V., J. V. Henderson and A. J. Venables (2017) Africa’s Cities: Opening Doors to the World, World Bank, Washington, DC.
Lampert, T., J. Costa, O. Santos, J. Sousa, T. Ribeiro and E. Freire (2021) ‘Evidence on the contribution of community gardens to promote physical and mental health and well-being of non-institutionalized individuals: A systematic review’, PloS One 16(8): e0255621
Lampis, A., J. M. Mott Pavanelli, A. L. D. V. Guerrero and C. Bermann (2021) ‘Possibilidades e limites da transição energética: Uma análise à luz da ciêcia pós-normal’, Estudos Avançados 35(103): 183-200
Langergraber, G., B. Pucher, L. Simperler, J. Kisser, E. Katsou, D. Buehler, M. C. G. Mateo and N. Atanasiva (2020) ‘Implementing nature-based solutions for creating a resourceful circular city’, Blue Green Systems 2(1): 173-185
Lanza, G. G. and M. De Martino (2022) ‘Urban housing inequity: Housing deprivation and social response in the City of Naples’ Sustainability 14(3): 1047
Lasage, R., S. Muis, C. S. E. Sardella, M. A. Van Drunen, P. H. Verburg and J. C. J. H. Aerts (2015) ‘A stepwise, participatory approach to design and implement community based adaptation to drought in the Peruvian Andes’, Sustainability 7(2): 1742-1773
Lassa, J. (2019) ‘When Does Institutionalization Mean NGOnization? Sustaining Climate Risk Governance in Secondary Cities’, Resilience Development Initiative, Charles Darwin University, Australia, https://rdi.or.id/storage/files/publication/89.pdf, last accessed 25 February 2022
Leck, H. and D. Roberts (2015) ‘What lies beneath: Understanding the invisible aspects of municipal climate change governance’, Current Opinion in Environmental Sustainability 13: 61-67
Leck, H. and D. Simon (2018) ‘Local authority responses to climate change in South Africa: the challenges of transboundary governance’, Sustainability 10(7): 2542
Lee, J. (2013) ‘Can You Hear Me Now?: Making Participatory Governance Work for the Poor’, Harvard Law. and Policy Review 7(2):405-441
Leung, D. Y. C., G. Caramanna and M. M. Maroto-Valer (2014) ‘An overview of current status of carbon dioxide capture and storage technologies’, Renew able and Sustainable Energy Reviews 39: 426-443
LSE Cities, UN-Habitat, United Cities and Local Governments (2016) How cities are governed: Building a global database for current models of urban governance, https://urbangovernance.net, last accessed 16 February 2022
Levy, C. (2013) ‘Travel choice reframed: “deep distribution” and gender in urban transport, Environment and Urbanization, 25(1): 47-63
Lewis, S. (2021) ‘The climate crisis can’t be solved by carbon accounting tricks’, The Guardian, 3 March, https://www.theguardian.com/commentisfree/2021/mar/03/climate-crisis-carbonaccounting-tricks-big-finance, last accessed 19 March 2022
Li, J. and N. Rose (2017) ‘Urban social exclusion and mental health of China’s rural-urban migrants–a review and call for research’, Health & Place 48: 20-30
Li, J., D. Webster, J. Cai and L. Muller (2019) ‘Innovation clusters revisited: On dimensions of agglomeration, institution, and built-environment’, Sustainability 11(12): 3338
Liimatainen, H., M. Pöllänen and R. Viri (2018) ‘CO2 reduction costs and benefits in transport: Sociotechnical scenarios’, European Journal of Futures
Research 6(1): 1-12
Lilford, R. J., O. Oyebode, D. Satterthwaite, G. J. Melendez-Torres, Y. Chen, B. Mberu, S. I. Watson, J. Sartori, R. Ndugwa, W. Caiaffa, T. Haregu, A. Capon, R. Saith and A. Ezeh (2017) ‘Improving the health and welfare of people who live in slums’, The Lancet 389(10068): 559-570
Lin, J. (2018) Governing Climate Change: Global Cities and Transnational Lawmaking, Cambridge University Press, Cambridge
Lincoln Institute of Land Policy (2016) The Atlas of Urban Expansion, Lincoln Institute of Land Policy, Cambridge, www.lincolninst.edu/sites/default/files/pubfiles/ atlas-of-urban-expansion-2016-volume-1-full.pdf, last accessed 6 April 2022
Lindley, S., S. Pauleit, K. Yeshitela, S. Cilliers. and C. Shackleton (2018) ‘Rethinking urban green infrastructure and ecosystem services from the perspective of sub-Saharan African cities’, Landscape and Urban Planning 180: 328-338 Ling, F. (2017) ‘Microbial communities as biosensors for monitoring urban environments’, Microbial Biotechnology 10(5): 1149-1151
LinkedIn (2022) 2022 Global Talent Trends: The Reinvention of Company Culture, LinkedIn Corporation, https://business.linkedin.com/content/dam/ me/business/en-us/talent-solutions-lodestone/ body/pdf/global_talent_trends_2022.pdf, last accessed 30 April 2022
Liquete, C., A. Udias, G. Conte, B. Grizzetti and F. Masi (2016) ‘Integrated valuation of a nature-based solution for water pollution control. Highlighting hidden benefits’, Ecosystem Services 22: 392-401
Liu, D., R. Huang and M. Wosinski (2017) Smart Learning in Smart Cities, First Edition, Springer, Singapore
Lixiong, Y. (2018) The Social Assistance Reform in China: Towards a Fair and Inclusive Social Safety Net, United Nations Department of Economic and Social Affairs, https://www.un.org/ development/desa/dspd/wp-content/uploads/ sites/22/2018/06/The-Social-Assistance-Reformin-China.pdf, last accessed 4 May 2022
Local Government Association (2021) A Vision for Urban Growth and Recovery, Local Government Association, London
Loewe, M., T. Zintl and A. Houdret (2021) ‘The social contract as a tool of analysis: introduction to the special issue on “framing the evolution of new social contracts in Middle Eastern and North African countries”’, World Development 145: 104982
Löffler, G. (2016) Analysis of the State of Local Finance in Intermediary Cities, United Cities and Local Governments (UCLG), Barcelona
Loh, T. H., C. Coes and B. Buthe (2020) ‘Separate and unequal: Persistent residential segregation is sustaining racial and economic injustice in the U.S.’, https://www.brookings.edu/essay/ trend-1-separate-and-unequal-neighborhoods-aresustaining-racial-and-economic-injustice-in-the-us, last accessed 4 May 2022
Lohmann, L. (2001) ‘Democracy or carbocracy? climate trading and the future of the climate debate’, Corner House Briefing 24, http://www. thecornerhouse.org.uk/resource/democracy-orcarbocracy, last accessed 6 June 2022
Lohmann, L. (2008) ‘Carbon trading, climate justice and the production of ignorance: Ten examples’, Development 51(3): 359-365
Long, J. and J. L. Rice (2019) ‘From sustainable urbanism to climate urbanism’, Urban Studies 56(5): 992-1008
Lord, B (2020) ‘Inequality in America: Far beyond extreme. The maldistribution of America’s income and wealth has reached levels that our conventional economic stats have trouble revealing’, https://inequality.org/great-divide/ inequality-in-america-far-beyond-extreme, last accessed 4 May 2022
Lovasi, G. S., A. V. D. Roux and J. Kolker (eds) (2020) Urban Public Health: A Research Toolkit for Prac-
tice and Impact, First Edition, Oxford University Press, New York
Łowicki, D. and S. Piotrowska (2015) ‘Monetary valuation of road noise. Residential property prices as an indicator of the acoustic climate quality’, Ecological Indicators 52: 472-479
Ludwick, T., A. Morgan, S. Kane, M. Kelaherand and B. McPake (2020) ‘The distinctive roles of urban community health workers in low-and middle-income countries: A scoping review of the literature’, Health Policy and Planning 35(8): 1039-1052
Luederitz, C., E. Brink, F. Gralla, V. Hermelingmeier, M. Meyer, L. Niven, L. Panzer, S. Partelow, A. Rau, R. Sasaki, D.J. Abson, D. J. Lang, C. Wamsler and H. von Wehrden (2015) ‘A review of urban ecosystem services: Six key challenges for future research’, Ecosystem Services 14: 98-112
Lund, F., L. Alfers and V. Santana (2016) ‘Towards an inclusive occupational health and safety for informal workers’ New Solutions: A Journal of Environmental and Occupational Health Policy 26(2): 190-207
Lund, S., A. Madgavkar, J. Manyika, S. Smit, K. Ellingrud, M. Meaney and O. Robinson (2021) The Future of Work After COVID19: Executive Summary, McKinsey Global Institute, https:// www.mckinsey.com/featured-insights/futureof-work/the-future-of-work-after-covid-19, last accessed 6 June 2022
Lustig, N., V. M. Pabon, F. Sanz and S. D. Younger (2020) The Impact of COVID-19 Lockdowns and Expanded Social Assistance on Inequality, Poverty and Mobility in Argentina, Brazil, Colombia and Mexico, CGD Working Paper 556, Center for Global Development, Washington, DC, https:// www.cgdev.org/sites/default/files/impact-covid19-lockdowns-and-expanded-social-assistance. pdf, last accessed 6 May 2022
Lutz, W., A. Goujon, K. C. Samir, M. Stonawski and N. Stilianakis (2018) Demographic and Human Capital Scenarios for the 21st Century: 2018 Assessment for 201 Countries, Jo Publications Office of the European Union, Luxembourg
Lynch, L. R. R. (2021) ‘Harambee urban farms fill crucial void for Black, Latinx families during the pandemic’, Milwaukee Journal Sentinel, 22 October, https://www.jsonline. com/story/news/2021/10/22/urban-farmsbecome-vital-food-option-milwaukee-duringpandemic/8458800002/, last accessed 22 April 2022
Lyons, G. and C. Davidson (2016) ‘Guidance for transport planning and policymaking in the face of an uncertain future’, Transportation Research Part A: Policy and Practice 88: 104-116
Maantay, J. (2007) ‘Asthma and air pollution in the Bronx: Methodological and data considerations in using GIS for environmental justice and health research’, Health & Place 13(1): 32-56
Mack E. A. and S. Wrase (2017) ‘A burgeoning crisis? A nationwide assessment of the geography of water affordability in the United States’, PLoS ONE 12(4): e0176645
Madsen, H. M., R. Brown, M. Elle and P. S. Mikkelsen (2017) ‘Social construction of stormwater control measures in Melbourne and Copenhagen: A discourse analysis of technological change, embedded meanings and potential mainstreaming’, Technological Forecasting and Social Change 115: 198-209
Magallón-Botaya, R., B. Oliván-Blázquez, K. L. Ramírez-Cervantes, F. Méndez-López-de-laManzanara, I., Aguilar-Palacio, M. CasajuanaClosas and E. Andrés-Esteban (2021) ‘Geographic factors associated with poorer outcomes in patients diagnosed with COVID-19 in primary health care’, International Journal of Environmental Research and Public Health 18(7): 3842
Mahendra, A., R. King, J. Du, A. Dasgupta, V. A. Beard, A. Kallergis and K. Schalch (2021)
Towards a More Equal City: Seven Transformations for More Equitable and Sustainable Cities,
World Resources Report, World Resources Institute, Washington, DC
Majale, M. (2008) ‘Employment creation through participatory urban planning and slum upgrading: The case of Kitale, Kenya’, Habitat International 32(2): 270-282
Makondo, C. C. and D. S. G. Thomas (2018) ‘Climate change adaptation: Linking indigenous knowledge with western science for effective adaptation’, Environmental Science and Policy 88: 83-91
Maley, J. (2019) ‘How many people in your suburb live in poverty?’, The Sydney Morning Herald, 24 October, https://www.smh.com.au/national/nsw/ we-are-surrounded-by-poverty-sydney-s-pocketsof-disadvantage-revealed-20191022-p5338n. html, last accessed 4 May 2022
Malinga, R., L. J. Gordon, R. Lindborg and G. Jewitt (2013) ‘Using participatory scenario planning to identify ecosystem services in changing landscapes’, Ecology and Society 18(4)
Mangi, M. Y., Z. Yue, S. Kalwar and Z. A. Lashari (2020) ‘Comparative analysis of urban development trends of Beijing and Karachi metropolitan areas’, Sustainability 12(2): 451
Manoharan, A. P., A. Ingrams, D. Kang and H. Zhao (2021) ‘Globalization and worldwide best practices in e-government’, International Journal of Public Administration 44(6): 465-476
Manzini, E. and E. Staszowksi (2013) ‘Introduction’ in Public And Collaborative: Exploring The Intersection Of Design, Social Innovation And Public Policy, DESIS network, pp. i-vi
Marcotullio, P. J., A. Sarzynski, J. Sperling, A. Chávez, H. Estiri, M. Pathak, R. Zimmerman, J. Garnick, C. Kennedy, E. J. Linky and C. Nahon (2018) ‘Energy transformation in cities’, in C. Rosenzweig, W. D. Solecki, P. Romero-Lankao, S. Mehrotra, S. Dhakal, and S. A. Ibrahim (eds) Climate Change and Cities: Second Assessment Report of the Urban Climate Change Research Network. Cambridge University Press, Cambridge, pp. 443-490
Marique, A. and S. Reiter (2014) ‘A simplified framework to assess the feasibility of zero-energy at the neighbourhood/community scale’, Energy and Buildings 82: 114-122
Marique, A., M. Penders and S. Reiter (2013) ‘From zero-energy building to zero-energy neighbourhood: Urban form and mobility matter’, Proceedings PLEA 2013 - 29th Conference, Sustainable Architecture for a Renewable Future, 10-12 September, Munich, Germany, https://mediatum. ub.tum.de/doc/1169297/1169297.pdf, last accessed 6 June 2022
Markard, J. (2018) ‘The next phase of the energy transition and its implications for research and policy’, Nature Energy 3(8): 628-633
Marteau, T. M., N. Chater and E. E. Garnett (2021) ‘Changing behaviour for net zero 2050’, BMJ 375, https://doi.org/10.1136/bmj.n2293, last accessed 19 March 2022
Martin, C. J., J. Evans and A. Karvonen (2018) ‘Smart and sustainable? five tensions in the visions and practices of the smart-sustainable city in Europe and North America’, Technological Forecasting and Social Change 133: 269-278
Martínez, L. and J. R. Short (2021) ‘The pandemic city: Urban issues in the time of COVID-19’, Sustainability 13(6): 3295
Martinez-Fernandez, C. and C. Wu (2009) ‘Shrinking cities: A global overview and concerns about Australian mining cities cases’ in K. Pallagst, J. Aber, I. Audirac, E. Cunningham-Sabot, S. Fol, C. Martinez-Fernandez, S. Moraes, H. Mulligan, J. Vargas-Hernandez, T. Wiechmann, T. Wu and J. Rich (eds) Shrinking Cities: Problems, Patterns and Strategies of Urban Transformation in a Global Context, Monograph 2009-01, University of California, Berkeley, CA
Martinez-Fernandez, C., T. Weyman, S. Fol, I. Audirac, E. Cunningham-Sabot, T. Wiechmann, and H. Yahagi (2016) ‘Shrinking cities in Australia,
Japan, Europe and the USA: from a global process to local policy responses’, Progress in Planning 105: 1-48
Martinez-Vazquez, J., and V. Vulovic (2017) ‘How well do subnational borrowing regulations work?’, In Y. Naoyuki and J. Peter (eds) Central and local government relations in Asia, Edward Elgar Publishing, pp. 161–220
MASS Design Group (2020) The Role of Architecture in Fighting COVID-19: Spatial Strategies for Restaurants in Response to COVID-19, https:// massdesigngroup.org/sites/default/files/multiplefile/2020-05/Spatial%20Strategies%20for%20 Restaurants%20in%20Response%20to%20COVID19_.pdf, last accessed 1 May 2022
Matatiele, P. and M. Gulumian (2016) ‘A cautionary approach in transitioning to ‘green’ energy technologies and practices is required’, Reviews on Environmental Health 31(2): 211-223
Matzopoulos, R., K. Bloch, S. Lloyd, C. Berens, B. Bowman, J. Myers and M. L. Thompson (2020) ‘Urban upgrading and levels of interpersonal violence in Cape Town, South Africa: The violence prevention through urban upgrading programme’ Social Science & Medicine, 255: 112978
Mayors Migration Council (2021) ‘Global Mayors Action Agenda On Climate And Migration’, https://www.mayorsmigrationcouncil.org/c40mmc-action-agenda, last accessed 6 March 2022
Mberu, B., M. Wamukoya, S. Oti and C. Kyobutungi (2015) ‘Trends in causes of adult deaths among the urban poor: Evidence from Nairobi urban health and demographic surveillance system, 2003–2012’ Journal of Urban Health 92(3): 422-445
McArthur, J., E. Robin and E. Smeds (2019) ‘Sociospatial and temporal dimensions of transport equity for London’s night time economy’, Transportation Research Part A: Policy and Practice 121: 433-443
McBain, S. and J. Teter (2021) Tracking Transport, International Energy Agency, Paris, https://www. iea.org/reports/tracking-transport-2021, last accessed 19 March 2022
McDonald, B. and S. Larson (2020) ‘Implications of the coronavirus on sales tax revenue and local government fiscal health’, Journal of Public and Non-profit Affairs 6 (3): 377–400
McDonald, D. (2018) ‘Remunicipalization: The future of water services?’ Geoforum, 91:47-56
McDonald, R. I., K. Weber, J. Padowski, M. Flörke, C. Schneider, P. A. Green, T. Gleeson, S. Eckman, B. Lehner, D. Balk, T. Boucher, G. Grill and M. Montgomery (2014) ‘Water on an urban planet: urbanization and the reach of urban water infrastructure’, Global environmental change 27: 96-105
McFarlane, C. (2020) ‘De/re-densification’, City 24(12): 314-324
McGowan, H. E. (2020) ‘The coronavirus is creating an inflection point in the future of work’, Forbes, 16 April, https://www.forbes.com/sites/ heathermcgowan/2020/04/16/the-coronavirusis-creating-an-inflection-point-in-the-future-ofwork/?sh=177b7f6c3b2d, last accessed 23 April 2022
McGranahan, G., D. Balk and B. Anderson (2007) ‘The rising tide: Assessing the risks of climate change and human settlements in low elevation coastal zones. Environment and Urbanization 19(1): 17-37, https://doi. org/10.1177/0956247807076960, last accessed 6 April 2022
McGregor, D., S. Whitaker and M. Sritharan (2020) ‘Indigenous environmental justice and sustainability’, Current Opinion in Environmental Sustainability 43: 35-40
McGuirk, P., R. Dowling, S. Maalsen and T. Baker (2020) ‘Urban Governance Innovation and COVID-19’ Geographical Research 59(2):188-195
McKinsey & Company (2020) ‘From No Mobility to Future Mobility: Where COVID-19 has Accelerated Change’, https://www.mckinsey.com/ industries/automotive-and-assembly/our-insights/
from-no-mobility-to-future-mobility-where-covid19-has-accelerated-change#, last accessed 19 March 2022
McKinsey Global Institute (2016) Bridging Global Infrastructure Gaps, https://www.mckinsey. com/~/media/mckinsey/business%20functions/ operations/our%20insights/bridging%20global%20 infrastructure%20gaps/bridging-global-infrastructure-gaps-full-report-june-2016.pdf, last accessed 18 May 2022
McMillan R., J. Kocsis and A. Daniere (2021) ‘Rights, justice and climate resilience: Lessons from fieldwork in urban Southeast Asia’, Environment and Urbanization 34(1): 170-189
McNee, G., and D. Pojani (2021) ‘NIMBYism as a barrier to housing and social mix in San Francisco’, Journal of Housing and the Built Environment 37:553–573
McPhearson, T., M. Karki, C. Herzog, H. S. Fink, L. Abbadie, P. Kremer, C. M. Clark, M. I. Palmer, K. Perini and M. Dubbeling (2018) ‘Urban ecosystems and biodiversity’, in C. Rosenzweig, W. D. Solecki, P. Romero-Lankao, S. Mehrotra, S. Dhakal, and S. A. Ibrahim (eds) Climate Change and Cities: Second Assessment Report of the Urban Climate Change Research Network, Cambridge University Press, Cambridge, pp. 257-318
Meehan, K., J. R. Jurjevich, N. M. J. W. Chun and J. Sherrill (2020) ‘Geographies of insecure water access and the housing–water nexus in US cities’, Proceedings of the National Academy of Sciences 117(46): 28700-28707
Melica, G., P. Bertoldi, A. Kona, A. Iancu, S. Rivas and P. Zancanella (2018) ‘Multilevel governance of sustainable energy policies: The role of regions and provinces to support the participation of small local authorities in the Covenant of Mayors’, Sustainable Cities and Society 39: 729-739
Menashe-Oren, A. and G. Stecklov (2017) Population Age Structure and Sex Composition in Sub-Saharan Africa: A Rural-urban Perspective, IFAD Research Series 17, International Fund for Agricultural Development, Rome, https://www. ifad.org/documents/38714170/39135332/17_ Research_Age_Sex_web.pdf/34ebef51-79f54361-bd0e-cf139d6fafad, last accessed 7 April 2022
Menashe Oren, A. and P. Bocquier (2021) ‘Urbanization is no longer driven by migration in low and middle Income Countries (1985–2015)’, Population and Development Review 47(3): 639-663, https://doi.org/10.1111/padr.12407, last accessed 6 April 2022
Mendes Barbosa, L. and G. Walker (2020) ‘Epistemic injustice, risk mapping and climatic events: Analysing epistemic resistance in the context of favela removal in Rio de Janeiro’, Geographica Helvetica 75(4): 381-391
Meth, P., T. Goodfellow, A. Todes and S. Charlton (2021) ‘Conceptualizing African urban peripheries’, International Journal of Urban and Regional Research 45(6): 985-1007
Meyer, N. and C. Auriacombe (2019) ‘Good Urban Governance and City Resilience: An Afrocentric Approach to Sustainable Development’, Sustainability 11(19):5514
Michael, K., T. Deshpande and G. Ziervogel (2019) ‘Examining vulnerability in a dynamic urban setting: The case of Bangalore’s interstate migrant waste pickers’, Climate and Development 11(8): 667-678
Mira-Bonnardel, S., F. Antonialli and D. Attias (eds) (2021) The Robomobility Revolution of Urban Public Transport: A Social Sciences Perspective, First Edition, Springer, Switzerland
Mitchell, B. C. and J. Chakraborty (2014) ‘Urban heat and climate justice: A landscape of thermal inequity in Pinellas County, Florida’, Geographical Review 104(4): 459-480
Mitlin, D. and S. Bartlett (2018) ‘Editorial: Co-production–key ideas’, Environment & Urbanization 30(2): 355-366
Mitlin, D., V. A. Beard, D. Satterthwaite and J. Du
(2019) Unaffordable and Undrinkable: Rethinking Urban Water Access in the Global South, World Resources Report: Towards a More Equal City Working Paper 6, World Resources Institute, Washington, DC
Mo Ibrahim Foundation (2020) 2020 Ibrahim Index of African Governance: Index Report, https:// mo.ibrahim.foundation/iiag/downloads, last accessed 25 February 2022
Moberg, K. R., C. Aall, F. Dorner, E. Reimerson, J. Ceron, B. Sköld, B. K. Sovacool and V. Piana (2019) ‘Mobility, food and housing: Responsibility, individual consumption and demand-side policies in European deep decarbonisation pathways’, Energy Efficiency 12(2): 497-519
Moglia, M., N. Frantzeskaki, P. Newton, M. PinedaPinto, J. Witheridge, S. Cook and S. Glackin (2021) ‘Accelerating a green recovery of cities: Lessons from a scoping review and a proposal for mission-oriented recovery towards postpandemic urban resilience’, Developments in the Built Environment 7: 100052
Mohindra, K. S. and T. Schrecker (2013) ‘From bulldozing to housing rights: reducing vulnerability and improving health in African slums’, Global Health Promotion 20(1): 64-69
Moir, E., T. Moonen and G. Clark (2014) The Future of Cities: What is the Global Agenda?, The Business of Cities, London https://assets.publishing.service. gov.uk/government/uploads/system/uploads/attach ment_data/file/429125/future-cities-global-agenda. pdf, last accessed 23 April 2022
Møller, M. S., A. S. Olafsson, K. Vierikko, K. Sehested, B. Elands, A. Buijs and C. K. van den Bosch (2019) ‘Participation through place-based e-tools: A valuable resource for urban green infrastructure governance?’, Urban Forestry & Urban Greening 40: 245-253
Moloney, A (2020) ‘How COVID-19 is exposing ‘hidden poverty’ across unequal cities’, World Economic Forum, https://www.weforum.org/ agenda/2020/11/pandemic-exposes-hidden-poverty-unequal-cities, last accessed 4 May 2022
Montgomery, M. R. (2008) ‘The urban transformation of the developing world’, Science, 319(5864): 761-764, https://doi.org/10.1126/ science.1153012, last accessed 6 April 2022
Moreno, C., Z. Allam, D. Chabaud, C. Gall and F. Pratlong (2021) ‘Introducing the “15-minute city”: Sustainability, resilience and place identity in future post-pandemic cities’, Smart Cities 4(1): 93–111
Morrison, J. (2020) ‘Smart cities and digital ethics: A few thoughts’, https://calvium.com/smart-citiesdigital-ethics-thoughts, last accessed 11 October 2021
Mos, E. (2021) ‘Platformization in the third sector’, City 25(3-4): 315-331
Moser, C. (2011) ‘A conceptual and operational framework for pro-poor asset adaptation to urban climate change’, in D. Hoomweg, M. Freire, M. J. Lee, P. Bhada-Tata. and B. Yuen (eds) Cities and Climate Change: Responding to an Urgent Agenda, World Bank, Washington, DC, pp. 225-253
Moser, C. O. N. and C. McIlwaine (2014) ‘New frontiers in twenty-first century urban conflict and violence’, Environment and Urbanization 26(2): 331-344
Mosler, S. and P. Hobson (2021) ‘Close-to-nature heuristic design principles for future urban green infrastructure’, Urban Planning 6(4): 67-79
Mudau, N., D. Mwaniki, L. Tsoeleng, M. Mashalane, D. Beguy and R. Ndugwa (2020) ‘Assessment of SDG Indicator 11.3.1 and urban growth trends of major and small cities in South Africa’, Sustainability 12(17): 7063
Muggah, R and R. Florida (2020) ‘Megacity slums are incubators of disease – but coronavirus response isn’t helping the billion people who live in them’, The Conversation, 14 May, https://theconversation.com/megacity-slums-are-incubators-ofdisease-but-coronavirus-response-isnt-helpingthe-billion-people-who-live-in-them-138092, last
accessed 4 May 2022
Muggah, R. (2014) ‘Deconstructing the fragile city: Exploring insecurity, violence and resilience’, Envi ronment and Urbanization 26(2): 345-358
Muggah, R. (2018) ‘Latin America’s cities are ready to take off. But their infrastructure is failing them’, World Economic Forum, https://www.weforum. org/agenda/2018/06/latin-america-cities-urbanization-infrastructure-failing-robert-muggah/, last accessed 4 May 2022
Mulyaningsih, T., R. Wahyunengseh and S. Hastjarjo (2020) ‘Poverty and digital divide: A study in urban poor neighborhoods’, Jurnal Ilmu Sosial dan Ilmu Politik 24(2): 189-203
Murgante, B., G. Balletto, G. Borruso, G. L. Casas, P. Castiglia and M. Dettori (2020) ‘Geographical analyses of COVID-19’s spreading contagion in the challenge of global health risks: The role of urban and regional planning for risk containment’, Journal of Land Use Mobility and Environment: 283–304
Mustafa, A., M. Bruwier, P. Archambeau, S. Erpicum, M. Pirotton, B. Dewals and J. Teller (2018) ‘Effects of spatial planning on future flood risks in urban environments’, Journal of Environmental Management 225: 193-204
Mutibwa, D. H., A. Hess and T. Jackson (2020) ‘Strokes of serendipity: Community co-curation and engagement with digital heritage’, Convergence 26(1): 157–177
Mutinda, M., B. Mwau, J. Makau and A. Sverdlik (2020) ‘Policy briefing: Rethinking slum upgrading in light of Nairobi’s poverty penalty (SDI Kenya)’, https://www.muungano.net/publicationslibrary/2020/5/20/muungano-alliancepolicy-briefing-rethinking-slum-upgrading-in-lightof-nairobis-poverty-penalty#_ftn3, last accessed 4 May 2022
Mutuku, B., L. Boerboom and A. Madureira (2019) ‘The role of Planning Support Systems in national policy transfer and policy translation in secondary cities’, International Planning Studies 24(3-4):293-307
Naden, C. (2020) ‘Smart cities to benefit from new international standards task force’, https://www. iso.org/news/ref2567.html, last accessed 14 November 2021
Nagenborg, M. (2020) ‘Urban robotics and responsible urban innovation’, Ethics and Information Technology 22(4): 345–355
Nasca, T. F., N. Changfoot and S. D. Hill (2019) ‘Participatory planning in a low-income neighbourhood in Ontario, Canada: Building capacity and collaborative interactions for influence’, Community Development Journal 54(4): 622-642
Nassar, M. A., L. Luxford, P. Cole, G. Oatley and P. Koutsakis (2019) ‘The current and future role of smart street furniture in smart cities’, IEEE Communications Magazine 57(6): 68-73
National Research Council (2003) Cities Transformed: Demographic Change and Its Implications in the Developing World, National Academies Press, Washington, DC, https://doi. org/10.17226/10693, last accessed 6 April 2022
Natural Capital Germany (2017) Ecosystem Services in the City – Protecting Health and Enhancing Quality of Life, Technical University of Berlin, Germany, https://www.ufz.de/export/data/ global/190507_TEEB_De_Broschuere_KF_ Bericht3_Stadt_engl_web.pdf, last accessed 19 March 2022
Naude, W. (2020) ‘Entrepreneurial Recovery from COVID-19: Decentralization, Democratization, Demand, Distribution and Demography’, IZA Institute of Labor Economics, https://docs.iza.org/ dp13436.pdf, last accessed 25 February 2022
Ndung’u, N. (2020) ‘COVID-19 crisis amplifies the urgency for economic diversification in Africa’, Africa Renewal, 8 September, https://www. un.org/africarenewal/magazine/september-2020/ covid-19-crisis-amplifies-urgency-economic-diversification-africa, last accessed 05 March 2022
Neagle, E. (2022) ‘Sustainable business must be
people-centered’, World Resources Institute, https://www.wri.org/insights/sustainablebusiness-must-be-people-centered, last accessed 3 May 2022
Negri, S., C. Sager, S. Wahba and S. Lall (2015) Competitive Cities for Jobs and Growth: What, Who, and How, World Bank, Washington, DC
Nematchoua, M. K., A. M. Nishimwe and S. Reiter (2021) ‘Towards nearly zero-energy residential neighbourhoods in the European Union: A case study’, Renewable and Sustainable Energy Reviews 135: 110198
Nesbitt, L., M. J. Meitner, S. R. J. Sheppard and C. Girling (2018) ‘The dimensions of urban green equity: A framework for analysis’, Urban Forestry & Urban Greening 34: 240-248
Nesta (2018) ‘Flying high: Shaping the future of drones in UK cities’, https://www.nesta.org.uk/ event/flying-high-shaping-future-drones-uk-cities/ Nesti, G. (2020) ‘Defining and assessing the transformational nature of smart city governance: insights from four European cases’, International Review of Administrative Sciences 86(1): 20-37
Nettle, D., E. Johnson, M. Johnson and R. Saxe (2021) ‘Why has the COVID-19 pandemic increased support for universal basic income?’, Humanities and Social Sciences Communications 8 (1): 1-12
Nguyen, M. C, H, N. Yoshida, H. Wu and A. Narayan (2020) Profiles of the New Poor Due to the COVID-19 Pandemic, World Bank, Washington, DC, https://thedocs.worldbank.org/en/ doc/767501596721696943-0090022020/ original/ProfilesofthenewpoorduetotheCOVID19pandemic.pdf, last accessed 4 May 2022
Niemi, M. K., S. Dan, J, Kalliokoski, K. Shahzad, S. R. Shakeel, R. Alagirisamy and I. Laurila (2021) Talent Retention and the Development of Digital Skills: A Study of the Ecosystem-based Digitalisation Academy located in Vaasa, Finland, Ministry of Economic Affairs and Employment, Helsinki, https://urn.fi/URN: ISBN: 978-952-327-840-0, last accessed 3 May 2022
Nieuwenhuijsen, M. J., H. Khreis, E. Verlinghieri, N. Mueller and D. Rojas-Rueda (2017) ‘Participatory quantitative health impact assessment of urban and transport planning in cities: a review and research needs’, Environment International 103: 61-72
Nigudkar, S. (2021) ‘15-minute city concept designed by Carlos Moreno wins Obel award 2021’, Rethinking The Future, 6 November 2021https:// www.re-thinkingthefuture.com/architecturalnews/a5804-15-minute-city-concept-designedby-carlos-moreno-wins-obel-award-2021/, last accessed 20 April 2022
Nikolaidis, N. P., D. Kolokotsa and S. A. Banwart (2017) ‘Nature-based solutions: Business’, Nature 543(7645): 315-315
Niță, M. R., D. L. Badiu, D. A. Onose, A. A. Gavrilidis, S. R. Gr dinaru, I. I. N stase and R. Lafortezza (2018) ‘Using local knowledge and sustainable transport to promote a greener city: The case of Bucharest, Romania’, Environmental Research 160: 331-338
Noorloos, F. and M. Kloosterboer (2018) ‘Africa’s new cities: The contested future of urbanization’, Urban Studies 55(6):1223-1241
Norman, B. and W. Steffen (2018) ‘Planning within planetary boundaries’, in Norman, B. (ed)
Sustainable Pathways for our Cities and Regions: Planning within Planetary Boundaries, 1st Edition, Routledge, United Kingdom, pp. 20-44
Noykhovich, E., S. Mookherji and A. Roess (2019) ‘The risk of tuberculosis among populations living in slum settings: A systematic review and meta-analysis’, Journal of Urban Health 96(2): 262-275
NYC Mayors Office of the Chief Technology Officer (2020) The New York City Internet Master Plan, https://www1.nyc.gov/assets/cto/downloads/ internet-master-plan/NYC_IMP_1.7.20_FINAL-2. pdf, last accessed 25 February 2022
Oborn, P. and J. Walters (2021) Planning for Climate Change and Rapid Urbanization: Survey of the
Built Environment Professions in the Commonwealth – Executive Summary’, Commonwealth Association of Architects, Commonwealth Association of Planners, Commonwealth Association of Surveying and Land Economy and Commonwealth Engineers Council, United Kingdom, https://www.thecommonwealth.io/wp-content/ uploads/2020/07/Executive-Summary-BE.pdf, last accessed 28 April 2022
O’Brien, K. (2016) ‘Climate change adaptation and social transformation’, in D. Richardson, N. Castree, M. F. Goodchild, A. Kobayashi, W. Lei and R. A. Marston (eds) International Encyclopedia of Geography: People, the Earth, Environment and Technology, John Wiley & Sons, United States
Obeng-Odoom, F. (2016) ‘Urban Governance in Africa Today: Reframing Experiences and Lessons’, Growth and Change 48(1):4-21
Odone, A., D. Delmonte, T. Scognamiglio and C. Signorelli (2020) ‘COVID-19 deaths in Lombardy, Italy: Data in context’, The Lancet Public Health 5(6): e310
OECD (Organisation for Economic Co-operation and Development) (2015a) Ageing in Cities, http:// dx.doi.org/10.1787/9789264231160-en, last accessed 3 May 2022
OECD (2015b) Making Cities Work for All. Data and Actions for Inclusive Growth, https://read.oecd. org/10.1787/9789264263260-en?format=pdf, last accessed 4 May 2022
OECD (2016) OECD Territorial Reviews: Japan 2016, OECD Territorial Reviews, OECD Publishing, Paris
OECD (2018a) Climate-resilient Infrastructure, OECD Environment Policy Paper No. 14, OECD Publishing, Paris
OECD (2018b) The Productivity-Inclusiveness Nexus, OECD Publishing, Paris
OECD (2019a) The Circular Economy in Cities and Regions, OECD Publishing, Paris
OECD (2019b) Decentralised Development Cooperation: Unlocking the Potential of Cities and Regions, https://doi.org/10.1787/e9703003-en, last accessed 25 February 2022
OECD (2019c) Enhancing Innovation Capacity in City Government, OECD Publishing, Paris
OECD (2019d) Making Decentralisation Work: A Handbook for Policy-Makers, https://doi. org/10.1787/g2g9faa7-en, last accessed 25 February 2022
OECD (2019e) Measuring Distance to the SDG Targets 2019: An Assessment of Where OECD Countries Stand, https://doi.org/10.1787/a8caf3fa-en, last accessed 25 February 2022
OECD (2020a) Building Back Better: A Sustainable, Resilient Recovery After COVID-19, https:// read.oecd-ilibrary.org/view/?ref=133_133639s08q2ridhf&title=Building-back-better-_Asustainable-resilient-recovery-after-Covid-19&_ ga=2.60021037.1859826171.16210582561077390381.1612859062, last accessed 6 May 2022
OECD (2020b) Improving Transport Planning for Accessible Cities, https://doi.org/10.1787/ fcb2eae0-en, last accessed 6 April 2022
OECD (2020c) ‘What is the impact of the COVID-19 pandemic on immigrants and their children?’, https:// www.oecd.org/coronavirus/policy-responses/what-isthe-impact-of-the-covid-19-pandemic-on-immigrantsand-their-children-e7cbb7de/#section-d1e554, last accessed 13 April 2022
OECD (2020d) Broad-based Innovation Policy for All Regions and Cities, OECD Regional Development Studies, OECD Publishing, Paris
OECD (2020e) ‘Recommendations for municipal COVID response’ in The Territorial Impact of COVID-19: Managing the Crisis Across Levels of Government, https://read.oecd-ilibrary.org/ view/?ref=128_128287-5agkkojaaaandtitle=Theterritorial-impact-of-covid-19-managing-the-crisisacross-levels-of-government, last accessed 25 February 2022
OECD (2020f) Smart Cities and Inclusive Growth: Building on the Outcomes of the 1st OECD Roundtable on Smart Cities and Inclusive Growth, https://www.oecd.org/cfe/cities/OECD_Policy_ Paper_Smart_Cities_and_Inclusive_Growth.pdf, last accessed 25 February 2022
OECD (2021a) ‘Launch of the G20 platform on SDGs localisation and intermediary cities (G20 PLIC)’, https://www.oecd.org/dev/g20-platform-on-sdgslocalisation-and-intermediary-cities-launch-event. htm, last accessed 25 April 2022
OECD (2021b) The Multilevel Governance of the SDGs, Chapter 4, https://www.oecd-ilibrary.org/ sites/b453ded2-en/index.html?itemId=/content/ component/b453ded2-en, last accessed 25 February 2022
OECD (undated) ‘Resilient cities’, https://www.oecd. org/regional/resilient-cities.htm, last accessed 19 March 2022
OECD and CERI (Centre for Educational Research and Innovation) (2017) The Starterpack - Futures Thinking in Action, https://www.oecd.org/ education/school/38981492.pdf, last accessed 7 May 2022
OECD and European Commission (2020) Cities in the World: A New Perspective on Urbanization, https://read.oecd.org/10.1787/d0efcbdaen?format=pdf, last accessed 23 April 2022
OECD and ILO (2019) Tackling Vulnerability in the Informal Economy, Development Centre Studies, OECD Publishing, Paris, https://doi. org/10.1787/939b7bcd-en, last accessed 3 May 2022
OECD and UCLG (2019) 2019 Report of the World Observatory on Subnational Government Finance and Investment – Key Findings, https://www. oecd.org/regional/observatory-on-subnationalgovernment-finance-and-investment.htm, last accessed 25 February 2022
OECD, UN-HABITAT, and UNOPS (2021) Global State of National Urban Policy 2021: Achieving Sustainable Development Goals and Delivering Climate Action, https://doi.org/10.1787/96eee083-en, last accessed 25 February 2022
Ohnsorge, F. and S. Yu (2021) The Long Shadow of Informality: Challenges and Policies, World Bank, Washington, DC
Okraszewska, R., A. Romanowska, M. Wołek, J. Oskarbski, K. Birr and K. Jamroz (2018) ‘Integration of a multilevel transport system model into sustainable urban mobility planning’, Sustainability 10(2): 479
Olajide, O. A., M. E. Agunbiade and H. B. Bishi (2018)
‘The realities of Lagos urban development vision on livelihoods of the urban poor’, Journal of Urban Management 7(1): 21-31
Olazabal, M., E. Chu, V. C. Broto and J. Patterson (2021) ‘Subaltern forms of knowledge are required to boost local adaptation’, One Earth 4(6): 828-838
Oliveira e Costa, S., J. Aaltonen and M. Rusanen (2018) ‘Making the most of brownfield sites in the Baltic Sea Region: Baltic Urban Lab has identified new ways to improve planning processes through public-private-people partnerships–the 4P approach’, Nordregio #6 Policy brief, https:// www.diva-portal.org/smash/get/diva2:1254946/ FULLTEXT01.pdf, last accessed 2 March 2022
Oliver, P. (2016) Green Bonds for Cities: A Strategic Guide for City-level Policymakers in Devel oping Countries, Climate Policy Initiative, https://climatepolicyinitiative.org/wp-content/ uploads/2016/12/Green-Bonds-for-Cities-A-Stra tegic-Guide-for-City-level-Policymakers-in-Devel oping-Countries.pdf, last accessed 2 March 2022
Olsson, L., A. Jerneck, H. Thoren, J. Persson and D. O’Byrne (2015) ‘Why resilience is unappealing to social science: Theoretical and empirical investigations of the scientific use of resilience’, Science Advances 1(4): e1400217
ONS (2021) Coronavirus (COVID-19) Related Deaths by Occupation, England and Wales: Deaths Registered Between 9 March and 28 December 2020,
Office for National Statistics, United Kingdom, https://www.ons.gov.uk/peoplepopulationandcommunity/healthandsocialcare/causesofdeath/ bulletins/coronaviruscovid19relateddeathsbyoccupationenglandandwales/deathsregisteredbetween9marchand28december2020, last accessed 8 November 2021
Onyanta, A. (2016) ‘Cities, municipal solid waste management, and climate change: Perspectives from the South’, Geography Compass 10(12): 499-513
Open Contracting Partnership (2022) ‘Open Contracting Partnership’, https://www.opencontracting.org, last accessed 8 May 2022
Open Data Charter (2022) ‘ODC’, http://www.opendatacharter.net, last accessed 8 May 2022
Open Government Partnership (2020) OGP at Ten: Toward Democratic Renewal, https://www.opengovpartnership.org/ogp-at-ten-toward-democraticrenewal, last accessed 25 February 2022
Open Government Partnership (2022) ‘OGP local’, https://www.opengovpartnership.org/ogp-local, last accessed 8 May 2022
Open North (2021) Digital Data Partnerships: Building the Foundation for Collaborative Data Governance in the Public Interest, https://assets. ctfassets.net/e4wa7sgik5wa/62KQJwk6iQe6W6A AyNx4jF/b51bc8f1d04bd78694bff59dc12d700a/ Digital_Data_Partnerships_Summary-EN.pdf, last accessed 25 February 2022
Open North (2022) Open Smart Communities in Practice: How Communities Across Canada are Reaching their Goals and Overcoming Challenges Using Data and Technology, https://opennorth. ca/publications/2sfzzrop6sz7k5wpjars8p_en, last accessed 25 February 2022
Ortiz E., S. and B. Gutiérrez Valdivia (2015) ‘Planning from below: Using feminist participatory methods to increase women’s participation in urban planning’, Gender & Development 23(1): 113-126
Ortiz-Moya, F. (2020) ‘Green growth strategies in a shrinking city: Tackling urban revitalization through environmental justice in Kitakyushu City, Japan’, Journal of Urban Affairs 42(3): 312332, DOI: 10.1080/07352166.2018.1448225, last accessed 6 April 2022
Østby, G. (2016) ‘Rural–urban migration, inequality and urban social disorder: Evidence from African and Asian cities’, Conflict Management and Peace Science 33(5): 491-515
Oteros-Rozas, E., B. Martín-López, T. M. Daw, E. L. Bohensky, J. R. A. Butler, R. Hill, J. MartinOrtega, A. Quinlan, F. Ravera, I. Ruiz-Mallén, M. Thyresson, J. Mistry, I. Palomo, G. D. Peterson, T. Plieninger, K. A. Waylen, D. M. Beach, I. C. Bohnet, M. Hamann, J. Hanspach, K. Hubacek, S. Lavorel and S. P. Vilardy (2015) ‘Participatory scenario planning in place-based social-ecological research: insights and experiences from 23 case studies’, Ecology and Society 20(4)
Otioma, C., A. M. Madureira and J. Martinez (2019) ‘Spatial analysis of urban digital divide in Kigali, Rwanda’, GeoJournal 84(3): 719-741
Owen, R., J. Stilgoe, P. Macnaghten, M. Gorman, E. Fisher, D. Guston and J. Bessant (2013) ‘A framework for responsible innovation’, in R. Owen, J. R. Bessant and M. Heintz (eds) Responsible Innovation: Managing the Responsible Emergence of Science and Innovation in Society, Wiley, London, pp. 27–50
Oxfam International (2021) ‘Brazil: Extreme inequality in numbers’, https://www.oxfam. org/en/brazil-extreme-inequality-numbers, last accessed 27 April 2022
Pagano, M. A. and C. K. McFarland (2020) ‘When will your city feel the fiscal impact of COVID-19?’, The Avenue, 31 March, https://www.brookings. edu/blog/the-avenue/2020/03/ 31/when-willyour-city-feel-the-fiscal-impact-of-covid-19, last accessed 27 February 2022
Page, J., J. Gutman, P. Madden and D. Gandhi (2020) Urban Economic Growth in Africa - A Framework
for Analysing Constraints to Agglomeration, Working Paper 24, Africa Growth Initiative at Brookings, Washington, DC, https://www.brookings.edu/wp-content/uploads/2020/09/20.09.28_ urban_economic_growth_in_africa_FINAL.pdf, last accessed 3 May 2022
Paköz, M. Z., C. Sözer, and A. Do an (2021) ‘Changing perceptions and usage of public and pseudo-public spaces in the post-pandemic city: The case of Istanbul’, URBAN DESIGN International, 27: 64–79
Paller, J. W. (2021) ‘Everyday politics and sustainable urban development in the Global South’, Area Development and Policy 6(3): 319-336
Pan, H., X. Lu and K. Lei (2017) ‘A comprehensive analysis of heavy metals in urban road dust of Xi’an, China: contamination, source apportionment and spatial distribution’, Science of the Total Environment 609: 1361-1369
Park, S., J. E. Mosley and C. M. Grogan (2018) ‘Do residents of low-income communities trust organizations to speak on their behalf? Differences by organizational type’, Urban Affairs Review 54(1): 137-164
Parnell, S. (2016) ‘Defining a global urban development agenda’, World Development 78: 529–540
Parnell, S. (2020) ‘The enabling conditions of postpandemic city government’, Environment and Planning B: Urban Analytics and City Science 47(7): 1143-1145
Parris, K. M., M. Amati, S. A. Bekessy, D. Dagenais, O. Fryd, A. K. Hahs, D. Hes, S. J. Imberger, S. J. Livesley, A. J. Marshall, J. R. Rhodes, C. G. Threlfall, R. Tingley, R. van der Ree, C. J. Walsh, M. L. Wilkerson and N. S. G. Williams (2018) ‘The seven lamps of planning for biodiversity in the city’, Cities 83: 44-53
Pase, F., F. Chiariotti, A. Zanella and M. Zorzi (2020) ‘Bike sharing and urban mobility in a post-pandemic world’, IEEE Access 8: 187291–187306
Pateman, R., H. Tuhkanen and S. Cinderby (2021) ‘Citizen science and the sustainable development goals in low and middle income country cities’, Sustainability 13(17): 9534
Patterson, J., N. Soininen, M. Collier and C. M. Raymond (2021) ‘Finding feasible action towards urban trans formations’, NPJ Urban Sustainability 1(1): 28
Patz, J. A. and J. G. Siri (2021) ‘Toward urban planetary health solutions to climate change and other modern crises’, Journal of Urban Health 98(3): 311-314
Pauleit, S., A. Vasquéz, S. Maruthaveeran, L. Liu and S. S. Cilliers (2021) ‘Urban green infrastructure in the global South’, in C. M. Shackleton, S. S. Cilliers, E, Davoren and M. J. du Toit (eds) Urban Ecology of the Global South, Cities and Nature. Springer, Switzer land, pp. 403-431
Pearsall, H. and I. Anguelovski (2016) ‘Contesting and resisting environmental gentrification: Responses to new paradoxes and challenges for urban environmental justice’, Sociological Research Online 21(3): 121-127
Pellow, D. N. (2016) ‘Toward a critical environmental justice studies: black lives matter as an environmental justice challenge’, Du Bois Review: Social Science Research on Race 13(2): 221-236
Pérez-Roman, E., M. Alvarado and M. Barrett (2020) ‘Personalizing healthcare in smart cities’ in S. McClellan (ed) Smart Cities in Application, Springer, Switzerland
Perng, S. (2019) ‘Anticipating digital futures: Ruins, entanglements and the possibilities of shared technology making’, Mobilities 14(4): 418-434
Perrings, C., S. Baumgärtner, W. A. Brock, K. Chopra, M. Conte, C. Costello, A. Duraiappah, A. P. Kinzig, U. Pascual, S. Polasky, J. Tschirhart and A. Xepapadeas (2009) ‘The economics of biodiversity and ecosystem services’, in S. Naeem, D. E. Bunker, A. Hector, M. Loreau and C. Perrings (eds) Biodiversity, Ecosystem, Functioning, And Human Well-Being : An Ecological and Economic Perspective, Oxford University Press, United
Kingdom, pp: 230-247 Perry, B. and B. Russell (2020) ‘Participatory cities from the “outside in”: The value of comparative learning’, in D. Simon, H. Palmer and J. Riise (eds) Comparative Urban Research from Theory to Practice; Co-production for Sustainability, Policy Press, Bristol, pp. 133-154
Perry, B. and M. Atherton (2017) ‘Beyond critique: The value of co-production in realising just cities?’ Local Environment 22(sup1): 36-51
Perry, B. G., Z. Patel, Y. Norén Bretzer and M. Polk (2018) ‘Organising for co-production: Local interaction platforms for urban sustainability’, Politics and Governance 6(1)
Peters, A. (2020) ‘Here are 11 more cities that have joined the car-free revolution’, https://www. fastcompany.com/90456075/here-are-11-moreneighborhoods-that-have-joined-the-car-freerevolution, last accessed 22 May 2022
Petitjean, O. and S. Kishimoto (2017) ‘Cities and citizens are writing the future of public services’, in Dumontier, M. and Doherty, A. (eds), Reclaiming Public Services: How Cities and Citizens are Turning Back Privatization, Transnational Institute, Amsterdam, pp. 157-177
Pieterse, E. (2019) ‘Urban governance and spatial transformation ambitions in Johannesburg’, Journal of Urban Affairs 42(1):20-38
Pieterse, M. (2021) ‘Balancing socio-economic rights: Confronting COVID-19 in South Africa’s informal urban settlements’, Nordic Journal of Human Rights 39(1): 33-50
Pimm, S. L., I. Donohue, J. M. Montoya and M. Loreau (2019) ‘Measuring resilience is essential to understand it’, Nature Sustainability 2(10): 895–897
Pineo, H. (2020) ‘Towards healthy urbanism: Inclusive, equitable and sustainable (THRIVES)–an urban design and planning framework from theory to praxis’, Cities & Health 1-19
Pitts, A. J. (2017) ‘Decolonial praxis and epistemic injustice’, in I. J. Kidd, J. Medina, G. Pohlhaus and Jr (eds) The Routledge Handbook of Epistemic Injustice, First Edition, Routledge, United Kingdom, pp. 149-157
Pløger, J. (2004) ‘Strife: Urban planning and agonism’, Planning Theory 3(1): 71-92
Plowright, R., J. Reaser, H. Locke, S. J. Woodley, J. A. Patz, D. Becker, G. Oppler, P. Hudson and G.M Tabor (2020) ‘A call to action: Understanding land use-induced zoonotic spillover to protect environmental, animal, and human health’, EcoEvoRxiv, 26 September, https://ecoevorxiv. org/cru9w/, last accessed 22 March 2022
Pomeroy, R. (2022) ‘How the Ukraine war is driving up food and energy prices for the world’, https:// www.weforum.org/agenda/2022/03/ukraineenergy-and-food-radio-davos/, last accessed 04 May 2022
Pomponi, F., J. Hart, J. H. Arehart and B. D’Amico (2020) ‘Buildings as a global carbon sink? A reality check on feasibility limits’, One Earth 3(2): 157-161
Pomponi, F., R. Saint, J. H. Arehart, N. Gharavi and B. D’Amico (2021) ‘Decoupling density from tallness in analysing the life cycle greenhouse gas emissions of cities’, npj Urban Sustainability 1: 33
Popkin, B. M., C. Corvalan and L. M. GrummerStrawn (2020) ‘Dynamics of the double burden of malnutrition and the changing nutrition reality’, The Lancet 395(10217): 65-74
Porst, L. and P. Sakdapolrak (2018) ‘Advancing adaptation or producing precarity? The role of ruralurban migration and translocal embeddedness in navigating household resilience in Thailand’, Geoforum 97: 35-45
Porter, L. and J. Barry (2015) ‘Bounded recognition: urban planning and the textual mediation of Indigenous rights in Canada and Australia’, Critical Policy Studies 9(1): 22-40
Prasad, D., T. Alizadeh and R. Dowling (2021) ‘Multiscalar Smart City Governance in India’, Geo-
forum 121:173-180
Prefeitura do Município de São Paulo (2021) PlanClimaSP: Plano de ação climática do município de São Paulo 2020–2050, São Paulo Municipality Climate Action Plan 2020–2050, https://www. prefeitura.sp.gov.br/cidade/secretarias/upload/ meio_ambiente/ arquivos/PlanClimaSP_BaixaResolucao.pdf, last accessed 19 March 2022
Pulido, L. (2020) ‘Racism and the anthropocene’, in G. Mitman, M. Armiero and R. S. Emmet (eds) Future Remains - A Cabinet of Curiosities for the Anthropocene, University of Chicago Press, United States, pp. 116-128
Puttkamer, L. (2020) ‘How can we make our cities more resilient to pandemics?’, parCitypatory, 25 April, https://parcitypatory.org/2020/04/25/ urban-resilience-pandemics, last accessed 23 April 2022
Pye, S., F. G. N. Li, J. Price and B. Fais (2017)
‘Achieving net-zero emissions through the reframing of UK national targets in the post-Paris Agreement era’, Nature Energy 2(3): 1-7
Qiu, R. (2019) ‘How Singapore is retraining workers for a more automated workplace’, Axios, 7 March, https://www.axios.com/how-singapore-isretraining-workers-for-a-more-automated-work place-0d31856b-39e5-4159-8a59-9b3ee02e7419. html, last accessed 8 November 2021
Quian, Y, W. Zhou, W. Yu and S. T. A. Pickett (2015) ‘Quantifying spatiotemporal pattern of urban greenspace: New insights from high resolution data’, Landscape Ecology 30 (7): 1165-1173
Quinio, V. and G. Rodrigues (2021) Net Zero: Decarbonising the City, Centre for Cities and HSBC, London
Rachmawati, R., U. Choirunnisa, Z. A. Pambagyo, Y. A. Syarafina and R. A. Ghiffari (2021) ‘Work from home and the use of ICT during the COVID-19 pandemic in Indonesia and its impact on cities in the future’, Sustainability 13(12): 6760
Rajagopal, B., M. Lawlor, C. Jimenez-Damary, F. de Varennes, P. Arrojo-Agudo, O. De Schutter and K. Boly Barry (2021) ‘India must halt mass eviction that threatens to leave 100,000 homeless’, United Nations Human Rights Office of the High Commissioner, https://www. ohchr.org/en/NewsEvents/Pages/DisplayNews. aspx?NewsID=27317andLangID=E, last accessed 22 march 2022
Ramaswami, A., K. Tong, A. Fang, R. M. Lal, A. S. Nagpure, Y. Li, H. Yu, D. Jiang, A. G. Russell, L. Shi, M. Chertow, Y. Wang and S. Wang (2017) ‘Urban cross-sector actions for carbon mitigation with local health co-benefits in China’, Nature Climate Change 7(10): 736-742
Ramaswami, A., K. Tong, J. G. Canadell, R. B. Jackson, E. K. Stokes, S. Dhakal, M. Finch, P. Jittrapirom, N. Singh, Y. Yamagata, E. Yewdall, L. Yona and K. C. Seto (2021) ‘Carbon analytics for net-zero emissions sustainable cities’, Nature Sustainability 4(6): 460-463
Ramirez-Rubio, O., C. Daher, G. Fanjul, M. Gascon, N. Mueller, L. Pajín, A. Plasencia, D. Rojas-Rueda, M. Thondoo and M. J. Nieuwenhuijsen (2019) ‘Urban health: An example of a “health in all policies” approach in the context of SDGs implementation’, Globalization and Health 15(1): 1-21
Randrup, T. B., A. Buijs, C. C. Konijnendijk and T. Wild (2020) ‘Moving beyond the nature-based solutions discourse: Introducing nature-based thinking’, Urban Ecosystems 23(4): 919-926
Rashidi, K. and A. Patt (2018) ‘Subsistence over symbolism: The role of transnational municipal networks on cities’ climate policy innovation and adoption’, Mitigation and Adaptation Strategies for Global Change 23(4): 507-523
Ratté, S., C. Excell and L. Williams (2014) ‘Crossing the digital divide to protect the environment’, https://www.wri.org/insights/crossing-digitaldivide-protect-environment, last accessed 13 October 2021
Raven, J., B. Stone, G. Mills, J. Towers, L. Katzschner, M. F. Leone, P. Gaborit, M. Georgescu, M.
Hariri, J. Lee, J. LeJava, A. Sharifi, C. Visconti and A. Rudd (2018) ‘Urban planning and urban design’, in C. Rosenzweig, W. D. Solecki, P. Romero-Lankao, S. Mehrotra, S. Dhakal and S. A. Ibrahim (eds) Climate Change and Cities: Second Assessment Report of the Urban Climate Change Research Network, Cambridge University Press, Cambridge, pp. 139-172
Ravenelle, A. J., K. C. Kowalski and E. Janko (2021) ‘The side hustle safety net: Precarious workers and gig work during COVID-19’, Sociological Perspectives 64(5): 898-919
Ravetz, J., A. Neuvonen and R. Mäntysalo (2021) ‘The new normative: Synergistic scenario planning for carbon-neutral cities and regions’, Regional Studies 55(1): 150-163
Rayner, T., S. Oberthür and L. Hermwille (2021) ‘A sectoral perspective on international climate governance: Key findings and research priorities’, Earth System Governance 8: 100105
Razavi, S., C. Behrendt, M. Bierbaum, I. Orton and L. Tessier (2020) ‘Reinvigorating the social contract and strengthening social cohesion: Social protection responses to COVID 19’, International Social Security Review 73(3): 55-80
RCN and ARUP (2021) Distributed Renewable Energy: A Pathway for Resilient Recovery in Cities, Resilient Cities Network (RCN) and Arup Group, https://www.arup.com/perspectives/publications/ promotional-materials/section/distributed-renewable-energy-a-pathway-for-resilient-recovery-incities, last accessed 11 May 2022
RECIPES (2020) Precaution and Innovation: Exploring Collaboratively a Significant Relationship, Reconciling Science, Innovation and Precaution through the Engagement of Stakeholders (RECIPES), https://recipes-project.eu/sites/ default/files/2020-03/PolicyBrief_Recipes_ Online20200320_01.pdf, last accessed 25 October 2021
Reckien, D., F. Creutzig, B. Fernandez, S. Lwasa, M. Tovar-Restrepo, D. McEvoy and D. Satterthwaite (2017) ‘Climate change, equity and the Sustainable Development Goals: An urban perspective’, Environment and Urbanization 29(1): 159-182
Reckien, D., M. Salvia, O. Heidrich, J. M. Church, F. Pietrapertosa, S. De Gregorio-Hurtado, V. D’Alonzo, A. Foley, S. G. Simoes, E. K. Lorencová, H. Orru, K. Orru, A. Wejs, J. Flacke, M. Olazabal, D. Genelleti, E. Feliu, S. Vasilie, C. Nador, A. Krook-Riekkola, M. Matosovic, P. A. Fokaides, B. I. Ioannou, A. Flamos, N. Spyridaki, M. V. Balzan, O. Fülöp, I. Paspaldzhiev, S. Grafakos and R. Dawson (2018) ‘How are cities planning to respond to climate change? Assessment of local climate plans from 885 cities in the EU-28’, Journal of Cleaner Production 191: 207-219
Reckien, D., S. Lwasa, D. Satterthwaite, D. McEvoy, F. Creutzig, M. Montgomery, D. Schensul, D. Balk, I. A. Khan, B. Fernandez, D. Brown, J. C. Osorio, M. Tovar-Restrepo, A. de Sherbinin, W. Feringa, A. Sverdlik, E. Porio, A. Nair, S. McCormick and E. Bautista (2018) ‘Equity, environmental justice, and urban climate change’, in C. Rosenzweig, W. D. Solecki, P. Romero-Lankao, S. Mehrotra, S. Dhakal, and S. A. Ibrahim (eds) Climate Change and Cities: Second Assessment Report of the Urban Climate Change Research Network, Cambridge University Press, Cambridge, pp. 173-224
Rémillard-Boilard, S., T. Buffel and C. Phillipson (2021) ‘Developing age-friendly cities and communities: Eleven case studies from around the world’, International Journal of Environmental Research and Public Health 18(1): 133
Repette, P., J. Sabatini-Marques, T. Yigitcanlar, D. Sell and E. Costa (2021) ‘The evolution of city-as-aplatform: Smart urban development governance with collective knowledge-based platform urbanism’, Land 10(1): 33
Restrepo-Mieth, A. (2021) ‘Examining the dynamics between formal and informal institutions in progressive city planning’, Urban Affairs Review
Reuschke, D. and C. Ekinsmyth (2021) ‘New spatiali-
ties of work in the city’, Urban Studies 58(11): 2177–2187
Reuters (2021) ‘Factbox: Uber’s legal challenges around the world’, Reuters, 19 February, https:// www.reuters.com/article/us-uber-britain-factboxidUSKBN2AJ1N7, last accessed 8 November 2021
Revi, A., D. Satterthwaite, F. Aragón-Durand, J. Corfee-Morlot, R. B. Kiunsi, M. Pelling, D. Roberts, W. Solecki, S. P. Gajjar and A. Sverdlik (2014) ‘Towards transformative adaptation in cities: The IPCC’s Fifth Assessment’, Environment and Urbanization 26(1): 11-28
Rhodes, C. J. (2017) ‘The imperative for regenerative agriculture’, Science Progress 100(1): 80-129
Riahi, K., E. Kriegler, N. Johnson, C. Bertram, M. den Elzen, J. Eom, M. Schaeffer, J. Edmonds, M. Isaac, V. Krey, T. Longden, G. Luderer, A. Méjean, D. L. McCollum, S. Mima, H. Turton, D. P. van Vuuren, K. Wada, V. Bosetti, P. Capros, P. Criqui, M. Hamdi-Cherif, M. Kainuma, and O. Edenhofer (2015) ‘Locked into Copenhagen pledges—implications of short-term emission targets for the cost and feasibility of long-term climate goals’, Technological Forecasting and Social Change 90: 8-23
Rice, J. L., D. A. Cohen, J. Long and J. R. Jurjevich (2020) ‘Contradictions of the climate friendly city: New perspectives on eco gentrification and housing justice’, International Journal of Urban and Regional Research 44(1): 145-165
Richmond MakerLabs (2022) https://richmondmakerlabs.uk, last accessed 20 May 2022
Richmond, A., I. Myers and H. Namuli (2018) ‘Urban informality and vulnerability: A case study in Kampala, Uganda’, Urban Science 2(1): 22 Rigon, A. and V. Castán Broto (eds) (2021) Inclusive Urban Development in the Global South: Intersectionality, Inequalities, and Community, Routledge, New York and London
Rivera-Córdova, A. (2021) ‘Relación densidad y pobreza con casos confirmados por Coronavirus en la región metropolitana’, Revista Médica Clínica Las Condes 32(1): 81–89
RNSF (Research, Network and Support Facility)(2017) Extending Coverage: Social Protection and the Informal Economy. Experiences and Ideas from Researchers and Practitioners, Research, Network and Support Facility, ARS Progetti, Rome; Lattanzio Advisory, Milan and AGRER, Brussels Roberts, B. H. (2014) Managing Systems of Secondary Cities: Policy Responses in International Development, Cities Alliance/UNOPS, Brussels Roberts, D. (2018) ‘Clean energy technologies threaten to overwhelm the grid. Here’s how it can adapt’, Vox, 30 November, https://www.vox.com/energy-and-environment/2018/11/30/17868620/renewable-energypower-grid-architecture, last accessed 11May 2022
Robin, E. and V. Castán Broto (2021) ‘Towards a postcolonial perspective on climate urbanism’, International Journal of Urban and Regional Research 45(5): 869-878
Robinson, C. J., K. Maclean, R. Hill, E. Bock and P. Rist (2016) ‘Participatory mapping to negotiate indigenous knowledge used to assess environmental risk’, Sustainability Science 11(1): 115-126
Rockefeller Foundation and Arup (2018) ‘City Resilience Index: 52 Indicators’, City Resilience Index, https://www.cityresilienceindex.org, last accessed 11 May 2022
Rodgers, S. and S. Moore (2018) ‘Platform urbanism: An introduction’, Mediapolis 3(4), https:// www.mediapolisjournal.com/2018/10/platformurbanism-an-introduction, last accessed 20 May 2022
Rodriguez-Pose, A. and A. Bwire (2004) ‘The economic (in)efficiency of devolution’, Environment and Planning 36(11):1907-1928
Roe, J., P. A. Aspinall and C. Ward Thompson (2016) ‘Understanding relationships between health, ethnicity, place and the role of urban green space
in deprived urban communities’, International Journal of Environmental Research and Public Health 13(7): 681
Rogers, A., J. Raymer and F. Willekens (2002) ‘Capturing the age and spatial structures of migration’, Environment and Planning A: Economy and Space 34(2): 341-359, https://doi.org/10.1068/ a33226, last accessed 6 April 2022
Roland Berger (2021) ‘Green tech industry remains on course for growth’, https://www.rolandberger. com/en/Insights/Publications/Green-techindustry-remains-on-course-for-growth.html, last accessed 8 November 2021
Romanello, M., A. McGushin, C. Di Napoli, P. Drummond, N. Hughes, L. Jamart, H. Kennard, P. Lampard, B. S. Rodriguez, N. Arnell and S. AyebKarlsson (2021) ‘The 2021 report of the Lancet Countdown on health and climate change: code red for a healthy future’, The Lancet 398(10311): 1619-1662
Romero-Díaz, A., J. D. Ruiz-Sinoga, F. RobledanoAymerich, E. C. Brevik and A. Cerdà (2017) ‘Ecosystem responses to land abandonment in Western Mediterranean Mountains’, Catena 149: 824-835
Romero-Lankao, P., N. Frantzeskaki and C. Griffith (2018) ‘Sustainability transformation emerging from better governance’, in T. Elmqvist, X. Bai, N. Frantzeskaki, C. Griffith, D. Maddox, T. McPhearson, S. Parnell, P. Romero-Lankao, D. Simon and M. Watkins (eds) Urban Planet, Cambridge University Press, Cambridge, pp263-280
Romero-Lankao, P., S. Burch, S. Hughes, K. Auty, A. Aylett, K. Krellenberg, R. Nakano, D. Simon and G. Ziervogel (2018) ‘Governance and policy’, in C. Rosenzweig, W.D. Solecki, P. Romero-Lankao, S. Mehrotra, S. Dhakal, and S.A. Ibrahim (eds) Climate Change and Cities: Second Assessment Report of the Urban Climate Change Research Network. Cambridge University Press, Cambridge, pp585-606
Roome, J. (2016) ‘The digital divide: A challenge to overcome in tackling climate change’, World Bank Blogs, 14 January, https://blogs.worldbank. org/climatechange/digital-divide-challengeovercome-tackling-climate-change, last accessed 13 October 2021
Rosa-Aquino, P. (2019) ‘5 ways we need to adapt to climate change – or pay the price’, Grist, 10 September, https://grist.org/article/5-ways-we-needto-adapt-to-climate-change-or-pay-the-price/, last accessed 13 May 2022
Rose, J. and A. Omolo (2013) ‘Six case studies of local participation in Kenya’, Worldbank https://openknowledge.worldbank.org/ handle/10986/17556?locale-attribute=es, last accessed 22 march 2022
Rosenthal, S. and W. Strange (2020) ‘How close is close? The spatial reach of agglomeration economies’, Journal of Economic Perspectives 34(3): 27-49
Rosenzweig, C., W.D. Solecki, P. Romero-Lankao, S. Mehrotra, S. Dhakal and S.A. Ibrahim (2018) Climate Change and Cities: Second Assessment Report of the Urban Climate Change Research Network, Cambridge University Press, Cambridge
Rosner, D. K., S. Lindtner, I. Erickson, L. Forlano, S. Jackson and B. Kolko (2014) ‘Making cultures: Building things & building communities’, Proceedings of the Companion Publication of the 17th ACM Conference on Computer Supported Cooperative Work & Social Computing, 113–116
Rossello, S. and P. Dewitte (2020) ‘Anonymization by Decentralization: The case of Covid-19 contact-tracing apps’, European Law Blog, 25 May, https://europeanlawblog.eu/2020/05/25/ anonymization-by-decentralization-the-case-ofcovid-19-contact-tracing-apps, last accessed 25 February 2022
Ruiz-Campillo, X., V. Castán Broto and L. Westman (2021) ‘Motivations and intended outcomes in local governments’ declarations of climate emer-
gency’, Politics and Governance 9(2): 17-28
Rupprecht Consult (2019) Guidelines for Developing and Implementing a Sustainable Urban Mobility Plan, Second Edition, https://www.eltis.org/sites/ default/files/sump-guidelines-2019_mediumres. pdf, last accessed 19 April 2022
Ryan, M. and A. Gregory (2019) ‘Ethics of using smart city AI and big data: The case of four large European cities’, The ORBIT Journal 2(2): 1-36
Sachs, J. D., C. Kroll, G. Lafortune, G. Fuller and F. Woelm (2021) Sustainable Development Report 2021: The Decade of Action for the Sustainable Development Goals, Cambridge University Press, Cambridge
Sachs, J. D., G. Schmidt-Traub, M. Mazzucato, D. Messner, N. Nakicenovic and J. Rockström, (2019) ‘Six transformations to achieve the Sustainable Development Goals’, Nature Sustainability 2(9): 805–814
Sadowski, J. (2020) ‘Cyberspace and cityscapes: On the emergence of platform urbanism’, Urban Geography 41(3): 448-452
Saint, G. (2021) ‘Life after the pandemic: What is the “next normal” for mobility?’, Kantar, 5 May, https://www.kantar.com/north-america/inspiration/mobility/life-after-the-pandemic-the-nextnormal-for-mobility, last accessed 3 March 2022
Saint, R. and F. Pomponi (2021) ‘Cities and climate change: Why low-rise buildings are the future –not skyscrapers’, The Conversation, 27 October, https://theconversation.com/cities-and-climatechange-why-low-rise-buildings-are-the-future-notskyscrapers-170673, last accessed 6 June 2022
Saldarriaga, N., K. K. Shrestha, P. McManus and A. Bajracharya (2020) ‘Greening Sydney: Attitudes, barriers and opportunities for tree planting’, Australian Geographer 51(4): 469-488
Salem, J. (2021) ‘Are we destined for a dystopian tech-future?’, SCIplanet, https://www.bibalex. org/SCIplanet/en/Article/Details.aspx?id=13696, last accessed 25 February 2022
Sallis, J. F. and K. Glanz (2009) ‘Physical activity and food environments: Solutions to the obesity epidemic’, Milbank Quarterly 87(1): 123–154
Sallis, J. F., E. Cerin, J. Kerr, M. A. Adams, T. Sugiyama, L. B. Christiansen, J. Schipperijn, R. Davey, D. Salvo, L. D. Frank, I. de Bourdeaudhuij and N. Owen (2020) ‘Built environment, physical activity, and obesity: Findings from the International Physical Activity and Environment Network (IPEN) adult study’, Annual Review of Public Health 41(1): 119–139
Samarakoon, S., P. Munro, C. Zalengera and M. Kearnes (2022) ‘The after-lives of off-grid solar: The dynamics of repair and e-waste in Malawi’, Environmental Innovation and Societal Transitions 42: 317-330
Samet, J. M. (2019) ‘Pollution’, in S. Galea, C. K. Ettman and D. Vlahov (eds) Urban Health, Oxford University Press, New York, pp. 112-128 Sánchez-Ancochea, D. (2020) The Costs of Inequality in Latin America: Lessons and Warnings for the Rest of the World, Bloomsbury Publishing Sanchez-Guevara, C., M. N. Peiró, J. Taylor, A. Mavrogianni and J. N. González (2019) ‘Assessing population vulnerability towards summer energy poverty: Case studies of Madrid and London’, Energy and Buildings 190: 132-143
Sanchez-Paramo, C. (2020) COVID-19 will hit the poor hardest. Here’s what we can do about it’, World Bank Blogs, 23 April, https://blogs.worldbank.org/ voices/covid-19-will-hit-poor-hardest-heres-whatwe-can-do-about-it, last accessed 6 June 2022
Santamouris, M. (2014) ‘Cooling the cities – A review of reflective and green roof mitigation technologies to fight heat island and improve comfort in urban environments’, Solar Energy 103: 682–703
Sapra, I. and B. P. Nayak (2021) ‘The protracted exodus of migrants from Hyderabad in the time of COVID-19’, Journal of Social and Economic Development 23(Suppl 2): 398–413
Satorras, M., I. Ruiz-Mallén, A. Monterde and H.
March (2020) ‘Co-production of urban climate planning: Insights from the Barcelona Climate Plan’, Cities 106: 102887
Satterthwaite, D. and S. Bartlett (2017) ‘The full spectrum of risk in urban centres: Changing perceptions, changing priorities’, Environment and Urbanization 29(1): 3-14
Satterthwaite, D., A. Sverdlik and D. Brown (2019) ‘Revealing and responding to multiple health risks in informal settlements in Sub-Saharan African cities’, Journal of Urban Health 96(1): 112-122
Satterthwaite, D., D. Archer, S. Colenbrander, D. Dodman, J. Hardoy, D. Mitlin and S. Patel (2020) ‘Building resilience to climate change in informal settlements’, One Earth 2(2): 143-156
Satterthwaithe, D. (2021) ‘Definitions matter – part one’, International Institute for Environment and Development Blog, 10 October, https://www.iied. org/definitions-matter-part-one, last accessed 13 May 2022
Schell, R. and D. Kaufman (2017) ‘Community building among older adults in a digital game environment’, Proceedings of the 9th International Conference on Computer Supported Education (CSEDU), SCITEPRESS – Science and Technology Publications, Portugal
Schinnerl, M. and D. Greiling (2019) ‘Urban poverty in Europe – poverty reduction policies and measures’, Review of Applied Socio-Economic Research 18(2): 118-128.
Schipper, E. L. F., S. E. Eriksen, L. R. F. Carril, B. C. Glavovic and Z. Shawoo (2021) ‘Turbulent transformation: Abrupt societal disruption and climate resilient development’, Climate and Development 13(6): 467-474
Schlaufer, C. (2021) ‘Why do nondemocratic regimes promote e participation? The case of Moscow’s active citizen online voting platform’, Governance, 34(3), 821-836
Schot, J., L. Kanger and G. Verbong (2016) ‘The roles of users in shaping transitions to new energy systems’, Nature Energy 1(5): 1-7
Schotte, S. and Zizzamia, R. (March 2021) The Livelihood Impacts Of COVID-19 In Urban South Africa: A View from Below, WIDER Working Paper 2021/56, UNU-Wider, Finland, https:// www.wider.unu.edu/sites/default/files/Publications/Working-paper/PDF/wp2021-56-livelihoodimpacts-COVID-19-urban-South-Africa.pdf, last accessed 4 May 2022
Schraven, D., S. Joss and M. de Jong (2021) ‘Past, present, future: Engagement with sustainable urban development through 35 city labels in the scientific literature 1990–2019’, Journal of Cleaner Production 292: 125924
Schulze, E. and E.Y. King (2021) ‘States, cities that expected to go bankrupt from pandemic now seeing cash surplus’, ABC News, 22 July, https://abcnews.go.com/US/states-citiesexpected-bankrupt-pandemic-now-cash-surplus/ story?id=78977318, last accessed 20 May 2022
Schwab, K., S. Zahidi and WEF (2020) The Global Competitiveness Report, Special Edition 2020: How Countries are Performing on the Road to Recovery, World Economic Forum, Cologny, https://www3.weforum.org/docs/WEF_TheGlobalCompetitivenessReport2020.pdf, last accessed 3 May 2022
Scott, D., H. Davies and M. New (eds) (2019) Mainstreaming Climate Change in Urban Development: Lessons from Cape Town, University of Cape Town Press, Cape Town
Scripps Institution of Oceanography, UC San Diego (2022) ‘The Keeling curve’, The Keeling Curve, https://keelingcurve.ucsd.edu/, last accessed 23 April 2022
Scruggs, G. (2021) ‘The Airbnb effect: Is a housing shortage inevitable?’, RICS Modus, 24 September, https://ww3.rics.org/uk/en/modus/builtenvironment/homes-and-communities/the-airbnbeffect--is-a-housing-shortage-inevitable-.html, last accessed 1 May 2022
SDI (2021) ‘Covid-19: Fostering community resilience amid the pandemic’, https://sdinet.org/2021/09/ covid-19-fostering-community-resilience-amidthe-pandemic/, last accessed 19 March 2022
SDI and Know Your City (2018) Know Your City: Slum Dwellers Count, SDI, Cape Town, https://sdinet. org/publication/know-city-slum-dwellers-count/, last accessed 11 May 2022
Seethaler-Wari, S. (2018) ‘Urban planning for the integration of refugees: The importance of local factors’, Urban Planning 3(4): 141-155
SEI, IISD, ODI, E3G, and UNEP (2021) The Production Gap Report, SEI, Stockholm, https://productiongap.org/wp-content/uploads/2021/10/ PGR2021_web.pdf, last accessed 23 April 2022
Serin, B (2019) ‘Inequality is being built into cities: Segregated playgrounds are just the start’, The Conversation, 8 May, https://theconversation. com/inequality-is-being-built-into-cities-segregated-playgrounds-are-just-the-start-115676, last accessed 5 May 2022
Seto, K. C., G. Churkina, A. Hsu, M. Keller, P. W. G. Newman, B. Qin and A. Ramaswami (2021) ‘From low-to net-zero carbon cities: The next global agenda’, Annual Review of Environment and Resources 46: 377-415, https://doi. org/10.1146/annurev-environ-050120-113117, last accessed 19 March 2022
Seto, K. C., S. Parnell, and T. Elmqvist (2013) ‘A global outlook on urbanization’, in T. Elmqvist, M. Fragkias, J. Goodness, B. Güneralp, P. J. Marcotullio, R. I. McDonald, S. Parnell, M. Schewenius, M. Sendstad, K. C. Seto and C. Wilkinson (eds) Urbanization, Biodiversity and Ecosystem Services: Challenges and Opportunities, Springer Dordrecht, Netherlands, pp. 1–12
Shaban, A. and Z. Aboli (2021) ‘Socio-spatial segregation and exclusion in Mumbai’, in M. van Ham, T. Tammaru, R. Ubarevi ien and H. Janssen (eds) Urban Socio-Economic Segregation and Income Inequality: A global perspective, Springer Cham, Switzerland
Shand, W. (2017) ‘Local level finance: Community-led Contributions to Delivering Urban Development’, Briefing, International Institute for Environment and Development, http://www. jstor.com/stable/resrep02635, last accessed 25 February 2022
Shand, W. and S. Colenbrander (2018) ‘Financing the inclusive city: The catalytic role of community savings’, Environment and Urbanization 30(1):175-190
Sharifi, A. (2016) ‘From garden city to eco-urbanism: the quest for sustainable neighborhood development’, Sustainable Cities and Society 20: 1–16
Sharifi, A. (2019) ‘Resilient urban forms: A macroscale analysis’, Cities 85: 1–14
Sharifi, A. (2021) ‘Co-benefits and synergies between urban climate change mitigation and adaptation measures: A literature review’, Science of The Total Environment 750: 141642
Sharifi, A. and A. Murayama (2013) ‘A critical review of seven selected neighborhood sustainability assessment tools’, Environmental Impact Assessment Review 38: 73–87
Sharifi, A. and A. R. Khavarian-Garmsir (2020a) ‘The COVID-19 pandemic: Impacts on cities and major lessons for urban planning, design, and manage ment’, Science of the Total Environment 749: 1-14
Sharifi, A. and A. R. Khavarian-Garmsir (2020b) ‘Urban resilience: Ten lessons from the COVID-19 pandemic’, HazNet, http: //haznet.ca/ urban-resilience-ten-lessons-covid-19-pandemic/, last accessed 6 May 2022
Sharifi, A., A. R. Khavarian-Garmsir and R. K. R. Kummitha (2021) ‘Contributions of smart city solutions and technologies to resilience against the COVID-19 pandemic: A literature review’, Sustainability 13(14): 8018
Sharifi, A., M. Pathak, C. Joshi and B. He (2021) ‘A systematic review of the health co-benefits of urban climate change adaptation’, Sustainable Cities and Society 74: 103190
Shaw, A., N. O’Brien, K. Flott, S. Leatherman, A. L. Neves and M. Durkin (2021) ‘The urgent need to identify and evaluate patient safety interventions in fragile, conflict-affected and vulnerable settings’, Journal of Global Health 11: 03082
Sheikh, F. A. and S. Bhaduri (2021) ‘Policy space for informal sector grassroots innovations: Towards a “bottom-up” narrative’, International Development Planning Review 43(1): 115-137
Sheller, M. (2018) Mobility Justice: The Politics of Movement in an Age of Extremes, Verso Books, New York and London
Shelton, T., M. Zook and A. Wiig (2015) ‘The “actually existing smart city”’, Cambridge Journal of Regions, Economy and Society 8(1): 13-25
Sheridan, D. (2018) SDI Energy Justice Programme: Progress Report, SDI, Cape Town, https://sdinet. org/wp-content/uploads/2018/02/SOLARREPORT-2018.pdf, last accessed 24 March 2022
Shi, L., E. Chu, I. Anguelovski, A. Aylett, J. Debats, K. Goh, T. Schenk, K. C. Seto, D. Dodman, D. Roberts, J. T. Roberts and S. D. VanDeveer (2016) ‘Roadmap towards justice in urban climate adaptation research’, Nature Climate Change 6: 131-137
Shokouhyar, S., S. Shokoohyar, A. Sobhani and A. J. Gorizi (2021) ‘Shared mobility in post-COVID era: New challenges and opportunities’, Sustainable Cities and Society 67: 102714
Shrestha, P., G. E. Small and A. Kay (2020) ‘Quantifying nutrient recovery efficiency and loss from compost-based urban agriculture’, PloS One 15(4): e0230996
Silva, P. (2016) ‘Tactical urbanism: Towards an evolutionary cities’ approach?’, Environment and Planning B: Planning and Design 43(6): 1040–1051
Silverman, R. M. (2018) ‘Rethinking shrinking cities: Peripheral dual cities have arrived’, Journal of Urban Affairs 42(3): 294-311, https://doi.org/10 .1080/07352166.2018.1448226, last accessed 3 April 2022
Simon D. (2016a) ‘The potential of the green economy in addressing urban environmental change’, in K.C. Seto, W.D. Solecki and C.A. Grif fith (eds) Handbook on Urbanization and Global Environmental Change, Routledge, London and New York, pp. 479-493
Simon, D. (2013) ‘Climate and environmental change and the potential for greening African cities’, Local Economy 28(2): 203-217
Simon, D. (2015) ‘The potential of the green economy and urban greening for addressing urban environmental change’, in K. C. Seto, W. D. Solecki and C. A. Griffith (eds) The Routledge Handbook of Urbanization and Global Environmental Change, Routledge, New York and London, pp. 455-469
Simon, D. (2016) ‘Green cities: From tokenism to incrementalism and transformation’, in D. Simon (ed) Rethinking Sustainable Cities: Accessible, Green and Fair, Policy Press, Bristol, pp. 61-105
Simon, D. (2021) ‘Co-productive tools for transcending the divide: Building urban–rural partnerships in the spirit of the New Leipzig Charter’, Land 10(9): 894
Simon, D. and W. Solecki (2018) ‘Box 1.2: Urban climate change transformation’, in C. Rosenzweig, W. Solecki, P. Romero-Lankao, S. Mehrotra, S. Dhakal and S. A. Ibrahim (eds) Climate Change and Cities: Second Assessment Report of the Urban Climate Change Research Network, Cambridge University Press, New York
Simon, D., A. Arano, M. Cammisa, B. Perry, S. Pettersson, J. Riise, S. Valencia, M. Oloko, T. Sharma, Y. Vora and W. Smit (2021) ‘Cities coping with COVID-19: Comparative perspectives’, City 25(1-2): 129-170
Simon, D., C. Griffith and H. Nagendra (2018) ‘Rethinking urban sustainability and resilience’, in T. Elmqvist, X. Bai, N. Frantzeskaki, C. Griffith, D. Maddox, T. McPhearson, S. Parnell, P. RomeroLankao, D. Simon and M. Watkins (eds) Urban Planet: Knowledge Towards Sustainable Cities, Cam bridge University Press, Cambridge, pp. 149-162
Simon, D., D. McGregor and K. Nsiah-Gyabaah (2004) ‘The changing urban-rural interface of African cities: Definitional issues and an application to Kumasi, Ghana’, Environment and Urbanization 16(2): 235-248
Simon, D., J. Goodness, J. Puppim de Oliviera, S. Lwasa, L. V. Macedo, J. Kavonic, E. Hermansson Török and T. Elmqvist, (2021) ‘Urban governance of and for urban green and blue infrastructure’, in C. M. Shackleton, S. S. Cilliers, E. Davoren and M. J. du Toit (eds) Urban Ecology of the Global South, Springer Cham, Switzerland, pp. 403-431
Simonofski, A., E. Hertoghe, M. Steegmans, M. Snoeck and Y. Wautelet (2021) ‘Engaging citizens in the smart city through participation platforms: A framework for public servants and developers’, Computers in Human Behavior 124: 106901
Singh, R. K., J. Pretty and S. Pilgrim (2010) ‘Traditional knowledge and biocultural diversity: Learning from tribal communities for sustainable development in northeast India’, Journal of Environmental Planning and Management 53(4): 511-533
Singh, R., X. Wang, J. C. Mendoza and E. K. Ackom (2015) ‘Electricity (in)accessibility to the urban poor in developing countries’, WIREs Energy and Environment 4(4): 339-353
Sisson, P. (2020a) ‘How the ‘15-Minute City’ could help post-pandemic recovery’, Bloomberg Asia Edition, 16 July, https://www.bloomberg.com/news/arti cles/2020-07-15/mayors-tout-the-15-minute-cityas-covid-recovery, last accessed 6 May 2022
Sisson, P. (2020b) ‘What is a 15-minute city?’, CityMonitor, 21 September, https://citymonitor. ai/environment/what-is-a-15-minute-city, last accessed 6 May 2022
Sitas, R. and B. Perry (2021) Whose Heritage Matters: Mapping, Making and Mobilising Cultural Heritage in Cape Town, Universty of Sheffield Print and Design, Sheffield
Slack, E. (2019) Metropolitan Governance Principles and Practice, Discussion Paper No. IDB-DP-659, Inter-American Development Bank, http:// dx.doi.org/10.18235/0001576, last accessed 25 February 2022
Smit, W., D. Simon, E. Durakovic, M. Dymitrow, G. Haysom, K. Hemström and J. Riise (2021) ‘The challenge of conflicting rationalities about urban development: Experiences from Mistra Urban Futures’ transdisciplinary urban research’, Trialog 137(2): 31-37.
Smith, J., S. E. Davies, H. Feng, C. C. R. Gan, K. A. Grépin, S. Harman, A. Herten-Crabb, R. Morgan, N. Vandan and C. Wenham (2021) ‘More than a public health crisis: A feminist political economic analysis of COVID-19’, Global Public Health 16(89): 1364-1380
Smith, K. R., S. Mehta and M. Maeusezahl-Feuz (2004) ‘Indoor air pollution from household use of solid fuels’, in M. Ezzati, A. D. Lopez and C. J. L. Murray (eds) Comparative Quantification of Health Risks: Global and Regional Burden of Disease Attributable to Selected Major Risk Factors, Volume 1, World Health Organization, Geneva, pp. 1435-1493
Smith, P., S. J. Davis, F. Creutzig, S. Fuss, J. Minx, B. Gabrielle, E. Kato, R. B. Jackson, A. Cowie, E. Kriegler, D. P. van Vuuren, J. Rogeli, P. Ciais, J. Milne, D. McCollum, G. Peters, R. Andrew, G. Shreshtha, P. Friedlingstein, T. Gasser, A. Grübler, W. K. Heidug, M. Jonas, C. D. Jonas, F. Kraxxner, E. Litteton, J. Lowe, J. R. Moreira, N. Nakicenovic, M. Obersteiner, A. Patwardhan, M. Rogner, E. Rubin, A. Sharifi, A. Torvenger, Y. Yamagata, J. Edmonds and C. Yongsung, (2016) ‘Biophysical and economic limits to negative CO 2 emissions’, Nature Climate Change 6: 42-50
Sommer, M., S. Ferron, S. Cavill and S. House (2015) ‘Violence, gender and WASH: Spurring action on a complex, under-documented and sensitive topic’, Environment and Urbanization 27(1): 105-116
Souza, C. (2001) ‘Participatory budgeting in Brazilian cities: Limits and possibilities in building democratic institutions’, Environment and Urbanization 13(1): 159-184
Sovacool, B. K. (2011) ‘Conceptualizing urban household energy use: Climbing the “Energy Services Ladder”’ Energy Policy 39(3): 1659-1668
Sovacool, B. K. (2019) ‘Toxic transitions in the lifecycle externalities of a digital society: the complex afterlives of electronic waste in Ghana’, Resources Policy 64: 101459
Sovacool, B. K., A. Hook, M. Martiskainen, A. Brock and B. Turnheim (2020) ‘The decarbonisation divide: Contextualizing landscapes of low-carbon exploitation and toxicity in Africa’, Global Environmental Change 60: 102028
Spencer, J. N. H., D. Marasco and M. Eichinger (2022) ‘Planning for emerging infectious disease pandemics’, Journal of the American Planning Association 88(1): 113–126
Spiliotopoulou, M. and Roseland, M. (2021) ‘Urban sustainability via urban productivity? A conceptual review and framework proposal’, Local Environment 2: 177-196
Stacey, P. and C. Lund (2016) ‘In a state of slum: governance in an informal urban settlement in Ghana’, The Journal of Modern African Studies 54(4):591-615
Stafford, L. (2020) ‘Planning inclusively: disrupting “ableism” to make communities just for all’, QUT Centre for Justice Briefing Paper (10): 1-12
Standing, G. (2018) ‘The Precariat: today’s transformative class?’, Development 61(1-4): 115-121
Stark, L. (2021) ‘Mobile money and the impact of mobile phone regulatory enforcement among the urban poor in Tanzania’, Human Technology 17(1): 22-44
StartUs Insights (2021) ‘Top 8 circular economy trends & innovations in 2021’, StartUs Insights, https://www.startus-insights.com/innovatorsguide/top-8-circular-economy-trends-innovationsin-2021/, last accessed 8 November 2021
State Government of Victoria (2022) ‘20-minute neighbourhoods’, Plan Melbourne 20172050, https://www.planning.vic.gov.au/ policy-and-strategy/planning-for-melbourne/ plan-melbourne/20-minute-neighbourhoods, last accessed 29 May 2022
Stecklov, G. (2008) The Components of Urban Growth in Developing Countries, Unpublished manuscript prepared for the United Nations Population Division, https://www.researchgate. net/publication/326189843_The_Components_ of_Urban_Growth_in_Developing_Countries, last accessed 6 April 2022
Steen, K. and E. van Bueren (2017) Urban Living Labs: A Living Lab Way of Working, Amsterdam Institute for Advanced Metropolitan Solutions, https://www.ams-institute.org/documents/28/ AMS_Living_Lab_Way_of_Working-ed4.pdf, last accessed 4 February 2022
Steg, L., and R. Gifford (2005) ‘Sustainable transporta tion and quality of life’, Journal of Transport Geography 13(1): 59-69
Stephenson, M. (2015) ‘Trust in government and public health: Corruption and Ebola revisited’, https://globalanticorruptionblog. com/2015/01/22/trust-in-government-andpublic-health-corruption-and-ebola-revisited, last accessed 25 February 2022
Stibbe, D. and D. Prescott (2020) The SDG Partnership Guidebook: A Practical Guide to Building High Impact Multi-Stakeholder Partnerships for The Sustainable Development Goals, The Partnering Initiative and UNDESA, New York Stiglitz, J. (2020) ‘Point of view: Conquering the great divide’, Finance and Development 0057(03): 7-19, https://www.imf.org/external/pubs/ ft/fandd/2020/09/pdf/COVID19-and-globalinequality-joseph-stiglitz.pdf, last accessed 6 May 2022
Subbaraman, R., J. O’Brien, T. Shitole, S. Shitole, K. Sawant, D. E. Bloom and A. Patil-Deshmukh
(2012) ‘Off the map: The health and social implications of being a non-notified slum in India’, Environment and Urbanization 24(2): 643-663
Subbaraman, R., T. Jhaveri and R. R. Nathavitharana (2020) ‘Closing gaps in the tuberculosis care cascade: An action-oriented research agenda’, Journal of Clinical Tuberculosis and Other Mycobacterial Diseases 19: 100144
Sukhwani, V., S. Deshkar and R. Shaw (2020) ‘COVID-19 lockdown, food systems and urban-rural partnership: Case of Nagpur, India’, International Journal of Environmental Research and Public Health 17(16): 5710
Suleimany, M. (2021) ‘Smart urban management and IoT; paradigm of e-governance and technologies in developing communities’, 5th International Conference on Internet of Things and Applications (IoT), 19-20 May, Isfahan, Iran, pp. 1-6
Sumner, A., C. Hoy and E. Ortiz-Juarez (2020) Estimates of the impact of COVID-19 on global poverty, WIDER Working Paper 2020/43, UNUWider, Helsinki, https://www.wider.unu.edu/ sites/default/files/Publications/Working-paper/ PDF/wp2020-43.pdf, last accessed 23 April 2022
Sun, H. (2019) ‘Grand challenges in environmental nanotechnology’, Frontiers in Nanotechnology 1(2): 1-3
Sundaresan, J. (2019) ‘Urban planning in vernacular governance: Land use planning and violations in Bangalore, India’, Progress in Planning 127:1-23.
Suri, S. N. and F. Bonaglia (2021) ‘Why local? Why now? Strengthening intermediary cities to achieve the SDGs’, https://unhabitat.org/ why-local-why-now-strengthening-intermediarycities-to-achieve-the-sdgs, last accessed 25 April 2022
Surico, J. (2021) ‘Informal transport must play a bigger role in post-pandemic recovery. Here’s how that can happen’, https://www.research. ox.ac.uk/article/2021-06-16-informal-transportmust-play-a-bigger-role-in-post-pandemicrecovery-here-s-how-that-can-happen, last accessed 19 March 2022
Surie, A. (2020) ‘On-demand platforms and pricing: How platforms can impact the informal urban economy, evidence from Bengaluru, India’, Work Organisation, Labour & Globalisation 14(1): 83-100
Susskind, L. (2010) ‘Responding to the risks posed by climate change: Cities have no choice but to adapt’, The Town Planning Review 81(3): 217-235
Sverdlik, A., D. Mitlin and D. Dodman (2019) Realising the Multiple Benefits of Climate Resilience and Inclusive Development in Informal Settlements, C40 Cities Climate Leadership Group, New York
Sverdlik, A. and A. Walnycki (2021) Better Cities After COVID-19: Transformative Urban Recovery in the Global South, IIED Issue Paper, International Institute for Environment and Development, London, http://pubs.iied.org/20241IIED, last accessed 7 June 2022
Sverdlik, A., J. Makau, J, Kimani, C. Mumbi, P. Njoroge, E. Otibine, K. Nyambuga, J. Wairutu and J. Waithaka (2020) Achieving Scale, Social Inclusion, and Multifaceted Shelter Solutions, International Institute for Environment and Development, Kenya, https://pubs.iied.org/sites/ default/files/pdfs/migrate/10884IIED.pdf, last accessed 24 March 2022
Swain, M., E. McKinney and L. Susskind (2020) ‘Water shutoffs in older American cities: Causes, extent, and remedies’, Journal of Planning Education and Research :1–8, https://doi. org/10.1177/0739456X2090443, last accessed 10 June 2022
Swapan, M. S. H., and S. Khan (2021) ‘Urban informality and parallel governance systems: shaping citizens’ engagements in urban planning processes in Bangladesh, International Planning Studies 27(1):1-17
Swart, R., W. Timmermans, J. Jonkhof and H. Goosen
(2021) ‘From urban façade to green foundation: Re-imagining the garden city to manage climate risks’, Urban Planning 6(4): 4-8
Tacoli, C. (2017) ‘Food (in)security in rapidly urbanising, low-income contexts’, International Journal of Environmental Research and Public Health 14(12): 1554
Tainio, M., Z. J. Andersen, M. J. Nieuwenhuijsen, L. Hu, A. de Nazelle, R. An, L. M. T. Garcia, S. Goenka, B. Zapata-Diomedi, F. Bull and T.H. de Sá (2021) ‘Air pollution, physical activity and health: A mapping review of the evidence’, Environment International 147: 105954
Talhami, M. and M. Zeitoun (2022) ‘The impact of attacks on urban services II: Reverberating effects of damage to water and wastewater systems on infectious disease’, International Review of the Red Cross 102(915): 1293-1325, https://international-review.icrc.org/articles/ impact-of-attacks-on-urban-services-ii-damageto-wastewater-systems-infectious-disease915#footnote43_h8syz25, last accessed 4 May 2022
Tanabe, M., E. Pearce and S. K. Krause (2018) ‘“Nothing about us, without us”: Conducting participatory action research among and with persons with disabilities in humanitarian settings’, Action Research 16(3): 280-298
Tasan-Kok, T. and J. Vranken (2011) Handbook for Multilevel Urban Governance in Europe. Analysing Participatory Instruments for an Integrated Urban Development, European Urban Knowledge Network, The Hague, Netherlands
Termeer, C. J. A. M., A. Dewulf and G. R. Biesbroek (2017) ‘Transformational change: Governance interventions for climate change adaptation from a continuous change perspective,’ Journal of Environmental Planning and Management 60(4): 558–576
The Climate Group (2022) ‘Further, faster, together: Under2 leaders actions at COP26’, , https:// www.theclimategroup.org/further-fastertogether-under2-leaders-actions-cop26, last accessed 22 May 2022
The Economist (2022) ‘What will it cost to rebuild Ukraine?’, The Economist, 16 April, https://www. economist.com/briefing/2022/04/16/what-willit-cost-to-rebuild-ukraine, last accessed 24 May 2022
The Guardian (2021) ‘The Guardian view on Amazon’s shops: Benefit society, not just consumers’, The Guardian, 10 October, https://www.theguardian. com/commentisfree/2021/oct/10/the-guardianview-on-amazons-shops-benefit-society-not-justconsumers, last accessed 25 October 2021
The Hindu BusinessLine (2021) ‘Ghaziabad issues India’s first municipal green bonds’, The Hindu Business Line, 8 April, https://www.thehindubusinessline.com/news/ghaziabad-issues-indias-firstmunicipal-green-bonds/article34271175.ece, last accessed 11 May 2022
The Independent Panel for Pandemic Preparedness and Response (2021) COVID-19: Make it the Last Pandemic, The Independent Panel for Pandemic Preparedness and Response, Geneva, https:// theindependentpanel.org/mainreport/, last accessed 24 March 2022
The Lancet (2020) ‘COVID-19: remaking the social contract’, Lancet 395(10234): 1401
The Lancet HIV (2019) ‘Cities getting to 90-90-90 and beyond’, The Lancet HIV 6(10): e639, https://www.thelancet.com/journals/lanhiv/ article/PIIS2352-3018(19)30299-1/fulltext, last accessed 24 March 2022
Thieme, T, A. (2016) A Reflection on Resilient Urban Economies, British Academy, United Kingdom, pp.1-17, https://www.thebritishacademy.ac.uk/ documents/1881/Reflection-Resilient-Urban-Econ omies-Thieme.pdf, last accessed 2 March 2022
Thombre, A. and A. Agarwal (2021) ‘A paradigm shift in urban mobility: Policy insights from travel before and after COVID-19 to seize the opportunity’, Transport Policy 110: 335–353
Todes, A. (2004) ‘Regional planning and sustainability: Limits and potentials of South Africa’s integrated development plans’, Journal of Environmental Planning and Management 47(6): 843–861
Tollefson, J. (2022) ‘What the war in Ukraine means for energy, climate and food’, Nature, 5 April, https://www.nature.com/articles/d41586-02200969-9, last accessed 06 May 2022
Tozer, L., K. Hörschelmann, I. Anguelovski, H. Bulkeley and Y. Lazova (2020) ‘Whose city? Whose nature? Towards inclusive nature-based solution governance’, Cities 107: 102892
Transformative Urban Mobility Initiative (TUMI) (2019) Sustainable urban transport: Avoid-Shift-Improve (A-S-I), Deutsche Gesellschaft für Internationale Zusammenarbeit (GIZ) GmbH, Germany, https:// www.transformative-mobility.org/assets/publica tions/ASI_TUMI_SUTP_iNUA_No-9_April-2019. pdf, last accessed 29 April 2022
Transport for London (2021a) Implications of Reduced Funding for TfL, Transport for London, London, https://board.tfl.gov.uk/documents/s16939/fc20211124-item11a-Impacts-of-Reduced-Funding. pdf
Transport for London (2021b) ‘Ultra low emissions zone’, https://tfl.gov.uk/modes/driving/ultra-lowemission-zone, last accessed 11 May 2022
Trencher, G. (2019) ‘Towards the smart city 2.0: Empirical evidence of using smartness as a tool for tackling social challenges’, Technological Forecasting and Social Change 142: 117-128
Tretter, E. M. (2016) Shadows of a Sunbelt City: The Environment, Racism, and the Knowledge Economy in Austin, University of Georgia Press, Georgia
Tribuna Economica (2019) ‘Eurostat - downward trend in the share of persons at risk of poverty or social exclusion in the EU’, Tribuna Economica,18 October, https://www.etribuna.com/eportale/ en/33951-eurostat-downward-trend-in-the-shareof-persons-at-risk-of-poverty-or-social-exclusionin-the-eu-2, last accessed 4 May 2022
Triveno, L. (2016) ‘How Latin America’s housing policies are changing the lives of urban families’, World Bank Blogs, 11 April, https://blogs.worldbank.org/sustainablecities/how-latin-america-shousing-policies-are-changing-lives-urban-families, last accessed 5 May 2022
Tsivanidis, N. (2018) The Aggregate and Distributional Effects of Urban Transit Infrastructure: Evidence from Bogotá’s TransMilenio, Ph.D. Dissertation, University of Chicago Booth School of Business, Chicago
Tucker, J. and M. Anantharaman (2020) ‘Informal Work and Sustainable Cities: From Formalization to Reparation’, One Earth 3(3): 290-299
Turnheim, B., F. Berkhout, F. Geels, A. Hof, A. McMeekin, B. Nykvist and D. van Vuuren (2015) ‘Evaluating sustainability transitions pathways: Bridging analytical approaches to address governance challenges’, Global Environmental Change 35: 239-253
Tyszczuk, R. and J. Smith (2018) ‘Culture and climate change scenarios: The role and potential of the arts and humanities in responding to the “1.5 degrees target”’, Current Opinion in Environmental Sustainability 31: 56-64
UCLG (United Cities and Local Governments) (2016) Local and Regional Governments: Partners for the Global Agenda, https://www.uclg cisdp.org/sites/ default/files/folleto%20UN%20final%20web_1. pdf, last accessed 25 February 2022
UCLG (2019) The Localization of the Global Agendas: How Local Action is Transforming Territories and Communities (GOLD V Report), https://www. uclg.org/sites/default/files/goldv_en.pdf, last accessed 11 April 2022
UCLG (2021) Towards the localization of the SDGs: Sustainable and Resilient Recovery Driven by Cities and Territories, Local and Regional Governments’ Report to the 2020 HLPF, 5th Report, https://www.uclg.org/sites/default/ files/5th_report_gtf_hlpf_2021.pdf, last accessed 25 February 2022
UITP (International Association of Public Transport/ Union Internationale des Transports Publics) (2020a) ‘Promoting safe and sustainable cities with public transport for the SDGs’, https:// www.uitp.org/publications/promoting-safe-andsustainable-cities-with-public-transport-for-thesdgs, last accessed 3 May 2022
UITP (2020b) ‘Public transport is COVID-safe’, https://www.uitp.org/publications/public-transport-is-covid-safe, last accessed 3 May 2022
UITP (2021) Key Insights into Transforming the Informal Transport Sector, UITP Knowledge Brief, https://cms.uitp.org/wp/wp-content/ uploads/2021/02/Knowledge-Brief-Informaltransport.pdf, last accessed 19 March 2022
UN Women (2019) Safe Cities and Safe Public Spaces for Women and Girls Global Flagship Initiative: International Compendium of Practice, https:// www.unwomen.org/en/digital-library/publications/2019/01/safe-cities-and-safe-public-spacesinternational-compendium-of-practices, last accessed 19 March 2022
UNAIDS (Joint United Nations Programme on HIV and AIDS) (2019) Cities on the Road to Success: Good Practices in the Fast-Track Cities Initiative to End AIDS, https://www.unaids.org/sites/default/files/ media_asset/cities-on-the-road-to-success_en.pdf, last accessed 24 March 2022
UNAIDS (2021) ‘Global HIV & AIDS statistics — Fact sheet’, Geneva, https://www.unaids.org/en/ resources/fact-sheet , last accessed 9 May 2022
UNCDF (United Nations Capital Development Fund) (2020) COVID-19 Emergency Response: Local Government Finance – Guidance Note for Immediate Action , Edition #4 https://www.uncdf.org/ article/5477/guidance-note-covid19-local-governments, last accessed 25 February 2022
UNCTAD (United Nations Conference on Trade and Development) (2021a) ‘Least developed countries suffer digital divide in mobile connectivity’, https:// unctad.org/topic/least-developed-countries/chartapril-2021, last accessed 27 September 2021
UNCTAD (2021b) ‘Global e-commerce jumps to $26.7 trillion, COVID-19 boosts online sales’, https://unctad.org/news/global-e-commercejumps-267-trillion-covid-19-boosts-online-sales, last accessed 8 November 2021
UNDESA (United Nations Department of Social and Economic Affairs) (2001) The Components of Urban Growth in Developing Countries, No. ESA/P/WP.169, UN Department of Economic and Social Affairs, New York
UNDESA (2014a) Prototype Global Sustainable Development Report, https://sustainabledevelopment. un.org/content/documents/1454Prototypeper cent20Globalper cent20SDper cent20Report2. pdf, last accessed 7 June 2022
UNDESA (2014b) ‘Enabling youth civic engagement’, https://www.un.org/development/desa/youth/enabling-youth-civic-engagement.html, last accessed 16 October 2021
UNDESA (2015) World Population Prospects: The 2015 Revision, Key Findings and Advance Tables, Working Paper No. ESA/P/WP.241, https://population.un.org/wpp/publications/files/key_findings_ wpp_2015.pdf, last accessed 25 April 2022
UNDESA (2018a) The World’s Cities in 2018 – Data Booklet (ST/ESA/ SER.A/417), https://digitallibrary.un.org/record/3799524/files/the_worlds_ cities_in_2018_data_booklet.pdf, last accessed 23 April 2022
UNDESA (2018b) ‘Majority of the world’s cities highly exposed to disasters, UN DESA warns on World Cities Day’, https://www.un.org/development/ desa/en/news/population/world-cities-day-2018. html, last accessed 5 May 2022
UNDESA (2019a) ‘Publications: 2018 revision of world urbanization prospects’, https://www. un.org/development/desa/publications/2018revision-of-world-urbanization-prospects.html, last accessed 20 April 2022
UNDESA (2019b) World Urbanization Prospects: The 2018 Revision, United Nations, New York
UNDESA (2019c) World Population Prospects, UN Department of Economic and Social Affairs, New York
UNDESA (2020a) E-Government survey 2020: Digital government in the decade of action for sustainable development, UN Department of Economic and Social Affairs, New York
UNDESA (2020b) World Social Report 2020: Inequality in a Rapidly Changing World, https://www.un.org/ development/desa/dspd/wp-content/uploads/ sites/22/2020/01/World-Social-Report-2020-FullReport.pdf, last accessed 21 September 2020
UNDESA (2022) ‘Ensure access to affordable, reliable, sustainable and modern energy for all’, United Nations Sustainable Development Goals, https:// sdgs.un.org/goals/goal7, last accessed 22 May 2022
UNDESA, UNCTAD, UNECA, UNECE, UNECLAC and UNESCWA (2021) World Economic Situation Prospects, United Nations, New York
UNDP (United Nations Development Programme) (2020) Human Development Report 2020: The Next Frontier - Human Development and the Anthropocene, United Nations Development Programme, New York
UNDP and OPHI (Oxford Poverty and Human Development Initiative) (2020) Global Multidimensional Poverty Index 2020, Charting Pathways out of Multidimensional Poverty: Achieving the SDGs, http://hdr.undp.org/sites/default/files/2020_mpi_ report_en.pdf, last accessed 4 May 2022
UNDP and OPHI (2021) Global Multidimensional Poverty Index 2021: Unmasking Disparities by Ethnicity, Caste, and Gender, https://hdr.undp. org/sites/default/files/2021_mpi_report_en.pdf, last accessed 4 May 2022
UNDRR (United Nations Office for Disaster Risk Reduction) (2022) ‘Making Cities Resilient 2030’, https://mcr2030dashboard.undrr.org, last accessed 8 May 2022
UNECE (United Nations Economic Commission for Europe) (2019) Regional Policy Brief on Building Urban Economic Resilience during and after COVID-19 in the UNECE Region, https://unece. org/sites/default/files/2021-09/Regional%20 Policy%20Brief%20-%20COVID%2019%20Resilient%20Cities.pdf, last accessed 3 May 2022
UNECE (2021a) ‘Recovering from COVID-19: A sustainable and human-centred approach to the future of work’, https://unece.org/economiccooperation-and-integration/news/recoveringcovid-19-sustainable-and-human-centred, last accessed 3 May 2022
UNECE (2021b) ‘Safer streets for pedestrians and cyclists will boost Ethiopia’s sustainable recovery, through joint action supported by UN Road Safety Fund’, https://unece.org/media/ press/358705, last accessed 20 April 2022
UNECOSOC (United Nations Economic and Social Council) (2019) Special Edition: Progress Towards the Sustainable Development Goals, Report of the Secretary-General, No. E/2019/68, UN Economic and Social Council, New York, https://unstats. un.org/sdgs/files/report/2019/secretary-general-sdgreport-2019--EN.pdf, last accessed 10 June 2022
UNECOSOC (2020) Social Dimensions of the New Partnership for Africa’s Development: Report of the Secretary-General, No. E/CN.5/2021/2, UN Economic and Social Council, New York, https:// digitallibrary.un.org/record/3929669/files/E_ RES_2021_9-EN.pdf, last accessed 5 May 2022
UNECOSOC (2022) Progress in the Implementation of the New Urban Agenda: Report of the Secretary General, No. A/76/639–E/2022/10, UN Economic and Social Council, New York, https:// documents-dds-ny.un.org/doc/UNDOC/GEN/ N22/278/72/PDF/N2227872.pdf?OpenElement, last accessed 23 May 2022
UNEP (United Nations Environment Programme) (2016) Green Energy Choices: The Benefits, Risks, and Trade-Offs of Low-Carbon Technologies for Electricity Production, United Nations Environment Programme, Nairobi
UNEP (2019a) ‘Business unusual: Four innovations to clear the air’, https://www.unep.org/news-andstories/story/business-unusual-four-innovationsclear-air, last accessed 8 November 2021
UNEP (2019b) ‘District energy: A secret weapon for climate action and human health’, https://www. unep.org/news-and-stories/story/district-energysecret-weapon-climate-action-and-human-health, last accessed 15 November 2021
UNEP (2020a) ‘Car-free days are taking hold in African cities’, https://www.unep.org/news-and-stories/ story/car-free-days-are-taking-hold-african-cities, last accessed 22 May 2022
UNEP (2020b) Emissions Gap Report 2020, https://www. unep.org/emissions-gap-report-2020, last accessed 29 April 2022
UNEP (2021a) 2021 Global Status Report for Buildings and Construction: Towards a Zero-emission, Efficient and Resilient Buildings and Construction Sector, United Nations Environment Programme, Nairobi
UNEP (2021b) ‘Cooling community announces steps to beat global warming with GBP 12 million boost from UK’, https://www.unep.org/news-and-stories/ press-release/cooling-community-announces-stepsbeat-global-warming-gbp-12-million, last accessed 26 May 2022
UNEP (2021c) Are We Building Back Better?: Evidence from 2020 and Pathways for Inclusive Green Recovery Spending, https://wedocs.unep.org/ bitstream/handle/20.500.11822/35281/AWBBB. pdf, last accessed 19 March 2022
UNEP (2021d) ‘Pandemic caused dip in building emissions, but long-term outlook bleak – UN report’, https://www.unep.org/news-and-stories/pressrelease/pandemic-caused-dip-building-emissionslong-term-outlook-bleak-un, last accessed 15 November 2021
UNEP (2021e) Emissions Gap Report 2021: The Heat Is On – A World of Climate Promises Not Yet Delivered, https://www.unep.org/resources/emissionsgap-report-2021, last accessed 29 April 2022
UNEP and UN-Habitat (2021) Global Environment for Cities-GEO for Cities: Towards Green and Just Cities, UNEP, Nairobi
UNESCAP (United Nations Economic Commission for Asia and Pacific) and UN-Habitat (2019) The Future of Asian and Pacific Cities. Transformative Pathways Towards Sustainable Urban Development, https:// www.unescap.org/sites/default/d8files/knowledgeproducts/Future%20of%20AP%20Cities%20 Report%202019.pdf, last accessed 3 May 2022
UNESCO (United Nations Educational, Scientific and Cultural Organization) (2016) United Nations Water Report 2016: Water and Jobs, UNESCO, Paris, https://unesdoc.unesco.org/ark: /48223/ pf0000243938, last accessed 5 May 2022
UNESCO (2019) The United Nations World Water Development Report 2019: Leaving No One Behind, United Nations Educational, Scientific and Cultural Organization, Paris
UNESCO (2021) Snapshots of Learning Cities’ Responses to COVID-19, United Nations Educational, Scientific and Cultural Organization Institute for Lifelong Learning, Hamburg, https://unesdoc.unesco.org/ ark:/48223/pf0000378050
UNESCO and UN-Habitat (2009) Urban Policies and the Right to the City: Rights, Responsibilities and Citizenship, https://unesdoc.unesco.org/ark:/48223/ pf0000178090, last accessed 10 June 2022
UNFCCC (United Nations Framework Convention on Climate Change) (2021a) ‘Who’s in?’, https:// racetozero.unfccc.int/join-the-race/whos-in, last accessed 6 June 2022
UNFCCC (2021b) ‘Climate smart cities in emerging economies’, https://unfccc.int/climate-action/ momentum-for-change/activity-database/ momentum-for-change-climate-smart-cities-inemerging-economies, last accessed 11 October 2021
UN-Habitat (2007) Enhancing Urban Safety and Security: Global Report on Human Settlements 2007, Earthscan, London and Sterling, VA
UN-Habitat (2008) State of the World’s Cities Report
2008/2009: Harmonious Cities, Earthscan, London and Sterling, VA
UN-Habitat (2009) Global Report on Human Settlements 2009: Planning Sustainable Cities, Earthscan, London and Sterling, VA
UN-Habitat (2010) State of the World’s Cities Report 2010: Bridging the Urban Divide, Earthscan, London
UN-Habitat (2011a) The Impact of The Global Financial Crisis on Housing Finance, UN-Habitat, Nairobi
UN-Habitat (2011b) Global Report on Human Settlements 2011: Cities and Climate Change, Earthscan, London and Washington, DC
UN-Habitat (2013) Planning and Design for Sustainable Urban Mobility: Global Report on Human Settlements 2013, Routledge, USA and Canada, https://unhabitat.org/planning-and-design-for-sustainable-urban-mobility-global-report-on-humansettlements-2013, last accessed 29 April 2022
UN-Habitat (2014) Urban Planning for City Leaders, Second Edition, UN-Habitat, Nairobi, https:// unhabitat.org/sites/default/files/downloadmanager-files/UN%20Habitat%20UPCL%20 14-02624%20-%20Combine.pdf, last accessed 6 April 2022
UN-Habitat (2015a) A New Strategy of Sustainable Neighbourhood Planning: Five Principles - Urban Planning Discussion Note 3, UN-Habitat, Nairobi, https://unhabitat.org/a-new-strategy-of-sustainable-neighbourhood-planning-five-principles, last accessed 1 May 2022
UN-Habitat (2015b) International Guidelines on Urban and Territorial Planning, UN-Habitat, Nairobi
UN-Habitat (2016a) World Cities Report 2016: Urbanization and Development – Emerging Futures, UN-Habitat, Nairobi
UN-Habitat (2016b) The Fundamentals of Urbanization: Evidence Base for Policy Making, UNHabitat, Nairobi
UN-Habitat (2016c) Sustainable Development Goal 11, https://www.local2030.org/library/60/ SDG-Goal-11-Monitoring-Framework-A-guide-toassist-national-and-local-governments-to-monitorand-report-on-SDG-goal-11-indicators.pdf, last accessed 25 February 2022
UN-Habitat (2018a) Leading Change: Delivering the New Urban Agenda through Urban and Territorial Planning, UN-Habitat, Nairobi, https://unhabitat. org/sites/default/files/download-manager-files/ Leadingper cent20Change_Webper cent20Versionper cent2001.02.18.pdf
UN-Habitat (2018b) SDG Indicator 11.3.1 Training Module: Land Use Efficiency, UN-Habitat, Nairobi
UN-Habitat (2018c) Kuala Lumpur Declaration on Cities 2030, https://unhabitat.org/sites/default/ files/2018/04/Agenda-10-WUF9-KL-DeclarationEnglish-1.pdf, last accessed 4 May 2022
UN-Habitat (2018d) The Ninth Session of the World Urban Forum. Cities 2030: Cities for All – Implementing the New Urban Agenda, Kuala Lumpur, Malaysia, https://unhabitat.org/sites/default/files/ documents/2019-05/wuf9-report-may-2019_10. pdf, last accessed 25 February 2022
UN-Habitat (2019a) Progress in the implementation of the New Urban Agenda and the 2030 Agenda for Sustainable Development: Report of the Executive Director, No. HSP/HA/1/1, UN-Habitat, Nairobi, https://unhabitat.org/sites/default/files/2019/05/ hsp_ha_1_4_e.pdf, last accessed 6 April 2022
UN-Habitat (2019b) The Strategic Plan 2020–2023, UN-Habitat, Nairobi, https://unhabitat.org/sites/ default/files/documents/2019-09/strategic_ plan_2020-2023.pdf, last accessed 6 April 2022
UN-Habitat (2019c) Urban Crises and the Informal Economy: Surviving ,Managing, Thriving in PostConflict Cities, https://unhabitat.org/sites/default/ files/documents/2020-02/urban_crises_and_the_ informal.pdf, last accessed 4 May 2022
UN-Habitat (2020a) World Cities Report 2020: The Value of Sustainable Urbanization, UN-Habitat, Nairobi
UN-Habitat (2020b) UN-Habitat Sub-Saharan Africa
Atlas, UN-Habitat, Nairobi, https://unhabitat.org/ sites/default/files/2020/07/atlasroaf_v02_finalcompressed.pdf, last accessed 6 April 2022
UN-Habitat (2020c) COVID-19 in African Cities: Impacts, Responses and Policies Recommendations, UN-Habitat, Nairobi
UN-Habitat (2020d) The New Urban Agenda Illustrated, UN-Habitat, Nairobi
UN-Habitat (2020e) ‘New roads for Old Accra’, https://www.mypsup.org/Ghana_Story_Details, last accessed 8 May 2022
UN-Habitat (2020f) ‘Opinion: COVID-19 demonstrates urgent need for cities to prepare for pandemics’, https://unhabitat.org/opinion-covid19-demonstrates-urgent-need-for-cities-toprepare-for-pandemics, last accessed 25 February 2022
UN-Habitat (2020g) Future Cities, New Economy, and Shared City Prosperity Driven by Technological Innovations, UN-Habitat, Nairobi, https:// unhabitat.org/sites/default/files/2020/02/future_ cities_new_economy_and_shared_city_prosperity_driven_by_technological_innovations_discussion_papers.pdf
UN-Habitat (2020h) The Role of National Urban Forums as Multi-stakeholder Platforms to Accelerate Implementation of the Sustainable Development Goals and the New Urban Agenda: Report on the Expert Group Meeting, October 2020 Nairobi, Kenya, https://unhabitat.org/the-roleof-national-urban-forums-as-multi-stakeholderplatforms-to-accelerate-implementation-of, last accessed 25 February 2022
UN-Habitat (2020i) ‘UN-Habitat’s COVID-19 response plan’, https://unhabitat.org/un-habitat-covid19-response-plan, last accessed 1 May 2022
UN-Habitat (2020j) ‘45 cities to endorse digital rights’, https://unhabitat.org/story-45-cities-toendorse-digital-rights, last accessed 30 October 2021
UN-Habitat (2020k) Governance Assessment Framework for Metropolitan, Territorial and Regional Management (GAF-MTR), Nairobi, Kenya, https:// unhabitat.org/sites/default/files/2020/10/gaf-mtr. pdf, last accessed 25 February 2022
UN-Habitat (2021a) Cities and Pandemics: Towards a More Just, Green and Healthy Future, https:// unhabitat.org/sites/default/files/2021/03/ cities_and_pandemics-towards_a_more_just_ green_and_healthy_future_un-habitat_2021.pdf, last accessed 3 April 2022
UN-Habitat (2021b) Sustainable Urbanization for Sustaining Peace: UN-Habitat’s contribution, experiences and added value in addressing and preventing urban crises in the Arab region, https://unhabitat.org/sites/default/files/2021/05/ sustainable_urbanization_for_sustaining_ peace_in_the_arab_region_29.03.2021.pdf, last accessed 28 April 2022
UN-Habitat (2021c) ‘UN-Habitat and University of Michigan assess Colombia’s legal and policy frameworks’, https://unhabitat.org/ un-habitat-and-university-of-michigan-assesscolombia%E2%80%99s-legal-and-policy-frameworks, last accessed 13 May 2022
UN-Habitat (2021d) A Guide: Leveraging Multi-Level Governance Approaches to Promote Health Equity, https://unhabitat.org/a-guide-leveragingmulti-level-governance-approaches-to-promotehealth-equity, last accessed 25 February 2022
UN-Habitat (2021e) Addressing the Digital Divide: Taking Action towards Digital Inclusion, https:// unhabitat.org/sites/default/files/2021/11/ addressing_the_digital_divide.pdf, last accessed 7 June 2022
UN-Habitat (2021f) Assessing the Digital Divide: Understanding Internet Connectivity and Digital Literacy in Cities and Communities, https:// unhabitat.org/sites/default/files/2021/11/ assessing_the_digital_divide.pdf, last accessed 7 June 2022
UN-Habitat (2021g) Centering People in Smart Cities: A Playbook for Local and Regional Governments,
https://unhabitat.org/sites/default/files/2021/11/ centering_people_in_smart_cities.pdf, last accessed 7 June 2022
UN-Habitat (2021h) Compendium of Inspiring Practices: SDG focus, Nairobi, Kenya, https:// unhabitat.org/compendium-of-inspiring-practicessdg-focus-03, last accessed 25 February 2022
UN-Habitat (2021i) ‘Urban population trends’, https:// data.unhabitat.org/pages/urban-population-anddemographic-trends, last accessed 2 May 2022
UN-Habitat (2022a) Implementation of the New Urban Agenda in the Latin America and the Caribbean, https://www.urbanagendaplatform.org/ node/2018, last accessed 25 February 2022
UN-Habitat (2022b) ‘UN-Habitat expands COVID-19 prevention in Kenya’s Mathare and Kibera informal settlements’, https://unhabitat.org/unhabitat-expands-covid-19-prevention-in-kenyasmathare-and-kibera-informal-settlements, last accessed 2 May 2022
UN-Habitat and DimSUR (2020) CityRAP Tool: City Resilience Action Planning Tool, UN-Habitat and Disaster Risk Management, Sustainability and Urban Resilience (DiMSUR), Nairobi, https:// unhabitat.org/sites/default/files/2020/05/ cityrap_tool_booklet_2020.pdf, last accessed 3 May 2022
UN-Habitat and Global Utmaning (2021) HerCity: A Guide for Cities to Sustainable and Inclusive Urban Planning and Design Together with Girls, UN-Habitat and Global Utmaning, Nairobi and Stockholm
UN-Habitat and UNCDF (2021) Global Compendium of Practices on Local Economic and Financial Recovery: Building Urban Economic Resilience during and after COVID-19, https://unhabitat. org/sites/default/files/2021/03/global-compendium-of-practices-covid-19.pdf, last accessed 3 May 2022
UN-Habitat and WHO (2020) Integrating Health in Urban and Territorial Planning: A Sourcebook for Urban Leaders, Health and Planning Professionals, https://unhabitat.org/integrating-healthin-urban-and-territorial-planning-a-sourcebookfor-urban-leaders-health-and, last accessed 24 March 2022
UN-Habitat, EC, EIB and IGC (2021) Financing Sustainable Urban Development, UN-Habitat, Nairobi UN-Habitat, UNIDO and Government of Mexico (2021) Prospective Territorial-Industrial Atlas for Investment Attraction: High-potential industries in Mexico, https://publicacionesonuhabitat.org/ onuhabitatmexico/Resumen-Atlas_ENG.pdf, last accessed 17 May 2022
UN-Habitat Youth (2020) ‘Youth-led coalition against COVID-19 releases call to action’, https://www. unhabitatyouth.org/youth-led-coalition-againstcovid-19-releases-call-to-action, last accessed 25 February 2022
UNHRC (United Nations Human Rights Council) (2021) A/HRC/39/29: The Right to Privacy in The Digital Age: Report of the United Nations High Commissioner for Human Rights, United Nations Human Rights Council, Geneva, https://undocs. org/A/HRC/39/29, last accessed 20 October 2021
UNICEF (United Nations Children’s Fund) (2018) Advantage or Paradox? The Challenge for Children and Young People of Growing Up Urban, https://data.unicef.org/resources/urban-paradoxreport, last accessed 22 March 2022
UNICEF (2020) Snapshot of Global and Regional Urban Water, Sanitation and Hygiene Inequalities, United Nations International Children’s Emergency Fund, New York
UNICEF, UN-Habitat and Ministry of Foreign Affairs of the Netherlands (2020) Analysis Report: Analysis of Multiple Deprivations in Secondary Cities in Sub-Saharan Africa, https://www. unicef.org/esa/media/5561/file/Analysis%20 of%20Multiple%20Deprivations%20in%20Secondary%20Cities%20-%20Analysis%20Report.pdf, last accessed 6 April 2022
United Nations (2014) Effective governance, policy making and planning for sustainable urbanization: Report of the Secretary-General, Economic and Social Council, New York, https://www.un.org/ ga/search/view_doc.asp?symbol=E/2014/67, last accessed 25 February 2022
United Nations (2015a) ‘Transforming Our World: The 2030 Agenda for Sustainable Development’, https://sdgs.un.org/2030agenda, last accessed 24 March 2022
United Nations (2015b) Sendai Framework for Disaster Risk Reduction 2015-2030, https://www. undrr.org/publication/sendai-framework-disasterrisk-reduction-2015-2030, last accessed 25 February 2022
United Nations (2017) New Urban Agenda, Resolution adopted by the General Assembly on 23 December 2016, No. A/RES/71/256, United Nations, New York, https://www.un.org/en/development/desa/population/migration/generalassembly/docs/globalcompact/A_RES_71_256.pdf, last accessed 30 October 2021
United Nations (2020a) Policy Brief on COVID-19 in an Urban World, https://www.un.org/sites/un2. un.org/files/sg_policy_brief_covid_urban_world_ july_2020.pdf, last accessed 23 March 2022
United Nations (2020b) Policy Brief: COVID-19 and Universal Health Coverage, https://unsdg.un.org/ sites/default/files/2020-10/SG-Policy-Brief-onUniversal-Health-Coverage_English.pdf, last accessed 6 May 2022
United Nations (2020c) Report of the Secretary-General: Roadmap for Digital Cooperation, https:// www.un.org/en/content/digital-cooperationroadmap/assets/pdf/Roadmap_for_Digital_Cooperation_EN.pdf, last accessed 13 October 2021
United Nations (2020d) The Sustainable Development Goals Report 2020, https://www.un.org/ en/file/81908/download?token=BfviFhNa, last accessed 5 May 2022
United Nations (2021a) Our Common Agenda –Report of the Secretary-General, https://www. un.org/en/content/common-agenda-report/assets/ pdf/Common_Agenda_Report_English.pdf, last accessed 24 March 2022
United Nations (2021b) World Economic Situation Prospects, https://www.un.org/development/ desa/dpad/publication/world-economic- situationand-prospects-2021/, last accessed 3 May 2022
United Nations (2021c) The Sustainable Development Goals Report 2021, https://unstats.un.org/sdgs/ report/2021/The-Sustainable-Development-GoalsReport-2021.pdf, last accessed 25 May 2022
United Nations (2021d) ‘Leave no one behind: A people-centered approach to achieve meaningful connectivity’, https://www.un.org/technologybank/news/leave-no-one-behind-people-centered-approach-achieve-meaningful-connectivity, last accessed 25 April 2022
United Nations (2022a) Financing for Sustainable Development Report 2022: Inter-agency Task Force on Financing for Development, United Nations Inter-Agency Task Force on Financing for Development, New York
United Nations (2022b) ‘Ukraine war squeezes food supplies, drives up prices, threatens vulnerable nations’, UN News,13 May, https://news.un.org/ en/story/2022/05/1118172, last accessed 14 May 2022
United Nations (2022c) Global Impact of War in Ukraine on Food, Energy and Finance Systems, UN Brief No.1, https://news.un.org/pages/wpcontent/uploads/2022/04/UN-GCRG-Brief-1.pdf, last accessed 24 May 2022
United Nations High Commissioner for Human Rights (2020) ‘COVID-19 guidance note: Prohibition of evictions’, https://www.ohchr.org/Documents/ Issues/Housing/SR_housing_COVID-19_guidance_evictions.pdf, last accessed 25 February 2022
United Nations University (2020) ‘The importance of decentralized development cooperation for migrants in a post-pandemic world’, https://cpr.
unu.edu/publications/articles/the-importanceof-decentralized-development-cooperation-formigrants-in-a-post-pandemic-world.html, last accessed 25 February 2022
United States Census Bureau (2021) The Supplemental Poverty Measure: 2020, Report No. P60-275, United States Census Bureau, Maryland, https://www.census.gov/library/publications/2021/demo/p60-275.html, last accessed 6 May 2022
United States Census Bureau (2022) ‘Over two-thirds of the nation’s counties had natural decrease in 2021 (Release No. CB22-51)’, https://www. census.gov/newsroom/press-releases/2022/ population-estimates-counties-decrease.html, last accessed 6 May 2022
Université de Montréal (2018) Montréal Declaration for Responsible AI, https://www.montrealdeclaration-responsibleai.com/the-declaration, last accessed 20 May 2022
Unnikrishnan, H. and H. Nagendra (2021) ‘Building climate resilient cities in the Global South: Assessing city adaptation plans in India’, The Round Table 110(5): 575-586, https://doi.org/10 .1080/00358533.2021.1985268, last accessed 19 March 2022
Unnikrishnan, H., V. Castán Broto and H. Nagendra (2020) ‘Commons - producing collaborative sustainable urban development: Experiences of water management in Bangalore, India’, in J. Metzger and J. Lindblad (eds) Dilemmas of Sustainable Urban Development: A View from Practice, 1st Edition, Routledge, United Kingdom, pp. 201-216
UNRISD (United Nations Research Institute for Social Development) (2016) The Human Rights-Based Approach to Social Protection, Issue Brief, No.2, https://cdn.unrisd.org/assets/library/briefs/pdffiles/ib2-human-rights-based-approach.pdf, last accessed 5 May 2022
Urban Europe (2020) ‘Europe Towards Positive Energy: A compilation of projects towards sustainable urbanization and the energy transition’, Vienna, https://jpi-urbaneurope.eu/wpcontent/uploads/2020/06/PED-Booklet-UpdateFeb-2020_2.pdf, last accessed 23 May 2022
Urdal, H. (2004) The Devil in the Demographics: The Effect of Youth Bulges on Domestic Armed Conflicts, 1950- 2000, Social Development Papers: Conflict Prevention and Reconstruction Series, Working Paper No. 14, World Bank, Washington, DC
Urdal, H., and K. Hoelscher (2009) Urban Youth Bulges and Social Disorder: An Empirical Study of Asian and Sub-Saharan African Cities, World Bank, Washington, DC, https://doi. org/10.1596/1813-9450-5110, last accessed 6 April 2022
Vailshery, L. S., M. Jaganmohan and H. Nagendra (2013) ‘Effect of street trees on microclimate and air pollution in a tropical city’, Urban Forestry & Urban Greening 12(3): 408-415
Valencia, S. C., D. Simon, S. Croese, A. Davison, K. Diprose, A. K. Srinivas, J. Nesprias, J. Nordqvist, M. Oloko, T. Sharma, N. Taylor Buck and I. Versace (2021) ‘Urban climate resilience and its link to global sustainability agendas’, in R. C. Brears (ed) The Palgrave Handbook of Climate Resilient Societies, Palgrave Macmillan, Cham, pp. 1-28
Valencia, S. C., D. Simon, S. Croese, J. Nordqvist, M. Oloko, T. Sharma, B. Taylor Buck and N. Versace, I. (2019) ‘Adapting the sustainable development goals and the new urban agenda to the city level: Initial reflections from a comparative research project’, International Journal of Urban Sustainable Development 11(1): 4-23
Valenzuela-Fuentes, K., E. Alarcón-Barrueto and R. Torres-Salinas (2021) ‘From resistance to creation: socio-environmental activism in Chile’s “sacrifice zones”‘, Sustainability 13(6): 3481
Valenzuela-Levi, N. (2021) ‘The written and unwritten rules of internet exclusion: inequality, institu-
tions and network disadvantage in cities of the Global South’, Information, Communication & Society 24(11): 1568-1585
van den Bosch, M. and Å. O. Sang (2017) ‘Urban natural environments as nature-based solutions for improved public health – a systematic review of reviews’, Environmental Research 158: 373-384
van Deursen, A. J. and E. J. Helsper (2018) ‘Collateral benefits of Internet use: Explaining the diverse outcomes of engaging with the Internet’, New Media & Society 20(7): 2333-2351
van Dijk, J. (2020) ‘Closing the digital divide: the role of digital technologies on social development, well-being of all and the approach of the covid-19 pandemic’, in Virtual Expert Group UN Meeting on “Socially just transition towards sustainable development: The role of digital technologies on social development and well-being of all, United Nations, New York, https://www.un.org/ development/desa/dspd/wp-content/uploads/ sites/22/2020/07/Closing-the-Digital-Divideby-Jan-A.G.M-van-Dijk-.pdf, last accessed 27 September 2021
van Hall, R. L., L. H. Cammeraat, S. D. Keesstra and M. Zorn (2017) ‘Impact of secondary vegetation succession on soil quality in a humid Mediterranean landscape’, Catena 149: 836-843
van Lente, H., T. Swierstra and P. Joly (2017) ‘Responsible innovation as a critique of technology assessment’, Journal of Responsible Innovation 4(2): 254-261
van Noordt, C. and G. Misuraca (2019) ‘New Wine in Old Bottles: Chatbots in Government’, in P. Panagiotopoulos, N. Edelmann, O. Glassey, G. Misuraca, P. Perycak, T. Lampoltshammer and B. Re (eds) Electronic Participation: ePart 2019, pp. 49-59
van Rensburg, N., A. N. Matheri and J. Meyer (2019) ‘Bridging the Digital Divide in an African Smart City’, 5th IEEE International Smart Cities Conference ISC2 2019, pp. 518-526
van Vliet-Brown, C. E., S. Shahram and N. D. Oelke (2018) ‘Health in All Policies utilization by municipal governments: Scoping review’, Health Promotion International 33(4): 713-722
Venables, A. J. (2015) Making Cities Work for Development, International Growth Centre, Growth Brief Series, No. 002, IGC, London
Venkateswaran, R. K. (2014) ‘Municipal financial management’, in C. D. Farvacque-Vitkovic and M. Kopanyi (eds) Municipal Finances: A Handbook for Local Governments, World Bank, Washington, DC
Venter, Z. S., K. Aunan, S. Chowdhury and J. Lelieveld (2020) ‘COVID-19 lockdowns cause global air pollution declines’, Proceedings of the National Academy of Sciences, 117(32): 18984–18990
Vila, R., E. Estevez and P. R. Fillottrani (2018) ‘The design and use of dashboards for driving decision-making in the public sector’, in Proceedings of the 11th International Conference on Theory and Practice of Electronic Governance (ICEGOV ‘18), pp. 382–388
Viola, C. O. (2020) ‘The future of water: How innovations will advance water sustainability and resilience worldwide’, World Bank Blogs, 15 June, https://blogs.worldbank.org/water/ future-water-how-innovations-will-advance-watersustainability-and-resilience-worldwide, last accessed 8 November 2021
Vilcu, I., L. Probst, B. Dorjsuren and I. Mathauer (2016) ‘Subsidized health insurance coverage of people in the informal sector and vulnerable population groups: Trends in institutional design in Asia’, International Journal for Equity in Health, 15(1): 1-29
Vojnovic, I., A. L. Pearson, G. Asiki, G. DeVerteuil and A. Allen (2019) ‘Global urban health: Inequalities, vulnerabilities, and challenges in the 21st century’ in I. Vojnovic, A.L. Pearson, G. Asiki, G. DeVerteuil and A. Allen (eds) Handbook of Global Urban Health, Routledge, New York, pp. 1-32
Volans (2020) Procuring a Regenerative Economy: The Critical Role of Sourcing in Generating the Future We Want, Volans Ventures Ltd, London, https://volans.com/wp-content/uploads/2020/01/ Procuring-a-Regenerative-Economy-FINAL.pdf, last accessed 19 March 2022
Vollset, S. E., E. Goren, C. Yuan, J. Cao, A. E. Smith, T. Hsiao, C. Bisignano, G. S. Azhar, E. Castro, J. Chalek, A. J. Dolgert, T. Frank, K. Fukutaki, S. I. Hay, R. Lozano, A. H. Mokdad, V. Nandakumar, M. Pierce, M. Pletcher, T. Robalik, K. M. Steuben, H. Y. Wunrow, B. S. Zlavog and C. J. L. Murray (2020) ‘Fertility, mortality, migration, and population scenarios for 195 countries and territories from 2017 to 2100: A forecasting analysis for the global burden of disease study’, The Lancet 396(10258): 1285-1306 https:// doi.org/10.1016/S0140-6736(20)30677-2, last accessed 7 April 2022
Wade, L. (2020) ‘An unequal blow’, Science 368(6492): 700–703
Wahba, S., M. M. Sharif, M. Mizutori and L. Sorkin (2020) ‘Cities are on the front lines of COVID19’, World Bank Blogs, 12 May, https://blogs. worldbank.org/sustainablecities/cities-are-frontlines-covid-19, last accessed 3 May 2022
Wahl, B., S. Lehtimaki, S. Germann and N. Schwalbe (2020) ‘Expanding the use of community health workers in urban settings: A potential strategy for progress towards universal health coverage’, Health Policy and Planning 35(1): 91-101
Walker, W. E., V. A. Marchau and D. Swanson (2010) ‘Addressing deep uncertainty using adaptive policies: Introduction to section 2’, Technological Forecasting and Social Change 77(6): 917-923
Walling, D., R. Sadler and D. Lafreniere (2021) ‘Lessons from U.S. rust belt cities for equitable low-growth futures’, Urban Research & Practice 14(4): 471-482
Wang, D., T. Zhou and M. Wang (2021) ‘Information and communication technology (ICT), digital divide and urbanization: Evidence from Chinese cities’, Technology in Society 64: 101516
Wang, H. and A. Rodríguez-Pose (2021) ‘Local institutions and pandemics: City autonomy and the Black Death’, Applied Geography 136(3):102582
Wang, H. and R. B. Noland (2021) ‘Bikeshare and subway ridership changes during the COVID-19 pandemic in New York City’, Transport Policy 106: 262–270
Wang, J, C. Wang and Y. Zhang (2020) ‘Four decades of poverty and consumption in China’, The Singapore Economic Review 65(Supp 1): 117-138
Wang, M. L. and M. Otis (2019) ‘Improving access to healthy food in cities’, in S. Galea, C. K. Ettman and D. Vlahov (eds) Urban Health, Oxford University Press, Oxford, pp. 148-155
Warner, J. F. and H. Wiegel (2021) ‘Displacement induced by climate change adaptation: The case of ‘climate buffer’ infrastructure’, Sustainability 13(16): 9160
Watson, J., A. S. Yazbeck and L. Hartel (2021) ‘Making health insurance pro-poor: Lessons from 20 developing countries’, Health Systems & Reform 7(2): e1917092
Watson, V. (2009) ‘‘The planned city sweeps the poor away…’: urban planning and 21st century urbanisation’, Progress in Planning 72(3): 151-193
Watson, V. (2014) ‘African urban fantasies: Dreams or nightmares?’ Environment and Urbanization 26(1): 215-231
Watson, V. (2014) ‘Co-production and collaboration in planning–The difference’, Planning Theory & Practice 15(1): 62-76
Watt, P. (2017) ‘Social housing and urban renewal’, in P. Watt and P. Smets (eds) Social Housing and Urban Renewal: A Cross-National Perspective, Emerald Publishing, Bingley, pp. 1-36
Weiss, L. M. (2014) ‘Informal settlements and urban heritage landscapes in South Africa’, Journal of Social Archaeology 14(1): 3-25
Wellcome Trust (2021) ‘Wellcome Global Monitor 2020: Covid-19,’ https://cms.wellcome.org/sites/
default/files/2021-11/wgm-public-file-covid-crosstabs.xlsx, last accessed 25 February 2022 West, P. (2019) ‘The Whitemosphere’: unsettling Western design epistemes through Indigenous sovereignty and the racialized logics of whiteness’, in Proceedings of the 2019 Australian Council of Art and Design Conference: Engagement (ACUADS 2019), RMIT University, pp. 1-11 West, S., A. Castro Baker, S. Samra and E. Coltrera (2021) Stockton Economic Empowerment Demonstration, Preliminary Analysis: SEED’s First Year, SEED, Stockton, https://static1.squarespace.com/static/6039d612b17d055cac14070f/ t/6050294a1212aa40fdaf773a/1615866187890/ SEED_Preliminary+Analysis-SEEDs+First+Year_ Final+Report_Individual+Pages+.pdf, last accessed 8 November 2021
Westbury, S., I. Ghosh, H. M. Jones, D. Mensah, F. Samuel, A. Irache, N. Azhar, L. Al-Khudairy, R. Iqbal and O. Oyebode (2021) ‘The influence of the urban food environment on diet, nutrition and health outcomes in low-income and middleincome countries: A systematic review’, BMJ Global Health 6(10): e006358
WFP (World Food Programme) (2020) Social Protection and Covid-19 in Urban and Rural Settings – 2020, https://docs.wfp.org/api/documents/ WFP-0000123459/download, last accessed 5 May 2022
Whitehead, M. (1992) ‘The concepts and principles of equity and health’, International Journal of Health Services 22(3): 429–45
Whitney, C. R. (1973) ‘4 European countries and West Berlin spend a car-free Sunday’, The New York Times, 26 November, https://www.nytimes. com/1973/11/26/archives/4-european-countriesand-west-berlin-spend-a-carfree-sunday-berlin. html?smid=url-share, last accessed 22 May 2022
Whittlestone, J., R. Nyrup, A. Alexandrova, K. Dihal and S. Cave (2019) Ethical and Societal Implications of Algorithms, Data, And Artificial Intelligence: A Roadmap for Research, Nuffield Foundation, London
WHO (World Health Organization) (2015) Health in All Policies: Training Manual, https://www.who. int/publications-detail-redirect/9789241507981, last accessed 24 March 2022
WHO (2016) Burning Opportunity: Clean Household Energy for Health, Sustainable Development, and Wellbeing of Women and Children, World Health Organization, Geneva, https://www.who.int/ publications/i/item/burning-opportunity-cleanhousehold-energy-for-health-sustainable-development-and-wellbeing-of-women-and-children, last accessed 24 March 2022
WHO (2018a) Air Pollution and Child Health: Prescribing Clean Air, https://www.who.int/ publications/i/item/air-pollution-and-child-health, last accessed 19 March 2022
WHO (2018b) Global Status Report on Road Safety 2018, World Health Organization, Geneva, https://www.who.int/publications/i/ item/9789241565684, last accessed 24 March 2022
WHO (2018c) ‘9 out of 10 people worldwide breathe polluted air, but more countries are taking action’, https://www.who.int/news/item/02-052018-9-out-of-10-people-worldwide-breathepolluted-air-but-more-countries-are-taking-action, last accessed 8 November 2021
WHO (2020) ‘The top 10 causes of death’, https:// www.who.int/news-room/fact-sheets/detail/ the-top-10-causes-of-death, last accessed 10 May 2022
WHO (2021a) Building Health Systems Resilience for Universal Health Coverage and Health Security During the COVID-19 Pandemic and Beyond, WHO Position Paper, No. WHO/UHL/PHCSP/2021.01, https://www.who.int/publications/i/ item/WHO-UHL-PHC-SP-2021.01, last accessed 24 March 2022
WHO (2021b) ‘Universal Health Coverage (UHC)’, https://www.who.int/news-room/fact-sheets/
detail/universal-health-coverage-(uhc), last accessed 11 April 2022
WHO (2021c) ‘COVID-19 and the social determinants of health and health inequity: Evidence Brief’, Geneva, https://www.who.int/publications/i/ item/9789240038387, last accessed 19 March 2022
WHO (2021d) ‘Dementia care at home: Telemedicine assessments for dementia patients’, https://www. who.int/publications/m/item/dementia-care-athome-telemedicine-assessments-for-dementiapatients, last accessed 10 May 2022
WHO (2021e) ‘Global leaders unite in urgent call for international pandemic treaty’, https://www.who. int/news/item/30-03-2021-global-leaders-unitein-urgent-call-for-international-pandemic-treaty, last accessed 6 May 2022
WHO (2021f) ‘Road traffic injuries’, https://www. who.int/news-room/fact-sheets/detail/road-trafficinjuries, last accessed 30 April 2022
WHO (2021g) ‘What are the WHO Air quality guidelines? Improving health by reducing air pollution’, https://www.who.int/news-room/feature-stories/detail/what-are-the-who-air-qualityguidelines, last accessed 24 March 2022
WHO (2021h) WHO Global Air Quality Guidelines: Particulate Matter ( And ), Ozone, Nitrogen Dioxide, Sulfur Dioxide And Carbon Monoxide, https://apps.who.int/iris/bitstream/ handle/10665/345329/9789240034228-eng. pdf?sequence=1&isAllowed=y, last accessed 24 March 2022
WHO (2022a) ‘Besiktas municipality’s social centers’, https://extranet.who.int/agefriendlyworld/ afp/besiktas-municipalitys-social-centers, last accessed 9 May 2022
WHO (2022b) ‘Bio-healthy parks’, https://extranet. who.int/agefriendlyworld/afp/bio-healthy-parks, last accessed 9 May 2022
WHO (2022c) ‘Committed to becoming more age friendly’, Geneva, https://extranet.who.int/agefriendlyworld/network/manchester, last accessed 9 May 2022
WHO (2022d) ‘Constitution’, https://www.who.int/ about/governance/constitution, last accessed 22 March 2022
WHO (2022e) ‘Measles – Afghanistan’, https://www. who.int/emergencies/disease-outbreak-news/item/ measles-afghanistan, last accessed 4 May 2022
WHO (undated) ‘Air pollution’, https://www.who. int/health-topics/air-pollution#tab=tab_1, last accessed 11 May 2022
WHO and IBRD/World Bank (2021) Tracking Universal Health Coverage: 2021 Global Monitoring Report, https://www.who.int/publications/i/ item/9789240040618, last accessed 24 March 2022
WHO and UN-Habitat (2016) Global Report on Urban Health: Equitable, Healthier Cities for Sustainable Development, https://apps.who.int/iris/ handle/10665/204715, last accessed 24 March 2022
WHO and UNICEF (2021) Progress on Household Drinking Water, Sanitation and Hygiene 2000-2020: Five Years into the SDGs, https:// reliefweb.int/sites/reliefweb.int/files/resources/ JMP-2021-progress-report.pdf, last accessed 11 April 2022
WHO Regional Office for Europe (2019) A Multilevel Governance Approach to Preventing and Managing Noncommunicable Diseases: The Role of Cities and Urban Settings, https://www.euro.who. int/__data/assets/pdf_file/0007/397789/Citiesand-NCDs.pdf, last accessed 24 March 2022
WHO Regional Office for Europe (2022) ‘Healthy cities vision’, https://www.euro.who.int/en/ health-topics/environment-and-health/urbanhealth/who-european-healthy-cities-network/ healthy-cities-vision, last accessed 22 March 2022
WHO Rwanda (2020) ‘COVID-19 response in Rwanda: Use of drones in community awareness’, https:// www.afro.who.int/news/covid-19-response-
rwanda-use-drones-community-awareness, last accessed 24 March 2022
Whyte, K. (2021) ‘Experts: Why does ‘climate justice’ matter?’, Carbon Brief, 7 October, https://www. carbonbrief.org/experts-why-does-climate-justicematter, last accessed 19 March 2022
Wielemaker, R., J. Stuiver, G. Zeeman and J. Weijma (2020) ‘Identifying Amsterdam’s nutrient hotspots: a new method to map human excreta at building and neighborhood scale’, Journal of Industrial Ecology 24(3): 473-484
Wijngaarde, I., J. Vinanchiarachi and J. Readman (2021) ‘Universal Basic Income (UBI) for reducing inequalities and increasing socio-economic inclusion: A proposal for a new sustained policy perspective’, in H. Kury and S. Redo (eds) Crime Prevention and Justice in 2030, Springer, Netherlands
Wilkinson, A. (2020) ‘Local response in health emergencies: key considerations for addressing the COVID-19 pandemic in informal urban settlements’, Environment and Urbanization 32(2): 503-522
Willett, W., J. Rockström, B. Loken, M. Springmann, T. Lang, S. Vermeulen, T. Garnett, D. Tilman, F. DeClerck, A. Wood, M. Jonell, M. Clark, L. J. Gordon, J. Fanzo, C. Hawkes, R. Zurayk, J. A. Rivera, W. De Vries, L. M. Sibanda, A. Afshin, A. Chaudhary, M. Herrero, R. Augustina, F. Branca, A. Lartey, S. Fan, B. Crona, E. Fox, V. Bignet, M. Troell, T. Lindahl, S. Singh, S. E. Cornell. K. S. Reddy, S. Narain, S. Nishtar and C. J. L. Murray (2019) ‘Food in the Anthropocene: the EAT–Lancet Commission on healthy diets from sustainable food systems’, The Lancet 393(10170): 447-492
Williams, D. R., J. A. Lawrence and B.A. Davis (2019) ‘Racism and health: Evidence and needed research’, Annual Review of Public Health 40: 105-125
Williams, G., B. V. Thampi, D. Narayana, S. Nandigama and D. Bhattacharyya (2011) ‘Performing participatory citizenship– Politics and power in Kerala’s Kudumbashree programme’, Journal of Development Studies 47(8):1261-1280
Williams, G., J. Devika and G. Aandahl (2015) ‘Making space for women in urban governance? Leadership and claims-making in a Kerala slum’, Environment and Planning A 47(5): 1113-1131
Williams, G., U. Omanakuttan, J. Devika and N. Jagajeevan (2019) ‘Planning a “slum free” Trivandrum: Housing upgrade and the rescaling of urban governance in India’, Environment and Planning C: Politics and Space 37(2):256-276
Willis, K. S. (2019) ‘Whose right to the smart city?’, in P. Cardullo, C. Di Feliciantonio and R. Kitchin (eds) The Right to the Smart City, Emerald Publishing Limited, Bingley, pp. 27-41
Woetzel, J., N. Garemo, J. Mischke, P. Kamra and R. Palter (2017) Bridging Infrastructure Gaps: Has the World Made Progress?, McKinsey & Company, New York, https://www.mckinsey.com/businessfunctions/operations/our-insights/bridging-globalinfrastructure-gaps, last accessed 3 May 2022
Wood, A. J., M. Graham, V. Lehdonvirta and I. Hjorth (2019) ‘Good gig, bad gig: Autonomy and algorithmic control in the global gig economy’, Work, Employment and Society 33(1): 56-75
World Bank (2010) World Development Report 2010: Development and Climate Change, World Bank, Washington, DC, http://www.worldbank.org/wdr, last accessed 25 February 2022
World Bank (2015) World Inclusive Cities Approach Paper, Report No. AUS8539, World Bank, Washington, DC, https://documents1.worldbank. org/curated/en/402451468169453117/pdf/ AUS8539-REVISED-WP-P148654-PUBLICBox393236B-Inclusive-Cities-Approach-Paper-wAnnexes-final.pdf, last accessed 5 May 2022
World Bank (2016) World Development Report 2016: Digital Dividends, World Bank, Washington, DC
World Bank (2018a) Poverty and Shared Prosperity 2018: Piecing Together the Poverty Puzzle, World Bank, Washington, DC
World Bank (2018b) Ghana Secondary Cities Support Program Technical Assessment, World Bank, Washington, DC, https://documents1.worldbank. org/curated/en/107671536083152882/pdf/FinalTechnical-Assessment-Ghana-Secondary-CitiesSupport-Program-P164451.pdf, last accessed 04 March 2022
World Bank (2018c) ‘What a waste: An updated look into the future of solid waste management’, https://www.worldbank.org/en/news/immersivestory/2018/09/20/what-a-waste-an-updatedlook-into-the-future-of-solid-waste-management, last accessed 8 November 2021
World Bank (2020a) ‘GDP (current US$)’, World Bank: Data, https://data.worldbank.org/indicator/ NY.GDP.MKTP.CD, last accessed 6 May 2022
World Bank (2020b) ‘Global action urgently needed to halt historic threats to poverty reduction’, https://www.worldbank.org/en/news/ feature/2020/10/07/global-action-urgentlyneeded-to-halt-historic-threats-to-poverty-reduction, last accessed 5 May 2022
World Bank (2020c) ‘COVID-19 turns spotlight on slums’, https://www.worldbank.org/en/news/ feature/2020/06/10/covid-19-turns-spotlight-onslums, last accessed 5 May 2022
World Bank (2020d) Urban Mobility and Covid-19 in Africa: Transport Global Practice, World Bank Group Africa Transport Policy Program, https:// www.ssatp.org/sites/ssatp/files/publication/ COVID19%20and%20Public%20Transport%20 in%20Africa%20-%20FINAL%20-%20Aug2020%20 -%20ENGLISH.pdf, last accessed 5 May 2022
World Bank (2020e) Poverty and Shared Prosperity 2020: Reversals of Fortune, World Bank, Washington, DC World Bank (2020f) Mauritania. Country Economic Memorandum: Accelerating Growth Through Diversification and Productive Cities, World Bank, Washington, DC
World Bank (2020g) City Resilience Program: Annual Report July 2019 – June 2020, http://documents1.worldbank.org/curated/ en/343941611599652517/pdf/City-ResilienceProgram-Annual-Report-July-2019-June-2020.pdf, last accessed 11 May 2022
World Bank (2020h) City Resilience Program: Annual Report July 2020 – June 2021, http://documents1.worldbank.org/curated/ en/835361644295920445/pdf/City-ResilienceProgram-Annual-Report-July-2020-June-2021.pdf, last accessed 11 May 2022
World Bank (2021a) ‘Future of cities will shape post-COVID-19 world’, https://www.worldbank. org/en/news/feature/2021/03/02/future-of-citieswill-shape-post-covid-19-world, last accessed 8 November 2021
World Bank (2021b) ‘Narrowing the digital divide can foster inclusion and increase jobs’, https://www. worldbank.org/en/news/feature/2021/09/24/ narrowing-the-digital-divide-can-foster-inclusionand-increase-jobs, last accessed 27 September 2021
World Bank (2021c) World Development Report 2021: Data for Better Lives, http://www.worldbank.org/ wdr, last accessed 25 February 2022
World Bank (2022a) Inequality in Southern Africa: An Assessment of the Southern African Customs Union, World Bank Group, Washington, DC
World Bank (2022b) Global Economic Prospects, January 2022, World Bank, Washington, DC
World Data Lab (2022) ‘World poverty map’, https:// worldpoverty.io/map, last accessed 6 May 2022
World Economic Forum (2017) Harnessing the Fourth Industrial Revolution for Sustainable Emerging Cities, World Economic Forum, Geneva
World Economic Forum (2020a) ‘Coronavirus has exposed the digital divide like never before’, https://www.weforum.org/agenda/2020/04/ coronavirus-covid-19-pandemic-digital-divideinternet-data-broadband-mobbile/, last accessed 25 February 2022
World Economic Forum (2020b) The Future of Jobs Report 2020, World Economic Forum, Cologny
World Economic Forum and IDFC Forum (2021) Indian Cities in the Post-Pandemic World, World Economic Forum White Papers, https:// https:// www3.weforum.org/docs/WEF_Indian_Cities_ in_the_Post_Pandemic_World_2020.pdf, last accessed 11 May 2022
World Commission on Environment and Development (1987) Our Common Future, Oxford University Press, Oxford
World Resources Institute, International Trade Union Confederation, and New Climate Economy (2021) The Green Jobs Advantage: How Climate-friendly Investments Are Better Job Creators, Working Paper, https://www.wri.org/research/green-jobsadvantage-how-climate-friendly-investments-arebetter-job-creators, last accessed 6 June 2022
Wright, M. (2021) ‘How the digital divide threatens the success and legitimacy of the COP26 talks’, https://www.iied.org/how-digital-divide-threatenssuccess-legitimacy-cop26-talks, last accessed 13 October 2021
Wu, F., and F. Zhang (2021) ‘Rethinking China’s urban governance: The role of the state in neighbourhoods, cities and regions’, Progress in Human Geography: an international review of geographical work in the social sciences and humanities (in press)
Wu, Z., R. Chen, M.E. Meadows, D. Sengupta and D. Xu (2019) ‘Changing urban green spaces in Shanghai: Trends, drivers and policy implications’, Land Use Policy 87: 104080
WWAP (United Nations World Water Assessment Programme)(2016) The United Nations World Water Development Report 2016: Water and Jobs, United Nations Educational, Scientific and Cultural Organization, Paris, http: //www.unesco. org/new/en/natural-sciences/environment/water/ wwap/wwdr/2016-water-and-jobs/, last accessed 3 May 2022
WWF (World Wide Fund For Nature) (2020) ‘One Planet City Challenge’, https://wwf.panda.org/ projects/one_planet_cities/one_planet_city_challenge_2021_2022, last accessed 20 May 2022
Yadav, V., S. Ghosh, K. Mueller, A. Karion, G. Roest, S. M. Gourdji, , I. Lopez Coto, K. R. Gurney, N. Parazoo, K. R.Verhulst, J. Kim, S. Prinzivalli, C. Fain, T. Nehrkorn, M. Mountain, R. F. Keeling, R. F. Weiss, R. Duren, C. E. Miller and J. Whetstone (2021) ‘The impact of COVID 19 on CO 2 emissions in the Los Angeles and Washington DC/Baltimore metropolitan areas’ Geophysical Research Letters 48(11): e2021GL092744
Yadavalli, A., C. K. McFarland and S. Wagner (2020) What COVID-19 Means for City Finances, https:// covid19.nlc.org/wp-content/uploads/2020/06/ What-Covid-19-Means-For-City-Finances_ReportFinal.pdf, last accessed 27 February 2022
Yamagata, Y. and P. Yang (eds) (2020) Urban Systems Design: Creating Sustainable Smart Cities in the Internet of Things Era, First Edition, Elsevier, Netherlands, Oxford and Cambridge, USA
Ye, L. (2014) ‘State-led metropolitan governance in China: Making integrated city regions’, Cities, 41:200-208
Yigitcanlar, T. and F. Cugurullo (2020) ‘The sustainability of Artificial Intelligence: An urbanistic viewpoint from the lens of smart and sustainable cities’, Sustainability 12(20): 8548
Yigitcanlar, T., J. M. Corchado, R. Mehmood, R. Yi Man Li, K. Mossberger and K. Desouza (2021) ‘Responsible urban innovation with local government Artificial Intelligence (AI): A conceptual framework and research agenda’, Journal of Open Innovation: Technology, Market, and Complexity 7(71): 71
Yiran, G. A. B., A. D. Ablo, F. E. Asem and G. Owusu (2020) ‘Urban sprawl in Sub-Saharan Africa: A review of the literature in selected countries’, Ghana Journal of Geography 12(1): 1-28
Yli-Pelkonen, V. and J. Kohl (2005) ‘The role of local ecological knowledge in sustainable urban planning: Perspectives from Finland’, Sustainability: Science, Practice and Policy 1(1): 3-14
You, H., X. Wu, and X. Guo (2020) ‘Distribution of COVID-19 morbidity rate in association with social and economic factors in Wuhan, China: Implications for urban development’, International Journal of Environmental Research and Public Health 17(10): 3417
You, X. (2021) ‘Analysis: how power shortages might “accelerate” China’s climate action’, Carbon Brief, 13 October, https://www.carbonbrief.org/analysishow-power-shortages-might-accelerate-chinasclimate-action, last accessed 19 March 2022
Young, G. W., R. Kitchin and J. Naji (2021) ‘Building city dashboards for different types of users’, Journal of Urban Technology 28(1-2): 289-309
Zakaria, F. (2020) Ten Lessons for a Post-Pandemic World, W. W Norton & Company, New York
Zapata, M. A. and N. Kaza (2015) ‘Radical uncertainty: Scenario planning for futures’, Environment and Planning B: Planning and Design 42(4): 754-770
Zelinsky, W. (1971) ‘The hypothesis of the mobility transition’, Geographical Review 61(2): 219-249, https://doi.org/10.2307/213996, last accessed 6 April 2022
Zeng, D. Z. (2016) Building a Competitive City through Innovation and Global Knowledge. The Case of Sino-Singapore Suzhou Industrial Par, Policy Research Working Paper, No. 7570, World Bank, Washington, DC
Ženka, J, O. Slach and A. Pavlík (2019) ‘Economic resilience of metropolitan, old industrial, and rural regions in two subsequent recessionary shocks’, European Planning Studies 27 (11): 2288-2311
Zhang, F. and F. Wu (2019) ‘Rethinking the city and innovation: A political economic view from China’s biotech’, Cities 85: 150-155 Zhang, J., L. Yan and Y. Yuan (2019) ‘Rural-urban migration and mental health of Chinese migrant children: Systematic review and meta-analysis’, Journal of Affective Disorders 257: 684-690 Zhang, M., P. Zhao and S. Qiao (2020) ‘Smartnessinduced transport inequality: Privacy concern, lacking knowledge of smartphone use and unequal access to transport information’, Transport Policy 99: 175-185
Zhang, Y. and Y. Li (2015) ‘The application of the smart technique in the construction and management of urban park green spaces’, International Journal of Smart Home 9(9): 113-118
Zhen, S. (2021) ‘Free public transportation: why we need it, and examples from Korean and European cities’, Sustainable Mobility ICLEI, 30 April, https://sustainablemobility.iclei.org/free-publictransportation, last accessed 19 March 2022
Zhong, H., J. Xu and A. R. Piquero (2017) ‘Internal migration, social exclusion, and victimization: An analysis of Chinese rural-to-urban migrants’, Journal of Research in Crime and Delinquency 54(4): 479-514
Zhou, L. and B. Parmanto (2019) ‘Reaching people with disabilities in underserved areas through digital interventions: Systematic review’, Journal of Medical Internet Research 21(10): e12981 Zhuang, Z. C., S. Edge and J. Dean (2021) ‘What is the future of public space? Hidden stories of immigrant suburbs during a global pandemic’, Town Planning Review 92(2): 229–237
Ziegler, S., M. Menon and P. Annichino (2019) ‘IoT privacy and security in smart cities’, in S. Ziegler (ed) Internet of Things Security and Data Protection, Springer, Netherlands, pp.149-171
Ziervogel, G. (2019) ‘Building transformative capacity for adaptation planning and implementation that works for the urban poor: Insights from South Africa’, Ambio 48(5): 494-506
Ziervogel, G., M. Pelling, A. Cartwright, E. Chu, T. Deshpande, L. Harris, K. Hyams, J. Kaunda, B. Klaus, K. Michael, L. Pasquini, R. Pharoah, L. Rodina, D. Scott and P. Zweig (2017) ‘Inserting rights and justice into urban resilience: A focus on everyday risk’, Environment and Urbanization 29(1): 123-138
Ziller, C. and S. W. Goodman (2020) ‘Local government efficiency and anti-immigrant violence’, The Journal of Politics, 82(3):895-907
Ziter, C. D., E. J. Pedersen, C. J. Kucharik and M. G. Turner (2019) ‘Scale-dependent interactions between tree canopy cover and impervious surfaces reduce daytime urban heat during summer’, Proceedings of the National Academy of Sciences 116(15): 7575-7580

The emergence of the COVID-19 pandemic in 2020 created a temporary crisis of confidence in the future of cities. However, a broad consensus is that urbanization remains a powerful twenty-first century mega-trend; and that well-planned towns and cities remain central to the sustainable development trajectory. There is a sense of optimism that the crisis may provide us with the opportunity to build back differently, more inclusively, greener and safer.
World Cities Report 2022: Envisaging the Future of Cities seeks to provide greater clarity and insights into the future of cities based on existing trends, challenges and opportunities, as well as disruptive conditions, including the valuable lessons from the COVID-19 pandemic, and suggests ways that cities can be better prepared to address a wide range of shocks and transition to sustainable urban futures. The Report proposes a state of informed preparedness that provides us with the opportunity to anticipate change, correct the course of action and become more knowledgeable of the different scenarios or possibilities that the future of cities offers.
Building economic, social and environmental resilience, including appropriate governance and institutional structures, must be at the heart of the future of cities. Economic resilience with new fiscal sustainability frameworks, societal resilience with universal social protection schemes, climate resilience with greener investments and stronger multilevel collaboration to confront future shocks—these are the main elements of a resilient future that can withstand and respond to the various threats and shocks facing urban areas.
The Report identifies three possible scenarios of urban futures: high damage, pessimistic and optimistic. Avoiding the high damage scenario and manifesting an optimistic urban future requires collaborative, well-coordinated and effective multilateral interventions. The response to the current urban crisis can lead to a collective reprioritization of cities across the world towards shared prosperity and inclusion.
The Report shows that the path to sustainable urban futures will be determined by inclusive and transformative policies to eradicate poverty and inequality; produce urban economies that provide opportunities for all; generate greener investment for sustainable consumption and production patterns; pursue responsive urban and territorial planning; implement collaborative and integrated governance; prioritize public health; deploy inclusive innovation and technology; and build resilience across multiple dimensions. During the Decade of Action (2020–2030), cities and subnational governments must urgently adopt approaches that will foster the optimistic scenario of urban futures. The localization and effective implementation of the New Urban Agenda serves as a framework for integrating the interrelated components that constitute these pathways.
UNITED NATIONS
Box 30030, Nairobi 00100
unhabitat-info@un.org
HS Number: HS/004/22E
ISBN Number(Series): 978-92-1-133395-4
ISBN Number: 978-92-1-132894-3
ISBN 978-92-1-132894-3
