MARKET TRENDS
2nd Quarter Market Report from the Market Leader

Reno/Sparks Regional Price Map
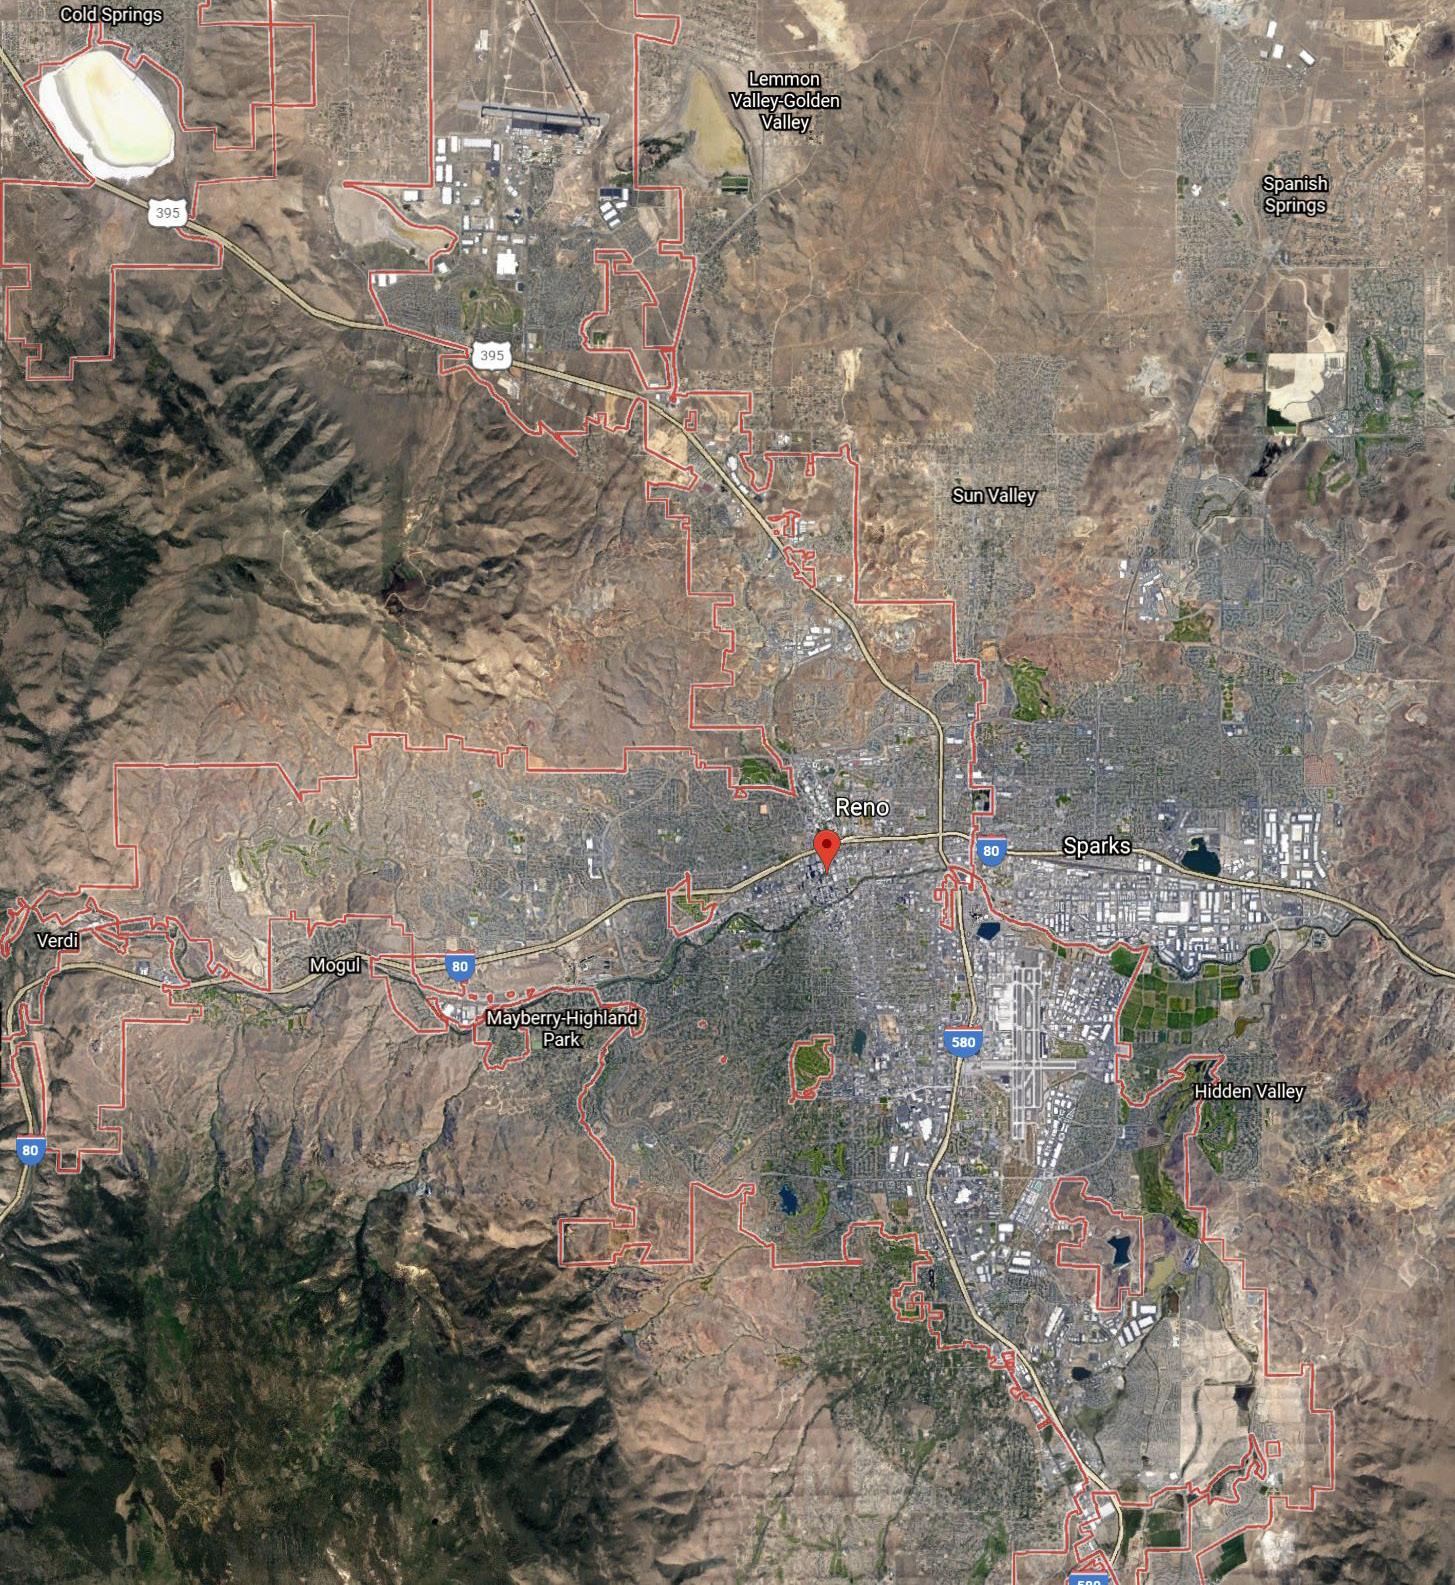
2nd Quarter 2023,
as of June 30, 2023
Data Source: Northern NV Regional MLS (NNRMLS)
NEW SOUTHWEST
SPANISH SPRINGS SINGLE FAMILY Median Sales $ $575,000 Year to year change -9.9% Average Price/SF $274.55 Median Sales $ $423,897 Year to year change -0.5% Average Price/SF $289.79 CONDO NORTH VALLEYS SINGLE FAMILY Median Sales $ $439,945 Year to year change -8.4% Average Price/SF $266.24 Median Sales $ $390,500 Year to year change +11.6% Average Price/SF $253.39 CONDO NORTH URBAN SINGLE FAMILY Median Sales $ $460,000 Year to year change -11.5% Average Price/SF $303.03 Median Sales $ $265,000 Year to year change -21.4% Average Price/SF $275.01 CONDO SPARKS SINGLE FAMILY Median Sales $ $476,000 Year to year change -6.7% Average Price/SF $280.45 Median Sales $ $310,000 Year to year change +3.3% Average Price/SF $261.31 CONDO NEW NORTHWEST SINGLE FAMILY Median Sales $ $645,000 Year to year change -7.3% Average Price/SF $334.38 Median Sales $ $362,500 Year to year change -0.7% Average Price/SF $319.13 CONDO OLD SOUTHWEST SINGLE FAMILY Median Sales $ $801,000 Year to year change -0.5% Average Price/SF $367.31 Median Sales $ $387,000 Year to year change +5.4% Average Price/SF $324.35 CONDO OLD SOUTHEAST SINGLE FAMILY Median Sales $ $474,950 Year to year change -5.0% Average Price/SF $321.54 Median Sales $ $262,500 Year to year change +9.4% Average Price/SF $273.64 CONDO
SINGLE FAMILY Median Sales $ $1,425,000 Year to year change +3.9% Average Price/SF $473.85 Median Sales $ $426,000 Year to year change -9.7% Average Price/SF $323.19 CONDO NEW SOUTHEAST SINGLE FAMILY Median Sales $ $675,000 Year to year change -7.5% Average Price/SF $328.11 Median Sales $ $440,000 Year to year change -7.4% Average Price/SF $339.00 CONDO
Properties Sold Available Listings
Reno/Sparks Market Overview
Months of Inventory
Percentage of Sales
Percentage
Percentage of Sales
Although, we have finally seen temperatures rise, the real estate market, while solid, is not the same hot market of the past two “covid” years. While those were remarkable years for sellers, it was not a healthy or sustainable trend for buyers, particularly first time buyers which are an important cornerstone of a balanced housing economy that feeds the move up market. It is time to adjust the expectations of all to the reality of the market.
As of June 30, 2023, there were 711 homes available for purchase in the Reno/Sparks real estate market. While this is an increase over 12% from May, it is a -38% decrease from June of 2022. We are seeing inventory climb month over month, which is healthy especially this time of year. However we are still inventory “light”. In our area, we need to be building more residential units (whether single family houses or condominiums) which are tempered by the high cost of building and land. This is not a new issue but a factor for the last ten plus years. The impact of tight inventories versus demand is reflected in the median price of homes as well as the days on market.
Months of Inventory is the amount of time it would take to sell all existing homes for sale if no additional homes entered the market. A five or six month supply of homes historically represents a balanced market, where neither buyers nor sellers have an advantage.
For current months supply of inventory based on price ranges, we have:
0.6 months of inventory in the $0 to $400,000 price range
1.3 months of inventory from $400,000 to $700,000
2.9 months of inventory from $700,000 to $1,000,000
4.3 months of inventory from $1,000,000 to $1,500,000
8.3 months of inventory for homes priced over $1,500,000
Our region had 2,146 home sales from January to June 30, 2023. That is 22.16% less than the 2,757 homes sold from the same time period in 2022. Again the “covid years” were exceptional years for a variety of reasons, coupled with higher mortgage rates and severe winter weather through April. We expect to see a more normal sales trend by year end.
Source: NNRMLS Residential listings/sales, area 100
Breaking down the home sales by price range through June, we see that:
75.6% of sales were under $700,000
15% of sales were between 700,000 and $1,000,000
9.4% of sales were over $1,000,000
Mortgage rates have been fluctuating, so be sure that you have been pre-qualified by a lender to understand how much house you can afford before you begin your search for a new home. If you are selling, you should work closely with a professional REALTOR to establish a realistic pricing strategy when going to market to sell your home for top dollar and within your timeframe goal. A professional real estate agent with negotiation and market expertise is as important now as it has ever been, whether buying or selling.
0 2 4 6 8 10 8.3 Months 4.3 Months 2.9 Months 1.3 Month 0.6 Months 15% 5.4% 4% 11.9% 63.7 $400,000 and Below $400,001 $700,000 $700,001 $1,000,000 $1,000,001 $1,500,000 $1,500,001 and Above
Market 0 200 0 140 0 76000 0 40 239 Source: Northern Nevada Regional Multiple Listing Service (NNRMLS). Copyright 2023 Dickson Realty. All Rights Reserved.
Median Sales Price Average Days on
June 2023 Year To Date 2023
0 2 4 6 8 10 8.3 Months 4.3 Months 2.9 Months 1.3 Month 0.6 Months 15% 5.4% 4% 11.9% 63.7 $400,000 and Below $400,001 $700,000 $700,001 $1,000,000 $1,000,001 $1,500,000 $1,500,001 and Above Properties Sold Available Listings Median Sales Price Average Days on Market 0 200 400 600 0 140 280 420 0 76000 152000 228000 0 40 80 120 692 549 547 563 634 711 239 276 406 369 412 444 106 107 100 87 75 75 Source: Northern Nevada Regional Multiple Listing Service (NNRMLS). Copyright 2023 Dickson Realty. All Rights Reserved.
of Sales June 2023 Year To Date 2023 Months of Inventory 0 2 4 6 8 10 8.3 Months 4.3 Months 2.9 Months 1.3 Month 0.6 Months 15% 5.4% 4% 11.9% 63.7 $400,000 and Below $400,001 $700,000 $700,001 $1,000,000 $1,000,001 $1,500,000 $1,500,001 and Above Properties Sold Available Listings Median Sales Price Average Days on Market 0 200 400 600 0 140 280 420 0 76000 152000 228000 0 40 80 120 692 549 547 563 634 711 239 276 406 369 412 444 106 107 100 87 75 75 Source: Northern Nevada Regional Multiple Listing Service (NNRMLS). Copyright 2023 Dickson Realty. All Rights Reserved.
Months of Inventory
Percentage
June 2023 Year To Date 2023 Months of Inventory 0 2 4 6 8 10 8.3 Months 4.3 Months 2.9 Months 1.3 Month 0.6 Months 15% 5.4% 4% 11.9% 63.7 $400,000 and Below $400,001 $700,001 $1,000,000 $1,000,001 $1,500,000 $1,500,001 and Above Properties Sold Available Listings Median Sales Price Average Days on Market 0 200 400 600 0 140 280 420 0 76000 152000 228000 0 40 80 120 692 549 547 563 634 711 239 276 406 369 412 444 106 107 100 87 75 75 Source: Northern Nevada Regional Multiple Listing Service (NNRMLS). Copyright 2023 Dickson Realty. All Rights Reserved. Percentage of Sales June 2023 Year To Date 2023 Months of Inventory 0 2 4 6 8 10 8.3 Months 4.3 Months 2.9 Months 1.3 Month 0.6 Months 15% 5.4% 4% 11.9% 63.7 $400,000 and Below $400,001 $700,001 $1,000,000 $1,000,001 $1,500,000 $1,500,001 and Above Properties Sold Available Listings Median Sales Price Average Days on Market 0 200 400 600 0 140 280 420 0 76000 152000 228000 0 40 80 120 692 549 547 563 634 711 239 276 406 369 412 444 106 107 100 87 75 75 Source: Northern Nevada Regional Multiple Listing Service (NNRMLS). Copyright 2023 Dickson Realty. All Rights Reserved.
of Sales
June 2023 Year To Date 2023
Dickson Realty is a member of Leading Real Estate Companies of the World,® a global community of real estate companies awarded membership based on rigorous standards for service and performance.

Every fifteen minutes a quality client introduction is made within Leading Real Estate Companies of the World.® As a member of Leading Real Estate Companies of the World,® Dickson Realty combines authentic, local expertise with global connections to the highest quality real estate firms worldwide. We’re Local. We’re Global.
1.2 Million annual global transactions
$586 Billion total annual home sales volume
550 companies
4,700 offices
136,000 sales associates
70+ countries
6 spanning continents
Incline Village Market Snapshot
(Data source: Incline Village REALTORS®) Available Homes Units Sold Days on Market Median Price UNITS SOLD -14.4% FROM LAST YEAR UNITS SOLD 11.1% FROM LAST YEAR DAYS ON MARKET 51.6% FROM LAST YEAR MEDIAN PRICE 39.9% FROM LAST YEAR 97 9 31 83 10 47 $3,497,500 $2,500,000 Source: Incline Village REALTORS®. Copyright 2023 Dickson Realty. All Rights Reserved Single Family Homes - June 2023 vs. June 2022 Incline Village/Crystal Bay 2023 2022 Available Condos Units Sold Days on Market Median Price 50 15 53 54 9 45 $975,000 $1,005,000 AVAILABLE CONDOS 8% FROM LAST YEAR UNITS SOLD
FROM LAST YEAR DAYS ON MARKET
FROM LAST YEAR MEDIAN PRICE -2.9% FROM LAST YEAR Condos - June 2023 vs. June 2022 Incline Village/Crystal Bay 2023 2022 Source: Incline Village REALTORS®. Copyright 2023 Dickson Realty. All Rights Reserved Available Homes Units Sold Days on Market Median Price UNITS SOLD -14.4% FROM LAST YEAR UNITS SOLD 11.1% FROM LAST YEAR DAYS ON MARKET 51.6% FROM LAST YEAR MEDIAN PRICE 39.9% FROM LAST YEAR 97 9 31 83 10 47 $3,497,500 $2,500,000 Source: Incline Village REALTORS®. Copyright 2023 Dickson Realty. All Rights Reserved Single Family Homes - June 2023 vs. June 2022 Incline Village/Crystal Bay 2023 2022 Available Condos Units Sold Days on Market Median Price 50 15 53 54 9 45 $975,000 $1,005,000 AVAILABLE CONDOS 8% FROM LAST YEAR UNITS SOLD
FROM LAST YEAR DAYS ON MARKET
FROM LAST YEAR MEDIAN PRICE
FROM LAST YEAR Condos - June 2023 vs. June 2022 Incline Village/Crystal Bay 2023 2022 Source: Incline Village REALTORS®. Copyright 2023 Dickson Realty. All Rights Reserved Available Homes Units Sold Days on Market Median Price UNITS SOLD -14.4% FROM LAST YEAR UNITS SOLD 11.1% FROM LAST YEAR DAYS ON MARKET 51.6% FROM LAST YEAR MEDIAN PRICE 39.9% FROM LAST YEAR 97 9 31 83 10 47 $3,497,500 $2,500,000 Source: Incline Village REALTORS®. Copyright 2023 Dickson Realty. All Rights Reserved Single Family Homes - June 2023 vs. June 2022 Incline Village/Crystal Bay 2023 2022 Available Condos Units Sold Days on Market Median Price 50 15 53 54 9 45 $975,000 $1,005,000 AVAILABLE CONDOS 8% FROM LAST YEAR UNITS SOLD -40% FROM LAST YEAR DAYS ON MARKET -15% FROM LAST YEAR MEDIAN PRICE -2.9% FROM LAST YEAR Condos - June 2023 vs. June 2022 Incline Village/Crystal Bay 2023 2022 Available Homes Units Sold Days on Market Median Price UNITS SOLD -14.4% FROM LAST YEAR UNITS SOLD 11.1% FROM LAST YEAR DAYS ON MARKET 51.6% FROM LAST YEAR MEDIAN PRICE 39.9% FROM LAST YEAR 97 9 31 83 10 47 $3,497,500 $2,500,000 Source: Incline Village REALTORS®. Copyright 2023 Dickson Realty. All Rights Reserved Single Family Homes - June 2023 vs. June 2022 Incline Village/Crystal Bay 2023 2022 Available Condos Units Sold Days on Market Median Price 50 15 53 54 9 45 $975,000 $1,005,000 AVAILABLE CONDOS 8% FROM LAST YEAR UNITS SOLD
FROM LAST YEAR DAYS ON MARKET
FROM LAST YEAR MEDIAN PRICE
FROM LAST YEAR Condos - June 2023 vs. June 2022 Incline Village/Crystal Bay 2023 2022
-40%
-15%
-40%
-15%
-2.9%
-40%
-15%
-2.9%

of Inventory 4 6 8 10 8.3 Months 11.9% 63.7 Properties Sold Available Listings Median Sales Price Average Days on Market 0 200 400 600 800 1000 0 140 280 420 560 700 0 76000 152000 228000 304000 380000 0 40 80 120 160 200 692 549 547 563 634 711 239 276 406 369 412 444 106 107 100 87 75 75 $510,000 $512,500 $527,919 $539,950 $555,000 $575,000 Market Statistics January 2023 February 2023 March 2023 April 2023 May 2023 June 2023 RENO/SPARKS AREAS
of Sales June 2023 Year To Date 2023 Source: Northern Nevada Regional Multiple Listing Service (NNRMLS). Copyright 2023 Dickson Realty. All Rights Reserved.
of Inventory 6 8 10 8.3 Months 63.7 Properties Sold Available Listings Median Sales Price Average Days on Market 0 200 400 600 800 1000 0 140 280 420 560 700 0 76000 152000 228000 304000 380000 0 40 80 120 160 200 692 549 547 563 634 711 239 276 406 369 412 444 106 107 100 87 75 75 $510,000 $512,500 $527,919 $539,950 $555,000 $575,000 Market Statistics January 2023 February 2023 March 2023 April 2023 May 2023 June 2023 RENO/SPARKS AREAS
of Sales June 2023 Year To Date 2023 MARKET STATISTICS RENO/SPARKS
Months
Percentage
Months
Percentage
Properties Sold Available Listings Median Sales Price Average Days on Market 0 20 40 60 80 100 0 14 28 42 56 70 0 74000 148000 222000 296000 370000 0 30 60 90 120 150 86 72 63 77 82 77 21 30 40 46 42 54 74 97 99 123 84 94 $550,000 $494,000 $450,000 $477,000 $477,000 $491,471 Market Statistics CARSON CITY AREA Source: Northern Nevada Regional Multiple Listing Service (NNRMLS). Copyright 2023 Dickson Realty. All Rights Reserved. January 2023 February 2023 March 2023 April 2023 May 2023 June 2023 Source: Northern Nevada Regional Multiple Listing Service (NNRMLS). Copyright 2023 Dickson Realty. All Rights Reserved. MARKET STATISTICS CARSON CITY Months of Inventory 4 6 8 10 8.3 Months 11.9% 63.7 Properties Sold Available Listings Median Sales Price Average Days on Market 0 200 400 600 800 1000 0 140 280 420 560 700 0 76000 152000 228000 304000 380000 0 40 80 120 160 200 692 549 547 563 634 711 239 276 406 369 412 444 106 107 100 87 75 75 $510,000 $512,500 $527,919 $539,950 $555,000 $575,000 Market Statistics January 2023 February 2023 March 2023 April 2023 May 2023 June 2023 RENO/SPARKS AREAS Percentage of Sales June 2023 Year To Date 2023

Source: Northern Nevada Regional Multiple Listing Service (NNRMLS). Copyright 2023 Dickson Realty. All Rights Reserved. MARKET STATISTICS CARSON VALLEY Months of Inventory 4 6 8 10 8.3 Months 11.9% 63.7 Properties Sold Available Listings Median Sales Price Average Days on Market 0 200 400 600 800 1000 0 140 280 420 560 700 0 76000 152000 228000 304000 380000 0 40 80 120 160 200 692 549 547 563 634 711 239 276 406 369 412 444 106 107 100 87 75 75 $510,000 $512,500 $527,919 $539,950 $555,000 $575,000 Market Statistics January 2023 February 2023 March 2023 April 2023 May 2023 June 2023 RENO/SPARKS AREAS
of Sales June 2023 Year To Date 2023 Properties Sold Available Listings Median Sales Price Average Days on Market 0 28 56 84 112 140 0 16 32 48 64 80 0 90000 180000 270000 360000 450000 0 40 80 120 160 200 122 104 89 102 104 113 26 28 34 66 62 68 136 118 130 114 73 93 $625,000 $566,250 $496,250 $520,000 $530,000 $630,500 Market Statistics January 2023 February 2023 March 2023 April 2023 May 2023 June 2023 CARSON VALLEY AREA Source: Northern Nevada Regional Multiple Listing Service (NNRMLS). Copyright 2023 Dickson Realty. All Rights Reserved.
Percentage

Source: Northern Nevada Regional Multiple Listing Service (NNRMLS). Copyright 2023 Dickson Realty. All Rights Reserved. MARKET STATISTICS FERNLEY Months of Inventory 4 6 8 10 8.3 Months 11.9% 63.7 Properties Sold Available Listings Median Sales Price Average Days on Market 0 200 400 600 800 1000 0 140 280 420 560 700 0 76000 152000 228000 304000 380000 0 40 80 120 160 200 692 549 547 563 634 711 239 276 406 369 412 444 106 107 100 87 75 75 $510,000 $512,500 $527,919 $539,950 $555,000 $575,000 Market Statistics January 2023 February 2023 March 2023 April 2023 May 2023 June 2023 RENO/SPARKS AREAS
of Sales June 2023 Year To Date 2023 Properties Sold Available Listings Median Sales Price Average Days on Market 0 26 52 78 104 130 0 14 28 42 56 70 0 50000 100000 150000 200000 250000 0 30 60 90 120 150 118 85 69 72 63 71 16 29 60 39 36 55 86 114 109 95 104 98 $369,900 $349,900 $355,000 $369,000 $379,202 $374,455 Market Statistics FERNLEY AREA Source: Northern Nevada Regional Multiple Listing Service (NNRMLS). Copyright 2023 Dickson Realty. All Rights Reserved. January 2023 February 2023 March 2023 April 2023 May 2023 June 2023
Percentage
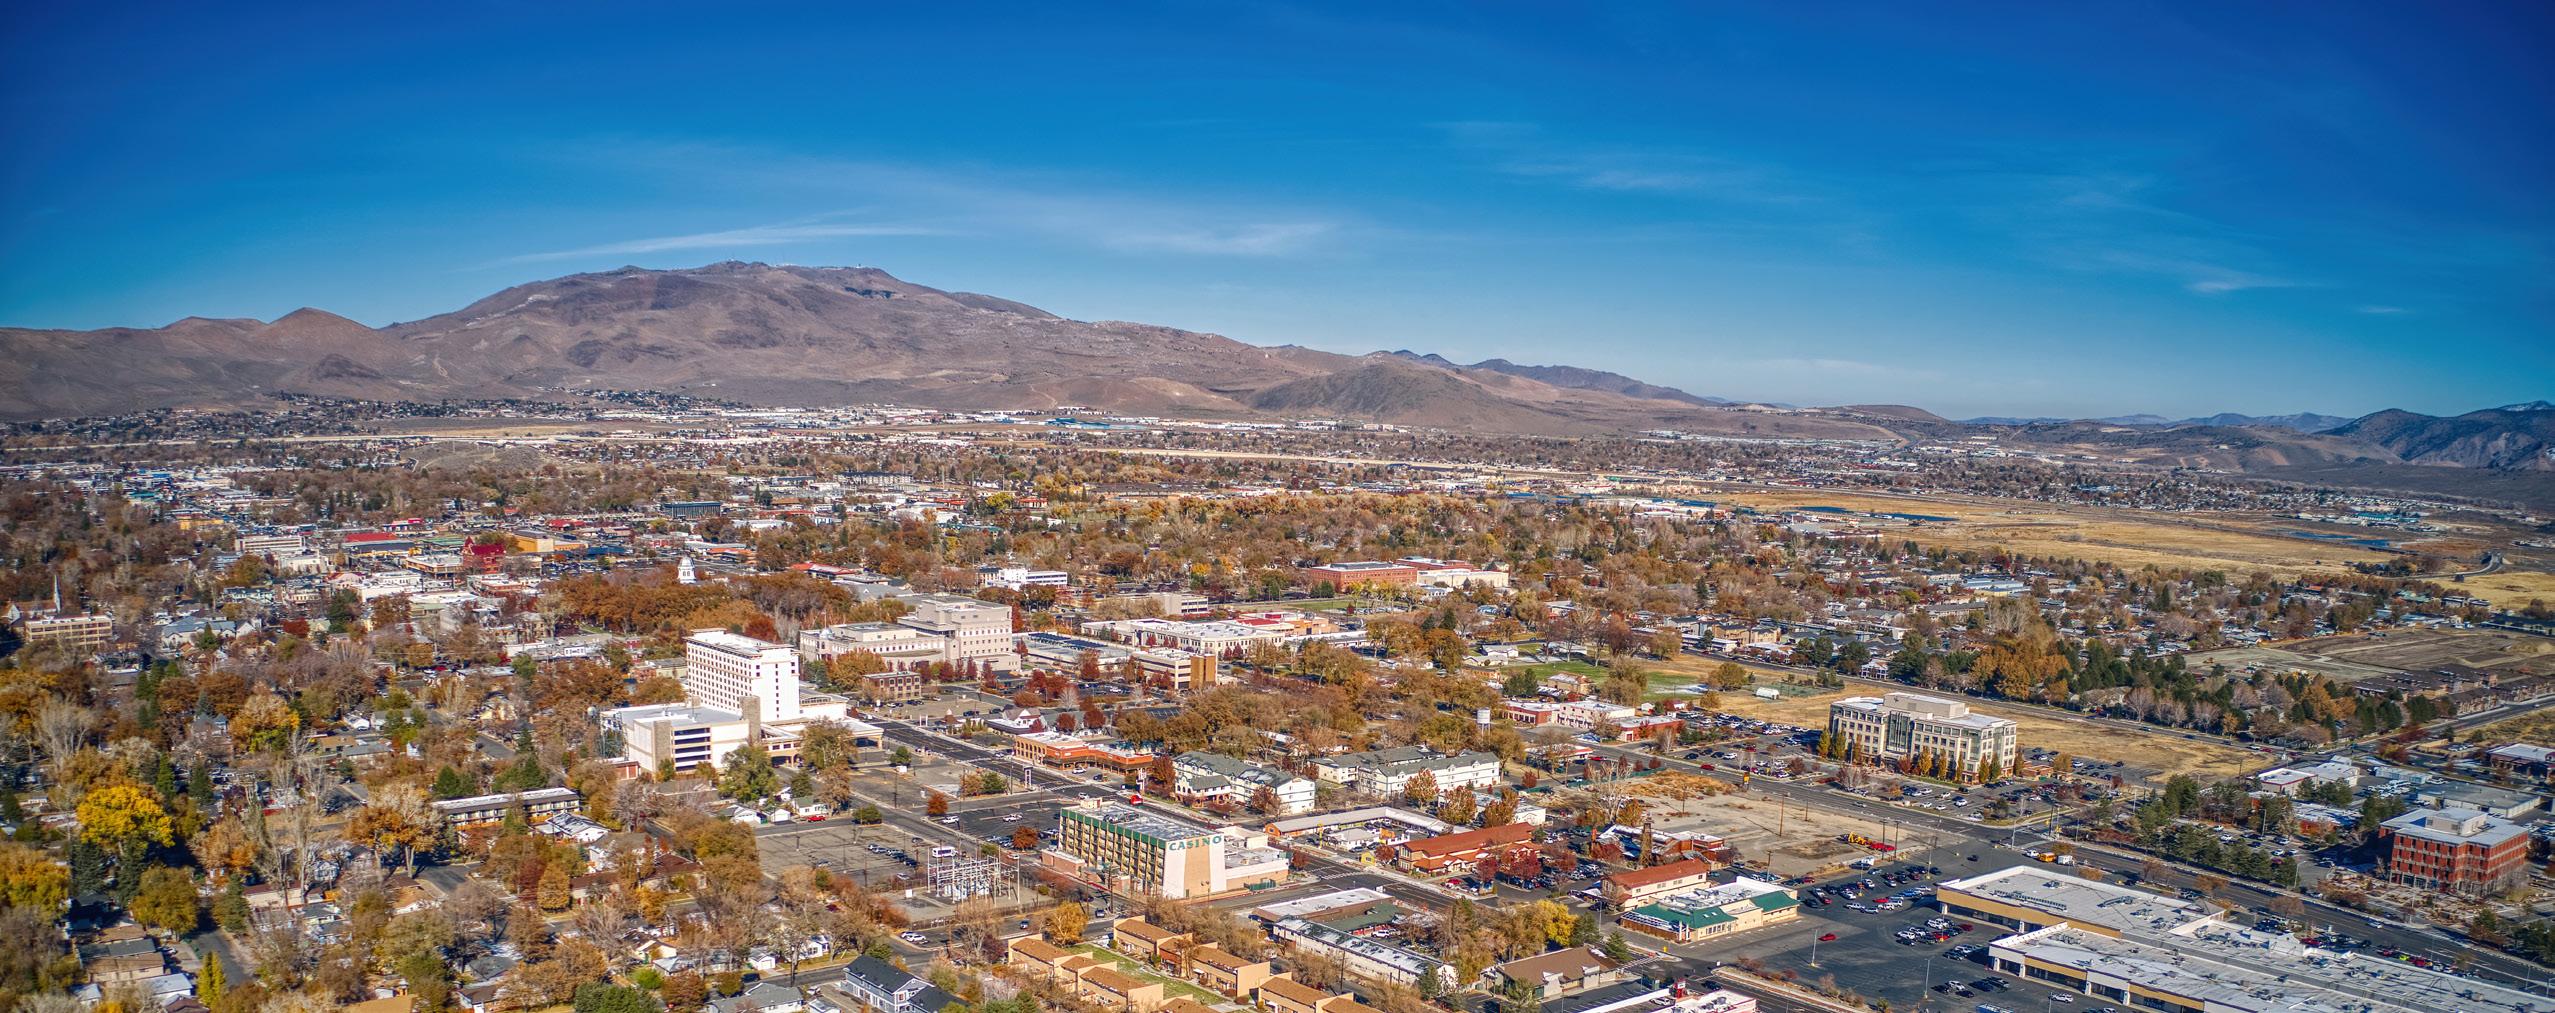
Reno Public Market
Can Tell Us the Past, Present, and Future of Reno’s Economy
Reno has changed a lot over the past 100 years, but to see just how different it is, look no further than the recent changes to Reno Public Market at the south end of Midtown. Earlier this year, Reno’s erstwhile Shoppers Square was remodeled into a brand new, mixed-use facility full of some of the hallmarks of Reno’s past century of development: art, live events, local brands, and lots of good food.
But as much as Reno Public Market exemplifies Reno’s present (and hopefully future), the building itself has deep roots in the city’s history. Let’s look at where Reno was in 1923, and what its redevelopment can tell us about Reno’s culture and economy in the 21st century.
The History of Reno Public Market

In 1923, the city of Reno proper occupied a far smaller parcel of land, and its population reflected it. It’s estimated that a little over 12,000 people lived in the town in 1920. But then, as it is now, Reno entered a great population shift, growing by 50% over the next decade. As Reno acquired some of its oldest and most famous institutions in the 1930s (namely, legalized gambling, one of the shortest residency requirements for divorce in the nation, and increased investment in the arts) the population boom only continued. With its borders bursting at the seams, Reno needed more room to grow.
Enter the Casazza family, who purchased 140 acres of land to the south of downtown as part of their family ranch in 1923. As Reno sprawled into their domain, the Cassazas began to sell acreage to the burgeoning town, all except for their current property at the corner of Plumb Lane and South Virginia Street—where their original family home once stood. In 1963, the Casazzas announced they were going to develop a $2.4 million shopping center on that parcel, and Shoppers Square was soon a reality.
A modest marketplace, Shoppers Square nonetheless stood for decades as a family-run establishment bordering the aptly named Casazza Drive. Over the decades, numerous businesses came and went as tenants—department stores, banks, drugstores, and restaurants among them. In 2019, however, the Casazzas decided to revamp the space, starting a years-long redevelopment that was hampered by the COVID-19 pandemic, permitting issues, and record snowfall levels this past winter.
In January of this year, Reno Public Market opened its doors to the public, showcasing a sprawling food court, space for 22 individual vendors, one of the largest bars in Reno, storefronts for local businesses, a combined artist workshop space and gallery, and a live entertainment stage christened “Faye’s” in homage to a long-time former tenant, Faye’s
Sportswear. The original neon sign that illuminated her storefront now sits, repurposed, above the main stage.
The Economic Vision
Similar to other developments in Reno over the past two decades, Reno Public Market was made possible thanks to some outside investment. California-based developers Foothill Partners were amongst the first to come up with the redesign, with Fireten Hospitality handling much of the mixed-use food court and vendor space. The entire price tag for the 55,000-square-foot space came in at around $50 million.
The food court is one of the premier utilities of the space, according to Steve Schroeder, founder of one of Reno’s most successful summer community events, Food Truck Fridays. According to Schroeder, who was asked to consult on the design of the food court, the smaller vendor stations present a logical progression for local restaurateurs from individual food trucks to 10-by-30-foot brick-and-mortar locations with lower overhead costs and community appeal baked into the concept.
The team behind Reno Public Market is banking on the sense of community inspired by the mixed-use space instead of the retail-forward model of Shoppers Square. Instead of going to Reno Public Market for one thing, the idea is that shoppers can find many—either trying different types of food, grabbing a drink while they watch live music, or wandering the storefronts until they see something they like.


It’s a concept that’s worked in other venues established by Foothill and Fireten, but Reno Public Market also has a secret weapon working in its favor. The development of the Reno Entertainment District apartment complex at the former site of Park Lane Mall across the street is primed to provide a ready source of clientele for the shopping center, which also includes a CVS Pharmacy, Sprouts grocery store, and other consumer must-haves. Investment in the confluence of living, entertainment, and shopping is poised to reinvigorate the south of Midtown.
The Economic Vision
The development of Reno Public Market is a microcosm of Reno’s own expanded economic vision. As the city has fought to move away from the largely gaming-centered economy of the past century, investment in large-scale entertainment spaces (like Jacobs Entertainment’s Neon Line District downtown), local food and beverage brands (evident in fourth street’s Brewery District or Food Truck Fridays), and high-density housing constitutes a shift to a more modern and diverse economy. Underscored by our access to Lake Tahoe, world-class skiing and hiking, and other outdoor recreation, Reno is banking on experiences and local culture as its future economic drivers—with projects like Reno Public Market providing a roadmap.
Copyright – Jeramie Lu Photography | www.JeramieLu.com
Copyright – Jeramie Lu Photography | www.JeramieLu.com
Like us on Facebook | Follow us on Instagram | Follow us on LinkedIn DicksonRealty.com | info@dicksonrealty.com © 2023 Dickson Realty. All rights reserved. Although the information above is deemed reliable, Dickson Realty does not guarantee its accuracy. Some rights reserved. DOWNTOWN RENO 775.324.7000 CAUGHLIN RANCH 775.746.7000 DAMONTE RANCH 775.850.7000 SOMERSETT 775.746.7222 MONTRÊUX 775.849.9444 SPARKS 775.685.8800 INCLINE VILLAGE 775.831.6600 TRUCKEE 530.587.7444 PORTOLA 530.832.1700 NORTHSTAR 530.562.1140 CARSON CITY 775.882.6300 GARDNERVILLE 775.882.6300 NV Lic#: B.0019733CORP
