TABLE 1: UTOPIAN ENROLLED PATIENTS OVERALL AND BY AGE AND SEX AGE
MALE
FEMALE
ALL PATIENTS
Number
Percentage
Number
Percentage
Number
Percentage
0–18 years
33,905
9
32,879
9
66,784
18
19–34 years
35,954
9
41,615
11
77,569
20
35–49 years
35,888
9
46,050
12
81,938
21
50–64 years
38,657
10
45,990
12
84,647
22
65+ years
30,979
8
41,133
11
72,112
19
175,383
45
207,667
55
383,050
100
Total
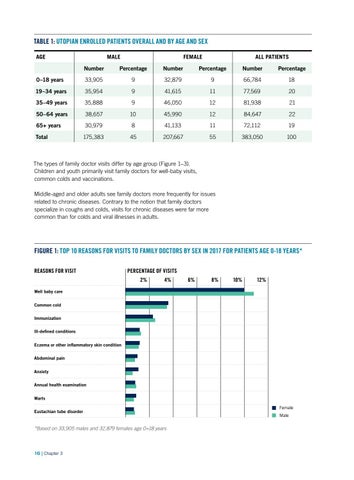
The types of family doctor visits differ by age group (Figure 1–3). Children and youth primarily visit family doctors for well-baby visits, common colds and vaccinations. Middle-aged and older adults see family doctors more frequently for issues related to chronic diseases. Contrary to the notion that family doctors specialize in coughs and colds, visits for chronic diseases were far more common than for colds and viral illnesses in adults.
FIGURE 1: TOP 10 REASONS FOR VISITS TO FAMILY DOCTORS BY SEX IN 2017 FOR PATIENTS AGE 0-18 YEARS* REASONS FOR VISIT
PERCENTAGE OF VISITS 2%
4%
6%
8%
10%
12%
Well baby care Common cold Immunization Ill-defined conditions Eczema or other inflammatory skin condition Abdominal pain Anxiety Annual health examination Warts Eustachian tube disorder
*Based on 33,905 males and 32,879 females age 0–18 years
16 | Chapter 3
1
Female
2
Male