Q2 Carmel Report

GOLDEN RECTANGLE
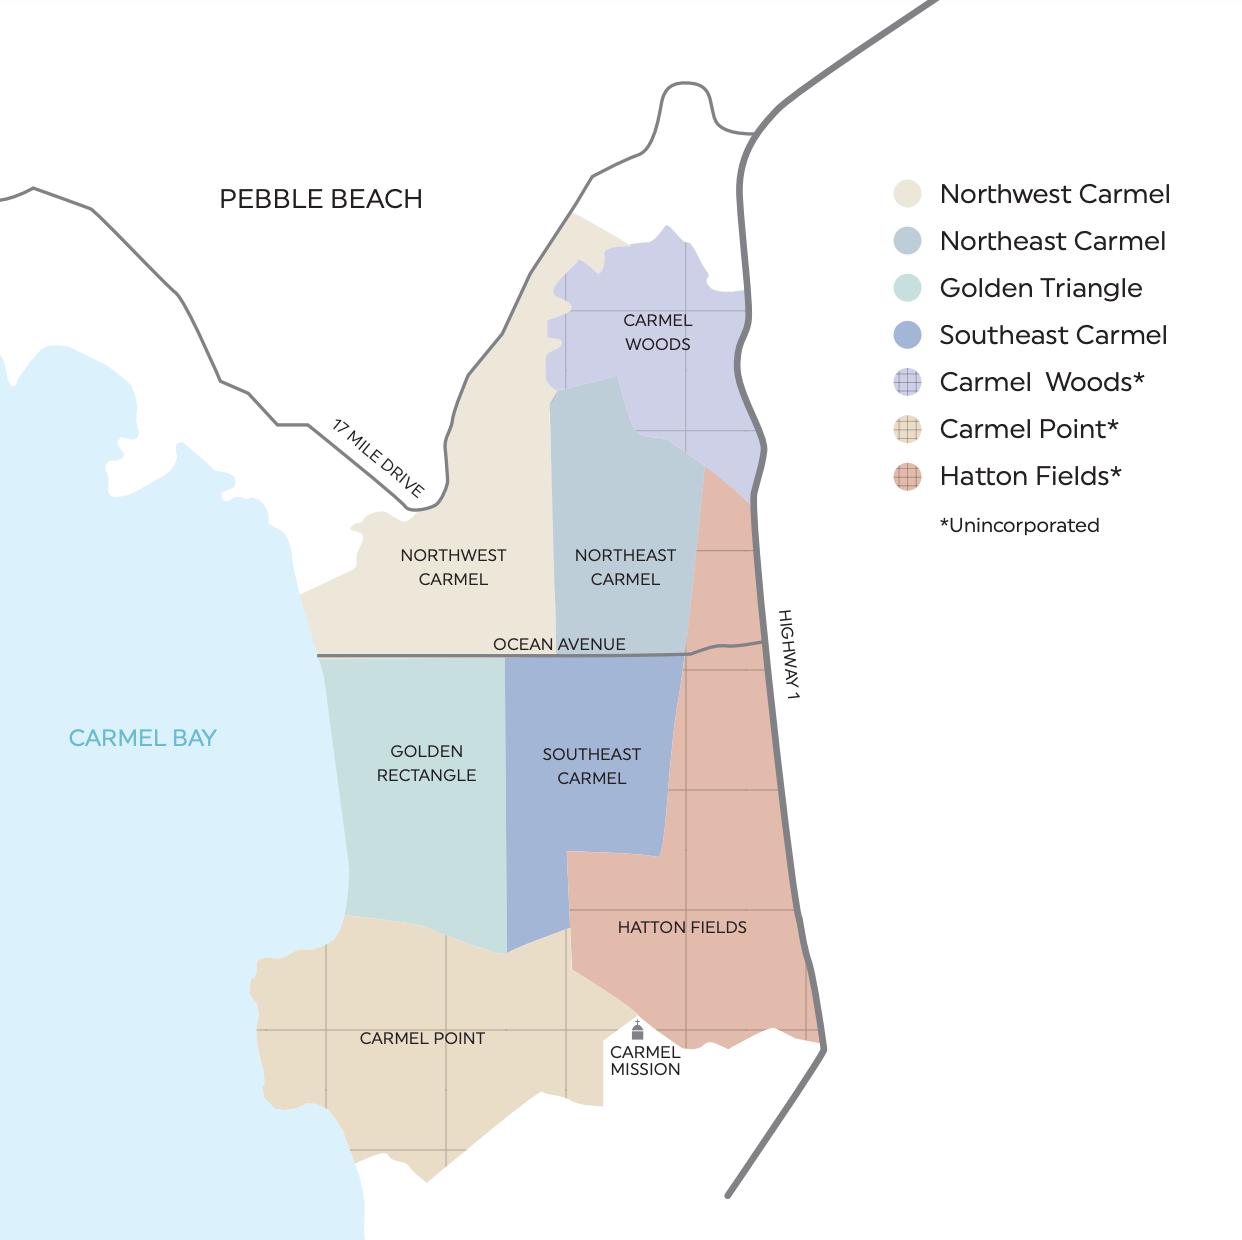
Located in the southwest corner of Carmel, the 'Golden Rectangle' is considered one of the most desirable locations given its close proximity to Carmel Beach and downtown, while having minimal elevation change Lot sizes are generally 40 x 100, or 4,000 square feet, meaning that homes are capped at ~1,600 square feet of living space with a one-car garage Homes closest to Scenic Avenue (which borders the ocean) are generally the most expensive given their vast ocean views
NORTHWEST CARMEL
Offering a similar proximity to the Beach and downtown as the Golden Rectangle, with a bit more change in elevation, northwest Carmel is considered by some to be one of the best kept secrets. Lot sizes are typically a bit larger than the Golden Rectangle which results in larger homes, and the area also tends to be quieter as visitors are drawn south of Ocean Avenue given the scenic walking path there.
NORTHEAST CARMEL
North of Ocean Avenue, this quaint section of town slopes upwards towards HWY 1, while still providing close proximity to downtown Lot sizes, are generally 40 x 100, or 4,000 square feet meaning homes here are capped at ~1,600 square feet with a one-car garage
SOUTHEAST CARMEL
Also sloping upwards towards HWY 1, southeast Carmel offers close proximity to downtown while featuring the common 40 x 100 lot size A large portion of southeast Carmel is dedicated to the well-maintained Mission Trails, offering various paths to the east-end of downtown. The Forest Theatre, a historic outdoor amphitheater, which hosts musicals and 'films in the forest' throughout the year also calls southeast Carmel home.
** CARMEL POINT
Technically an unincorporated part of Monterey County and considered part of 'Greater Carmel' and not 'Carmel-by-the-Sea', Carmel Point offers larger lot sizes (and hence homes) than the Golden Rectangle while still having a relatively flat topography The scenic walking path that runs along the Golden Rectangle ends at Carmel Point meaning most tourists typically don't venture this far south River Elementary School (grades K-5th) can also be found in this part of town
* HATTON FIELDS
Just west of HWY 1, Hatton Fields is home to many full-time residents as lot sizes are larger than the standard 40 x 100 lots found in Carmel-by-the-Sea, while also providing easy access to the freeway Larger homes, more sunshine, and lower prices than those found in other parts of Carmel draw many families to this area.
**CARMEL WOODS
At the crown of Carmel is Carmel Woods a hilly and forested neighborhood which sits at the peak of the hills both east of the ocean, and as you climb north
from downtown. A quieter spot with larger lots and ocean views makes this neighborhood another full-time resident favorite, although walkability to downtown and/or the beach is unlikely from this area.
** These neighborhoods are part of unincorporated Carmel and technically not 'Carmel by the Sea'. Unincorporated Carmel typically offers larger lot sizes, homes, and a true address

94% Average sale to list price $7,500,0000 $3,275,000 $10,775,000 New listings Transactions fell through compared to 3 in Q1 '23 compared to 2 in Q2 ‘22 Q 2 O T H E R N U M B E R S O F N O T E ‘ 2 3 M A R K E T O V E R V I E W Homes Sold 2 Average Sales Price Days on Market $5,387,500 127 Total $ Sales vs Q1 ‘23 28% 18% vs Q2 ‘22 vs Q1 ‘23 115 days 116 days vs Q2 ‘22 vs Q1 ‘23 157% (41%) vs Q2 ‘22 Highest Sale Lowest Sale 2 2 Price Reductions compared to 0 in Q1 '23 compared to 1 in Q2 ‘22 compared to 0 in Q1 '23 compared to 1 in Q2 ‘22 0 vs Q1 ‘23 100% (50%) vs Q2 ‘22 0% 50% 2 TOTAL SALES C A R M E L P O I N T S A L E S B Y S E G M E N T 1 $3M - $5M 1 $5M+

0% Average sale to list price $0 $0 100% $0 New listings Transactions fell through compared to 3 in Q1 '23 compared to 9 in Q2 ‘22 Q 2 O T H E R N U M B E R S O F N O T E ‘ 2 3 M A R K E T O V E R V I E W Homes Sold 0 Average Sales Price Days on Market $0 0 Total $ Sales vs Q1 ‘23 (100%) (100%) vs Q2 ‘22 vs Q1 ‘23 (8 days) (37 days) vs Q2 ‘22 vs Q1 ‘23 (100%) (100%) vs Q2 ‘22 Highest Sale Lowest Sale 2 1 Price Reductions compared to 2 in Q1 '23 compared to 2 in Q2 ‘22 compared to 0 in Q1 '23 compared to 1 in Q2 ‘22 0 vs Q1 ‘23 (100%) (100%) vs Q2 ‘22 0 TOTAL SALES H A T T O N F I E L D S S A L E S B Y S E G M E N T zero sales
NOQ2SALES


99% Average sale to list price $34,535,000 New listings Transactions fell through compared to 12 in Q1 '23 compared to 10 in Q2 ‘22 Q 2 O T H E R N U M B E R S O F N O T E ‘ 2 3 M A R K E T O V E R V I E W Homes Sold 7 Average Sales Price Days on Market $4,933,571 17 Total $ Sales vs Q1 ‘23 17% 8% vs Q2 ‘22 vs Q1 ‘23 11 days 12 days vs Q2 ‘22 vs Q1 ‘23 173% (6%) vs Q2 ‘22 10 6 Price Reductions compared to 2 in Q1 '23 compared to 1 in Q2 ‘22 compared to 1 in Q1 '23 compared to 0 in Q2 ‘22 0 vs Q1 ‘23 133% (13%) vs Q2 ‘22 57 % 286% 1 3% 7 TOTAL SALES G O L D E N R E C T A N G L E S A L E S B Y S E G M E N T 1 $2M - $3M 2 $3M - $5M 4 $5M - $7M Highest Sale Lowest Sale $6,550,000 $2,500,000
Average sale to list price $14,025,106 New listings Transactions fell through compared to 10 in Q1 '23 compared to 7 in Q2 ‘22 Q 2 O T H E R N U M B E R S O F N O T E ‘ 2 3 M A R K E T O V E R V I E W Homes Sold 5 Average Sales Price Days on Market $2,805,021 71 Total $ Sales vs Q1 ‘23 (10%) (14%) vs Q2 ‘22 vs Q1 ‘23 59 days 61 days vs Q2 ‘22 vs Q1 ‘23 (25%) (28%) vs Q2 ‘22 3 2 Price Reductions compared to 5 in Q1 '23 compared to 1 in Q2 ‘22 compared to 0 in Q1 '23 compared to 1 in Q2 ‘22 0 vs Q1 ‘23 (17%) (17%) vs Q2 ‘22 60% 20% 0%
TOTAL SALES S O U T H E A S T C A R M E L S A L E S B Y S E G M E N T 1 $1M - $2M 1 $2M - $3M 3 $3M - $4M Highest Sale Lowest Sale $3,562,500 $1,700,000
93%
5

96% Average sale to list price $17,649,000 New listings Transactions fell through compared to 7 in Q1 '23 compared to 2 in Q2 ‘22 Q 2 O T H E R N U M B E R S O F N O T E ‘ 2 3 M A R K E T O V E R V I E W Homes Sold 6 Average Sales Price Days on Market $2,941,500 28 Total $ Sales vs Q1 ‘23 (26%) (1%) vs Q2 ‘22 vs Q1 ‘23 (40 days) (15 days) vs Q2 ‘22 vs Q1 ‘23 49% (19% vs Q2 ‘22 13 7 Price Reductions compared to 4 in Q1 '23 compared to 3 in Q2 ‘22 compared to 0 in Q1 '23 compared to 1 in Q2 ‘22 2 vs Q1 ‘23 100% 20% vs Q2 ‘22 50% 333% 67% 6 TOTAL SALES N O R T H W E S T C A R M E L S A L E S B Y S E G M E N T 2 $3M - $5M 1 $1M - $2M 3 $2M - $3M Highest Sale Lowest Sale $4,700,000 $1,749,000
Average sale to list price $14,461,025 New listings Transactions fell through compared to 7 in Q1 '23 compared to 11 in Q2 ‘22 Q 2 O T H E R N U M B E R S O F N O T E ‘ 2 3 M A R K E T O V E R V I E W Homes Sold 6 Average Sales Price Days on Market $2,410,171 11 Total $ Sales vs Q1 ‘23 21% 3% vs Q2 ‘22 vs Q1 ‘23 (48 days) 6 days vs Q2 ‘22 vs Q1 ‘23 142% (31%) vs Q2 ‘22 6 2 Price Reductions compared to 2 in Q1 '23 compared to 2 in Q2 ‘22 compared to 0 in Q1 '23 compared to 2 in Q2 ‘22 2 vs Q1 ‘23 100% (33%) vs Q2 ‘22 66 % 67% 16 % 6 TOTAL SALES N O R T H E A S T C A R M E L S A L E S B Y S E G M E N T 1 $1M - $2M 4 $2M - $3M 1 $3M - $5M
Sale Lowest
100%
Highest
Sale $3,454,500 $1,500,000

Average sale to list price $7,165,000 New listings Transactions fell through compared to 3 in Q1 '23 compared to 6 in Q2 ‘22 Q 2 O T H E R N U M B E R S O F N O T E ‘ 2 3 M A R K E T O V E R V I E W Homes Sold 3 Average Sales Price Days on Market $2,388,333 35 Total $ Sales vs Q1 ‘23 100% (1%) vs Q2 ‘22 vs Q1 ‘23 35 days 6 days vs Q2 ‘22 vs Q1 ‘23 100% (51%) vs Q2 ‘22 Highest Sale Lowest Sale 2 3 Price Reductions compared to 1 in Q1 '23 compared to 2 in Q2 ‘22 compared to 1 in Q1 '23 compared to 1 in Q2 ‘22 0 vs Q1 ‘23 100% (50%) vs Q2 ‘22 33% 3 3% 333% 3 TOTAL SALES C A R M E L W O O D S S A L E S B Y S E G M E N T 1 $3M+ 1 $1M - $1.5M 1 $1.5M - $2M $3,935,000
95%
$1,380,000
intentionally left blank
Devon Meeker \\ 650.759.4193

Devon@MaloneHodges com
DRE #02074131