CHAPTER 7 PRODUCTION ANALYSIS AND COMPENSATION POLICY
MULTIPLE CHOICE
1. The production function Q = 0.25X0.5Y exhibits:
a. constant returns to scale.
b. increasing returns to scale.
c. increasing and then diminishing returns to scale.
d. diminishing returns to scale.
ANS: B
2. The law of diminishing returns:
a. deals specifically with the diminishing marginal product of fixed input factors.
b. states that the marginal product of a variable factor must eventually decline as increasingly more is employed.
c. can be derived deductively.
d. states that as the quantity of a variable input increases, with the quantities of all other factors being held constant, the resulting output must eventually diminish.
ANS: B
3. A new production function results following:
a. a new wage agreement following collective bargaining.
b. a surge in product demand.
c. a decrease in the availability of needed inputs.
d. the successful completion of a training program that enhances worker productivity.
ANS: D
4. The relation between output and the variation in all inputs taken together is the:
a. factor productivity of a production system.
b. law of diminishing returns.
c. returns to scale characteristic of a production system.
d. returns to factor characteristic of a production system.
ANS: C
5. When PX = $60, MPX = 5 and MPY = 2, relative employment levels are optimal provided:
a. PY = 16.7¢.
b. PY = $24.
c. PY = $60.
d. PY = $150.
ANS: B
6. When PX = $100, MPX = 10 and MRQ = $5, the marginal revenue product of X equals:
a. $100.
b. $50.
c. $10.
d. $5.
ANS: B
7. The returns to scale characteristic of a production system:
a. is measured by the way in which inputs can be varied in an unbroken marginal fashion rather than incrementally.
b. illustrates the distinct, or "lumpy," pattern of input combination.
c. shows the relation between output and the variation in all inputs.
d. is the relation between output and variation in only one of the inputs employed.
ANS: C
8. Returns to a factor denotes the relation between the quantity of an individual input employed and the:
a. optimal scale of a firm.
b. optimal size of production facilities.
c. optimal length of production runs.
d. level of output produced.
ANS: D
9. The marginal product concept is:
a. used to describe the relation between output and variation in all inputs in a production function.
b. the change in output associated with a one-unit change in an individual factor.
c. total product divided by the number input units employed.
d. the complete output from a production system.
ANS: B
10. A production function describes the relation between output and:
a. technical progress.
b. one input.
c. total cost.
d. all inputs.
ANS: D
11. Total product divided by the number of units of variable input employed equals:
a. average product.
b. marginal revenue product.
c. returns to scale.
d. marginal product.
ANS: A
12. Marginal product is the change in output associated with a unit change in:
a. all inputs.
b. technology.
c. scale.
d. one input factor.
ANS: D
13. When the slope of the average product curve equals zero:
a. total product is maximized.
b. returns to the variable input are increasing.
c. marginal product equals average product.
d. marginal product equals zero.
ANS: C
14. Total output is maximized when:
a. average product equals zero.
b. marginal product is maximized.
c. average product is maximized.
d. marginal product equals zero.
ANS: D
15. An isoquant represents:
a. input combinations that can be employed at the same cost.
b. input combinations that can efficiently produce the same output.
c. output combinations that can be efficiently produced using the same input combination.
d. output combinations that can be produced for the same cost.
ANS: B
16. Right-angle shaped isoquants reflect inputs that are:
a. perfect complements.
b. perfect substitutes.
c. imperfect substitutes.
d. inefficient.
ANS: A
17. The marginal rate of technical substitution is:
a. the slope of the marginal revenue product curve.
b. the marginal product of either input.
c. minus one times the ratio of marginal products for each input.
d. the slope of an isocost curve.
ANS: C
18. Marginal revenue product equals:
a. marginal revenue multiplied by marginal product.
b. marginal product multiplied by total revenue.
c. total revenue multiplied by total product.
d. marginal revenue multiplied by total product.
ANS: A
19. A firm will maximize profits by employing the quantity of each input where the marginal:
a. revenue product of each input equals its price.
b. revenue equals the price of each input.
c. product of each input is equal.
d. product of each input equals its price.
ANS: A
20. If tripling the quantities of all inputs employed doubles the quantity of output produced, the output elasticity:
a. equals one.
b. is greater than one.
c. cannot be determined without further information.
d. is less than one.
ANS: D
21. The maximum output that can be produced for a given amount of input is called a:
a. discrete production function.
b. production function.
c. continuous production function.
d. discontinuous production function.
ANS: B
22. The output effect of a proportional increase in all inputs is called:
a. returns to scale.
b. returns to a factor.
c. total product.
d. marginal product.
ANS: A
23. As the quantity of a variable input increases, the resulting rate of output increase eventually:
a. falls.
b. rises.
c. becomes constant.
d. none of these.
ANS: A
24. Economic efficiency is achieved when all firms equate the marginal:
a. product and price for all inputs.
b. cost of all inputs.
c. revenue product and price for all inputs.
d. product of all inputs.
ANS: C
25. When MRQ = $25, PX = $200, and MPX = 8, employment of X:
a. is optimal.
b. should expand.
c. should contract.
d. none of these.
ANS: A
PROBLEM
1. Input Combination. The following production table provides estimates of the maximum amounts of output possible with different combinations of two input factors, X and Y. (Assume that these are just illustrative points on a spectrum of continuous input combinations.)
Units of Y Used Estimated Output per Day 5 258 360 455 542 620 4 234 332 416 496 542 3 206 294 372 416 455
A. Do the two inputs exhibit the characteristics of constant, increasing, or decreasing marginal rates of technical substitution? How do you know?
B. Assuming output sells for $4 per unit, complete the following tables:
C. Assume the quantity of X is fixed at 2 units. If the output of the production system sells for $4 and the cost of Y is $155 per day, how many units of Y will be employed?
D. Assume that the company is currently producing 258 units of output per day using 1 unit of X and 5 units of Y. The daily cost per unit of X is $155 and that of Y is also $155. Would you recommend a change in the present input combination? Why or why not?
E. What is the nature of the returns to scale for this production system if the optimal input combination requires that X = Y?
ANS:
A. The inputs exhibit the characteristics of decreasing marginal rates of technical substitution throughout. For decreasing MRTS, the slope of the production isoquants diminishes as one input is increasingly substituted for another. We can also see this point algebraically by holding X or Y constant in the input-output matrix and noting the decline in the relative marginal product of the other input as its usage level grows.
B. X Fixed at 2 Units
Units of Y
2 168 248 294 332 360 1 124 168 206 234 258 1 2 3 4 5 Units of X Used
Units of Y Used Total Product of Y Marginal Product of Y Average Product of Y Marginal Revenue Product of Y 1 2 3 4 5 Fixed at 3 units Units of X Used Total Product of X Marginal Product of X Average Product of X Marginal Revenue Product of X 1 2 3 4 5
X Fixed at 2 Units
C. Three units of Y will be employed. The marginal value of the first three units of Y is greater than their marginal cost. The marginal value of the fourth unit is only $152 or $3 less than its cost, and hence, the firm would employ no more than three units of Y.
D. A change would be in order because the firm could produce 372 units at the same cost using 3 units of each output. That is, the marginal product to price ratios of the two inputs are not equal at the current input proportions. Relatively less Y and more X is needed to provide an optimal combination.
E. The system exhibits constant returns to scale. This is true because a given increase in both inputs causes an increases in output of the same proportion.
A. Do the two inputs exhibit the characteristics of constant, increasing, or decreasing marginal
Used TPY MPY APY MRPY (1) (2) (3) (4) = $4 (2) 1 168 168 168 $672 2 248 80 124 320 3 294 46 98 184 4 332 38 83 152 5 360 28 72 112 Fixed at 3 units Units of X Used TPX MPX APX MRPX (1) (2) (3) (4) = $4 (2) 1 206 206 206 $824 2 294 88 147 352 3 372 78 124 312 4 416 44 104 176 5 455 39 91 156
X Y Output 1 1 124 1 = 124 2 2 124 2 = 248 3 3 124 3 = 372 4 4 124 4 = 496 5 5 124 5 = 620
Units of Y Used Estimated Output per Day 5 184 265 334 395 440 4 176 248 303 352 395 3 164 216 264 303 334 2 128 176 216 248 265 1 88 128 164 176 184 1 2 3 4 5 Units of X Used
2. Input Combination. The following production table provides estimates of the maximum amounts of output possible with different combinations of two input factors, X and Y. (Assume that these are just illustrative points on a spectrum of continuous input combinations.)
rates of technical substitution? How do you know?
B. Assuming output sells for $3 per unit, complete the following tables:
C. Assume the quantity of X is fixed at 4 units. If the output of the production system sells for $3 and the cost of Y is $135 per day, how many units of Y will be employed?
D. Assume that the company is currently producing 248 units of output per day using 2 units of X and 4 units of Y. The daily cost per unit of X is $135 and that of Y is also $135. Would you recommend a change in the present input combination? Why or why not?
E. What is the nature of the returns to scale for this production system if the optimal input combination requires that X = Y?
ANS:
A. The inputs exhibit the characteristics of decreasing marginal rates of technical substitution throughout. For decreasing MRTS, the slope of the production isoquants diminishes as one input is increasingly substituted for another. We can also see this point algebraically by holding X or Y constant in the input-output matrix and noting the decline in the relative marginal product of the other input as its usage level grows.
B.
at 4 Units
Fixed at 4 Units Units of Y Used Total Product of Y Marginal Product of Y Average Product of Y Marginal Revenue Product of Y 1 2 3 4 5 Fixed at 2 units Units of X Used Total Product of X Marginal Product of X Average Product of X Marginal Revenue Product of X 1 2 3 4 5
X
Units of Y employed TPY MPY APY MRPY (1) (2) (3) (4) = $3 (2) 1 176 176 176 $528 2 248 72 124 216 3 303 55 101 165 4 352 49 88 147
X Fixed
Y Fixed at 2 Units
C. Four units of Y will be employed. The marginal value of the first four units of Y is greater than their marginal cost. The marginal value of the fifth unit is only $129 or $6 less than its cost, and hence, the firm would employ no more than four units of Y.
D. A change would be in order because the firm could produce 303 units at the same cost using 3 units of each output. That is, the marginal product to price ratios of the two inputs are not equal at the current input proportions. Relatively less Y and more X is needed to provide an optimal combination.
E. The system exhibits constant returns to scale. This is true because a given increase in both inputs causes an increases in output of the same proportion.
3. Production Relations. Indicate whether each of the following statements is true or false.
A. L-shaped isoquants describe production systems where inputs are perfect complements.
B. If the marginal product of capital increases as capital usage grows, the returns to capital are decreasing.
C. Marginal revenue product measures the output gained through expanding input usage.
D. The marginal rate of technical substitution will be affected by a given percentage increase in the marginal productivity of all inputs.
E. Increasing returns to scale and declining average costs are indicated when Q > 1.
ANS:
A. True. L-shaped production isoquants reflect a perfect complementary relation among inputs, i.e., no amount of input X can make up for the lack of input Y.
B. False. Returns to the capital input factor are increasing when the marginal product of capital increases as capital usage grows.
5 395 43 79 129
Units of X employed TPX MPX APX MRPX (1) (2) (3) (4) = $3 (2) 1 128 128 128 $384 2 176 48 88 144 3 216 40 72 120 4 248 32 62 96 5 265 17 53 51
X Y Output 1 1 88 1 = 88 2 2 88 2 = 176 3 3 88 3 = 264 4 4 88 4 = 352 5 5 88 5 = 440
C. False. Marginal revenue product is the revenue generated by expanding input usage, and represents the maximum that could be paid to expand usage. Marginal product measures the change in output given a change in an input.
D. False. The marginal rate of technical substitution is measured by the relative marginal productivity of input factors. This relation is unaffected by a commensurate increase in the marginal productivity of all inputs.
E. True. When Q > 1, the percentage change in output is greater than a given percentage change in all inputs. Thus, increasing returns to scale and decreasing average costs are indicated.
4. Production Relations. Indicate whether each of the following statements is true or false.
A. If the marginal product of capital decreases as capital usage grows, the returns to capital are decreasing.
B. The marginal rate of technical substitution will be affected by a given percentage increase in the marginal productivity of an input.
C. Marginal revenue product represents the minimum revenue amount required to expand usage.
D. Linear isoquants describe production systems where inputs are perfect complements.
E. Decreasing returns to scale and declining average costs are indicated when Q < 1.
ANS:
A. True. Returns to the capital input factor are decreasing when the marginal product of capital decreases as capital usage grows.
B. True. The marginal rate of technical substitution is measured by the relative marginal productivity of input factors. This relation is affected by an increase in the marginal productivity of a single input.
C. True. Marginal revenue product is the revenue generated by expanding input usage, and represents the minimum revenue required to expand usage.
D. False. L-shaped production isoquants reflect a perfect complementary relation among inputs, i.e., no amount of input X can make up for the lack of input Y. Linear isoquants reflect perfect substitutability of input X for input Y, and vice versa.
E. False. When Q < 1, the percentage change in output is less than the percentage change in all inputs, implying decreasing returns to scale but increasing average costs.
5. Returns to Scale. Determine whether the following production functions exhibit constant, increasing, or decreasing returns to scale.
A. Q = 0.25X + 5Y + 30Z
B. Q = 4L + 15K + 600
C. Q = 9A + 3B + 12AB
D. Q = 4L2 + 6LK + 3K2
E. Q = 2L0.2K0.6
ANS:
A. Initially, let X = Y = Z = 100, so output is:
Q1 = 0.25(100) + 5(100) + 30(100) = 3,525
Increasing all inputs by 4% leads to:
Q2 = 0.25(104) + 5(104) + 30(104) = 3,666
Because a 4% increase in all inputs results in a 4% increase in output (Q2/Q1 = 3,666/3,525 = 1.04), the output elasticity is 1 and the production system exhibits constant returns to scale.
B. Initially, let L = K = 100, so output is:
Q1 = 4(100) + 15(100) + 600 = 2,500
Increasing both inputs by 5% leads to
Q2 = 4(105) + 15(105) + 600 = 2,595
Because a 5% increase in both inputs results in a 3.8% increase in output (Q2/Q1 = 2,595/2,500 = 1.038), the output elasticity is less than 1 and the production system exhibits diminishing returns to scale.
C. Initially, let A = B = 100, so output is:
Q1 = 9(100) + 3(100) + 12(100)(100) = 121,200
Increasing both inputs by 1% leads to:
Q2 = 9(101) + 3(101) + 12(101)(101) = 123,642
Because a 1% increase in both inputs results in a 2% increase in output (Q2/Q1 = 123,624/121,200 = 1.02), the output elasticity is greater than 1 and the production system exhibits increasing returns to scale.
D. Initially, let L = K = 100, so output is:
Q1 = 4(1002) + 6(100)(100) + 3(1002) = 130,000
Increasing both inputs by 2% leads to:
Q2 = 4(1022) + 6(102)(102) + 3(1022) = 135,252
Because a 2% increase in both inputs results in a 4% increase in output (Q2/Q1 = 135,252/130,000 = 1.04), the output elasticity is greater than 1 and the production system exhibits increasing returns to scale.
E. Initially, let L = K = 100, so output is:
Q1 = 2(1000.2)(1000.6) = 80
Increasing both inputs by 4% leads to:
Q2 = 2(1040.2)(1040.6) = 82
Because a 4% increase in both inputs results in a less than 4% increase in output (Q2/Q1 = 82/80 = 1.025), the output elasticity is less than 1 and the production system exhibits decreasing returns to scale.
6. Returns to Scale. Determine whether the following production functions exhibit constant, increasing, or decreasing returns to scale.
A. Q = 25X + 0.5Y + 8Z
B. Q = 9L + 5K - 400
C. Q = 10A + 7B + 4AB
D. Q = 6L2 + 3LK + 2K2
E. Q = 2L0.4K0.6
ANS:
A. Initially, let X = Y = Z = 100, so output is:
Q1 = 25(100) + 0.5(100) + 8(100) = 3,350
Increasing all inputs by 4% leads to:
Q2 = 25(104) + 0.5(104) + 8(104) = 3,484
Because a 4% increase in all inputs results in a 4% increase in output (Q2/Q1 = 3,484/3,350 = 1.04), the output elasticity is 1 and the production system exhibits constant returns to scale.
B. Initially, let L = K = 100, so output is:
Q1 = 9(100) + 5(100) - 400 = 1,000
Increasing both inputs by 5% leads to
Q2 = 9(105) + 5(105) - 400 = 1,070
Because a 5% increase in both inputs results in a 7% increase in output (Q2/Q1 = 1,070/1,000 = 1.07), the output elasticity is greater than 1 and the production system exhibits increasing returns to scale.
C. Initially, let A = B = 100, so output is:
Q1 = 10(100) + 7(100) + 4(100)(100) = 41,700
Increasing both inputs by 1% leads to:
Q2 = 10(101) + 7(101) + 4(101)(101) = 42,521
Because a 1% increase in both inputs results in a 2% increase in output (Q2/Q1 = 42,521/41,700 = 1.02), the output elasticity is greater than 1 and the production system exhibits increasing returns to scale.
D. Initially, let L = K = 100, so output is:
Q1 = 6(1002) + 3(100)(100) + 2(1002) = 110,000
Increasing both inputs by 2% leads to:
Q2 = 6(1022) + 3(102)(102) + 2(1022) = 114,444
Because a 2% increase in both inputs results in a 4% increase in output (Q2/Q1 = 114,444/110,000 = 1.04), the output elasticity is greater than 1 and the production system exhibits increasing returns to scale.
E. Initially, let L = K = 100, so output is:
Q1 = 2(1000.4)(1000.6) = 200
Increasing both inputs by 4% leads to:
Q2 = 2(1040.4)(1040.6) = 208
Because a 4% increase in both inputs results in a 4.0% increase in output (Q2/Q1 = 208/200 = 1.04), the output elasticity is 1 and the production system exhibits constant returns to scale.
7. Returns to Scale. Determine whether the following production functions exhibit constant, increasing, or decreasing returns to scale.
A. Q = 2X + 25Y + 5Z
B. Q = 3A + 5B - 200
C. Q = 5A + 6B + 3AB
D. Q = 4L2 - 3LK + 2K2
E. Q = 4L0.4K0.8
ANS:
A. Initially, let X = Y = Z = 100, so output is:
Q1 = 2(100) + 25(100) + 5(100) = 3,200
Increasing all inputs by 4% leads to:
Q2 = 2(104) + 25(104) + 5(104) = 3,328
Because a 4% increase in all inputs results in a 4% increase in output (Q2/Q1 = 3,328/3,200 = 1.04), the output elasticity is 1 and the production system exhibits constant returns to scale.
B. Initially, let L = K = 100, so output is:
Q1 = 3(100) + 5(100) - 200 = 600
Increasing both inputs by 5% leads to
Q2 = 3(105) + 5(105) - 200 = 640
Because a 5% increase in both inputs results in a 6.7% increase in output (Q2/Q1 = 640/600 = 1.067), the output elasticity is greater than 1 and the production system exhibits increasing returns to scale.
C. Initially, let A = B = 100, so output is:
Q1 = 5(100) + 6(100) + 3(100)(100) = 31,100
Increasing both inputs by 1% leads to:
Q2 = 5(101) + 6(101) + 3(101)(101) = 31,714
Because a 1% increase in both inputs results in a 2% increase in output (Q2/Q1 = 31,714/31,300 = 1.02), the output elasticity is greater than 1 and the production system exhibits increasing returns to scale.
D. Initially, let L = K = 100, so output is:
Q1 = 4(1002) - 3(100)(100) + 2(1002) = 30,000
Increasing both inputs by 2% leads to:
Q2 = 4(1022) - 3(102)(102) + 2(1022) = 31,212
Because a 2% increase in both inputs results in a 4% increase in output (Q2/Q1 = 31,212/30,000 = 1.04), the output elasticity is greater than 1 and the production system exhibits increasing returns to scale.
E. Initially, let L = K = 100, so output is:
Q1 = 4(1000.4)(1000.8) = 1,005
Increasing both inputs by 4% leads to:
Q2 = 4(1040.4)(1040.8) = 1,053
Because a 4% increase in both inputs results in a 4.8% increase in output (Q2/Q1 = 1,053/1,005 = 1.048), the output elasticity is greater than 1 and the production system exhibits increasing returns to scale.
8. Returns to Scale. Determine whether the following production functions exhibit constant, increasing, or decreasing returns to scale.
A. Q = 10X + 4Y + 0.25Z
B. Q = 12L + 5K + 500
C. Q = 4A + 14B + 3AB
D. Q = 5L2 + 5LK + 5K2
E. Q = 3L0.3K0.4
ANS:
A. Initially, let X = Y = Z = 100, so output is:
Q1 = 10(100) + 4(100) + 0.25(100) = 1,425
Increasing all inputs by 4% leads to:
Q2 = 10(104) + 4(104) + 0.25(104) = 1,482
Because a 4% increase in all inputs results in a 4% increase in output (Q2/Q1 = 1,482/1,425 = 1.04), the output elasticity is 1 and the production system exhibits constant returns to scale.
B. Initially, let L = K = 100, so output is:
Q1 = 12(100) + 5(100) + 500 = 2,200
Increasing both inputs by 5% leads to
Q2 = 12(105) + 5(105) + 500 = 2,285
Because a 5% increase in both inputs results in a 3.9% increase in output (Q2/Q1 = 2,285/2,200 = 1.039), the output elasticity is less than 1 and the production system exhibits diminishing returns to scale.
C. Initially, let A = B = 100, so output is:
Q1 = 4(100) + 14(100) + 3(100)(100) = 31,800
Increasing both inputs by 1% leads to:
Q2 = 4(101) + 14(101) + 3(101)(101) = 32,421
Because a 1% increase in both inputs results in a 2% increase in output (Q2/Q1 = 32,421/31,800 = 1.02), the output elasticity is greater than 1 and the production system exhibits increasing returns to scale.
D. Initially, let L = K = 100, so output is:
Q1 = 5(1002) + 5(100)(100) + 5(1002) = 150,000
Increasing both inputs by 2% leads to:
Q2 = 5(1022) + 5(102)(102) + 5(1022) = 156,060
Because a 2% increase in both inputs results in a 4% increase in output (Q2/Q1 = 156,060/150,000 = 1.04), the output elasticity is greater than 1 and the production system exhibits increasing returns to scale.
E. Initially, let L = K = 100, so output is:
Q1 = 3(1000.3)(1000.4) = 75
Increasing both inputs by 4% leads to:
Q2 = 3(1040.3)(1040.4) = 77
Because a 4% increase in both inputs results in a 2.7% increase in output (Q2/Q1 = 77/75 = 1.027), the output elasticity is less than 1 and the production system exhibits decreasing returns to scale.
9. Optimal Input Mix. Rachel Green, owner-manager of the Manhattan-based Central Perk Coffee Shop, is reviewing the company's compensation plan. Currently, the company pays its three experienced management staff members salaries based on the number of years of service. Chandler Bing, a new management trainee, is paid a more modest salary. Monthly sales and salary data for each employee are as follows:
Bing in particular has shown great promise during the past year, and Green believes a substantial raise is clearly justified. At the same time, some adjustment to the compensation paid other sales personnel would also seem appropriate. Green is considering changing from the current compensation plan to one based on a 9% commission. Green sees such a plan as fairer to the parties involved and believes it would also provide strong incentives for needed market expansion.
A. Calculate Central Perk's salary expense for each employee expressed as a percentage of sales generated by that individual.
B. Calculate monthly income for each employee under a 9% commission-based system.
C. Will a commission-based plan result in efficient relative salaries, efficient salary levels, or both?
Sales Staff Average Monthly Sales Monthly Salary Monica Geller $200,000 $12,000 Phoebe Buffay 150,000 9,750 Joey Tribbian 120,000 6,750 Chandler Bing 90,000 4,500
ANS: A. Sales Staff Average Monthly Sales Monthly Salary Salary Percentage of Sales (1) (2) (3) (4) = (3) (2) Monica Geller $200,000 $12,000 6.00% Phoebe Buffay 150,000 9,750 6.50%
C. The commission-based compensation plan will result in more efficient salaries for sales personnel. Under this plan, Central Perk's compensation costs average 9% of sales, irrespective of which member of the sales staff generates a given dollar of sales. Each employee is treated equally under this plan in the sense that all are paid the same rate for generating business.
Although a commission-based plan will result in an efficient relative pay structure, a 9% commission may or may not result in an optimal level of compensation being paid to each employee. If 9% of sales represents the net marginal revenue (marginal revenue minus all costs except sales expenses) generated by the sales staff, then optimal levels of compensation would be generated under such a commission-based plan. However, if net marginal revenues are different than this rate, some adjustment in the commission rate would be appropriate.
10. Optimal Input Mix. Puerto Rico-based Chocolate Products, Inc., manufactures and distributes a distinctive line of hand-packed candies. Lucy Ricardo president of Chocolate is reviewing the company's sales-force compensation plan. Currently, the company pays its three experienced sales staff members salaries based on the number of years of service. Matty Trumbull, a new sales trainee, is paid a more modest salary. Monthly sales and salary data for each employee are as follows:
Trumbull in particular has shown great promise during the past year, and Ricardo believes a substantial raise is clearly justified. At the same time, some adjustment to the compensation paid other sales personnel would also seem appropriate. Ricardo is considering changing from the current compensation plan to one based on a 3.5% commission. Ricardo sees such a plan as fairer to the parties involved and believes it would also provide strong incentives for needed market expansion.
A. Calculate Chocolate's salary expense for each employee expressed as a percentage of the sales generated by that individual.
B. Calculate monthly income for each employee under a 3.5% commission-based system.
C. Will a commission-based plan result in efficient relative salaries, efficient salary levels, or
Joey Tribbian 120,000 6,750 5.63% Chandler Bing 90,000 4,500 5.00% B. Sales Staff Average Monthly Sales 9% Commission (1) (2) (3) = (2) 0.09 Monica Geller $200,000 $18,000 Phoebe Buffay 150,000 13,500 Joey Tribbian 120,000 10,800 Chandler Bing 90,000 8,100
Sales Staff Average Monthly Sales Monthly Salary Ethel Mertz $300,000 $9,000 Caroline Appleby 450,000 14,000 Ralph Ramsey 520,000 15,000 Matty Trumbull 390,000 8,000
C. The commission-based compensation plan will result in more efficient salaries for sales personnel. Under this plan, Chocolate's compensation costs average 3.5% of sales, irrespective of which member of the sales staff generates a given dollar of sales. Each employee is treated equally under this plan in the sense that all are paid the same rate for generating business.
Although a commission-based plan will result in an efficient relative pay structure, a 3.5% commission may or may not result in an optimal level of compensation being paid to each employee. If 3.5% of sales represents the net marginal revenue (marginal revenue minus all costs except sales expenses) generated by the sales staff, then optimal levels of compensation would be generated under such a commission-based plan. However, if net marginal revenues are different than this rate, some adjustment in the commission rate would be appropriate.
11. Optimal Input Mix. Salem-based Horton & Brady, Inc., is a small firm offering a wide variety of stock brokerage and financial services to high net worth individuals. Mickey Horton, president of Horton & Brady is reviewing the company's compensation plan. Currently, the company pays its three experienced financial advisors a salary based on the number of years of service. Nicole Walker, a new sales trainee, is paid a more modest salary. Sales and salary data for each employee are as follows:
both? ANS: A. Sales Staff Average Monthly Sales Monthly Salary Salary Percentage of Sales (1) (2) (3) (4) = (3) (2) Ethel Mertz $300,000 $9,000 3.0% Caroline Appleby 450,000 14,000 3.1% Ralph Ramsey 520,000 15,000 2.9% Matty Trumbull 390,000 8,000 2.1% B. Sales Staff Average Monthly Sales 3.5% Commission (1) (2) (3) = (2) 0.035 Ethel Mertz $300,000 $10,500 Caroline Appleby 450,000 15,750 Ralph Ramsey 520,000 18,200 Matty Trumbull 390,000 13,650
Financial Advisors Commissions and Fees Generated Salary Hope Williams-Brady $3.2 million $185,000 Austin Reed 2.8 million 112,000 Sami Brady 1.6 million 56,000 Nicole Walker 1.2 million 48,000
Walker in particular has shown great promise during the past year, and Horton believes a substantial raise is clearly justified. At the same time, some adjustment to the compensation paid other sales personnel would also seem appropriate. Horton is considering changing from the current compensation plan to one based on a 5% commission. Horton sees such a plan as fairer to the parties involved and believes it would also provide strong incentives for needed market expansion.
A. Calculate Horton & Brady's salary expense for each employee expressed as a percentage of the commissions and fees generated by that individual.
B. Calculate income for each employee under a 5% commission-based system.
C. Will a commission-based plan result in efficient relative salaries, efficient salary levels, or both?
C. The commission-based compensation plan will result in more efficient compensation for sales personnel. Under this plan, Horton & Brady's sales costs average 5%, irrespective of which member of the sales staff generates a given dollar of sales. Each employee is treated equally under this plan in the sense that all are paid the same rate for generating business.
Although a commission-based plan will result in an efficient relative pay structure, a 5% commission may or may not result in an optimal level of compensation being paid to each employee. If 5% of sales represents the net marginal revenue (marginal revenue minus all costs except sales expenses) generated by the sales staff, then optimal levels of compensation would be generated under such a commission-based plan. However, if net marginal revenues are different than this rate, some adjustment in the commission rate would be appropriate.
12. Optimal Input Mix. Brisco, Van Buren & Associates is a New York City based law firm. Anita van Buren, managing partner of Brisco, Van Buren is reviewing the firm's compensation plan. Currently, the firm pays its staff attorneys salaries based upon the number of years of service. The value of billable hours generated by each staff attorney during the past year are as follows:
Sales Staff Annual Sales Salary Salary Percentage of Sales (1) (2) (3) (4) = (3) (2) Hope Williams-Brady $3,200,000 $185,000 5.78% Austin Reed 2,800,000 112,000 4.00% Sami Brady 1,600,000 56,000 3.50% Nicole Walker 1,200,000 48,000 3.33%
Sales Staff Annual Sales 5% Commission (1) (2) (3) = (2) 0.05 Hope Williams-Brady $3,200,000 $160,000 Austin Reed 2,800,000 140,000 Sami Brady 1,600,000 80,000 Nicole Walker 1,200,000 60,000
ANS: A.
B.
Van Buren believes some adjustment to the compensation paid all staff members would be appropriate. Van Buren is considering changing from the current compensation plan to one whereby each staff member would be paid a salary equal to 10% of client billings (gross revenue generated). Van Buren sees such a plan as fairer to the parties involved and believes it would also provide strong incentives for needed client development.
A. Calculate Brisco, Van Buren's salary expense for each employee expressed as a percentage of the client billings generated by that individual.
B. Calculate income for each employee under a 10% commission-based system.
C. Will a commission-based plan result in efficient relative salaries, efficient salary levels, or both?
C. The commission-based compensation plan will result in more efficient compensation for sales personnel. Under this plan, Brisco, Van Buren's staff attorney salary costs average 10%, irrespective of which member of the staff generates a given dollar of sales. Each employee is treated equally under this plan in the sense that all are paid the same rate for generating business.
Although a commission-based plan will result in an efficient relative pay structure, a 10% commission may or may not result in an optimal level of compensation being paid to each employee. If 10% of sales represents the net marginal revenue (marginal revenue minus all costs except sales expenses) generated by the staff, then optimal levels of compensation would be generated under such a commission-based plan. However, if net marginal revenues
Staff Billings Salary Ed Green $5 million $250,000 Serena Southerlyn 3.5 million 157,500 Jack McCoy 2 million 80,000 Nora Lewin 1.6 million 72,000
A. Staff Billings Salary Salary Percentage of Sales (1) (2) (3) (4) = (3) (2) Ed Green $5,000,000 $250,000 5.0% Serena Southerlyn 3,500,000 157,500 4.5% Jack McCoy 2,000,000 80,000 4.0% Nora Lewin 1,600,000 72,000 4.5% B. Staff Billings 10% Commission (1) (2) (3) = (2) 0.1 Ed Green $5,000,000 $500,000 Serena Southerlyn 3,500,000 350,000 Jack McCoy 2,000,000 200,000 Nora Lewin 1,600,000 160,000
ANS:
are different than this rate, some adjustment in the commission rate would be appropriate.
13. Optimal Input Mix. Hydraulics Ltd. has designed a pipeline that provides a throughput of 70,000 gallons of water per 24-hour period. If the diameter of the pipeline were increased by 1 inch, throughput would increase by 4,000 gallons per day. Alternatively, throughput could be increased by 6,000 gallons per day using the original pipe diameter with pumps that had 100 more horsepower.
A. Estimate the marginal rate of technical substitution between pump horsepower and pipe diameter.
B. Assuming the cost of additional pump size is $600 per horsepower and the cost of larger diameter pipe is $200,000 per inch, does the original design exhibit the property required for optimal input combinations? If so, why? If not, why not?
ANS:
A. The marginal rate of technical substitution is calculated by comparing the marginal products of "diameter," MPD, and "horsepower," MPH:


MPD = Q/D = 4,000/1 = 4,000 gal.
MPH = Q/H = 6,000/100 = 60 gal.
So, MRTSDH = == -66.67 = -66.67
This implies H = -66.67 D or D = -0.015 H. This means, for example, that output would remain constant following a one inch reduction in pipe diameter provided that horsepower were increased by 66.67.


B. No. The rule for optimal input proportions is: =
In this instance the question is: 0.02 0.10
Here the additional throughput provided by the last dollar spent on more horsepower (0.10 gallons/day) is five times the gain in output resulting from the last dollar spent to increase the pipe diameter (0.02 gallons/day). Thus, horsepower and pipe diameter are not being employed in optimal proportions in this situation.
14. Optimal Input Mix. Electron Specialties, Inc. has designed an electric feeder cable that provides a throughput of 2,000 ampere hours (aH) per 24-hour period. If the diameter of the cable were increased by 1/2 inch, throughput would increase by 500 aH per day. Alternatively, throughput could be increased by 1,000 aH per day using the original cable diameter with an additional 100 mf of capacitance electronics designed by the firm.
A. Estimate the marginal rate of technical substitution between capacitance electronics and cable diameter.
B. Assuming the cost of additional capacitance electronics is $50 per mf and the cost of larger diameter cable is $20,000 per 1/2 inch, does the original design exhibit the property required for optimal input combinations? If so, why? If not, why not?
ANS:
A. The marginal rate of technical substitution is calculated by comparing the marginal products of "diameter," MPD, and "capacitance," MPC:


MPD = Q/D = 500/0.5 = 1,000 aH.
MPC = Q/C = 1,000/100 = 10 aH.

So, MRTSDF = == -100 = -100
This implies -C = -100 D or D = -0.01 C. This means, for example, that output would remain constant following a one-half inch reduction in cable diameter provided that capacitance were increased by 100.


B. No. The rule for optimal input proportions is:
In this instance the question is: 0.05 0.125
Here the additional throughput provided by the last dollar spent on additional capacitance (0.125 aH) is two and one-half times the gain in power output resulting from the last dollar spent to increase the cable diameter (0.05 aH). Thus, capacitance electronics and cable diameter are not being employed in optimal proportions in this situation.
=
15. Optimal Input Mix. Boch, Ltd., has designed a fuel injector for oil fired generators that provides a throughput of 3 gallons of oil per minute. If the diameter of the industrial injector nozzle were increased by 1 centimeter, throughput would increase 1 gallon per minute. Alternatively, throughput could be increased by 2 gallons per minute using the original injector diameter with fuel pumps that had 50 more pounds of pressure (psi).
A. Estimate the marginal rate of technical substitution between pump psi and injector diameter.
B. Assuming the cost of additional fuel pump size is $10 per psi (due to changing of the pump and fuel supply peripheral), and the cost of larger diameter fuel injector is $400 per centimeter (due to machining of combustion units), does the original design exhibit the property required for optimal input combinations? If so, why? If not, why not?
ANS:
A. The marginal rate of technical substitution is calculated by comparing the marginal products of "diameter," MPD, and "psi," MPP:


MPD = Q/ D = 1/1 = 1 gal.
MPP = Q/ P = 2/50 = 0.04 gal.


So, MRTSDP = == -25 = -25
This implies P = -25 D or D = -0.04 P. This means, for example, that output would remain constant following a one centimeter reduction in injector diameter provided that psi were increased by 25.

B. No. The rule for optimal input proportions is:
In this instance the question is:
0.0025 0.004
Here the additional throughput provided by the last dollar spent on more psi (0.004 gallons/minute) is about 1.6 times the gain in output resulting from the last dollar spent to increase the output diameter (0.02 gallons/minute). Thus, psi and injector diameter are not being employed in optimal proportions in this situation.
16. Optimal Input Mix. Third World Solutions, Inc., has designed a manual water pump that attains a flow rate of 5 gallons per minute using 1 manpower. If the diameter of the pump were increased by 1 inch, throughput would increase 4 gallons per minute. Alternatively, throughput could be increased by an additional 8 gallons per minute using the original pump diameter with one hydraulic chamber.
A. Estimate the marginal rate of technical substitution between hydraulic chambers and pump diameter.
B. Assuming the cost of additional hydraulic chamber size is $5 per chamber and the cost of a larger pump diameter is $2.50 per inch, does the original design exhibit the property required for optimal input combinations? If so, why? If not, why not?
ANS:
A. The marginal rate of technical substitution is calculated by comparing the marginal products of "diameter," MPD, and "hydraulic chambers," MPH:


MPD = Q/D = 4/1 = 4 gal.
MPH = Q/H = 8/1 = 8 gal.
So, MRTSDH = == -0.50 = -0.50
This implies H = -0.5 D or D = -2 H. This means, for example, that output would remain constant following a one-half inch reduction in pump diameter provided that the number of hydraulic chambers were increased by 1.
B. No. The rule for optimal input proportions is:

In this instance the question is:
1.60 = 1.60
Here the additional throughput provided by the last dollar spent on more hydraulic chamber (1.60 gallons/minute) is the same as the gain in output resulting from the last dollar spent to increase the pump diameter (1.60 gallons/minute). Thus, hydraulic chambers and pump diameter are being employed in optimal proportions in this situation.
17. Optimal Input Level. U-Do-It Furniture, Inc., sells hardwood chairs, in both kits and fully assembled forms. Customers who assemble their own chairs benefit from the lower kit price of $35 per chair. "Full-service" customers enjoy the luxury of an assembled chair, but pay a higher price of $60 per chair. Both kit and fully assembled chair prices are stable. The company has observed the following relation between the number of assembly workers employed per day and assembled chair output:
A. Construct a table showing the net marginal revenue product derived from assembly worker employment.
B. How many assemblers would U-Do-It Furniture employ at a daily wage rate of $75?
C. What is the highest daily wage rate U-Do-It Furniture would pay to hire four assemblers per day?
ANS:
A. Because the market for hardwood chairs is perfectly competitive, the $25 price premium for fully assembled chairs versus kits is stable. Thus, the net marginal revenue product of assembler labor (sometimes referred to as the value of marginal product) is:
B. From the table above, we see that employment of three assemblers could be justified at a daily wage of $75 because MRPA=3 = $75. Employment of a fourth assembler could not be justified because MRPA=4 = $50 < $75.
C. From the table above, the MRPA=4 = $50. Thus, a daily wage of $50 per assembler is the most U-Do-It Furniture would be willing to pay to hire a staff of 4 assemblers.
Number of Workers per day Finished Chairs 0 0 1 5 2 9 3 12 4 14 5 15
Number of Assemblers per Day (1) Fully Assembled Output (2) Marginal Product of Labor (3) Net Marginal Revenue Product of Labor (4)=(3)$25 0 0 1 5 5 $125 2 9 4 100 3 12 3 75 4 14 2 50 5 15 1 25
Optimal Input Level. Do-It-Yourself, Inc., sells budget-priced stereo receivers, in both kit and fully-assembled forms. Customers who assemble their own receivers benefit from the lower kit price of $100 per receiver. "Full-service" customers enjoy the luxury of an assembled receiver, but pay a higher price of $150 per receiver. Both kit and fully assembled receiver prices are stable. The company has observed the following relation between the number of assembly workers employed per day and assembled receiver output:
A. Construct a table showing the net marginal revenue product derived from assembly worker employment.
B. How many assemblers would Do-It-Yourself employ at a daily wage rate of $120?
C. What is the highest daily wage rate Do-It-Yourself would pay to hire four assemblers per day?
ANS:
A. Because the market for budget receivers is perfectly competitive, the $50 price premium for fully assembled receivers versus kits is stable. Thus, the net marginal revenue product of assembler labor (sometimes referred to as the value of marginal product) is:
B. From the table above, we see that employment of three employees could be justified at a daily wage of $120 because MRPA=3 = $200 > $120. Employment of a fourth could not be justified because MRPA=4 = $100 < $120.
C. From the table above, the MRPA=4 = $100. Thus, $100 is the most Do-It-Yourself would be willing to pay to hire a staff of 4 assemblers.
18.
Number of Workers per day Finished Receivers 0 0 1 8 2 14 3 18 4 20 5 21
Number of Assemblers per Day (1) Fully Assembled Output (2) Marginal Product of Labor (3) Net Marginal Revenue Product of Labor (4)=(3)$50 0 0 1 8 8 $400 2 14 6 300 3 18 4 200 4 20 2 100 5 21 1 50
19. Optimal Input Level. Just Bikes, Inc., sells tricycles, in partially-assembled and fully assembled forms. Parents who assemble their own tricycles benefit from the lower price of $40 per tricycle. "Full-service" customers enjoy the luxury of an assembled tricycle, but pay a higher price of $60 per tricycle. Both partially and fully assembled tricycle prices are stable. The company has observed the following relation between the number of assembly workers employed per day and assembled tricycle output:
A. Construct a table showing the net marginal revenue product derived from assembly worker employment.
B. How many assemblers would Just Bikes employ at a daily wage rate of $100?
C. What is the highest daily wage rate Just Bikes would pay to hire three assemblers per day?
ANS:
A. Because the market for tricycles is perfectly competitive, the $20 price premium for fully assembled versus partially assembled tricycles is stable. Thus, the net marginal revenue product of assembler labor (sometimes referred to as the value of marginal product) is:
B. From the table above, we see that employment of two assemblers could be justified at a daily wage of $100 because MRPA=2 = $120 > $100. Employment of a third assembler could not be justified because MRPA=3 = $80 < $100.
C. From the table above, the MRPA=3 = $80. Thus, $80 is the highest daily wage Huffee Bikes would be willing to pay to hire a staff of 3 assemblers.
20. Nonprice Competition. Tickets, Inc., uses mall intercept promotion services to promote concerts and sporting events. The St. Louis firm uses a team of ten students to hand-deliver flyers at shopping malls and other high traffic centers, where every hour increment of flyer advertising costs $130. Over the past year, the following relation between advertising and ticket sales per event has been observed:
Number of Workers per day Finished Tricycles 0 0 1 8 2 14 3 18 4 21 5 23
Number of Assemblers per Day (1) Fully Assembled Output (2) Marginal Product of Labor (3) Net Marginal Revenue Product of Labor (4)=(3)$20 0 0 1 8 8 $160 2 8 6 120 3 14 4 80 4 20 3 60 5 23 2 40
and
Sales/A = 200 - 1.2A
Here A represents one hour of flyer distribution, and sales are measured in numbers of tickets.
Niki Martin, manager for the St. Louis firm, has been asked to recommend an appropriate level of advertising. In thinking about this problem, Martin noted its resemblance to the optimal resource employment problem she had studied in a managerial economics course that was part of her MBA program. The advertising-sales relation could be thought of as a production function with advertising as an input and sales as the output. The problem is to determine the profit-maximizing level of employment for the input, advertising, in this "production" system. Martin recognized that to solve the problem she needed a measure of output value. After consultation with associates, she determined that the value of output is $2 per ticket, the net marginal revenue earned (price minus all marginal costs except flyer advertising).
A. Continuing with Martin's production analogy, what is the "marginal product" of advertising?
B. What is the rule for determining the optimal amount of a resource to employ in a production system? Explain the logic underlying this rule.

C. Using the rule for optimal resource employment, determine the profit-maximizing number of flyer distribution hours.
ANS:
A. The marginal product of advertising is given by the expression:
MP A = S/A = 200 - 1.2A
B. The rule for determining the optimal amount of a resource to employ is:
MRPA = PA
The logic of this rule can be best understood by simply dissecting the above relations:
MRPA = PA
MPA MRQ = PA
TR = TC
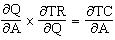
Inflow = Outflow
C. The optimal advertising level is found where:
MRPA = PA
MPA MRQ = PA
(200 - 1.2A) $2 = $130
Sales (units) = 7,000 + 200A - 0.6A2
400 - 2.4A = 130
2.4A = 270 A = 112.5 or 115 one-hour segments of flyer advertising.
21. Nonprice Competition. Top Gun Marketing, Inc., offers overhead banner fly-by promotion services using their Cessna aircraft and banner creation facilities. The Padres Island firm specializes in restaurant promotion via fly-bys at outdoor events and other high traffic centers, where each 10 minute increment of advertising costs $300. Over the past year, the following relation between fly-by advertising and incremental restaurant guests per month has been observed:
Sales (units) = 5,200 + 50A - 0.5A2 and
Sales/A = 50 - A
Here A represents a 10-minute fly-by advertisement, and sales are measured in numbers of restaurant guests.
Pete Mitchel, manager for the Padres Island firm, has been asked to recommend an appropriate level of advertising. In thinking about this problem, Mitchel noted its resemblance to the optimal resource employment problem he had studied in a managerial economics course that was part of his MBA program. The advertising-sales relation could be thought of as a production function with advertising as an input and sales as the output. The problem is to determine the profit-maximizing level of employment for the input, advertising, in this "production" system. Mitchel recognized that to solve the problem he needed a measure of output value. After consultation with the restaurant, he determined that the value of output is $10 per guest, the net marginal revenue earned by the client (price minus all marginal costs except fly-by advertising).
A. Continuing with Mitchel's production analogy, what is the "marginal product" of advertising?
B. What is the rule for determining the optimal amount of a resource to employ in a production system? Explain the logic underlying this rule.
C. Using the rule for optimal resource employment, determine the profit-maximizing number of 10-minute ads.
ANS:
A. The marginal product of advertising is given by the expression:
MP A = S/A = 50 - A
B. The rule for determining the optimal amount of a resource to employ is:
MRPA = PA
The logic of this rule can be best understood by simply dissecting the above relations:
MRPA = PA
TR = TC Inflow = Outflow
C. The optimal advertising level is found where:
MRPA = PA
MPA MRQ = PA
(50 - A) $10 = $300 500 - 10A = 300
10A = 200 A = 20 or 20 10-minute increments of fly-by advertising.
22. Optimal Input Level. Laboratory Testing, Inc., provides routine drug tests for employers in the Los Angeles metropolitan area. Tests are supervised by skilled technicians using equipment produced by two leading competitors in the medical equipment industry. Records for the current year show an average of 24 tests per hour performed on the A-1, and 51 tests per hour on a new machine, the Caltec. The A-1 is leased for $16,000 per month, and the Caltec is leased at a rate of $34,000 per month. On average, each machine is operated 25 eight-hour days per month. Labor and all other costs are fixed.
A. Does company usage reflect an optimal mix of testing equipment?
B. At a price of $5 per test should the company lease more machines?
ANS:
A. The rule for an optimal combination of A-1 (A) and Caltec (C) equipment is:


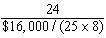

Of course, marginal products and equipment prices must both be in the same relevant time frame, either hours or months.
On a per hour basis, the relevant question is:
0.3 = 0.3
On a per month basis, the relevant question is:
0.3 = 0.3
In both instances, the last dollar spent on each machine increased output by the same 0.3 units indicating an optimal mix of testing machines.
MPA MRQ = PA
B. Yes, expansion would be profitable. The rule for optimal input employment is:
MRP = MP MRQ = Input Price
In this instance, for each machine hour:
Or, in per month terms:
In both cases, we see that each machine returns more than its marginal cost (price), and expansion would be profitable.

23. Optimal Input Level. Smokey's Garage, Inc., provides routine auto diagnostics for customers in the Atlanta, Georgia, metropolitan area. Tests are supervised by skilled mechanics using equipment produced by two leading competitors in the auto test equipment industry. Records for the current year show an average of 4 tests per hour performed on the Sunny Tune System (STS), and 6 tests per hour on a new machine, the Car Care Tower (CCT). The STS is leased for $8,000 per month, and the CCT is leased at a rate of $12,000 per month. On average, each machine is operated 25 eight-hour days per month. Labor and all other costs are fixed.
A. Does company usage reflect an optimal mix of testing equipment?
B. At a price of $15 per test should the company lease more machines?
ANS:
A. The rule for an optimal combination of STS and CCT equipment is:

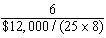

Of course, marginal products and equipment prices must both be in the same relevant time frame, either hours or months.
On a per hour basis, the relevant question is:
0.1 = 0.1
On a per month basis, the relevant question is:
A-1 Caltec MRPA = MPA MRQ PA MRPC = MPC MRQ PC 24 $5 $16,000/(25 8) 51 $5 $34,000/(25 8) $120 > $80 $255 > $170
MRPA = MPA MRQ PA MRPC = MPC MRQ -PC 24 (25 8) $5 $16,000 51 (25 8) $5 $34,000 $24,000 > $16,000 $51,000 > $34,000
In both instances, the last dollar spent on each machine increased output by the same 0.1 units indicating an optimal mix of testing machines.
B. Yes, expansion would be profitable. The rule for optimal input employment is:
MRP = MP MRQ = Input Price
In this instance, for each machine hour:
Or, in per month terms:
In both cases, we see that each machine returns more than its marginal cost (price), and expansion would be profitable.
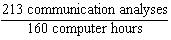
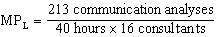
24. Optimal Input Level. Communications Consultant Services, Inc., advises small to medium-sized businesses on telephone equipment and network configurations. The primary resources CCS employs are skilled network consultants and computers. Currently, CCS employs 16 consultants at a cost of $70 per hour (wage plus fringes and variable overhead), and purchases 160 hours of computer time each week at a time-sharing cost of $280 per hour. Each consultant works a 40-hour week. This level of employment allows CCS to complete 213 communications analyses per week for which the firm receives $300 each.
A. Assuming that both returns to factors and returns to scale are constant, what are the marginal products for: (1) communication consultants and, (2) computer time (up to the full capacity level)?
B. Is CCS employing labor and computers in an optimal ratio, assuming that substitution of the resources is possible? Explain.
C. Determine the marginal revenue products for consultants and for the computer services employed by CCS. (Assume constant returns to factors in part A.)
D. Is CCS employing an optimal (profit-maximizing) quantity of labor and computer time? Explain.
ANS:
A. Because returns to factors and returns to scale are constant for CCS' current operations, the marginal and average products for each input will be equal. Thus,
STS CCT MRPSTS = MPSTS MRQ PSTS MRPCCT = MPCCT MRQ v PCCT 4 $15 $8,000/(25 8) 6 $15 $12,000/(25 8) $60 > $40 $90 > $60
STS CCT MRPSTS = MPSTS MRQ PSTS MRPCCT = MPCCT MRQ PCCT 4 (25 8) $15 $8,000 6 (25 8) $15 $12,000 $12,000 > $8,000 $18,000 > $12,000
MPL = APL and MPC = APC
Where, = 0.33 analyses per planner hour
MPC = = 1.33 analyses per computer hour
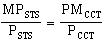
B. Yes. For CCS to be using inputs in their optimal ratios, then:
In this problem:
0.25 = 0.25
Yes. CCS is employing consultants and computer time in the optimal ratio.
C. MRPL = MPL MRQ = 0.33 $300 = $100

MRP
C = MPC MRQ = 1.33 $300 = $400
This means that an additional hour of consultant time will increase CCS revenue by $100, and an additional hour of computer time will increase revenue by $400.
D. No. If CCS were employing a profit maximizing quantity of labor and computer time, then MRP = P for both inputs.
MRPL PL MRPC PC
$100 $70 $400 $280
Therefore, CCS is not employing a profit maximizing level of inputs and should expand its operation.
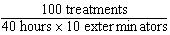
25. Optimal Input Level. Sunshine Pest Control, Inc., provides exterminator services to residences in the Miami area. The primary resources SPC employs are skilled exterminators and large dome/air pumps used to cover the homes, pump in insecticide, and minimize leakage to the environment. Currently, SPC employs 10 exterminators at a cost of $15 per hour, employs 2,000 hours of pump time each week at a cost of $3 per hour. Each exterminator works a 40-hour week. This level of employment allows SPC to complete 100 treatments per week for which the firm receives $100 each.
A. Assuming that both returns to factors and returns to scale are constant, what are the marginal products for (1) exterminators and (2) gallons of chemicals?
B. Is SPC employing labor and domes in an optimal ratio, assuming that substitution of the resources is possible? Explain.


C. Determine the marginal revenue products for exterminators and for the domes/pumps
employed by SPC. (Assume constant returns to factors in part A.)

D. Is SPC employing an optimal (profit-maximizing) quantity of labor and computer time? Explain.
ANS:
A. Because returns to factors and returns to scale are constant for SPC's current operations, the marginal and average products for each input will be equal. Thus,


MPL = APL and MPD = APD
Where, MPL = = 0.25 treatments per exterminator
MPD = = 0.05 treatments per dome-pump hour.

B. Yes. For SPC to be using inputs in their optimal ratios, then: In this problem:
Yes. SPC is employing exterminators and dome pumps in the optimal ratio.
C. MRPL = MPL MRQ = 0.25 $100 = $25
MRPD = MPD MRQ = 0.05 $100 = $5
This means that an additional hour of exterminator time will increase SPC revenue by $25, and an additional hour of dome pump time will increase revenue by $5.
D. No. If SPC were employing a profit maximizing quantity of labor and computer time, then MRP = P for both inputs.
MRPL PL MRP D PD
$25 > $15 $5 > $3
Therefore, SPC is not employing a profit maximizing level of inputs and should expand its operation.
Test Bank for Managerial Economics, 12th Edition, Christopher Thomas, S. Charles Maurice Visit TestBankBell.com to get complete for all chapters

