ECONOMIC SNAPSHOT


MID-YEAR 2023

METRO PHOENIX
Presented by Michael Carabio


Six months ago, we discussed three scenarios that were possible for the economy. Our best case we called the “soft landing” (and gave it a 20% chance) which meant that we escape a recession despite high interest rates with a strong labor market and by bringing inflation under control. The other two scenarios included a recession, one short and shallow, recovering by the second half of 2024 (50% chance) and the worst case being a long and protracted recession (30% chance).
Despite months of predictions that the U.S. is on the verge of a recession, the U.S. economy has remained remarkably resilient in 2023. Stubborn inflation and rising interest rates that typically signal the peak of an economic cycle haven’t managed to spark the job-killing downturn that many, including us, feared was inevitable. What we have seen over the past six months is low unemployment and declining inflation. Job growth has continued and there are still nearly twice as many jobs available as there are people looking for one.
Many economists and investment banks are changing their outlook. Goldman Sachs now reports just a 25% chance of recession in the next year. Bank of America is now forecasting a softer downturn not expected until next year. One of the country’s leading economists, Mark Zandi of Moody’s Analytics, has cited five reasons why the economy could avoid a recession:
Between low spending during the pandemic and the government’s stimulus money, consumers saved a lot more cash. Savings peaked in 2021 but consumers are still holding on to $500 billion. Consumer spending, which accounts for 70% of our economy, is still increasing.
Businesses have struggled to find employees both before and after the pandemic. They are avoiding layoffs now because persistent labor shortages are expected going forward as baby boomers retire.
Borrowing by households and businesses has been sensible ever since the Great Recession. While household debt is near record highs, consumers are not overly burdened compared to their disposable income.
While still a burden on households, inflation was down to 4% in May and has been on a downward trajectory for months. The Fed decided not to increase borrowing rates last month, although additional increases are anticipated by the end of the year. If consumers and businesses believe the Fed will do what is needed to rein in inflation, they will behave accordingly. A more positive outlook - that inflation will recede - will help increase the chances of this outcome.
Recessions since World War II have historically been preceded by a spike in oil prices. That has not occurred this time. Global oil markets have adjusted despite the Ukraine war, easing inflationary pressures. We may experience price swings as Saudi Arabia cuts output, but prices have stabilized for now.
Overall, declining inflation, stable oil prices, steady consumer finances, and a strong labor market all point to a potential soft landing. The economy will ultimately slump, but odds are fading that a recession is ahead. Time will tell if this more optimistic forecast comes true.
1.7% INCREASE 2023
2.7% INCREASE 2024
1.9% INCREASE 2023
2.7% INCREASE 2024
1.6% INCREASE 2023
4.0% INCREASE 2024
-30.0% DECREASE 2023
20.0% INCREASE 2024
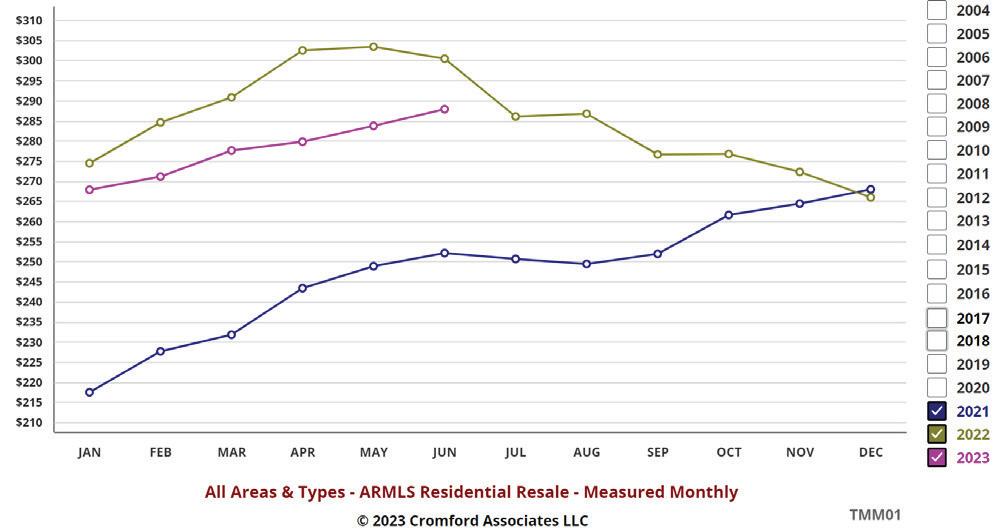
When the Dodd-Frank Act was signed into law in 2010 after the 2008 financial crisis, it was described as “the most far-reaching Wall Street reform in history” to ensure that “taxpayers will not have to bear the costs of Wall Street’s irresponsibility”1. Housing prices today are proving to be resilient in the face of a possible recession due to some of the lending regulations implemented in that bill. While supply has been severely restricted for buyers due to the “locked-in effect” of homeowners with fixed-rate sub-3% mortgages, most in the industry would agree they’d choose this over a flood of desperate sellers facing foreclosure any day of the week. Countries that do not have long-term fixed-rate mortgages, like the UK for example, are seeing homeowners forced to sell their properties as their payments adjust to higher rates. This is causing supply to surge and home prices to fall in those countries, while homeowners in the U.S. are content and able to stay put in the storm. Losses from last year’s price declines were realized mostly by Wall Street-backed companies engaging in short-term hold strategies, otherwise known as iBuyers, that were forced to deeply discount their holdings to sell. Since the beginning of this year, with most of Wall Street on the sidelines, home prices have been rising and closing the gap between last year’s and this year’s price measures. To reflect this, below are the year-over-year price appreciation measures for June, and appreciation rates since December 2022.
June
MONTHLY PRICE PER SQUARE FOOT
Declined -4.2% from $300.43 to $287.86
Increased +8.3% from $265.92 to $287.86
MONTHLY AVERAGE SALES PRICE
Declined -1.8% from $592,285 to $581,358
Increased +12.5% from $516,546 to $581,358
MONTHLY MEDIAN SALES PRICE
Declined -6.6% from $474,374 to $443,000
Increased +7.5% from $412,000 to $443,000
The 2023 price recovery in the Greater Phoenix market has caused some head scratching in the media since high mortgage rates in the 6-7% range have remained the leading impasse for home buyers and sellers to fully engage. The key piece of the puzzle is luxury real estate, which is not reliant on mortgage rates because a high percentage of the sales are cash.
The market over $1M had its 3rd best Spring season in 2023 for both sales volume and dollar volume. 2022 had 3,432 sales in the first half, $6.7B in dollar volume, and +11.5% June-to-June price appreciation. 2021 had 3,015 sales in the first half, $5.9B in dollar volume, and +26.7% June-to-June price appreciation. 2023 had 2,746 sales in the first half, $5.3B in dollar volume and +8.3% Juneto-June price appreciation. Eliminating 2020 due to COVID-19 for comparison, 2019 had 1,136 sales in the first half, $2.1B in dollar volume, and +7.1% June-to-June price appreciation. When sales over $1M are removed from price calculations, the June-to-June price appreciation per square foot is reduced from a decline of -4.2% to -8.7% and the December 2022 to June 2023 price appreciation rate is softened from +8.3% to +3.2%.
The active supply of homes in Greater Phoenix has declined 48% since the peak in October 2022 from 19,640 to 10,200. Supply levels in 2018 and 2019 at this time of year were around 14,000. Overall contract activity has been severely restricted due to mortgage rates as well, with just 7,435 contracts in escrow at the
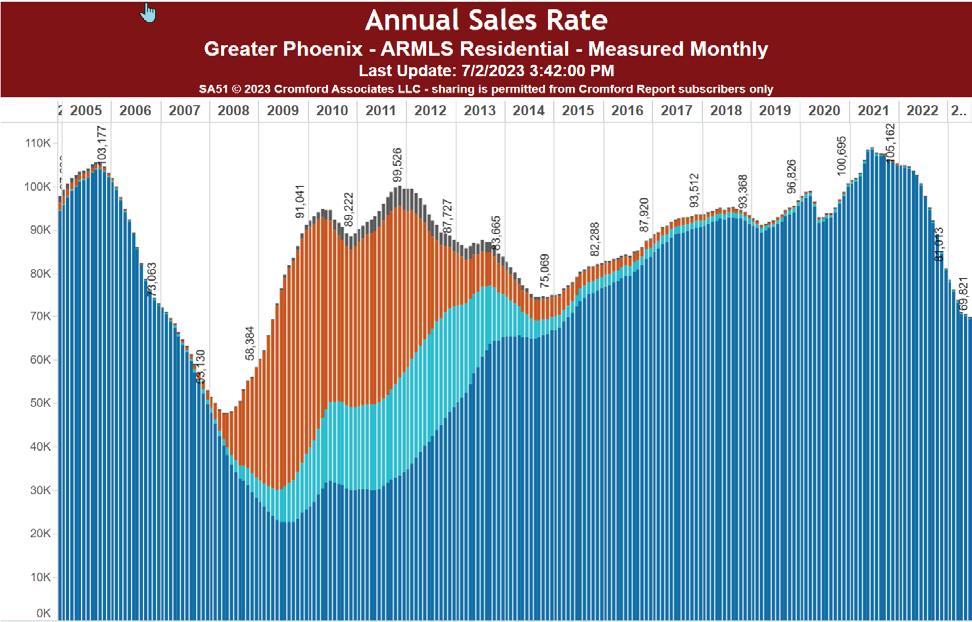

end of June. Based on 2018 and 2019 at this time of year, there should be nearly 11,000 in escrow. While the drop in demand is dramatic, the simultaneous dramatic drop in supply has offset any downward pressure on price. This is keeping housing values stable and rising for now.
In the last issue, we estimated January would be the bottom of the market and we were almost right. December was officially the bottom, but without luxury sales January was the bottom for the rest of the market. Looking forward, the Cromford Market Index has moved into a mild seller’s market comparable to 2018. There is justifiable optimism that inflation rates will reveal more favorable improvements in the 3rd quarter of the year, which could have a positive effect on mortgage rates. If that happens, and unemployment remains low at 3.4% in Greater Phoenix, we could see both supply and demand rise in the second half of 2023. That wouldn’t have much effect on price appreciation but would be a huge relief to the real estate industry and its employees.