Local Market Update for April 2021
Outer Richmond Market Update April 2021 1E Outer Richmond Report provided by the San Francisco Association of REALTORS®
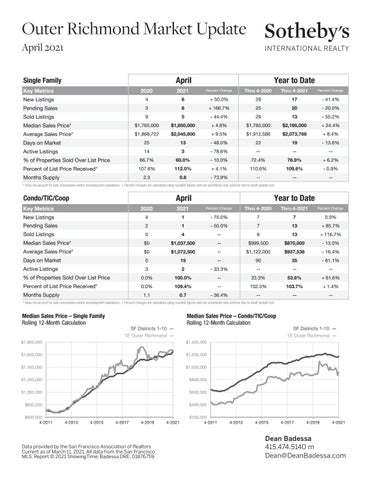
April
Single Family
Year to Date
Key Metrics
2020
2021
Percent Change
New Listings
4
6
+ 50.0%
29
17
- 41.4%
Pending Sales
3
8
+ 166.7%
25
20
- 20.0%
Sold Listings
9
5
- 44.4%
29
13
- 55.2%
Median Sales Price*
$1,765,000
$1,850,000
+ 4.8%
$1,765,000
$2,195,000
+ 24.4%
Average Sales Price*
$1,868,722
$2,045,800
+ 9.5%
$1,912,586
$2,073,769
+ 8.4%
25
13
- 48.0%
22
19
- 13.6%
Days on Market Active Listings
Thru 4-2020
Thru 4-2021
Percent Change
14
3
- 78.6%
--
--
--
% of Properties Sold Over List Price
66.7%
60.0%
- 10.0%
72.4%
76.9%
+ 6.2%
Percent of List Price Received*
107.6%
112.0%
+ 4.1%
110.6%
109.6%
- 0.9%
2.3
0.6
- 73.9%
--
--
--
Months Supply
* Does not account for sale concessions and/or downpayment assistance. | Percent changes are calculated using rounded figures and can sometimes look extreme due to small sample size.
April
Condo/TIC/Coop
Year to Date
Key Metrics
2020
2021
Percent Change
Thru 4-2020
New Listings
4
1
- 75.0%
7
7
0.0%
Pending Sales
2
1
- 50.0%
7
13
+ 85.7%
Thru 4-2021
Percent Change
Sold Listings
0
4
--
6
13
+ 116.7%
Median Sales Price*
$0
$1,037,500
--
$999,500
$870,000
- 13.0%
Average Sales Price*
$0
$1,072,500
--
$1,122,000
$937,538
- 16.4%
Days on Market
0
15
--
90
35
- 61.1%
Active Listings
3
2
- 33.3%
--
--
--
% of Properties Sold Over List Price
0.0%
100.0%
--
33.3%
53.8%
+ 61.6%
Percent of List Price Received*
0.0%
109.4%
--
102.3%
103.7%
+ 1.4%
1.1
0.7
- 36.4%
--
--
--
Months Supply
* Does not account for sale concessions and/or downpayment assistance. | Percent changes are calculated using rounded figures and can sometimes look extreme due to small sample size.
Median Sales Price – Single Family Rolling 12-Month Calculation
SF Districts 1-10 — 1E Outer Richmond —
Median Sales Price – Condo/TIC/Coop Rolling 12-Month Calculation
$1,800,000
$1,400,000
$1,600,000
$1,200,000
$1,400,000
$1,000,000
$1,200,000
$800,000
$1,000,000
$600,000
$800,000
$400,000
$600,000 4-2011
4-2013
4-2015
4-2017
4-2019
Data provided by the San Francisco Association of Realtors Current as of March 11, 2021. All data from the San Francisco MLS. Report © 2021 ShowingTime. Badessa DRE: 01876759
4-2021
$200,000 4-2011
4-2013
4-2015
SF Districts 1-10 — 1E Outer Richmond —
4-2017
4-2019
4-2021
Dean Badessa 415.474.5140 m Dean@DeanBadessa.com
Current as of May 11, 2021. All data from the San Francisco MLS. Report © 2021 ShowingTime.