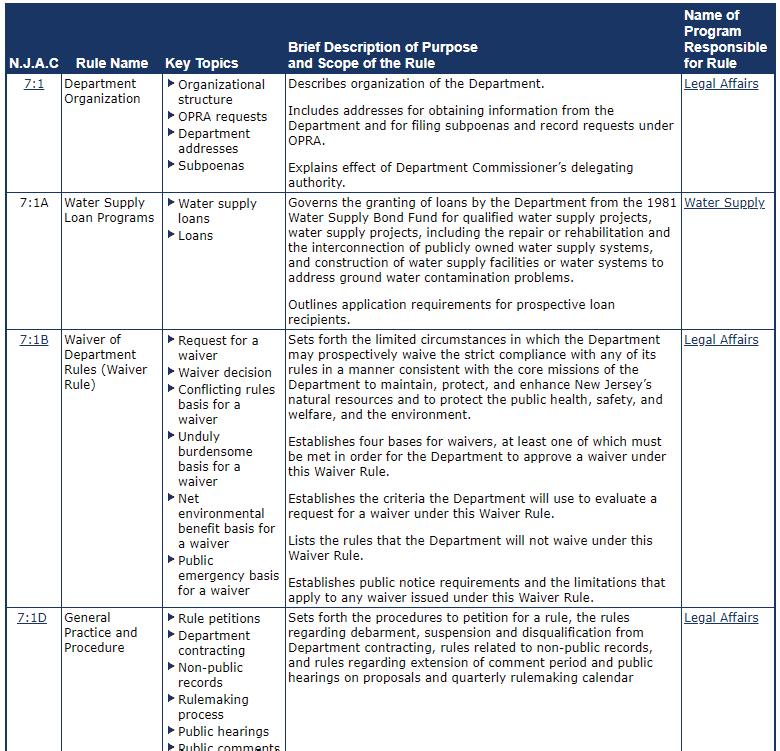
Rutgers, The State University of New Jersey Department of Landscape Architecture
Instructors:
Prof. Dr. Wolfram Hoefer
Prof. Arianna Lindberg
Published 11 December 2018
Cover by Michael Scott Bey
This report was compiled by:
Alex Baldwin
Giovanni Caputo
Yat Chan
Jonathan Connor
Evan Eden
Axel Gonzalez
Eric Graber
Adriana Hall
Daniel Ilkow
Chelsea Kang
Tom Kastner
Molly Kinghorn
Dianne Lê
Amanda Leifer
Jolean London
Jessica MacPhee
Tiffany Nguyen
Zoe Orlino
Nina Petracca
David Rigueur
Smerliene Rodriguez
Michael Scott Bey
Jessica Thorning
Zhaoxuan Wang
Aliya Williams
Dakota Wojcik
Lydia Zoe
The Environmental Planning Studio is a 5-credit, junior level studio course. It is mandatory for the BS Landscape Architecture and optional for the BS Environmental Planning and Design.
INTRODUCTION
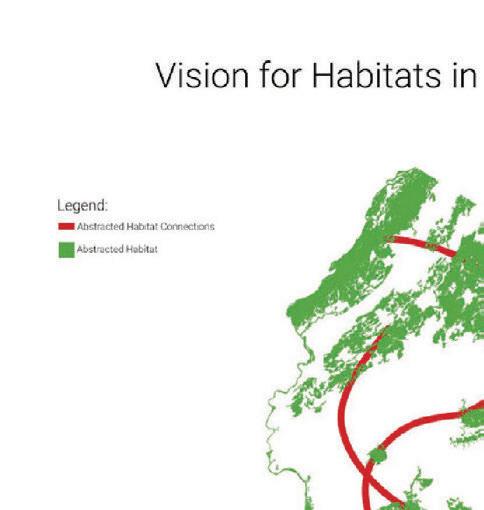
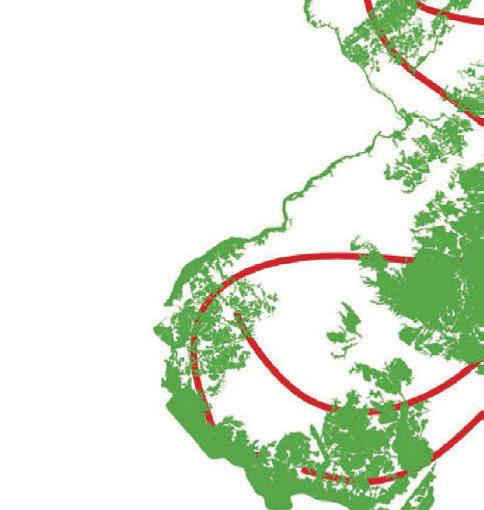
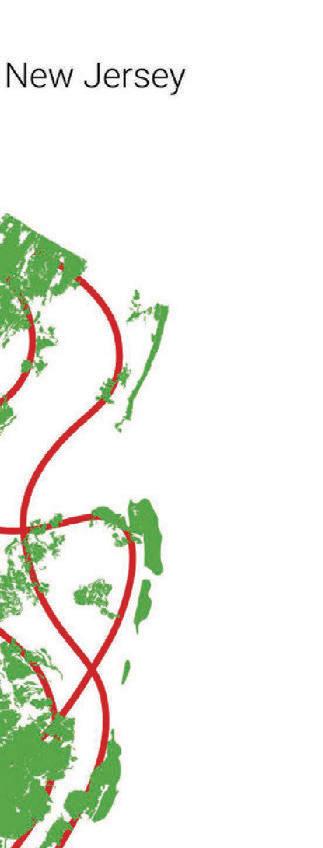
Introduction
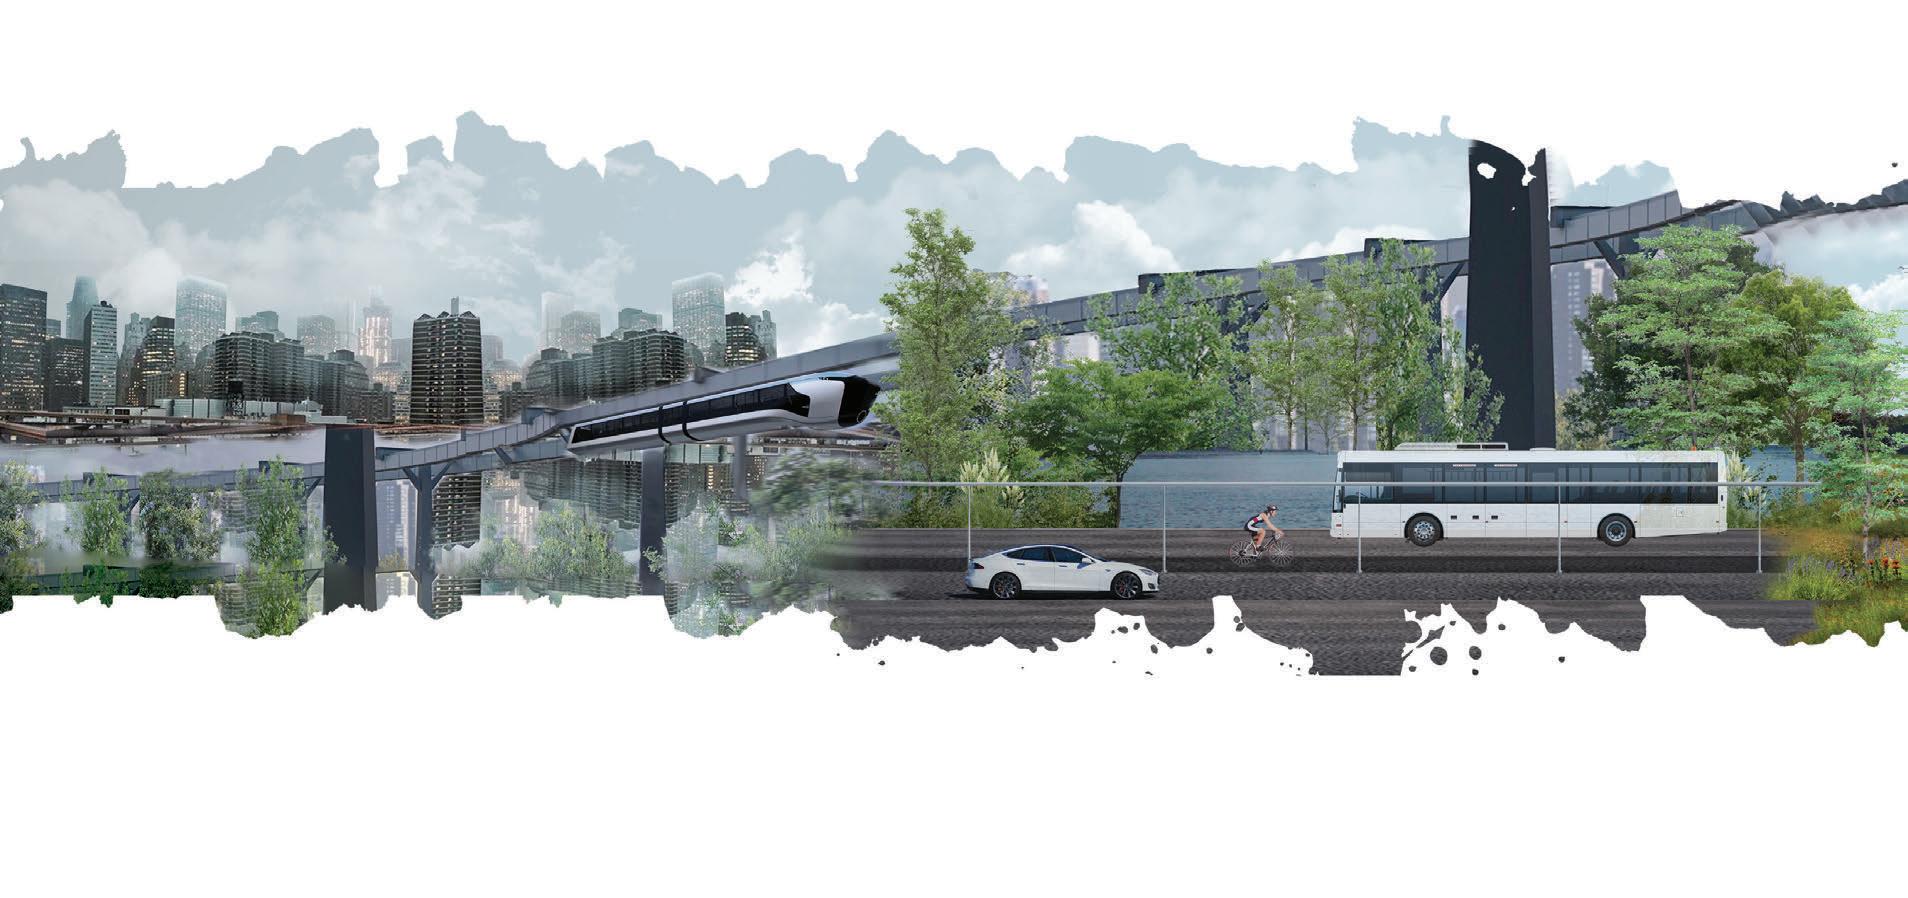
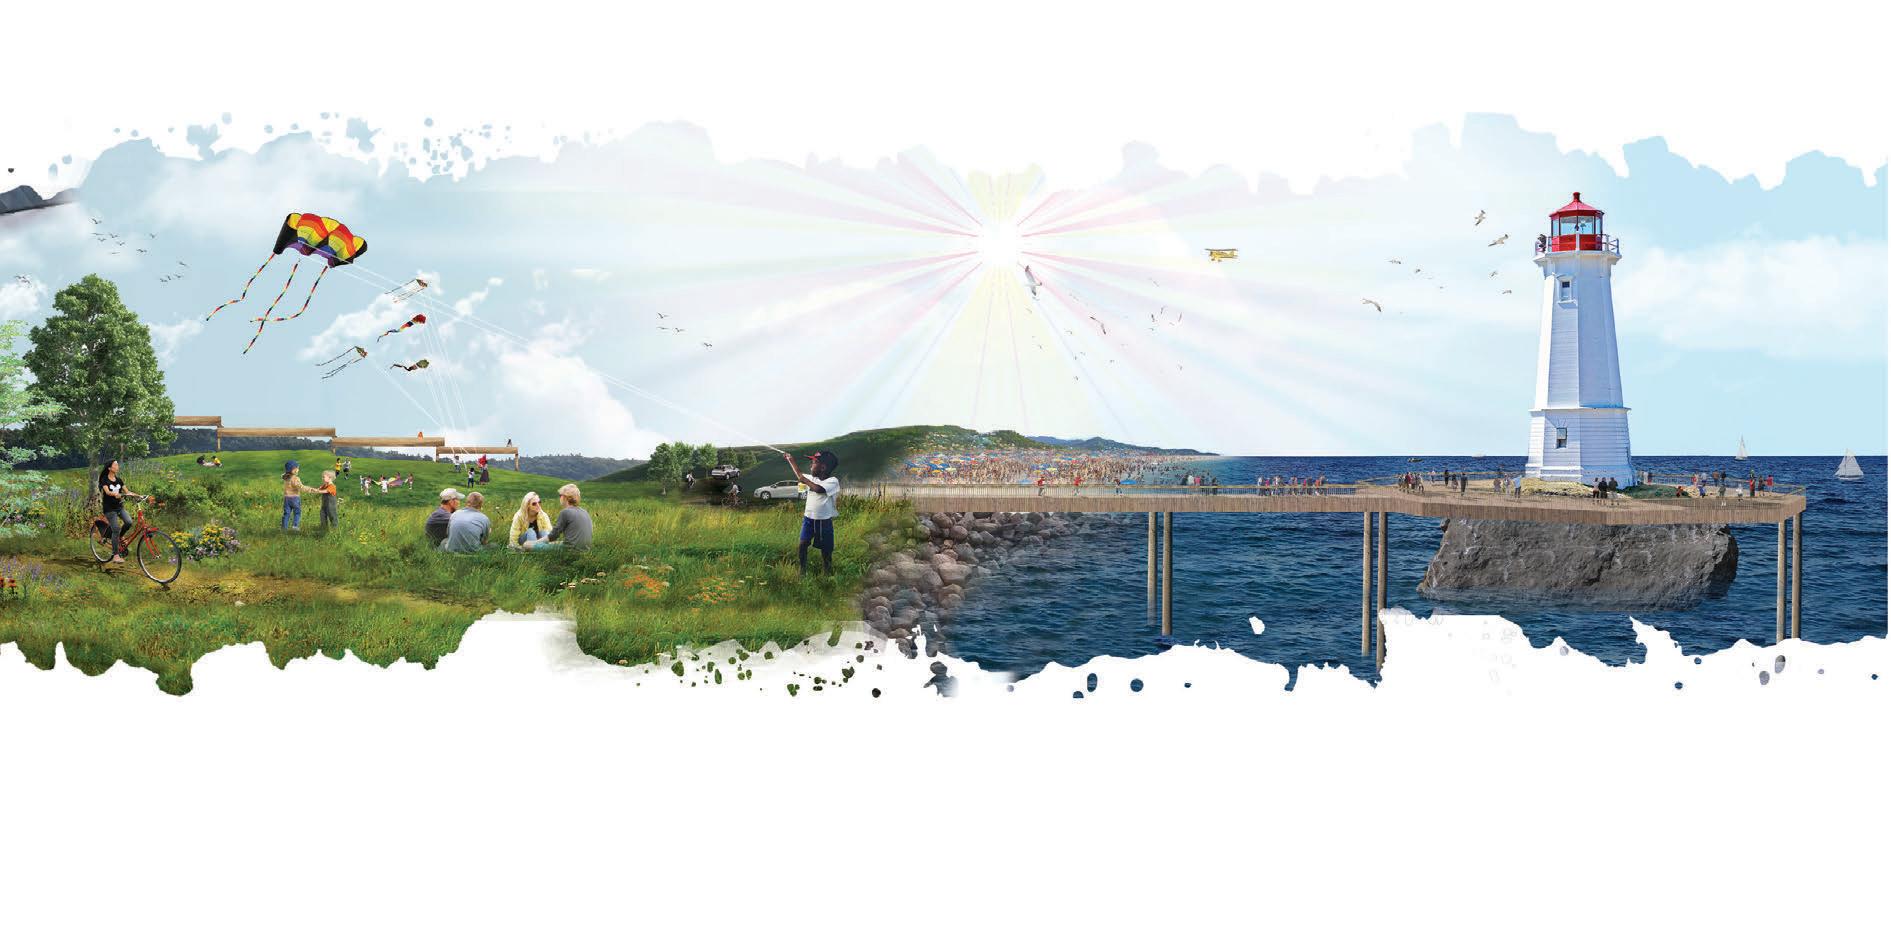
Business as usual no longer works for New Jersey. The challenges of climate change will make large portions of the sate uninhabitable, while the need for a ordable housing challenges development pressures. Tra c makes the commute to work unbearable, while new roads fragment remaining natural habitat. New Jersey is at the crossroads of either fully building out the state or an opportunity of a sustainable and resilient future for its diverse population. The fact that we need innovative solutions is shared by both residents and leaders across the political spectrum, but there is still no common vision in place for guidance.
At present, the State of New Jersey calls for an innovative master plan, although the focus is currently on coastal resiliency planning. We hope that
our work will provide an argument that a statewide e ort is needed. The plan must, of course, consider issues related to economy, urban development and transportation, but should also address concerns related to environmental vulnerabilities and ecological assets. Policy makers and residents are generally quite aware of the threats associated with climate change and rapid development, but there is no real agreement about a positive goal. A strong environmental focus has not been incorporated into the state’s planning e orts before, but with new state leadership committed to improving the environment, we nd it to be an auspicious time to take on the challenge of forming a positive vision of the environmental landscape of New Jersey that may be used toward future decision making.
The goal of developing a vision with such a focus is a challenging experiment due in part to the fact that environmental concerns are often perceived as hindering, rather than supporting, development. Coupled with this is the simple fact that New Jersey’s environmental conditions are very complex – whether one considers such issues as coastal resilience, contamination, or habitat fragmentation and loss. For our students, developing a vision has meant addressing the challenges without being overwhelmed by them, identifying objectives and outlining implementation strategies. As a course, this planning studio fostered the development of problem-solving skills and the ability to interpret and analyze data, information and ideas.
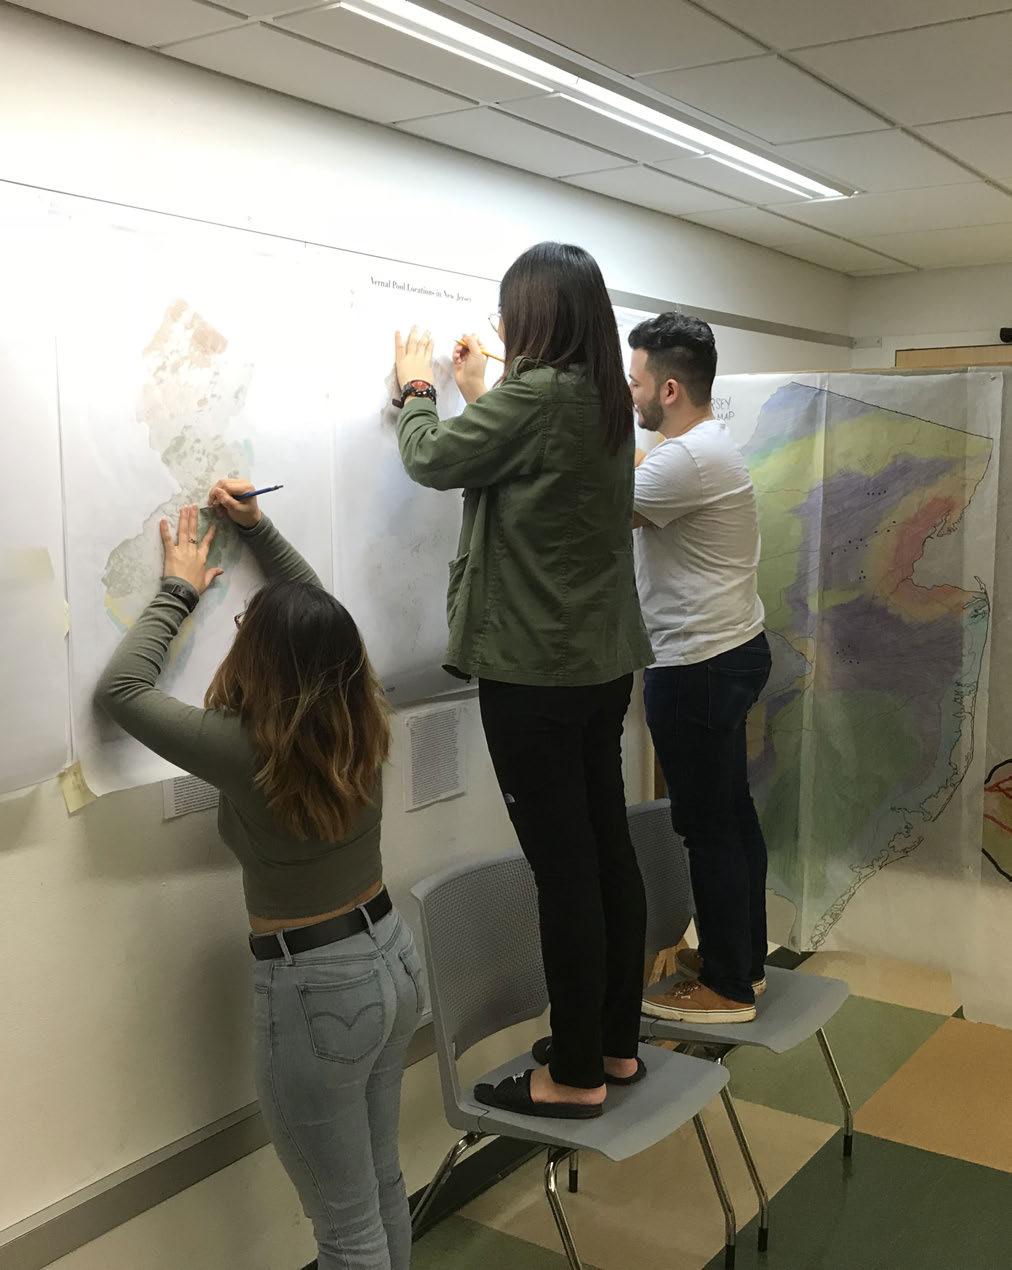
The planning process was organized by a series of assignments and accompanied by readings from Frederick Steiner’s Making Plans: How to engage with landscape, design, and the urban environment and Barbara Salmore’s New Jersey Politics and Government. The students began by identifying and describing the landscape typologies of the state. After mapping these on an abstract level, the existing complexity of overlapping landscapes became quite clear. From here, students de ned goals for each typology and then moved into a more detailed inventory stage based on focused aspects of the landscape types.
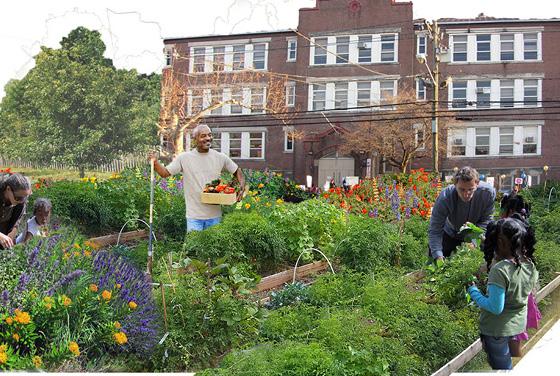
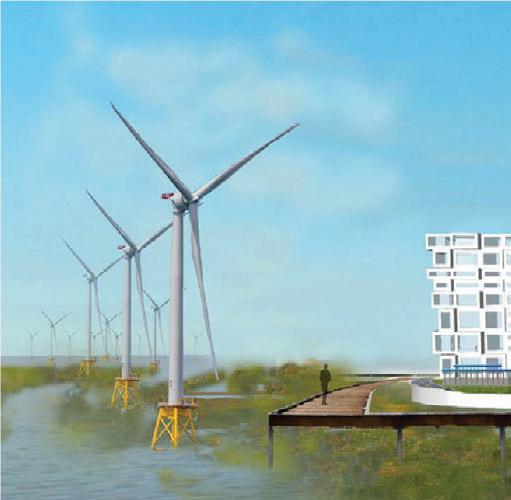
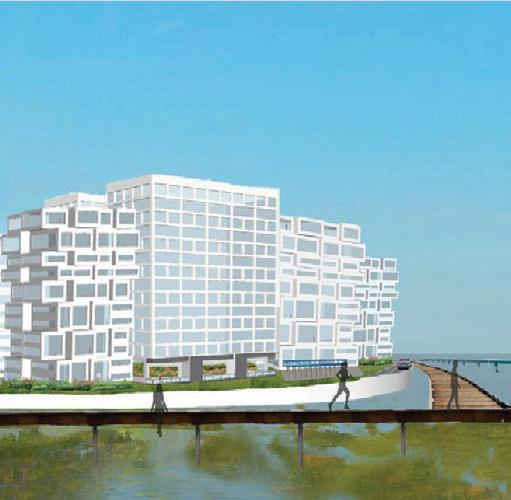
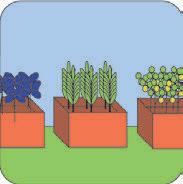
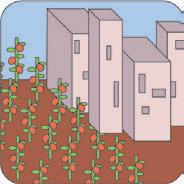
Inventory mapping of various natural, cultural and social systems led to the development of three design themes that informed the students’ design and policy approach to speci c planning topics. The theme RE-THINK encompassed agriculture, a ordable housing and habitat. RESILIENCE included topics of renewable energy, contamination and retreat. CONNECTIVITY addressed transportation, open space and historic sites.
The students have greatly appreciated the constructive criticism provided by state o cials, representatives from NGO’s, and Rutgers faculty. Both formal reviews and informal conversations have helped the students to obtain a more thorough understanding of the complex issues at hand in order to place their work in a real-world context. This report documents visionary proposals that may seem far-fetched, but at this point in time, New Jersey is in need of such forward thinking. It is our hope that together, these proposals form the foundation for a robust conversation about the future of the state of New Jersey that includes a positive vision of the environmental landscape.
Arianna Lindberg, Wolfram Hoefer
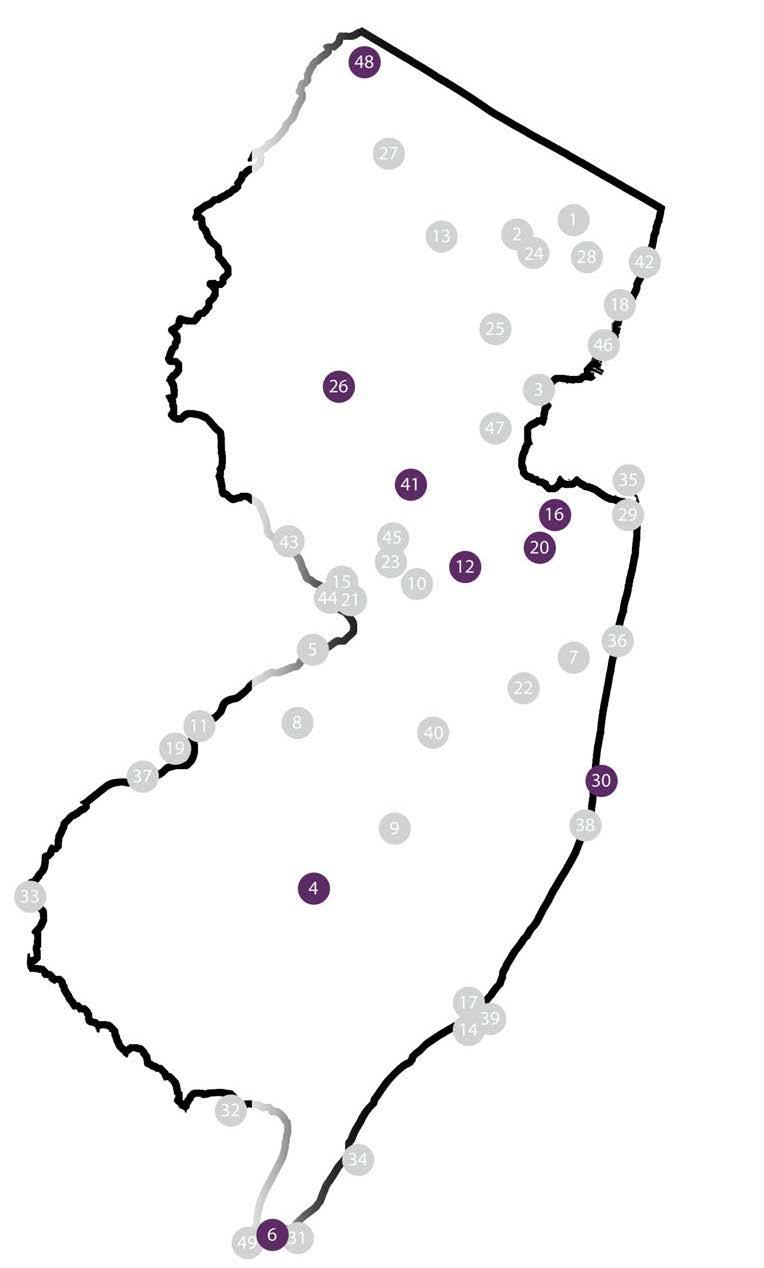
TYPOLOGIES OF NEW JERSEY
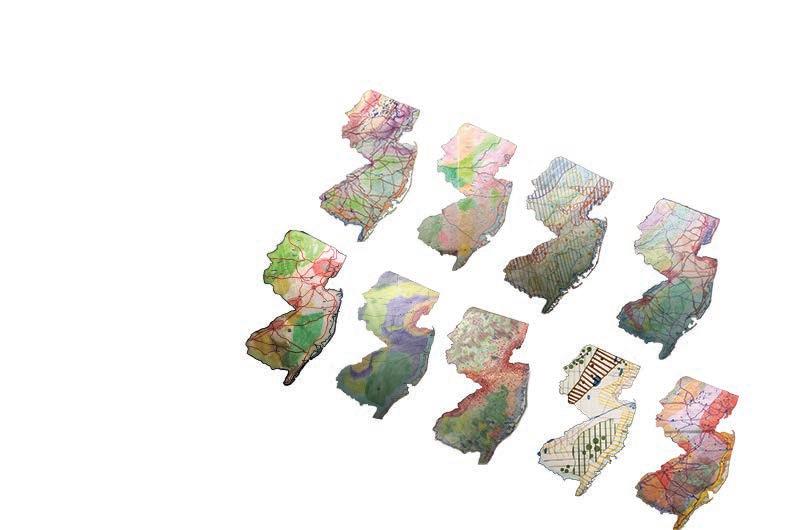
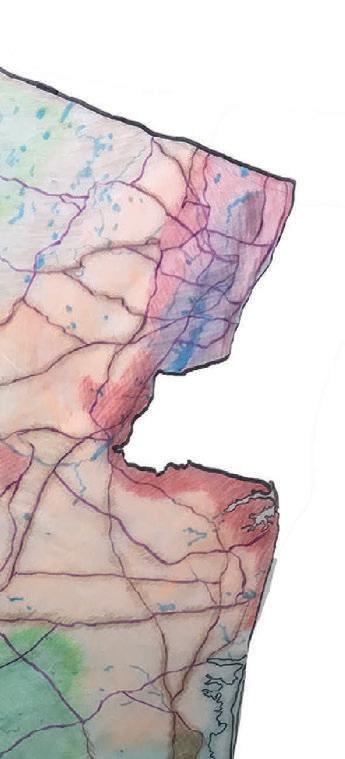
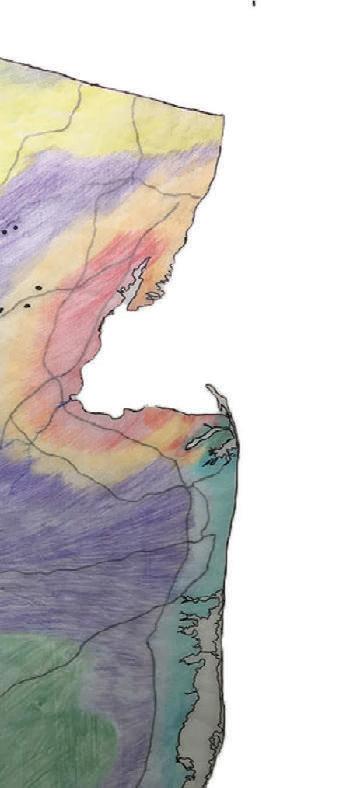
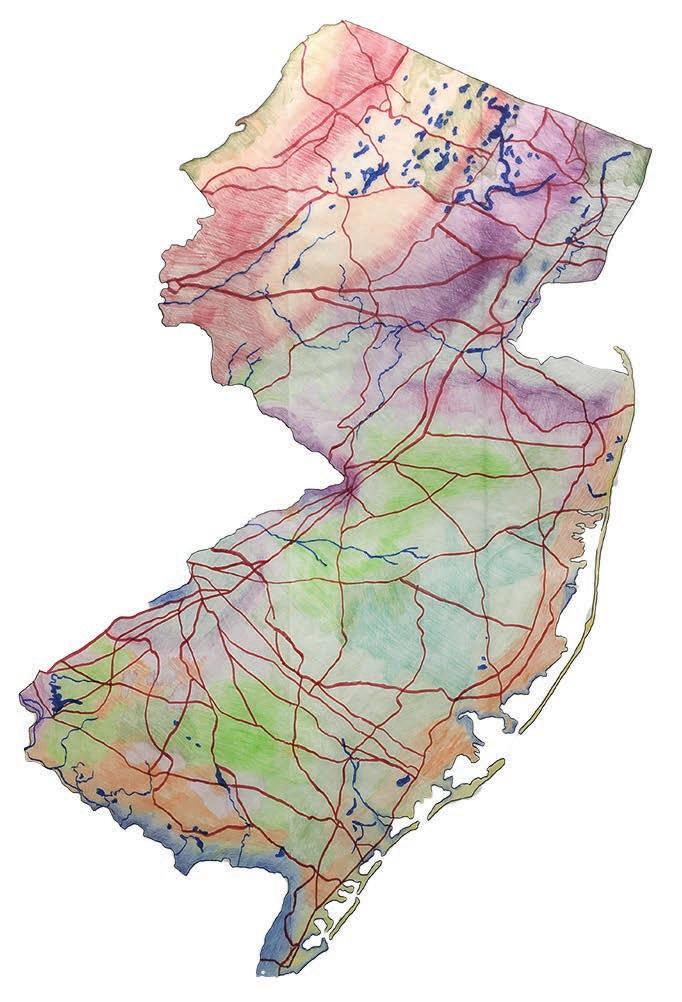
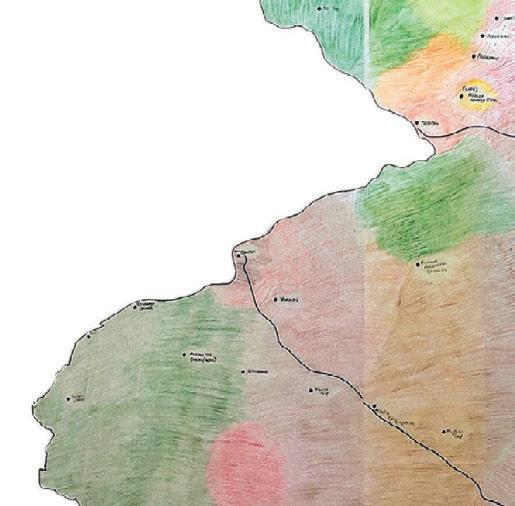
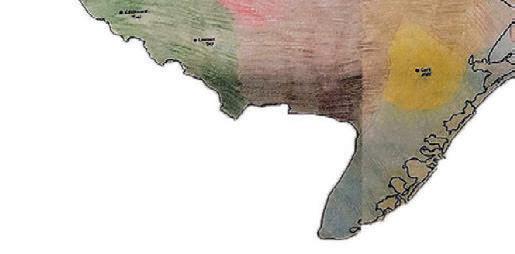
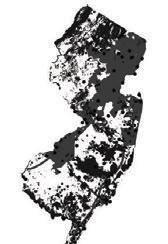
An urban downtown is a di erent landscape than the shore or a farm landscape, but it is also di erent from a suburban town. The whole of New Jersey is made up of a variety of di erent landscape types, or landscape types. In our design teams, we brainstormed several landscape typologies to re ect all of New Jersey when combined and created maps of these typologies.
TYPOLOGIES OF NEW JERSEY
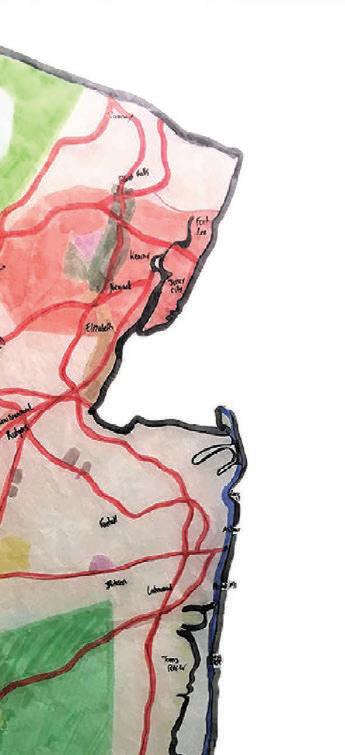
Our map divides the di erent landscapes of New Jersey into the following typologies: Private Landscapes, Public Landscapes, Commercial Sites, Suburban Landscapes, Urban Landscapes, Turnpikes and Parkways, Agricultural Land, Mountains, Beaches, and the Pine Barrens. We thought that these typologies embodied the State as a whole, and took note of the correlations between di erent typologies.
Jon Connor, Dianne Le, Amanda Leifer
TYPOLOGIES OF NEW JERSEY
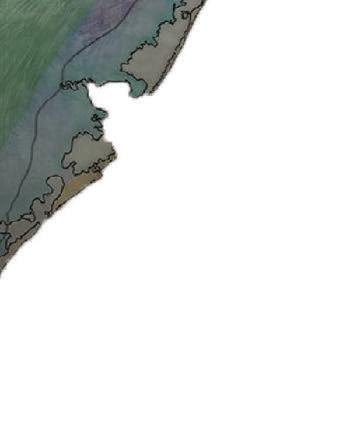
The typologies of New Jersey seen here exemplify only the lens through which we see the state and how we have experienced it. However, we became aware of the fact that individual spaces and types of landscape that make up the state overlap and interact with each other in this exercise. Through this interaction, we realized that New Jersey is a much more complex and diverse state than what we have individually experienced.
Giovanni Caputo, Smerliene Rodriguez, Jessica Thorning
TYPOLOGIES OF NEW JERSEY
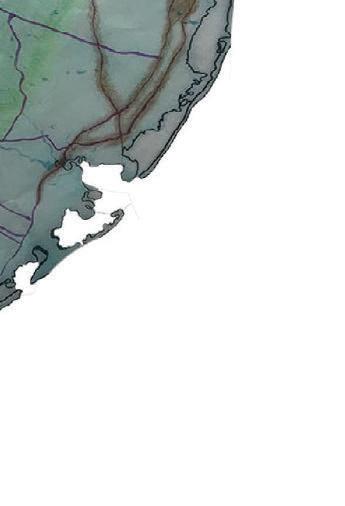
New Jersey is a small state, but consists of many di erent typologies. Three main categories relating to the geography of the state are: The Highlands, The Pine Barrens and The Jersey Shore. These areas contain New Jersey’s scenic aspects and resources. Three categories that New Jersey living is broken up into are urban, suburban and rural areas. Rural areas are home to New Jersey’s agriculture that make our nickname the Garden State.
Tom Kastner, Nina Petracca, Eric Graber
TYPOLOGIES OF NEW JERSEY
There were some typologies that we had a clear idea of, but others were much more vague and required some guess work to establish their locations. We identi ed the urban areas as the three major cities in the state, i.e. Trenton, Camden, and Newark. The suburban areas were bu ered around these population centers and eventually led to forested areas in the North and agricultural areas in the South. The Pinelands, Valley/Ridge, Coastal Plains, Mountains, Transportation, and Shore were in fairly xed locations making them easier to mark on our map. The location of Green spaces, Wetlands, Commercial, and Water were based more on our own Interpretation of New Jersey.
Molly Kinghorn, Jessica MacPhee, Adriana Hall
TYPOLOGIES OF NEW JERSEY
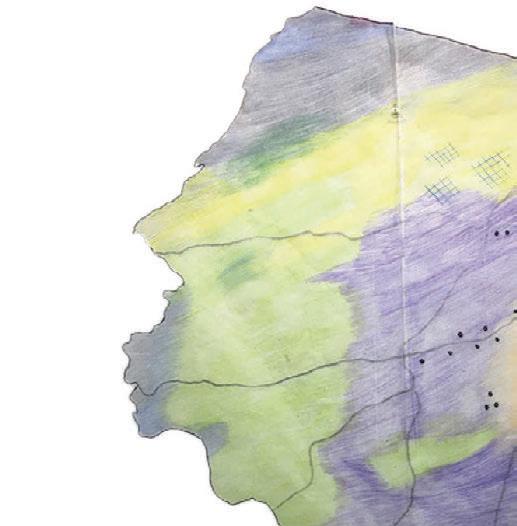
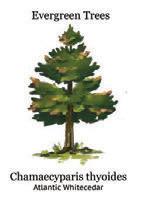
The rst aspect of New Jersey that we focused on was the urban and industrial areas because of the major signi cance that New York and Philadelphia have on the state. We then looked at the shore because of the tourist attention that it draws to New Jersey. Bordering the shore are the pinelands which consist of a dense preserve of evergreen trees and sandy soil. Following pinelands, we focused our attention to the north western part of New Jersey where the Appalachian Mountains touch state. In conjunction to the vast landscape of no impervious surfaces, we then gured out where all of the major roadways are. We felt that each one of these typologies were most signi cant to our vision.
Zhaoxuan Wang, Dakota Wojcik, Zoe Orlino
Highlands/
Suburban/
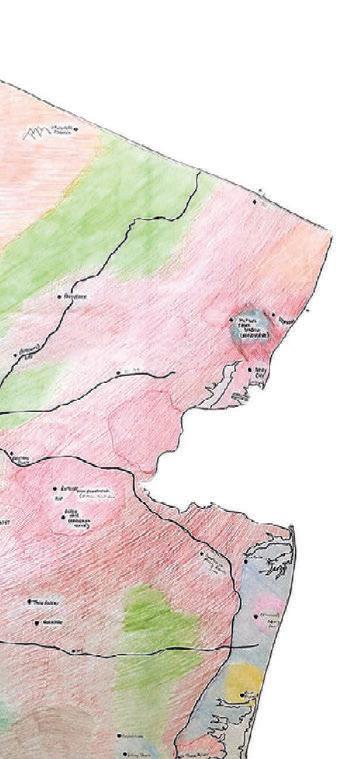
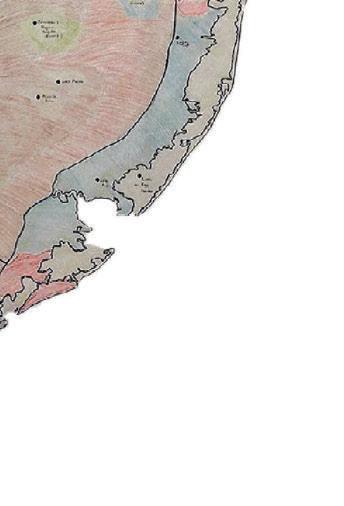
TYPOLOGIES OF NEW JERSEY
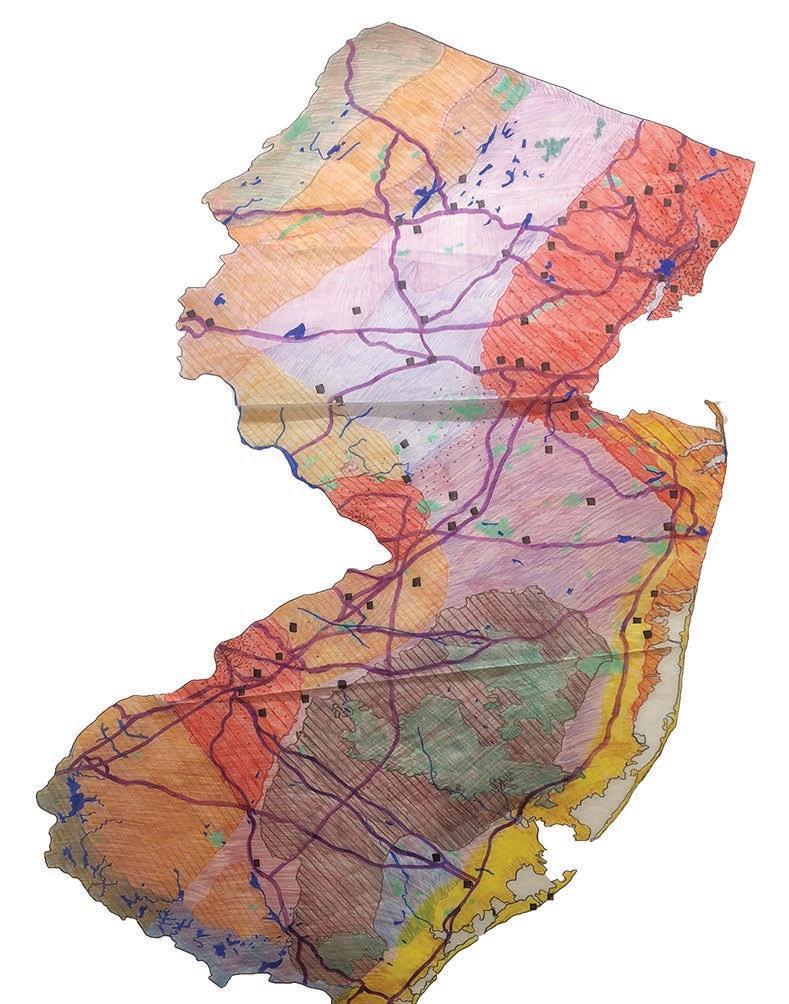
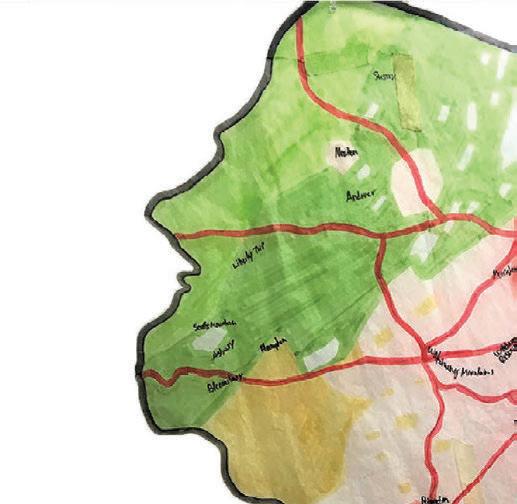
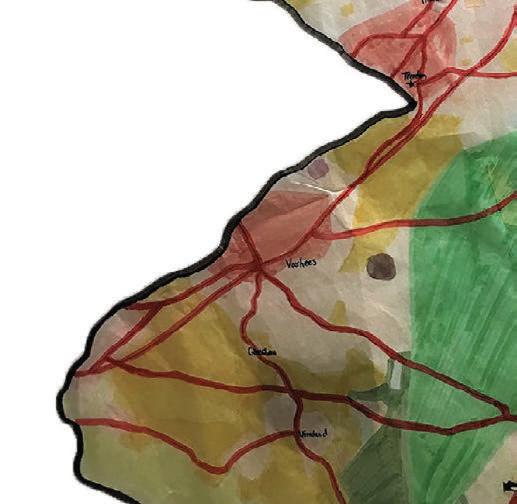
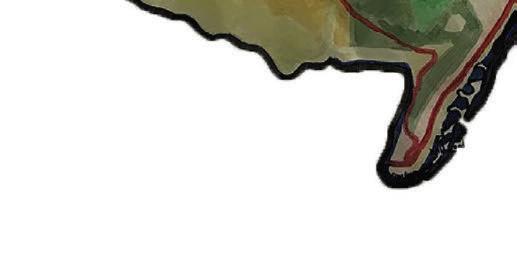
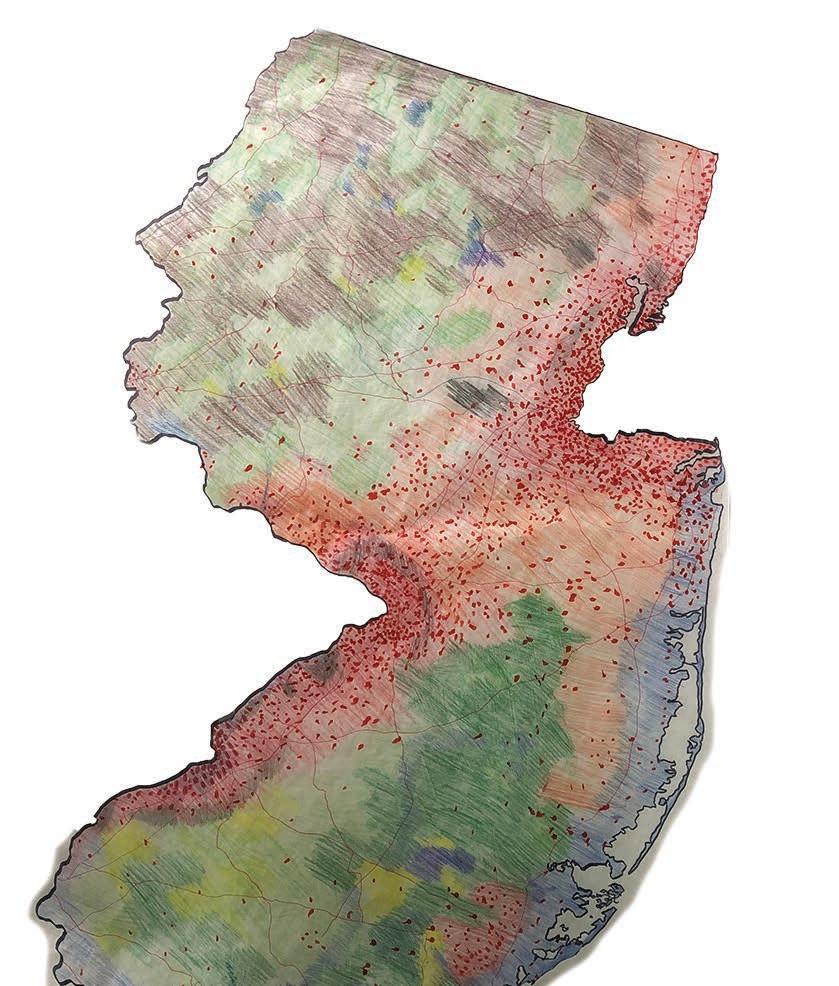
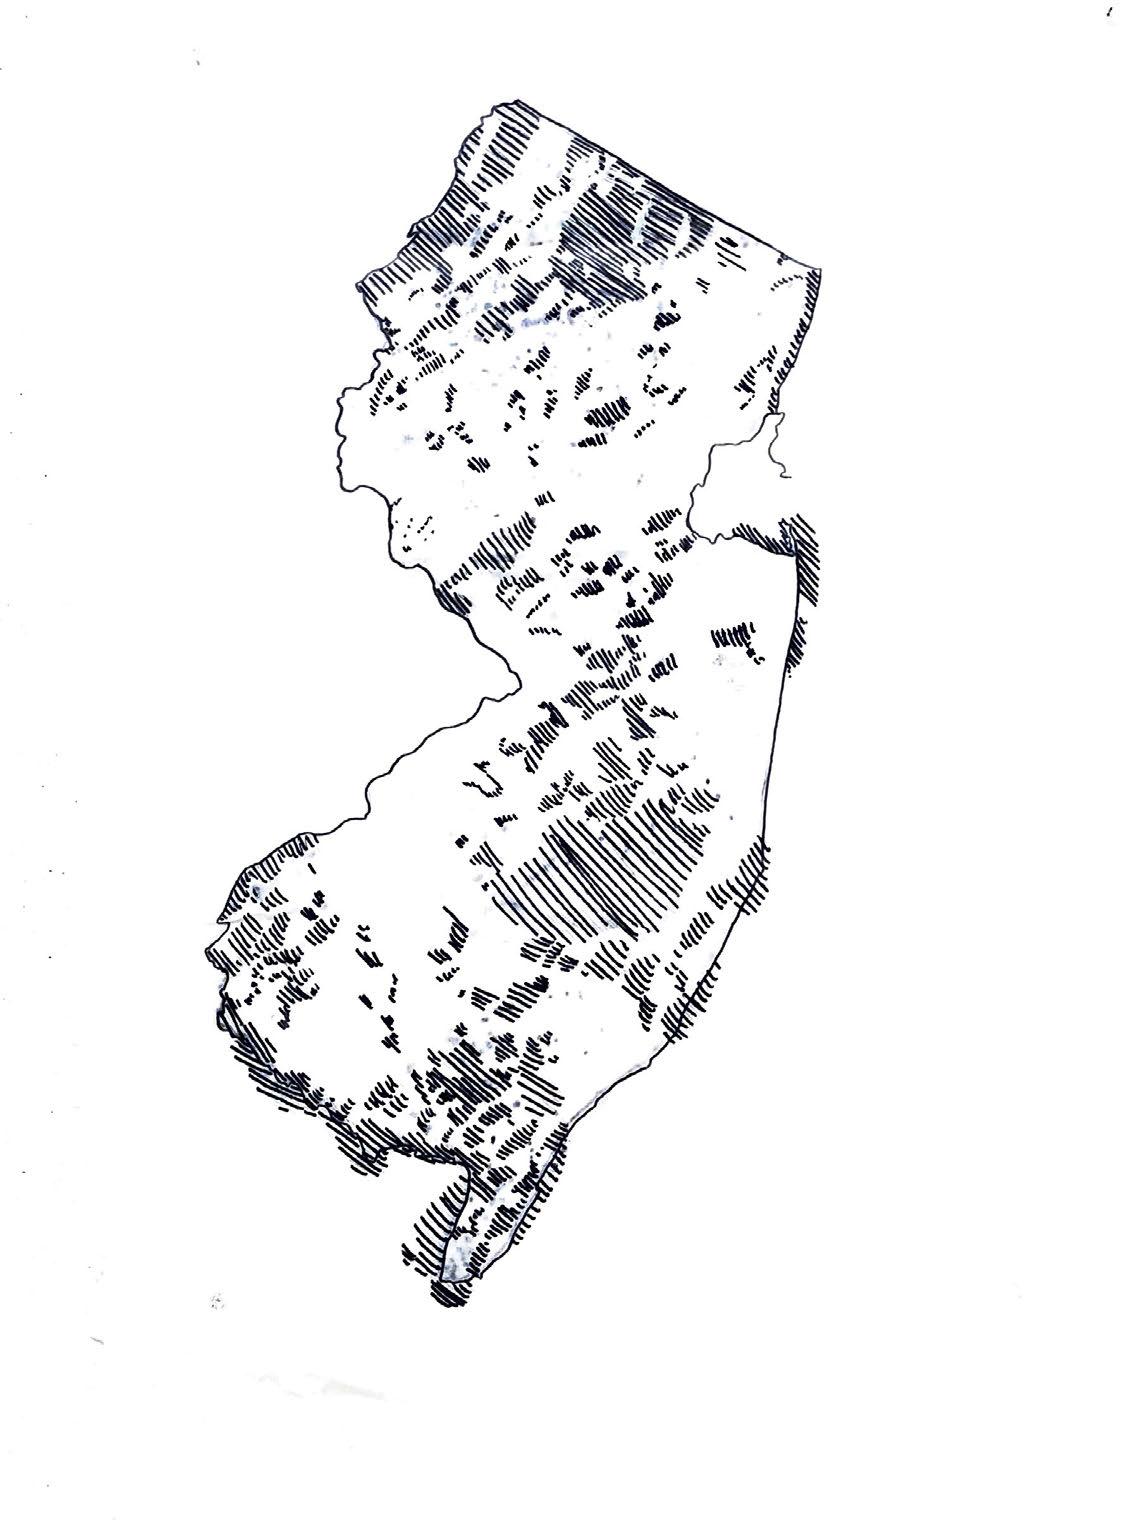
This map of New Jersey illustrates the landscape typologies that the state encompasses. New Jersey is unique and stands out from all other states in the United State for numerous reasons including that of population density. With this map drawing, the diverse nature of the state as a whole is reverent. It is important to understand how the state is structured, so that the issues that will arise in curating a state plan can be anticipated.
Axel Gonzalez, Ti any Ngueyen, Yat Chan
TYPOLOGIES OF NEW JERSEY
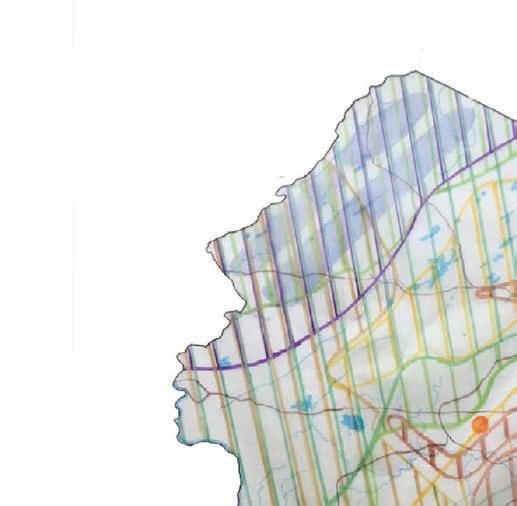
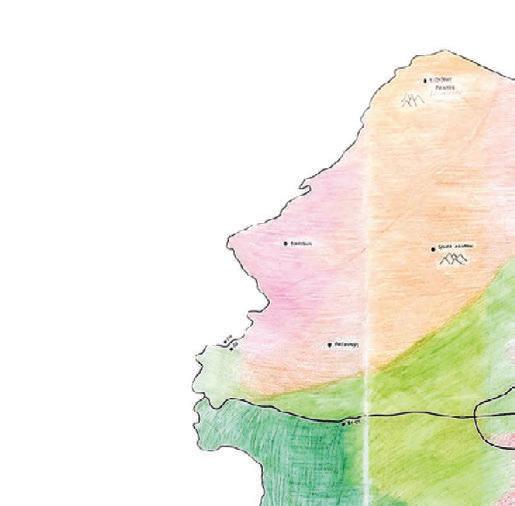
Our map of New Jersey divides the state into the typologies: Industrial, Urban/City, Suburban, Shore, Coastal Plain, Agriculture, Pine Barrens, Forest, Valley/Ridge, Mountains, Wetlands, Commercial, and Gathering Spaces. What stood out evidently was the highly densely urbanized areas where the state meets Pennsylvania and New York. The ine ciency of public transportation and congestion of roadways was also noted.
Aliya Williams, Daniel Ilkow, Evan Eden
TYPOLOGIES OF NEW JERSEY
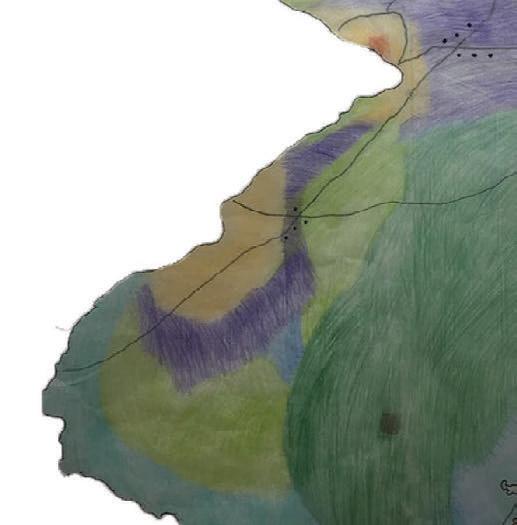
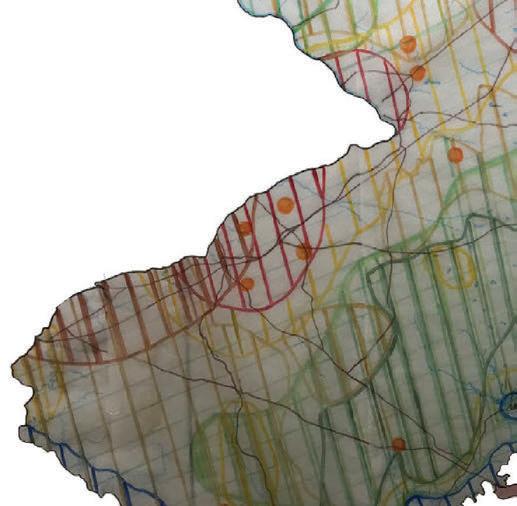
The map was divided in to typologies of public land, water, transportation, green spaces, highlands, pine barrens, valley/ridge, meadowlands, industrial, suburban, urban, agriculture, and shore. We felt these were the most apparent typologies that made up New Jersey and illustrated them on the map. From that, we clearly saw a separation from North and South Jersey. There were no major transportation lines that ran from east and west throughout the state. And all major modes of transportation either were along the shore or from New York to Philadelphia. Where that makes sense to accommodate where people are currently living, there’s a lot that New Jersey has to o er that should be accessible to everyone within the state.
David Rigueur, Alex Baldwin, Michael Scott Bey
TYPOLOGIES OF NEW JERSEY
This is a map of the state of New Jersey’s 15 various typologies. Included are agriculture, coast, commercial, atlands, forests, gathering spaces, highways, Industrial, meadowland, mountains, Pinelands, shores, suburban, urban, valleys and ridges. We came up with the numerous types by doing research on the di erent ways society uses the Garden State’s land and then colored in each respective area based on location of town. In looking at the map, we learned that overall, New Jersey has a wide range of equal uses among the typologies.
Chelsea Kang, Jolean London, Lydia Zoe
INVENTORY MAPS
Inventory Maps
Rational decision-making requires correct and accessible information. Decisions based on false or incomplete information are most likely wrong. Of course, it is an illusion to think that you may gather all relevant information and that you can ground proof everything. Therefore, it is of utmost importance source and to take into consideration possible limits of factual correctness and completeness.
People in New Jersey
Population Density
Land uses and locations help explain why certain municipalities have a higher population density than others. Urban areas have a higher population density due to their close proximity to New York City and Philadelphia, while rural areas have a lower population density due to agricultural land uses.
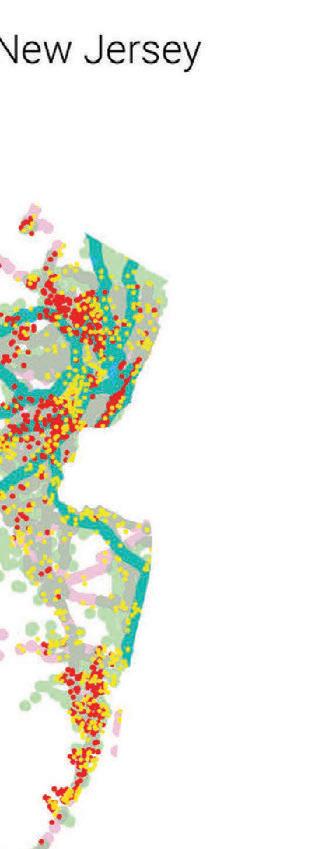
Race and Literacy Rates
New Jersey is one of the most diverse states in the country due to the American history of immigration. Demographic clusters are seen all throughout the state and relate to di erent levels of literacy. High-density, diverse urban areas are noted to have the lowest literacy rates among New Jersey occupants.
Race and Literacy Rates in New Jersey
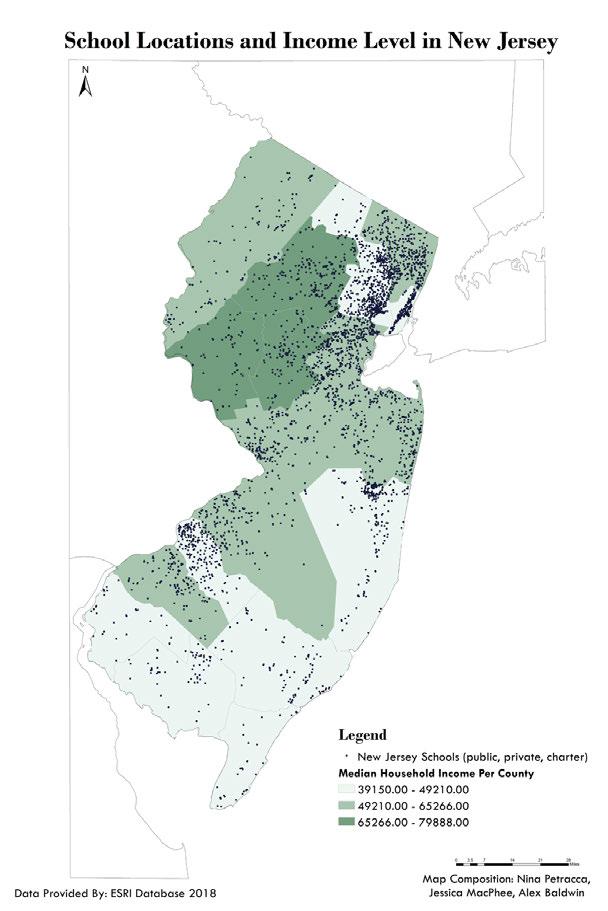
School Locations and Income Level
Mapping and identifying school locations and income levels will help gauge the age and income related demographics in New Jersey. This will aid in further analysis on education quality relative to income. Education accessibility and quality is an important factor for education on environmental issues and how to access community members, starting with children and their parents.
Public Solar Facilities
Energy use in the statve of New Jersey is on the rise as our populations continues to increase. With the increased energy use our state faces, new energy sources remain an important factor in city and statewide planning. Solar power is an important factor in the progression of our state in order to attain a completely renewable energy powered future.
Public Solar Facilities in New Jersey
Nina Petracca, Jessica MacPhee, Alex Baldwin
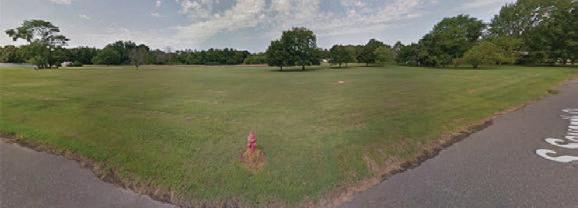
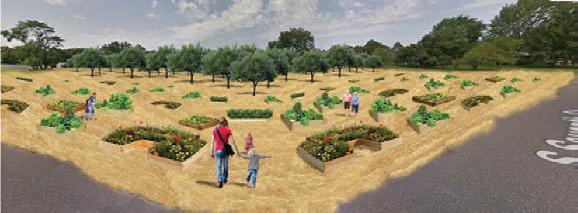
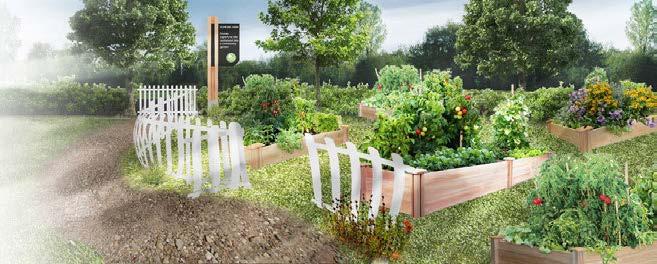
Agriculture
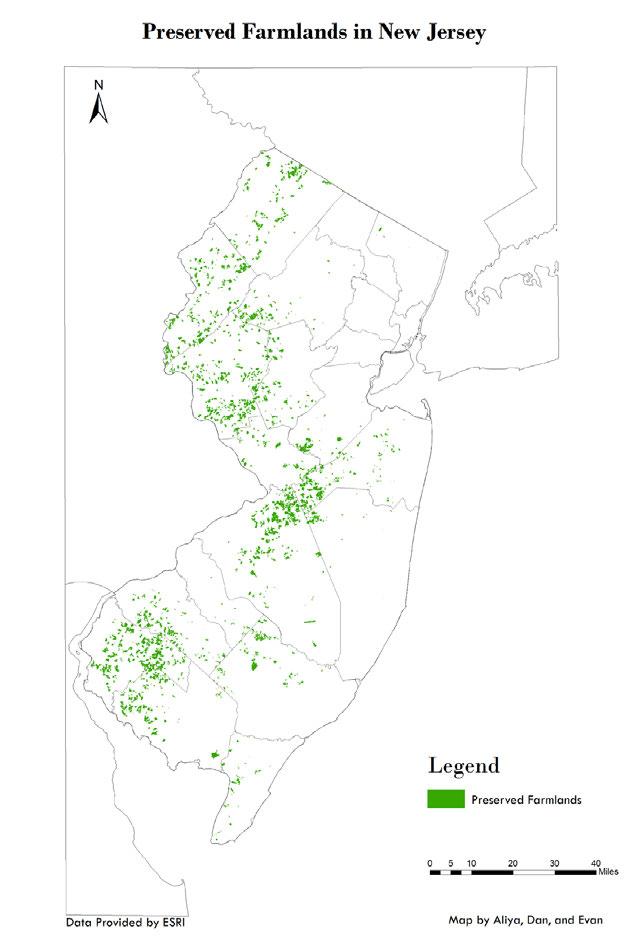
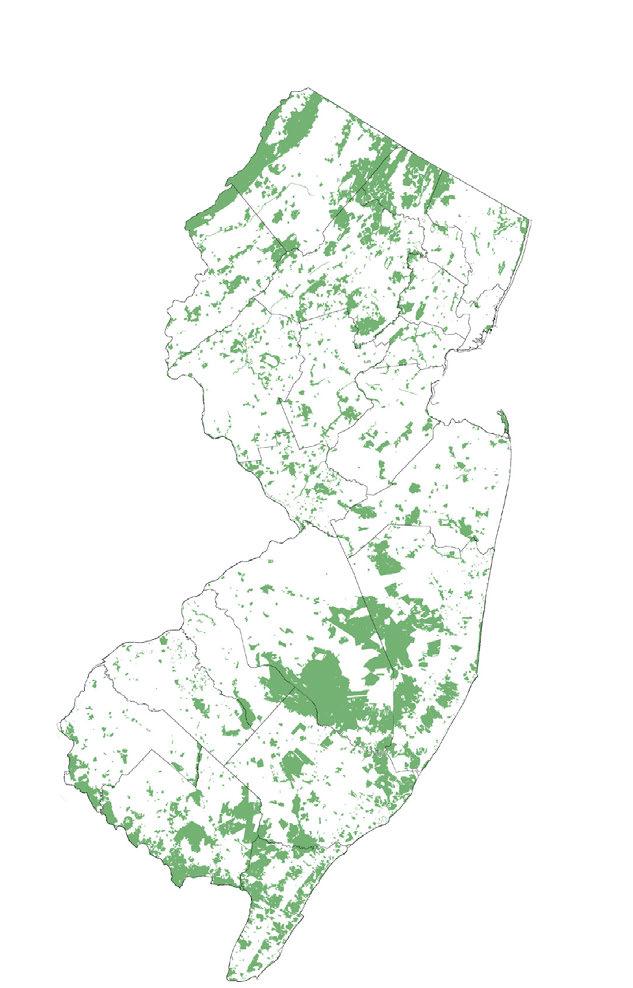
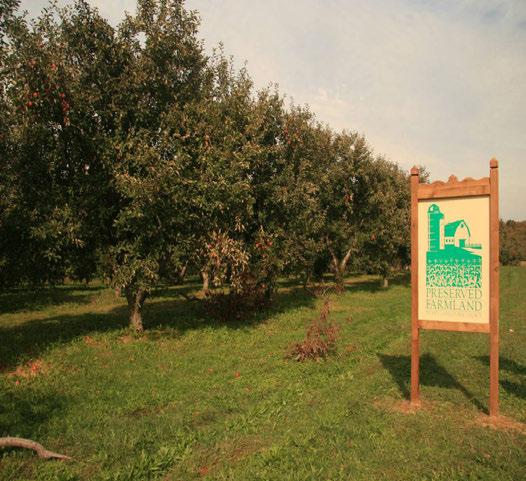
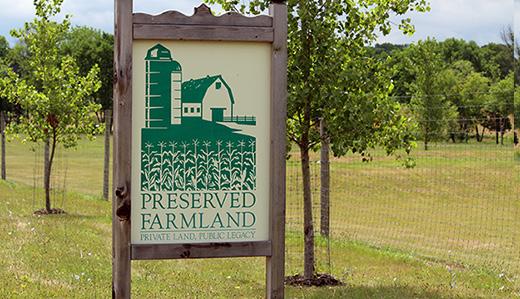
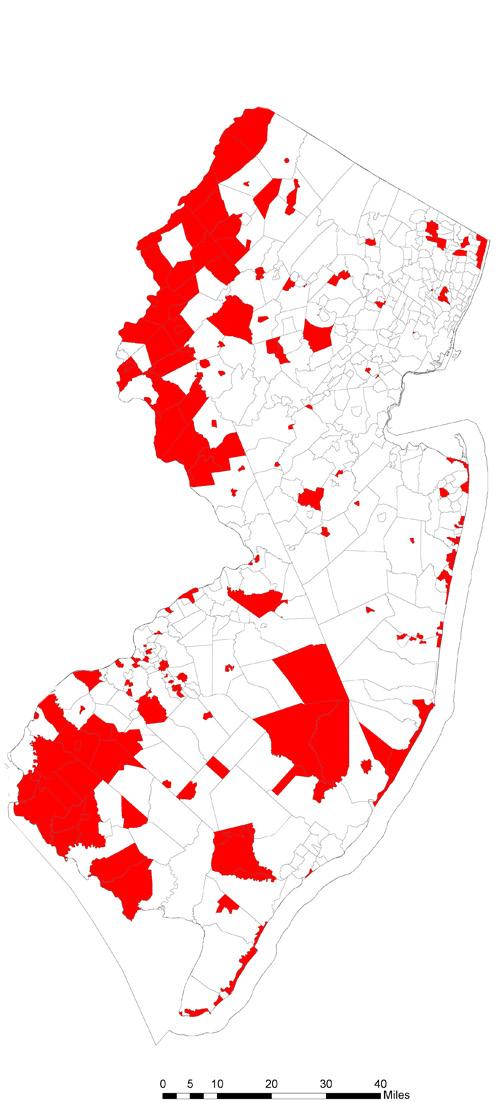
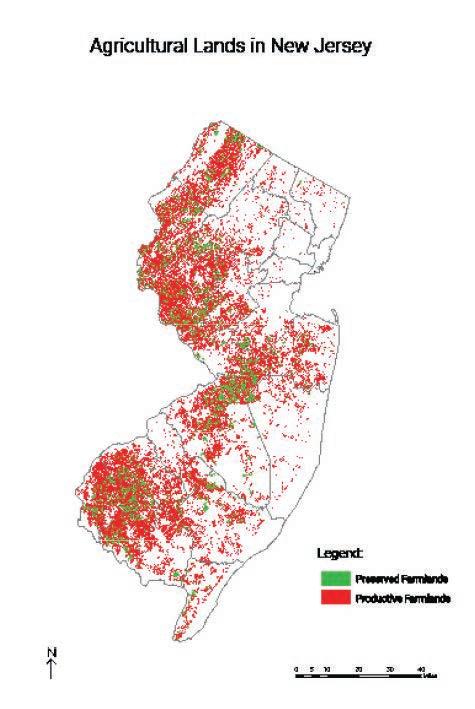
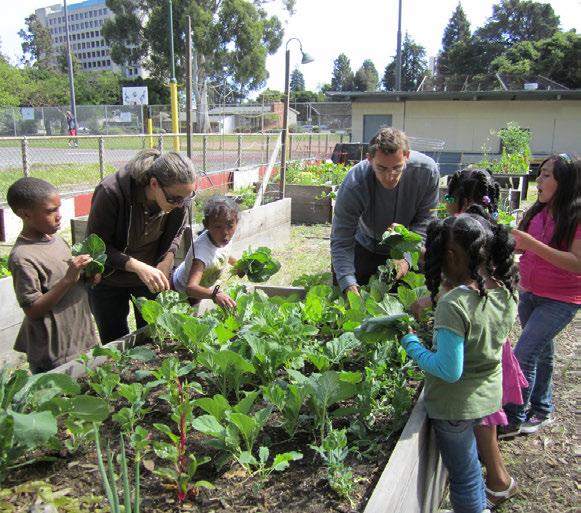
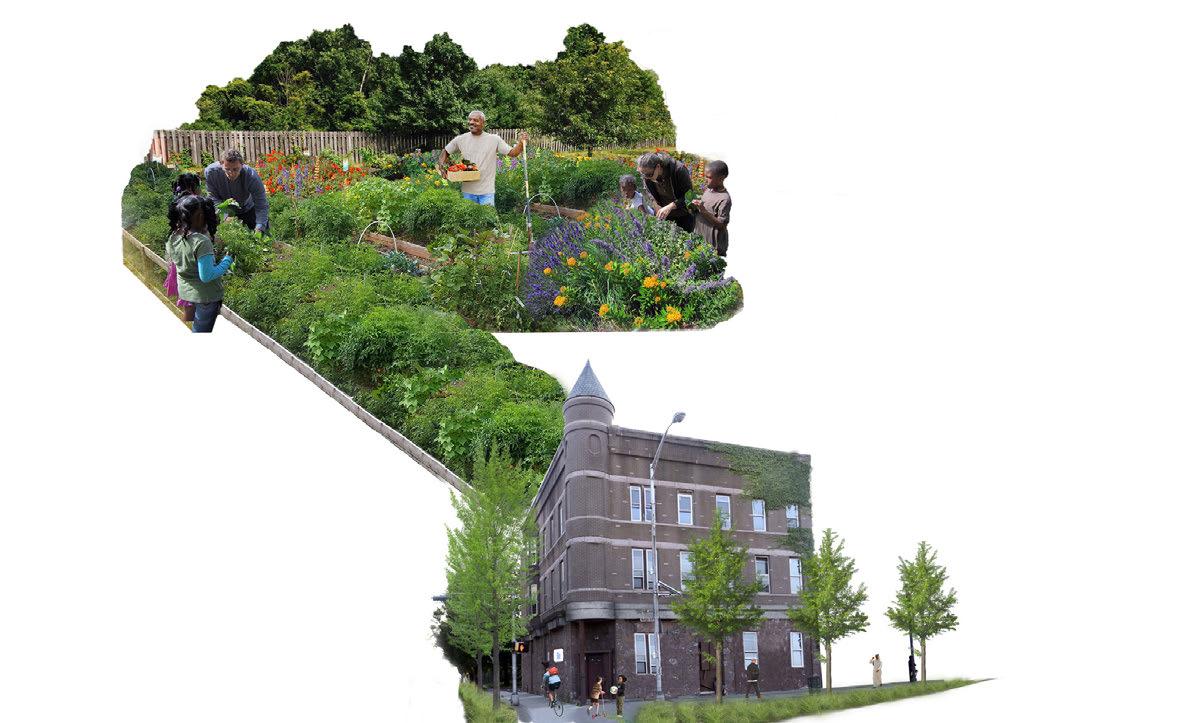
This map presents the areas in New Jersey visualizing areas of preserved farmlands. A “preserved farmland” is a farm that has been obtained through the Farmland Preservation Program, and is forever reserved for agricultural use. Regardless of who owns the preserved farms, owners are restricted from non-agricultural development. This restriction ensures that these farmlands will remain unthreatened from any harmful development that might lead to ground pollution that would alter production. The cost of obtaining and preserving land is based on the di erence between what a developer would pay for the land and what it is worth for the produce. Preserved farmlands are present in seventeen of New Jersey’s twenty one countries. The counties which do not have preserved farmland area include Union county, Essex county, Hudson county, and Passaic county, which is likely due to proximity to high density urban areas. Due to constant development and urban sprawl, naturally green spaces are under constant threat of being contaminated by urbanism through pollutants from manufacturing facilities, power generation, and vehicle exhaust, etcetera, or being absorbed and developed into urbanism altogether, which is why mapping these preserved lands is so essential.
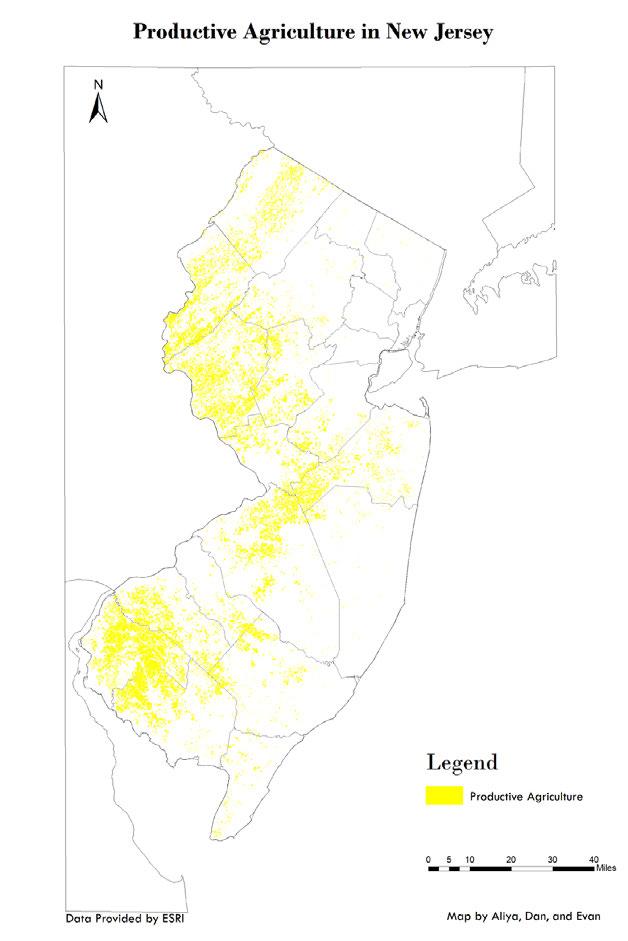
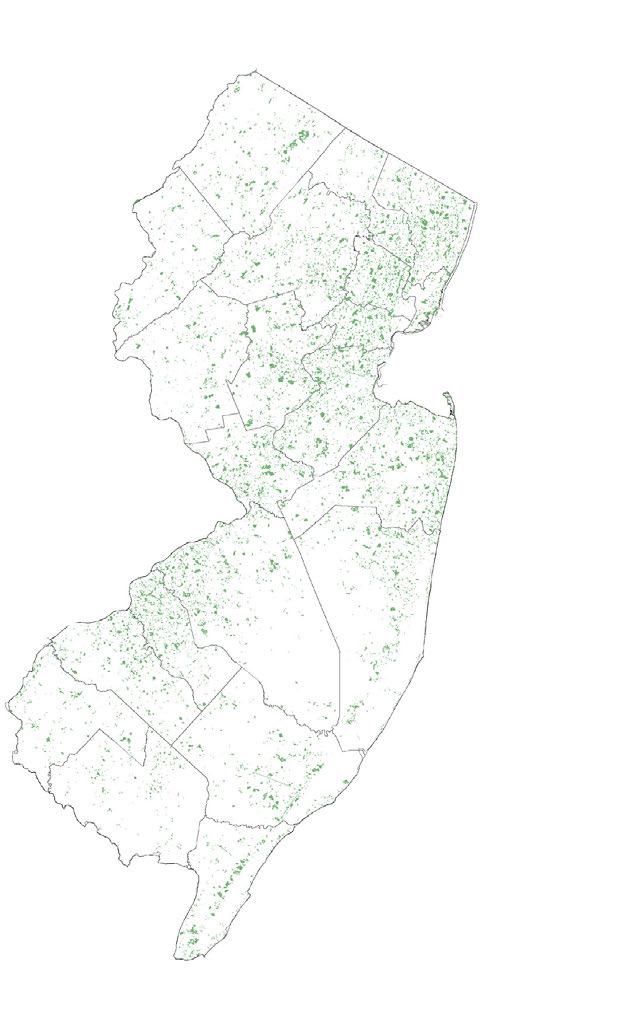
This map presents the areas of productive agricultural lands throughout the state of New Jersey. “Productive agriculture”, as it applies to these inventory maps, is de ned as areas of agricultural lands in New Jersey that currently create su cient pro t from their output of agricultural products. These areas are in proximity to su cient resources that promote growth and have an appropriate “Termed Total Factor Productivity” (TFP), a comparison of total of product inputs versus product outputs. When gathering the data for this inventory map, the fragmentation of productive agriculture along the western portion of New Jersey was immediately obvious, with particularly signi cant gaps in dense urban regions where the state connects to Philadelphia and New York. It is important to monitor the uctuation of the agricultural productivity and the status of these sites because current areas of productive agriculture are already disconnected and patchy throughout the state. Further damage of these agricultural areas would not only lead to more ecological fragmentation, it could also lead to the disruption of food distribution and access within New Jersey.
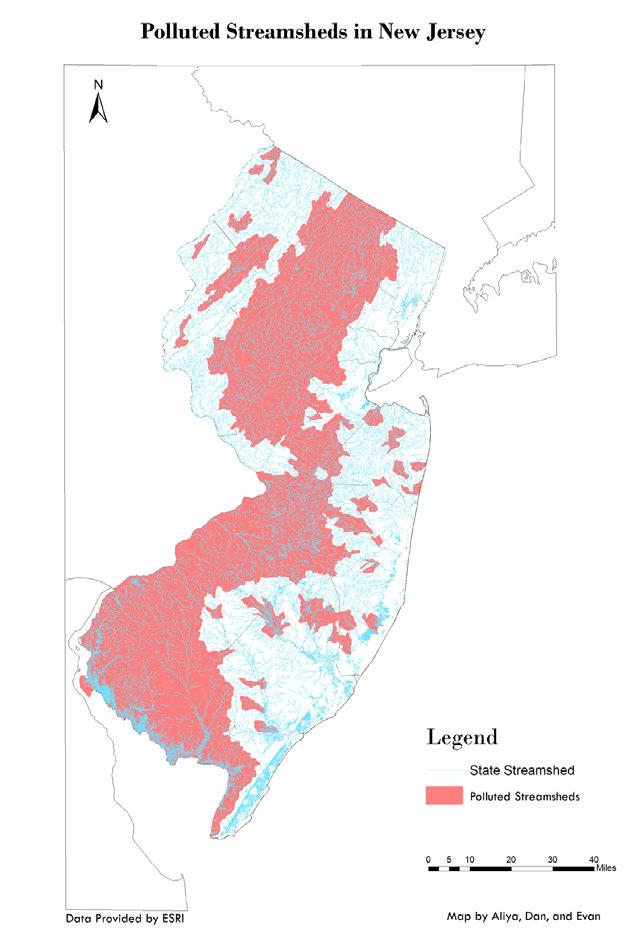
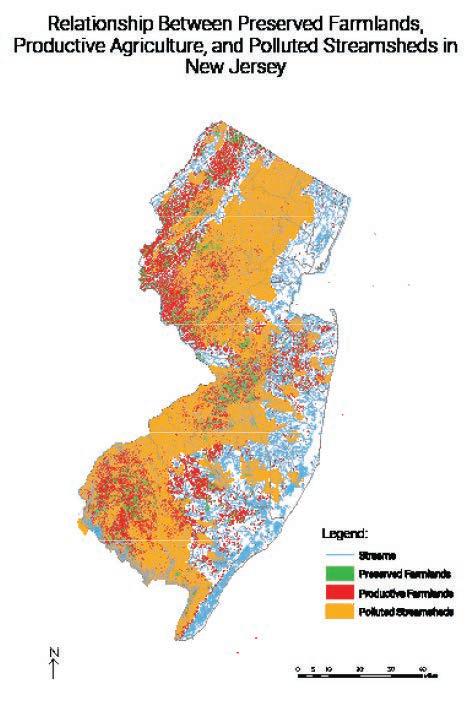
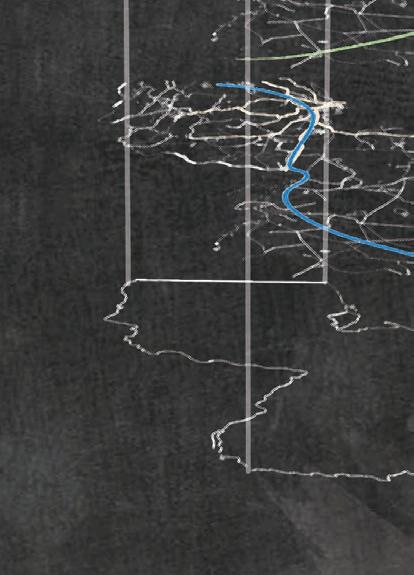
This map presents areas of polluted stream-sheds in the state of New Jersey. Pollution is inherently connected to farmlands, and whether it be from the contaminants released from livestock waste, or phosphorus pollution from fertilizers, both often lead to water contamination. To preface, streamsheds are sections of streams and adjacent land that directly in uence the hydrology of streams. The locations of streamsheds are typically where farmers access water for their farms and farm livestock, which can in turn lead to contaminants from these livestock and chemicals. Within polluted streams, nonpoint and point sources exist that are primary contributors towards contamination. This often includes storm-driven loads that proliferate fecal matter from geese and domesticated animals or livestock sources such as cows, pigs, and chickens to the receiving water. Nonpoint sources include constant input from poor sewage systems and failing septic systems. Overall, these many sources can add dangerous pollutants like fecal coliform and phosphorus to water sources across the state and country. Noting and mapping this information is very important for the state of New Jersey because streamsheds are an essential part of not only the agricultural scape, but of the health of New Jersey as a whole.
Daniel Ilkow, Aliya Williams, Evan Eden
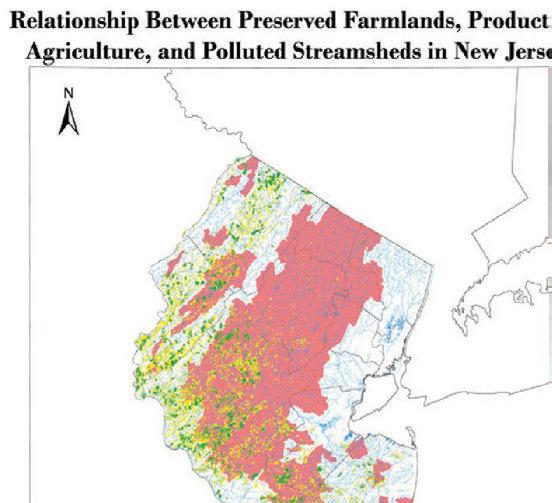
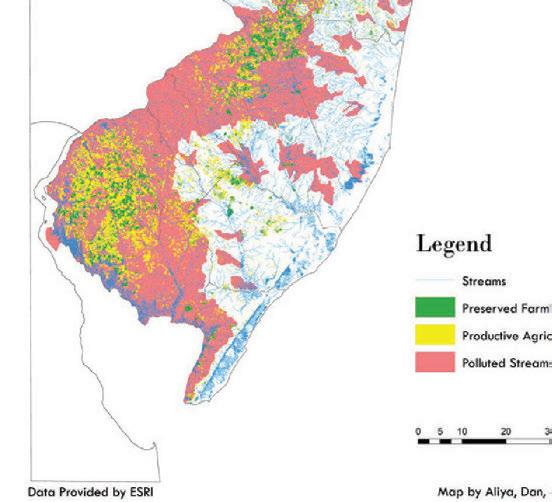
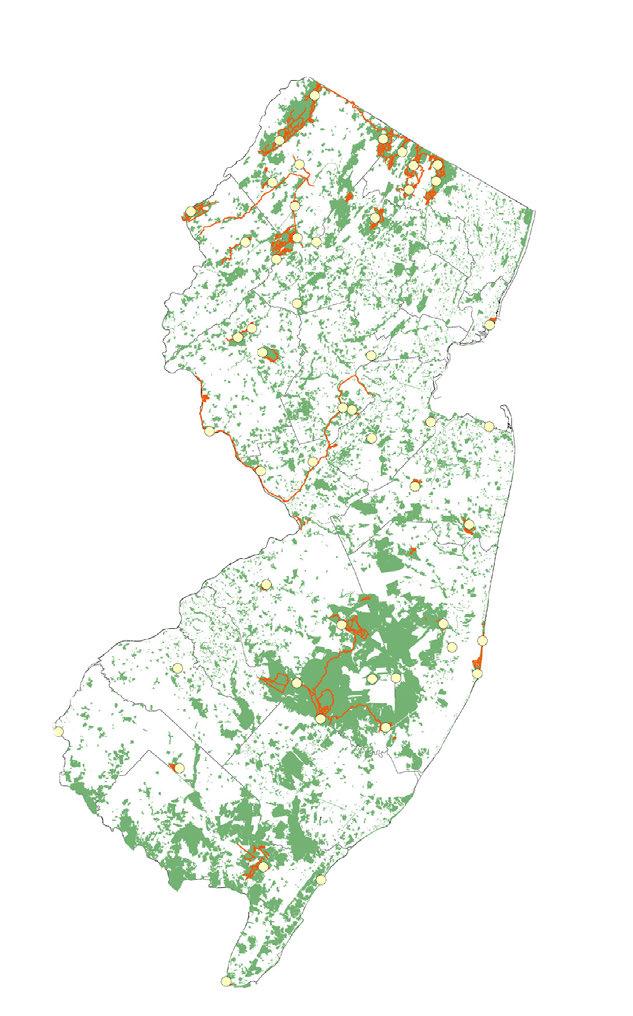
This map is focused on the spatial relationship between agriculture production and polluted streamsheds together on one visual plane. As previouslt mentioned, stream-sheds are areas in which farmers get their water for their farms because they are regions of water that contribute to streams and rivers. Many agricultural lands contained polluted water systems nearby or within the farmland itself, and several reasons that farms could produce pollution included: overuse of pesticides, herbicides, fertilizers, and other pollutants from animals through fecal matter. Though there could be a multitude of reasons for pollution, these are the most commonly found causes. With these pollutants in mind, a conclusion can be reached that these waterways most likely had pollution due to one of these reasons mentioned.it’s also important to consider the brown elds within which existed pollution caused by infrastructure and construction. While this is less likely evident on farmlands themselves, it’s still possible in regions where farmlands are not in areas of polluted stream-sheds.
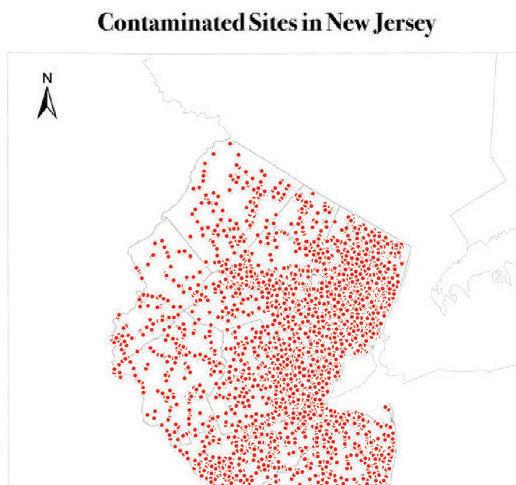
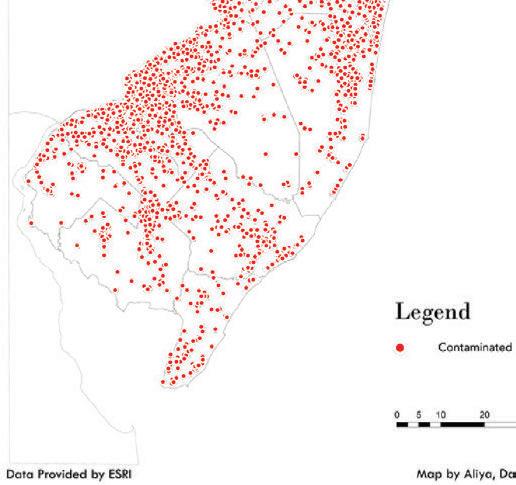
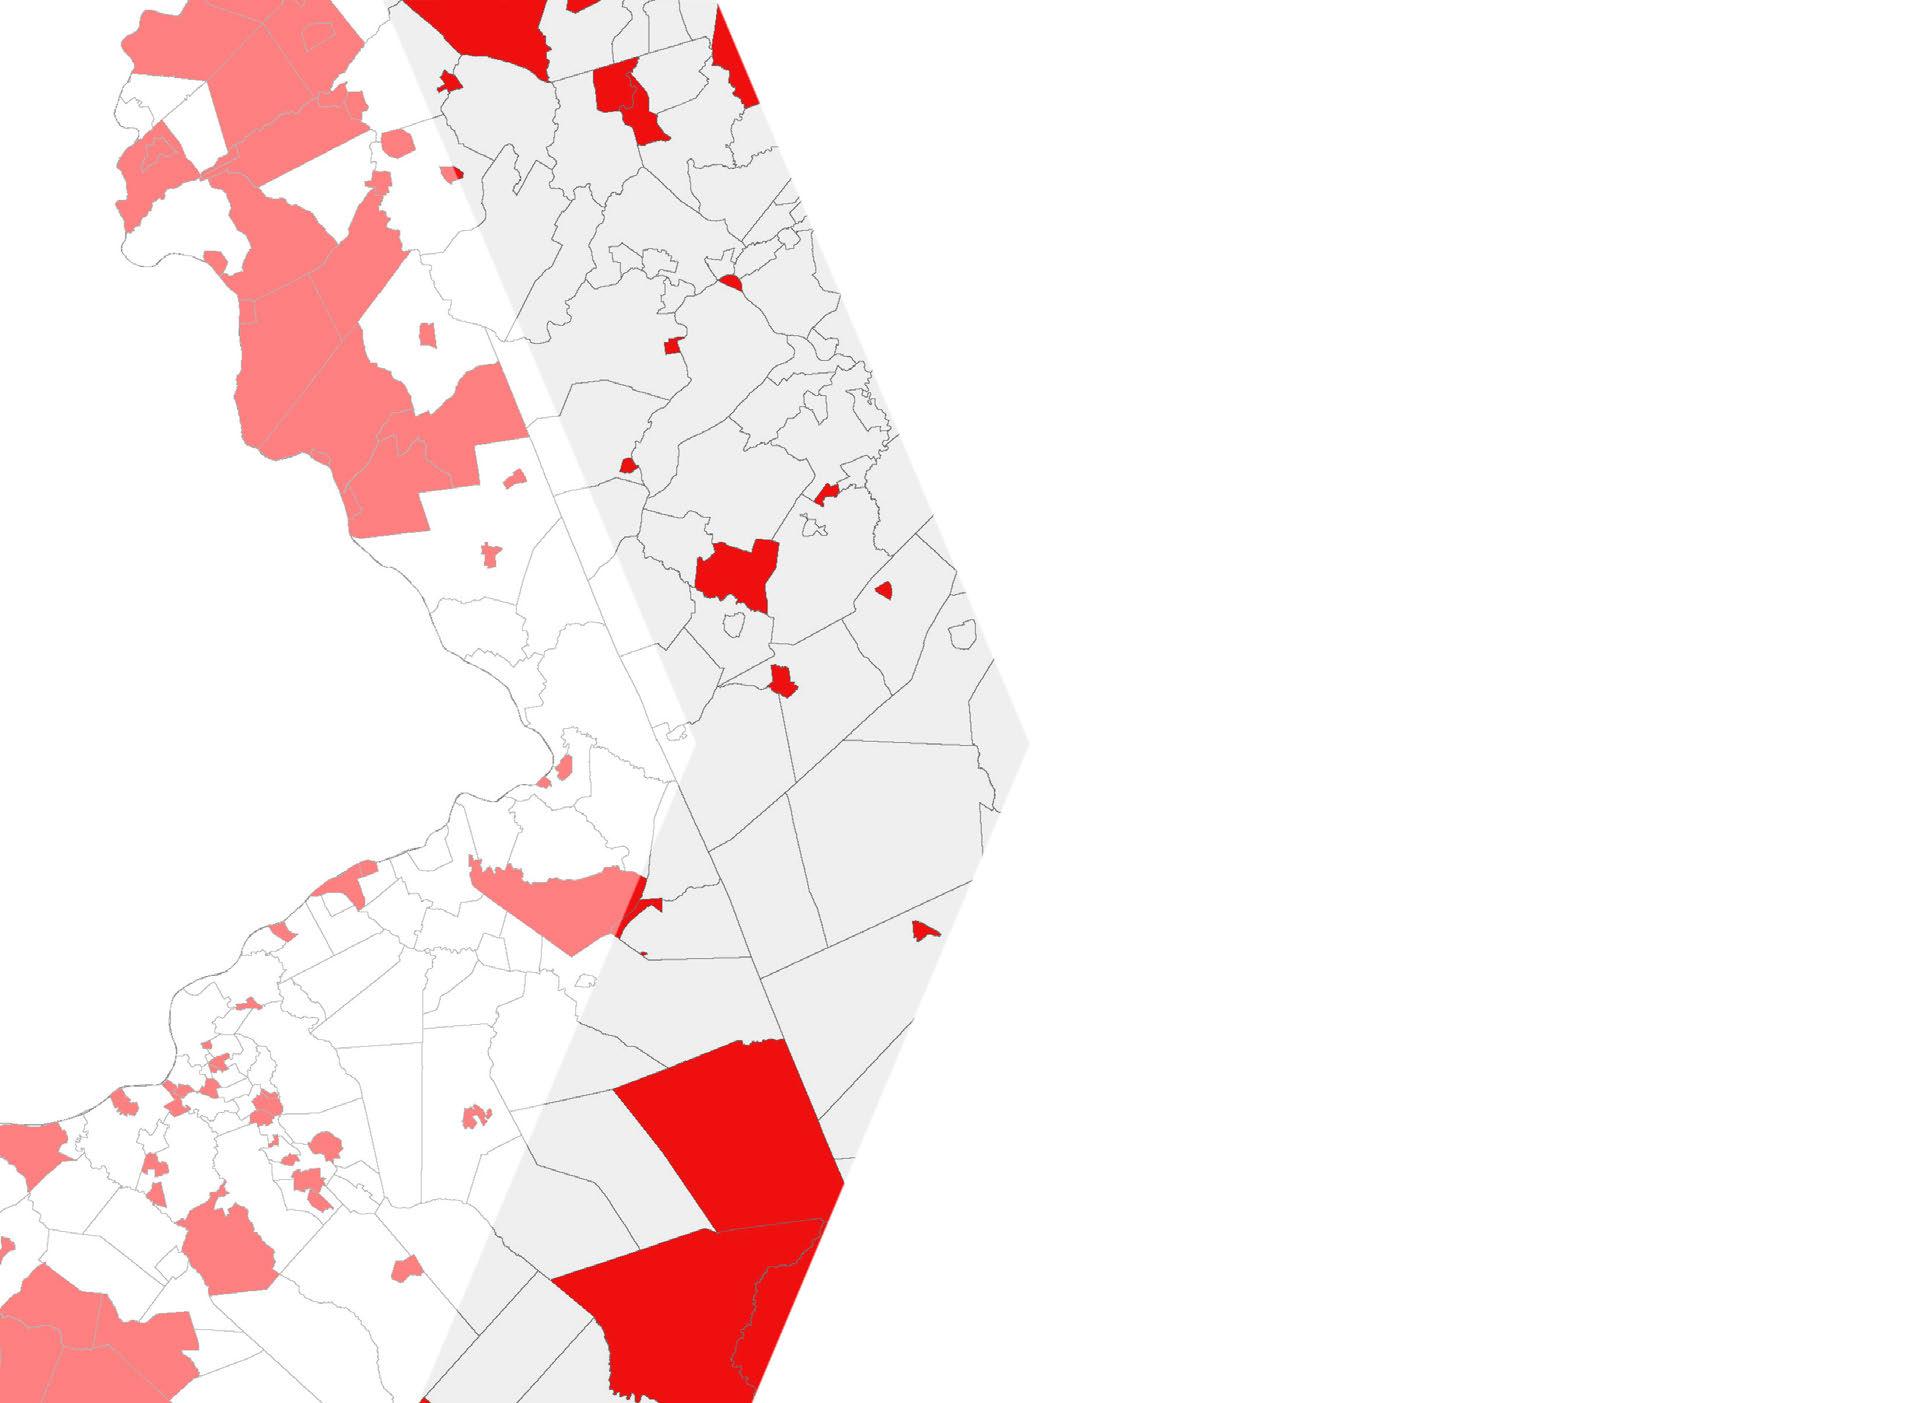
This map represents contaminated sites within the state of New Jersey. The EDP de nes these areas as sites and properties within the state where contamination of soil or groundwater has been con rmed at levels equal to or greater than applicable standards. These selected areas are either currently contaminated areas, areas where remediation is under way, or areas where it is required but not yet initiated or completed. It was necessary to address these areas because they a ect how productively crops grow and in extreme cases if they grow at all. Agricultural production in these areas could jeopardize the safety of produce and in turn the health of the New Jersey’s inhabitants.
Daniel Ilkow, Aliya Williams, Evan Eden
25 Contamination
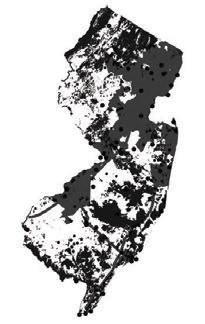
Brownfield Sites
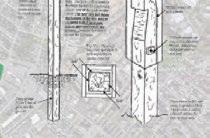
Brown eld sites are former or current industrial sites that pose a problem for future development because of the contamination. This map shows the locations of underutilized or vacant browneld sites within New Jersey that are intended for redevelopment. In this map, the “contamination hot-pockets” or concentrated areas of brown elds are where the popular cities are, like New York City and Philadelphia. These places are very industrial based and it e ects the neighboring cities in New Jersey, especially those in Camden county and Bergen county. Even when looking at this dataset, a pattern can be seen where the browneld sites are. In some way, all of these industrial sites are connected. The brown eld sites create an edge around New Jersey, the stretches along the shore, and is bridged between Cumberland and Gloucester county, therefore continuing the edge along Camden County to Mercer County, and stretches to connect all the way to Bergen county. These brown elds are mostly located where there are densely populated communities, a ecting more people. This data of located brown elds can be used to promote remediation and highlight its potential of redevelopment. This relationship that is seen can furthermore guide the focus of design in regard to its relationship with urban areas and site remediation.
Map
Tiffany Nguyen, Smerliene Rodriguez, Eric Graber
Data Provided by: NJOGIS
Map Composition: Tiffany Nguyen, Smerliene Rodriguez, Eric Graber
Data Provided by: NJOGIS
This map is of groundwater contamination areas located around New Jersey. Groundwater is one of the most important sources of water for irrigation and wells. This map identi es sites where groundwater is contaminated and that these speci c contaminants have exceeded the New Jersey Ground Water Quality Standards (NJGWS) and are established as a Classi cation Exception Area (CEA) and Well Restriction Areas (WRAs). Knowing where there is groundwater contamination can help identify where it is best suited to place a well to prevent a ecting health of those who can access the water, and further minimize unintended migration of contaminants. Much of the contamination is centralized to the urban areas that are closer to New York City and Philadelphia, however there are three major areas that are signi cantly large compared to the rest. The largest is located right above the Pinelands between Burlington and Ocean county, and the other two are located in Morris county by the Wildlife Management Area and Warren county by agricultural land. With this data, it is apparent that there is risk to health if water is accessed in these areas. CEA provides notice that the aquifers are not or will not meet the constituent standards, and that the use of the aquifer is suspended.
Superfund Sites on National Priority List
Provided by: ArcGIS
New Jersey has the highest number of superfund sites in the United States. The Superfund-- or Comprehensive Environmental Response, Compensation, and Liability Act of 1980 (CERCLA) is a United States federal law designed to clean up sites contaminated with hazardous substances and pollutants. Included in the map is a list of these sites along with the rating in which it received, grouped into 4 categories ranging from highest to lowest importance. These listed sites are from the National Priorities List (NPL) with status information for the Environmental Protection Agency (EPA) under the Superfund web page. The Hazard Ranking System (HRS) carried by EPA is used to rate and evaluate the uncontrolled waste sites, to determine the potential need and determine what actions are required for remediation. Using the hazardous rating score, these sites represent superfund sites above 25 rating, and are on the national priority list. The superfund site assessments evaluate the current site conditions to gure out the appropriate response to address the issue of hazardous substances being released into the environment. Following the HRS criteria, the sites with HRS scores of 28.5 or greater are eligible to be placed on the National Priority List. The sites that are above 28.5 ranking can only be funded by the Superfund Trust Fund- nance.
Ti any Nguyen, Smerliene Rodriguez
Habitat
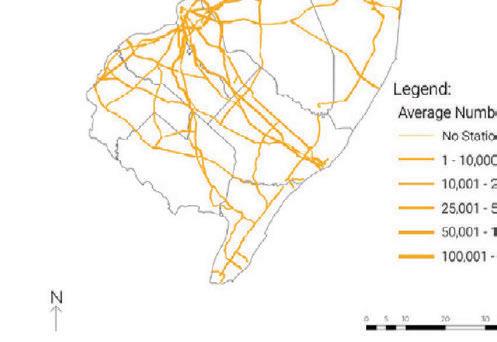
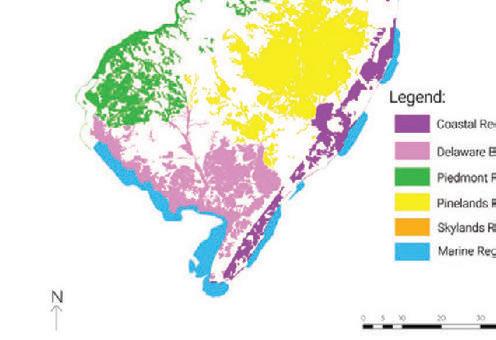
Conservation Focal Areas within Landscape Regions in New Jersey
This map shows the six landscape regions of New Jersey: coastal, pinelands, marine, delaware bay, piedmont, and skyland regions. Piedmont is the region where there is a gentle slope that starts at the bottom of the mountains and ends at at land. You can nd this region bordering the skyland region. The skylands are uplifted land, rolling hills, and mountains, located in the northwest part of New Jersey. The pinelands, or pine barrens is the region that is heavily forested with pine trees. It is important to protect because it is habitat for large mammals like deer, beavers, otters, bats, squirrels, weasel, and fox. The delaware bay is the region where freshwater meets with saltwater from the atlantic ocean. Almost all of the rivers, streams, and lakes in this region are polluted from previous industrial toxins. The coastal region of New Jersey is where the land meets with the Atlantic Ocean. The marine region is the the body of water surrounding the state beyond the coast and into the ocean. Conservation focal areas are habitat areas that are the best for supporting New Jersey’s wildlife within each region. Conservation focal areas increase the chance for biodiversity in the landscape by allowing for connections to be formed between habitats. Having these areas identi ed can help restoration e orts target the most bene cial sites and o er wildlife protection from future development.
Data Provided by: NJDEP
Map Composition: Giovanni Caputo, Tom Kastner, Dakota Wojcik
Map Composition: Giovanni Caputo, Thomas Kastner, Dakota Wojcik
Data Provided by: NJDEP
New Jersey has at least 84 known threatened or endangered species. These include piping plover, shortnose sturgeon, checkered white butter y, and bald eagle. In some cases, New Jersey’s environment is the prime habitat for these species. Endangered species habitats are separated into di erent ranks. Habitats designated as “Rank 2” are considered special concern habitats. A habitat is considered special concern when the species are in decline, or vulnerable to becoming threatened in some way. As the ranking system goes up, “Rank 3,4, and 5” habitats are considered most critical. These higher ranking habitats are home to state threatened, state endangered, federally threatened, and federally endangered species. These areas are very important to protect for the future of the environment because once these species are gone they can not be brought back. On the map, “Rank 2” habitats are designated as Threatened to ensure they are not looked over because they are very important to protect. The “Rank 3,4,and 5” habitats are designated as endangered because they are already home to species that are in serious decline and need all the protection they can get.
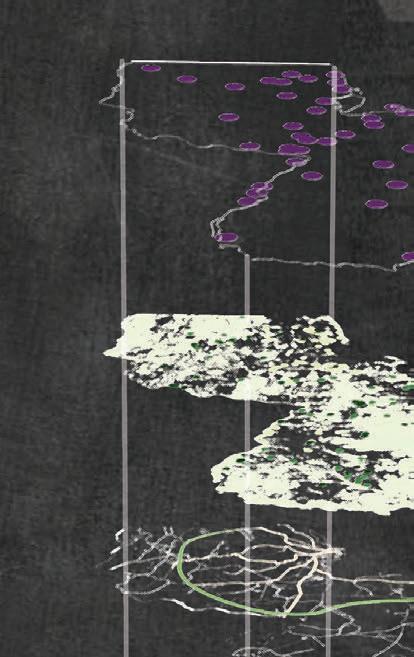
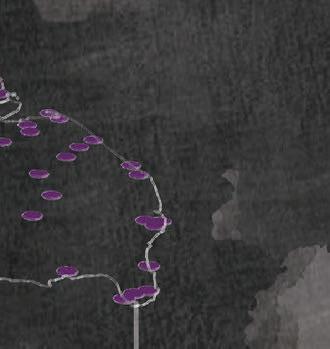
Vernal Pool Locations in New Jersey
Vernal pools and potential pool locations, also called vernal ponds or ephemeral pools, are temporary pools of water that provide habitat for distinctive plants and animals. Vernal pools and potential pool locations are areas that are dry for at least part of the year and lled with winter rain and snow melt. Outside these references, potential vernal pools are areas where people feel that it would be a bene cial site for these pools to be established. The criteria for vernal pools are that they provide essential breeding habitat for certain amphibians and that they are partially dry during the year. Organisms that are associated with vernal pools fall into two categories. These two categories are Obligate and Facultative species. Obligate or direct indicator species are completely dependent on vernal pools for parts of their life cycles. Another type of conservation habitat are Natural Heritage Habitats or priority sites. These Natural Heritage areas are important for our map because it shows the correlation between vernal pool conservations and other conservation areas. Which evidently shows the conservation e orts that New Jersey is trying to impose.
Map Composition: Giovanni Caputo, Tom Kastner, Dakota Wojcik
Giovanni Caputo, Thomas Kastner, Dakota Wojcik
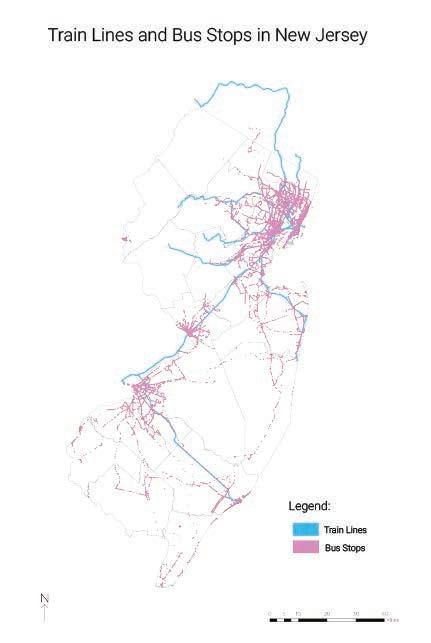
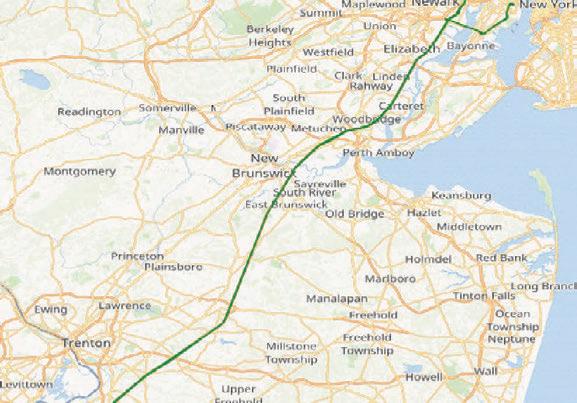
The map aims to show the NJ Transit railway systems in comparison to train lines that border the state. With 12 lines, 3 light rails, and 162 stations, NJ transit lines are set up to direct commuter frequency out of the state. Every line, from the Montclair-Boonton line to the Newark Penn line, lead into New York Penn station. Meanwhile, speci c routes like the Atlantic City line lead into Philadelphia while the Pascack Valley line end in Spring Valley, New York. Despite the fact these key stations are all outbound destinations, the New Jersey Transit lines are maintained by the state.
Due to the heavy concentration on outside centers there is a lack of inner-state connectivity. There are no direct lines that connect South Jersey to North nor are there lines that connect the outer edges of New Jersey to the inner core. This disparity of inner-state connectivity is exaggerated when compared to the rail and underground rail systems of New York and Philadelphia. Therefore, adding more lines, speci cally connecting parts of New Jersey together, is important in order to encourage other uses of the rail line other than outbound commuting.
New Jersey Transit Rail Lines New Jersey Transit Rail Lines
In relation to Pennsylvania and New York Rails
Adriana
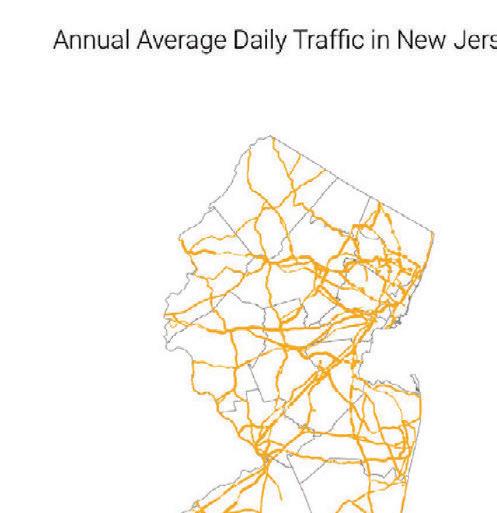
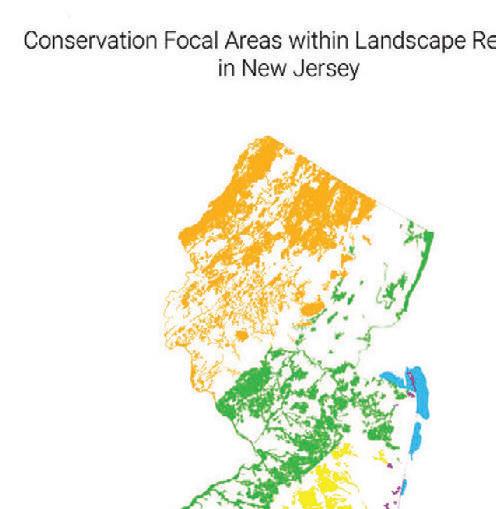
This speci c map portrays all the major highways and how they connect to surrounding states as well as their annual average daily tra c. The most congested part of the map are Route 78, the Garden State Parkway, and the New Jersey Turnpike. The highways have to be highlighted in a map because that is a huge part of New Jersey transportation. Adding congestion on top of an already huge component helps to diagnose where the most tra c is. With that information, one could then nd other alternative routes that can help decrease the overcrowded areas and create a better ow or introduce another commuting option to lessen the tra c load.
Creating a better ow for the highways is a great idea for improving a system that has not been updated since 2001. Because the population has skyrocketed since then, the transportation system can no longer accommodate drivers and is costly. An option is to nd alternate routes or even creating a separate parkway for trucks and buses to help move tra c along. Consequently these alternate routes place a heavy burden on local tra c and increases the number of impervious surfaces. Encouraging other forms of transportation can be a replacement to these options that may damage the topological and environmental value of New Jersey.
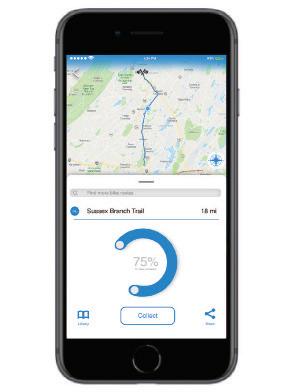
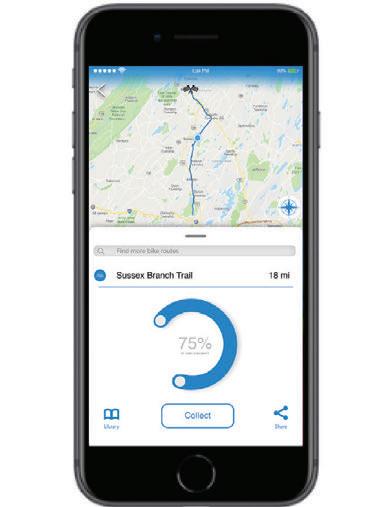
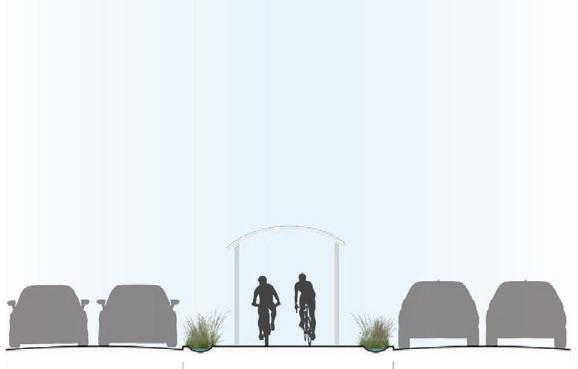
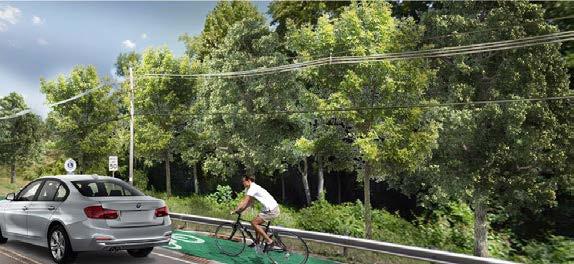
The bikes and trail maps display all of the bike trails, both for recreation and commuting purposes. The majority of the bike trails are in the very northern part of New Jersey by the mountainous areas and green spaces. There is one bike route that connects North Jersey to South Jersey. Other than that, there are no other bike trails in the southern part. Spreading awareness about bike trails and creating more bike trails can solve this issue of connection.
By creating more bike lanes/trails, the connection between north and south Jersey will be stronger and will allow for more diversity in the state. It will give people a chance to connect with people that have similar interests from outside their town. By spreading awareness of biking as a commuting opportunity, it will provide people with the opportunity to try something new. Introducing long distance trails for commuting back and forth could also help lessen the tra c occurring on the roads. Pollution will also decrease because of bikes can replace the cars. Overall, bike lanes/trails was an important factor to portray because it is the most underrated method of transportation that can help New Jersey decrease pollution and create diversity.
Adrianna Hall, Zoe Orlino, and Jonathan Connor
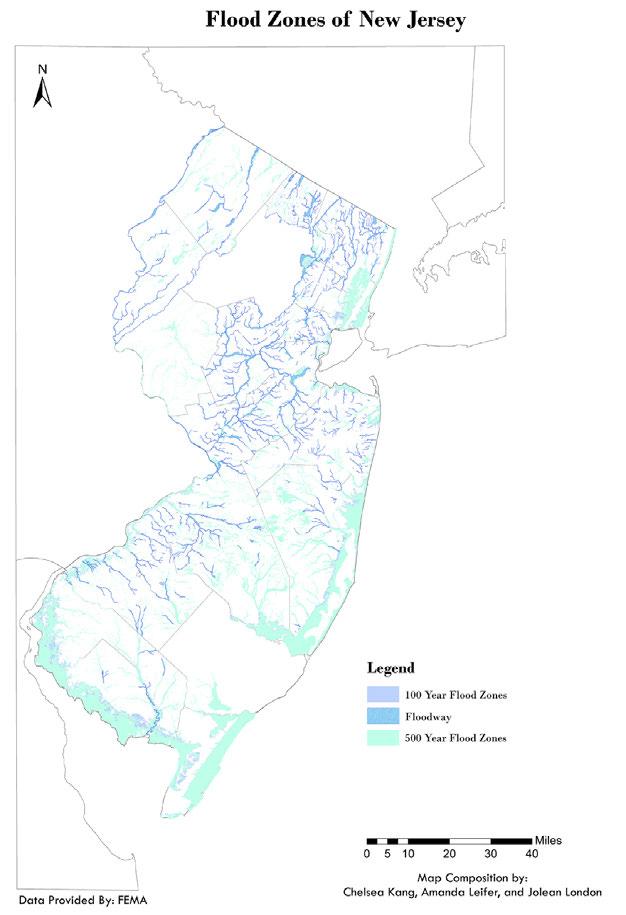
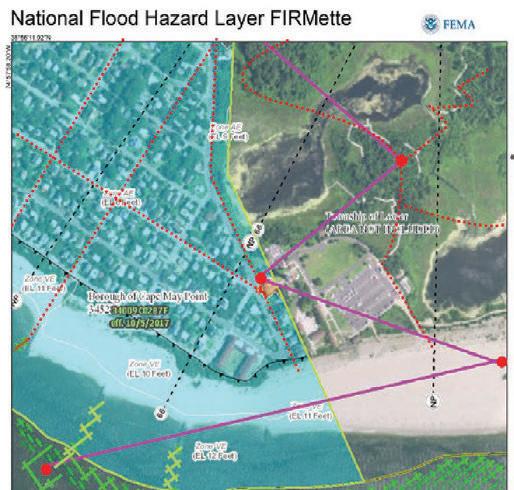
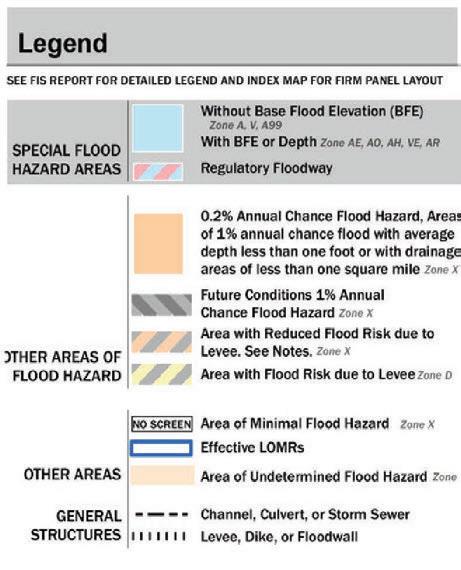
This map is divided into 500 year ood zones, 100 year ood zones, and oodway zones. According to FEMA, a oodway zone is a channel of a body of water that discharges oods to prevent an increase in water surface elevation. 100 year ood zones have a 1% chance of occurring throughout the year while 500 year ood zones have a 0.2% chance, according to USGS. Through this map, it shows that most ooding happens around the inner areas of New Jersey, alongside Pennsylvania. Also, within areas such as Bergen County and the Middlesex, Somerset and Mercer county, current oodways take up a large portion of those counties. This is an unexpected expansion as one would assume that high risk ooding would occur more along the coastlines. However, through the predicted 100 and 500 year ood zones, it shows that ood zones will expand to coastline areas that are surrounded by the ocean. Bergen county will also continue to expand as a ood zone even though it is not surrounded by the ocean. With this, it shows that the dangers of ood zones will continue to expand into New Jersey, causing a greater threat for seaside residents of New Jersey.
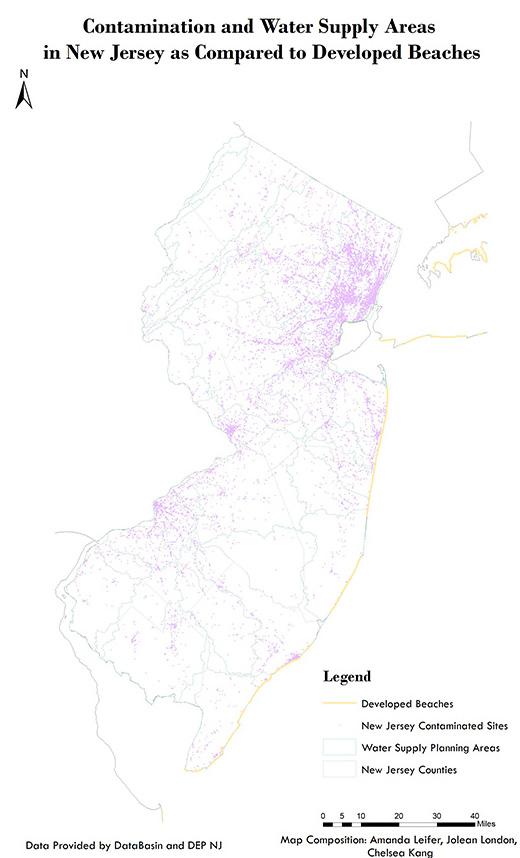
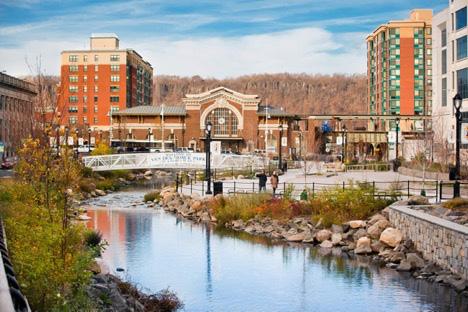
Included on this map are the water supply area zones, which are 23 areas used in the NJ Statewide Water Supply Plan by the NJDEP’s O ce of Natural Resource Restoration to spatially reference ground water contaminant data. This map also shows to New Jersey’s contamination sites and their proximity to many of the developed beaches in New Jersey. Beaches naturally erode, and when they do, they are replenished using shore remediation techniques. These replenished beaches are considered to be developed beaches. The reason New Jersey has chosen to replenish its shoreline is because of the beaches attraction to tourists who bring revenue for the state. Tourism at the shore provided the state economy with 44.1 billion dollars in 2016. Atlantic City, Cape May, Wildwood, Ocean City, and Sandy Hook are the most popular beaches for tourists. Tourism certainly provides New Jersey with monetary bene ts, but there are also many issues with the increased tourism in the state. Although the beaches in New Jersey provide a steady source of income from tourism, they are many problems related to water contamination that e ect them.
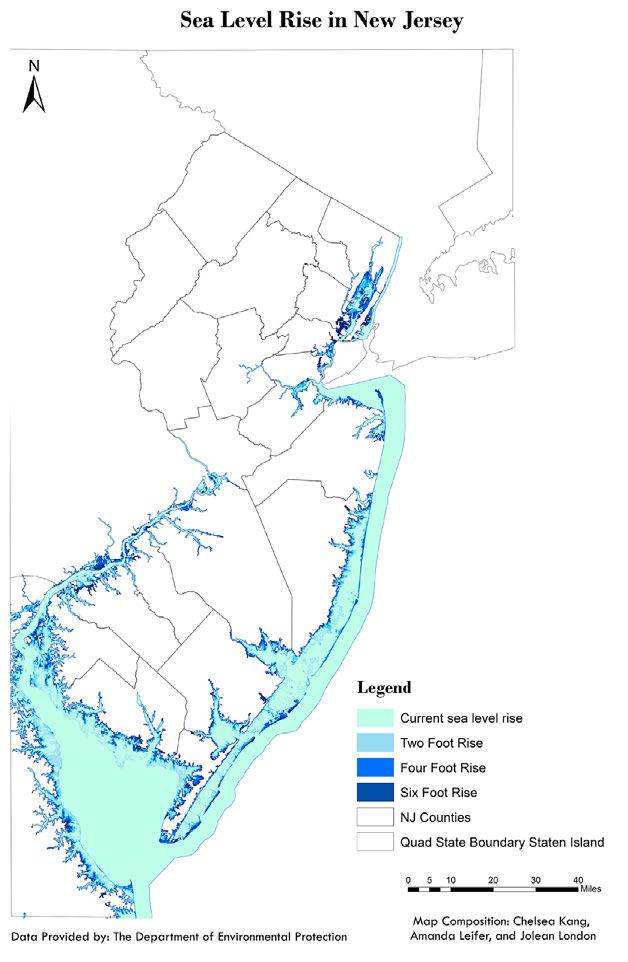
This map is based on the changing elevation levels of the sea throughout the numerous counties and municipalities of the state of New Jersey. Sea level is the height of seawater relative to a xed point on land that is used as a reference of measurement to another landform. Sea level change occurs due to alterations in the volume of water present within the ocean basins compared to the storage of water on land, earthquakes/uplift, climate factors/plate tectonics, water evaporation, continental aquifer water storage in the subsurface, thermosteric expansion, and much more. There are many negative e ects which majorly destruct coastal habitats. For example, erosion can occur, ooding can take place, aquifer and agricultural soil can become contaminated, and plants/animals can lose their habitat. If water reaches a point where it is too high, it will nd its way to the land it neighbors. Which means, subsidence will occur and people settlement in that speci c area will be nonexistent. If water begins to invade onto land and ood the surrounding space, this also means that the value of the property will immensely decrease, and towns will permanently disappear.
Land Use
Legend
Developed, Open Space
Developed, Low Intensity
Developed, Medium Intensity
Developed High Intensity
Barren Land (Rock/Sand/Clay)
Deciduous Forest
Evergreen Forest
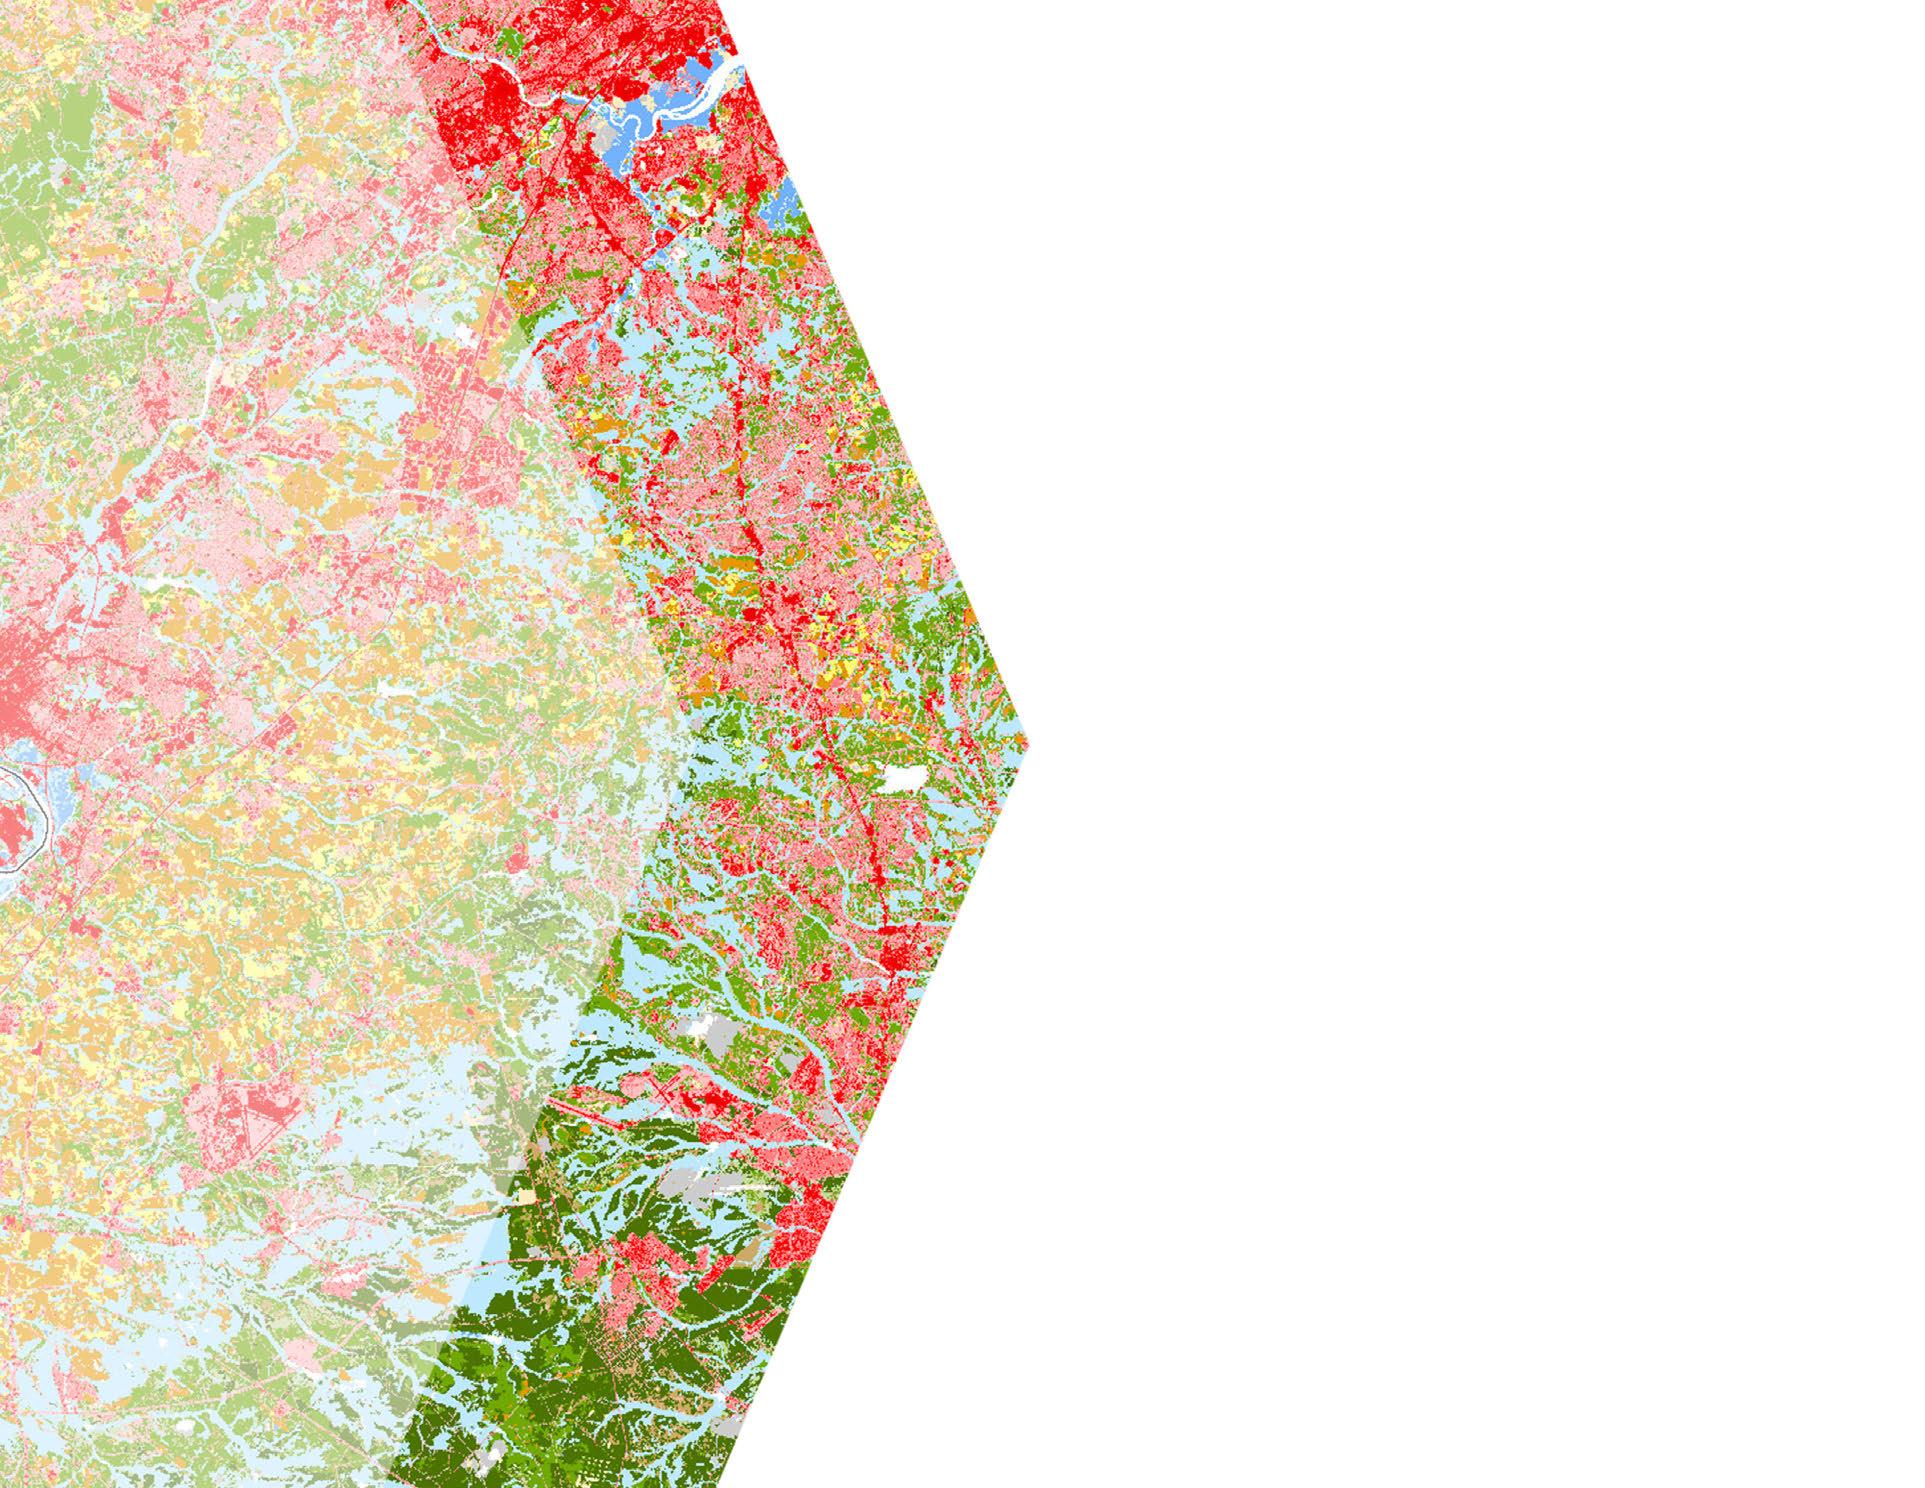
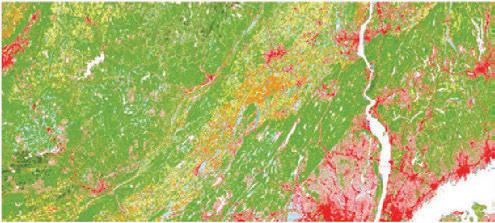
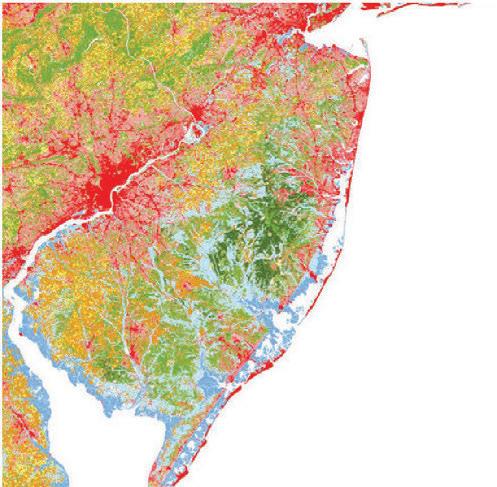
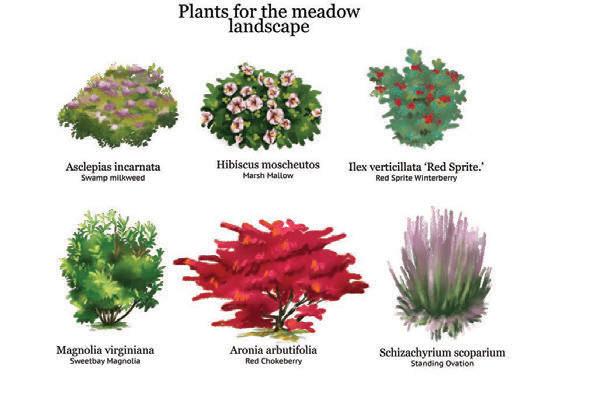
The land use map displays the concentration and placement of di erent land uses in New Jersey. This map represents land use data available for New Jersey from 2011 that is signi cant in displaying the e ects of zoning laws, and policies that have led to the variety and spread of land uses in New Jersey. Understanding the meaning of land cover in New Jersey involves deciphering the typologies described in the data. Developed Space is separated into four categories: open space, low intensity, medium intensity, and high intensity. Barren land is an area where vegetation accounts for less than 15% of surface area. Forest area is an area dominated by trees that are greater than 5 meters tall, and separated into three categories: deciduous forests, evergreen forests, and mixed forests. Shrubland is consisting shrubs that are less than 5 meters tall. Herbaceous area is consisting herbaceous plants. Pasture/Hay area is area with grasses or legumes. Cultivated crop area is farmland area. The wetlands areas are separated into two categories: woody wetlands with forest or shrubland, and emergent herbaceous wetlands with perennial herbaceous vegetation.
Zhaoxuan Wang, Yat Chan, Jessica Thorning
Yat Chan, Jessica Thorning
Land Use of New Jersey (2011)
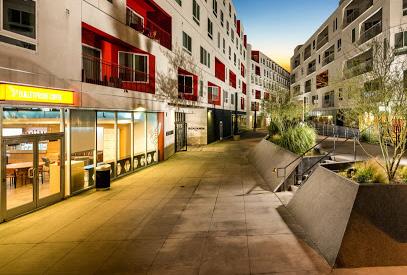
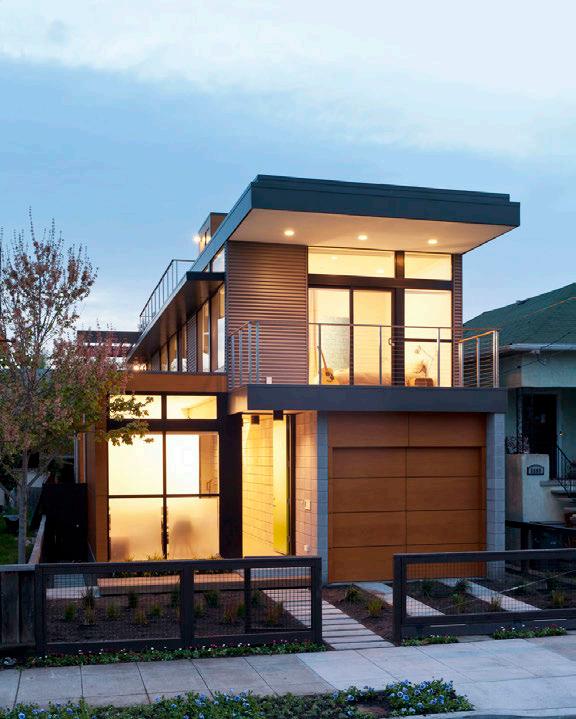
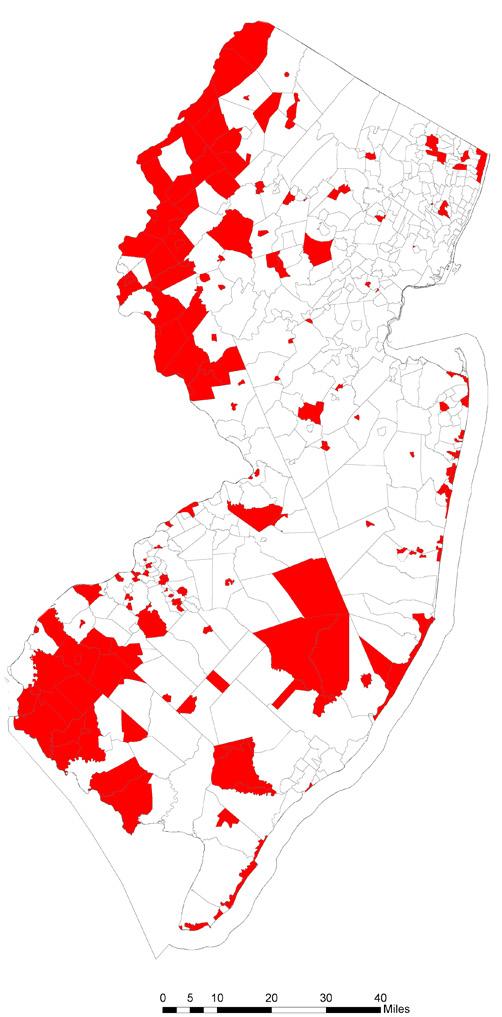
This map portrays the existing and potential areas of urban development in New Jersey. Urbanized areas are classi ed as areas having 50,000 or more people in an area, while an urban cluster contains 5,000-49,999 people in an area. The Department of Housing and Urban Development’s proposed revitalization areas, areas described as having the ability “to be revitalized through expanded homeownership opportunities”. This means these places are where urbanization might expand, among other things like improved living conditions, economic development, and possible gentri cation. Urban Enterprise Zones or UEZs “provide signi cant incentives and bene ts to businesses that locate within these zones” according to the New Jersey Department of Community A airs. This data is important because it signi es areas with high economic opportunity, drawing more people to an area. Also, it considers high vehicular and pedestrian tra c and ample parking space. This represents a transition between existing urban areas and proposed urban areas because it is a destination spot for many upcoming businesses and people who want convenience.
The New Jersey Housing Density and Public Housing Map is important for land use representation because New Jersey faces many issues regarding development and where it is concentrated. A ordable housing is a prominent topic in our studio, as it directly a ects the citizens of New Jersey and how to plan for them. Identifying where public housing units are in New Jersey according to the Department of Housing and Urban Development lets planners visualize the location and concentrations of a ordable housing available to New Jersey residents. This map has more public housing units near the urban areas, or more dense areas in terms of housing as well as areas where municipalities become smaller and more condensed.
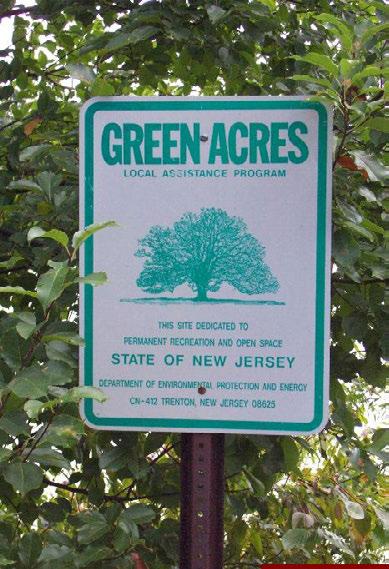
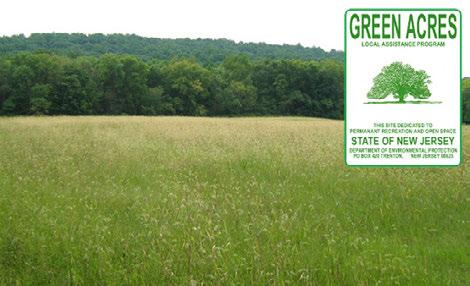
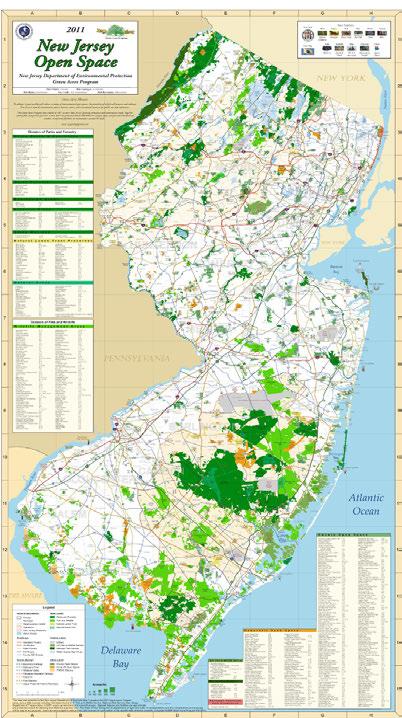
This map shows current area preserved by the Green Acres Program of 196. The Green Acres mission which is to achieve, in partnership with others to create a system of interconnected open spaces, whose protection will preserve and enhance New Jersey’s Natural Environment. It was created to meet New Jersey’s growing recreation and conservation needs - the act itself has protected over half a million acres of open space and provided hundreds of outdoor recreational facilities in communities around the State (New Jersey Department of Environmental Protection).
On the map, it is represented as the green open spaces that fall under the 1961 plan. This program is active in many di erent counties spanning from North to South Jersey. The data set for the open space is based o of several dataset maps which are all managed by the Green Acres Program of New Jersey Department of Environmental Protection. This information is important to indicate that these spaces are speci cally set aside to not be developed and are in interest of preserving New Jersey’s natural landscape, wildlife, and ecological importance.
Green Acres
Locan Non rofit pen pace Legend Green Acres
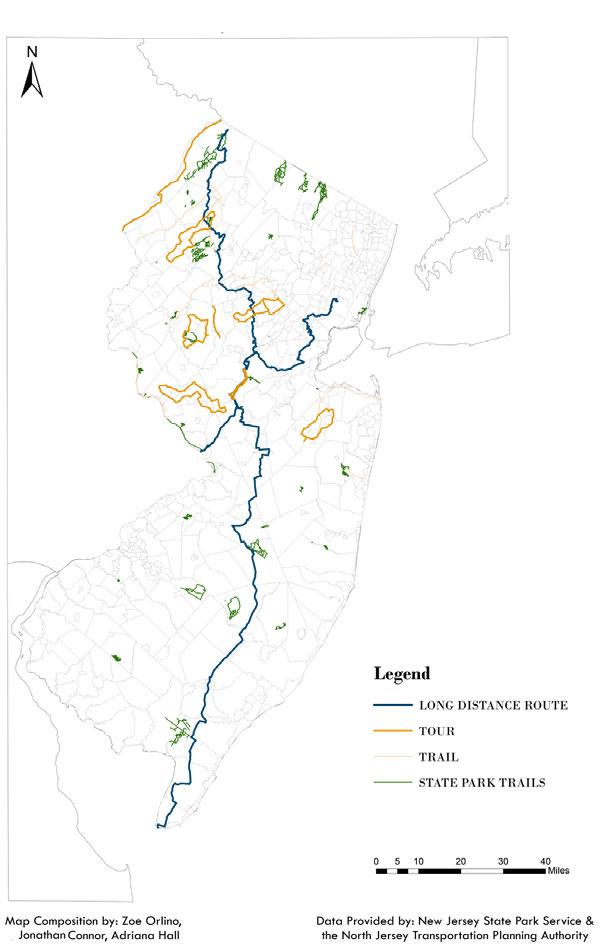
This map shows the open space areas of New Jersey as well as spaces under the Green Acres Act mission which is to achieve -- in partnership with others -- to create a system of interconnected open spaces that protect, preserve, and enhance New Jersey’s Natural Environment. The purpose of this map is to indicate and display areas that are open to the public for various activities including, but not limited to: academic research and recreational use.
These lands are owned by either the state, county, municipality, or a nonpro t agency that has received funding through the Green Acres State/Local Assistance Program(s). Locations of NJ State Park Service’s parks, forests, and recreational areas are displayed on the map along with over 1,000 miles of o cial recreational trails on lands owned and managed by the New Jersey State Park Service. Information is provided by the NJ Department of Environmental Protection.
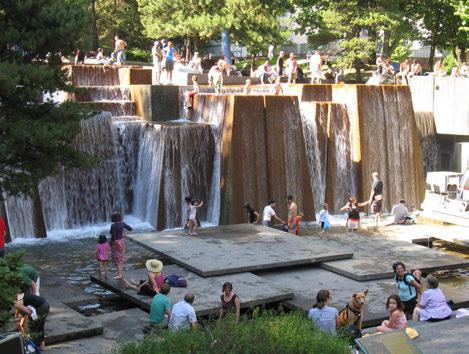
Urban Open Space
This map displays the urban open space areas of New Jersey, urban is de ned as developed areas with impervious surfaces. Open spaces may be categorized in urban areas as public athletic or recreational elds, preserves, cemeteries, vacant lots, etc. The areas displayed are considered developed / semi developed open areas that are not federally protected meaning not restricted to terrestrial nationally designation (federal) protected areas managed by variety of agencies excluding the possibilities of development on any of these lands.
The purpose of this map is to indicate areas that fall under the aforementioned de nition as well as bring about questions for the future. Where are some areas that do not have access to urban green spaces? What can we do to create an increased amount of urban green spaces in cities and suburban fringes? It allows for a discussion about the amount of “natural” spaces that we have in New Jersey – “natural” as in man-touched and a ected with constant touchups, sidewalks, and landscaping.
Michael Scott Bey, Lydia Zoe, David Rigueur
Legend
Urban Open Spaces
Physical Geography
Geography of New Jersey
This map shows several geographic qualities of New Jersey including the elevation, the physiographic regions, and the shoreline typing. This map shows the general geography of New Jersey by outlining where the six regions (Marine, Atlantic Coastal, Delaware Bay, Piedmont Plains, Pinelands, and Skylands) are located across the state. This map gives an overall picture of the terrain of New Jersey, this information is key when trying to gure out the suitability of certain regions as opposed to others based on their elevation and geographic qualities.
Geology of New Jersey
This map shows the numerous rock formations found across the state. The Northern area of the state has much more of a mix of rock types whereas the Southern area of the state has larger sections of the same rock formation. This mixing of various rock materials seen in the Northern regions could be a result of fault lines present in these areas. In the Southern area of the state, there are no fault lines present and very little elevation change resulting in large sections of the same formation that transform as thinner bans as they move north. The bedrock geology of the state has an impact on the way the environment reacts with it thus it has a direct bearing on how that land will be or has been utilized.
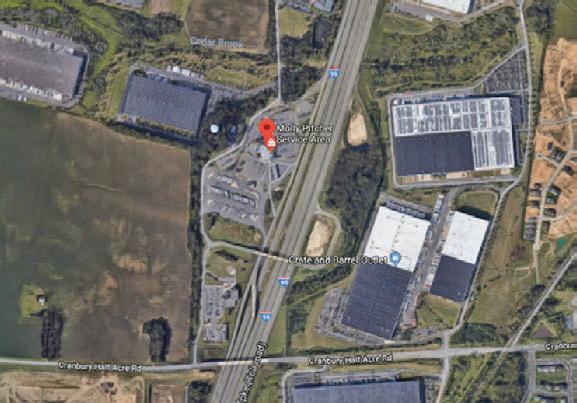
Active and Inactive Quarries in New Jersey
This map shows the sites of both active and inactive quarries in New Jersey. The active quarries sites are current functioning quarries, wheareas the inactive quarries sites are retired location that are no longer funtioning. This map funtions to show sites that are no longer in use that have the potentioal for redevelopement as opposed to development. Each quarry site, active or inactive, is also a brown eld site, which makes the inactive sites targets for redevelopment. This information is important as it o ers a new way to combat the issue of overdevelopment in New Jersey.
Map Composistion: Axel Gonzalez, Dianne Lê, Molly Kinghorn
Molly Kinghorn, Dianne Lê, & Axel Gonzalez
The map to the left displays the fault lines throughout the state of New Jersey. Fault lines frommountains and ridges are formed from earthquakes. They very often also a ect people and how they access resources and navigate the land, along with developers’ decisions on where to construct sites and buildings. Wind
Speed, and Relative Humidity in New Jersey
Fault Lines in New Jersey
Wind speed is critical as wildlife, such as bird migration, may very well impact or be impacted by the local ecosystem within a speci c area of New Jersey. Relative humidity may prove useful to this research as insects, such as mosquitoes, may be more or less attracted to particular areas which a ects the attraction, migration, and overall interaction with other species however, provides context to people, e.g. developers, as to deciding upon potential construction sites. Humidity levels may also a ect the desirability of potential residents renting or buying homes, if compared to areas that are signi cantly cooler.
Molly Kinghorn, Dianne Lê, & Axel Gonzalez
CASE STUDIES
Case Studies
In class, we discussed what additional research would provide useful contributions to our planning process. The amount of tools available was almost overwhelming; our goal was to develop a dictionary of NJ planning tools that would help us to identify the appropriate implementation strategy for our visions.
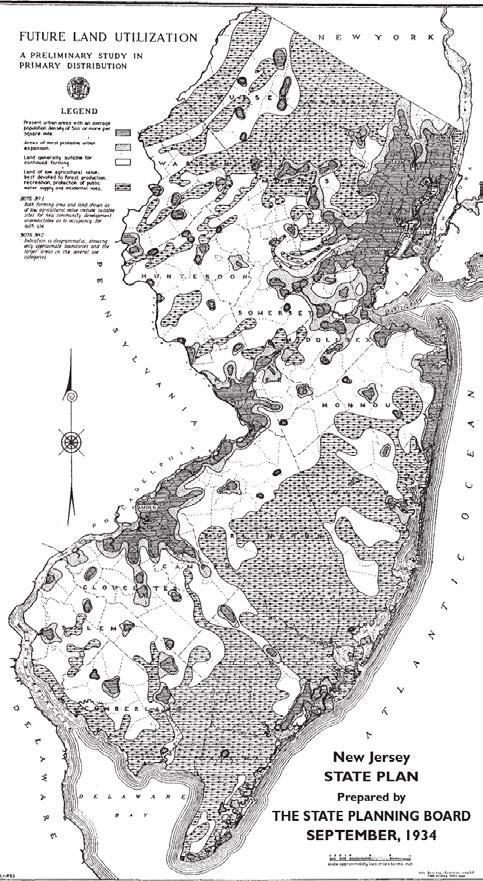
New Jersey State Plan 1934
The New Jersey State Plan of 1934 was designed by the New Jersey Planning Board to delineate the best land uses for New Jersey’s real estate.
Key features that The New Jersey Planning stressed in the nal report of 1934 was the importance of parks, open space, waterway contamination cleanup, preservation, agriculture and limited development.
The 1934 State Plan of New Jersey delineated the importance of land based on agricultural uses. If the land was not deemed for agriculture it was marked for preservation or for limited development. The 1934 State Plan that was heavily focused on agriculture shows the importance that the New Jersey community placed in maintaining the Garden State title.
Most of New Jersey in 1934 was open space, farmland or land not yet developed as farmland. “Urban” was the only category for residential areas present at this time, the suburban category was not yet established. Only a few urban settlements existed throughout the state, whereas today we see urban and suburban development throughout the majority of the state.
In 1934 a major concern in development was the unplanned growth of suburban sprawl. According to the New Jersey Planning Board of 1934, sprawl would be contributed to roadway locations and the increase in commercial land use relative to transportation and accessibility.
Information Provided by: New Jersey State Planning Board, State Planning in New Jersey 1934-1944 Final Report, Trenton. 1944
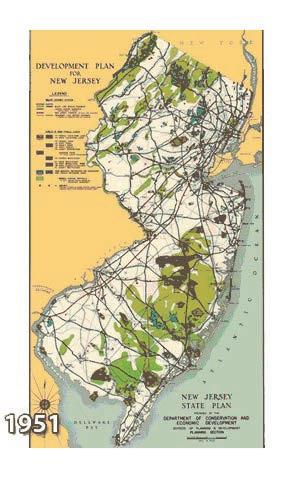
New Jersey State Plan (1951)
The goal of this plan were to complete ongoing transportation projects and to obtain numerous tracts of land for governmental use / preservation. Under this plan, the New Jersey Turnpike and Garden State Parkway were open for use for the public thus changing the way people navigate New Jersey for decades to come. The most notable tracts of land obtained from this plan were the Wharton State Forest and the Island Beach State Park. The Wharton State forest comprises of 122,880 acres of the Pine Barrens and the Island Beach State Park is still a very popular destination in the summer.
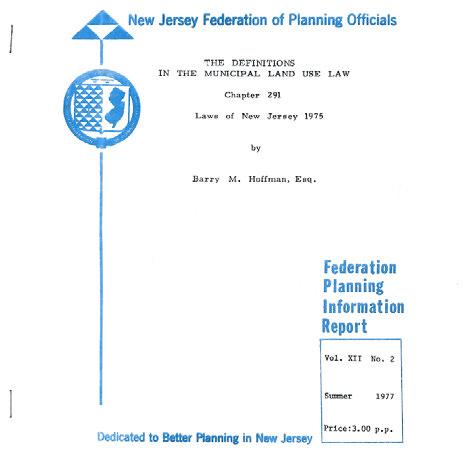
New Jersey State Plan (1977)
The New Jersey State Plan is composed of a few booklets outlining speci c issues in the state and commentary on the Municipal Land Use Law from 1975. Overall, in the state, there had been a 3,00,000 person population increase since 1947, and was designated the most populated state in America by the 1970 Census. There was a need for more housing as New Jersey was the home to the heaviest concentration of manufacturing and processing plants in the country at the time.
Agriculture in New Jersey was essential in 1977, as it was a two billion dollar industry. However, there was concern about a dwindling farm population. It was projected that “at
this rate, in 40 years there will be no more farms.” The growing population and shrinking agriculture industry created an interesting juxtaposition that is still apparent in New Jersey. Unofrtunately, planning this in the future would be an issue with the new Muinicipal Land Use Law.
The Municipal Land Use Law created a more local planning power, but a rift between counties in terms of overall vision for the state. For this reason, the state plan suggested having stronger planning boards, meanwhile giving them more power. There would now be legal consequences for going against zoning laws as compared to just having zoning suggestions.
Hopefully, the implementation of stronger planning boards would bring back more control over creating a capital improvement program, senior citizen housing construction, and environmental preservation initiatives. The stronger planning boards would also have more control over the agricultural presence in the state.
One singular booklet in the state plan set outlined a need for the preservation of horses and space for horses in the state. The equine industry was 50% of the whole agricultural industry and a symbol on the great seal of New Jersey. Horses brought a need for big open spaces and promoted wholesome activity. New Jersey today has the highest density of horses compared to the rest of America - a sign that this master plan had an impact on the present.
New Jersey State Plan (2001)
The New Jersey State Plan was created to plan for the future, to preserve, and maintain its abundant natural, cultural, economic, and social assets as well as its quality of life. It eventually adopted the State Planning Act that focused on prosperity and ensuring protection and growth to the surrounding environment -both ecologically and economically. It has an abundance of resources and a high quality of life with access to many major cities like New York City and Philadelphia. As a result, it creates a strong economy and access to the nations tourism and wealth.
The New Jersey State Plan of 2001 is a feat of a plan that targeted the e ects of urban sprawl in the state. It focused on eight main goals:
(1)Revitalize the State’s Cities and Towns
(2)Conserve the State’s Natural Resources and Systems
(3)Promote Bene cial Economic Growth, Development and Renewal for All Residents of New Jersey
(4)Protect the Environment, Prevent and Clean Up Pollution
(5)Provide Adequate Public Facilities and Services at a Reasonable Cost
(6)Provide Adequate Housing at a Reasonable Cost
(7)Preserve and Enhance Areas with Historic, Cultural, Scenic, Open Space and Recreational Value
(8)Ensure Sound and Integrated Planning and Implementation Statewide
By achieving all of these goals by the year 2020, it will result in lower public service costs, improved quality of life in communities, opportunities for a ordable housing, resilient and technologically advanced infrastructure, and the protection of existing ecological systems and the environment as a whole.
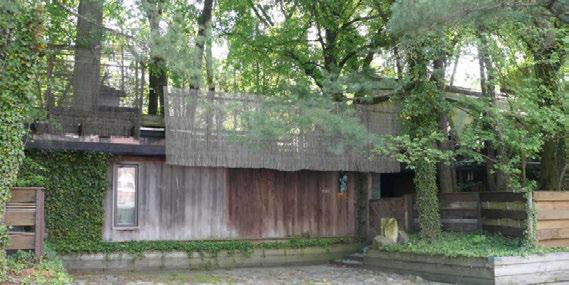
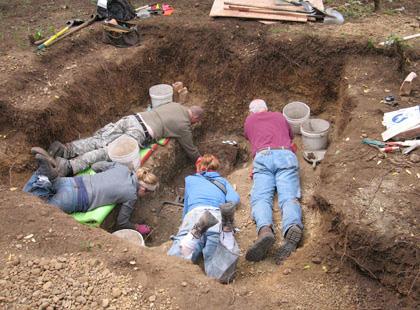
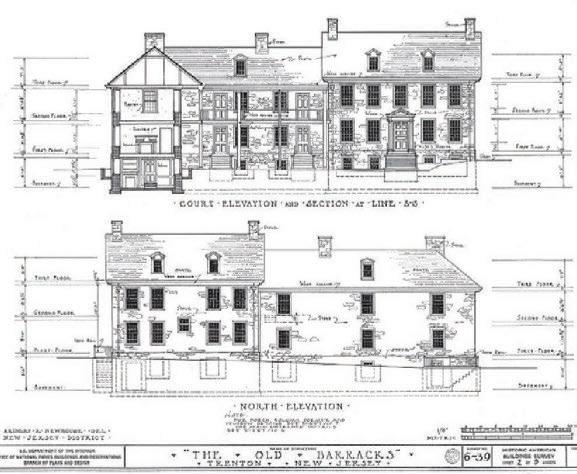
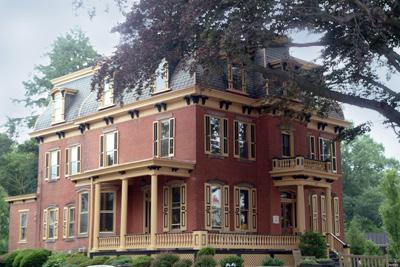
Historical reservation fice
NJDEP
The Historic Preservation O ce also consults and engages with federal agencies under Section 106 of the Historic Preservation Act for licensed or permitted projects that are federally funded. The Historic Preservation O ce is required by law to review and authorize any action by state, county, or local governments that might impact a property that is listed under the New Jersey Register of Historic Places Act. In conjunction with Historic Preservation O ce, Preservation NJ compiles a list of endangered historic sites. These endangered sites range in the clauses that force them onto the list, however the most common is the threat of development.
The New Jersey Historic Preservation O ce goes about identifying historical sites in two ways: Architectural Survey and Archaeological Survey. The Historic Preservation O ce has used published archaeological survey and guidelines since 1996 and guidelines for architectural survey since 1999. The Historic Preservation O ce guides and assists anyone undertaking such identi cation e ort through use of these publications and resources.
The New Jersey Historic Preservation O ce (HPO) is located under the New Jersey Department of Environmental Protection (NJDEP) and brings a wide variety of specialty and expertise that is needed for historic preservation. The Historic Preservation O ce Sta includes historians, researchers, planners, architectural historians, architects, engineers, and archaeologists who dedicate themselves to the historic preservation eld. The Historic Preservation O ce administers historic protection through a variety of programs.
Axel Gonzalez
FEMA
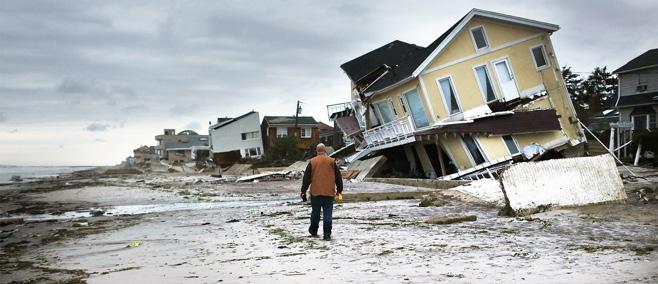
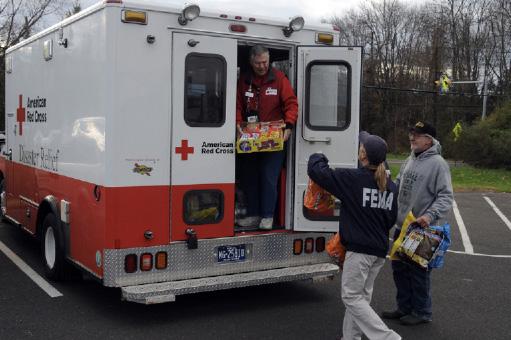
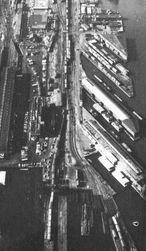
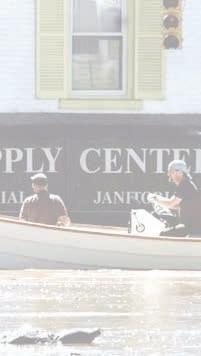
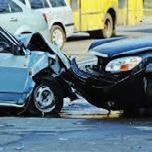
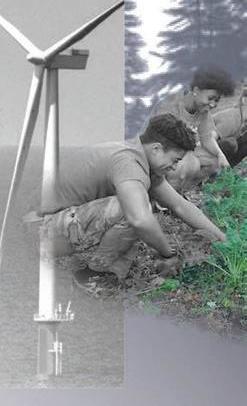
FEMA, the Federal Emergency Management Agency, is the nation’s governmental organization where groups are arranged to travel to places in need and provide help for people before, during, and after disasters. New Jersey is part of Region II of the subdivision of FEMA. Out of the many natural disasters occuring, New Jersey typically experiences hurricanes, nor’ easters, and tropical storms, of which mostly result in ooding, wind and/or snow damage. In the last two decades though, New Jersey has experienced almost every kind of natural disaster known to mankind, making it one of the most experienced FEMA subdivisions.
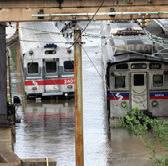
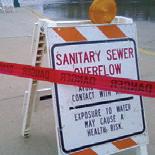
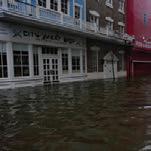
volunteer groups, non-pro t organizations, etc. to protect against, respond to, recover from, and mitigate all hazards that could be possible. One of New Jersey’s most recent involvements with FEMA was during hurricane Sandy (damage and relief e ort depicted above and to the right), one of the most catastrophic hurricanes in lifetimes for residents. FEMA, like Sandy and all other natural disaters raises funds, gather supplies, and disperse volunteers to help people get back in their homes and help get New Jersey back to its pre-disaster state and to help victims survive after disaster strikes.
During FEMA’s approach to situations of natural disasters, it is the job of FEMA to reach out to the state, municipalities,
Overall, FEMA’s main goal is to coordinate key recovery and long-term infrastructure projects through whole community engagement to promote risk reduction and capacity-building initiatives as well as to enhance the whole community’s responsiveness and resilience.
FEMA Mission Statement: To support our rst responders and ensure that as a nation we work together to build, sustain, and improve our capability to prepare for, protect against, respond to, recover from, and mitigate all hazards.
New erse fice or Planning Advocacy
e New Jersey O ce for Planning Advocacy (OPA) was formed as the O ce of State Planning in 1986. e o ce provides members for the New Jersey State Planning Commission and the New Jersey Brown elds Redevelopment Task Force. e goal of the o ce is to eliminate overlap in the di erent agencies to make sure growth can be achieved in the smoothest manner. A large responsibility the o ce has is ensuring that the New Jersey State Plan is implemented in the best way.
e O ce acknowledges the importance of physical planning and design. ere is more to growth and development than just the location. e way the development is put into e ect decides how well it will t the community. e OPA wants to put forth the best designs to ful ll the State Plan in order to keep the public happy. ey explain how o ce buildings and research centers can be incorporated around restaurants, hotels, and other retail stores to promote a healthy lifestyle. e close proximity of necessities to the workplace also promotes walking and reduces tra c and parking.
e OPA prepares di erent maps to help many di erent agencies perform research. e main data they provide are the New Jersey State Plan Policy GIS data and Quad Maps. In addition, they have developed Smart Growth Areas, which are areas of Metropolitan and Suburban Planning that are usually close to public transportation. ey also cover growth areas for the Pinelands and Meadowlands. e O ce also provides a very informative chronological timeline for the history New Jersey planning.
Overall, the O ce for Planning Advocacy is a great resource for anyone interested in the future
of New Jersey. ey provide a wealth of information that is easy to navigate in one place. ey also include a long list of links to other resources that would be bene cial to anyone in the planning process or public looking to learn more about planning issues. Between staing multiple commissions in the state and doing research to provide tools for growth, the OPA does a great job in providing the necessary people and tools to make planning in New Jersey e ective and e cient.
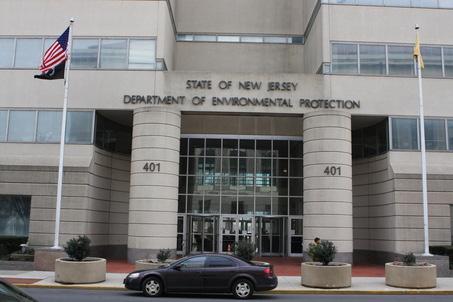
NJDEP
The New Jersey Department of Environmental Protections strives to address and to improve the impacts of climate change within the state. We have set a 2020 goal that the department is working to attain by transitioning to a low carbon economy and reducing carbon pollution as well as creating sustainable usage in communities and infrastructure. The NJDEP was established on Earth Day (April 22, 1970) when New Jersey’s former environmental programs were combined into one agency. This agency rst started as managing natural resources in order to solve pollution issues but then moved on to much more to what it handles today. This agency for “aggressive environmental protection and conservation e orts” was rst commissioner Richard J. Sullivan who was appointed by former NJ governor William T. Cahill. What once started o with 1400 employees in 5 divisions has grown to 2900 employees and now is the leader in pollution prevention e orts.
The NJDEP controls mostly all regulations and creates environmental rules that we all are familiar with. They create recycling regulations, pesticide control and licensing, maintain air quality by regulating vehicle emissions and statewide inspections. They also control larger scale sustainability that greatly impact the average person such as maintaining policies for public health and the environment with land and open space control such as coastal management and risk assessment planning, they provide info about wetlands, coastal stream and oodplain encroachment programs well as protect lands like the Highlands that provide part of New Jersey with drinking water. The NJDEP works to improve our health and the environment by creating policies and enforcing them. Without the DEP, New Jersey would not be able to implement stronger policies and regulations that could completely change each individual’s habits in order to create a more sustainable state. In addition to policies being made to enforce greater environmental strategies, the NJDEP also educates the younger generation what they can do to be greener and why this is such an important manner.
MacPhee
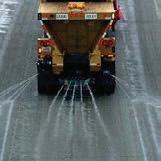
New Jersey Department of Transportation
NJDOT deals with all forms of transportation: vehicles (passenger and transport), busses, trains (freight and pedestrian), bikes, pedestrians, traffic, and aviation. It also provides safety standards for construction/ potholes. It manages EZ Pass and other tolls, Path Trains, and oversees all activity on the New Jersey Turnpike and Garden State Parkway.
NJDOT’s mission statement is “Improving Lives by Improving Transportation.”
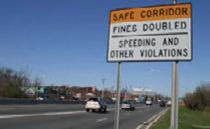
An important issue for the NJDOT is safety. New Jersey follows the “toward zero deaths” national strategy of highway safety. NJDOT serves a variety of clientele and as such, several safety programs have been implemented for pedestrian and bicycle safety. NJDOT provides students with safe routes to schools, and has implemented safety corridors and bike lanes.NJDOT employs several mechanisms to increase its environmental aware-
ness. In 1969, the National Environmental Policy Act (NEPA) was established, and helps establish ways for evaluating and mitigating highway tra c noise. ere are Tra c noise management techniques such as noise wall design guidelines. e Federal Highway Administration works with NJDOT to decrease the amount of highway tra c and construction noise. NJDOT also has a soil erosion and sediment control standards, as well as a soil stabilization plan. Most interestingly is that NJDOT has a socioeconomic guidance
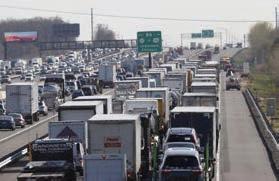
manual that explains the e ects of large scale transportation systems on society. The New Jersey “Long Range Transportation Plan” was developed in October of 2008 and discusses the cost of managing transportation, maintaining existing transportation, and gas costs. The plan recognizes the challenge of managing transportation in an already densely populated state with a growing in population. It includes elements like addressing local street connectivity, urban transportation issues, and public transport. The increase of New Jersey’s population density will likely lead to traffic. To quote the master plan: “Congestion continues to worsen in New Jersey. Some
14% of the state’s roads are considered congested (at capacity), and another 28% are almost at capacity, leaving only 58% able to accommodate more traffic, a 9% decrease between 1998 and 2004.” Transportation planners have to consider the increase of people in the state, and how that plays a role in traffic, public transport, and pedestrian use.
The Farmland Preservation Program
The Farmland Preservation Program is administered by the State Agriculture Development Committee (SADC) for the preservation of the exisiting farmlands in New Jersey. The program o ers incentives to help those with nancial debt, capital increase, land protection and retirement planning. With this wide range preservation program, land owners have many programs available for them once they meet certain criteria.
In order to be eligible, the land must meet SADC’s minimum criteria, qualify for farmland tax assessment, be part of an agricultural program, and lastly, must be existent on an area that the County Agriculture Development Board has determined can be farmed on over a long time period.
Through the Farmland Preservation Program, there are four available programs or methods available for landowners. The rst method is the Sale of Development Easements, which allows landowners who want to sell their development easements to the SADC, non-pro t organizations, County Agriculture Development Boards, or municipalities. After selling their rights, they are still allowed to farm on their land however, are not allowed to develop outside of agricultural means. Another similar method is the Donation of Development Easements. This allows landowners to voluntarily donate development rights for a portion of their land.
In return, they can receive income and estate tax bene ts. The third method is for a landowner to completely sell their property to the SADC for its fair market value. After purchase, the SADC will set the property to a private owner under agricultural deed restrictions to help preserve the land and prevent development potential. Lastly, landowners can voluntarily restrict nonagricultural developments for eight years. There is no direct compensation for this decision however, the landowners can apply to the SADC for funding grants of up to fty percent of approved soil and water conservation projects.
With the Farmland Preservation Program, land owners will be able to bene t nancially and can also have protection over the use of their farmlands.
Land and Water Conservation Fund
The fund has much approval and assistance from numerous organizations, such as the Wilderness Society, the Nature Conservancy, the Land Trust Alliance, and a few more. One of LWCF’s many appeals to the public is that it cost taxpayers nothing at all and is such an integral part of its long-time campaign for the conservation of many of America’s natural wonders.
The US Land and Water Conservation Fund, also known as LWCF, is a program enacted by Congress in the early 60’s for the bene t of funding local, state, and even federal governments for the obtainment of land and water. The purpose of LWCF is to fund the protection of the natural landscape, wildlife, parks, and other natural sites.
The predominant source of money for LWCF comes from fees paid to the Bureau of Ocean Energy Management, Regulation, and Enforcements from the companies that source for fossil fuels o shore, and can usually expect up to an average of $2.5 million daily. This type of funding makes LWCF particularly important because the program is taking something detrimental to the land and water and turning it to the conservation of both.
LWCF funding has been channeled into numerous projects of varying scales across the world, and they’ve helped develop and protect natural parks and recreational sites like the many popular national parks we’re familiar with today.
Unfortunately enough, the legal authorization of LWCF expired this past sunday on the 30th of September as part of the Trump Administration’s detrimental proposal to get rid of this undoubtedly important conservation program.
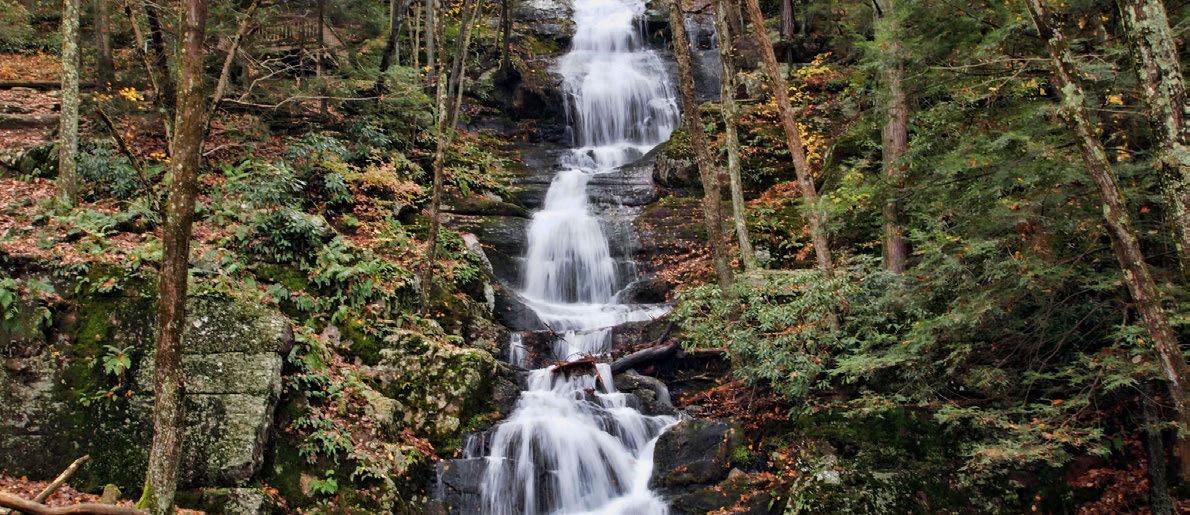
State Parks
State Parks and Forests in New Jersey o er a variety of natural and historic places due to the state’s diverse topology. As of 2016, there are 40 state parks, 11 state forests, 20 historic sites, and 25 miscellaneous areas including burial grounds, state marinas, and recreational areas. The state also has 43 areas designated as “natural areas”, some of which overlap with the current state parks and forests. These areas o er many activities including camping, swimming, hiking, boating, shing and hunting. Through programs and visitation fees, these recreational uses provide economic bene ts that contribute to New Jersey’s multibillion-dollar tourism revenues.
New Jersey is ranked 2nd in the northeast region and 8th in the nation for state park acreage. From 1992 to 2016, there was an increase in the acreage of State parks and forests from 304,539 acres to 448,497 acres. Visitation has also increased from 10,607,300 to 16,207,066 people over the same time period. The current acreage plus the amount of visitations can be used to calculate the use density (visitations per unit area), of which there were 36 visitations per acre during 2016.
There are many economic bene ts that state parks o er to New Jersey. One important that they provide to the ecosystem is the ability of forests to serve as “sponges and lters” during rain events, reducing the ood potential of sustained water. They also play a vital role in reducing greenhouse gas emissions and maintaining crucial ecosystem services such as soil erosion control, groundwater protection, and biodiversity enhancement. Many parks and forests are located within the watersheds of some of the State’s
biggest water supply reservoirs and they provide watershed protection for the water entering the reservoirs.
State Parks and Forests are also responsible for New Jersey’s economic value. A DEP study estimated that the value was at least $1.2 billion annually, which includes the value of ecosystem services. They also create a bu er zone to regulate development, functioning as a protected area around which sustainable land-use can be executed. The state lands are the basis of a tool called the Garden State Greenways, which is a tool to identify undeveloped lands with natural resources and the linear connections between them. It provides a statewide plan, suggested goals, detailed maps with GIS data, and planning tools to help coordinate private groups and government agencies.
Green Acres
The Green Acres Program was established in 1961 with the intent to preserve land in the state of New Jersey. The program has successfully preserved over a half a million acres of land for conservation. The Green Acres Program works with a large quantity of public and private partners some of which are: The Association of New Jersey Environmental Commission, The D&R Greenway Land Trust, The Delaware Valley Regional Planning Commission, The Forest Legacy Program (USDA Forest Service), and Friends of Princeton Open Space. In 2007, twelve million dollars was given to the Green Acres Program to preserve land for conservation and recreational activities in the ood ways of the Delaware River, Raritan River, and the Passaic River. In 2009 voters voted for an additional twenty-four million dollars toward the the preservation of these ood ways.
The Green Acres Program has many success stories which show the many large pieces of land that have been preserved from development. One example of this is the preservation of forested land in Hopatacong Borough, Sussex County. At this site a total of three hundred and ve acres in the New Jersey Highlands has been preserved as of February 2014. The funding for this project came from The Green Acres State Acquisition funds and federal Forest Legacy Program funds. Hopatacong will bene t from this land because it will contribute to clean water in the underlying aquifer in the New Jersey Highlands. Also this preserved land was added to the Hopatacong State Park making it a great addition for recreational activities.
of land that was formerly the Princeton Nurseries. The Princeton Nurseries was one of the largest commercial nurseries in the nation and was purchased by the Green Acres Program. This project was one of the largest preserves every created by The Green Acres Program. It contributes to clean water in the heart Central New Jersey. Approximately ve hundred acres will be used for a wildlife management area. Another ve hundred acres will be added to an existing park in Monmouth County. Lastly, the remaining land of the eighteen thousand acres will contain the preservation of farmland.
Another great success story which the Green Acres Program enacted was the preservation of 1,900 acres
Zoning
Zoning is the legislative process for dividing land into zones for di erent uses. Zoning laws are the laws that regulate the use of land and structures built upon it. (Propertymetrics) In New Jersey, the zoning of land (land divisions) is entrusted to towns under the Municipal Land Use Law. In towns or cities, elected and appointed o ce holders assume di erent responsibilities under the zoning laws. The elected city council or township committee introduces and passes the district regulations, and the public may propose amendments. The Planning Board supervises is responsible for overseeing the development of a city or town master plan and reviewing proposed regulations that are consistent with the master plan.
The Zoning Board of Adjustment reviews the development and build applications that require “use” di erences. Each piece of land is assigned a speci c use or use as permitted by the master plan and zoning regulations, and any other use needs to be different.
“The Land Use Department in a municipality sta s the Planning Board, Zoning Board of Adjustment, Economic Development Committee, Housing Committee (a ordable housing), Design Review Committee, Historic Preservation Review Commission, and the Environmental Commission.((Land Use and Zoning Law in New Jersey )” When the developer submits the plan, it is thoroughly reviewed by the Planning Board or the District Adjustment Committee (as the case may be) and by other county, state, and federal agencies. The land use department usually coordinates the approval of the Planning and Zoning Committee and oversees the implementation of a ordable housing programs within the community rule.
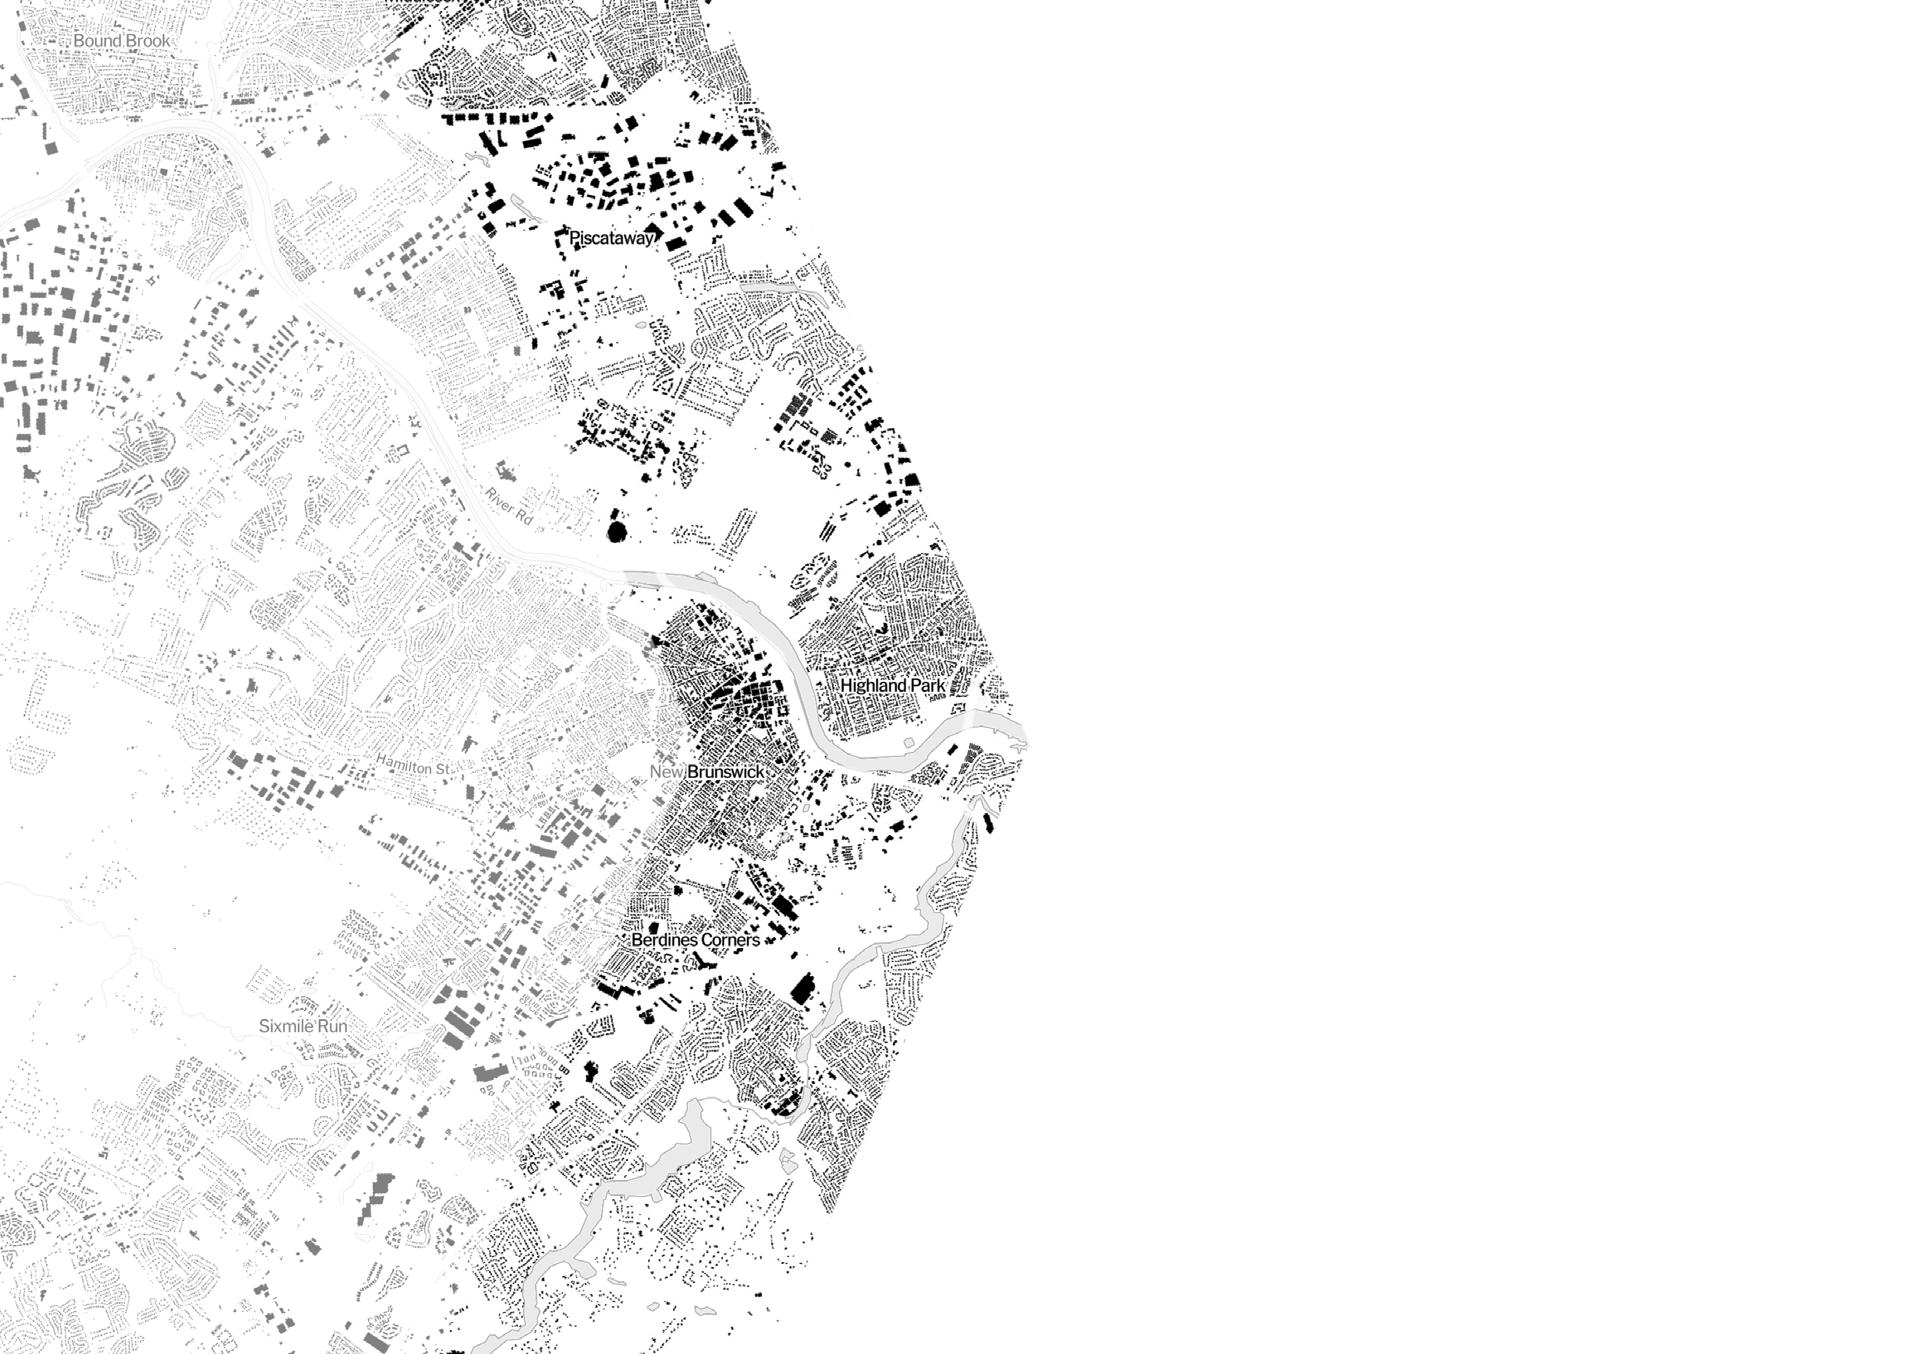
Map 2017 New Brunswick, NJ
Zhaoxuan Wang
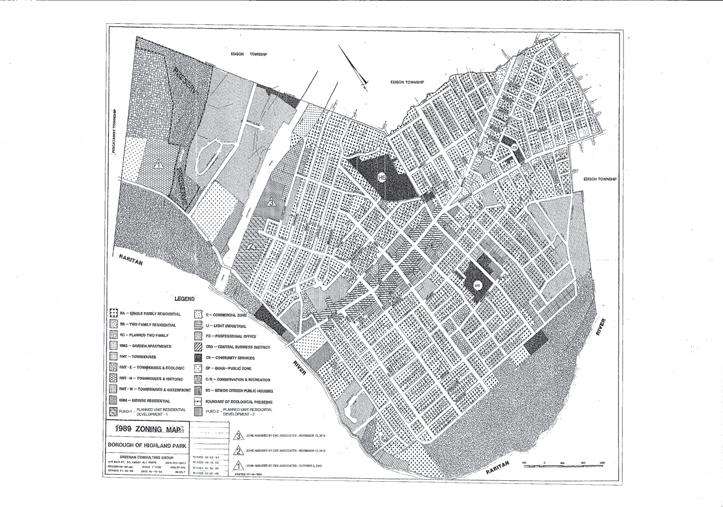
Zoning
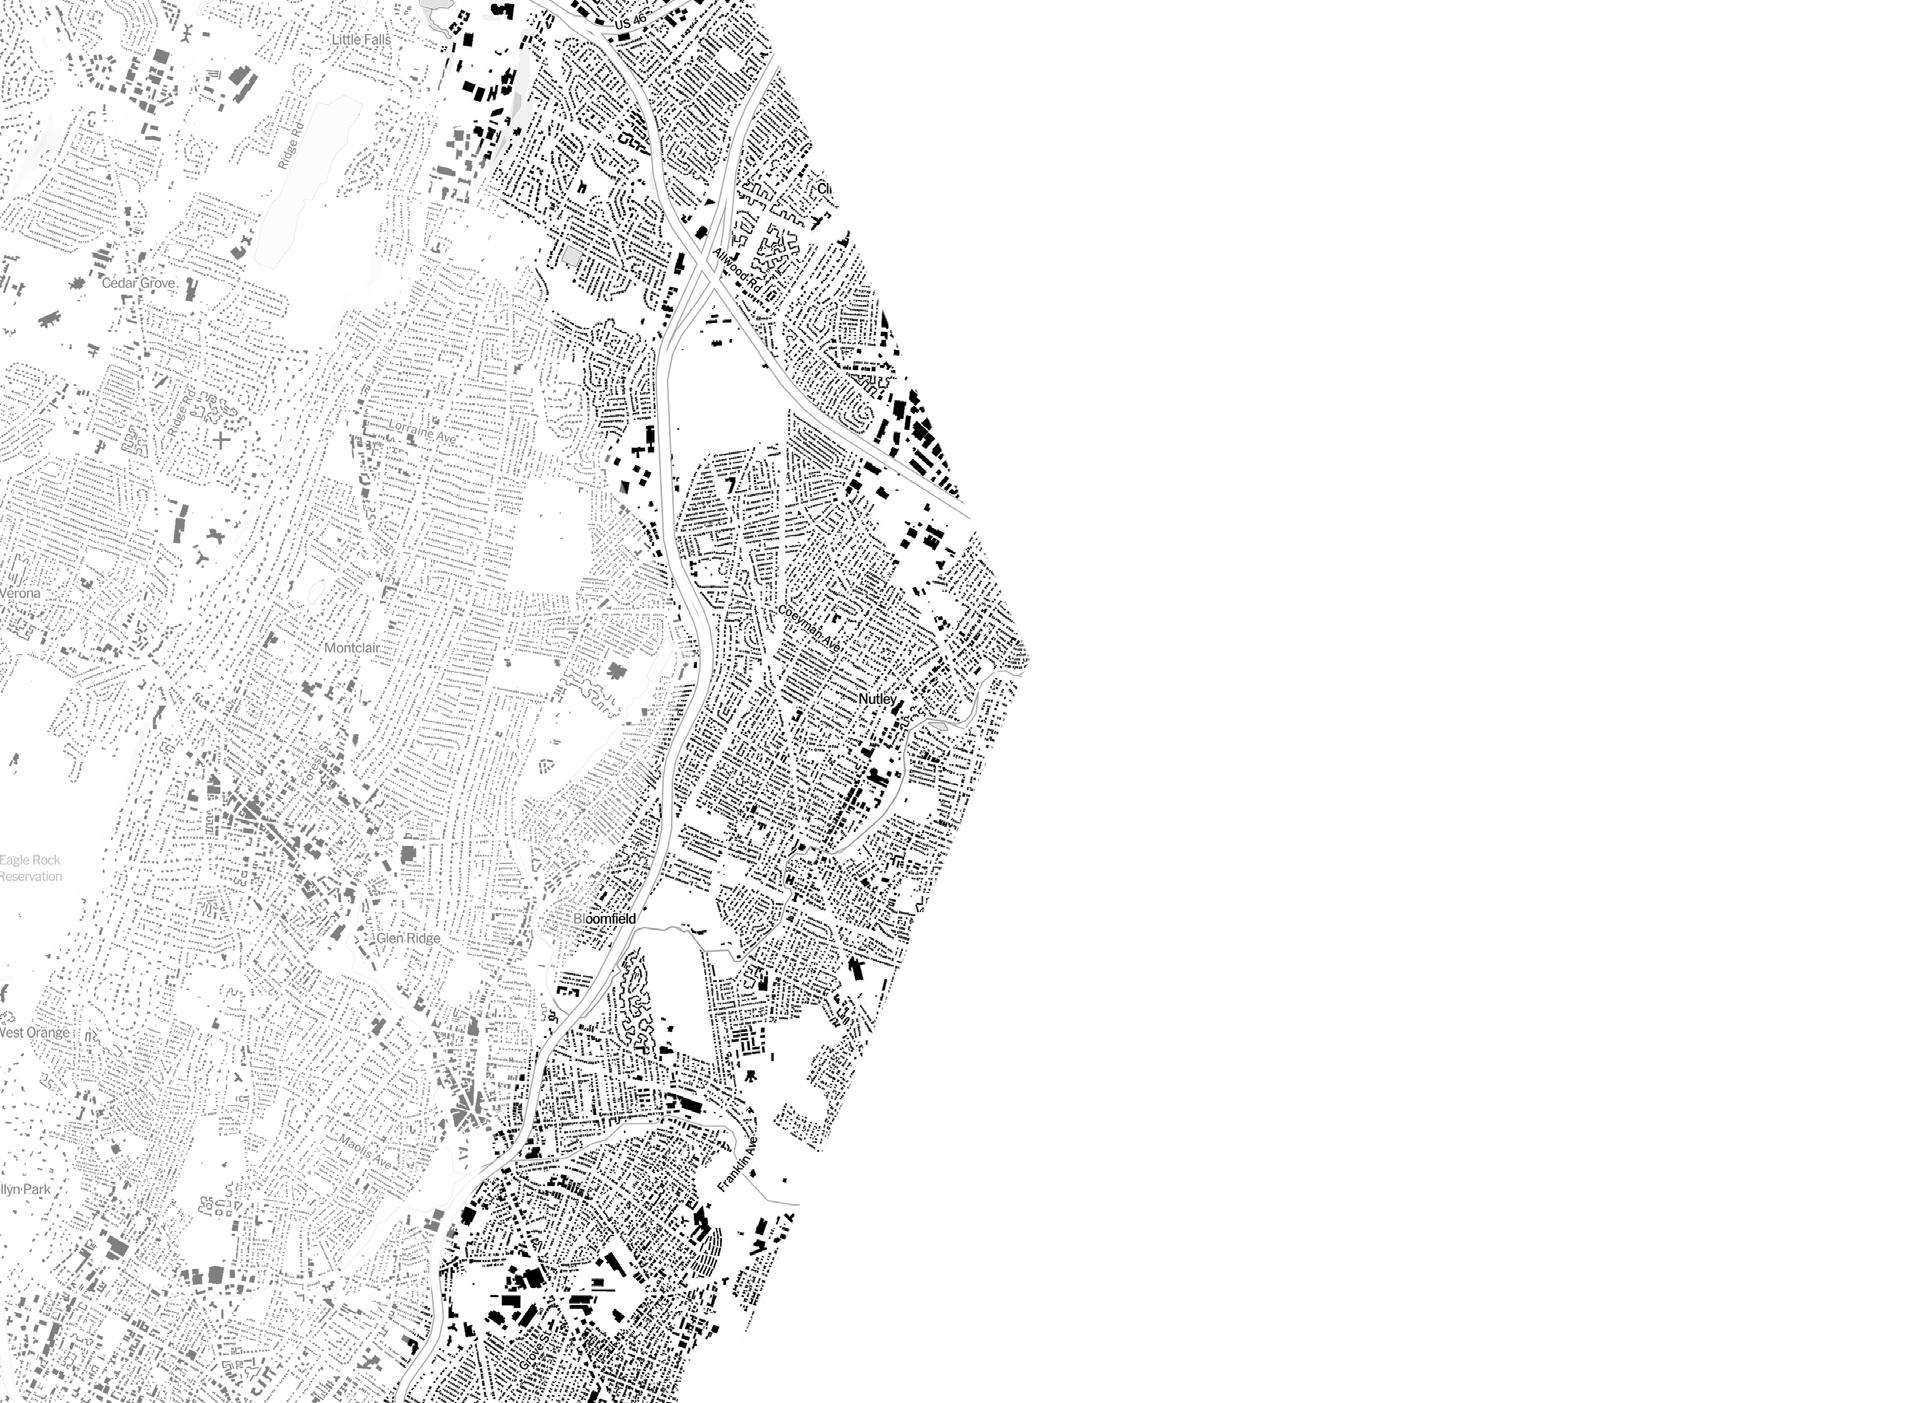
Zoning Map 1989 Highland Park, NJ
NEW JERSEY BLUE ACRES PROGRAM
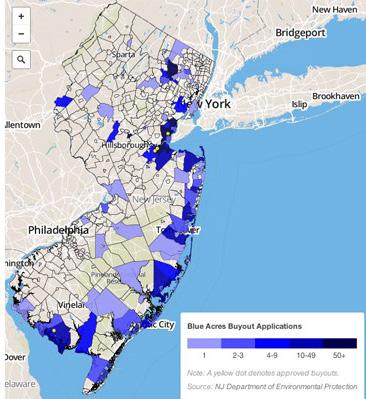
The Blue Acres Program Funding was launched by Governor Christie May 16, 2013 directly sourced from The Green Acres mission which is to achieve, in partnership with others to create a system of interconnected open spaces, whose protection will preserve and enhance New Jersey’s Natural Environment. Together with public and private partners, Green Acres Program, since 2007 this program has authorized $12 million for acquisition of lands in oodways of the Delaware River, Passaic River or Raritan River, and their respective tributariesWhen Hurricane Sandy hit New Jersey on October 29, 2012. It did $70.2 billion in economic damage. It was the fourth-worst storm in U.S. history being a Category 3 storm. , for recreation and conservation purposes.
The storm damaged or destroyed at least 650,000 homes, and 8 million customers lost power. This moment was a travesty for our state. Through the New Jersey Department of Environmental Protection’s (DEP) Superstorm Sandy Blue Acres Program, the state has been budgeted $300 Million in federal disaster recovery funds to acquire approximately 1,000 properties in tidal a ected with heavy ooding repeatedly. This program gives willing and able sellers the option to sell Sandy-damaged homes at pre-storm value in ood prone areas. The State seeks clusters of homes or whole neighborhoods that were ooded in superstorm Sandy. Once acquired by the State, these properties that have been damaged by, or my be prone to incurring damage cause by, storms
or storm – related ooding, or that may bu er or protect other lands from such damage, are eligible for acquisition. The appropriately selected area will be demolished, and the land will be permanently preserved as open space, accessible to the public, for recreation or conservation. The preserved land will serve as natural bu ers as well against future storms and oods. The goal of the Blue Acres Program is to dramatically reduce the risk of future catastrophic ood damage, and to help families to move out of harm’s way.
Princeton Merger
The Princeton merger was a long awaited feat for the two municipalities of Princeton Township and Princeton Borough. The merger has the possibility of providing an alternative solution to help manage the immense amount of municipalities in the state of New Jersey.
The Princeton consolidation goes back as far as the 1950s. The discussion began to merge municipalities to allow for sharing services. It wasn’t until November of 2011 when the merger was approved. The two municipalities had to vote to determine for or against the consolidation.
After its approval, the consolidation was o cially in e ect on January 1, 2013. It was projected for the merger to save 3.2 million dollars as a result as well as the lay o of 15 government jobs and 9 o cers. Aside from the loss of jobs, other concerns consist of the cost of transitioning and the longevity of services such as a ordable housing and human services departments.
According to NJ Spotlight analysis of tax data, the rate of tax growth was at 20% prior to the merger. It is now at 10%. In addition to slowing tax growth, the positives outweigh the negatives. The rate of employment has went up. Public services have also been able to work more e ciently.
Both standard services, such as snow plowing, and emergency services now aren’t restricted by jurisdictional boundaries. Housing services, health departments, and senior resource centers are all now able to work together. Consolidating services is a great start to allow for the disconnected state to work better in unison.
Risk
Meadowlands Planning Region
e New Jersey Sports and Exposition Authority(NJSEA), created in 1971, holds a land lease for and provides for the ongoing operation of the MetLife Sports Complex. In 2015, it became a regional planning and zoning agency for the 30.4-square-mile Hackensack Meadowlands District through its absorption of the New Jersey Meadowlands Commission. Between Bergen County and Hudson County, there are 14 counties that fall under the Meadowlands District. e Meadowlands District upholds the former New Jersey Meadowlands Commission’s threefold mandate to provide for orderly development of the region, to provide facilities for the sanitary disposal of solid waste, and to protect delicate balance of nature. e New Jersey Sports and Exposition Authority receives revenue from lease
payments, solid waste operations, fees and property transactions, and an appropriation from the State Budget under the Department of State.
planning and zoning agency for the 30.4-square-mile Hackensack Meadowlands District through its absorption of the New Jersey Meadowlands Commission.
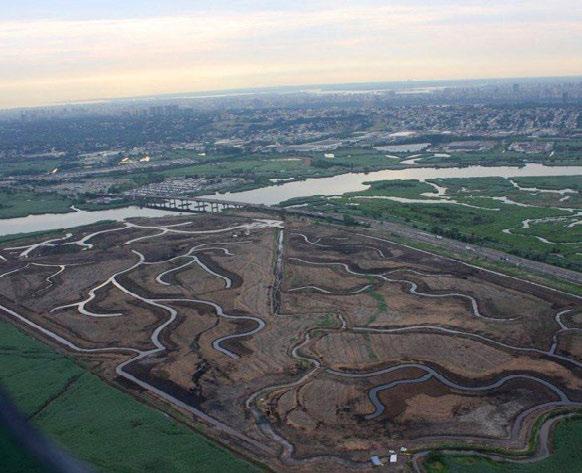
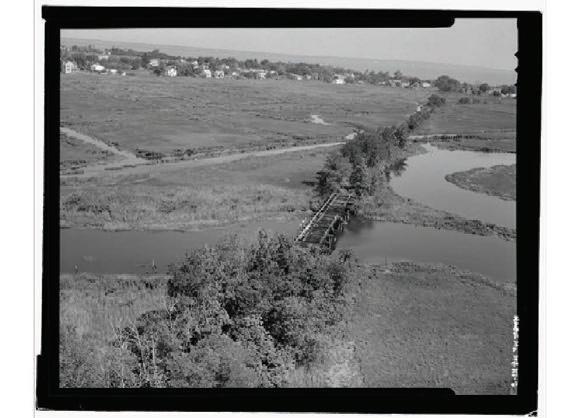
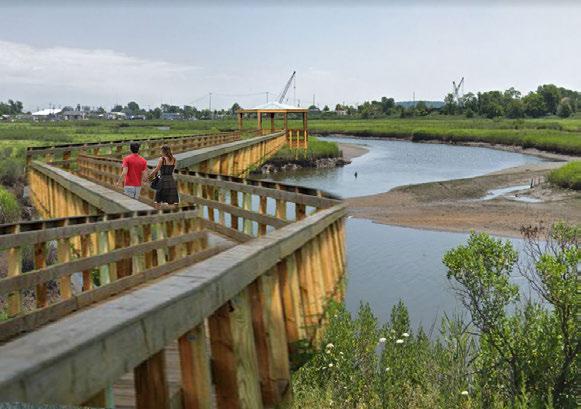
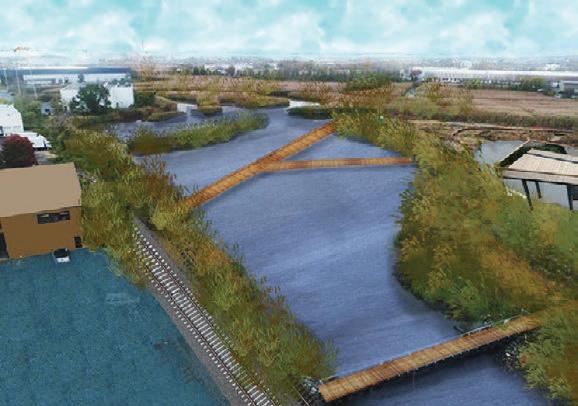
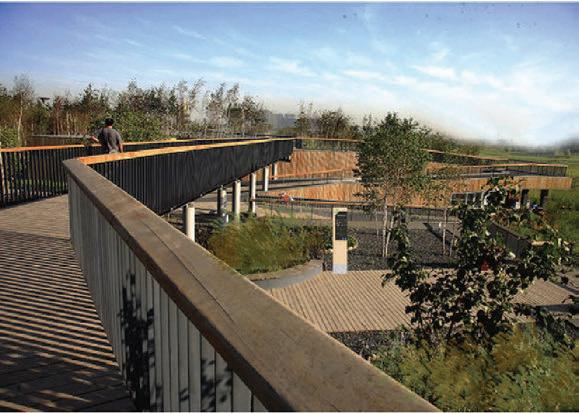
Since 1972, more than 100 acres of open space for 21 parks and eight miles of trails have been preserved, designed and constructed in an environmentally friendly manner, incorporating low-impact construction techniques, native plantings, and recycled materials. 21 parks, and eight miles of trails. Some trails in the park system are the Marsh Discovery, the Saw Mill Creek, and Kingsland trail.
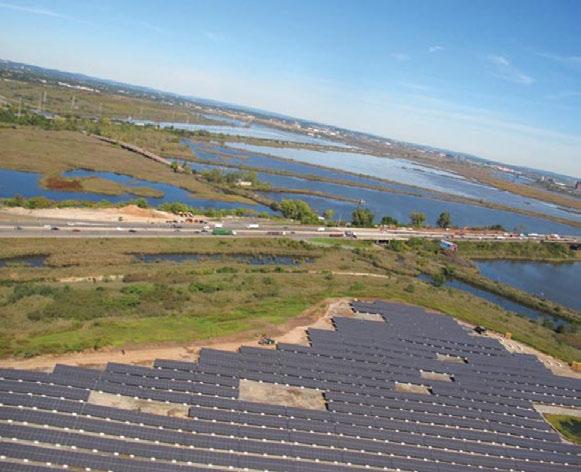
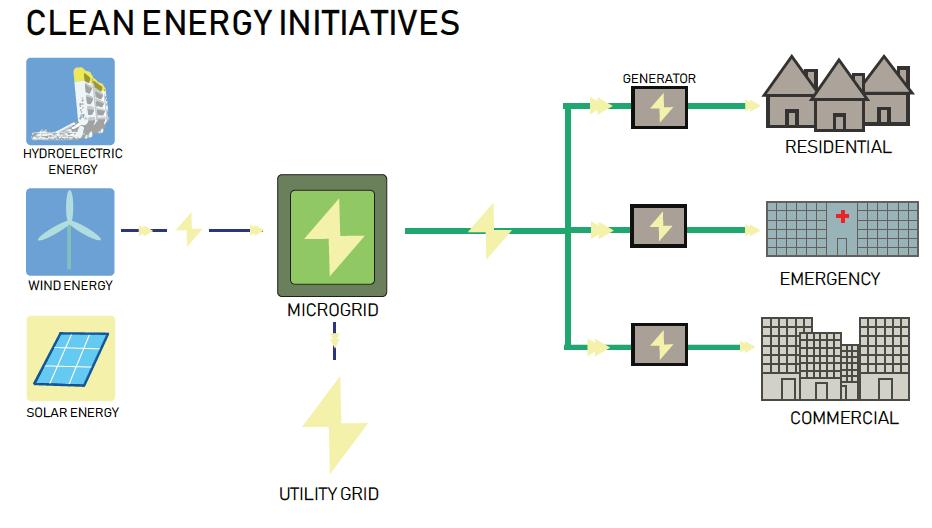
Energy initiatives involve the use of renewable and sustainable energy systems that are promoted by o ering incentives to companies and developers. Solar power, recycled materials and energy-e cient heating and lighting systems.
e New Jersey Sports and Exposition Authority o er hands-on, environmental science programs for schools for grades K-12, covering an array of disciplines including ecology, chemistry, biology, physics, natural history and astronomy.
Created in 1971, e New Jersey Sports and Exposition Authority holds a land lease for and provides for the ongoing operation of the MetLife Sports Complex. In 2015, it became a regional
provided by NJSEA
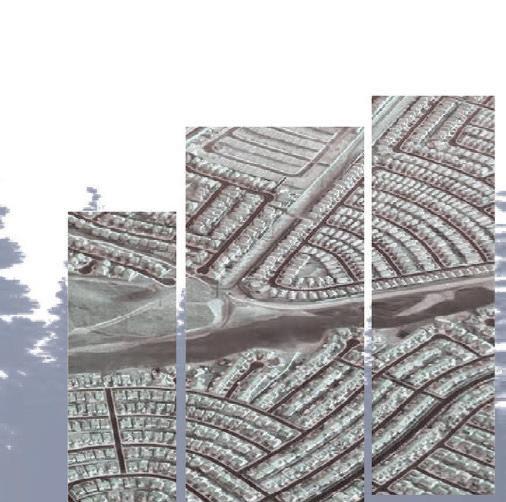
Images
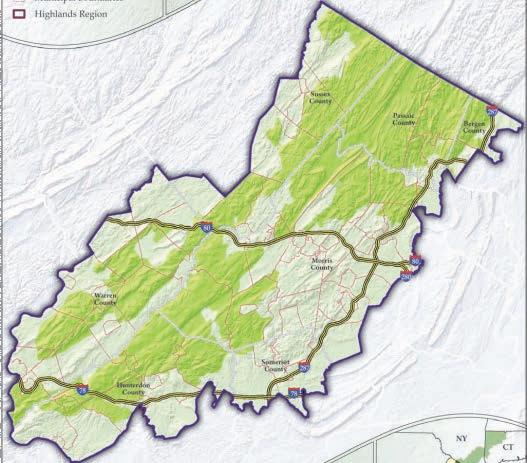
Highlands
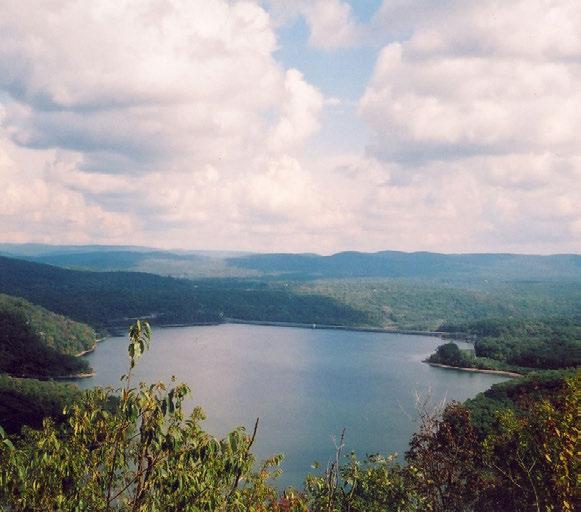
Including 88 municipalities, and parts of seven counties, Bergen, Hunterdon, Morris, Passaic, Somerset, Sussex, and Warren, New Jersey Highlands Region has 859,358 acres of lands in North Jersey, providing residence for 880,000 people. It is the water source for more than half of New Jersey’s families, supplying 379 million gallons of water daily. Plus, it contains forest lands, wetlands, watersheds, plant and wildlife species habitats, and about 110,000 acres of agricultural lands in active production.
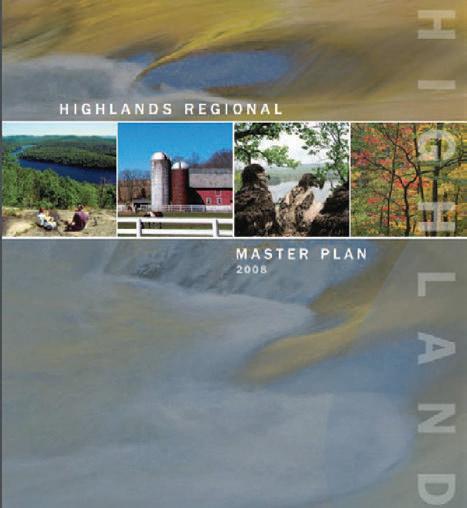
In order to preserve drinkable water for over 5.4 million people and maintain diversity of natural resources, New Jersey Department of Environmental Protection declared the Highlands Water and Protection Act on August 10, 2004. Every decision has to be approved by Highlands Water Protection and Planning Council, following the Regional Master Plan (RMP) which was acknowledged by the Highlands Council on July 17, 2008. Considering di erent
components, such as Resource Assessment, Transfer of Development Rights (TDR), etc., RMP provides analysis of varied elements, like Natural and Agricultural Resources, Water Resources and Utilities, etc., in order to solve the problems.
Transfer of Development Rights (TDR) is one of the aspects of the RMP. This program was Adopted by the Highlands Council on June, 2008, and the Highlands Development Credit Bank (HDC Bank) was found to support TDR at the same time. It is a Market tool for land trading, from Sending zones, Areas for preservation, to Receiving zones, Areas for development. Basically, landowners get equitable amount of lands with compensation for contributing to environment preservation.
Chan
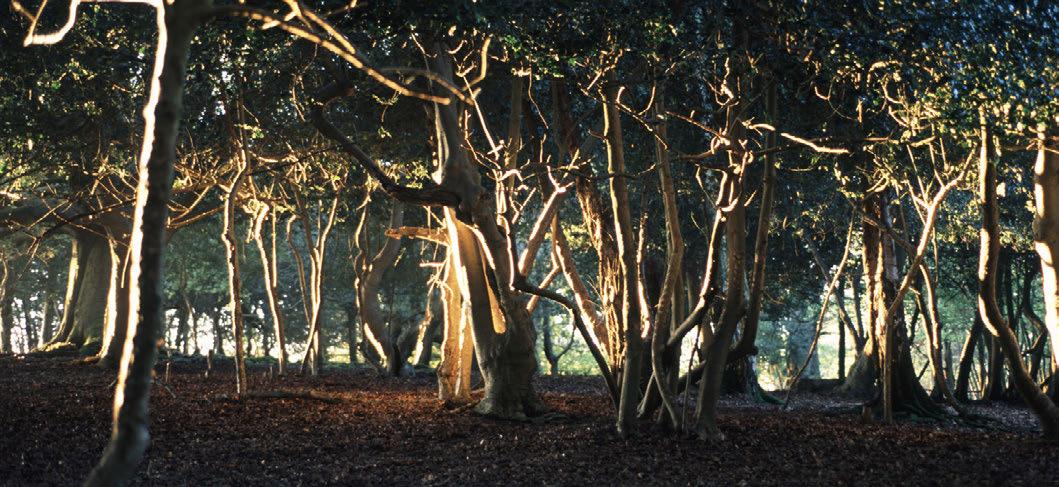
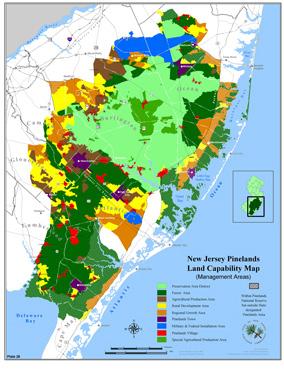
Pine Barrens
Where the landscapes defy all expectations. Where it struggle to hold onto identity, culture, and the natural world.
Spanning across seven counties and fty six municipalities, the Pinelands is 1.1 million acres of land and make up about 83% of New Jersey’s forests. It is home to a rich, diverse ecosystem and rests upon one of the largest sources of freshwater for a majority of New Jersey Kirkwood-Cohansey Aquifer.
This Aquifer is the largest source of freshwater with 17 trillion gallons of water being pumped and depleted faster than we can replace. With the Pinelands sandy, loose soil and shallow topography, its water source is susceptible to contamination from pesticides and fertilizer.
Typically, planning and zoning is left in the hands of the municipality, however this is not the case with the Pine Barrens. Instead, the Pinelands Commission, an independent state agency, creates its own comprehensive
management plan that overrides municipal rule. This plan discusses areas of management such as: installation plans on a county, municipal, and federal level, permits for state agencies, and development on a public or restorative level.
When it comes to taking care of the Pine Barrens, the Pinelands Commision mission statement is to preserve, protect, and enhance the natural and cultural resources of the Pinelands National Reserve, and to encourage compatible economic and other human activities consistent with that purpose.
The Trust for Public Land
Mission Statement:
The Trust for Public Land(TPL) is a non-pro t organization whose mission is to preserve the land for the people, and ensure that there are recreational and livable areas for all.
The Trust for Public Land assists in many projects, especially those that strive to provide social equity for disparaged urban communities. TPL is more well known for its urban conservation work, however the land trust has secured and purchased many locations for the sake of conservation such as additions to Yosemite National Park and the Appalachian Trail.
TPL makes this happen through a variety of social programs and initiatives such as ‘Parks for People’, ‘Our Land’ and ‘Climate-Smart Cities’. All of these provide a variety of focuses, some on nature conservancy, and others on urban resiliency initiatives. Since its founding in 1972, TPL has pioneered the conservation of land and has completed ve thousand parks across the United States. Today, TPL is among the largest U.S. Conservation nonpro ts and has approximately 30 eld o ces across the United States.
Land trusts work by conserving land through conservation easement acquisition, or by assisting in this process. Additionally, it can be an agreement where the trustee holds ownership of a property for the bene t of the bene ciary, the people who live there, and who the land supports.
Graber
New Jersey Future
New Jersey Future has been one of the leading non-governmental, non-pro t organizations in New Jersey for over 30 years. Many non-pro t organizations have only one speci c goal in mind that deals with either one or two topics. NJ Future is an organization that deals with various societal and environmental issues across multiple platforms. Most of the time Environmental group’s usually only focus on issues that will positively impact the environment while having a lot less regard for businesses small and large. On the contrary, large lobbyist groups and business groups often only have the interests of business and pro ts in mind. NJ Future accomplishes something interesting with their motto. They plan on bringing together and improving towns, cities, and communities via improving the Environment and landscapes, protecting important waterways and streams, fostering economic growth, and providing access to safe and aging friendly neighborhoods for citizens of this state. It’s hard to imagine a non-pro t covering such a vast array of topics and issues but the reason NJ Future can do it so well is their experience and
political know-how. Policy and advocacy are the perfect tools used to accomplish the goals of the organization.
Water infrastructure is one of the 5 main focal points of the organization. Water Infrastructure is important to our state as we have a high number of streams, rivers, lakes, and marsh waterways. Paired along with our growing population in what’s already the most densely populated state in America, these sources of biodiversity and precious water resources must be protected at all costs and maintained.
Rebuilding and Resiliency are the next issues that NJ Future deals with and they go about
this by publishing important data and knowledge about rebuilding homes in densely populated areas, with di erent property values, lifestyles, and employment opportunities. We are one of the most diverse states and this makes tackling this issue tough, and needs to be taken on strategically. Creating great places to age is another important focus and they handle this once again using their advocacy and meeting expertise. Senior citizens o en lack vital community information and getting data to these community members is o en tricky. NJ Future rates municipalities based on di erent amenities they provide their senior citizens such as mobility, information, gathering spaces and parks for light recreation. By doing this they can inform citizens on the best towns to grow old in, and show townships how to improve these things.
Revitalizing downtowns and Mainstreaming Green Infrastructure are the last current state wide issues that NJ Future deals with. Revitalizing downtowns can be accomplished in a similar way that places to grow old in are determined.
Sustainable Jersey
Sustainable Jersey has a chart (see gure 1.1, 1.2) that is categorized in three di erent components: Prosperity, Planet, and People. These categories have examples of how to become more sustainable for the community ranging from 5 points to 60 points each. This chart has di erent subcategories like energy, waste management, food, green design, brown elds, health & wellness and it lists what you can do to become more sustainable. Within each of these items is accompanied by points. In order to be bronze certi ed, you must accumulate at least 150 points. In order to be silver certi ed, you must have at least 350 points. In order to be gold certi ed, you must also be above standards in energy and waste management. This is a new category and they are slowly adding in more requirements for this category.
1.2
Sustainable Jersey is a certi cation program with three key components that is designed speci cally for municipalities in New Jersey. The three key components include: identify actions to help towns become more sustainable, provide tools, resources, and guidance to make progress, and provide access to grants & funding for municipalities. Of the 565 municipalities in New Jersey, 447 are participating in Sustainable Jersey. Of the 447 municipalities, 200 are already certi ed with either bronze or silver. There are currently no municipalities with gold.
1.1
Sustainable Jersey’s Mission Statement:
“Sustainable Jersey is a nonpro t organization that provides tools, training and nancial incentives to support communities as they pursue sustainability programs. By supporting community e orts to reduce waste, cut greenhouse gas emissions, and improve environmental equity, Sustainable Jersey is empowering communities to build a better world for future generations.”
“A Better Tomorrow, One Community at a Time”
Giovanni Caputo
Figure
Figure
Regional Planning Association
The Regional Planning Association is an organization that focuses on increasing the quality of life in the Tri State region (New York, New Jersey, and Connecticut). This region is consists of 31 counties. This group helps guide municipalities with ideology and planning suggestions to help solve to issues that occur in these areas, seek to prevent them before they happen, or improve existing conditions.
Some of these issues include critical infrastructure, transportation, community designs, economic development, energy, environment, and housing. Having oversight and coordination is extremely important because how one community handles an issue could result in the negative or positive e ect for another nearby community.
The RPA has categorized a set of areas for the types of areas to be dealt with and general stragetegies for them. The four types, which they call corridors, are the highlands, the suburbs, the city, and the coast. The categories sum up a majority of the region and allow the RPA to narrow the most common issues and nd the most e ective solutions that can be applied across the region.
The most powerful idea that the RPA has brought to fruition is its Fourth Regional Plan. This plan concerns itself with a ordable housing, ease of commute, and the region’s vulnerability to climate change. Along with this the RPA seeks to increase productivity, sustainability, and quality of life.
4-H
I will discuss a non-pro t entity which seeks to empower the youth from local communities. According to their o cial website, the Middlesex County 4-H “is the youth development component of the Rutgers Cooperative Extension. 4-H uses a learn-by-doing approach to enable youth to become competent, caring citizens of the world.”
This entity covers a diverse plethora of projects including: community and expressive arts, civic engagement, community/volunteer service, leadership and personal development, foods and nutrition, personal safety, animals, biological sciences, consumer and family science, environmental education and earth science, plant
science, physical sciences, and technology and engineering. Under environmental education, topics that are taught to the youth include yet are not limited to: adventure/challenge, composting, environmental stewardship, household hazardous waste, outdoor education/recreation, recycling, soils and soil conservation, waste management, and weather and climate. 4-H carries their own textbooks which fall under the guidelines of the “national curriculum.”
Furthermore, a very relevant case study to the topics of youth engagement and environmental education is the Lindley Cook 4-H Camp. This summer camp was initially established in 1951, and their objective is to
“o er the same simple, social, transformative environment…” The space may also be used as recreational or camping grounds which is intended to be a social space where forest visitors may interact with and build new friendships. Furthermore, the social skills learned from this summer camp is designed to build more con dence in the youth as they interact frequently with other individuals as well as the landscape. Overall, the Middlesex County 4-H is quite near the Rutgers, The State University of New Jersey’s campus. This entity serves as a bridge between the youth, resources, and its volunteers. The ultimate vision is to develop leaderships from a variety of ages and across many generations.
The Cultural Landscape Foundation
Mission Statement:
The Cultural Landscape foundation (TCLF) connects people to places. TCLF educates and engages the public to make our shared landscape heritage more visible, identify its value, and empower its stewards.
Preface:
This Case Study, done to assist with the research aspect of the planning process for NJ Water, focuses on the goals and e ects of The Cultural Landscape Foundation. Based in Washington DC, the non-pro t organization aspires to encourage people to raise awareness for the importance of the environment around them.
The TCLF hosts educational programs, conferences, and other occasions that allow for the public to become involved and do as much as they can to make world a better place. These events aid with achieving their goals of educating the community on the support needed in order to solve landscape issues, engaging them through conferences and social gatherings, empowering the planning and design process, and expanding research by networking nationwide.
Thanks to donors from all over the country, including the American Society of Landscape Architects, The Cultural Landscape Foundation was able to put these goals into action by initiating 3 programs: What’s Out There, Pioneers of American Landscape Design, and Landslide. With the success of achieving their goals, it is crucial to see that the foundation
was able to help people make an impact on the landscape as a whole. After doing this research, it is easy to see that people are fully capable of caring for the environment. Due to this, part of the environment includes the Typology of Water in NJ and the issue that corresponds to it being rise in sea level.
Therefore, if The Cultural Landscape Foundation can come up with a program to raise awareness to diminishing landscapes, then it is completely doable to also raise awareness for future problems that come with this situation. From ooding to a decrease in property value to disappearing towns, all it takes to save these is knowledge and research, community involvement, and the e orts of people from the US to across the rising sea.
Urban Land Institue
The Urban Land Institute is a nonpro t organization focuses on research and education in order to promote leadership in the responsible use of land. The organization was founded in 1936 with the goal being “an organization where the ingredients were businessmen with knowledge, experience, and a philosophy
about the problems of the urban growth and decay of the American city.” stated on the ULI website. Between 2000 and 2011, the institute expanded and created o ces in Europe, Asia, and online.
The organization has many things to o er, these include membership, councils, events, programs, research and publications. Becoming a member gives an individual to become part of creating better communities and shaping the future of the industry. Members attend di erent events and are part of councils, which means they need to have speci c expertise in areas that bene t the organization. The events held may include face-to-face or even online in order to connect individuals from di erent parts of the world. The events are set up in a way that includes all who are part of making a city work including developers, investors, planners, designers, public o cials, and scholars. An example of an event recently held this year was titled, “Real Struggles, Real Solutions: Transit-Oriented Redevelopment Amidst New Jersey’s Housing Litigation Mess”. This event focused on what the challenges are if a ordable housing were to be incorporated into the transit-oriented development and what New Jersey is doing as a state to help alleviate these challenges.
ULI worked on an area in New York that can be related to some of the issues currently happening in New Jersey. The project is called Hudson River and it is a transit-oriented multifamily rental development located in Yonkers. It is a site that took time to construct because there were concerns by citizens that the site should be a privatized waterfront. The development adds to the community in a positive way. It provides a space for di erent types of people to enjoy as well as beauti es an area that was deemed un t and worthless.
Smerliene Rodriguez
River Keeper
For my case study I chose the Riverkeeper’s of New Jersey and simply what their organizations area, are non-pro t environmental organizations that dedicate their time to protecting rivers and neighboring watersheds. The vvriverkeepers’ of New Jersey consist of the Great Swamp Watershed Association, Hackensack Riverkeeper, NY/NJ Baykeeper and Raritan Riverkeeper. These riverkeeping associations are part of a bigger association called the Waterkeeper Alliance. The Waterkeeper alliance is the combined e orts of all of the riverkeepers across the globe in order to ght against water pollution and to bring ecosystems back to waterways that have been damaged in the past. They were rst founded by Robert F Kennedy, Jr. in the mid 1960’s in e ort to take back the dying Hudson River however, it was not only one man that started this movement but a group of shermen. Since these organizations were created their goals have been to restore their respected waterways to a point of safe recreation use and to promote ecosystems well-being.
They achieve these goals by constant patrolling of this water way, community engagement and with the help of their donators. Since nancial disclosure was limited I could not nd speci c donators to these organizations other than citizen donors such as myself. Each organization has their own representatives, the (GSWA) rep is Sally Rubin, retired attorney; the (Hackensack) rep Bill Sheehan, founder of the organization; the (Baykeeper) rep Greg Remaud, advocate for conservation; and the (Raritan) rep Bill Schultz, retired re service. All of these representatives are elected through the organizations Board of Directors which are then voted on by the citizens.
The biggest aspect of this organization are their campaigns they run and getting the community involved. For each organization, they list the top campaigns/ events that they feel necessary to reach their goals. These events consist of volunteer clean-ups, silent auctions, ecocruises and student involvement. All in all, their vision is to bring back life into the waterways to the point before industry was introduced. These organizations are advocates for clean water and as citizens it’s our duty to answer the call for help.
Rethink New Jersey
Concept
Suitability
Design Exploration
Conclusion
5.1 5.2 5.3 5.4 5.5
5.1 RETHINK NEW JERSEY
New Jersey, being the most densely populated state and also the fth smallest, there are many issues to address. Rethink New Jersey focuses on the components that most prominently a ect the state: agriculture, housing, and wildlife. New Jersey is the garden state and relied on agriculture and its wildlife for resources and a way of sustaining itself. Now, in the 21st century, as the population has grown and become divided in accessibility to these resources, the plan addresses the ways of improving these issues and bringing them together to make a new Garden State.
ONE MILE TRANSPORTATION BUFFER
SUSTAINABLE HOMES
PROGRAMMING
URBAN AREAS
JOBS
SCHOOL GARDENS
COMMUNITY GARDENS
AGRICULTURE HOUSING
RESIDENTIAL GARDEN FREEDOM
HABITAT
POLLINATOR PASSAGES
ROADS
PLAYGROUNDS AND PARKS
HABITAT CONNECTIVITY
REVITALIZE DETENTION BASINS
CONTAMINATED SITES
RAISED BEDS
CONNECTION BRIDGES
Giovanni Caputo, Yat Chan, Evan Eden, Axel Gonzalez, Dan Ilkow, Ti any Nguyen, Smerliene Rodriguez, Jessica Thorning, Aliya Williams
CONCEPT
The design concept displayed on the left is a visual representation of the goal to rethink the ways in which agriculture, habitat, and housing can be united e ectively and valuably on the New Jersey landscape. Pictured at the top is a ourishing community garden with enthusiastic community member participants. Pictured to the right of the garden is a Uni ed Living community, a concept that rethinks New Jersey’s use, or lack thereof, of foreclosed homes. To the left of the Uni ed Living community is a vision for the wildlife overpass/ animal bridge, which aims to combat the issue of habitat fragmentation in the state.
The design concept displayed below is a nal visual representation of the three ways in which the state plan addresses the rethinking and reuse of brown eld sites. Starting from the left of the visual, closed brown eld would be transformed and repurposed into remediation forests, community gardens with raised beds and greenhouse systems, and public parks for communities to enjoy.
Revitalizing pollinator areas and craeting native ecosystems for native creatures
Find and revive areas that were once farmland and provide agriculture to urban areas
Use underutilized spaces between existing habitats to re-establish wildlife populations threatened by human activities
Connect habitats that were once connected but have been seperated due to human disturbance
Use capped brown elds to have areas of food production
Bring agriculture to the people through community farming to provide fresh food and food security to low-income families
Find exisiting bridges over roadways and trandform them into eco-bridges to reduce fragmentation and increase gene pool
Using safe, cleaned, and previosuly contaminated areas, community areas can be implemented and give life to once abandoned spaces
Having productive environmnets for locals to grow food and provide for tehir families, even during times of inclememnt weather/ during the o season
Locate foreclosed homes/ buildings and repourpose them into a ordable housing units
Foreclosure Homes versus Preforeclosed / Foreclosed Homes by County
100 Preforeclosure / Foreclosed HomesPreforeclosure - Mortgage is late and foreclosure process has started Foreclosed - Owned by bank, may soon be marked for sale Foreclosure - Owned by bank, marked for sale 100 Foreclosure Homes Legend De nitions
is graphic depicts the pre-foreclosure, forelosed and foreclosure homes within New Jersey by county. is data changes on a day to day basis as homes are purchased or going through the foreclosure process - this particular data is from October 14th, 2018. e issue at hand is that homes are going into foreclosure everyday while developers are continuously building new homes, creating useless overdevelopment in the state. Additionally, New Jersey is the most densely populated state in America - there are not enough homes to accommodate the population. is infographic shows the potential for all of these preforeclosure, foreclosed, and and foreclosure homes to become livable, solving two issues at once.
Giovanni Caputo, Smerliene Rodriguez, Jessica Thorning
Rethinking a ordable homes resulted in speci c criteria which consisted of transportation, preforeclosure, foreclosed, and foreclosure homes.
Locating where these vacant homes are is important for the process of repurposing them. Identifying a one mile radius between one of these homes and a bus or train line is essential for low income families that do not have a vehicle. Both of these data sets come together as one and create a balance for the suitable areas.
e vision for housing in New Jersey was developed by overlapping preforeclosure / foreclosed and foreclosure homes with a one mile bu er around public transportation data including train lines and bus stops. It’s tremendously important to this vision that those residing in a Uni ed Living unit have both close and reliable forms of public transportation. A more improved and inclusive New Jersey includes better access to public transportation and a ourishing community. e term Uni ed Living Community, is not only the new name for a ordable housing, it is a new way of living that accounts for the needs of low income families as well as improving urban environments. In addition, a large component of the Uni ed Living community includes incorporating green features in the neighborhoods where these homes are located. Introducing open spaces such as parks with green features in which individuals can interact with their environment is another important component that adds to this vision.
Habitat preservation and connectivity became a component of Rethink New Jersey upon analysis of the maps of Annual Average Daily Tra c in New Jersey and Conservation Focal Areas within Landscape Regions in New Jersey.
The two maps were overlaid which revealed that the major roadways in New Jersey were directly fragmenting the state’s habitat conservation focal areas. Analysis of the overlay allowed for areas that are most suitable for habitats to connect to be pinpointed and to see areas that need habitat to ow into each other.
Due to highly tra cked roadways, for animal’s, crossing the roadways becomes virtually impossible. As a result, the wildlife habitats become isolated and fragmented, causing issues of gene pool isolation and species isolation. The habitat component of Rethink New Jersey aims to address the issue of fragmentation and reconnect the wildlife habitats. The Vision for Habitats in New Jersey fully encompasses the idea of connectivity and in an abstract manner it visually shows how connection should ow for habitats in the state.
Yat Chan, Axel Gonzalez, Ti any Nguyen
The rst inventory map represents the areas of agricultural lands (“preserved farmlands” and “productive agriculture”) within the state of New Jersey. A “preserved farmland” is a farm that has been obtained through the Farmland Preservation Program, and is forever reserved for agricultural use. Regardless of who owns the preserved farms, owners are restricted from non-agricultural development. “Productive agriculture” is de ned as areas of agricultural lands that currently create su cient pro t from their output of agricultural products. This map was important to nding fragmentation of agriculture.
The second map is focused on the spatial relationship between agriculture production and polluted streamsheds together on one visual plane. Stream-sheds are areas in which farmers get their water for their farms because they are regions of water that contribute to streams and rivers. Many agricultural lands contained polluted water systems nearby or within the farmland itself, and several reasons that farms could produce pollution included: overuse of pesticides, herbicides, fertilizers, and other pollutants from animals through fecal matter.
e vision for agriculture represented in the map to the le abstracts the goal of defragmenting the agricultural scape through various open spaces, trails, agricultural connection pathways, and a more colorfully diverse productive agricultural landscape.
Evan Eden, Dan Ilkow, Aliya Williams
DESIGN EXPLORATION
AGRICULTURE REBORN
in Suburan Spaces: Vineland, NJ
Reducing regulations on plant heights within municipalities across the entire state to allow for growth of various crops. Currently municipalities have varying laws on how big or how many plants are allowed on property owners’ lawns, but standardizing this would allow for a greener, more productive New Jersey.
Agricultural Preservation
This policy preserves the existing productive farmlands of the state, as well as continue to preserve agricultural lands by upkeeping the already preserved spaces. Along with this, this policy encourages the private production of agriculture on a homeowner’s property with incentives such as annual rebates to instill the importance of the Garden State.
Plant Heights
FUNDING:
USDA, Team Nutrition funds, and National School Lunch Program funds provide grant funding, guidance and resources, and support for food service personnel who are interested in purchasing products from a school garden.
PROGRAMMING:
Connecting gardens with summer meal programs is a perfect way to ensure that gardens receive upkeep during the summer months. For harsher climates, tower gardens make it possible for students to garden all year long.
Criteria for selecting this location in Newark NJ:
Destination spot
Patch of open space next to school grounds
Closeby to food market
Easy access for many
SCHOOL GARDENS
in North Star Academy Fairmount Campus, Newark NJ
School Programs
School gardens and greenhouse programs would be mandated by state law. This would promote agricultural education while providing a food source that could bene t other school programs through sale or to go to food banks.
CLOSED CONTAMINATED SITE PARK DESIGN
Urban Garden
Contaminated areas throughout New Jersey can be repurposed into one of the following: agricultural site with raised beds, Uni ed Living housing units that are within a one mile radius of public transportation, restored wildlife habitat through the process of phytoremediation, or a public recreational park. This is decided based on what is most needed within that area.
Contaminated Zones
By implementing a statewide policy to require urban gardens, it connects the public back to New Jersey’s agricultural roots. These gardens will be implemented within a two mile radius of densely populated areas as well as high-volume tra c, city areas.
This park design stemmed from the idea of rethinking closed contaminated sites (CCS). Located in an urban area, it meets the criteria of being centered in the neighborhood as well near a populated rea. The hardscape style works well with the green feautures to beautify the area and serve as a place for education and unity for the community.
The materials used consist of pea gravel and concrete pavers in order to account for the previous types of contaminations. Galvanized metal and Rustic wood are also incorpoarted to keep a sustainbale aesthetic. All materials work together to provide a modern look that is inviting and tting to the existing environment.
53 S Bellevue Ave, Atlantic City, NJ
Giovanni Caputo, Smerliene Rodriguez, Jessica Thorning
Union County has the appropriate locations for Uni ed Living, which include foreclosure homes already on the market, the abundant number of bus and train stops within one mile of a proposed Uni ed Living location, and the wide range of income levels. The purple circles represent forclosure homes, homes that have already been foreclosed and are on the market. The green circles are bus stops and the blue circles are train stops.
The orange bu ers represent a mile surrounding the proposed Uni ed Living locations, an appropriate distance to walk to a transportation location. This is essential because Uni ed Living recipients need access to transportation without using a car.
UNION COUNTY
Transportation
A Uni ed Living housing unit must be within a one mile radius of a public transportation. Public transportation includes the bus and train. The housing unit must be within a one mile radius of a bus stop or train station.
Rede ning A ordable Housing
In order to change the stigma around a ordable housing, rede ning a ordable housing is essential to reshape the public’s view of what a ordable housing really is. Uni ed Living is housing that is made for low income people who cannot a ord to live in New Jersey. In order to qualify for Uni ed Living, you must be a low-income working family with at least one independent, or an elderly, or the disabled. Low-income working families are de ned as those that earn less than twice the poverty line. Each municipality has a di erent poverty line depending on what the average income for a working person is. The poverty line is de ned as the lowest tenth percentile based o of the average income within each municipality. Low income would then be the lowest 20th percentile. The average income per municipality is rede ned every ve years.
Giovanni Caputo, Smerliene Rodriguez, Jessica Thorning
UNIFIED LIVING
Uni ed Living Housing Units
A Uni ed Living unit includes, but is not limited to, townhouses, duplexes, houses, and apartments. Uni ed Living units are not “cookie cutter” designs but rather all have their own modern originality. Housing units are considered a ordable if they cost (including rent, mortgage, and utilities) no more than 35% of the occupants combined incomes.
Repurposing Foreclosed Housing
Taking an abandoned building like a foreclosed home quali es for a Uni ed Living unit. If the foreclosed home is older than 50 years, it must be torn down and rebuilt into a multi-functional housing unit to t multiple families. All new development for housing should have some type of productive garden. This can include: a community garden, rooftop garden, walled garden, etc. Construction costs for Uni ed Living units are covered by non-pro t organizations. In order to compensate the community members with the new development and higher density, the neighborhood will be beauti ed with plantings along the sidewalks and nearby parks will be renovated.
Giovanni Caputo, Smerliene Rodriguez, Jessica Thorning
The Uni ed Ag Committee aims to connect all three concepts of Rethink New Jersey: housing, agriculture, and habitat. By going out to recipients of Uni ed Living housing units and helping them to set up their own gardens or work on community gardens, there is a connection between people and the environment. Through the exploration of agriculture and self-sustainability, the user learns more about the history of the culture in the state and furthers it into a new type of agriculture for New Jersey. Furthermore, pollinator plots and other bene cial gardens may be planted for wildlife, creating a bridge between people and habitat. The Uni ed Ag Committee brings the people and environment of New Jersey together.
UNIFIED AG COMMITTEE
Uni ed Ag Committee
The Uni ed Ag Committee is a proposed government commitee that teaches families how to productively grow crops to sustain people in a Uni ed Living housing units. The Uni ed Ag Commitee goes to housing units in New Jersey to fully support members on how to e ciently grow fruits and vegetables in the backyards and front yards of their own property. The Uni ed Ag Committee seeks to improve the lives of community members by growing crops in order to sustain themselves.
Giovanni Caputo, Smerliene Rodriguez, Jessica Thorning
TRENTON COUNTY
Pollinators in Urban Spaces
Pollinator Passage
To create pollinator passages to decrease fragmentation, and provide habitat and forage areas for native pollinators by implementing native pollinator plants throughout the urban environments of New Jersey. Create a program that focuses on informing the public about pollinators, forage and habitat areas within the neighborhood, and protwect these areas for the sole purpose of providing habitat for wildlife. Locations should be within a mile radius of each other.
Inspired by the “Bee Highway” in Oslo, Norway, a similar concept of creating habitat for pollinators rethink urban spaces in New Jersey. The design explore many points to create a Pollinator Passage in Trenton, transitioning from its most dense to its least dense neighborhoods.
To represent heavily dense urbans spaces, the design focuses on the Delaware & Raritan Canal State Park Trail on Passaic Street. In this speci c case, this trail is the neighboring “park” for those who live nearby. Therefore pollinator gardens will line alongside the canal. Overall for any heavily dense urban spaces, pollinator gardens will be implemented in neighboring parks.
To represent an urban space that is not as heavily or lightly dense, the design focuses on the Oakland Street Playground. The pollinator garden will line along the extended park trail from Passaic Street. This is site speci c because this trail can easily be seen as the connection all throughout Trenton. Generally, the placement of the pollinator gardens will be within a mile radius along the most suitable passage that runs throughout the city.
For those neighborhoods that are least dense, the Cadwalader Park helps demonstrate how to implement pollinator gardens in neighborhoods that have more access to open spaces. This design is more broad, and the same concept of pollinator gardens in open spaces can be applied.
Informative signs are also placed at the sights to educate the public about pollinatwwors and their habitat. Inspired by the US Golf Association (USGA) and the Bats Northwest, habitat structures are also located at these sites.
Inspired by the Niaosong Wetland Park in Kaohsiung, Taiwan, detention basins are getting retro tted to wildlife habitats. From inventory maps, roads are showing as one of the main factors that cause fragmentation to habitats. Therefore, instead of letting roads to separate habitats, retro tting detention basins along the NJ Turnpike can connect habitats, and allow birds and pollinators to move between them. Thus, from obstacles that create fragmentation, roads would become stepping stones for habitat connectivity.
Test design locations are the detention basins near Molly Pitcher service area, Cranbury on the NJ Turnpike. In order to create wildlife habitat, besides the original functions of slowing down and in ltrating stormwater, and providing ood protection, retro ts for detention basins are going to substitute high-maintenance turf to turf type vegetation and removing low- ow concrete channels, which also help to minimize labor and chemical fertilizers.
NATURALIZE DETENTION BASINS
Retro t for detention basins is required for every three miles on highways in New Jersey, so that stepping stones can be created to connect habitats. Naturalized detention basins have to use turf type vegetation to replace high-maintenance turf, and are not allowed to use chemical fertilizers. Plus, in order to prevent mosquito breeding, detention basins are designed to not be holding water over 72 hours.
Detention Basin
WILDLIFE CROSSINGS
in Wharton State Forest
Wildlife Crossings
Wildlife crossings are required for every major road that fragments a wildlife conservation focal area. Each bridge must also contain pollinator plants in addition to serving as a wildlife crossing. At least one wildlife crossing is required for every ve miles of road that fragments such areas.
This wildlife overpass/animal bridge aims to combat the issue of fragmentation in NJ. Wharton State Forest is a large habitat that is directly fragmented by Route 206. Overpasses have been used to decrease fragmentation due to human infrastructure in countries all across Europe, such as the NetherlGermany. In New Jersey we can use animal bridges to address many issues such as, fragmentation, reduction of vehicular accidents involving animals, and the loss of pollinators.
Axel Gonzalez
Rethink New Jersey is the vision of the state of New Jersey encompassing the ideas of agriculture, wildlife, and housing. In the past, New Jersey was known for its agricultural produce, not only for itself, but for its major neighboring states: New York and Pennsylvania. New Jersey’s major agricultural production areas were some of the rst to begin to develop and expand, eventually becoming suburban and urban areas. Moving further into the modern era, areas of agricultural and wildlife signi cance were either swallowed by development or strongly reduced in response to this industrial expansion. The vision seeks to address fragmentation and the e ects it has caused, such as threatening agricultural diversity and the weakening of gene pools in the wild. In regard to agricultural production, the plan aims to maintain the few protected agricultural areas while moving new ones into urban and suburban areas. To help properly implement these ideas, the proposed vision implements a
Uni ed Ag Committee to help teach inhabitants of Uni ed Living, and in its surrounding area, how to productively grow crops that could go to a variety of uses: personal use, food bank donations and school fundraisers. To address the issues associated with habitat fragmentation, the plan introduces the implementation of major ecobridges as well as pollinator passages in urban spaces. In addition to these infrastructural modi cations, there will also be installation of detention basins along highways to create rain gardens for birds, insects and other creatures to extend habitats for and strengthen the amount of native pollinators. While nature is a major consideration in this plan, the issue of housing is also a major factor in Rethink New Jersey. To acknowledge this, the plan looks across the state for preforeclosure, pre-foreclosure, and foreclosed homes that have the potential to be reused for the Uni ed Living initiative. This is what the plan rede nes a ordable housing as in order to change the stigma and conversation
around a ordable housing. Uni ed Living is housing that is tailored for low income citizens who currently struggle to a ord to live in New Jersey. The locations
that fell into the criteria also have the potential to e ciently recalibrate the development of New Jersey but to set a new era where residents of the state have a stronger connection to agriculture and habitat. By using the resources that already exist in New Jersey, the harm in icted to the state and to the world around residents caused by ine cient development practices is reduced. The vision will create greener and cleaner environments for humans and wildlife as well as make living more a ordable for citizens while also not omitting the right of environmental upkeep. New Jersey is a place where people can have a relationship with each other, wildlife habitat, and the garden. New Jersey must act now, so citizens must Rethink New Jersey.
Giovanni Caputo, Yat Chan, Evan Eden, Axel Gonzalez, Dan Ilkow, Ti any Nguyen, Smerliene Rodriguez, Jessica Thorning, Aliya Williams
Resiliency
Design Progress
Redefining Re oning
Reconnecting
6.1
6.2
6.3
6.1 RESILIENCY
New Jersey has battled many hardships from both nature and humanity. With environmental risks ranging from sea level rise, storm surges, pollution, and industrial wastes, New Jersey needs a resilient master plan.
As a group of nine we’ve created a new future for New Jersey, an idealistic plan to change current conditions. By implementing new housing development, aggressive zoning laws, green energy designs, and creating sustainable policies and practices, we have proposed a plan that prepares New Jersey for greater resiliency.
: The ability to bounce back, e ectively and quickly, from a natural or non-natural disaster.
6.2 DESIGN PROGRESS
Our team went through many iterations in order to plan a more resilient future for New Jersey.
Through design explorations and case studies our team discovered a few key components that we wanted to solve. It was imperative to us that not only was our plan e ective, but it had a positive impact on the lives of New Jersey residents. We created informational graphics in the early stages to de ne resiliency and to shape the ideal future for New Jersey.
LIBERTY STATE PARK BOUND BROOK
Liberty State Park is a direct example of resiliency from manmade pollution and contamination. During the industrial period of the 1900s, the land was subjected to a massive amount of pollution from the local train station, creating a brown eld site. In 1976, the Department of Environmental. Protection decontaminated the site and redesigned it into the park that it is today. Liberty State Park proves that brown elds can be revitalized and made usable again in great ways
The case study of Bound Brook, New Jersey shows hurricane resilience through retreat tactics. Retreating from hurricane e ects allows for people to stay in their current communities, but may be costly and damaging to the natural environment. Hurricane Floyd (1999) and Hurricane Irene (2011) were two storms with similar amounts of rainfall, 10 inches, with di ering damage to the community based on e orts to control ood waters. Hurricane Floyd brought fteen feet ood water into downtown Bound Brook whereas Hurricane Irene brought in three feet of ood water. The di ering factor in these storms were the retreat and defense methods that had been implemented since 1999. A levee system and ood gates were built around the town of Bound Brook to alleviate the amount of water that was brought into the town. This method was explored by our group to help decide our plan for the future of New Jersey based on water implementation.
Jonathan Connor, Nina Petracca
SOUTH CAPE MAY MEADOWS
The South Cape May Meadows Project is a perfect case study to show how nature-based implementations can be resilient. This project involved restoring a length of beach that was constantly battered by strong storms. It also handled a lot of storm water issues through a wetland system. Through multiple implementations, such as a dune system, the project was able to provide protection from storm surge. On the other side of the dunes there was a system of weirs to control the water level inside the wetland to handle incoming storm water. After completion, the South Cape May Meadows became a hot spot for migratory birds and ourished as a natural wetland ecosystem. When Hurricane Sandy made landfall, the damage across New Jersey was devastating. Since the project had many water related implementations it was able to handle the storm surge and rainfall from the storm. There was little damage to the meadows and surrounding homes compared to the rest of the state. This case study shows how the strongest storms can be handled when planned for properly. This information helped us shape how our plan handles water related issues and how to plan for the unexpected future.
DESIGN EXPLORATION
Monmouth Beach is a two square mile town located on the Jersey Shore. It is home to 3,279 residents, according to the United States 2010 Census Bureau. Due to frequent ooding during storms Monmouth Beach is a great location in New Jersey for a storm water management design study. Sea level rise and storm water runo are all factors that contribute to Monmouth Beach’s continuous ooding problem. Storm drain pipe sizing is the main infrastructure issue that Monmouth Beach is facing to manage excess ood waters. The sea level rise map lead to the conclusion that ood water needs to be controlled or avoided. In reviewing this information our group decided that two approaches can be taken. Approach 1: Manage storm water runo , Approach 2: Create living communities outside of the “retreat” zones. Retreat zones are areas within the six foot sea level rise that will ood causing damage to property and result in unsafe living conditions for residents.
Jolean London, Nina Petracca, Tom Kastner
Monmouth Beach Safe Zone Community Living Plan
WATER INUNDATION PREDICTION
The New Jersey coastline is no stranger to sea level rise. There are many di erent contributing factors that go into the ever-changing coastline. Between land subsidence, intense storms, and sea level rise, New Jersey faces a faster than average sea level rise. As the average predictions begin to be proven inadequate, a di erent approach needs to be taken.
While the unexpected rates of sea level rise are trying to be modeled, a more extreme way of preparing for these events needs to be taken. The Water Level Risk diagrams show the potential extent of water over the next 200 years. As the conditions worsen, New Jersey will face higher water levels than ever imagined. Instead of pushing the boundaries and trying to control some of the strongest forces on the planet, we need to allow the water to go where it wants to.
ORGANIC COMPOSTING
There are many existing community gardens in New Jersey. These gardens have served the surrounding communities by giving community members the chance to purchase a plot and grow their own produce. The community garden should be a place for education and learning, as well as a place to bring the community together. Recommended garden activities are maintenance, seed sowing, watering, cooking, and eating produce. The Department of public works will encourage composting, of both leaves and food products. It is unclear how many New Jersey residents compost, or even have an incentive to compost. With a centralized community garden, the compost will be brought to the community garden (or personal gardens) of local community members.
SOCIAL MAP
To complement the creation of several suitability maps addressing a variety of environmental conditions, a axonometric social map was also produced. This addresses the needs of people in speci c areas and was used to approximate areas that need improvement and support. Four maps were created to represent this information. The rst depicts public solar facilities in New Jersey and compares the amount of energy produced in di erent counties. The second depicts education density and shows the location of all of New Jersey’s schools and how many are in each municipality. The third map shows how many municipalities are certied by Sustainable Jersey, a non-pro t organization that sets standards for resiliency and sustainability. Our last layer addresses the basic needs of health, highlighting areas within a fteen minute bu er of hospitals and showing their locations. Together, these maps provide a framework of the social needs in New Jersey can be used to highlight areas of importance.
STATISTICS
In the beginning phase of the planning process for resiliency, statistics were an important in uence on what problems we wanted to focus on. Problems regarding sea level, coastal ooding and gas emissions were key topics that we focused on.
NJ GREENHOUSE GAS
Pollution in both air and water are relevant problems for the entire state. According to the NJDEP, nearly 60 percent of New Jersey’s current water pollution can be attributed to contaminated or poorly managed stormwater runo . Also, 42% of NJ Greenhouse gas is emitted by transportation. Because of this, we decided to focus on greenhouse gas emission reduction and protection of residents who live near areas of high ood risk.
REAL ESTATE LOSS
New Jersey’s risk of ooding is increasing at a concerning rate. Sea level rise is a huge threat for those living in the coastal areas of NJ. According to the UCS (Union of Concerned Scientists), with the predicted 10 inch increase in sea level by the year 2035, $9.6 billion of residential properties are predicted to be destroyed. This means, NJ has the highest risk out of any state in the country.
COASTAL FLOODING DANGERS
With the predicted population of 376,000 people who could be a ected by the coastal ooding, 1 in every 25 New Jersey residents will be a ected by coastal ooding. This coastal ooding is not strictly de ned to ooding caused by storms; it also includes the increase in tides due to the increase in sea level rise.
GOALS DIAGRAM
These Venn Diagrams display the goals that our group developed in the beginning stages of our planning process. Our two main topics of concern were land and water. By organizing our data, we learned of the many problems related to both land and water in New Jersey and created venn diagrams to compare them. This process yielded united goals which provided insight to the main issues that needed to be solved.
RISK DIAGRAM
The risk assessment diagram de nes the many di erent issues that New Jersey is currently facing. The diagram looks at the risks from three di erent perspectives: individual, community and state. Each perspective is directly a ected by the other. Planning will have a more e ective outcome when basing decisions on current threats to New Jersey. The ve branches of the diagram represent di erent issues that New Jersey faces daily. The main factors that our group de ned as issues within New Jersey include: vehicular related damage and emissions output, contamination, excessive and improper waste disposal, beach erosion, inland and coastal ooding, and habitat deconstruction. We can make the most informed decisions in planning New Jersey’s future by beginning with the current threats that our state regularly faces.
IndividualCommunity State
Jolean London, Chelsea Kang, Nina Petracca
TOXIC SITES
EDUCATION
INTERVENTION TYPES
PROTECT AND PRESERVE
LAND USE RESILIENCY
This map was part of our initial study and analysis of the state of New Jersey.
Our goals were to
-Remediate toxic sites
-Educate the public
-Protect and preserve green space
-Employ resilient land use strategies and zoning techniques
-Address ooding and sea level rise
-Implement policies to enforce planning decisions
WATER ISSUES
GREEN SPACES POLICY
Initially, our main concerns were Bergen County, Burlington and Camden Counties (near Philadelphia), and Monmouth County. These sites were contaminated or highly susceptible to ooding. We soon discovered that we would need to address the state as a whole instead of these concentrated regions, and also realized that policy and green spaces, although not on the map, played an important role in New Jersey’s resiliency.
This timeline shows the changes that New Jersey will undergo from year 2018 until projected intervention completion in 2200.
TIME FOR A RESILIENT FUTURE
TRANSFORMATION TIMELINE
This transformation timeline shows the progression of changes that New Jersey will need to undergo through our design implementation. The timeline begins in 2018 with current conditions relating to suburban sprawl and individual vehicles as New Jersey’s main source of transportation and ends 200 years later with condensed communities. Our implementation includes energy, emissions and water related topics to increase safety for all inhabitants of New Jersey. In 200 years, our plan is to create a state with more open space and more resilient communities. Through clean energy initiatives and dense community living, a more sustainable New Jersey will thrive.
SUBURBAN SPRAWL
As our nal design, our team has come up with the idea of Rede ning, Rezoning, and Reconnecting New Jersey. We focused on three main design concepts, then de ned what they are in relation to both the state and the individual communities. Energy Emissions address the issues of pollution from industrial factories, the lack of recycling, and the accountability of food waste. Renewable sources develop greener, cleaner, and more reliable sources of energy while a focus on water and housing introduce resilient and a ordable housing for citizens of New Jersey.
COMMUNITY GARDENS
Our New Jersey Plan includes the implementation of community gardens in each safety zone. These community gardens will function as places for communities to come together to grow fresh and local fruits and vegetables. The food scraps from the city will be composted to be used in the garden. Restaurants will be required to compost, local eating will be encouraged and easily accessible due to the gardens. Plant blindness will slowly be eliminated as people will understand where their food is coming from. The gardens will be able to bring people together and provide community members with a space for growing local produce.
HEALTHY NEW JERSEY
On a more community based level, there are plans to implement policies under the name Healthy New Jersey. This would require citizens to practice growing and maintaining their community gardens and encourages eating locally and seasonally. Transporting food into the country from overseas is non-sustainable, and it discourages local eating. Obtaining local, seasonal produce will be cheaper, healthier, and better for New Jersey residents. By implementing this policy local businesses will be promoted alongside New Jersey’s agriculture. Imported produce from outside of the country will be taxed an additional seven percent.
LOCAL LIVING
In an e ort to create a more resilient New Jersey, our team has looked to instate programs and enact policies that would help promote a cleaner, greener, and a more sustainable state. Our main focus is cutting back on emissions and waste creation on both the industrial and community level. These issues would be tackled in the form of creating policies that would require industries to form a symbiotic waste relationship and reduce greenhouse gas emissions. This would help combat global warming and to maintain and further improve the current environment. On a local level, the creation of community gardens, composting systems, and through the implementation of policies, such as carry-in-carry-out, we will increase green spaces and decrease generated municipality waste.
COMPOSTING AND RECYCLING
COMPOSTING
Composting is essential to a resilient waste management system because it reduces the amount of waste sent to land lls. The decreased land ll waste will lead to cleaner air. Leaf litter, food scraps, and grass clippings will be collected and composted in community gardens to be used on community crops. Compost reduces greenhouse gases while simultaneously improving the soil quality for plants to grow. Residential households will be given specialized compostable bags at the start of each month to place compost materials. Restaurants and food businesses will be required to compost food waste on a daily basis with a limit to the amount of waste they can accumulate.
CARRY IN CARRY OUT
New Jersey is nicknamed the garden state, and should be kept just like a garden - pristine and in top condition. Our team is introducing a plan of carry-in-carry-out in state parks, trails, beaches, and other natural green public spaces. By removing trash bins and recycling receptacles, visitors will be required to take out whatever they have brought in with them. This is to promote a healthier landscape and environment free from plastics, glass, and other undesirables that pollute naturalized areas.
WASTE MANAGEMENT INITIATIVE
The Waste Management Initiative is about recycling, reducing, and reusing all the waste that communities produce on a daily basis. From implementing composting, to a 5 way trash initiative we will promote more waste conscious society as well as keep trash out of New Jersey’s land lls and environment.
5 TRASH INITIATIVE
The ve way trash initiative features ve trash designated waste receptacles for Compost, Plastic, Metal, Paper, and Land ll. Each receptacle corresponds to a waste center. Waste will be divided in order to maximize the recycling capabilities in each region. The receptacles will be placed in dense city centers and large trucks will collect the trash. Recycling guidelines will be clear and written in several languages on the trash cans. Community members will be able to easily identify di erent trash containers and therefor dispose of waste properly.
INDUSTRIAL SYMBIOSIS CONGLOMERATION
It is no doubt that emissions cause various health issues for people, animals, and plants while damaging the environment and atmosphere. As it is not quite feasible to seek to end industrialization altogether, therefor, we propose to consolidate all industries into one centralized location. This will ensure that toxic and harmful emissions will be controlled. These toxic emissions currently end up in the atmosphere, water, and soil. By reusing the resources output of one industrial factory as the resources input of another , we will minimize energy usage and costs, promote healthier surrounding ecosystems, and reduce health problems of
current residents who live near industrial plants. In reusing waste resources, we approach the concept of circular economy, where an economy regenerates itself though the repurposing of waste products and leads to reduction in not only energy output or waste emission, but also in costs and labor.
For example, the United Kingdom, an early participant in industrial symbiosis, has provided a potassium aluminum ouridebased waste product from vehicle air conditioning and engine cooling systems production, to another company that uses this waste product in
INDUSTRIAL EMISSIONS
recycling aluminum. This initiative has reduced 15 tonnes of hazardous waste annually and has reduced 36,000 Euros in management costs. The UK has also applied industrial symbiosis in generating electricity through anaerobic digestion with the waste products from the food industry. Furthermore, carbon dioxide produced from nitrogen production and methanol production have been provided for greenhouses to aid in their full year cultivation of tomatoes. Therefore, this proposal proclaims that we as a society may advance industrially and economically without sacri cing the health of its people.
RENEWABLE SOURCES
Renewable energy sources allow for cleaner energy use within New Jersey. Currently more than half of New Jersey’s energy comes from nuclear power plants, There are many downsides and risks associated with this type of energy. Over time, these dangerous methods will need to be replaced with more reliable and safe solutions. Renewable sources such as solar panels, wind turbines, and hydroelectric energy can provide a substitution for nuclear energy, bringing cleaner, more environmental friendly energy to the state while also reducing carbon emissions.
Jonathan Connor, Eric Graber, Chelsea Kang,
SOLAR ELECTRIC
In one day a 2000 sq foot home with twelve to eighteen 320 watt solar panels, can produce up to 15.36 kilawatts of energy. By harnessing the power of natural light, we can eliminate our dependence on limited, non renewable resources. In an e ort to preserve as much open space as possible, we’ve proposed the creation of solar panel canopies and solar panel roo ng for large scale buildings. Solar panel Canopies are placed in existing parking lots, functioning as a source of shade in an area that would be otherwise underused. An additional bene t of installing solar panel roo ng is that it reduces heat retention, and therefore, the heat island e ect.
OFFSHORE WINDTURBINES
We’ve proposed the creation of multiple wind turbines that will be installed along the New Jersey coast line. These wind farms will be able to generate energy on a larger scale than other alternatives such as solar energy. In addition, it reduces the need for further impervious surface development
HYDROELECTRIC ENERGY
Although renewable energy has many advantages, The standards used today do not work in signi cant storm events. Wind turbines require constant, steady wind and because of this, they need to be shut o in a hurricane or major storm. Additionally, Solar Panels don’t work in the rain, the snow, nighttime, limiting their generating potential. Hydroelectric energy provides a solution to this problem. One way of harnessing the power of the ocean that we selected for our project was the Oyster 2 hydroelectric generator by Aquamarine Power. With the ability to power 9,000 single family homes from just 20 generators, we can maximize our energy producing e ciency. Placed at a depth of 10-16 meters, these generators use a paddle-like lever to pressurize water as the water current moves the device. This form of renewable energy is currently in use in the UK, and in addition to creating energy, it also has stimulated their economy by creating jobs and generating revenue.
MICROGRIDS
A microgrid is a group of multiple energy sources. Renewable sources such as wind turbines and solar panels, as well as the local main utility grid, work together to power the microgrid. These sources work together to power the microgrid in both poor and good weather conditions. Although microgids are powered while being connected to both the main utility grid and renewable energy sources, in cases of storm weather, microgrids can detach themselves from the main grid and act as its own source of energy. Microgrids can work on their own due to being powered by the renewable energy sources.
Microgrids are commonly used in private buildings such as hospitals, universities and businesses. However, community based use is considered in this project due to its e ciency. Residents and building owners who are connected to the microgrid by
having either ownership of solar panels or access to other renewable energy sources will have access to microgrid energy through a converter. With this access, residents will be resilient to power outage during storms.
BUY IN POLICY
In case of state wide blackouts and power loss, our policy provides consumers with an option to buy in to the sustainable energy market, all proceeds go towards the Microgrid Energy Fund. The consumer will be guaranteed thirty years of backup energy for post storm situations when electricity is lost. This purchase also provides a reduction in their electricity bill alongside guaranteed electricity during blackouts.
MICROGRIDS
In cases of storm weather, loss of energy is a common outcome. However, when power is lost, it is difcult for people to perform daily essential functions such as charging their devices to turning on lights within buildings. Having access to power despite storm weather conditions is a form of resiliency that is crucial for people to perform daily tasks. In the case of power outages during a storm, microgrids can help as a form of resiliency. With the implementation of microgrids throughout communities, users will be able to have access to power despite being disconnected from the main power grid, all due to power emitted by renewable energy sources.
NJ COMMUNITY
Our design implementation rede nes the New Jersey community. This view gives an inside perspective of our communities. Within these living communities their will be all aspects of daily life. Community gardens and open space will be the focal point of public space to promote a connection to the natural environment and decrease the need for importing goods. By promoting the public interaction with nature a new appreciation for wildlife will evolve. Wetlands and forests will surround the individual communities to help with ooding related to sea level rise and natural occurrences. Being close to the natural environment will also connect people to nature through pathways and trails. A denser community decreases the need for transportation allowing for smaller roadways and more open space. The buildings shown are designated for residential and commercial space allowing members of the community to work and live within a close proximity
CONNECTION TO NATURE
Wetlands that surround the communities will help protect the community from ood water inundation. The wetlands will provide a barrier from sea level rise e ects and inland ooding during natural events like heavy rains. The wetlands will also help promote an increase in ora and fauna around the communities, while providing New Jersey with services like contamination and water ltration.
The population will be able to interact with the environment through board walks that are placed throughout the wetlands. These allow for community members to sh, walk or simply enjoy the view while experiencing nature. Access to water and natural land will be heavily promoted through education and accessibility of these areas.
Chelsea Kang, Eric Graber
FINAL PLAN
COASTAL RESILIENCY
The gure on the right demonstrates the nal plan of the community living design. The basis of the design was to condense the amount of people who live in a ood zone, into an area that is not prone to ooding. It consists of four residential buildings, two commercial centers for any pre-existing businesses and retail store, green space for parks and child’s play, and a community garden. On the outskirts of this island, there lies a space solely for wetlands that includes a wooden boardwalk that runs through the middle for people to experience the natural aspect of the community. On each of the buildings and above each of the parking lots, there are solar panels and solar panel canopies which help with energy usage among the people as well. In order to travel in and out of the community, marinas are o the side of the wetland area with roads that lead around the circumference of the circle and then go out to the coast.
e population density and land use diagram shows an abstracted representation of how the Resiliency group plans to create 45 dense living communities within New Jersey. e movement of communities is based on our prediction of the water inundation level shown in another diagram.
2018 represents New Jersey’s current living conditions. e population is dispersed throughout the entire state with small areas dedicated to natural habitat preservation. is diagram shows the capabilities of suburban sprawl when there is a lack of developmental planning.
2068 is when our implementations will begin to show a change in the dispersal of the population. rough regulations and permitting, development will be allowed within our designated “safety” zones. Production zones and compost sites will be in set locations.
SEA LEVEL RISE RISK MAP
COMPOST SITES
NATURAL HABITAT COMMUNITY
PRODUCTION ZONE AGRICULTURE
2118
2218
2118 continues the process of condensing New Jersey communities, production zones and compost sites.
2218 is our projected time frame for project completion. New Jersey will consist of 45 living communities with production zones and compost sites that correlate to each living community. Natural habitat will be a more prominent feature for New Jersey’s land use.
Introduction
Transportation
Open Space
History
7.1 7.2 7.3 7.4
7.1 Introduction
Goals
Transportation
Our goal is to create a seamless transportation network within New Jersey that will encourage a shift away from individual automobile use by establishing a more sustainable, multi-modal system as a viable alternative.
Habitat/Open Space
Our goal is to create a green belt through New Jersey by linking open spaces with transportation and other accessible options while using Superfund sites as our anchor points. While making these connections we also strive to magnify the di erent typologies of New Jersey through our landscapes.
People/Culture
It is our mission to attain a physical and mental connection between New Jerseys current citizens and our states rich cultural history. We aim to nd an equilibrium between our people and nature, with the emphasis that we live in the most densely populated state per square mile.
Molly Kinghorn, Zoe Orlino, Adriana Hall, Jess MacPhee, Zhaoxuan Wang, Alex Baldin, Michael Scott Bey, Dakota Wojcik, David Rigueur
Signage
As a group we decided that it would be best for the users of these green spaces to learn a little history about the sites they are visiting. So we implemented these speci c signs that will give a brief history and be able to connect back to the application that we share.
Suitability Axon
The suitability axonometric graphic is composed of suitable historic sites, open space areas, and train lines. For history, our group came together to decide the most import historical sites throughout the state. Open space based the suitability o of open space in less dense populated areas and highly contaminated sites. Transportation were able to propose a new system composed of multiple forms of transportation. This was based on existing major transition hubs, abandoned rail lines, and major highways.
Super Jersey Application
This app. can be downloaded on any mobile device and users can utilize this app for many di erent functions. First function being that the app gives you all the locations of the sites that are in this green/open space link. The app can also show you how far you have traveled and all of the policies that are in icted in those areas. When visiting historical sites, users can collect pins from visiting all historical sites for fun prizes. The goal is to allow for a virtual connection with easy accessibility.
7.2 Transportation
Our goal is to create a seamless transportation network within New Jersey that will encourage a shift away from individual automobile use by establishing a more sustainable, multi-modal system as a viable alternative.
Key
Bike Path
Monorail Line
The main reference used for our policy implementation strategy was the 2030 New Jersey Long-Range Master Plan which already had several strategies in place to improve travel across the state. Our main proposal was the creation of a new non-partisan transportation company, NJConnect, which would unite all public transportation services under a single entity in order to streamline operations. A higher emphasis would be placed on areas of higher population density and immediately surrounding areas to implement transit oriented development. By incentivising these municipalities to increase access to public transportation and bike routes, a network would begin to form in these areas surrounding higher population centers thus increasing connectivity to these surrounding areas.
To support the increased use of public transportation and alternative forms of travel apart from individual automobile use, we would ensure that all new projects would follow complete street guidelines. Under these guidelines, urbanized areas would have to include covered bike routes in cities to ensure that bicycle travel could be possible in any weather conditions. A city wide bike program would be implemented in major cities to further support this growing network of bike routes connecting to public transportation. In areas outside of these population centers, a rail to trail program would be developed in order to convert abandoned train routes to usable bike paths. Overall, this new focus on multi-city connections via public transportation and alternative travel would unify New Jersey over time until the entire state was connected via a multi-modal transportation network.
The app connects users to open space, history as well as transportation. This section of the application is provided to connect users to the transportation means of the NJ Connect program. It features mile tracking, bike rental capabilities, train schedules, train ticket purchases, as well information about attractions to visit. The app overall is a way to get connected to all parts of New Jersey.
Molly Kinghorn, Jessica MacPhee, Adriana Hall
Urban Bike Paths in Jersey City, NJ
Jersey City is a urban area that is located 3 miles from Ellis Island. Once dominated by manufacturing and industry, it is now a huge melting pot lled with people of many backgrounds and cultures. e main goal is to decrease the amount of tra c and gas emissions in Jersey City. A covered bike path speci cally designed for urban areas.
Each bike lane will vary in color based on the topic it leads you through (purple being history, green being open space, and blue being regular transportation route).
A collaboration with the Jersey City Mural Arts Program leads to a staple art piece throughout the transportation system.
Similar to the Journal Square Transportation hub, the tops of the bike path structure is covered in murals.
Journal Square will serve as the main transportation hub for Jersey City. Working with the Jersey City Mural Arts Program, the main building will be covered with murals. CitiBikes will be heavily provided at this hub to promote people to bike instead of drive.
In order to separate the bike lanes from the cars, a bioswale will be installed on each side of the bike path. This bioswale will actively collect water from both the street and the runo from the roof of the bike path structure.
Adriana Hall
Expanding the Citi Bike routes pushes for a decrease in car use and air pollution.
Henry Hudson Trail Connection
to the NY Waterway in Port Monmouth, NJ
The Raritan and Delaware Bay Railroad line opened rst in Port Monmouth. It was to provide a connection from the Raritan area to the Delaware Bay. The goal of this design is to provide a direct connection to various modes of transportation in the suburban wetland. A continuous and direct route via bike trail and boardwalk to connect the Henry Hudson Trail users and local residents to the NY Waterway Ferry.
Perspective view of the boardwalk where the Raritan and Delaware Bay Railroad
The proposed bike path through Compton Creek. The path starts at the Henry Hudson Trail and ends at the NY Waterway.
Complete Street design in front of NY Waterway entrance. Users may rent bikes and have a safe designated commute route.
Jessica MacPhee
The remains of the Raritan and Delaware Bay Railroad line in the middle of Compton Creek, Port Monmouth.
line existed.
Open Space
Our goal is to create a green belt through New Jersey by linking open spaces with transportation and other accessible options while using Superfund sites as our anchor points. While making these connections we also strive to magnify the di erent typologies of New Jersey through our landscapes.
1. Mansfield Trail Dump
2. Combe Fill North Landfill
3. Krysowaty Farm
4. Wilson Farm
5. Sussex Branch Trail
6. Lower Maurice River Watershed
7. Pine Barrens/Base River State Forest
8. Great Egg Harbor Watershed
9. Sourlands
10. Raritan and Passaic River Headwaters
11. Barnegat Lighthouse State Park
12. Washington Crossing State Park
Recreation
13. Plumsted Township Strip
14. Nascolite Corp.
15. Fort Mott State Park
16. Cape May
17. Round Valley Recreation Area
18. Wharton State Forest
19. Cosden Chemical Coatings Corp.
20. Ventron/Velsicol
21. Glen Ridge Radium Site
22. Delaware Water Gap National Recreation Area
Bring Back To Nature
23. AO Polymer
24. Metaltec/Aerosystem
25. Naval Air Engineering Center
26. Former Kil-Tone Company
27. Vineland State School
28. Woodland Route 72 Dump
29. Sherwin- Williams/Hilliards Creek
30. Iceland Coin Laundry Area GW Plume
Lighting required for paths
Coverings on bike paths for year round enjoyment
Green Spaces relating to NJ history require signage about the site
Enhancing accessibility to open space in appropriate manner
connect
Non-Native Plantings
Redesigned landscapes shall exemplify local characteristics
The goals is to create policies that maintain the order of existing parks as well as promoting new open spaces in order to link them to each other. Superfund sites will be revitalized into new green spaces. The current actions may include remedy operations, maintenance and monitoring, as well as accommodation for users and the installation of appropriate accessibility.
We plan to bring back the superfund sites in a way that ampli es the characteristics the Garden State should emulate, which include the diverse types of landscapes. Landscapes must represent the area they are located in through their plantings, linkages, and accommodations.
For instance, open spaces with tree lines provide an optimal landscape for bikers to see and ride through while traveling. The main focus for these policies are to bringing back the characteristics that de ned the Garden State while enhancing the connection between each of the spaces.
Through the Open Space application, users can located the nearest park, trail, path, or green space near them based on the three categories of “Bring Back to Nature”, “Recreation”, and “ Preservation/Trail”.
Learn how revitalized sites, like Hillards Creek, transformed from a superfund site into the beautiful destination it is now!
BACKGROUND:
The Ventron/Velsicol site is located in the boroughs of Wood-Ridge and Carlstadt, New Jersey. Process waste, containing mercury and other contaminants was disposed of on the 40-acre property and to Berry’s Creek. Soils, groundwater, surface water and sediments are contaminated. Osite sediments, surface water and biota are also contaminated.
GOALS:
Berry’s Creek Study Area (BCSA) is
of the
Remediation the superfund site and redesign a gathering space for surrounding community and residences.
in
The site is within an urban watershed that is part of the Hackensack River Meadowland and was home to signi cant industry and three super-fund sites. This area is within one of the most populous and urbanized regions of North America.
Main Perspective - Night view on the boardwalk Native wetland grasses and meadow are grown surround by boardwalk, and the natural evolution process is initiated inside this site. Storm water will be ltrate and distribute into lower level wetland, also can be use for irrigation surrounding plants
Perspective of Plan
After remediation, an open space place for surrounding communities will be designed. Boardwalks are used to link the wetlands for exercise and recreation.
Perspective -Boardwalk View
Wooden platform style boardwalk as a signature characteristic for this new open space. Implementing Super Jersey Application system inside the park, easily assessable on any smart phone.
Zhaoxuan Wang
The
part
Ventron/Velsicol Superfund Site located
bergan County, NJ.
Time of Site
Redefining the Garden State Landscape
in Plumsted Township
Plumsted Township contains the highest amount of superfund sites in New Jersey - including Friedman Property, Goose Farm, and Hopkins Farm. By the 1990s, the three sites were revitalized and marked for no further actions.
GOALS
Provide a de nition for what New Jersey should look like as a Garden State
IMPLEMENTATION STRATEGY
Create a planting palette for di erent types of landscapes and require superfund site revitalization
Site
Arts & Cultural
1. James Rose Center - Ridgewood, NJ
2. Hinchli Stadium - Paterson, NJ
3. Newark Museum - Newark, NJ
4. African American Heritage Museum - Newtonville NJ
5. Roebling Muesum - Roebling, NJ
Historic District/Buildings
6. Cape May Historic District - Cape Map, NJ
7. Georgian Court - Lakewood, NJ
8. Paulsdale - Mount Laurel, NJ
9. Batsto Village - Hammonton, NJ
10. Windsor, New Jersey
11. Cooper Street Historic District - Camden, NJ
12. Millstone Historic District - Millstone, NJ
13. Mountain Lakes, NJ
7.4 History War
14. New Jersey State Korean War Memorial- Atlantic City, NJ
15. New Jersey World War II Memorial - Trenton, NJ
16. New Jersey Vietnam Museum and Education Center - Homdel, NJ
17. World War I Memorial - Atlantic City, NJ
18. Fort Lee Historic Park - Fort Lee, NJ
19. Battleship NJ - Camden, NJ
20. Monmouth Battle eld - Freehold, NJ
21. Old Barracks Museum - Trenton, NJ
22. Hangar No. 1 Lakehurst Naval Air Station - Lakehurst, NJ
23. Princeton Battle eld - Princeton, NJ
Industrial/ Post-Industrial
24. Paterson Great Falls Historic National Park - Paterson, NJ
25. Thomas Edison National Historic Park - West Orange, NJ
26. The Red Mill- Clinton, NJ
27. Sterling Hill Mining Museum - Odensburg, NJ
28. Hackensack Water Works - Weehawken, NJ
Lighthouses
29. Absecon Lighthouse- Atlantic City, NJ
Registered Sites shall have appropriate uses taylored upon age, location, sustainability, etc. to explore new public alternatives
30. Barnegat Lighthouse- Barnegat Light, NJ
31. Cape May lighthouse- Cape May Point- NJ
32. East Point Lighthouse- Heislerville, NJ
33. Finns Point Rear Range Light - Pennsville, NJ
34. Hereford Inlet Lighthouse- North Wildwood, NJ
35. Sandy Hook Lighthouse- Highlands, NJ
36. Sea Grit Lighthouse- Sea Grit, NJ
37. Tinicum Rear Range Lighthouse - Paulsboro, NJ
38. Tuckerton Seaport & Baysmens Museum - Tuckerton, NJ
39. Twin Lights of Navesink - Highlands, NJ
3+ historical sites within a mile connected with interactive path
Must have appropriate accomadations and services tending to all visitors
Agriculutre/ Sustaibility
40. Whitesbog Village (Free Admission) - Pemberton, NJ
41. Duke Farms
42. Palisades Interstate Parkway - Bergen, NJ
Providing proper facilities & programs to ecourage youth & group oriented visits
State Parks/ Government Buildings
43. Washington Crossing Historic Park - Hopewell Twp, NJ
44. New Jersey State House (Free Admission) - Trenton, NJ
45. Drumthwacket Foundation (Free Admission) - Princeton, NJ
46. Hamilton Park - Weehawken, NJ
All Registered Historical Sites having displays/monuments to further educating & connecting the public
47. Washington Rock State Park- Green Brooke NJ
48. High Point State Park-NJ Skylands
49. Cape May Wetlands State Natural Area - Cape May, NJ
is map was composed of a group of historical sites deemed most important within our connectivity group. We felt these sites created a very broad and diverse historic experience throughout the state. e forty-nine sites chosen, were able to be broken down into seven categories. We felt these categories embodied exactly what these sites represented. Each category has a corresponding icon which will show up on our virtual application and on our way nding signage statewide.
Historical site to have intended recreational uses
Historical Preservation goals that coincide with all apsect of enviornment, ecological presevervation ,& sustainability to ehnance experience
Michael Scott Bey, David Rigueur, Alex Baldwin
Trenton Historic Walk
The Old Barracks Museum, New Jersey State House, New Jersey State Library, and the New Jersey State Museum are all located along W State Street in Trenton forming this natural system of history.
Each building located in this system creates an opportunity for a cohesive experience transitioning through decades of American History.
The main goal is to bring the history into the streets to allow for a more accessible learning experience through outdoor exhibits and interactive stations for all ages.
Within the sidewalk, purple paint indicates the continuation of the historic walk. Along the walk, part of the museum is brought outside through outdoor exhibits.
With the expectations of more technological advances, the idea of implementing a virtual reality screen to “go back in time” becomes a reality.
Another form of interaction that is used are touchscreen bars to allow for groups of people to interact with at once through these information systems.
Along with exhibits, statues are implemented to allow for physical representation through structure that kids can play on.
Michael Scott Bey
New Jersey State Library
New Jersey State Museum
Old Barracks Museum
New Jersey State House
Site Plan
Context: Trenton, NJ
Policies
Cape May Point Historic Preservation
The primary focus of this design intervention is to truly explore alternative ways to connect people to historical landmarks and create new ways of experiencing the WWI & WWII historical grounds by preserving the sites. In doing this, we will further educate by physically connecting all of the New Jersey public to our states history and popular local attractions within a certain mile radius This design explores a coastal resiliency tactic utilizing a living break water system that will encompass an ecoautonomous coastal infrastructure to mitigate sea level rise.
Cape May Point, NJ
Cape May Lighthouse, Cape May Point State Park, Fire Control Watch Tower No. 23, Battery 223, SS Atlantus
Coastal Preservation Perspective
Inventory Maps
Case Studies
8.1 8.2
Inventory Maps 8.1
Map of N.J. Bus Stops and Roads
The map being portrayed shows the layout of the New Jersey bus stops. The northeast and southwest areas of New Jersey contain many more bus stops than other parts. These areas are located closer to the two major cities New York City and Philadelphia. The overall trend that seems to persist in the GIS data is the denser and more populated areas contain many more bus stops. The bus frequency between stops varies throughout the day. In the morning the bus comes by most stations at a higher frequency than later in the day. Although, in some areas of New Jersey the bus stops only twice a day.
Certain parts of New Jersey are lacking in bus stops. The bus system provides people without cars the ability to travel. Busses connect people together. They also reduce the amount of cars on the road creating less congestion and a more sustainable environment. People in certain areas of New Jersey are becoming increasingly isolated due to the lack of public transportation. These places are typically rural areas. The two places that lack the most bus stops are the New Jersey Highlands and the New Jersey Pine Barrens. Places that are lacking bus stops would benefit by having more available. The cities would also benefit if the bus systems became fully electric, reducing their carbon footprint, and promoting cleaner air.
Water Quality Impairment Risks for Watersheds
Water Quality Impairment Risks for Watersheds
Maintaining a good water quality in New Jersey is essential to preserving our regional resources and natural lands. However, with this data we can see that the water impairment quality of the watersheds in New Jersey are particularly high. In this dataset, the rating ranges from medium to very high regarding the risk of damage to watersheds. The map shows the overall risk of water quality impairment for fth-level watersheds which are currently under development. What determines the risk levels for these watersheds is the measured amount of toxins, pH, soil quality, nutrients in the water, and numerous other factors. If the watershed does not meet ambient water quality standards pertaining to its designated use after elimination of point source pollution through applicable technology it is considered impaired. In other words, this map shows that these watersheds are struggling to meet the water quality standards. The areas with the highest risk level are located on the western areas of the state, while the eastern area contains the medium levels. It is essential to note that although these areas are being worked on, it does not mean that the water quality will be xed in short periods of time and that is something to take into consideration when thinking about planning in those areas.
Maintaining a good water quality in New Jersey is essential to preserving our regional resources and natural lands. However, with this data we can see that the water impairment quality of the watersheds in New Jersey are particularly high. In this dataset, the rating ranges from medium to very high regarding the risk of damage to watersheds. The map shows the overall risk of water quality impairment for fth-level watersheds which are currently under development. What determines the risk levels for these watersheds is the measured amount of toxins, pH, soil quality, nutrients in the water, and numerous other factors. If the watershed does not meet ambient water quality standards pertaining to its designated use after elimination of point source pollution through applicable technology it is considered impaired. In other words, this map shows that these watersheds are struggling to meet the water quality standards. The areas with the highest risk level are located on the western areas of the state, while the eastern area contains the medium levels. It is essential to note that although these areas are being worked on, it does not mean that the water quality will be xed in short periods of time and that is something to take into consideration when thinking about planning in those areas.
Case Study 8.2
Michael Scott Bey
The Princeton merger was a long awaited feat for the two municipalities of Princeton Township and Princeton Borough. The merger has the possibility of providing an alternative solution to help manage the immense amount of municipalities in the state of New Jersey. The Princeton consolidation goes back as far as the 1950s. The discussion began to merge municipalities to allow for sharing services. It wasn’t until November of 2011 when the merger was approved.
The two municipalities had to vote to determine for or against the consolidation. Out of 12,000 residents, the Princeton Borough tallied 1,385 votes for the merger and 902 against. Out of 16,000 residents, the Princeton Township tallied 3,542 votes for and 604 against. After its approval, the consolidation was o cially in e ect on January 1, 2013. It was projected for the merger to save 3.2 million dollars as a result as well as the lay o of 15 government jobs and 9 o cers.
Aside from the loss of jobs, another concerns consist of the cost of transitioning and the longevity of services such as a ordable housing and human services departments. The largest misconception with consolidating municipalities was the drop in property tax which is near impossible due to the overall tax growth as a state.
Taking a look ve years later the tax rate did not decrease, but the merger allowed for it to slow. According to NJ Spotlight analysis of tax data before the merger the rate of tax growth was at 20%. It is now at 10%. According to the 5 year period leading up to the merger vs 5 years after. (2013-2017) In addition to slowing tax growth, the positives outweigh the negatives. The rate of employment has went up. Public services have also been to work more e ciently. Both standard services, such as snow plowing, and emergency services now aren’t bound by jurisdictional boundaries.
Housing services, health departments, and senior resource centers are all now able to work together. Liz Lempert, mayor of Princeton, was very much for the consolidation, as well as former mayor of Princeton township Chad Goerner. Lempert mentions the important steps before merging is getting used to sharing services between the two municipalities.
Princeton Borough and Princeton Township shared services before the merger as well as regionalizing the school district.
Lempert believes what happened with Princeton sets a great example for the future of New Jersey municipalities. Consolidation services is a great start to allow for the disconnected state to work better in unison.
Lawmakers and people in higher positions of power all would love to consolidate a third of New Jersey as they nd it as a potential to cut the substantial tax growth in the state of New Jersey. This idea, along side more than sixty other ideas to improve New Jersey, has been thought up by a very powerful panel led by state Senate President Steve Sweeney. The more radical idea of Sweeney and his panel is to merge all municipalities with a population under 5,000 to adjacent towns. If this was the case, six counties would be forced to merge more than half of its municipalities together. The only county that would not be a ected would be Passaic County. Overall the idea is to cut down the cost of government which will lead to the decrease in tax growth.
Wenonah boroughGloucester
West Amwell township Hunterdon
West Cape May borough Cape-May
Rethink
Resiliency
Connectivity
Compiled by Giovanni Caputo
Citations
9.1 Inventory
Data Sources for Population Density
New Jersey public, private and charter school point locations (2017)|NJDEP (2018)
Govt_census_block_2010|US Census Bureau (2010)
Median_Household_Income|ESRI (2018)
Libraries, Income, and Literacy Rates|ESRI (2018)
Public Solar Facilities in New Jersey|ESRI (2017)
Solar Energy Produced By County|ESRI (2017)
Data Sources for Agriculture
New Jersey Farmland Preservation | NJDA (2016)
New Jersey Contaminated Sites | NJOGIS (2018)
Polluted Streamsheds | NHD (2002)
Data Sources for Contamination
• U.S Forest Service Water Quality Impairment Risks | Mila Alvarez, U.S. Endowment for Forestry and Communities (2017)
• NJOGIS Brown eld Sites in New Jersey | NJ Department of State, O ce for Planning Advocacy, Brown elds Redevelopment Task Force (2013)
• NJOGIS Groundwater Contamination | NJDEP, OIRM, Bureau of GIS (2018)
NJDEP Vernal Pools and Potential sites | NJDEP (2002)
NJDEP Natural Heritage Habitats | NJDEP (2018)
NJDEP Vernal Pools and Potential sites | EPA, NJDEP (2018)
NJDEP Natural Heritage Habitats | NJDEP (2014)
Conservation Focal Areas in the Atlantic Coast Region | NJDEP (2018)
Conservation Focal Areas in the Delaware Bay Region | NJDEP (2018)
Conservation Focal Areas in the Marine Region | NJDEP (2018)
Conservation Focal Areas in the Piedmont/Inner Coastal Plain Region | NJDEP (2018)
Conservation Focal Areas in the Pinelands Region | NJDEP (2018)
Conservation Focal Areas in the Skylands Region | NJDEP (2018)
Landscape Project Endangered Species Habitat, Rank 2 | NJDEP (2018)
Landscape Project Endangered Species Habitat, Rank 3,4,5 | NJDEP (2018)
Data Sources for Transportation
Speci c lines of New Jersey transit rail lines | NJ O ce of GIS Open Data and NJ Transit (2016-2018)
Rail lines along the MTA LIRR Line | No Acknowledgements (2015)
Location of New York Subway routes and Staten Island Rail | Center for Urban Research at the Graduate Center, CUNY (2016)
Detailed Rail Routes in Pennsylvannia | No Acknowledgements (2015)
2018 Septa Bus Stops | Septa GIS (2018)
NJTransit Bus Stops | NJ Transit (2017)
Bus Stops in the State of Delaware | FirstMap@DE (2017)
Su olk County, Long Island Bus Stops | SCOpenData (2017)
Su olk County, Long Island Bus Stops | Department of Transportation (2017)
Bike and Trail Routes within New Jersey | NJTPA, NJDOT, NJtransit (2015)
NJ Recreational State Park Trails (hiking,biking,etc...) | NJDEP (2016)
New jersey Annual Average Daily Tra c | NJDOT (2017)
Data Sources for Geography
DGS04-6 Bedrock Geology of New Jersey | NJDEP, DWSG (2007)
NJDEP Elevation Contours for the State of New Jersey | NJDEP, BOG (1987)
Shoreline Typing, New Jersey | NJOGIS (2016)
NJDEP Species Based Habitat, Landscape Regions (Version 3.3, 20170509) | NJDEP, DFW, ENSP (2017)
New Jersey Fault Lines | NJOGIS (2014)
Current Wind and Weather Conditions | ESRI, NOAA (2014)
DGS05-1 Selected Sand, Gravel and Rock Sur cial Mining Operations in New Jersey | NJDEP, DWSG (2006-2007)
Data Sources for Water
Known Contaminated Site List for New Jersey | NJ Department of Environmental Protection (NJDEP) (2012)
NA Beaches Developed | DataBasin (2015)
National Flood Hazard Layer | Federal Emergency Management Agency (2018)
NJDEP Water Supply Planning Areas of New Jersey | New Jersey Department of Environmental Protection (NJDEP), O ce of Natural Resource Restoration (ONRR) (1996)
NOAA Coastal Services Center Sea Level Rise Data: 1-6 ft Sea Level Rise Inundation | NOAA’s Ocean Service, Coastal Services Center (CSC) (2012)
NOAA Coastal Services Center Sea Level Rise Data: Current Mean Higher High | NOAA’s Ocean Service, Coastal Services Center (CSC) (2012)
Data Sources for Green Spaces
NJ GIS | NJDEP: NJ O ce of GIS Open Data and NJ transit ISO 19139 Geographic Information | (2007)
NOIRM/BGIS | The O cial Web Site for The State of New Jersey, New Jersey Population | (2018)
NJ DEP | New Jersey Department of Environmental Protection & Preservation | (2018)
Green Acres Program | NJDEP, Green Acres Program | (2018)
NJCMP | NJDEP, New Jersey Coastal Management Program | (2018)
Data Sources for Land Use
National Land Cover Database 2011 (NLCD 2011) | U.S. Geological Survey, Multi-Resolution Land Characteristics (MRLC)
Consortium (2011)
Urban Areas | NJDOTGIS (2017)
Public Housing Buildings | Federal User Community (2018)
Housing Unit Density Map, NJ | Irfanafsar1 (2016)
Urban Enterprise Zones (UEZ) of New Jersey | NJOGIS (2018)
Revitalization Areas | Federal User Community (2018)
Citations
9.2 Case Study
Chapter Page
• “Opinion: Marking Time Until The Revised State Plan Can Be Adopted.” PlanSmart NJ. Web. Accessed Dec. 2018. www. plansmartnj.org/opinion-marking-time-until-the-revised-state-plan-can-be-adopted/#more-3990.
State Plan (1934) - Nina Petracca
• McCarter, Thomas. Report, Local Government Plan Commission. Self Contained, 1934
• New Jersey State Planning Board, State Planning in New Jersey 1934-1944 Final Report, Self Contained, Trenton. 1944
State Plan (1951) - Molly Kinghorn
• CHAZZ Partners. “A Brief History of Wharton State Forest.” A Brief History of Wharton State
• Forest - Micks Pine Barrens Canoe and Kayak Rental. Web. Accessed Sep. 2018. www.mickscanoerental.com/history.html.
• “Chronology.” The O cial Web Site for The State of New Jersey, NJDEP/OIRM/BGIS. Web. Accessed Sep. 2018. www.nj.gov/ state/planning/spc-research-chronology.html.
• Csebestyen, and Mgryczon. “O cial Site of The State of New Jersey.” The O cial Web Site for The State of New Jersey, NJDEP/ OIRM/BGIS. Web. Accessed Sep. 2018. www.nj.gov/nj/about/history/short_history.html.
• “File:New Jersey Turnpike Shield.svg.” Category:Heidentor (Carnuntum) - Wikimedia Commons, Wikimedia Foundation, Inc. Web. Accessed Dec. 2018. commons.wikimedia.org/wiki/File:New_Jersey_Turnpike_Shield.svg.
• Happening, Ocean. “Garden State Parkway Logo, Ocean County, Ocean Happening.” Flickr, Yahoo!, 9 Aug. 2011. Web. Accessed Dec. 2018. www. ickr.com/photos/64552513@N08/6024859054.
• Magazine, Skylands Visitor. “Worthington State Forest.” Rockaway River in New Jersey. Web. Accessed Sep. 2018. www. njskylands.com/pkworthington
• “New Jersey Division of Parks and Forestry.” Wikipedia, Wikimedia Foundation, 1 Mar. 2017. Web. Accessed Dec. 2018. en.wikipedia.org/wiki/New_Jersey_Division_of_Parks_and_Forestry.
• “PLANNING.” GSP History. Web. Accessed Sep. 2018. www.njta.com/gsphistory/index.html.
State Plan (1977) - Jessica Thorning
• Feller, Milton A. A Judicial Analysis of New Jersey’s New Municipal Land Use Law. Federation Planning Information Report, vol. XII, no. 1, New Jersey Federation of Planning O cials, Spring 1977.
• Ho man, Barry M. The De nitions in the Municipal Land Use Law. Federation Planning Information Report, vol. XII, no. 2, New Jersey Federation of Planning O cials, Summer 1977.
• Spinale, John V. New Jersey and the Horse. Federation Planning Information Report, vol. XII, no. 3, New Jersey Federation of Planning O cials, Autumn 1977.
• Maslow, Harry A. A Book of Forms. Federation Planning Information Report, vol. XII, no. 4, New Jersey Federation of Planning O cials, Winter 1977.
State Plan (2001) - Lydia Zoe
• State of New Jersey Department of State, The New Jersey State Development and Redevelopment Plan, Executive Summary. Web. Accessed 1 Oct. 2018. https://www.nj.gov/state/planning/docs/execsumm030101.pdf
• State of New Jersey Department of State, The New Jersey State Development and Redevelopment Plan Web. Accessed 1 Oct. 2018 https://www.nj.gov/state/planning/docs/stateplan030101.pdf
• Piech, Dan. “Jersey Rising.” VAST., Jersey City, New Jersey, 29 Mar. 2016, https://vastphotos.com/photo/jersey-rising-by-danpiech.
Historic Preservation O ce - Axel Gonzalez
• “Archaeological Survey & Inventory.” Washington State Department of Archaeology & Historic Preservation (DAHP), Dahp. wa.gov, Web. Accessed 1 Oct. 2018. dahp.wa.gov/archaeology/archaeological-survey-inventory.
• “Historic Structure Reports & Preservation Plans: A Preparation Guide – Second Edition.” Njht.org, Web. Accessed 1 Oct. 2018. www.njht.org/dca/njht/resources/publications/HSR-PP-Guidelines-forweb.pdf.
• “Tax Incentives for Historical Preservation.” The O cial Web Site for The State of New Jersey, NJDEP/OIRM/BGIS, Web. Accessed 1 Oct. 2018. www.nj.gov/dep/hpo/3preserve/itc.htm.
FEMA - Daniel Ilkow
• Department of Homeland Security. FEMA. Region II. New York: DHS. 2018. Web. 4 October 2018. https://www.fema.gov/ region-ii-nj-ny-pr-vi-0
O ce for Planning Advocacy - Thomas Kastner
• New Jersey O ce of Planning Advocacy, New Jersey State Department. Web. Accessed 10 Oct 2018. nj.gov/state/planning/ index.html.
NJDEP - Jessica MacPhee
• “New Jersey Department of Environmental Protection.” NJDEP. Web. Accessed 1 Oct. 2018. http://www.state.nj.us/dep.
NJDOT - Amanda Liefer
• NJDOT Web Development. “New Jersey Department of Transportation.” NJ Department of Environmental Protection (NJDEP), O ce of Information Resources Management (OIRM), Bureau of Geographic Information Systems (BGIS), 2018. Web. Accessed 2 Oct 2018. www.state.nj.us/transportation/.
Farmland Preservation Program - Chelsea Kang
• Adminsadc. The O cial Web Site for The State of New Jersey, State of New Jersey Department of Agriculture State Agriculture Development Committee. Web. Accessed 1 Oct 2018. www.nj.gov/agriculture/sadc/farmpreserve/.
• “Apple Trees at Schober Orchards .” State NJ, State of New Jersey Garden State Preservation Trust, Monroe Township,
Gloucester County , www.state.nj.us/gspt/photo_gallery.htm.
• Zinke, Ryan. “Land and Water Conservation Fund.” U.S. Department of the Interior, 21 Sept. 2017. Web. Accessed 1 Oct. 2018 www.doi.gov/lwcf.
• Miner, Nick. “The Land and Water Conservation Fund.” The Land and Water Conservation Fund. Web. Accessed 1 Oct. 2018 www.lwcfcoalition.com/.
• Hodder, Sam, and Emily Burns. “Obama Calls for Action on LWCF.” Save the Redwoods League, 6 Nov. 2015. Web. Accessed 1 Oct. 2018 www.savetheredwoods.org/blog/futures/obama-calls-for-action-on-lwcf/.
• Gra , Michael, et al. “LWCF to Senators: Don’t You Forget about Me.” POLITICO, POLITICO, 27 July 2018. Web. Accessed 1 Oct. 2018 www.politico.com/newsletters/morning-energy/2018/07/27/lwcf-to-senators-dont-you-forget-about-me-298877.
• NJDEP. State Parks and Forests. 2017, Web Accessed 1 Oct. 2018. webcache.googleusercontent.com/ search?q=cache:bIWrKu31H1gJ:www.nj.gov/dep/dsr/trends/pdfs/parks.pdf+&cd=7&hl=en&ct=clnk&gl=us.
• “An Invitation to Explore New Jersey’s State Parks, Forests, Recreation Areas and Historic Sites.” State of New Jersey Department of Environmental Protection, NJ Department of Environmental Protection (NJDEP), O ce of Information
Resources Management (OIRM), Bureau of Geographic Information Systems (BGIS), 2018, Web Accessed 1 Oct. 2018. www. state.nj.us/dep/parksandforests/parks/index.html.
• New Jersey Conservation Foundation. Garden State Greenways, 2012, Web Accessed 1 Oct. 2018. www.gardenstategreenways. org/index.htm.
Green Acres - Jonathan Connor
• Blair, Andy. “Jersey Central Railroad Terminal and Morris Canal from the Air. Jersey City. 1955.” Flickr, Yahoo!, 7 Nov. 2009, Web. Accessed 10 Dec. 2018 www. ickr.com/photos/wavz13/4082278677.
• EMMA LAZARUS; FAMOUS POEM :”THE NEW COLOSSUS”, Web. Accessed 10 Dec. 2018 www.libertystatepark.com/ history.htm.
• Team, Motor1.com. “Mayor Not Supportive of Jersey City as US GP Host.” Motor1.Com, Motor1.Com, Edition: USA / Global, 5 May 2010, Web. Accessed 10 Dec. 2018. www.motor1.com/news/21514/mayor-not-supportive-of-jersey-city-as-us-gp-host/.
Zoning - Zhaoxuan Wang
• “Zoning Map of New Brunswick.” The City of New Brunswick, New Brunswick, 23 Oct. 2017. Web. Accessed 2 Oct. 2018. thecityofnewbrunswick.org/planninganddevelopment/wp-content/uploads/sites/8/2014/10/Zoning-Map-10-23-2017.pdf.
“1989 Zoning Map of Highland Park, NJ.” Borough of Highland Park , 1989. Web. Accessed 2 Oct.2018. www.hpboro.com/ DocumentCenter/View/1933.
Blue Acres Program - David Rigueur
• The O cial Web Site for The State of New Jersey, NJDEP/OIRM/BGIS, Web. Accessed 27 Nov. 2018. www.nj.gov/dep/cmp/ index.html.
• “New Jersey Population 2018.” Total Population by Country 2018, Web. Accessed 5 Oct. 2018. worldpopulationreview.com/ states/new-jersey-population/.
• “New Jersey Department of Environmental Preservation.” NJDEP, Web. Accessed 5 Oct. 2018. https://www.nj.gov/dep/.
• “O ce of Coastal and Land Use Planning.” The O cial Web Site for The State of New Jersey, NJDEP/OIRM/BGIS, Web. Accessed 27 Nov. 2018. www.nj.gov/dep/oclup/.
Princeton Merger - Michael Scott Bey
• Adubato, Steve. “The Merger, Revisited: The Consolidation of Princeton, Four Years Later.” New Jersey Monthly, 29 Sept. 2017, Web Accessed Oct 1, 2018. njmonthly.com/articles/towns-schools/steve-adubato-only-in-nj/the-merger-revisited-consolidationprinceton/
• Reitmeyer , John. “Princeton Merger Pays O in Property-Tax Slowdown, Better Services.” NJ Spotlight, 7 Aug. 2018, Web Accessed Oct 1, 2018. www.njspotlight.com/stories/18/08/06/princeton-merger-pays-o -in-property-tax-slowdown-betterservices/
• Efthim, Rosi. “If You Live in One of These Towns, You Might Have to Be Merging with Some Other NJ Town.” Blue Jersey, 21 June 2018, Web Accessed Oct 1, 2018. www.bluejersey.com/2018/06/if-you-live-in-one-of-these-towns-you-might-have-to-bemerging-with-some-other-nj-town/
• Davis, Tom. “Eliminating 191 Towns? More Tolls? Look At What NJ Could Do.” Stone Mountain-Lithonia, GA Patch, Patch, 23 June 2018, Web Accessed Oct 1, 2018. patch.com/new-jersey/west eld/more-tolls-look-what-nj-could-do-you-may-not
• Coughlin, Kevin. “Urge to Merge?” Morristown Green, 20 Sept. 2013, Web Accessed Oct 1, 2018. morristowngreen. com/2013/09/20/urge-to-merge-morris-township-joining-regional-court-are-shared-services-with-morristown-next/
• Arco, Matt. “New N.J. Toll Roads? Public Worker Bene t Cuts? Forcing Towns to Merge? It’s All Being Discussed.” NJ.com, NJ Advanced Media, 20 June 2018, Web Accessed Oct 1, 2018. www.nj.com/politics/index.ssf/2018/06/top_democrats_tax_policy_ review_to_recommend_cuts.html
Meadowlands - Ti any Nguyen
• LLC Web Developers Studio. “New Jersey Sports and Exposition Authority” Meadowlands Environment Center Web. Accessed 1 Oct. 2018. | NJSEA, www.njsea.com/.
Highlands - Yat Chan
• United States, Congress, “Highlands Regional Master Plan.” Highlands Regional Master Plan, State of New Jersey, Highlands Water Protection and Planning Council, 2008.
• “Horse Pond Mountain.” HT NJ 1: Passaic County 511 To Route 23, NYNJ Trail Conference, www.nynjtc.org/book/ht-nj-1passaic-county-511-route-23.
Pine Barrens - Zoe Orlino
• Shughes. The O cial Web Site for The State of New Jersey, Web. Accessed 1 Oct. 2018. NJDEP/OIRM/BGIS, www.nj.gov/ pinelands/about/.
• “Groundwater and Aquifers.” Fire in the New Jersey Pine Barrens, Pine Barrens Fire - Pinelands Preservation Alliance, Web. Accessed 2 Oct. 2018. www.pinelandsalliance.org/ecology/water/groundwaterandaquifers/
• “New Jersey Pinelands Land Capability Map (Management Areas) .” Pine Barrens Overview, Web. Accessed 2 Oct. 2018. www. pinelandsalliance.org/protection/overview/.
• “The Kirkwood-Cohansey Aquifer.” Save The Source , Pinelands Preservation Alliance , Web. Accessed 2 Oct. 2018.
savethesource.org/about-the-aquifer/.
Trust for Public Land - Eric Graber
• “Website Home.” The Trust for Public Land. Web. Accessed 10 Oct. 2018. http://www.tpl.org.
• Monkman, Jerry, and Marcy Monkman. “People in a Field .” The Trust for Public Land, Web. Accessed 12 Oct. 2018. www.tpl. org/our-work/vermont#sm.000wai8nf1afkekk110rrtlh2drjk.
NJ Future - Alexander Baldwin
• “Smart Growth, A ordable Housing, Sustainable Development, Transit Oriented Development, State Planning. “ New Jersey Future, Web Accessed 29, October 2018. https://www.njfuture.org/
• “Joshua Burd.” Real Estate NJ, Web. Accessed 12, November 2018. https://re-nj.com/atlantic-city-3-0-riding-high-from-newinvestment-the-iconic-resort-town-is-charting-a-new-future/
• “The Cultural Landscape Foundation (TCLF).” Freeway Park: Past, Present, and Future? The Cultural Landscape Foundation, Web. Accessed 1 Oct. 2018. www.tclf.org/.
• “Courtesy The Cultural Landscape Foundation.” kid101, 2o7fsh4anuayrnrhe3us6v71-wpengine.netdna-ssl.com/wp-content/ uploads/2018/08/Courtesy-The-Cultural-Landscape-Foundation..jpg.
• “The Cultural Landscape Foundation (TCLF).” Freeway Park: Past, Present, and Future? The Cultural Landscape Foundation, www.tclf.org/.
• “Fountain Place Dallas.” Https://Urbanmilwaukee.com/Pressrelease/Uwm-Launches-Architectural-Photo-Exhibition-withFree-Talk-Tours-on-Nov-2/, urbanmilwaukee.com/wp-content/uploads/2017/10/Fountain-Place-Dallas-TX-2013.-Courtesy-TheCultural-Landscape-Foundation-photograph-Alan-Ward.3.jpg.
Urban
Land Institution - Smerliene Rodriguez
• “Home.” Urban Land Institute, 2018. Web. Accessed Sep.2018. www.uli.org/.
• “Troy’s Van Cleve School.” My Dayton Daily News, Dayton, 10 Mar. 2017, Accessed Nov 28 2018. www.mydaytondailynews.com/ rf/image_medium/Pub/p8/MyDaytonDailyNews/2017/03/10/Images/newsEngin.18053686_ddn031617nrnewsstory.jpg
• “Forest.” PNG ALL, 25 July 2018, Forest PNG Image. Accessed Nov 28 2018. http://www.pngall.com/wp-content/uploads/1/ Forest-PNG-Image.png
Map Data
• “53 S Bellevue Ave, Atlantic City, NJ.” Google Search, Google, 2018. Web. Accessed Nov. 2018. www. google.com/maps/place/53+S+Bellevue+Ave,+Atlantic+City,+NJ+08401/@39.35526,-74.443884,17z/ data=!3m1!4b1!4m5!3m4!1s0x89c0ee663aec8e83:0xb74d394332778038!8m2!3d39.35526!4d-74.44169.
• New Jersey Real Estate. Zillow. Web. Accessed 14 Oct. 2018. https://www.zillow.com/homes/for_sale/NJ/fore_lt/pmf,pf_pt/40_ rid/globalrelevanceex_sort/42.313877,-69.559937,37.775056,-79.887085_rect/6_zm/
• Kenneth, Miller. “Sea Level Rise in New Jersey Fact Sheet.” Sea Level Rise in New Jersey Fact Sheet, 2018, www.margate-nj. com/sites/margatenj/ les/ le/ le/kenmillersealevelfactsheet.pdf. Accessed 11 Dec 2018.
• Topographic Elevation Contours for New Jersey (1:100,000 Scale) | N.J. Geological Survey (1999)
• “THE CLEAN WATER BOOK: CHOICES FOR WATERSHED PROTECTION.” The O cial
• Web Site for The State of New Jersey, NJDEP Watershed Restoration, 2018, www.nj.gov/dep/watershedrestoration/waterbook_ chp1.html.
• “New Jersey Greenhouse Gas Emissions Inventory.” The O cial Web Site for The State of New
• Zimmer, Russ. “Sea Level Rise: Jersey Shore Town Flooding Predictions; $10B at Risk.” Asbury
• Park Press, Asbury Park Press, 20 June 2018, www.app.com/story/money/personal- nance/2018/06/18/nj-sea-level-risepredictions-union-concerned-scientists/704485002/.
• Kalundborg, Novo Nordisk. “Kalundborg Symbiosis.” Kalundborg Symbiose -, Dansk Symbiosecenter, 2015, www.symbiosis.dk/ en/.
• N/A, N/A. “State Compost Regulations.” Test Methods & Parameters | US Composting Council, US Composting Council, 2018, compostingcouncil.org/state-compost-regulations-map/.
• N/A, N/A. “Sustainable Jersey Actions.” Sustainable Jersey, Sustainable Jersey, 5 Mar. 2018, www.sustainablejersey.com/actionscerti cation/actions/.
• Nora, Vogel. “The Regional Greenhouse Gas Initiative.” RGGI, RGGI, Inc., 2018, www.rggi.org/.
• Sentinel, Amy CalderMorning. “Carry in, Carry out Policy Working at Waterville Parks.” Press Herald, Morning Sentinel, 2 July 2015, www.pressherald.com/2015/07/02/carry-in-carry-out-policy-working-at-waterville-parks/.
• “Industrial Symbiosis: Realising the Circular Economy.” ECO-INNOVATION at the Heart of European Policies, 12 May 2018, ec.europa.eu/environment/ecoap/about-eco-innovation/experts-interviews/20140127_industrial-symbiosis-realising-thecircular-economy_en.
• Bonnet, Francoise, et al. Identi cation of Best Practices and Lessons Learnt in Industrial Symbiosis. FISSAC, 2016, Identi cation of Best Practices and Lessons Learnt in Industrial Symbiosis , ssacproject.eu/wp-content/uploads/2018/06/ FISSAC-D1.2-Best-practices-and-lessons-learnt-in-IS-Summary.pdf.
• Photograph of person in boat - Unknown
• Photograph of two people walking - Unknown
• Zientara, Ben. “How Much Electricity Does a Solar Panel Produce?” Solar Power Rocks, 7 Aug.
• Roberts, David, and Alvin Chang. “Meet the Microgrid, the Technology Poised to Transform
• Electricity.” Vox.com, Vox Media, 24 May 2018, www.vox.com/energy-and-environment/2017/12/15/16714146/greener-morereliable-more-resilient-grid-microgrids.
• “EMEC: European Marine Energy Centre.” EMEC European Marine Energy Centre, www.emec.org.uk/about-us/wave-clients/ aquamarine-power/.
• “Features and Bene ts.” Features and Bene ts - Microgrids, www.districtenergy.org/microgrids/about-microgrids97/features.
• “Five Striking Concepts for Harnessing the Sea’s Power.” National Geographic, National Geographic Society, 22 Feb. 2014, news. nationalgeographic.com/news/energy/2014/02/140220- ve-striking-wave-and-tidal-energy-concepts/.
• Grant, Julie. “Developers Face Obstacles to O shore Wind Farms in Great Lakes.” RSS, www.michiganradio.org/post/ developers-face-obstacles-o shore-wind-farms-great-lakes.
• “How Microgrids Work.” Department of Energy, www.energy.gov/articles/how-microgrids-work.
• “Home.” Mit Engineering, engineering.mit.edu/engage/ask-an-engineer/how-many-wind-turbines-would-it-take-to-power-all-ofnew-york-city/.
• State of New Jersey.” Department of Health | Chronic Disease Programs | Resources, nj.gov/governor/news/news/562018/ approved/20180523a_cleanEnergy.shtml.
• “Top 10 Things You Didn’t Know About O shore Wind Energy.” Department of Energy, www.energy.gov/eere/wind/articles/top10-things-you-didn-t-know-about-o shore-wind-energy.
• The O cial Web Site for The State of New Jersey, NJDEP/OIRM/BGIS, www.nj.gov/dep/.
• “Monmouth Beach, NJ.” Data USA, datausa.io/pro le/geo/monmouth-beach-nj/#category_wages.
• Sea-Level Rise and Coastal Flooding Impacts, www.nj oodmapper.org/slr/.
• Dhar, Michael. “How Do Solar Panels Work?” LiveScience, Purch, 6 Dec. 2017, www.livescience.com/41995-how-do-solarpanels-work.html
Citations
9.5 Connectivity
Map Data:
• CERLA, Superfunds, and Brown elds sites in New Jersey | Senate Admin (2013)
• Speci c lines of New Jersey transit rail lines | NJ O ce of GIS Open Data and NJ Transit (2016-2018)
• Bike and Trail Routes within New Jersey | NJTPA, NJDOT, NJtransit (2015)
• “United New Jersey Railroad and Canal Company.” Wikipedia, Wikimedia Foundation, 8 Aug. 2018, en.wikipedia.org/wiki/ United_New_Jersey_Railroad_and_Canal_Company.
• CERLA, Superfunds, and Brown elds sites in New Jersey | Senate Admin (2013) NJDEP 2012 Land Use/Land Cover (version 2/7/15) | NJDEP (2012) Green/Blue Acres Open Space (preserved) | NJDEP, Green Acres Program Government Census Block | US Census Bureau (2012)
• New Jersey and National Registers of Historic Places | NJ DEP - Historic Preservation O ce. (2011)
• Barnegat/Cape May Lighthouse | NJ Department of Environmental Protection (NJDEP), O ce of Information Resources Management (OIRM) (2018)
• Site of Liberty State Park, “Historic Gateway To America.”, NJ Department of Environmental Protection (NJDEP), O ce of Information Resources Management (OIRM), Bureau of Geographic Information Systems (BGIS) (18 Sept. 2018) (Web Accessed December 11, 2018) www.state.nj.us/dep/parksandforests/parks/liberty.html .
• Site of Monmouth Battle eld State Park, Harassment, Intimidation & Bullying (HIB), NJ Department of Environmental Protection (NJDEP), O ce of Information Resources Management (OIRM), Bureau of Geographic Information Systems (BGIS) (23 Nov. 2018) (Web Accessed November 3, 2018) www.state.nj.us/dep/parksandforests/parks/monbat.html .
• Walker. “New Jersey State Parks.” Parks of the Interior Region in Alaska, (Web Accessed December 9, 2018) www.stateparks. com/new_jersey_parks_and_recreation_destinations.html .
• Motivate International, Inc. “Citi Bike: Unlock a Bike, Unlock New York.” Citi Bike NYC, Web Accessed 15 Nov. 2018. www. member.citibikenyc.com/map/ .
• “Jersey City Mural Arts Program.” The O ce of Cultural A airs, Web Accessed 15 Nov. 2018. www.jerseycityculture.org/ jersey-city-mural-arts-program/ .
• “Google Maps.” Google Search, Google, 2018, Web Accessed 15 Nov. 2018. www.google.com/maps/@40.7321997,74.0636086,3a,63.5y,102.23h,87.55t/data=!3m6! 1e1!3m4!1sklN25PTu-IiQEG9_vDLmrA!2e0!7i16384!8i8192 .
• “City of Jersey City.” Jersey City, Web Accessed 15 Nov. 2018. www.jerseycitynj.gov/ .
• Henry Hudson Trail Connection to the NY Waterway in Port Monmouth, NJ - Jessica MacPhee Historic American Engineering Record, Creator, et al., photographer by Tucher, Rob. Raritan & Delaware Bay Railroad, Crossing Compton Creek & Church Road Bounded North by Port Monmouth Road, & South by Broadway, Belford, Monmouth County, NJ. Documentation Compiled After. Photograph. Retrieved from the Library of Congress, <www.loc.gov/item/nj1639/>.
• Koenneman, Kristen. “You’ve Never Experienced Anything Like This Epic Abandoned Railroad Hike In New Jersey.” OnlyInYourState , Only In Your State, 14 Oct. 2016, www.onlyinyourstate.com/new-jersey/abandoned-railroad-hike-nj/.
• “Google Maps.” Google Search, Google, 2018, Web Accessed 15 Nov. 2018. https://www.google.com/ maps/place/Port+Monmouth,+Middletown,+NJ/@40.4185459,- 74.1232747,3233a,35y,50.16h,39.02t/ data=!3m1!1e3!4m5!3m4!1s0x89c236bee24117d9: 0xc2ca2ace1c fdcc!8m2!3d40.4314588!4d-74.1002478
• Wikipedia. “United New Jersey Railroad and Canal Company.” Wikipedia , Wikimedia Foundation, 8 Aug. 2018, en.wikipedia. org/wiki/United_New_Jersey_Railroad_and_Canal_Company.
• Unit, NJDOT Web Development. 2030 New Jersey Long-Range Master Plan. NJ Department of Environmental Protection (NJDEP), O ce of Information Resources Management (OIRM), Bureau of Geographic Information Systems (BGIS), 2008, https://www.state.nj.us/transportation/works/njchoices/pdf/2030plan.pdf
• United States, NJDOT, O ce of Bicycle and Pedestrian Programs. “New Jersey Bicycle & Pedestrian Master Plan.” New Jersey Bicycle & Pedestrian Master Plan, 2016, pp. https://www.state.nj.us/transportation/commuter/bike/pdf/ bikepedmasterplan2016.pdf
• United States, NJDOT, WSP, and Parsons Brinckerho . “2017 State of New Jersey Complete Streets Design Guide.” 2017 State of New Jersey Complete Streets Design Guide,2017 http://njbikeped.org/wp-content/uploads/2017/05/Complete-StreetsDesign-Guide.pdf
• Directions for Driving from Route 537 Upper Freehold Township, NJ to Route 539 Plumsted Township, NJ. Google Maps,
2018, maps.google.com
• “NJDOT Route 35 Reconstruction Plans – Landscape Review.” Save Barnegat Bay , Bryce Bennett , Web Accessed 14 Nov. 2018. www.savebarnegatbay.org/wp-content/uploads/2017/05/Route-35-Landscape-Report-.pdf
• “FRIEDMAN PROPERTY Site Pro le.” EPA , Environmental Protection Agency, Web Accessed 13 Nov. 2018. cumulis.epa.gov/ supercpad/cursites/csitinfo.cfm?id=0200741.
• “HOPKINS FARM Site Pro le.” EPA , Environmental Protection Agency, Web Accessed 13 Nov. 2018, cumulis.epa.gov/ supercpad/cursites/csitinfo.cfm?id=0200742.
• “GOOSE FARM Site Pro le.” EPA , Environmental Protection Agency, Web Accessed 13 Nov. 2018, cumulis.epa.gov/supercpad/ cursites/csitinfo.cfm?id=0200681.
• “Berry’s Creek Study Area.” Berry’s Creek Study Area , 2018, Web Accessed 13 Nov. 2018, www.berryscreekstudyarea.com/.
• “VENTRON/VELSICOL Site Pro le.” EPA, Environmental Protection Agency, 20 Oct. 2017, cumulis.epa.gov/supercpad/ cursites/csitinfo.cfm?id=0200674. Web Accessed 13 Nov.2018
• “VENTRON/VELSICOL Site Pro le.” EPA, Environmental Protection Agency, 20 Oct. 2017,cumulis.epa.gov/supercpad/ SitePro les/index.cfm?fuseaction=second.cleanup&id= 0200674. Web Accessed 13 Nov.2018
• “REVOLUTIONARY WAR SITES IN TRENTON, NEW JERSEY.” Mount Holly, New Jersey Revolutionary War Sites | Mount Holly Historic Sites, Newark, N.J., The Carteret Book Club, (Web Accessed November 5, 2018) www. revolutionarywarnewjersey.com/new_jersey_revolutionary_war_sites/towns/trento n_nj_revolutionary_war_sites.htm .
• “National Historic Preservation Act of 1966 (16USC470).” National Parks Service, U.S. Department of the Interior, 2018, (Web Accessed November 23, 2018) www.nps.gov/history/local-law/nhpa1966.htm .
• “New Jersey and National Registers of Historic Places - Cape May County” (PDF). NJ DEP - Historic Preservation O ce. March 1, 2011. p. 3. Archived from the original (PDF) on June 28, 2011. Retrieved April 26, 2011.
• “National Register of Historic Places Inventory/Nomination: Cape May Lighthouse” . National Park Service . Retrieved September 1, 2018. With accompanying pictures
• “National Historic Preservation Act of 1966 (16USC470).” National Parks Service, U.S. Department of the Interior, (2018) (Web Accessed November 23, 2018) www.nps.gov/history/local-law/nhpa1966.htm .
• NJ Department of Environmental Protection (NJDEP), O ce of Information Resources Management (OIRM), Bureau of Geographic Information Systems (BGIS), www.state.nj.us/dep/parksandforests/historic/index.html .
• “Home | FEMA.gov.” Emergency Support Function Annexes | FEMA.gov, www.fema.gov/ . “The Federal Emergency Management Agency” (PDF). Fema.gov. November 2010. (Retrieved February 3, 2017) https://www.state.nj.us/dep/ parksandforests/historic/index.html
ACKNOWLEDGMENTS
e Junior Fall Environmental Planning Studio would like to acknowledge Wolfram Hoefer, Arianna Lindberg, and the Rutgers Landscape Architecture Department for supporting us throughout the semester. ank you for believing in us and entrusting us with creating an environmental vision for New Jersey. Our professors pushed us to be better and capable designers. e skills we have learned in this class will forever in uence us as future environmental planners and landscape architects.