EVOLUTION OF DATA PLATFORMS
with TARUSH AGGARWAL

Time Series Forecasting with Deep Learning and more.. .
USING AI TO MAP FORESTS
HOW AI IS DRIVING THE ERADICATION OF MALARIA
A GUIDE TO CAUSAL INFERENCE
ISSUE 3
There are start-ups that are trying to do direct air capture - they literally just hoover CO2 right out of the air and bury it underground or compress it.
HEIDI HURST Mathematician and Computer Scientist
It’s concerning because people hear about problematic findings potentially more than about correct findings.
ÁGNES HORVÁT
Asst Prof in Communication & Computer Science at Northwestern University


I think almost every problem that Silicon Valley is trying to solve has already been solved in the cell.
PERRY MARSHALL Scientist and Founder of the
Evolution 2.0 Science Prize
Data Science Conversation

datascienceconversations.com
PRESENTED BY Dr Philipp Diesinger and Damien Deighan
“
Tune in now to be part of the Join the industry’s top trailblazers as they explore groundbreaking new ideas and push the boundaries of what’s possible in data science and machine learning.
your knowledge Enhance your career
Expand
CONTRIBUTORS
Tarush Aggarwal
Heidi Hurst
Francesco Gadaleta
Arnon Houri-Yafin
Zain Baquar
Tamanna Haque
Philipp M. Diesinger
Graham Harrison
Patrick McQuillan
Damien Deighan
Dr Anna Litticks
George Bunn
Katherine Gregory
EDITOR
Anthony Bunn
anthony.bunn
@datasciencetalent.co.uk

+44 (0)7507 261 877
DESIGN
Imtiaz Deighan
PRINTED BY Rowtype
Stoke-on-Trent, UK +44 (0)1782 538600
sales@rowtype.co.uk
NEXT ISSUE
6TH SEPTEMBER 2023
The Data Scientist is published quarterly by Data Science Talent Ltd, Whitebridge Estate, Whitebridge Lane, Stone, Staffordshire, ST15 8LQ, UK. Access a digital copy of the magazine at datatasciencetalent.co.uk/media.

DISCLAIMER
The views and content expressed in The Data Scientist reflect the opinions of the author(s) and do not necessarily reflect the views of the magazine or its staff. All published material is done so in good faith.
All rights reserved, product, logo, brands, and any other trademarks featured within The Data Scientist magazine are the property of their respective trademark holders. No part of this publication may be reproduced, stored in a retrieval system, or transmitted in any form by means of mechanical, electronic, photocopying, recording, or otherwise without prior written permission. Data Science Talent Ltd cannot guarantee and accepts no liability for any loss or damage of any kind caused by this magazine for the accuracy of claims made by the advertisers.
COVER STORY We discuss data platforms with Tarush Aggarwa l, one of the world’s leading experts in helping organisations to leverage data for exponential growth. 05 START UP We speak to Jaguar Land Rover’s Tamanna Haque on what motivated her interest in the world of Data Science and her career to date. 09 INDUSTRY CASE STUDY Arnon Houri-Yafin , founder of Zzapp Malaria discusses how his company is using AI to drive the eradication of malaria. 12 CHATTING WITH CHAT GPT Francesco Gadaleta casts his expert eye over what everyone around the (Data Science) world is talking about. 18 TIME SERIES FORECASTING WITH DEEP LEARNING IN PYTORCH (LSTM-RNN) An in-depth focus on forecasting a univariate time series using deep learning with PyTorch by Zain Baquar 22 CAUSAL INFERENCE Graham Harrison explores what it is and why Data Leaders and Data Scientists should pay attention. 30 DATA SCIENCE CITY Our third city focus features London . We look at the UK’s capital city,
of the world’s Data Science and AI hotspots. 35 USING AI TO MAP FORESTS
satellite
39 THE VIRTUAL MILLION DOLLAR QUESTION:
INDUSTRIALISE
SCIENCE MVP? HERE’S
DECISION From
M. Diesinger helps you to determine if your Data Science MVP is ready for industrialisation. 45 THE PRINCIPLES OF AN EFFECTIVE DATA-DRIVEN ORGANISATION By Patrick McQuillan , Founder of Jericho Consulting and a Professor at Northeastern University and Boston University. 48 LARGE LANGUAGE MODELS Risk mitigation and the future of large language models in the enterprise market by Damien Deighan 52 ANNA LITTICKS Our spoof Data Scientist. Or is she? 54
one
Following up from her brilliant feature in ou r last issue, Heidi Hurst once again looks at satellite imaging. In this issue, she focuses on using
imaging to help tackle the complex problem of deforestation.
SHOULD YOU
YOUR DATA
HOW TO MAKE THE RIGHT
prototype to production, Philipp
THE DATA SCIENTIST | 03
INSIDE ISSUE #3
HELLO, AND WELCOME TO ISSUE 3 OF THE DATA SCIENTIST
Since our inaugural issue last November, we have received outstanding feedback from a wealth of Data Science professionals around the world - and we are thrilled to produce an even bigger and more varied third issue.
Our mission has remained uncomplicated: to produce a Data Science magazine that serious Data Scientists want to read, be featured in, and contribute to. We believe that the quality of contributors in each issue speaks for itself, and we hope that you find issue 3 informative, insightful, and engaging.
So what will you find in issue 3?
We feature two interviews - 5x’s Tarush Aggarwal and Pachama’s Heidi Hurst - and we also host a fascinating business case study too, as Arnon HouriYafin gives us a detailed insight into how his company is tackling malaria. We’re also very proud that issue 3 boasts a wealth of other outstanding content from those within the sector, focussing on their current work or Data Science & AI topics that they have a real interest in.
As ever, we welcome and seek your feedback, thoughts, and ideas, and we encourage you to contact the Editor to find out how you, your team, or your organisation can feature in future issues. Many Data Scientists and organisations already have. The Data Scientist is a broad and welcoming church and welcomes all who want to contribute to it or read it. We know that a magazine is only as good as its readers and contributors, and in that respect we are blessed.
And talking of contributors…
The Data Scientist goes out in print and digital formats to thousands of Data Scientists all around the world, providing curated content from a plethora of contributors. It’s a great vehicle to get you or your organisation’s work or words in front of the eyes that it deserves. Future issues are already filling up with content, and unlike other media outlets, we don’t charge a fee for appearing in our magazine.
We are really excited about the future of The Data Scientist , a magazine that reflects the ever-growing importance of our sector; aimed at those looking for great Data Science content to read. Thanks for joining us on board for the journey.
But in the here and now, we really hope that you enjoy this issue. Please share it with your colleagues or those you think may enjoy it, and let us know how we can improve it even more.
EDITORIAL 04 | THE DATA SCIENTIST
The Data Scientist Editorial Team
DATA PLATFORMS
TARUSH AGGARWAL
He graduated with a degree in computer engineering from Carnegie Mellon in 2011, before becoming the first Data Engineer on the analytics team at Salesforce. More recently, Tarush led the data function for WeWork before he left to found The 5x Company in 2020, which supports entrepreneurs in scaling their businesses.

THE DATA SCIENTIST | 05
IS ONE OF THE WORLD’S LEADING EXPERTS IN HELPING ORGANISATIONS TO LEVERAGE DATA FOR EXPONENTIAL GROWTH.
DATA PLATFORMS
How has the data infrastructure landscape developed over the last 10 years, Tarush?
When you look at the history of data infrastructure, it began with the online revolution. All of a sudden, we went from storing data on our own personal devices to storing data on the Cloud. With the advent of Facebook and Google, Cloud companies started collecting massive amounts of customer information, so the need to analyse this information is really where the big data revolution came from.
information back to users inside our products, and it allows anyone to answer any questions by slicing and dicing data. You would have a simple BI or reporting layer, which would pull this highly structured data which we’ve just created. In general, that’s the core framework of the different layers of infrastructure. As time progresses, we are introducing more and more categories such as reverse CTL, and then there’s observability, augmented analytics, machine learning and AutoML, which are all additional categories.
But the four core layers are the ones I just described.
Do you think that in the next few years companies will be able to manage their data more efficiently?
Along with starting to store information in the Cloud, the second thing which became prevalent is that we started having multiple different services to store this information. It was no longer one company which had all of this information. Today, your average start-up has got 10 different sources of data. This could be your backend databases, marketing data from Facebook Ads, Google Ads, data from your CRM, financial data from Xero or QuickBooks, or even Google sheets mixed with application data from Greenhouse and Lever. The number of different data sources has increased, so this has resulted in a need to centralise data again. We need to decentralise this and make sense of the data.
That’s a quick history of how we got to where we are today, and wh y it’s becoming more and more important for companies to have the right platform or the right infrastructure in place to make sense of all of this data.
What can companies do to tackle this problem of disparate and convoluted different data sources?
I think there are four core steps when we think about data platforms today... Step one is how do we pull this data from these different data sources into a single place to analyse? Once you have this, you want to store all of this inside a data warehouse, which is structured to store large amounts of data. Modern day warehouses are able to separate storage from computers, which makes them really cost-efficient in being able to store lots and lots of data without racking up large bills. That’s step two.
For step three, you have all of this raw data; it’s messy and it’s not been structured in a way to answer business questions. You want data modelling to create a clean business layer, which is optimised to answer business questions. We call that the data modelling layer.
Step four is where we want to surface this
I think what’s happened has been really interesting. If you look at the data space, it’s one of the most fragmented spaces out there. Every different layer of those four layers sees multiple billion dollar companies competing in them. Then, with the few additional categories which are named after, there are 10 different categories. What this really means for end consumers is actually pretty grim, because the space is becoming mainstream and every company needs to get value from data.
For example, imagine walking into Honda, and instead of selling you a Honda Civic, they sell you an engine and you have to build your own car. That’s really what the buying journey looks like today for the end consumers.
Although we’ve made progress and have flexibility in these tools, it hasn’t been easy for companies who don’t have large armies of data teams to actually go and get value from this. The short answer to ‘have things got better’ , is no. What I’m very bullish about in 2023 is a new category in the space called the managed data platform. This ensures that you can focus on the application of data instead of having to worry about setting up the infrastructure. In full transparency, I run a company which is focused on the managed data platform, but I’m trying to be as unbiased as possible.
Can you describe how a managed data platform works and what’s involved?
The goal is not just how we give businesses an end-toend platform across these initial four categories, but also all of the other categories as the company grows in scale. If you look at software engineering it’s a lot more mature.
How does software engineering solve this problem? Well, software engineering has Amazon Web Services and AWS, and if you really think about it, it’s just an umbrella for 50 different services. Amazon owns a lot of these 50 services, but it’s also got a marketplace where
06 | THE DATA SCIENTIST
PHILIPP KOEHN DATA PLATFORMS
It’s becoming more and more important for companies to have the right platform or the right infrastructure in place to make sense of all of this data.
you have external services, and the Amazon platform gives you a central place to do certain things like provisioning or setting up templates.
It makes it very easy by giving you a macro platform, which grows all the way from when you build your first product all the way till you are an enterprise, a large customer, and the entire journey in between. We partner with all of the different data vendors out there, so all of the different warehouses, and ingestion, and modelling, and all of these different categories are all inside our ecosystem. We make it very easy to go build your first platform. Initially, you could start from a template, or based on your industry, use case or size you could pick from a template. There will be a B2B template and a template for companies who have fewer SQL capabilities - so a low-code template, or a Web3 company which needs to pull on chain data will have a template.
We help to build your platform and then manage your users, give you all the tools to upgrade your platform as you become a bigger company, and have more advanced use cases and everything in between just like the Amazon web services. In short, we’re trying to be the Amazon web services of the data platform world.
Is this simply a case of you go to your managed platform and you select what you want?
Yes, I think that’s where the magic comes in. We integrate with all of these different vendors at an API
level. We provide, manage, build, user manage, and configure managed teams on behalf of these vendors, and make it very easy by removing all of that complexity and giving you a single platform where you can manage multiple vendors at the same time.
On average, it takes companies four months to build a data platform. Today, they have to sign multiple different enterprise contracts, and this involves work by finance, legal product, and billing. Building a platform on 5X today takes about four minutes. I’m not just making that number up, we’ve actually measured it. What we’re talking about is an end-to-end customer experience which is more streamlined and efficient than what exists inside the market today.
How do you think the whole data infrastructure and platform space plays out over the next five years, given where we are?

I think at a fundamental level, abstraction always goes upstream. We’ve seen time and time again that jobs get replaced by more automation. People always think that this is the end of jobs, but inevitably it creates a new category which employs more people, and things always go more upstream. For example, we don’t design chips anymore, we don’t write and see language anymore, and we don’t optimise how our database is run.
All of this happens automatically. Database administrators were replaced by data platform engineers,
THE DATA SCIENTIST | 07 DATA PLATFORMS
who are getting replaced by data engineers, who at some point will get replaced by Data Scientists, and so on. When I think about infrastructure, I think we’re at a point where it’s no longer relevant to hire data platform engineers to build your data platform. New categories in this space promise to give you all of these different things, which allows you to focus more of your time. Time on your data modelling, on building your BI on data science, on insights and recommendations; meaning less time worrying about infrastructure and platform which really wasn’t adding business value in the first place. It was just one of the building blocks.
As I see the space evolving, we’re moving away from a lot of the data infrastructure to more of the applications and data, and I think that’s a really exciting part of the journey.
What do you think that means for someone who’s a data engineer now in 5 or 10 years? What do you think they’ll be doing?
I think if you look at what data engineers were doing 5 or 10 years ago, 80% of time was spent on building pipelines and moving data from one place to another. Ingestion and Fivetran, Stitch, and Airy, and all of these different companies in this category came and replaced that. Whereas today, only a very small amount of a data engineer’s time should be spent thinking about pipelines because this should be fully automated. Instead, data engineering is evolving more into the data modelling side, where data engineers can spend most of their time.
This clean business layerwhich the data engineers really build - is ultimately what powers the data products. It gives the Data Scientists the core models they need in order to go and build the insights and recom mendations. It also powers data analysts to go deeper. Data engineering jobs have just moved higher up the abstraction level and they’re more important than they’ve ever been before.
to drive outsized returns in terms of the insights and recommendations they can provide for companies.
On the rise of data platforms and managed data platform providers - does that have any implications for how you structure a data team going forward?
I think a macro trend which we’re seeing in 2023 and moving forward is doing more with less. I think the downturn, or recession, has had a larger than normal impact on data teams. Globally, data teams have been quite affected, and I think in some ways it’s a correction. Some companies over-hire data teams with the big promise of everyone wanting to become data driven, and this is just part of a normal cost correction.
I think for Data Engineers and Data Scientists, being able to be more relevant over a few core areas, instead of having a data analyst, data engineer, a scientist, a data platform engineer, and then someone on MLOps inside every single team was a little bit too much. I think these skills will still exist individually, as I think specialisation is very necessary, but I think your average Data Engineer will be able to do more things on data platforms, more modelling and some level of data science. And vice versa, where your average Data Scientist will know how to build a stack from scratch.
I think in general, we are going to get a little bit more rounded and do a little bit more with less.
As I see the space evolving, we’re moving away from a lot of the data infrastructure to more of the applications and data, and I think that’s a really exciting part of the journey.
Will this differ depending on the size of a company?
What about Data Scientists? How do you see their role evolving?
Their role is getting more real. A lot of Data Scientists aren’t actually doing any data science, they’re focusing on all of the layers before. I think that if I look at ML, and data science, and MLOps, it’s finally this point where it’s less buzz-wordy and it’s becoming more real. The opportunity to go and join a company and actually do data science work in the next few years starts to become more tangible, so these people will be able
I think the general trend which I’m seeing in large organisations that didn’t start off as tech companies, is that they’re the ones struggling right now. By putting more and more people into this problem and creating more and more silos, things just aren’t getting better for them. I think there’s going to be a lot of consolidation in terms of end-to-end platforms going in there, and this could be things like Palantir or Databricks or other platforms. It’s making their jobs much easier because I think at the end of the day, these very large organisations are the ones I see suffering the most in this current landscape. I think there’s a lot of opportunity to rebalance and change.
08 | THE DATA SCIENTIST PHILIPP KOEHN DATA PLATFORMS
START-UP
START-UP
IN EACH ISSUE OF THE DATA SCIENTIST , WE SPEAK TO THE PEOPLE THAT MATTER IN OUR INDUSTRY AND FIND OUT JUST HOW THEY GOT STARTED IN DATA SCIENCE OR IN A PARTICULAR PART OF THE SECTOR.
LEAD DATA SCIENTIST AT JAGUAR LAND ROVER,
TAMANNA HAQUE , TALKS ABOUT HOW SHE LEAPT INTO WORKING WITH THE CARS SHE’S ALWAYS LOVED, AND HOW IT SATISFIES BOTH SIDES OF HER BRAIN.

GETTING INTO DATA SCIENCE
How did you start working in Data Science?
I completed a Maths degree at The University of Manchester, where I specialised in statistics. I didn’t do any post-graduate education and this was fine for me, I’ve always worked in fast-paced, commercial environments driven by value and delivery.
After graduating, I joined a digital fashion retailer (with a Financial Services proposition) as an Analyst initially. I learned a lot about real-life data and analytics itself, whilst developing a rounded understanding about the business and how to deal with stakeholders crossfunctionally. A great way for me to set solid foundations for what followed, and I personally feel this gives me
a lens that others who dive straight into Data Science don’t have.
I was soon attracted to Data Science because it tapped into what I learned at university and challenges you to keep learning; there’ll always be new advances in the field and things to learn. I gave up personal time when transitioning from data analytics towards Data Science.
Were there any roadblocks on your path into Data Science?
There were definitely some challenges. I had a few people tell me I couldn’t do Data Science or specifically the role at Jaguar Land Rover. I’m not sure if this was because it was happening quickly, or because I didn’t
THE DATA SCIENTIST | 09
fit the typical Data Scientist stereotype in several ways. This can instill self-doubt, which is why having and nurturing your wider network matters; I wouldn’t be here if it wasn’t for the people around me.
INITIAL CONNECTION WITH JAGUAR
How, when, and why did you start to follow the company?
I’ve been a fan of Jaguar since I was nine. I grew up with Top Gear and Formula 1, but it was Jaguar which really piqued my interest. At the time it was the Jaguar XJ, XK, S-TYPE and X-TYPE which turned my head, all attractive and luxurious cars with sporting pedigree; qualities which made Jaguar an aspirational brand to me.
Since then, I’ve ended up writing about the brand, attending previews of upcoming launches, and attending invitation-only experience days. I was a fan-turnedcustomer at 22 (very much in love with my Jaguar XF!) and I ultimately became an employee at 25. So, within my role at Jaguar Land Rover, I feel connected and personally committed when developing our products and customer experiences.
Anyone who knows me associates me with Jaguar and that’s a lovely feeling.
WORKING AT JAGUAR LAND ROVER WITH THE PRODUCTS I LOVE
Give us an overview of your current role?
I’ve been working at Jaguar Land Rover since 2019, as a Lead Data Scientist working within Product Engineering, specifically in the connected vehicle space.
My role involves using the connected car and AI to make our products and customer experiences better, whilst leading within our wide Data Science team too. The Data Science team in Manchester, UK, started with myself and one of my teammates - it’s since grown to nearly forty (cross-sites and countries) and developed into a high-performing, advanced Data Science team.
What makes us stand out is the nature of our workwe mostly use vehicle data (of participating customers), which is different to a lot of other commercial businesses or teams who’ll focus more on transactional or web data. The data we use lends itself to some pretty interesting projects, and a general futuristic feel here.
I’m particularly interested and active in enabling a more electric and modern luxury future from the use of vehicle data.
How did you land your current role?
I started here as a Senior Data Scientist in 2019, in a brand-new role and team. This move presented a lot of change, moving from retail into automotive, from an
established company to a tech-hub with a start-up feel, going through a general culture change and having a big step up in my career.
My interest in the Jaguar brand and corporate awareness made the interview easier because I didn’t have to ‘revise’ on these areas. In the hiring seat (which I’m now in) it’s also easy to know when someone genuinely has an interest in your business. Being able to demonstrate passion helps - you’re already aligning with some of the company values.
If you have an appetite to develop, joining a brandnew team can be great. Not only are there lots of opportunities, but there’s room to create many more and propel your development, which I did. I’m grateful to be working at a place where hard work and commitment is recognised and rewarded; last year I was promoted to Lead Data Scientist.
Looking back, I can see that this was a great career move for me, coming into a newly conceived Data Science team for a company which influences me. It satisfies both sides of my brain, ‘left brain logic’ and ‘right brain desire’. I read this phrase in an old Jaguar advert!
How does your passion for Jaguar Land Rover’s brands and cars improve your ability to perform in your role?
I have ever-growing commercial awareness and passion about our products, customers and business. These aren’t new qualities, but they now align with my professional interests, as well as personal. I’m always thinking about new ways I can add value to the business through the use of Data Science, keeping up with our competitors and trends in AI to support me. I can be sat in my car, visiting a dealership or at home with my customer app, appreciating the modern and luxurious experience in front of me whilst challenging myself to think of ways to improve it.
Day-to-day, this wider understanding complements my technical expertise, such as knowing when something should be questioned in data or outputs, which performance metrics to optimise for when building machine learning models or where a trade-off in model performance is appropriate.
It’s a pleasure to be able to do what I do best, for who I know best. I’ve found a keen appreciation for our other brands (Range Rover, Defender, Discovery) and I’ve been fortunate enough to get hands on with them too.
10 | THE DATA SCIENTIST
START-UP
Anyone who knows me associates me with Jaguar and that’s a lovely feeling.
DIVERSITY AND LEADERSHIP IN AI
You’re focussed on making an impact both inside and outside the business in terms of improving diversity and inclusion within AI. Can you describe some of your work here?
I’ve led outside the team by mentoring female apprentices with a tactical approach, working with them on original project ideas with many value streams.
More recently I founded a ‘Women in AI’ group at Jaguar Land Rover which provides female members across the business with technical and soft-skill development opportunities in a challenging, maledominated field. Additionally, I was chosen for a new (voluntary) role within Jaguar Land Rover’s Women in Engineering committee as its Analytics Lead, helping committee chairs and executive sponsors to become better informed towards improved gender diversity.

I’ve done a lot of work externally which has promoted my skillset and those of my audiences. I’ve delivered numerous talks to industry professionals, students, and women’s leadership and diversity groups, with the goal of promoting inclusion within AI and automotive. The other angle to my talks involves following your passions. Externally I have also been a guest lecturer at a leading UK university where I’m also supporting multiple students (who are also on placement with Jaguar Land Rover) with their final-year, industry-based projects.
Have you faced any challenges as a woman in Data Science, what many see as a typically underrepresented space?
I know some women in tech think they have to do more for the same worth. It’s definitely pushed me to give it everything here. My domain knowledge and Data Science expertise combined help to build my credibility and reputation.
You’ve recently transitioned into a leadership role within Data Science. What are some things you’ve learned, what are some of the challenges faced, and what are you enjoying more now?
I’m continually learning and adapting how I can be a good leader. If I had some qualities before, I realised I had more to learn, such as being assertive, a role model, a Data Science thought leader, comfortable in speaking, confident to be my authentic self. I’m providing support to a breadth of colleagues (in and outside the team) whilst delivering myself. I’m actively involved in setting and refining our team’s strategy and I’m enjoying leading projects which either deliver high financial impact or help set the path in terms of new tech and/or machine learning capability. I’m grateful that my manager (Dr Anthony Woolcock) values my opinion and gives me responsibility to lead (and on exciting things to come)!
Sometimes I’m time-poor so I need to manage my diary well to ensure effectiveness and work-life balance. I’m overseeing people, other projects, doing public speaking and trying to remain hands on. I sometimes block out chunks of time in my diary - I need some meeting-free time to produce quality technical work. I try to finish on time and enjoy a very busy social life with my family and friends. A flexible attitude to how we work helps to keep me happy and energised whilst I’m delivering from various angles.
CLOSING THOUGHTS
Have you achieved anything so far which you previously thought would be a dream, and is there anything you’ve still yet to achieve? And do you have any advice for others?
I’m most proud of my recent promotion from Senior to Lead Data Scientist. Also, it was exciting for my family and me when I gained an offer to join Jaguar Land Rover (I especially couldn’t wait to tell my grandparents)!
Despite my interest in Jaguar, I was nervous to join a much larger, global company and adjust to the changes I mentioned earlier, which took me out of my comfort zone considerably. But this was clearly a great choice for me, and has given me courage to continually find new limits in myself to serve my internal and external customers better.
Since joining Jaguar Land Rover, I’ve delivered many Data Science projects of varying natures, which have boosted my abilities whilst creating impact on our vehicles and customers of today and tomorrow. With Jaguar becoming an all-electric brand in 2025, it’s a huge milestone for the company and it’s thrilling to know that my current work contributes to this.
Out of hours, I’ve also experienced several amazing opportunities. To name some, I was sent to support Jaguar TCS Racing at the London E-Prix last Summer, I’ve tested top-tier cars such as the Land Rover Defender and I’m still trying to get used to the fact that I now drive a Jaguar F-TYPE!
START-UP THE DATA SCIENTIST | 11
HOW AI IS DRIVING THE ERADICATION OF MALARIA
WE SPOKE TO XPRIZEWINNING ARNON
HOURI-YAFIN. HE IS AN ISRAELI ENTREPRENEUR WHO FOUNDED ZZAPP MALARIA IN 2016, A START-UP WITH A MISSION TO ERADICATE MALARIA.
So, if we start with your personal journey Arnon, could you tell us how you ended up working in both AI and in the field of malaria eradication?

I have two answers. One is a personal story, where my friend took me to see malaria first-hand and then another one is poverty.
Back when I had to decide what to study in university, I chose economics. My goal was to become an economist in the context of developing countries, and specifically African countries. I believed that reducing poverty was the key to significantly improving the wellbeing of whole communities.
12 | THE DATA SCIENTIST INDUSTRY CASE STUDY
Just before I completed my MA, a friend called and told me that he was starting a company (Sight Diagnostics) dealing with malaria. I knew at the time that malaria was a huge problem in terms of public health, and that it’s one of the primary reasons for poverty. The disease prevents people from going to work, either because they are sick or they attend to sick family members, which reduces productivity. Malaria is also one of the primary reasons why children in Africa miss school, which obviously harms their ability to progress.
Sight Diagnostics developed a malaria diagnostics device, and one of my jobs was to test them. We ran these tests in public hospitals in Mangalore and Mumbai, India.
In India, you have some places with a lot of malaria and others without. I was in an area with a lot of malaria. Now, I’m a nervous parent - when my children have a fever, I get really stressed out. But when you see the moms with young children who are very feverish, they are scared, because it’s not just a fever that will probably be gone by tomorrow, it’s malaria. And when I saw that, the difference between malaria diagnostics and malaria elimination struck me. In many countries, Israel for example, malaria was a problem - a big problem. Here, malaria was all but eliminated in the 1920s and 1930s, after the stagnant water bodies where the Anopheles mosquito breed were thoroughly targeted. So, if we have such a big problem, but one that could be fully eliminated, why don’t we do it? This is what caused me to say, okay, diagnostics are very important, but we need something more radical. We need to recreate in modern Africa the successful malaria elimination operations of Cyprus, Egypt and many other countries.
Zzapp Malaria is about moving from malaria control to malaria elimination. This takes artificial intelligence and data.
Is that why you specifically founded Zzapp Malaria?
Exactly. Zzapp Malaria is about moving from malaria control to malaria elimination. This takes artificial intelligence and data. When people tried to treat water bodies in Africa, they did it with partial success. This is because tropical Africa has two rainy seasons and there are wide areas that must be searched for water bodies that once detected need to be treated regularly. A very high percentage of water body coverage is required, which is a difficult result to reach.
With our system, fieldworkers go into the field with a smartphone that guides them exactly to the areas they need to search, enables them to upload information
about the water bodies they find, and, once water bodies are detected, shows them which water body has already been treated, which needs to be treated again, which houses should be sprayed etc. So we really have a lot of information about the exact location of water bodies and the overall situation of the operation in terms of the treatment of houses and mosquito breeding sites.
Did the company have a concrete idea already?
Did they have a team? How did you start this up? Where were you when you started the company?
We actually started with an app for house spraying, but quickly moved into larviciding (the treatment of water bodies). Today, our system combines a lot of different features that, combined, are meant to provide the most cost-effective solution per location. The ideas and the team were built as we progressed. We have been receiving a lot of help from many people. It is nice to see that people understand the importance of malaria, and really try to do their best to fight it.
What were the backgrounds of the other members?
Zzapp has a strong and dedicated team with expertise in science, technology implementation, marketing and community engagement. We have leading software developers, PhD holders in veterinary medicine and communication, and team members with extensive experience in leading field operations, against mosquitoborne diseases and other impactful causes, in Africa and elsewhere.
You had a diverse set of skills when you started out. Did you have a very concrete idea already?
We started out with a clear goal that is still with us: eradicating malaria. We knew, almost from the start, that the key is locating and treating the water bodies. We have since improved our ability to do so, and have integrated in our operations other methods, but yes, we are still big believers in larviciding.
That sounds interesting. So, you stuck with your original ideas - more or less - to implement and to turn your idea into reality rather than to do a lot of research in 2016? Can you explain a little bit about how the company grew and how the project grew over time?
Malaria is unique in that the means for eliminating it are known. It’s not like having to develop a new medicine. So the trick is to think of the best waysthat are the most cost-effective ways - to do so under challenging conditions and with limited resources. So
INDUSTRY CASE STUDY
THE DATA SCIENTIST | 13
that is where our R&D goes. We began with a small budget from our parent company Sight Diagnostics, and a grant from the Israel Innovation Authority (IIA). Working lean, and gradually hiring more staff, we collaborated with leading scientists, for example Andy Hardy with whom we operated in Zanzibar. In that project, which was funded by IVCC through the Bill and Melinda Gates Foundation, we used drones to map water bodies.
Winning the grand prize in the IBM Watson XPRIZE AI for good provided us with $3 million, which is obviously a significant improvement in terms of our resources. We were able to hire additional staff and push our technology forward. It also helped us create connections with African governments. We have been going to malaria conferences in which we present our technology to malaria researchers and implementers. We have also been contacting government ministries of health and proposing our solution. So far we have been working in several African countries, including Ethiopia, Kenya, Ghana, Tanzania, Mozambique and São Tomé and Príncipe.
Can you explain the core idea that you had to combat the spread of malaria? If I understand correctly, it has to do with identifying stale pools of water? How do you prevent the spread of malaria?
In the past, the best solution to fight malaria was treating the stagnant water bodies. But today in Africa, most countries prefer bed nets. You distribute them and hope that people sleep under them. It’s a simple and effective tool, which indeed protects many people. However, it depends on peoples’ behaviour, which as we know from mask mandates during COVID, is unfortunately not always reliable. We want to make use of the proven method of larviciding and apply it in Africa.
To do so successfully, you must overcome two problems. One is coverage: you need to find all of the water bodies. The second problem is budget. Because you don’t have the money to scan every single square kilometer in Africa, you must prioritise. Based on satellite imagery and data on topography and rainfall, our system decides when and where to scan for water bodies. This is how we reduce operation costs. The mobile app helps coordinate the operation and the monitoring. We make sure that all the areas that were assigned for scanning were searched, and that all of the water bodies and the houses that were selected were treated.

So, you’re basically saying that using satellite data, and then also artificial intelligence, you can pinpoint people much more precisely to those water bodies that need to be treated, and by increasing the spacial distance coverage, basically you can eliminate malaria better? What was the idea initially? How do you scale this across a continent like Africa?
Yes, treating the water bodies is the idea, and scale is the challenge. Besides technology, it’s about finding good local partners, be it the government or a large NGO. We provide the technology and training, but it is the fieldworkers and the local management who have the ownership over these operations. Ultimately, they are the ones who serve their own communities.
Therefore you are bringing the technology, and the partners are bringing the people to make it scalable?
Yes. We bring technology and we also bring knowledge about which agent to put in the water. We are experienced because we did it in other countries, then we go to new countries to share our knowledge.
You already mentioned satellite data. There’s obviously a lot happening in that space at the moment. Can you talk a little bit about which
14 | THE DATA SCIENTIST
INDUSTRY CASE STUDY
kind of data you’re using and how you’re using the satellite data?
One of the challenges that we faced is resolution. If you have a large water body, you just see it from the satellite imagery. It then becomes a standard machine vision problem and you also have the near infrared, a channel where water is very distinct. But then you have water bodies that are smaller than your resolution. So it’s not about finding the water bodies themselves, but rather the areas that are suitable for water bodies. This is interesting because if you go to look at something smaller than your resolution, the context becomes very important. For example, you won’t find malaria mosquitoes in a river because they only breed in standing water. However, near that river, you’ll probably find many water bodies.
We started with a small neural network that detected only what we wanted it to detect. We then enlarged the networks so as to get better usage of the context of the area. It’s similar with topography (and this isn’t even artificial intelligence, it’s more traditional models of topography): you have water, going from a high area to a low catchment, so you can understand that it’s not only the absolute height of a specific point on the map, it’s also how it relates to other points in the area. We use both traditional models of topography and a neural network to understand where the water bodies are likely to occur. Again, if you give it more areas, it works better.
satellite imagery produced by the European Union, but also high resolution satellite imagery that one can buy. We help countries understand the pros and cons of each and make a decision. So far, we mostly focused on the low resolution part because it will be more convenient for many of our potential customers. We hope to gain more experience with high resolution satellite imagery.
Basically then, this model takes all of this input data and then predicts where water bodies could be, and that information goes in through an app to the workers in the field. Is that correct?
Yes. We have one more layer, which is locating the houses. If you have a water body in the middle of the jungle, you don’t care because malaria is transmitted only from person to person. The mosquito is merely the vector. So, we have one component that maps the water bodies and then one component that maps the houses.
The last component is about the proximity of houses to areas that potentially have many water bodies in it. Then, based on that, and based on their allocated budget, we define where to scan for water bodies. We then have one more component that takes it to the mobile app.
Malaria attacks poor communities and then prevents them from getting out of their poverty because it’s difficult to go forward. It’s a vicious cycle of poverty and disease that we want to help solve.
You mentioned you’re using conventional neural networks, basically to identify areas where there could be water bodies… what are the inputs for those models? You mentioned satellite data, but you’re not only using visible light channels, but also infrared - anything else?
We’re using satellite data, then topography, and also land use. We also use data on rain and humidity. For that, as part of our prize, IBM Watson also helped us in machine learning projects. They focused on the temporal part of it, because you need to know not only where the bodies of water are, but also when.
Obviously, at the start of the rainy season, you will find many more water bodies than after the dry season. But knowing the exact amount of rain, humidity and temperature, helps to better predict the abundance and location of water bodies.
That’s quite sophisticated modelling that you’re doing there already. For the data sources, are they open source or do we have to buy this kind of data?
This is up to the country we work with. There is free
And so these workers, what do they then do? Do they take the app, then take the information, and then they go to these locations and then they treat the stale water bodies with chemicals? Yes, they search for the water bodies. If we found water bodies from a drone or from satellite imagery, we can just direct them, but they can also report water bodies from the field. This is important because that’s how we feed the system. It’s machine learning and we need new data. That’s one thing. Then, they treat the water bodies. Treatment of the water bodies in the past involved chemicals, but this isn’t good because animals, and sometimes even people, drink from the water bodies.
The World Health Organisation has very strict regulations about which materials can be put into the water, but mostly we use a biological agent that is called Bti (bacillus thuringiensis israelensis). The good thing about Bti is that except for mosquitoes it doesn’t harm other animals. Not people, not cows, not frogs - not even other insects. Only mosquitoes and black flies (that transmit river blindness). So, it’s very environmentally friendly.
INDUSTRY CASE STUDY THE DATA SCIENTIST | 15
Can you talk about some specific user cases or field tests that you did with communities?
One interesting thing that we’ve done is with an NGO in Ghana. They fight malaria in their town and in the villages surrounding it, and they were very successful before us. They sprayed houses and did community activities with the village inhabitants, because education is also important so that people use the bed nets and go to the doctor if they have a fever.
They wanted to achieve zero cases, and so they approached us and together we implemented an operation against the water bodies. As I said, the very interesting part is that we managed to reduce more than 60% of the mosquito population in the town and the villages, which is an outstanding result.
It was a controlled trial: some areas we treated and in some not, so we were able to compare the impact. The cost was only 20 cents per person protected , which is extremely low. Other interventions cost about $5 per person protected, so it’s a very big difference. This operation spanned 100 days, but because it was so inexpensive, we could have used the budget they usually spend to run the operation year-round and scale it up to more villages in the area.
Another interesting operation was in Ethiopia, where we worked in a few villages and mapped the area. We learnt a lot from this operation because we saw how different fields are correlated with the existence of water bodies. For example, teff fields (teff is a kind of grain) did not have suitable water bodies for Anopheles mosquitoes, whereas in the grazing area where the cows were we saw hundreds.
How does the collaboration work? Do you have to be in the field when you work with these people in Ghana or Ethiopia, or is this a remote collaboration?
I’m a big fan of being in the field. It’s about user experience. It’s about science. It’s about the quality of training. It’s about understanding the specific problems. In each of our operations, even during COVID, we visited in person except for one operation in Kenya where, because of COVID, we weren’t able to make it. You learn a lot from such partners.
How do you measure how successful you are?
You have two measures. One is about mosquitoes. We catch mosquitoes. We don’t catch them to kill them, we catch them to count them - again inside the intervention area and then outside the intervention area to confirm the reduction rate of mosquitoes. And then, the most important measure is to count malaria cases to see if you reduce malaria cases.

And what are the results?
In Ghana, this is the first time we did an end-to-end trial. The results of mosquito reduction is amazing, it’s more than 60%.
INDUSTRY CASE STUDY 16 | THE DATA SCIENTIST
What timeframe is that 60% reduction over?
It’s 100 days, less than four months. Now we start our most ambitious operation, which is about malaria elimination - really elimination to zero. For that, we collaborate with the government of São Tomé and Príncipe. São Tomé and Príncipe are two islands, forming an African island nation. Because they are islands, it’s a closed system, so you don’t get incoming mosquitos and they don’t go out.
We want, in two years, to not only target the water bodies but integrate other interventions based on artificial intelligence planning, to understand where to do what, and then to eliminate the disease. If that happens, it opens up the opportunity to approach larger countries and offer them malaria elimination. Malaria elimination will save many people and will boost the economy. People understand that if you eliminate malaria from countries, the impact on the GDP and on their economy will be more than 10% in a few years. It affects agriculture, tourism, education - everything.
Obviously, there is an imminent health care cost or health care impact of malaria. But you mentioned at the beginning that it drives poverty, it has economic implications…
The sad thing about malaria, and actually about many things in our world, is that it impacts the poor more than it impacts the rich. You have more malaria in poor villages than in the wealthy neighbourhoods in the cities. For example, in India, you have more malaria in some tribes in the mountains than all of the rest of the population. Malaria attacks poor communities and then prevents them from getting out of their poverty because it’s difficult to go forward. It’s a vicious cycle of poverty and disease that we want to help solve.
What’s happening in terms of more widespread adoption across Africa, are you hoping that one day this will be across the whole of Africa, or is that a challenging thing to scale to that degree?
For us, it is not challenging. It’s software, basically. It’s not very difficult to scale. So scaling up is up to the Ministry of Health. If countries in Africa adopt the system, it will happen. If one country uses it, they will help not only themselves, but also neighbouring countries, because, as you know - mosquitoes don’t believe in borders. I really hope to see it across the world, and not only in Africa - in South America and in India where there is malaria as well. We must do our best to eliminate this disease. I think it’s very strange that in the 21st century we still have such disasters happening. We experienced 18 months of the Coronavirus pandemic and we know how difficult it is, so why do we allow a disease such as malaria to persist for decades or centuries? We must stop it.
Most of the deaths are in children. Is that right? Yes. Children under five is where most of the deaths are. And then there are also pregnant women who are greatly affected by the disease.
You see varying estimates. What would you put the estimates of the number of people per year affected by malaria?
I don’t have better estimates than the World Health Organisation, which estimated about 400,000 people last year. This figure grew by 15% or so because of COVID. With COVID, it became difficult to provide bed nets and health clinics were less available to treat malaria patients, which is what caused a surge in malaria cases.
You’ve worked a lot in this field of malaria prevention over the last couple of years. Are there any other organisations that you would want to mention that work on different approaches, who are maybe tackling the same problem?
If we improve the available vaccine it will be amazing, and some teams are trying to do so. Some tried to do this based on MRA technology, and some are trying to just take the existing vaccine, and with a few modifications, enhance its capability. Other groups try to do so by engineering mosquitoes - they want to put genes in the mosquito that means the mosquito itself will have a drug against malaria. Then the mosquito will not be infectious. This is a very innovative approach.
If it happens, it will be the first time in history where humanity has taken a species from nature and replaced it with other species with different genes. This is interesting, but we are still trying to understand how to do it in terms of technology and the safety of this method.
If people want to support you, what can they do?
Thanks. I actually prefer if people support the malaria NGOs. For example, Malaria No More and Only Nets are two good NGOs that really save many, many lives. If you buy, for example, 10 bed nets, it costs only $40 and you are potentially saving lives.
Where can people find out more about your work and about Zzapp Malaria?
Our website is Zzappmalaria.com

INDUSTRY CASE STUDY
THE DATA SCIENTIST | 17
We must do our best to eliminate this disease. I think it’s very strange that in the 21st century we still have such disasters happening.
When it comes to artificial intelligence chatbots, there is little hype around the models that are published in the public domain compared to those available from the big players in artificial intelligence. I am very much against hype and the idea that these complex models that resemble a human being are even close to what we define as artificial general intelligence. We are still not on that track - whether that’s unfortunately or fortunately, I don’t know. But that’s a fact. It would take a lot to explain what ChatGPT is, but more importantly, what should we expect from this type of model?
I’m also unsure about the enthusiasm around ChatGPT. I was never a big fan of the GPT family of models. But, I’ve slightly reconsidered my position - I won’t say I’m super excited about these models as I’ve been playing quite extensively with them in the last few weeks, as there are still things missing. The model is also behaving the way a large language model of this type is
expected to behave, regardless of what people say or the general public’s enthusiasm. It’s a very powerful model, that’s undeniable. It’s also very fun to use. I personally use it to create poems about pretty much anything that happens in my life, just for fun, or describing situations in which my friends and colleagues are involved in the form of a sonnet. That’s how I personally use ChatGPT. Of course, ChatGPT can be used for more important things, and tasks that can help you in your daily job if you use it with parsimony. That’s my advice. It’s not a silver bullet against anything or everything. You should always double check, or fact check all the answers that ChatGPT gives you. Because there is a point at which ChatGPT starts guessing things and also inventing things that probably never existed, but makes these facts look real. If you are consuming the response or the answer of a ChatGPT session without double checking, you may get into trouble if you’re using that answer for something important, for example. I mentioned the
CHATTING WITH CHAT GPT
18 | THE DATA SCIENTIST CHAT GPT
FRANCESCO GADALETA looks at the capabilities and limitations of the advanced language AI model that everyone is talking about.
word ‘guess’, and not by coincidence, because a guessing game is probably the closest exercise. This was in fact invented by Claude Elwood Shannon - and there is an amazing book about that. He created this game, which he named the ‘guessing game’.
This was essentially a way to teach computers to understand language. That was back in the days when artificial intelligence hadn’t been invented. Claude Shannon was the beginner and the pioneer of a lot of technological advances out there. These are things we take for granted, especially with communication and artificial intelligence - in particular NLP or language understanding. NLP was not even a term back at the time. Shannon invented this game in 1951, which consisted of guessing the next letter. If you know what ChatGPT does, and what all the family of GPT models do, these are doing exactly the same but on a word basis.
The models are guessing the next word given a certain context. There are several papers and a lot of tutorials out there that go into the technicalities of how ChatGPT works. But I would like to give you an explanation of what it is and what you should be expecting from a model of this type. The way ChatGPT has been trained, and how all the families of GPT models have been trained, is essentially guessing the next word given a certain context. Apparently, this is a game that gets interesting if you want to play at a human level. This is because you need to understand the context. In the case of Shannon, you need to guess the next letter. But in the case of ChatGPT, in order to generate and guess correctly the next character or word, you need to understand the context very well. This is why usually training models or building models of this type is strictly related to the fact that you are understanding language. You could not generate that letter or that word if you did not understand the context, and the context can be pretty much anything. It can be philosophy, religion, technical content, news, or politics; you name it.
The fact that a model is expected to guess the next word almost all of the time (approximately 99%), that’s not really the case. But let’s assume that happens. That would mean the model understands the context and therefore it can guess correctly the next letter or the next word, which is not the case. I mean, it is partially the case, but it’s also the case that these models are equipped with billions and billions of parameters.
Something has definitely changed with respect to when we were dealing with, for example, 60 billion parameter models (which is an amazing number of parameters) to 175 or more billion parameters. These are the models that we are dealing with today. There is a
flipping point where something is happening; something different happens from the perspective of the model.
It could also be that the model is so big that it relatively starts memorising things because it has much more bandwidth; more space in terms of a number of parameters. Meaning it has much more space to store and memorise whatever is provided from the training set. That could be the case. That was my very first conclusion about this large language model; the day they come with, let’s say, a trillion parameter model, we will have this amazing lookup table that is much more powerful than a simple lookup table, because it can look up things that are similar and not an exact match.
A lookup table allows you to search and to find some targets exactly as they are in your database or in your storage.
By using hashing or other techniques, one can do that very fast, for example in constant time or in O(log n) time, so ChatGPT looked more like a big lookup table. In fact, the family of GPT models looks like a big lookup table on steroids due to the fact that these models can consider text similarity and paragraph similarity. The concept of similarity is much more powerful than the concept of exact match (which exists since the ‘60s or ‘70s, or even before). It is powerful, but it is a mechanical thing. It’s not something that can generate the same level of enthusiasm in humans.
ChatGPT is the combination of three or more different modules that were not present in the models before. This is where I started changing my opinion about these models. When you combine three modules that I’ll go on to discuss, you get something that is much more powerful than the classic models; as the language models, we were used to until several months ago.
First of all, the GPT family of models is based on the concept of instructions. Before getting there, we have to say that when these models get trained, they get trained with a massive amount of text, and this text can come from pretty much anywhere. It can come from forums, chats, or websites. The entire Wikipedia site and Reddit have been used to train this model, so millions or billions of articles are publicly available. When it’s time to train these models, the amount of text they are exposed to is incredible.
However, despite the amount of available training data, there is something missing: a connection with the external world. Outside of that text, there is nothing. If
CHAT GPT
THE DATA SCIENTIST | 19
It’s not a silver bullet against anything or everything. You should always double check, or fact check all the answers that ChatGPT gives you.
you have some concept in textual format, like the sky is blue , or the colour blue , this might be associated with another concept that is present in the text; like a chair, a table, and so on.
There is no concept of the outside world or the scenario in which that concept is related to, or what that concept is related or refers to. That’s obvious, because the only input that these models receive is text, while human beings receive many more types of input. Humans have perceptions that come from pretty much all their senses. Moreover, we can read text, we can view, we can hear, we can touch, we can feel. That is probably the biggest limitation of machine learning models, and that’s normal because one is a model; mathematical or an algorithm. The other one is an organism or a human which is even more complex than a simple organism.
languages; for example, programming languages.
Programming languages are non-natural languages. In fact, they are formal languages. That is languages that are parsed and understood by a machine or by another algorithm to generate, for example, machine code. Java, C, C++, Rust, or Python are all programming languages and ChatGPT has been trained on programming languages too.
The amount of information that a code snippet carries can be incredible due to the presence of comments, headers or descriptions that developers augment their code with. There are even entire discussions written about code snippets. There are entire papers, with code in which the paper is describing what has been done exactly by the authors. There is enough material for a 175 billion parameter model to learn the most subtle relationships between comments and code. In summary, yet another way to bring the context out of the text.
With this said, there have been strategies used to train these models, and I refer to the entire family of the GPT models, which are trained by using instructions. Instructions are given by humans during training time in order to describe a task. For example, today you can ask ChatGPT to translate a certain text into another language. It’s because, during training, someone has instructed the model with a keyword that looks like
TRANSLATE <input text> <output text> letting the model learn that when there is a translation request of an input text into another text, it should be generating something similar to output text. The same happens for a summary or a description of a context.
If one asks ChatGPT to provide the summary of a text, that’s possible because, during training, there was someone who instructed the model with a summary; which is the instruction, the text to summarise, and the summarised text as the answer of that instruction.
The same goes for a lot more instructions that one can play with on ChatGPT. Myself included, I like playing with prompts; such as “from this story, make a poem out of it”. That’s my favourite these days.
The concept of instructions is relatively novel and powerful. It is powerful because it allows one to create that bridge between the text and the outside world. As a matter of fact, it’s an artificial way to bridge what is in the text to what is not, mitigating one of the biggest limitations of machine learning models and, more specifically language models.
The second feature that characterises ChatGPT and makes it different from the models that we have been playing with until now is dealing with non-natural
The third novel concept that is now first class citizen in ChatGPT is Reinforcement Learning with Human Feedback, RLHF.
It allows a human to always have control over the model. Controlling a 175 billion parameter model from diverging any conversation is anything but an easy task.
We know that deep learning models suffer whenever they are used in generative mode, that is when they generate data (text, images, sound), instead of performing predictions. The worst can happen when such models start generating “concepts” that were not present in the training set. We have experienced hyperacist models in the past, and chatbots impersonating Hitler. To avoid situations like those, the developers and the designers of ChatGPT have introduced a human factor that rewards the algorithm accordingly.
In my opinion, it’s the combination of these three things that makes a difference with respect to what ChatGPT or the family of GPT models, and all these large language models could provide in terms of experience and usability. However, there are limitations, and I must be critical here, especially when I read claims online that these models are approaching artificial general intelligence or that they will soon take over. I have read extensively about these models, and while they have impressive capabilities, they can also be dangerous.
The very first versions of GPT models were banned by developers, even from OpenAI, because they were considered too dangerous. In the sense that people could have abused the way, GPT models generated text and used it to create fake news or spread false information. These models are also highly biased, contain stereotypes, and do not understand language very well.
20 | THE DATA SCIENTIST CHAT GPT
The third novel concept that is now first class citizen in ChatGPT is Reinforcement Learning with Human Feedback, RLHF.
While it is important to acknowledge these limitations, I do not believe they are a significant issue. As always, it depends on how the models are used.
For example, Google’s search engine does not understand text in human terms, yet it provides accurate results most of the time. Similarly, language models like ChatGPT can be used for specific purposes without requiring a deep understanding of language. These models do not need to understand language in the way that humans do.
It is crucial to double-check or even triple-check the answers generated by these models, even if they make grammatical and semantic sense. Generated text can seem smooth and convincing, but it may contain contradictions or be logically impossible. Additionally, models of this type do not have a notion of time since they are trained on snapshots of data.
This means that, for example, if one asks who’s the president of the United States or Italy and who were the presidents before, ChatGPT cannot give you answers of this type because there’s no notion of time. Having no notion of time means there’s no way of telling which fact came first. President A and president B are both valid because they both were presidents at some point in time, just in two different timeframes. There is no notion of time, there is no notion of knowledge either. The so-called knowledge awareness is not present. The fact that what the model knows is a concept that is not there. That’s why they can make stuff up and mix it into real facts coming from the training set, plus the generated facts generated by the model itself, and they would still be mixed up and look legit. Because there is no awareness of knowledge, there is no knowledge
of knowledge. Another thing I found is that ChatGPT struggles with numbers and maths.
Mathematics is something that is not a piece of cake, except for the usual ‘two plus two’ and similar arithmetic questions. But for the rest, there is no capability that is at least human level capability for performing mathematics, and there is a reason behind that. It’s because the representation of mathematical concepts comes from text. There are much better ways to represent, for example, numbers and mathematical concepts than text. These are some of the limitations that I have in my head. There are probably many more. One, for example, is the fact that the number of parameters I see, I look at it as a big limitation because it doesn’t really help in the democratisation of these models and their availability.
We have to hope that OpenAI keeps ChatGPT available to the public. The day they will shut it down, we will have no ChatGPT and we will have to wait for the next player who has the financial capacity, and the infrastructure to provide a massive model like this one to the rest of the world. There is no democratisation in that respect. Also, there’s no democratisation in the way these models get trained. For that, one needs massive infrastructure and lots of data. These are very data hungry problems; terabytes of data is not even an exaggeration. Such requirements definitely restrict the number and type of people and organisations who can deal with and build models of this calibre.

THE DATA SCIENTIST | 21 CHAT GPT
FRANCESCO GADALETA is the Founder and Chief Engineer of Amethix Technologies and Host of the Data Science At Home podcast. datascienceathome.com
TIME SERIES I NG WITH DEEP LEARNING IN PYTORCH (LSTM-RNN)

AN IN-DEPTH FOCUS ON FORECASTING A UNIVARIATE TIME SERIES USING DEEP LEARNING WITH PYTORCH
By ZAIN BAQUAR
INTRODUCTION
Believe it or not, humans are constantly predicting things passively - even the most minuscule or seemingly trivial things. When crossing the road, we forecast where the cars will be to cross the road safely, or we try to predict exactly where a ball will be when we try to catch it. We don’t need to know the exact velocity of the car or the precise wind direction affecting the ball in order to perform these tasks - they come more or less naturally and obviously to us. These abilities are tuned by a handful of events, which over years of experience and practice allow us to navigate the unpredictable reality we live in. Where we fail in this regard, is when there are simply too many factors to take into consideration when we are actively predicting a large-scale phenomenon, like the weather or how the economy will perform one year down the line.
This is where the power of computing comes into focus - to fill the gap of our inability to take even the most seemingly random of occurrences and relate them to a future event. As we all know, computers are extremely good at doing a specific task over numerous iterations - which we can leverage in order to predict the future.
TIMES SERIES
22 | THE DATA SCIENTIST
WHAT IS A ‘TIME SERIES’?
A time series is any quantifiable metric or event that takes place over a period of time. As trivial as this sounds, almost anything can be thought of as a time series. Your average heart rate per hour over a month or the daily closing value of a stock over a year or the number of vehicle accidents in a certain city per week over a year. Recording this information over any uniform period of time is considered as a time series. The astute would note that for each of these examples, there is a frequency (daily, weekly, hourly etc) of the event and a length of time (a month, year, day etc) over which the event takes place.
For a time series, the metric is recorded with a uniform frequency throughout the length of time over which we are observing the metric. In other words, the time in between each record should be the same.
In this tutorial, we will explore how to use past data in the form of a time series to forecast what may happen in the future.
OBJECTIVE
The objective of the algorithm is to be able to take in a sequence of values, and predict the next value in the sequence. The simplest way to do this is to use an Auto-Regressive model, however, this has been covered extensively by other authors, and so we will focus on a more deep learning approach to this problem, using recurrent neural networks
DATA PREPARATION
Let’s have a look at a sample time series. The plot below shows some data on the price of oil from 2013 to 2018.


Many machine learning models perform much better on normalised data. The standard way to normalise data is to transform it such that for each column, the mean is 0 and the standard deviation is 1. The code below provides a way to do this using the scikit-learn library.

This is simply a plot of a single sequence of numbers on a date axis. The next table shows the first 10 entries of this time series. Just looking at the date column, it is apparent that we have price data at a daily frequency.
We also want to ensure that our data has a uniform frequency - in this example, we have the price of oil on each day across these five years, so this works out nicely. If, for your data, this is not the case, Pandas has a few different ways to resample your data to fit a uniform frequency.
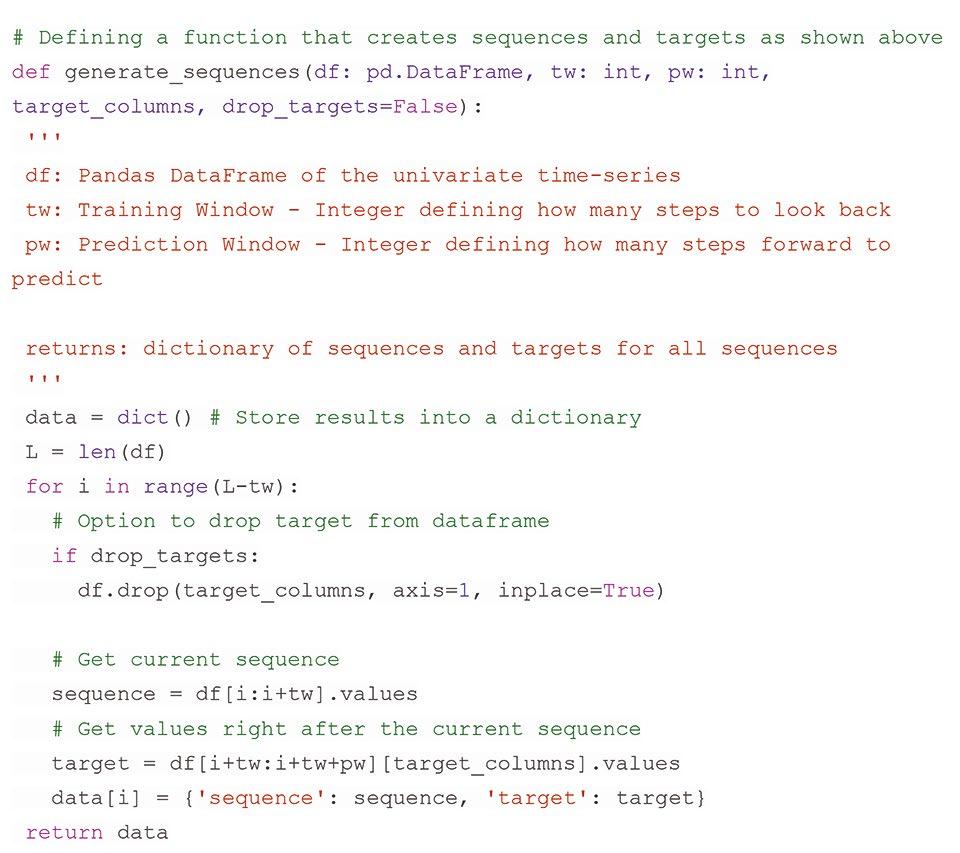
SEQUENCING
Once this is achieved, we are going to use the time series and generate clips, or sequences of fixed length. While recording these sequences, we will also record the value that occurred right after that sequence. For example: let’s say we have a sequence: [1, 2, 3, 4, 5, 6].
By choosing a sequence length of 3, we can generate the following sequences, and their associated targets:
Another way to look at this is that we are defining how many steps back to look in order to predict the next value. We will call this value the training window and the number of values to predict, the prediction
TIME SERIES
[Sequence]: Target [1, 2, 3] → 4 [2, 3, 4] → 5 [3, 4, 5] → 6
THE DATA SCIENTIST | 23
Image by author.
window . In this example, these are 3 and 1 respectively. The function below details how this is accomplished.
MODEL ARCHITECTURE
The class below defines this architecture in PyTorch . We’ll be using a single LSTM layer, followed by some dense layers for the regressive part of the model with dropout layers in between them. The model will output a single value for each training input.


PyTorch requires us to store our data in a Dataset class in the following way:

We can then use a PyTorch DataLoader to iterate through the data. The benefit of using a DataLoader is that it handles batching and shuffling internally, so we don’t have to worry about implementing it for ourselves.
The training batches are finally ready after the following code:
At each iteration the DataLoader will yield 16 (batch size) sequences with their associated targets which we will pass into the model.
24 | THE DATA SCIENTIST TIME SERIES
This class is a plug n’ play Python class that I built to be able to dynamically build a neural network (of this type) of any size, based on the parameters we choose - so feel free to tune the parameters n_hidden and n_deep_players to add or remove parameters from your model. More parameters means more model complexity and longer training times, so be sure to refer to your usecase for what’s best for your data.


As an arbitrary selection, let’s create a Long ShortTerm Memory model with 5 fully connected layers with 50 neurons each, ending with a single output value for each training example in each batch. Here, sequence_ len refers to the training window and nout defines how many steps to predict; setting sequence_len as 180 and nout as 1, means that the model will look at 180 days (half a year) back to predict what will happen tomorrow.
Here’s the training loop. In each training iteration, we will calculate the loss on both the training and validation sets we created earlier:
MODEL TRAINING
With our model defined, we can choose our loss function and optimiser, set our learning rate and number of epochs, and begin our training loop. Since this is a regressive problem (i.e. we are trying to predict a continuous value), a safe choice is Mean Squared Error for the loss function. This provides a robust way to calculate the error between the actual values and what the model predicts. This is given by:


The optimiser object stores and calculates all the gradients needed for back propagation.

THE DATA SCIENTIST | 25 TIME SERIES
Now that the model is trained, we can evaluate our predictions.
INFERENCE
Here we will simply call our trained model to predict on our un-shuffled data and see how different the predictions are from the true observations.
For a first try, our predictions don’t look too bad! And it helps that our validation loss is as low as our training loss, showing that we did not overfit the model and thus, the model can be considered to generalise well - which is important for any predictive system.
With a somewhat decent estimator for the price of oil with respect to time in this time period, let’s see if we can use it to forecast what lies ahead.
FORECASTING
If we define history as the series until the moment of the forecast, the algorithm is simple:
1. Get the latest valid sequence from the history (of training window length).
2. Input that latest sequence to the model and predict the next value.

3. Append the predicted value on to the history.
4. Repeat from step 1 for any number of iterations.
One caveat here is that depending on the parameters chosen upon training the model, the further out you forecast, the more the model succumbs to it’s own biases and starts to predict the mean value. So we don’t want to always predict too far ahead if unnecessary, as it takes away from the accuracy of the forecast.
This is implemented in the following functions:


Let’s try a few cases.
Let’s forecast from different places in the middle of the series so we can compare the forecast to what actually happened. The way we have coded the forecaster, we can forecast from anywhere and for any reasonable number of steps. The red line shows the forecast. Keep in mind, the plots show the normalised prices on the y-axis.
26 | THE DATA SCIENTIST TIME SERIES
Normalised Predicted vs Actual price of oil historically. Image by author.
Forecasting 200 days from Q3 2013. Image by author.

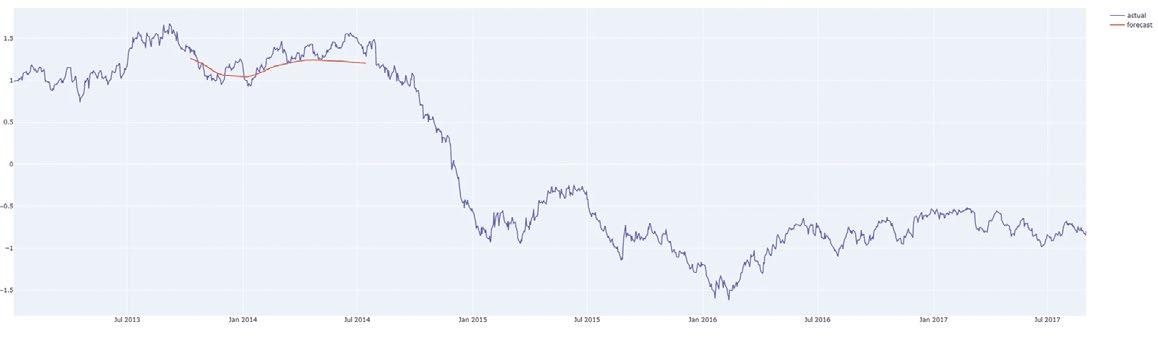


Forecasting 200 days from EOY 2014/15. Image by author.

Forecasting 200 days from Q1 2016. Image by author.
Forecasting 200 days from the last day of the data. Image by author.
And this was just the first model configuration we tried! Experimenting more with the architecture and implementation would definitely allow your model to train better and forecast more accurately.
CONCLUSION
There we have it! A model that can predict what will happen next in a univariate time series. It’s pretty cool when thinking about all the ways and places in which this can be applied. Yes, this article only handled univariate timeseries, in which there is a single sequence of values. However there are ways to use multiple series measuring different things together to make predictions. This is called multivariate time series forecasting, it mainly just needs a few tweaks to the model architecture which I will cover in a future article.
The true magic of this kind of forecasting model is in the LSTM layer of the model, and how it handles and remembers sequences as a recurrent layer of the neural network.
THE DATA SCIENTIST | 27
TIME SERIES
Simplify Hiring with Data Science Talent
From the moment he started working in Data Science in 2014, Damien was determined to make Data Science recruitment easier by creating a new kind of company. One that would harmonise the desires of both job seekers and employers and create a perfect match.
He knew recruitment consultants needed to do more than just forward resumes and conduct basic qualifications.

That’s why he envisioned a company that would offer a full assessment capability, deep sector understanding and expert candidate attraction.
On August 1st, 2016, Data Science Talent was born. Damien and his team were dedicated to understanding the Data Science sector. They immersed themselves in the industry, participating in hackathons and attending events like ODSC to gain valuable insights.

But as they delved deeper into the industry, they found a couple of big roadblocks.
Nobody could agree on what to call the different roles in a Data Science team.
Job descriptions, marketing, and candidate assessments in tech recruitment were messy. It was even worse in Data Science because of the broad nature of the discipline.
Fortunately, Damien had lots of experience with profiling systems and saw an opportunity to create a more advanced tool for Data Science. After two years of hard work, Damien developed the DST Profiler®. He hired a software engineer and a Data Scientist - who together, had interviewed over 350 Data Scientists over a 20 year career - to build the system.
Meet Damien Deighan, founder of Data Science Talent. He’s on a mission to improve hiring and make Data Science and Engineering recruitment better.
The goal is to make life better for companies looking to hire and for job seekers looking for their next career move.
By making the hiring process more transparent, it helps people find the perfect job that matches their skills and career ambitions.
But the benefits of the DST Profiler® don’t stop there.
By identifying the specific skill sets and strengths required for each role, the DST Profiler® can find the right candidates who are the best fit for your team and your business.


Meaning boosted productivity, skyrocketing job satisfaction, and dramatically lower turnover rates.
Isn’t that everyone’s dream?
Find your next hire today at datasciencetalent.co.uk

The DST Profiler® is a system that identifies skills and strengths and defines the eight profiles found across corporate Data Science and Engineering teams.
100% iPad
WHAT IS CAUSAL INFERENCE AND WHY SHOULD DATA LEADERS AND DATA SCIENTISTS PAY ATTENTION?
By GRAHAM HARRISON
INTRODUCTION
Causal inference is the application of the combination of statistics, probability, machine learning and computer programming in understanding the answer to the question “why?”.
In my work as a Data Scientist I have developed and implemented many machine learning algorithms that produced accurate predictions that have added significant value to organisational outcomes.

For example, accurate predictions of staff churn allow proactive intervention to support and encourage likely churners to stay and that insight can increase staff productivity and decrease recruitment costs.
However, that may not be enough. Following one successful machine learning prediction project one of the business domain experts approached me and asked, “why are the staff members identified as churners leaving the organisation?”
Dipping into my Data Science tool bag I used SHAP (SHapley Additive exPlanations) to show what features were contributing the greatest weights to the overall prediction and to individual cases.
This helped the customer to understand more about the way the algorithm worked and prompted their next
question - “What do I need to change to stop churn happening in the first place rather than just intervening for staff that might leave?”
This prompted me to do some research which led to some revelatory conclusions.
PREDICTION DOES NOT IMPLY CAUSATION
We all know the saying “correlation does not imply causation” but at the time I had not appreciated that this is equivalent to “prediction does not imply causation” for machine learning models.
Predictive models use the available features greedily to make the most accurate predictions against the training data. It may be the case that there are no causal links in the features that enable the best predictions and in the world of big data that may not matter.
If a retailer knows that every time it rains sales of butter will increase and this prediction is reliable, they will not care that there is no likely causal link, they will just stock the shelves with dairy products whenever the storm clouds gather.
Another example is the prediction from data that people who go to bed in their shoes are correlated with next-day headaches, but the shoes have no causal link.
30 | THE DATA SCIENTIST CAUSAL INFERENCE
Rather the causality may be attributable to the previous night’s alcohol related activity, but an algorithm that relies on the “shoes” feature can make accurate predictions, even though taking your shoes off is no headache cure.
A more serious implication is that I could not use the churn algorithm to answer the “why?” question for my customer. Prediction does not imply causation and hence taking pre-emptive action based on the correlative features in the model has the potential to cause neutral or even harmful outcomes.
The revelation that predictive models could not be used reliably to suggest preemptive and preventative changes to organisations led me to begin a learning journey into causal inference that has lasted ever since.
DESCRIPTIVE, PREDICTIVE AND PRESCRIPTIVE ANALYTICS
Descriptive analytics is the science of looking backwards at things that have already happened and making sense of them through a variety of techniques including graphs, charts, tables, interactive dashboards and other rich forms of data visualisation.
Good descriptive analytics enables leaders to make informed decisions that positively impact organisation outcomes whilst avoiding bias, noise and gut instinct.
Some approaches like data warehousing may involve data that is hours or even days out of date but even the most current descriptive data systems, for example the heads-up display in a fast jet, are still a few microseconds behind the real world.
Predictive analytics bucks that trend by probabilistically predicting what entities of interest like customers, suppliers, products, demand, staff etc. are likely to be doing in the next hour, day, month or year.
The insight gained through those predictions can then be used to inform interventions to improve organisational impact and outcomes (for example more sales or less staff churn).
Prescriptive analytics goes beyond understanding the past and making predictions about the future. It is the business of making recommendations for change informed by data, models and domain expertise that can improve outcomes by fundamentally altering the future that the models were predicting would happen.
For example, in the staff churn model it was identified that month when the staff started their employment was a feature that the model used to inform its predictions.
That naturally leads to the question - “if staff start dates were delayed or accelerated to match the start month associated with the least churn, will churn decrease?”
This is the sort of question that causal inference techniques are starting to ask and answer and the
potential to add this type of analysis to the Data Science tool bag is why Data Scientists and leaders should pay attention to causal inference.
WHAT IS CAUSAL INFERENCE?
One potential definition of causal inference is “the study of understanding cause-and-effect relationships between variables while taking into account potential confounding factors and biases ”.
Central to this idea is that causality cannot be established from the data alone, it needs to be supplemented by additional modelling elements to allow cause-and-effect to be proposed, explored, tested, established and used to prescribe outcomes.
For example, if we collected binary data for recording days when a cockerel crowed and the sun rose and asked the simple question “is the sun causing the crowing or vice-versa?” How would we know?
The answer seems obvious and trivial but primitive civilisations had different theories about the cause of celestial events and our intuitive answer is informed by domain expertise - we know that the sun is a 1.4m kilometre, 15m degree Celsius celestial object and that the cockerel is a male chicken that cannot influence the sun.
We have supplemented the observed data with domain knowledge that can be formalised into a diagram like the following…
This type of diagram is called a “Directed Acyclic Graph” (or DAG) which is commonly shortened to “Causal Graph” or just “Graph” and it is the combination of a DAG and the observed data which forms the building blocks of causal inference techniques.
You may be thinking “is this cheating?” as we have leapt from no understanding of the causality to a hard statement about the cause-and-effect. In real-world examples DAGs are developed in consultation between Data Scientists and domain experts and once proposed there are methods for testing or “refuting” them to ensure that the proposal is reasonable.
There is another advantage to developing an understanding of DAGs which is not discussed in books and articles and that does not require any technical understanding of causal inference or the associated statistical and machine learning techniques.
As a Data Scientist and senior manager, I often find myself in management meetings listening intently to leaders’ views on what is happening in their organisations and what they believe the impacts and outcomes are.
THE DATA SCIENTIST | 31 CAUSAL INFERENCE
Figure 1 - Causality Between Sun Rising (S) and Cockerel Crowing (C)
S C
Almost unconsciously I have found myself starting to doodle the causal relationships in a rough DAG and then backtracking down the arrows from effect to cause to underlying cause and interjecting in those meetings to ask, “is A the cause of B and how do you know?”
In this respect I am embedding causality into my daily habits and enabling and encouraging others to think the same way. Thinking about causality is adding value and delivering tangible benefits informally without going anywhere near a machine learning model!
CONTROL TRIALS AND CONFOUNDING
There is nothing new about causal methods per se; they have been around for a long time and are tried and tested in statistical and observational methods.
For example, if the causal effects of a new drug need to be established then A/B testing groups can be set up with group A given the drug and group B given no drug or a placebo.
The recovery outcomes of the two groups can then be measured and conclusions drawn about the efficacy of the new drug to inform whether it should be approved, withdrawn or recommended for further testing.
There are several problems with this approach. First, let us imagine that individuals were given the choice whether they wanted to join Group A and take a new drug or Group B and take the placebo.
One likely issue is that the groups could become self-selecting. It might be the case that more fit and healthy people choose to join Group A who are more likely to have a better recovery irrespective of the drug. A potential solution is to randomly select individuals for the groups and to not tell them whether the pill they are taking is the drug or a placebo which overcomes the self-selection problem.
There are other challenges though. What if assigning individuals into the groups were immoral or unethical?
For example, if the study is looking at the effect of smoking or the effect of obesity how could the individuals be forced to smoke or to be obese? In this instance it is impossible to avoid the self-selecting problem without serious ethical concerns.
Yet another problem is that the trial we are interested in may already have taken place. It is possible that the individuals have been assigned, the drug taken and the outcomes and observations carefully recorded but it is too late to influence the group membership.
It turns out that all of these problems can be addressed by understanding and applying causal inference techniques including the apparent magic trick of going back in time to simulate everyone either taking or not taking the drug.
BACKDOOR ADJUSTMENT
Returning to the drug example, what if something that
cannot be controlled is having an impact on the trial?
For example, what if males are more likely to take the drug but females have a better recovery rate? In this instance gender will influence both the treatment (whether the drug is taken) and the outcome (the recovery rate).
That sounds like an intractable problem, but the start point is always a Directed Acyclic Graph…
The terminology used in causal inference is that G is confounding D and R. Simply stated, the isolated effect of the drug on recovery is mixed in with the effect of gender on both taking the drug and recovery.
The desired outcome is to “de-confound” or isolate the impact of the drug on recovery so that an informed choice can be made about whether to recommend or withdraw the drug.
The pattern of causality in Figure 2 is called “the backdoor criterion” because there is a backdoor link between D and R through G and this causes the true effect of the drug to be lost because it is mixed in with the effect of gender.
This could be the end of the road for the usefulness of the historical observational data but causal inference techniques can be applied that are capable of simulating the following -
1. Travelling back in time and forcing everyone in the trial to take the drug.
2. Observing and recording the impact on recovery.
3. Repeating the time-travel trick and this time forcing everyone to avoid the drug.
4. Observing and recording the impact again.
5. Performing a simple subtraction of the first set of results from the second to reveal the true effect of the drug on recovery.
The “interventions” at points 1 and 3 are expressed as -
1. P(Recovery=1 | do(Drug=1)) i.e., the probability of recovery given an intervention forcing everyone to take the drug
32 | THE DATA SCIENTIST CAUSAL INFERENCE
Figure 2 - Causality Between Drug (D) and Recovery (R) and Gender (G)
D R G
2. P(Recovery=1 | do(Drug=0)) i.e., the probability of recovery given an intervention forcing everyone to not take the drug.
Causal inference implements this magic trick by applying something called “the backdoor adjustment formula” -
effect on churn but not only was it not measured but no-one had any idea how to measure it.
In the example in Figure 5 below, if something is confounding both the drug taking and recovery, but nothing is known about it and no measurements have been taken, surely it must be impossible to repeat the magic of backdoor adjustment?
A detailed explanation of the maths can be found in my article on the Towards Data Science website ¹ but the key takeaway is that the intervention on the left hand side i.e. P(Y Z do(X)) can be rearranged and expressed purely in terms of observational data on the right hand side.
From this point there are only a few more steps to be able to de-confound or isolate the effect of any treatment on any effect no matter how complex the causal relationships captured in the DAG or how big the dataset is.
When I first understood the implications of backdoor adjustment it was a light-bulb moment for me. I suddenly saw the potential for starting to answer all those “whatif?” type questions that domain users inevitably ask in their desire not only to intervene on predictions but create a new future for their organisations.
However, the magic of causal inference does not stop there, it gets even better!
FRONT-DOOR ADJUSTMENT
Returning to the drug example again, let us assume that the gender of the participants was confounding both the drug taking and recovery but that it had not been recorded during the observations -
Well, not quite. If the causal relationships are limited to just the treatment and outcome then the effect of the unobserved confounder cannot be isolated, but if there is an intermediary between drug taking and recovery it can be done. Here is an example -
This pattern is called an “unobserved confounder” and it is very common in causal inference. For example, in the staff churn example the data team became convinced that “staff commitment” was having a causal
In this example, taking the drug (D) has a causal impact on blood pressure (B) and this change in blood pressure is then having a causal impact on recovery (R). The confounder of both taking the drug and recovery remains unobserved.
When this pattern exists front-door adjustment can be applied to isolate the effect of D on R even where an unobserved confounder affects both -
If you are interested in the maths, please check out my article on the Towards Data Science website ² but again the key takeaway is that the “intervention” expressed on the left hand side can be re-written and expressed solely in terms of observational data on the right hand side. (Please note that in the drug trial example D=X, R=Y and B=Z).
This was another revelatory moment for me. At the time I had begun researching front-door adjustment I had been working on a project that had shown a clear correlation between students engaging in physical activity and positive learning outcomes. However, a theory emerged that more committed students may have chosen to engage in the activity and also studied harder for their exams which might have confounded the effect of the physical activity.
THE DATA SCIENTIST | 33
Figure 3 – The Backdoor Adjustment Formula
Figure 4 – An Unobserved Confounder (U)
Figure 6 – The Front-door Criteria
Figure 7 – The Front-door Adjustment Formula
D R
CAUSAL INFERENCE U G
D R B
“Learner commitment” was an unobserved confounder and hence the front-door adjustment formula was applied to demonstrate that the activities were having a positive impact on outcomes irrespective of any confounding.
I hope by now you are starting to feel a stir of excitement about the possible applications of causal inference techniques and thinking about how you might apply them to deliver meaningful impact and outcomes.
THE CHALLENGES AND LIMITATIONS OF CAUSAL INFERENCE TECHNIQUES
As with any branch of machine learning there are challenges and limitations that need to be understood and appreciated in order to know when causal inference is and is not an appropriate tool.
One of the biggest challenges is the relatively immature state of the publicly available libraries that provide implementations of causal inference for Python and other programming languages.
There are a number of libraries that are emerging as the front runners. Two that I have used extensively are pgmpy ³ and DoWhy ⁴
Pgmpy is more light weight, making it easy to use whilst DoWhy has more advanced features but is more difficult to get started with. Both have challenges and limitations.
Machine learning algorithms like linear regression and classification have been standardised in the scikit-learn library. All the predictors in sklearn implement the same interface so they are easy for Data Scientists to learn and the interfaces are so intuitive that it is not necessary to have a deep knowledge of the maths in order to use them.
In contrast there is no standardisation across causal inference libraries and whilst DoWhy can do some impressive things it requires a lot of dedicated research and effort to become competent. Also, the documentation is weak and there are nowhere near as many coding examples as there are for more traditional machine learning algorithms.
Beyond the challenges of getting started, all the current causal inference libraries have functionality limitations. For example, pgmpy can perform a backdoor adjustment but it does not work for unobserved confounders. It does not implement front-door adjustment or another common technique called instrumental variable.
DoWhy does implement backdoor, front-door and instrumental variable for a causal calculation called “Average Treatment Effect” (ATE) but it does not work for unobserved confounders in “do” operations.
So if you want to develop causal inference solutions you will have to spend more time learning the theory than you would for a regressor or classifier and you will likely have to dance around the limitations of the existing libraries.
However, I have generally found that the answers
are out there in books and online articles if you look hard enough and the number of available resources are increasing in volume and quality all the time.
Another limitation is that the DAG must accurately capture the causal relationships or the calculations will be wrong. There are emerging techniques for testing or “refuting” a proposed DAG but this stage will always require domain expertise and hard work as DAGs cannot be established from the data alone.
In my experience though, domain users enjoy getting involved in working out the causal relationships and well-facilitated workshops and analysis sessions usually produce good DAG models to use in the calculations.
There are also moral and ethical concerns but these are common to all machine learning and artificial intelligence and can be addressed by considering transparency, giving the control to the customers (i.e., automatic opt-out, voluntary opt-in) and by building solutions that deliver clear customer benefit.
THE FUTURE OF CAUSAL INFERENCE
It is natural for human beings to think about “what-if?” type questions, for example -
y “Would I have got home earlier if I had taken the bypass rather than driving through town?”
y “Where would I be now if I had taken that job opportunity?”
y “What would have happened if I had invested my money in Fund A rather than Fund B?”
Whereas there is no empirical proof for this theory, it is reasonable to assume that human beings may create a version of a DAG inside their minds and then re-run different scenarios to imagine what today would be like if yesterday had been different, or what tomorrow might look like based on the choices available today.
Descriptive and predictive analytics will always be mainstays of Data Science, but causal inference will add another set of tools into the Data Science tool bag with the potential to contribute to organisational and societal outcomes by answering the big questions like “why?” and “what if?”.
After all, if you had the choice of having a regression model that could interpolate the expansion of the universe back to 300,000 years after the big bang or a causal model that could tell you why the universe was created, which one would provide you with the most startling insight?
34 | THE DATA SCIENTIST
¹ towardsdatascience.com ² towardsdatascience.com ³ pgmpy.org ⁴ pywhy.org/dowhy CAUSAL INFERENCE
LONDON DATA SCIENCE CITY #3
One of the most vibrant, exciting, and cosmopolitan cities in the world, London is a melting pot of cultures and traditions. A city where history and modernity blend seamlessly. Cool, historic, contemporary, traditional, hip - London has it all, and is one of the world’s leading Data Science and AI hot-spots.

THE DATA SCIENTIST | 35
London DATA SCIENCE CITY
Overview of London
As the capital and largest city of England and the United Kingdom, London (what the Romans called Londinium ) has been a major settlement for almost 2,000 years. Boasting a population of almost 9 million, London is divided into 32 boroughs, each with its own distinct character and attractions.
The River Thames dissects the heart of the city, and places and people are often tagged as either being north or south of the river. Along its banks, you can find some of the most iconic landmarks in the world, such as the 11th century Tower Bridge, the London Eye, The Tate Modern, The Cutty Sark, and the Houses of Parliament.
Founded by the Romans, the City of London (also known as ‘The Square Mile’ or ‘The City’) is the ancient core and financial centre. The City of Westminster, to the west of the City of London, has hosted the national government and parliament for centuries. London’s other neighbourhoods radiate out from the centre, and in many ways are a series of villages, each with their own identity.
London is also home to some of the world’s most iconic royal landmarks including Buckingham Palace, the official residence of the British monarch. The Tower of London is home to the Crown Jewels, whilst other notable royal landmarks in London include Kensington Palace and St. James’s Palace-the official residence of the Sovereign since the 17th century.
London is also justly famous for its museums and galleries, many of which are free to visit. The British Museum, The V&A, The Science Museum, The National Portrait Gallery, The National Gallery, and The Tate Modern are just a few of the world-class institutions that attract millions of visitors each year. Add this to an amazing array of theatre, nightlife, shopping, sport, and dining opportunities, then you can see why London really is a city that has something for everyone.
Data Science Higher Education in London
Both Data Science degrees and Masters in London are offered by a variety of universities, including the University of London, King’s College London, University College London, and the London School of Economics and Political Science.
The University of London offers a Data Science MSc, PGDip, and PGCert, which provides students with an indepth understanding of emerging technologies, statistical analysis, and computational techniques.
King’s College London offers a Data Science MSc, which provides students with advanced technical and practical skills in the collection, collation, curation, and analysis of data.
University College London offers a Data Science and Machine Learning MSc. This degree provides students
7 things you may not know about London
1. The city has over 300 languages spoken within its borders, making it one of the most linguistically diverse cities in the world.
2. The city boasts over 8 million trees, making it one of the greenest cities in the world.
3. The original London Bridge was dismantled and sold to an American entrepreneur in the 1960s where it was rebuilt.
4. Author J.M Barrie made the brilliant gesture of gifting the rights of Peter Pan to Great Ormond Street Hospital, ensuring that all of the royalties from every related version goes there.
5. The majority of the London Underground actually runs above ground surface level.
6. At the Start of World War 2, London Zoo killed every venomous animal just in case they managed to escape into the city if the zoo was bombed.
7. London has a crying church. St. Bartholomew The Great Church gains its nickname the ‘weeping church’ because when the weather gets cold and wet, the stones of the church become porous.
with introductory machine learning, by becoming familiar with the conceptual landscape of machine learning and developing practical skills to solve real world problems using available software.
The London School of Economics and Political Science offers an MSc Data Science, providing students with training in data science methods, emphasising statistical perspectives.
36 | THE DATA SCIENTIST
DATA SCIENCE CITY: LONDON
Data Science & Tech Hot-Spots in London

If you’re a Data Science or technology professional, London is a real player on the world stage. Some of the major sectors and industries using Data Science on a large scale are finance, healthcare, transportation, and retail. Companies and organisations with their HQ or a large presence in the city include the likes of HSBC, JP Morgan, DeepMind, Standard Chartered, BlackRock, Twitter, Apple, Bloomberg, Deliveroo, Barclays, and Spotify.
London also has a number of tech hot-spots too, such as:
Tech City: Located in East London, Tech City is the hub of the city’s technology industry, with numerous startups, co-working spaces, and accelerators. Don’t miss the Silicon Roundabout, which is the nickname for the area around Old Street.
The Alan Turing Institute: Named after the famous mathematician and computer scientist, the Alan Turing Institute is the UK’s national institute for Data Science and artificial intelligence research. Located in the British Library in King’s Cross, it offers workshops, seminars, and talks on data science and AI.
The Science Museum: Located in South Kensington, this is a must-visit for technology enthusiasts. It has a range of exhibitions on science and technology, including the Information Age gallery, which explores the history of communication technology.
The Barbican Centre: This is a world-class arts and learning centre located in the heart of the city. It hosts a range of events, including technology-focused exhibitions and talks.
Imperial College London: One of the world’s leading science and engineering universities. It has a strong focus on technology and Data Science, with research centres and courses dedicated to these areas.
Google Campus: This is a co-working space for startups and entrepreneurs located in Shoreditch. It offers a range of events, talks, and workshops on technology and entrepreneurship.
The British Computer Society: The professional body for the UK’s IT industry, The British Computer Society hosts events and talks on technology and Data Science, and also offers professional development courses in these areas.
THE DATA SCIENTIST | 37 DATA SCIENCE CITY: LONDON
Data Science Meet-Ups in London
A buzzing Data Science city ensures that there are a number of meet-ups for those within the sector - and the UK’s capital city is no different. Some of the main ones in London include:
Data Science London:
This is one of the largest Data Science communities in Europe. This diverse group meets regularly to discuss various Data Science issues, projects and methods. meetup.com/data-science-london
Big Data LDN:
Run by the creators of Big Data LDN, these events boast a series of global industry experts discussing the Data Science issues that affect you and your organisation. bigdataldn.com/meetups
The Data Science Speakers Club: Meeting fortnightly, this Toastmasters International Club hosts a range of Data Scientists, Entrepreneurs, and Innovators that help attendees to develop and refine communication and leadership skills. meetup.com/datasciencespeakers
London Business Analytics Group: A community Data and Analytics group that is now almost a decade old. They host regular inperson and online talks and events that are free to attend.
meetup.com/London-Business-AnalyticsGroup
KEY DATA SCIENCE & TECH CONFERENCES IN LONDON
MAY 16-17th
Conversational AI Summit
Discover advances in NLP and how applications can help create digital assistants, chatbots and conversational interfaces to improve customer experience & increase engagement. Topics include: Predictive Intelligence; Natural Language Understanding; Chatbots; Conversation Design; Virtual Agents: Natural Language Processing; MultiChannel Integrations and Scalability; Machine Learning; UX Design; and Generative AI.
JUNE 7-8th
AI World Congress
Held at Kensington Conference and Event Centre, this features keynote and speakers from the likes of Orange, TELUS, Experian, IMF, JP Morgan, TECH UK and many more.
MAY 22-24th
Gartner Data & Analytics Summit
A gathering with a number of leading data and analytics leaders, this three-day summit offers solutions to the most significant challenges that organisations are facing. There will be a wealth of guest keynote speakers, experienced practitioners and Gartner experts in attendance.
JUNE 14-15th
DSC (Open Data Science Conference)
A three-day event and a Data Science community essential, a place to grow your network, build your skills, find about the latest sector tools and advances, and learn from some of the best and brightest minds in Data Science and AI. It’s a comprehensive, one-stop-event that has over 200 hours of content and 140 speakers.
SEPTEMBER 20-21st
Big Data LDN
This free, two-day event is one of the UK’s leading data & analytics conference and exhibitions.You’ll find leading data and analytics experts, who’ll help to give you the tools to deliver an effective data-driven strategy. Host to over 180 leading technology vendors and consultants, there are around 300 expert speakers in 15 technical and businessled conference theatres, it’s a great chance to network, view the latest product launches & demonstrations, and get access to free on-site data consultancy and interactive evening community meet-ups.
38 | THE DATA SCIENTIST
DATA SCIENCE CITY: LONDON
USING AI TO MAP FORESTS
IN PART 2 OF OUR INTERVIEW WITH HEIDI HURST, WE ONCE AGAIN LOOK AT THE RAPIDLY DEVELOPING FIELD OF SATELLITE IMAGING. In this issue, Heidi discusses her work at Pachama, where there is a key focus on using satellite imaging to help to tackle the complex problem of deforestation.

THE DATA SCIENTIST | 39
SATELLITE IMAGING
Heidi, can you tell us about what you’ve been up to over the past couple of years, because the field you’re in now is still satellite imaging but in a very different sector?
Of course. Around two years ago, I was working more on the defence and intelligence side of things, working on imagery analysis and machine learning to identify objects from satellite imagery. It was really interesting, and with a lot of open questions. Then, an opportunity arose to transition to working in climate tech and I was very excited to find that a lot of these same questions, around how we use satellite imagery and aerial imagery, are relevant in the world of climate as well. So, a lot of the same tools but a very, very different domain.
I transitioned to working at my current company, Pachama, in March of 2021. Pachama’s main aim is restoring nature to solve climate change: we verify carbon credits and sell them. There are a lot of claims about carbon credits that you may see online and in general. The purpose of a carbon credit is to offset an emission, for example, if I have a factory that belches out 100 tons of carbon dioxide or a carbon dioxide equivalent and I want to offset that.
Additional means that this wouldn’t have happened without the project being in place, and that’s where we find a lot of carbon projects fail - they’re in areas that would have been protected anyway or they would have regrown anyway. Traditionally verification is done through in-person measurements, which means that we send a team of guys into the forest with tape measures and wait for them to come back, which as you can imagine is a really expensive arduous time-consuming process. And there are two main consequences…
Firstly, it’s difficult to verify carbon projects, and therefore it isn’t done very frequently. And secondly, it means that it’s expensive, and because it is expensive, smaller landowners don’t have as much of an opportunity to participate. We do find that they fail from time to time and that’s why this technology is important, to give people confidence that these offsets are providing a real tangible climate benefit.
So, when you say that you sent teams into existing forests, the carbon offset is then a kind of a negative or a threat of deforestation that is being averted by providing some financial stimulation, or would it be the other way around - that there has been deforestation and it’s been reverted by planning new trees again?
Obviously, the best thing we can do for the climate rate is to reduce emissions entirely, but if we can’t do that, we can offset them, and there are a number of different ways of doing that. One way is through naturebased solutions, so either regrowing or preserving forests. However, there are a lot of difficult technical challenges in doing that. We want to make sure that when people say, “I emitted one ton of carbon, have you captured one ton of carbon?”, that the maths really adds up. You can imagine, given how wild some of these forests are, that quantifying this is non-trivial.
So, before I go too deep into that rabbit hole, that’s the overview and that’s how satellite imagery can be used.
Heidi, you mentioned that you’re verifying this carbon offset… what’s your experience with that? Are there many times when the verification fails or most of the time, it actually can be verified, it’s legitimate?
It really depends on the project. There are a number of pillars that we look for when verifying the offsets. One is, are the offsets real? Secondly, are they additional?
There are a number of different types of carbon projects. There are ones that are called ‘Avoided deforestation project’ and they are basically saying that “we think someone’s going to cut this down, but if we get in there and protect it, they won’t”. So that’s one category. Then there are ‘Reforestation projects... these are basically saying that “this area has been deforested, we’re going to plant it, monitor the trees, make sure they grow back and that will capture carbon”. And then there are also projects that are a little bit more nuanced called ‘Improved forestry management’, that improve the amount of carbon that a forest can hold, but they’re not quite as clear-cut as either don’t cut them down or we’re going to regrow them. Basically, they are somewhere in the middle.
Any landowner with a forest can make claims that there will be plans of cutting something down and then to try to make money from it. Is this a scenario that you have to deal with?
Yes, it is. It is something that we see in the broader market.
The most useful tool in understanding the value of a carbon credit is something called a ‘baseline’, and this is counterfactual as it’s what would have happened
40 | THE DATA SCIENTIST
SATELLITE IMAGING
Carbon credits are, in general, issued based on the difference between what the project developer says is happening versus what they say would have happened anyway - the difference between what the project did and what would have happened without it.
anyway. Carbon credits are, in general, issued based on the difference between what the project developer says is happening versus what they say would have happened anyway - the difference between what the project did and what would have happened without it.
The reliability of this baseline is incredibly important, because if someone comes in with a project and they say, “everything would have been deforested without me”, that puts them in a position to gain quite a lot of carbon credits if that’s true. So, a lot of our work and our research at Pachama is around understanding different baseline methodologies and ensuring that the projects that we evaluate have a reasonable baseline.
That makes a lot of sense. Can you give us a rough number, in your experience, of how many of these projects are reforestation versus deforestation projects?
In my experience, I would say there’s a lot of both. Certainly, I would say that reforestation projects are flashier and something that we’re seeing a lot of market demand for because they’re very easy to understand and provide a very compelling narrative for clients who do need verification because it turns out growing trees is really non-trivial. You have these small areas in plots of land that just don’t grow trees because of microenvironmental conditions. So, verification is still important to make sure that trees are growing and that they’re being planted in a way that gives them the chance for success.
Are there any alternatives to trees, other plants maybe? Why do trees hold so much carbon

compared to other plants?
There are certainly a lot of other options, in particular, there’s a lot of interesting research going on around blue carbon which is a source of carbon that is based in the ocean. The likes of seagrasses, kelp forests, mangroves… those are harder to monitor frankly. It’s very difficult to monitor mangroves because a lot of the carbon that’s captured is underwater. So, from a remote sensing perspective we can’t see it in the satellite image and we can’t really get a lidar return on it. It’s very difficult to monitor.
Trees are great at storing carbon. They’re just a stellar version. They also offer a relative amount of permanence. So, when we’re saying, “we want to offtake carbon”, we don’t want to offtake it for five minutes and spit it back out again. That’s not providing a tangible kind of benefit. Preferably, we want this carbon to be stored for a really long time. If you think about the lifespan of some of these organisms, there are trees that have been around for hundreds of years in the Americas, which is incredible. That carbon is being captured and embodied for a very long time in comparison to shrubs for example, which don’t last that long.
And how do you use satellite imagery for this?
We use satellite imagery in combination with a couple of other data sources, mostly lidar, to estimate the amount of biomass in a given area. The idea being that if we can estimate biomass at several different points in time, we can see how the biomass, and therefore the captured carbon, has changed - and we can use that to evaluate the validity.
In general, that’s using a lot of multispectral
SATELLITE IMAGING THE DATA SCIENTIST | 41
imagery… things like Landsat, or imagery from private satellite constellations to train neural networks to estimate the amount of biomass available. That requires a lot of training data from what are called field plots, which are field estimates of people who have gone in with tape measures and measured trees and figured out the amount of carbon. This is a difficult and important dataset. Field plots are the gold standard estimate of how much biomass and therefore how much embodied carbon is stored by an area of forest. A field plot is a forestry inventory that needs to be taken on the ground by teams that go in and measure the diameter of a tree, the height of a tree, and other forestry characteristics. We then use that to estimate the amount of carbon stored in the trees in that area.
So, that’s the core training dataset that we use in combination with remote sense imagery and then also lidar to develop these models.
And what are these neural networks trained to predict?
A lot of this work is still being developed. So, in some cases we’re training it to estimate canopy height. If we can estimate canopy height, that can be a useful proxy for biomass. In some cases, we have tried to estimate biomass directly. There are a lot of different components to understand these models, and sometimes canopy height can be an input into a larger model. So, maybe we try and extract canopy height from imagery and then use some of the hyperspectral bands that get us into chlorophyll, for example, to sense how green something is, and use that as a proxy for how much vegetation there is.
There are a lot of different things that we’re trying to train for.
So, does the foliage play a major role in storing the carbon?
No, the foliage doesn’t play a huge role in the carbon capture. Most of the carbon is either captured in the body of the tree and the wood, or in its root systems. Depending on the type of tree, it’s usually broken into above ground biomass and below ground biomass. So, a lot of carbon can be stored in the root and the root system. That doesn’t even begin to touch the carbon that can be stored in the soil, which is not something that we work on estimating and is a separate, very difficult problem.
To be a little bit more specific, often what we’re looking at estimating is the above ground biomass portion. Leaves can be a useful indicator of where there’s a tree and so, it’s not so much that the leaves
themselves are where the carbon is being stored but rather that the leaves are a good way to identify highlywooded areas.
There is a lot of really cool innovation going on right now in climate tech in general. There are start-ups that are trying to do direct air capture, so they literally just hoover CO2 right out of the air and bury it underground or compress it, or use it for other sources. There are also a lot of cool sort of manmade initiatives. Trees are like the original, they’ve evolved for thousands of millennia to do exactly this. So, they’re such a great tool in the fight against extreme climate change.
We talked about basically measuring the capacity of existing forests - how about areas where deforestation already took place, do you use satellite imagery also for that?
Yes, we do. Areas where deforestation has already taken place where you’re initiating a reforestation project come with a different set of challenges. One of the challenges is that, depending on the dataset you are using, trees are really small from space if they’re babies. So, if you’re looking at a fully grown forest, if you’re looking at a really dense rainforest, you can see that from space. If you’re looking at twigs in a field that you’re hoping will become trees, you can’t really see that.
So, in the earlier stages of reforestation projects, we rely much more heavily on either field crews or local airborne imagery, because spaceborne imagery just doesn’t have the resolution to pick up on some of those things.
You mentioned a third type of carbon capture, increasing the carbon density of existing forests. Can you explain how that works?
These projects are called IFM or Improved Forestry Management. Basically, these focus on supporting whoever owns the forest and helping them to manage the forest in a better way, a way that allows it to capture more carbon without sacrificing some of the objectives of whoever owns it.
One example… in some particular forests, there has been some really compelling pieces of research showing that most of the carbon or a good chunk of the carbon is contained in relatively few trees. So, the older grizzlier, gnarlier trees that have been around for a long time hold much more carbon than some of the younger trees. So if
42 | THE DATA SCIENTIST
SATELLITE IMAGING
There’s a lot of interesting research going on around blue carbon which is a source of carbon that is based in the ocean
you are holding an IFM project, perhaps one way of making sure that you contain as much carbon as possible is by only removing younger trees or by creating opportunities for larger trees to continue to grow.
That’s one example, there are many more.
There’s more carbon in the atmosphere to make plants grow faster, isn’t that helping with reforestation?

That’s a great question.
We are seeing some instances of what’s called ‘global greening’, so things are, overall, more green. But I think the difficulty is that it’s not just about more carbon. We’re seeing these broader weather systems at play and so we’re seeing desertification happening. We’re seeing human-induced destruction of the Amazon rainforest. And so, I think there’s a lot of complex things happening beyond just additional carbon dioxide in the atmosphere.
So, when you work with this kind of data, what is the biggest challenge that you’re facing? Well, it’s a lot of data. I think this is a challenge that anybody who works with satellite imagery faces. So, there is a lot of data - and you need to be able to process it. A lot of the challenges in the technology are similar, and so the data is large and you need a lot of it, and you need high resolution data for certain things.
So, when I was looking at aircraft previously, if you want to be able to differentiate different types of aircraft you need higher resolution. And similarly, if you care about delineating tree crowns for example, you’re going to need high resolution imagery. Those are similar challenges.
Another challenge is co-registration of different
pieces of information. If you have satellite imagery, lidar, and field plots - and you’re trying to make use of those altogether, you need to make sure that they’re aligned properly. This can be very challenging. If you have a field plot, even one that has the latitude and longitude of every tree, it’s very difficult to get a reliable GPS signal under a dense forest canopy, and so making sure that those pieces of data are all properly aligned so that your models are meaningful is a kind of a non-trivial challenge at times.
And can you give us a sense of the scale of the data that you feed into a model when you’re training it, and maybe also for the scale of the neural network that you are using?
With regards to the scale of the data, recently, one of my colleagues has been developing a model in Brazil. It’s a country that contains a lot of the world’s rainforest, and people talk about the Amazon as the lungs. That was around 10 terabytes of data, at a relatively low resolution, and that’s just for the optical data. That doesn’t include any of the lidar or hyperspectral stuff.
When I first started working at Pachama, I was all ready to build all the models, realised we didn’t have all the data pipelines and have gone further and further into the backend pipelines…
On the modelling side, are you still experimenting and trying to find the right approach?
Yes, definitely. I think that it’s an area of active research in the private sector, Pachama, and also within the academic community at large. I expect that we’ll continue to see, as new sensors come on, more and more
SATELLITE IMAGING THE DATA SCIENTIST | 43
different approaches proliferating.
From this huge amount of input data, what are the most important sources of input? You mentioned measurements in the field, satellite imagery and basically data in different types of the spectrum… what is the most important, does the visible spectrum play a role at all or are there other parts that are more important?
Yes, the visible spectrum does play a role. But I think in general, multispectral is something that we pull from. Simple things, like the Normalised Density Vegetation Index or NDVI is composed from just the eight multispectral bands from Landsat, of which I think it uses four.
What does multispectral mean, is it infrared, or UV or is it even further away from visible light?
It will be infrared and UV, yes, and the only distinction that we make at least between multispectral and hyperspectral is something like Landsat would be considered multispectral. You’ve got eight bands, three of which are in the visible spectrum. Whereas hyperspectral, you have hundreds of bands or much more narrow wavelengths. So, at present we’ve only been using multispectral imaging.
And do weather obstructions play a role? I would imagine if you look at a forest from above with a lot of fog or clouds and things that can happen, maybe there’s no daylight.
Correct. Weather obstructions are a huge pain point because a lot of the areas that we’re trying to monitor right now are in dense rainforests, and there’s dense rain there all the time and it makes data collection really challenging. If you want to get a cloud-free image your options sometimes are very limited and in some cases, we can’t find a single cloud-free image because these areas receive such dense rain.
So yes, it’s a huge challenge. Occasionally we collect our own data from airborne sources and sometimes the people that we work with in Brazil will say “We can try flying again next month but, it’s going to rain forever.” Definitely, in these tropical environments, weather obstructions can be a huge challenge.
Is the humidity or the probability for rain related to the vegetation maybe? Could that be even used in a positive way?
That’s a good question, because we do see areas that have been deforested experiencing a sense of desertification, because in addition to the carbon storage benefits, trees provide a huge benefit for the landscape as a home for a wide range of animals, but also they hold on to soil, they improve broader drainage quality.
So, I don’t know. I’ll run that by the team and see if anybody can think of anything. That’s a great question though.
For trying to solve this problem basically of verifying carbon capture technologies, what do you think is the impact that machine learning has on this? Would this be something that would possibly be without it or is the use of data and machine learning a massive improvement in this area?
Our hope, and the premise on which Pachama was founded, is that machine learning is going to be a huge force-multiplier in this space . As I said before, previously the industry standard for carbon verification was sending people into the forest maybe once every five years. This is time consuming, costly, and prevents scaling. By using machine learning technologies, we can scale this to have more frequent updates of the state of different forests. So, we can provide higher quality, higher update data about projects which will in turn provide higher confidence in the value of these credits. And we can scale it up to larger areas, so you don’t have to be a big landowner to be incentivised to protect your forest or your land.
The hope is that it makes it faster, more reliable, cheaper, and more widely available.
Does the scalability of the approach completely depend then on data and evidence that you are developing at the moment?
Yes, absolutely, and that depends on biome. You can’t take a model that you trained in Brazil and try and run it in Sweden, it’s just not going to work. There are a lot of regional complexities that come into play.
What advancements, if any, have you seen in the last couple of years in the field of satellite imaging?
I think around two years ago, one of the things that I said was going to be really hot was small satellite constellations. And not to toot my own horn - but that was right! There have been so many small satellite constellations that have come up over the past two years.there were larger players like Planet and Digital Globe that we were already aware of, but also smaller players as well, and they ran different types of sensors. The more niche, smaller companies have really come to the fore.
I still think there’s a gap in capitalising on that data. Being a start-up in the hardware specific space and launching satellites with sensors on them is really challenging - so they haven’t taken off super rapidly. However, I do think there’s a lot of potential there.
44 | THE DATA SCIENTIST
SATELLITE IMAGING
THE VIRTUAL MILLION DOLLAR QUESTION:
SHOULD YOU INDUSTRIALISE YOUR DATA SCIENCE MVP?
BY PHILIPP M. DIESINGER , DATA AND A.I. ENTHUSIAST;
Over the past decade, the ability to quickly prototype Data Science projects has advanced significantly. However, industrialising and scaling such minimal viable products (MVPs) remains a highly complex process, involving a multitude of stakeholders and significant resources. For organisations, decisions on which MVPs to industrialise, and perhaps more crucially, which ones not to, have become increasingly important.

Industrialising Data Science MVPs requires a holistic approach that considers not only technical aspects, but also the business and regulatory requirements of the organisation. To ensure successful deployment and achieve the desired business impact, several key factors must be considered. The decision whether to industrialise an MVP can be viewed from two perspectives:
TECHNOLOGY FACTORS: such as platform and architecture considerations
PEOPLE FACTORS: including change management, adherence, and general acceptance within the organisation.
Successfully navigating these factors is critical to the effective industrialisation and deployment of Data Science MVPs.
PARTNER AT BCG X
CURRENTLY
DATA INDUSTRIALISATION THE DATA SCIENTIST | 45
HERE’S HOW TO MAKE THE RIGHT DECISION
TECHNOLOGY FACTORS
Scalability: the MVP may work well on small data sets, but as it is scaled up to production-level data, it must be able to handle increased volumes of data and computation. Distributed computing and cloud-based services can be considered for scalable and efficient processing.
Integration: the MVP will need to be integrated with other systems in the organisation’s technology stack to be useful. Consider API design, data schema, and data formatting requirements to ensure smooth integration with other systems. Integration complexity can be a significant challenge and often requires a thorough upfront assessment to not run into problems later.
Cost: industrialising a Data Science MVP can be expensive, especially when considering hardware, software, and personnel costs. Early transparency on costs can be a valuable determining factor to decide whether and how to industrialise. Consider cost optimisation strategies, such as using open-source tools and cloud-based services, to keep costs under control.
Robustness: the MVP may work well on ideal data, but it could encounter unexpected data scenarios when exposed to real world conditions. Ensure that the model can handle noisy, missing, and out-of-distribution data, and consider building in fault-tolerance mechanisms. Think about how the solution may react to significant shifts in input data and how to detect and deal with these.
Security: data is a valuable asset and must be protected from unauthorised access or manipulation. Consider which measure to implement secure access controls, encryption, and data anonymisation techniques to protect sensitive information.
Monitoring and maintenance: Data Science models are not static, and their performance may degrade over time due to changes in data distribution or other factors. Consider establishing a monitoring and maintenance system to ensure that the model is performing as expected and retraining the model as needed.
Regulatory compliance: depending on the industry and the nature of the data used, regulatory compliance may be required. Ensure that the MVP is compliant with applicable regulations, such as GDPR, HIPAA, or PCI DSS.
Data management: the industrialisation process requires a robust data management framework that ensures data quality, security, and compliance. This may involve changes to existing data management processes and the adoption of new tools and technologies.
Technology infrastructure: the technology infrastructure required for the MVP may not be sufficient for industrialisation. It’s essential to assess the current infrastructure and identify any gaps or limitations that need to be addressed.
PEOPLE FACTORS
Organisational culture and change
management: it is important to ensure that the organisational culture supports the adoption of new technology and data-driven decision-making. Data Science initiatives may require changes to existing business processes, so it’s essential to have buy-in from all stakeholders.
Communication and transparency: open and transparent communication is essential to ensure that all stakeholders are aware of the progress of the project and any issues that arise. This can help build trust and ensure that everyone is working towards a common goal.
Leadership support: s trong leadership support is necessary to ensure that the resources and budget required for industrialising the MVP are allocated effectively. Leaders should communicate the importance of the project and provide guidance on how the organisation can support the initiative.
Skills and expertise: Data Science MVPs may require specific technical and business skills to industrialise effectively. Identifying the required skills and expertise early on can help organisations assess their talent gaps and provide training or recruitment support where necessary.
46 | THE DATA SCIENTIST
DATA INDUSTRIALISATION
Stakeholder engagement: the stakeholders involved in the project, such as business users and IT teams, should be engaged early in the process to ensure that their needs are considered. Stakeholder feedback should be incorporated into the design and implementation of the solution.
Talent management: Data Science initiatives require skilled professionals with a mix of technical and business skills. The organisation should ensure that it has the talent required to industrialise the MVP and support ongoing Data Science initiatives.
Governance and control: industrialising the MVP requires robust governance and control frameworks to manage risks, ensure compliance, and maintain data quality. These frameworks should be developed in collaboration with all stakeholders and should be scalable to support future Data Science initiatives.
User adoption: the success of the industrialisation process depends on user adoption of the solution. It’s essential to involve users early in the process to ensure that their needs are considered and that they have a sense of ownership over the solution.
Collaboration and teamwork: industrialising a Data Science MVP is a collaborative effort that involves multiple teams and stakeholders. Effective teamwork and collaboration are critical to ensure that the solution is designed, implemented, and maintained to meet the organisation’s needs.
The decision to industrialise does not have to be a binary go/no-go decision. If only a few critical factors are missing, additional development time or testing can be invested, allowing the organisation to reassess the scaling decision at a later point.
Scalability
Technology
Infrastructure
Data Managemen t Regulatory Compliance
CONSIDERING INDUSTRIALISATION
Monitoring and Maintenance
Communication and Transparency
Organisational culture and change management
Collaboration and Teamwork
User Adoption
Governance and Control
PEOPLE FACTORS
Leadership Support
Skills and Expertise
Stakeholder Engagement
Talent Management
THE DATA SCIENTIST | 47
FACTORS Integration Cost Robustness Security
TECHNOLOGY
DATA INDUSTRIALISATION
THE PRINCIPLES
OF AN EFFECTIVE DATA-DRIVEN ORGANISATION
 By PATRICK MCQUILLAN
WHAT DOES IT MEAN TO BE ‘DATA-DRIVEN’?
Companies are tasked with the ever-increasing responsibility to be data-driven. This makes sense given that the global economy has more access than ever to digital information, and with the rise of resources like big data and ChatGPT there’s no surprise that accurate performance measurement and technological differentiation have become king to remain competitive in the marketplace. One of the greatest challenges in being able to leverage these resources properly is a misalignment of data literacy across organisations, particularly with senior leadership. To some leaders, being data-driven means using any sort of analytical tool (e.g. Excel, Tableau) to make
informed decisions; to others, it’s about utilising advanced analytical methods and AI to perform onceimpossible tasks. Neither of these definitions are wrong, but the value is not in the tool itself - it’s in the wellspring of information the tool draws from. The key to a successful data-driven enterprise - no matter its objective or resources - is in its ability to create a high-fidelity, end-to-end data strategy that infuses reliable insights into the day-to-day decision making of the business.
In order to integrate an effective data strategy that will survive and grow into the long term, common hurdles need to be overcome. These include:
Data illiteracy at the decision making level: Often the bottlenecks begin at the top. While there has been an explosion in the creation of executive data leadership roles (e.g. CTO, CIO, CDO) over the past decade, the lion’s share of organisations still do not have positions like these in place to prioritise a strong data and IT infrastructure. This creates a culture where advanced analytics and strong empirical decision making are replaced with an oversimplified set of executive key performance indicators (KPIs) that exist in a dashboard or static report that gets updated each month or so.
48 | THE DATA SCIENTIST
DATA-DRIVEN ORGANISATIONS
Outcomes misalignment:
Time and time again I’ve seen companies of all sizes - from $10 million startups to Fortune 100 conglomerates - lack clear alignment and stewardship on the KPIs they rely on to track outcomes. Examples of this include
(1) multiple redundant KPIs with similar names to track nearidentical outcomes, (2) definitions that are often too technical for nontechnical stakeholders to effectively communicate performance, and
(3) unclear ownership of KPIs at the individual or team level. These systematic issues breed overconfidence in reporting accuracy, increase the frequency of data blackouts/errors and the
affiliated costs of fixing them, and create an inherent lack of trust in the entire data infrastructure.
Overlooking the human factor:
Even with a strong data infrastructure in place and clear alignment on outcomes, these mean little without proper data storytelling to contextualise performance. It is particularly dangerous when these types of discussions are siloed across various teams within an organisation, leading to an organisation-wide lack of transparency and disorganised reporting. The Data Strategist has a responsibility to partner with key stakeholders across the organisation
and communicate a clear narrative that coincides with the KPIs being reported.
Of the countless companies I have worked with over the years, I have rarely seen one that is not struggling with at least one of these issues at its core. There is a need for a common set of principles to guide efforts as data-driven organisations modernise and incorporate data into their routine decision making. Particularly, these principles must give rise to a process that is selffulfilling and adaptable - even during periods of rapid change - to ensure that leaders are planting the seeds for success that is both sustainable and achievable at scale.
DATA GOVERNANCE & INFRASTRUCTURE DESIGN
The root of all analytics is ensuring access to reliable data; sourced responsibly with clear alignment on ownership, methodology, and intent. This means creating a data strategy explicitly rooted in a partnership with data and IT leaders, as well as the non-technical stakeholders whose teams are responsible for reporting on and delivering specific KPIs. This approach creates an open environment that necessitates open communication among all parties involved in providing an accountable narrative around performance.
These parties are collectively responsible for a sound, wellgoverned data infrastructure that minimises the risks of information blackouts and inaccurate reporting. This infrastructure should be based on three key principles:
Managing an internal data dictionary:
From KPI definitions (and how they’re calculated) to the
logic behind setting targets, all stakeholders must speak the same language around how performance is being measured. A data dictionary is often a one-stop-shop that ensures clear alignment and communication around outcomes, measurement methodology, and data lineage.
Invest in a resilient back end:
Whether you call it a data lake, data warehouse, data mart, or any of the other trendy conventions we hear about, it is critical to possess a high-fidelity data storage location and ETL process in place for any organisation that hopes to be competitively intelligent. This means sourcing clear and consistent data to be pulled into your back end, having rigorous cleaning processes in place that account for various potential errors that can be scaled rapidly if needed, and automating as much of this as possible to minimise manual maintenance.
Ultimately the data that is output from this process should be ready to be queried and loaded into reporting tools.
Routine QA, even on automated processes:
Too many times have I seen companies tell me that they don’t need to run regular checks on their back end because “it’s automated.” This blissful ignorance benefits no one when it comes to maintaining an IT asset, similar to how it still makes sense to check a car engine periodically. A sanity check every blue moon can save millions in preventing potential data loss or faulty reporting.
Laying the groundwork for these principles will place your organisation ahead of a vast majority of competitors in the market, who are often realising too late this needs to be done and invest twice the resources to reverse engineer a solution.
THE DATA SCIENTIST | 49
DATA-DRIVEN ORGANISATIONS
BESPOKE SELF-SERVICE REPORTING
Now that the back end is in a good place, we can talk about the fun stuff: business intelligence (BI). This is a critical inflection point where empirical analysis of the source data is translated into digestible insights for all involved stakeholders to drive decision making. These insights are often shared using one of three mediums: self-service dashboards, shared spreadsheet tools, and recurring reports issued on a regular basis. No matter the choice of medium, the result should be a reliable self-service tool that maximises value for the specific audience and relevant topic the metrics are designed to explain.
The Data Strategist responsible for designing and owning BI resources should always keep their audience in mind. Each self-service tool should have a unique layout, set
of KPIs, and forum for discussion that best suits its intended users (e.g. board of directors, C-suite, individual team managers). This also means constructing these tools using the medium that is bestsuited to your audience to that they can glean the most information in the least amount of time. The best way to evangelise data-driven efforts in any organisation is through the use of BI, which is often one of the easiest points of gaining buy-in from senior leadership for future data-focused initiatives.
In all cases, the data loaded into these tools should be semiautomated and be communicated as simply as possible. This means not only choosing the right amount of detail and flexibility (e.g. date filters, KPI segmentation), but also using footnotes and other contextual
cues to succinctly highlight any assumptions taken in the analysis. The data being presented in any interactive BI tools should also be as real-time as possible, meaning that it should refresh with new information as often as new data has become available. This can usually be done by scheduling the underlying queries to run at a set frequency that best suits the specific data being sourced and the questions that need to be answered.
The objective here is to create BI tools that - while they may look different from each other, draw on different data, and be intended for entirely disparate audiences - all follow the same core principles around data-driven storytelling that deliver confidence to their users and provide rich context around the KPIs being reported.

50 | THE DATA SCIENTIST
DATA-DRIVEN ORGANISATIONS
The data narrative is a collective effort that relies on both the Data Strategist to collect and prioritise insights, but also on individual stakeholder teams to provide deeper context into the specific workflows behind each key insight. It is critical that all the key players who share the responsibility of measuring and delivering on performance can meet regularly and strategise, using BI tools that draw on a well-governed data infrastructure to steer discussion. These meetings can take many forms, but my experience has shown that the best results come from hosting something called “business reviews.”
A business review is nothing more than a meeting to discuss performance around a certain topic, and with a certain audience. These can be a monthly 5-person call with executive leadership, or a weekly 120-person call with all managers and directors of a national business segment. What matters more is the
fact that all of the right people are using data-driven BI tools to discuss performance and make decisions on a regular basis. There are two sides to this format: the Data Strategist and the non-technical partnered stakeholders. The Data Strategist is responsible for the items we’ve discussed so far - sourcing reliable data, creating compelling data visualisations and reports to tell a cohesive story, and providing a forum for discussion. On the other side of the equation, partnered stakeholders are there to give deeper context into each KPI, and work with the Data Strategist and senior leadership to offer solutions to pressing challenges affecting the business, such as:
• Why is customer engagement down from the last quarter?
• What are we doing about the supply chain bottlenecks in the EMEA?
• Can software engineering prioritise resolving the breakage
issue with the customer portal?
The main point here is that following a ‘don’t shoot the messenger’ model where the data team is held responsible for all aspects of performance does not work, nor should it. Success is collective, and – while the Data Strategist is at the beginning of all performance discussions – there are other stakeholders in the room whose entire responsibilities at times are to move the needle a certain direction and deliver on KPI targets. Hosting business reviews gives them the environment to speak to their work and gain visibility with leadership, all in partnership with the data-minded individuals who developed the BI tools they are using and have a bird’s eye view on the sum total performance of the entire organisation. This data-driven model enables streamlined partnerships with core teams to foresee risks and navigate challenges effectively.
PARTNERSHIP WITH KEY STAKEHOLDERS TO CONTEXTUALISE INSIGHTS & DRIVE DECISION MAKING CONCLUSION
Innovations in the data and analytics space are evolving at a rate that outpaces most other areas of business today. An end-to-end data strategy rooted in an unchanging set of underlying principles is paramount for modern businesses to grow, as it allows them to have consistent access to clean data and
tell compelling stories regardless of the new analytics tools or methods they choose to adopt in the long run. This ultimately comes down to senior leadership being able to invest intelligently in a data-focused centre of excellence designed to partner across the organisation to increase transparency among
stakeholder teams, provide accurate insights at every major level of the business, and hold contributors accountable for their work. This also means being able to manage tech debt effectively and determine what is worth doing now, and what needs to be invested in over time as a sustainable solution at scale.
PATRICK MCQUILLAN has a successful history leading data-driven business transformation and strategy on a global scale and has held data executive roles in both Fortune 500 companies as well as various strategy consulting firms. He is the Founder of Jericho Consulting and a Professor at Northeastern University and Boston University, where he teaches graduate programmes in Analytics and Business Intelligence
THE DATA SCIENTIST | 51
DATA-DRIVEN ORGANISATIONS
RISK MITIGATION AND THE FUTURE OF LARGE LANGUAGE MODELS IN THE ENTERPRISE MARKET
By DAMIEN DEIGHAN , CEO OF DATA SCIENCE TALENT

Since the launch of Chat GTP3 on November 31st 2022, the pace of development in the generative AI space has been incredible.
On 21st Feb 23 Bain & Co announced a services alliance partnership with OpenAI with the intention of embedding OpenAI’s technologies (ChatGPT, DALL·E, and Codex) into their clients operations having already done so with their own 18k workforce. Coca Cola were swiftly announced as the first major corporate to engage with this new alliance, although interestingly no other major corporation has announced their involvement since.
Just four weeks later OpenAI announced their Plugins for Chat GPT and popular platforms such as Wolfram, Expedia, Klarna and Opentable were revealed as the first
third party platforms to integrate.
Microsoft’s heavy investment in OpenAI and their rapid deployment of Chat GPT into their product range, added to the fact they are the trusted provider of corporate software applications, might suggest deep integration of Microsoft/OpenAI products into large companies might be inevitable.
However this is not necessarily how things are likely to pan out. Two things happened in March 2023 that give us some clues to what might happen next instead.
What the samsung incident means for internal use of LLM’s in business
In early April several tech publications reported that Samsung employees leaked sensitive corporate data via
52 | THE DATA SCIENTIST
LARGE LANGUAGE MODELS
Chat GPT, 3 times inside 20 days. This included a recording transcription of an internal meeting and source code for a new program in their semiconductor business unit. The problem is in each of these instances employees decided to input proprietary information into a third party platform, thereby removing control of this information from Samsung and putting company IP at risk.
Samsung’s immediate response was to limit use of ChatGPT and announce they are developing their own AI for internal use.
ChatGPT is an incredible piece of technology and its use in business can help drive significant leaps in productivity. However, the Samsung incident is also a clear warning to enterprise leaders of the importance of ensuring proper use of Chat GPT so that company information and IP is not shared in this way.
Bloomberggpt and the development of domain specific LLM’s
In addition to security concerns, another issue with generic closed LLM’s is their performance in tightly regulated industries where a high level of accuracy is critical. On 30th March, Bloomberg announced they had developed their own LLM and published the related paper “BloombergGPT: A Large Language Model for Finance”. Initially, BloombergGPT is intended to be a finance specific internal AI system with future plans to make it available to customers using their Bloomberg Terminal system. BloombergGPT can perform a variety of NLP tasks related to the finance industry including Sentiment analysis, news classification, and question answering.
Unlike generic LLM’s such as ChatGPT, the model is trained on a combination of curated general web content and internal financial datasets. Bloomberg’s huge company archive of news and financial documents collected over a 40 year period, means that high quality clean data is at the core of the model training. This should result in a system that performs better than a generic LLM in the specific domain of finance and this drive for accuracy is at the center of Bloomberg’s initiative.
Using pre-trained foundation models deployed with private domain specific datasets
In addition to the Samsung incident, OpenAI themselves experienced a major data breach on March 20th. During an outage, personal data of 1.2% of ChatGPT Plus subscribers was exposed, including payment-related information. The breach was caused by a bug in an open-source library, which allowed some users to see titles from another active user’s chat history. This led to Chat GPT being banned in Italy and on April 13th, Spain announced that they were investigating OpenAI
over a suspected breach of data protection rules. This further highlights the need for large companies to tread carefully in the early stages of their adoption of LLM’s.
Does this mean the security risks and accuracy concerns presented by generic LLM’s mean that most large companies will follow Bloomberg and develop their own LLM from scratch?
No, probably not.
The cost of building an LLM from scratch is significant and it might make sense for Bloomberg, because their LLM will be central to their terminal product which comes with a $27k per year subscription charge. Most large corporations will not be able to justify the time and money involved in developing something similar from scratch.
There is a growing number of start-ups offering pre-trained LLM’s that any company can customize commercially into their own domain specific LLM.
Microsoft recently announced that customers of Azure machine learning could build and operate open source foundation models through its link with Hugging face. A few weeks later AWS launched Bedrock, which through an API, allows users to customize a range of foundation models that include Amazon Titan, Jurassic-2 (A121labs), Claude (Anthropic) and the open source Stable Diffusion (Stability ai).
The big decision a company needs to make is whether or not they should adopt a closed foundation model or an open source model.
Conclusion - is a hybrid approach to LLM’s most likely?
It’s difficult to predict how exactly things will evolve given that we are right at the start of the Age of AI. The allure of using powerful generic LLM’s such as ChatGPT and its direct competitors who also have powerful closed systems will be high in the short term as the open source offerings will take some time to catch up.
It’s probable that many companies will formally adopt the likes of Microsoft 365 copilot to drive efficiencies in its general internal operations, and allow its employees to use ChatGpt within certain bounds.
However, in regulated industries in particular, I suspect few large companies will be comfortable with using private datasets with closed models and they may not be able to adhere to laws such as GDPR if they do go down this route. For interactions that require an LLM to interface with sensitive customer data or other proprietary internal datasets, then open source will likely be the winner.
One thing, I can confidently predict... the key ideas in this article will probably be out of date within two weeks of publication!
THE DATA SCIENTIST | 53
LARGE LANGUAGE MODELS
ANNA LITTICKS
ANNA LITTICKS: #3
HOW I BECAME A HEROINE IN TECH A PERSONAL REFLECTION
In the corporate world, Datarella is a mild-mannered employee who leads a double life as a fearless Data Scientist.
Armed with python scripts and machine learning algorithms, she battles ignorance and misconception to save the company from the perils of data illiteracy.
In this article, we follow Datarella's adventures and discover how her unyielding spirit, sharp intellect, unwavering patience, and humour make her a Data Science heroine.

Once upon a neural network, in the land of corporate cubicles, there lived a mild-mannered, bespectacled woman named Datarella. By day, she appeared to be just another employee, blending in with the sea of office workers. But behind her unassuming demeanour, she was a fearless Data Scientist, armed with a quick wit, a sharp mind, and an uncanny ability to decode the mysteries of big data.
Datarella’s daily quest was to navigate the treacherous terrain of corporate bureaucracy while battling the dark forces of ignorance and misconception. Her weapons of choice were Python scripts and machine learning algorithms, which she wielded with the finesse of a master swordsman.
One fateful day, Datarella found herself summoned to the dreaded Conference Room of Endless Meetings. Her mission: to present her latest findings to the legion of executives known as the PowerPoint Rangers. With a heavy sigh, she prepared herself for the onslaught of misguided questions and wellintended but utterly unhelpful suggestions.
As she began her presentation, a hush fell over the room. The Rangers listened intently, eyes widening as she unveiled complex data visualisations and sophisticated models. But Datarella’s true test lay in her ability to translate her findings into the universal language of business jargon.
“Ah, so what you’re saying is, we need to pivot our paradigm and synergize our core competencies to maximise our ROI?” asked one PowerPoint Ranger, stroking his chin thoughtfully.
Datarella suppressed a grin. “Precisely,” she replied, as she continued to weave a tale of strategic action items, stakeholder engagement, and value propositions. Her audience nodded in unison, captivated by her mastery of their native tongue.
With the meeting concluded, Datarella returned to her cubicle sanctuary, having once again saved the company from the perils of data illiteracy. As she settled back into her ergonomic chair, she couldn’t help but chuckle at the absurdity of her double life.
From deciphering the cryptic messages hidden in the coffee-stained scrolls of company databases to defending her realm from the barbaric onslaught of Excel fanatics, Datarella’s adventures were never dull. But she wouldn’t have it any other way.
For in the vast, unpredictable world of corporate life, there was one constant: the unyielding spirit of Datarella, Data Scientist extraordinaire, forever battling the forces of confusion with her sharp intellect, unwavering patience, and a healthy dose of humour.
Until next time,
Anna Litticks
54 | THE DATA SCIENTIST
“
FUTURE ISSUE RELEASE DATES IN 2023/2024
ISSUE 4: 6th September 2023
ISSUE 5: 22nd November 2023
ISSUE 6: 21st February 2024
ISSUE 7: 8th May 2024
ISSUE 8: 4th September 2024
ISSUE 9: 20th November 2024
POTENTIAL ADVERTISERS
We will consider taking a very small amount of exclusive,sector-specific advertising for future issues. For our Media Pack, please email the Editor.
POTENTIAL CONTRIBUTORS
We are always looking for new contributors from any Data Science or AI areas including:
Machine Learning and AI
Data Engineering and platforms
Business and industry case studies
Data Science leadership

Current and topical academic research
Careers advice.
If you or your organisation want to feature in a future issue(s) then please contact the Editor: anthony.bunn@datasciencetalent.co.uk
OUR REACH
The Data Scientist magazine is a niche, highquality publication that is produced in two formats: print and digital.
The magazine is read by thousands within your sector, including leading companies, Data Science teams and Data Science leaders. Print copies are posted to leading, selected Data Science and AI experts, influencers and organisations and companies throughout the world.
We also send digital copies out to our large and growing subscription list, whilst each issue is available online on Issuu.
THE DATA SCIENTIST | 55
Fill Your Skills Gap Fast with the Top 10% of Data Science & Engineering Contractors
Are you struggling to keep your project on track due to a lack of resource?
Are you falling behind your competitors because of a lack of skills and expertise?
We hire for these roles:
Data Scientists
Data Engineers
Machine Learning Engineers
Data Architects
Data Analysts
You’ll get pre-assessed contractors to fill your skills gap and contribute to your project’s success using the proprietary DST Profiler® assessment tool. By pinpointing exactly the right candidates with the right strengths and skillsets, the DST Profiler® will find you the right fit.
Plus, to save you time and effort in the recruitment process, Data Science Talent will find your ideal candidate in just 48 hours*.
For these types of cover:
Skills or domain knowledge gaps
Fixed-term projects and transformation programmes
Maternity/paternity leave cover
Sickness leave cover
Unexpected leaver s/resignations
Don’t let a skills gap hold you back
Tell us what you need at datasciencetalent.co.uk

*Our 10k contractor guarantee - in the first two weeks, if we provide a contractor who is not a fit, we will replace them immediately and won’t be charged anything.
