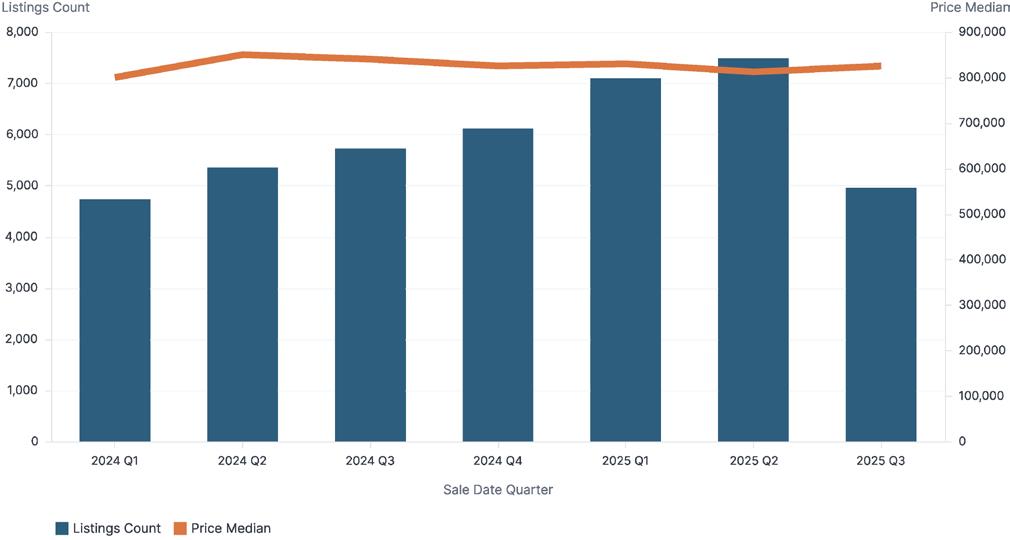
BROOKLYN, LONG ISLAND & QUEENS Q3 2025 MARKET REPORT DEAR CLIENTS, FRIENDS, AND PARTNERS, The housing market gained meaningful momentum in the third quarter of 2025, signaling renewed confidence among both buyers and sellers. Total sales rose 9.9% from the previous quarter, with 14,018 homes sold across the region. The median sales price climbed to $785,000, up 3.3% quarter over quarter, and homes sold more quickly, averaging just 54 days on the market.
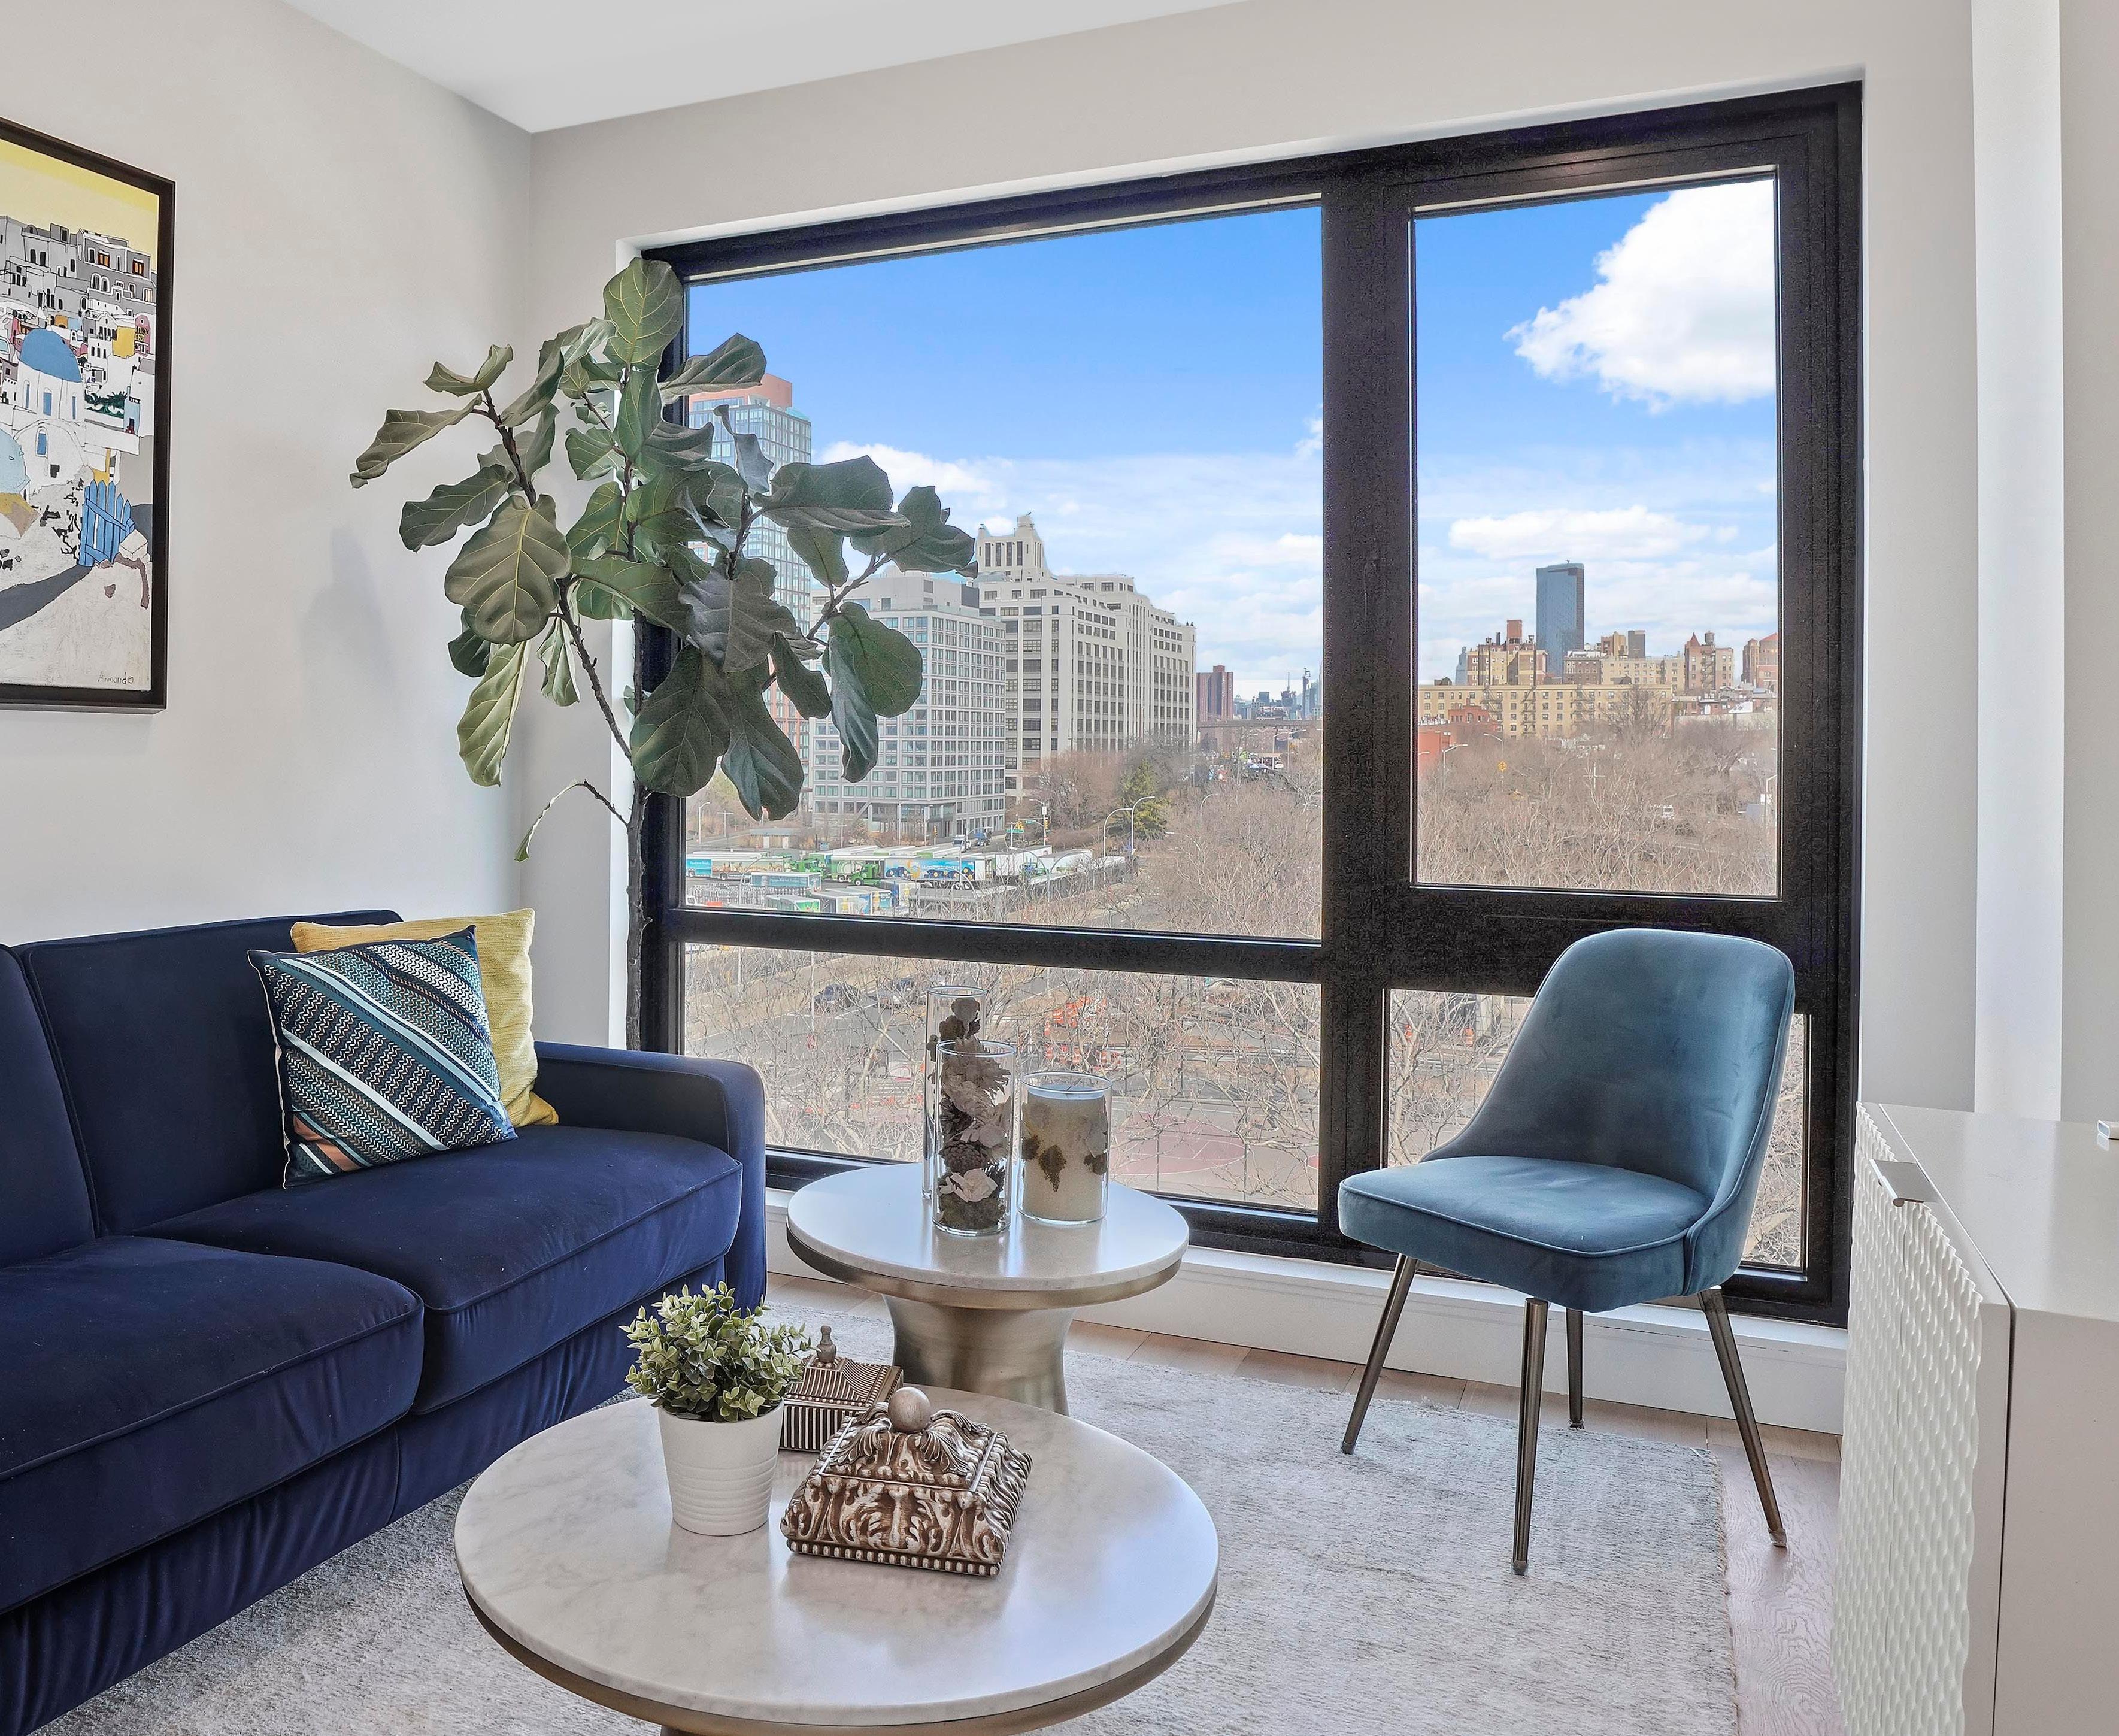
In Brooklyn and Queens, activity surged with sales up 35% year over year and prices rising 6%. Neighborhoods like Williamsburg and Long Island City continue to attract strong demand, while faster selling times reflect both strategic pricing and increased buyer confidence.
Across Nassau and Suffolk County, suburban markets remained remarkably competitive. Sales increased 25% year over year, the median price reached $740,000, and homes sold in just 42 days on average—an impressive 26% faster than last year.
On the North Fork and in the Hamptons, the luxury segment recalibrated slightly. Median prices held firm at $1.09 million, while buyers found more room to negotiate amid a steadier pace of sales.
As we look ahead to the final quarter of the year, inventory continues to rise modestly providing buyers with more choice without exerting downward pressure on prices. Sellers who price thoughtfully will continue to achieve strong results, while investors would be wise to watch emerging neighborhoods that show longterm growth potential.
Overall, the market remains active, balanced, and full of opportunity. At Daniel Gale Sotheby’s International Realty, we remain steadfast in our commitment to guide you with insight, precision, and care to help you make the most of every market moment.
Warm regards,
Deirdre O’Connell Chief Executive Officer
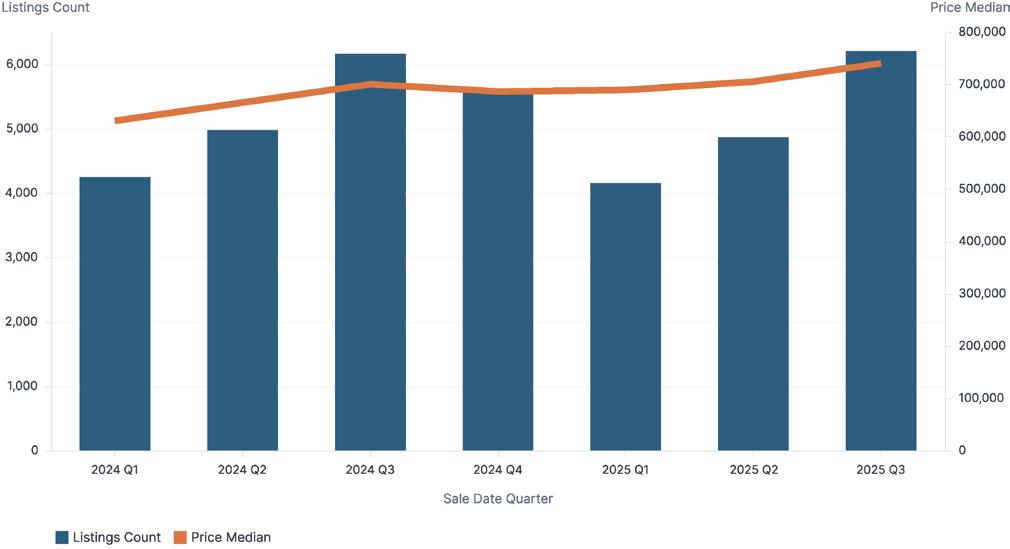
Number of Sales Vs. Median Sales Price
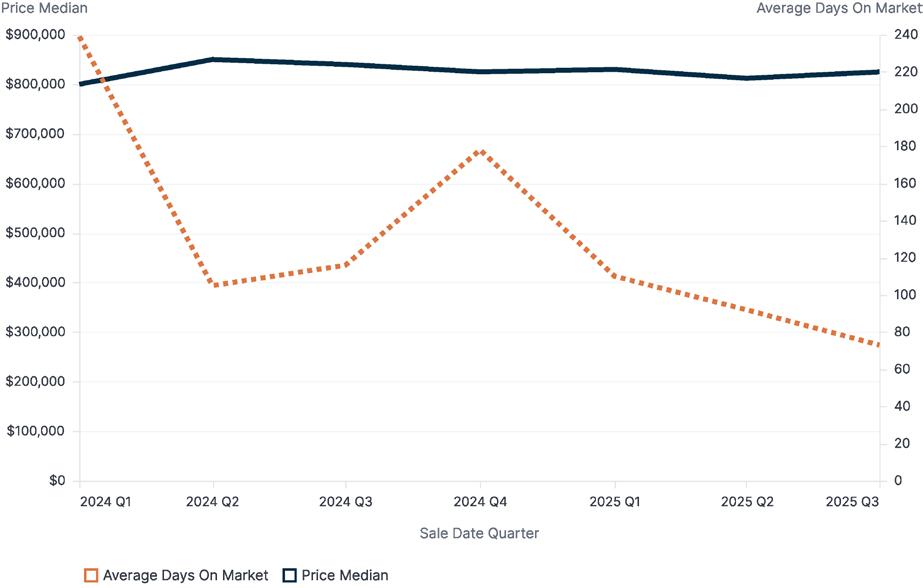
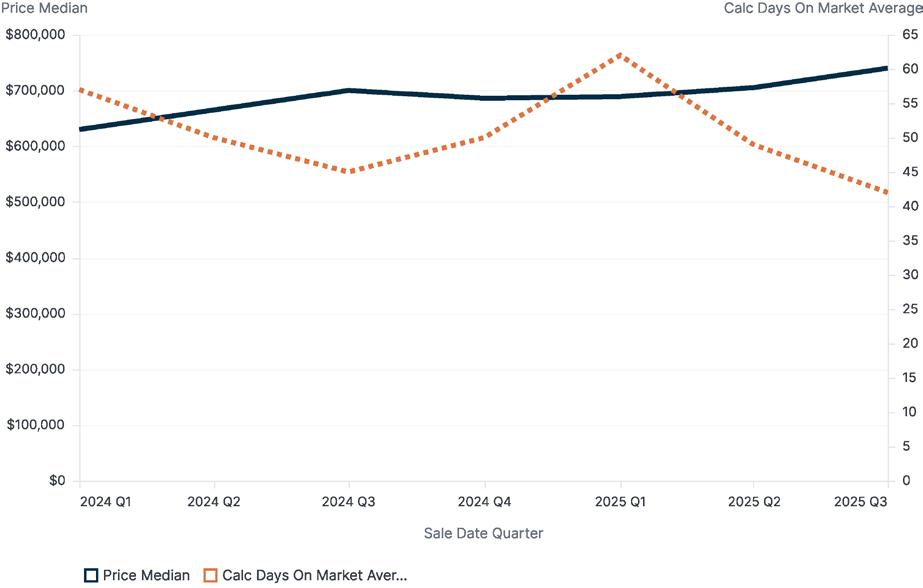
Median Sales Price Vs. Average Days On Market
Nassau County & Suffolk County Number of Sales Vs. Median Sales Price
Median Sales Price Vs. Average Days On Market
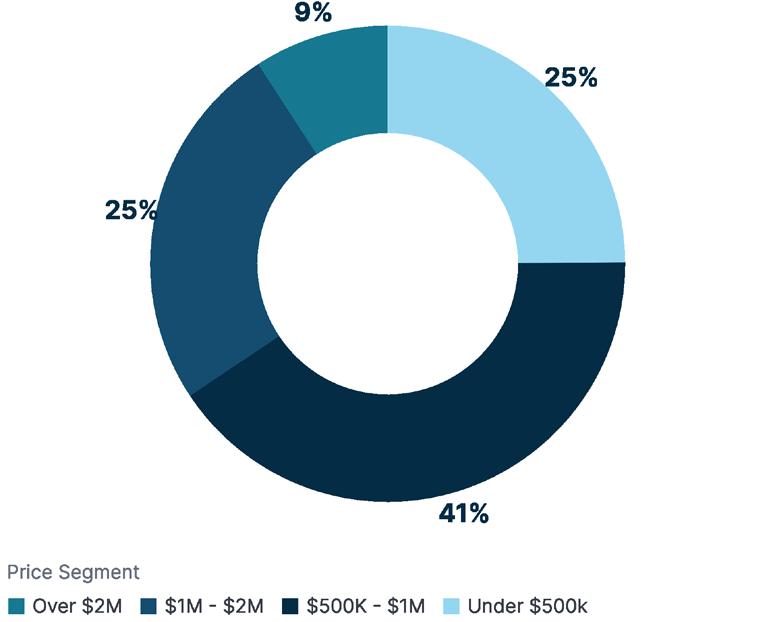
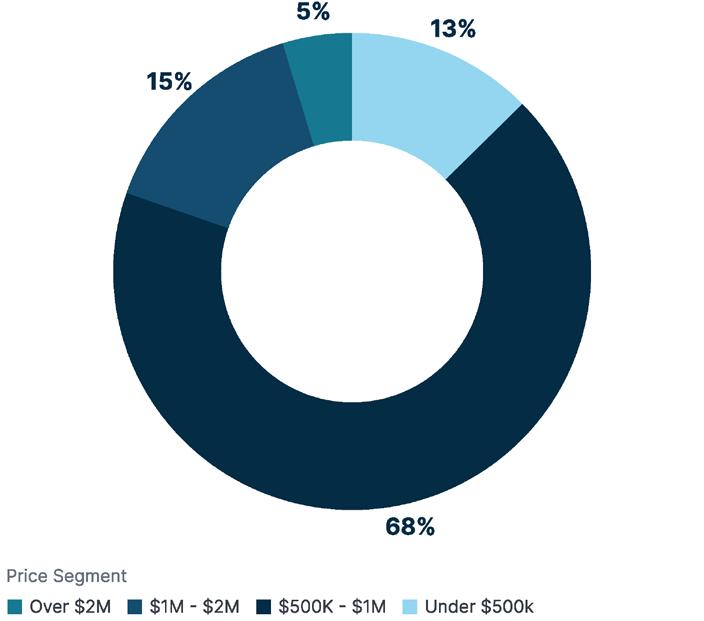
Closed Sales by Price
Closed Sales by Price
Table of Contents Brooklyn
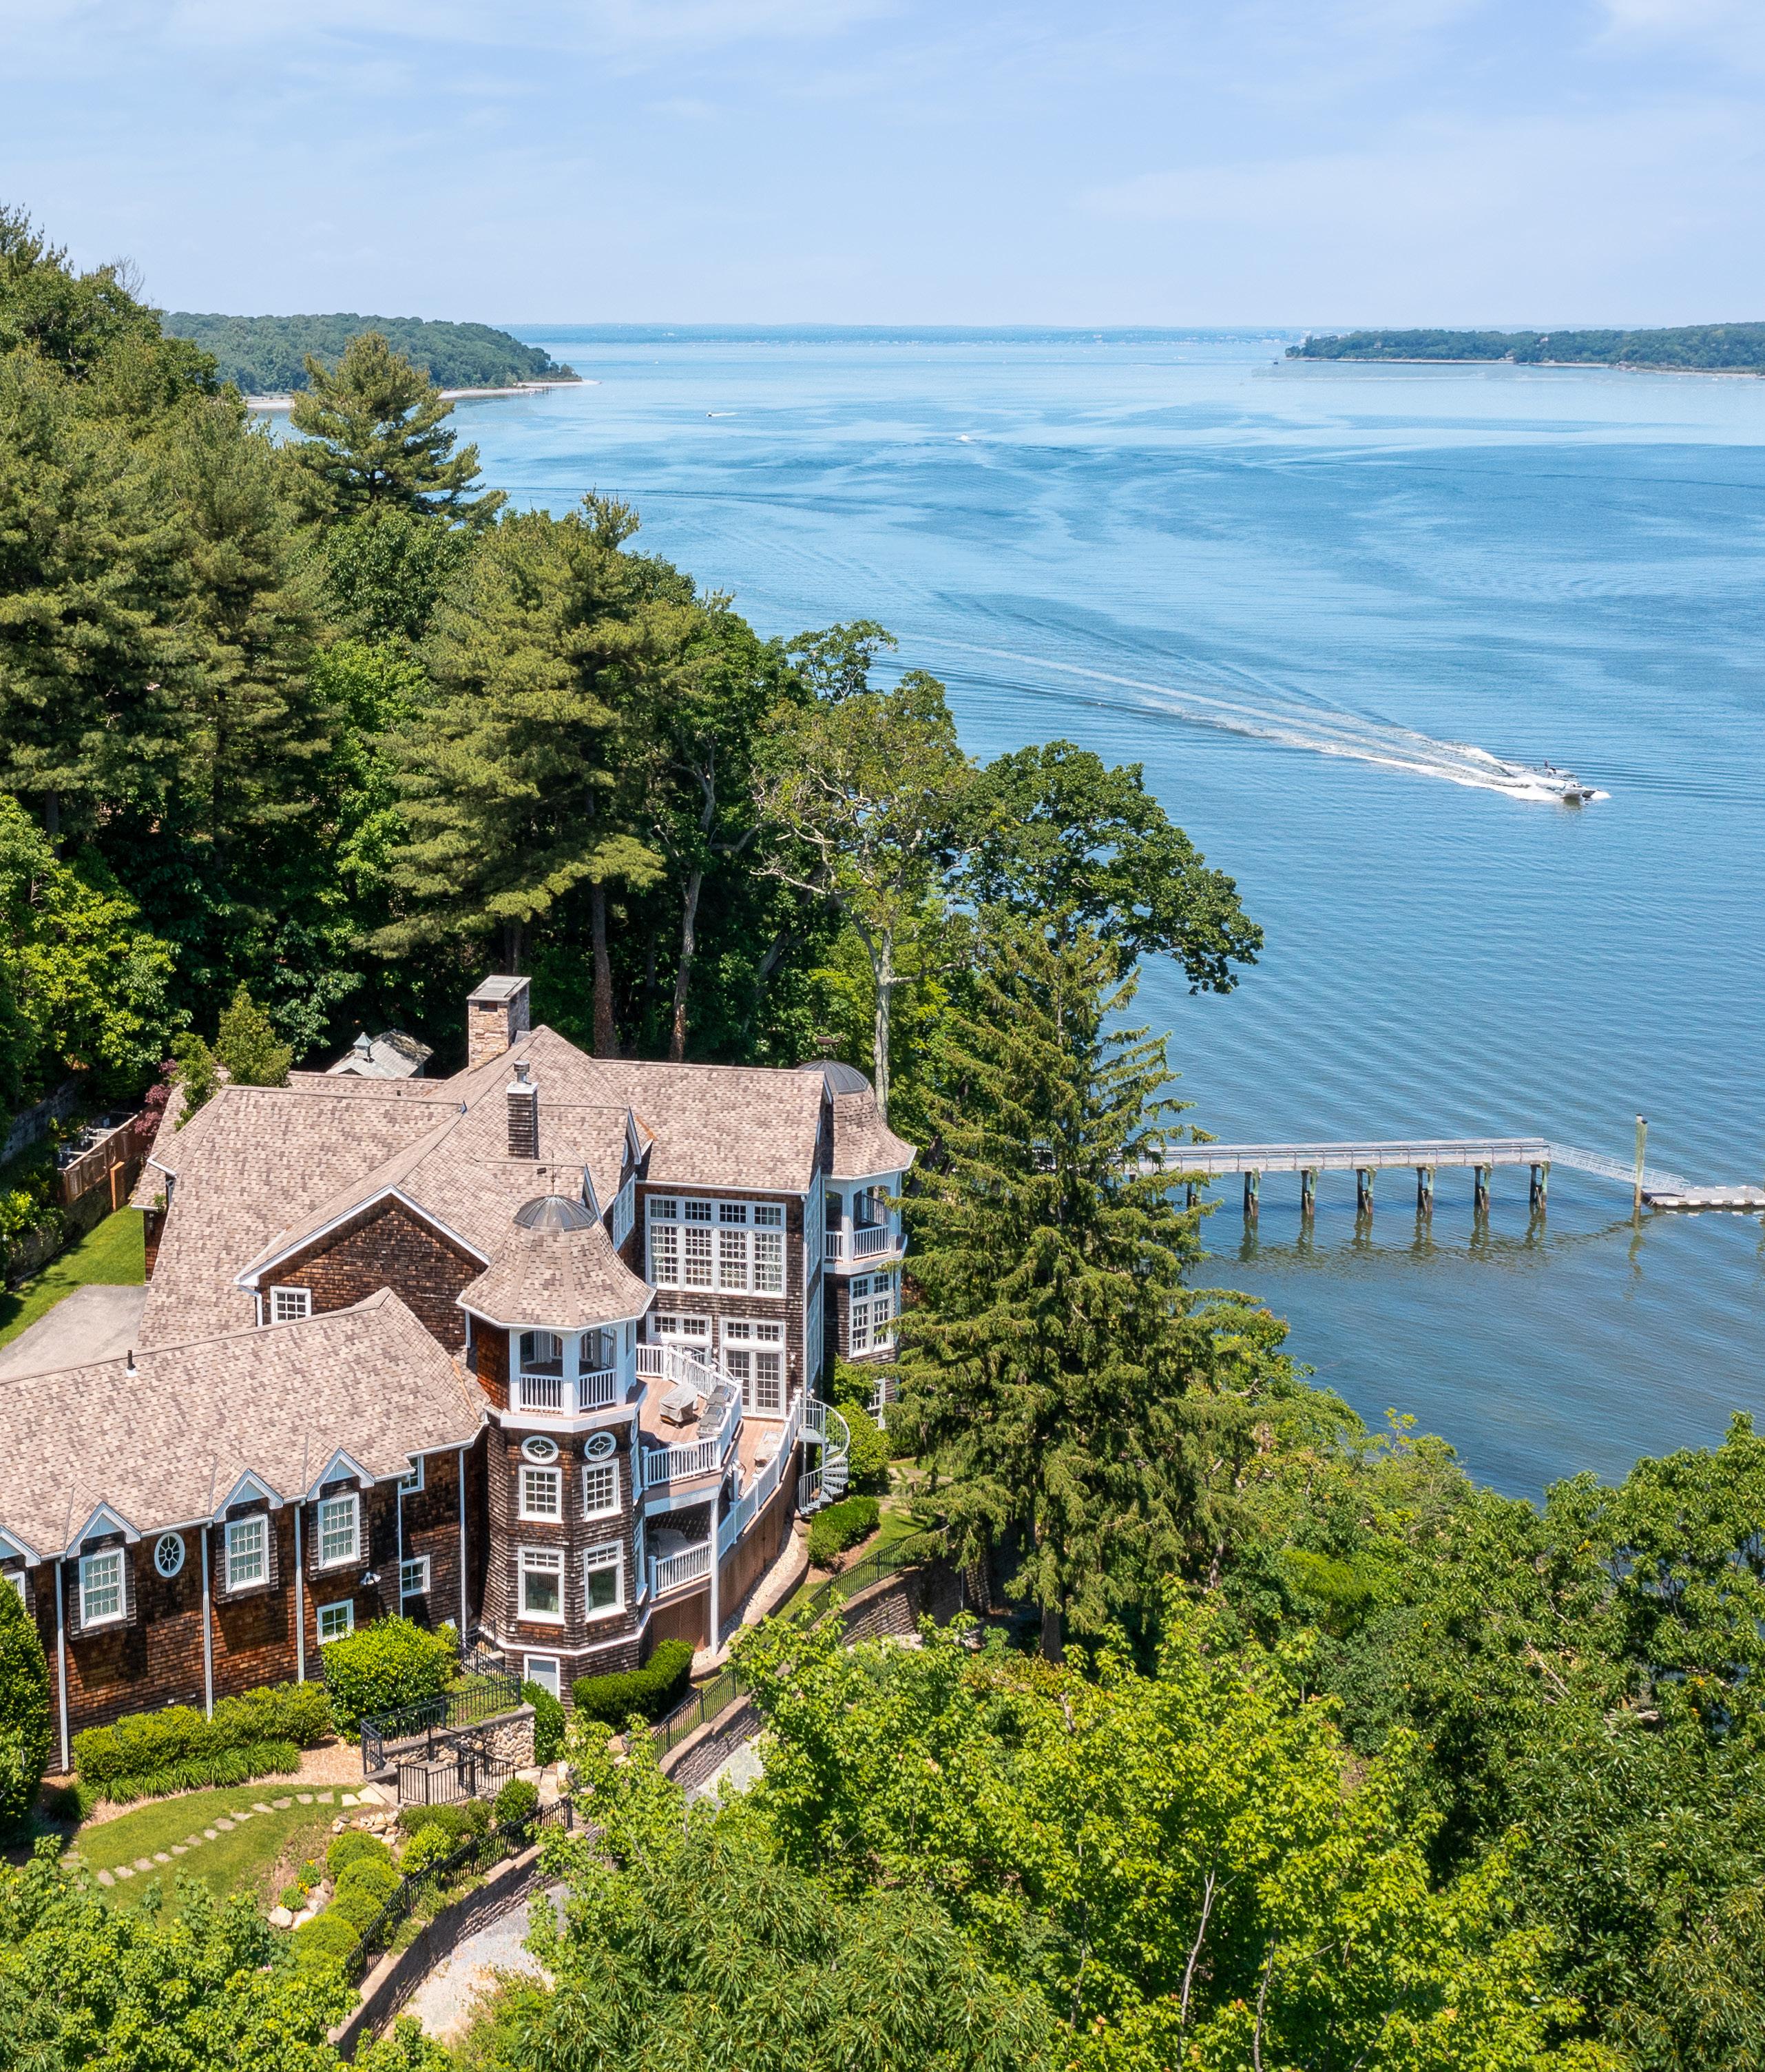
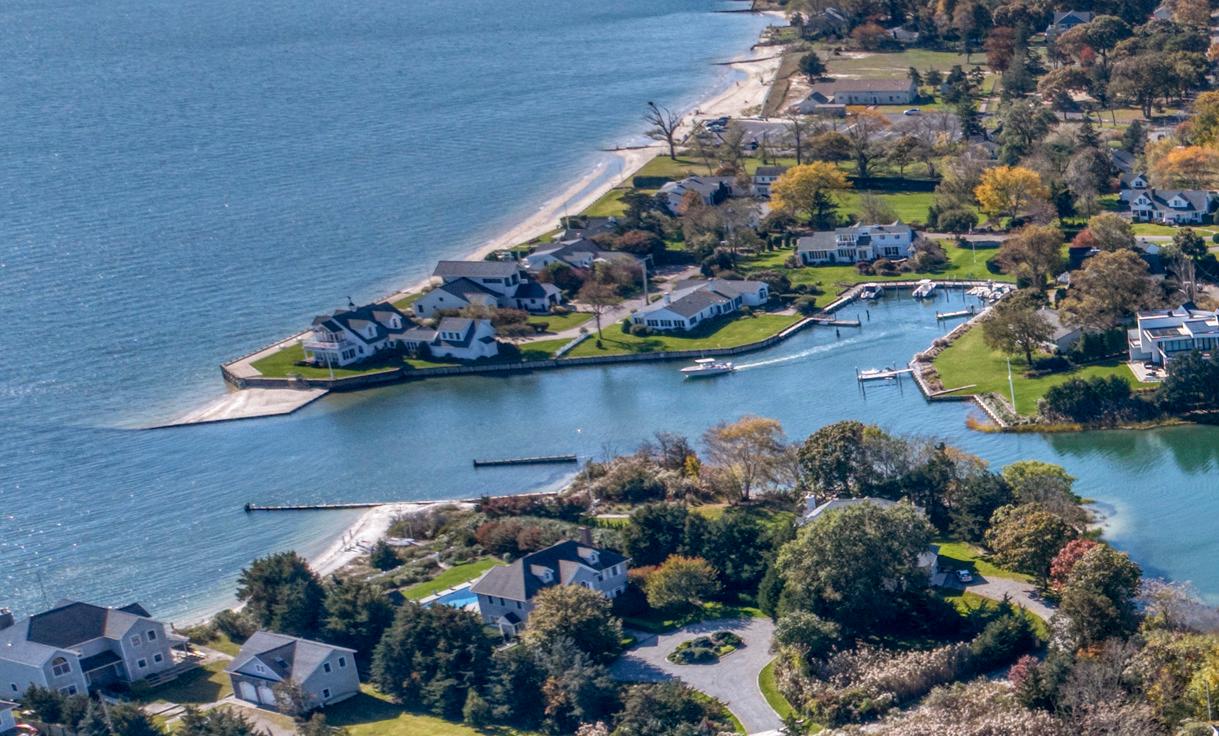
Remsenburg, NY• MLS# 919972
Brooklyn Queens
Nassau County
County
Q3 2025 Summary • January 1 – September 30, 2025
8,162 -2%
Number of Sales
Q3 2025 vs Q3 2024
79 +5%
Average Days on Market Q3 2025 vs Q3 2024
$1.17M 0%
Median Sales Price Q3 2025 vs Q3 2024
$1.49M -4%
Average Sales Price Q3 2025 vs Q3 2024
2,399 -5%
Listing Inventory*
Q3 2025 vs Q3 2024
Boerum Hill, NY • MLS#
Residential
Q3 2025 Summary • January 1 – September 30, 2025
Bay Ridge
Bed Stuy
Bensonhurst
Bergen Beach
Boerum Hill
Brooklyn Heights
Bushwick
Carroll Gardens
Clinton Hill
Cobble Hill
Columbia St. Waterfront
Crown Heights
DUMBO / Vinegar Hill
Downtown Brooklyn
Dyker Heights
East Williamsburg
Flatbush
Fort Greene
Fort Hamilton
Gowanus
Greenpoint
Greenwood
Kensington/Ocean Pkwy
Manhattan Beach
Northeast Flatbush
Park Slope
$1,095,000 $1,300,000 $1,210,000 $835,000 $1,805,000 $1,688,750 $996,900 $1,900,000 $1,250,000 $2,135,000 $1,565,000 $1,323,289 $1,795,000 $1,215,000 $1,275,000 $1,045,000 $717,500 $1,810,000 $650,000 $1,395,000 $1,597,500 $1,335,000 $610,950 $1,412,500 $715,000 $1,695,000 $1,585,000 $1,125,364 $775,000
Q3 2025 Summary • January 1 – September 30, 2025
Cobble Hill,
Bay Ridge
Bed Stuy
Bensonhurst
Bergen Beach
Boerum Hill
Brooklyn Heights
Bushwick
Carroll Gardens Clinton Hill
Cobble Hill
St. Waterfront
/ Vinegar Hill
Pkwy
DAYS ON MARKET $4,200 $2,650 $3,798 $4,500 $3,200 $2,750
$2,800 $4,370 $4,300
RENTAL PRICE / Vinegar Hill
$1,400,000 $1,951,000 $1,390,000 $841,500 $3,905,000 $6,880,000 $1,207,500 $3,162,500 $2,497,500 $4,700,000 $2,487,500 $1,500,000 $54,520,408
$1,370,000 $2,529,740 $996,500 $3,800,000 $1,259,000 $1,812,500 $2,400,000 $1,274,500 $1,600,000 $1,450,000 $740,000 $3,155,000 $3,322,660 $1,870,000 $2,236,000
Bay Ridge
Bed Stuy
Bensonhurst
Bergen Beach
Boerum Hill
Brooklyn Heights
Bushwick
Carroll Gardens
Clinton Hill
Cobble Hill
Columbia St. Waterfront
Crown Heights
DUMBO / Vinegar Hill
Downtown Brooklyn
Dyker Heights
East Williamsburg
Flatbush
Fort Greene
Fort Hamilton
Gowanus
Greenpoint
Greenwood
Kensington/Ocean Pkwy
$651,400 $962,500 $709,750 $880,000 $1,785,000 $2,975,000 $742,000 $1,475,000 $1,380,000 $1,795,000 $1,195,000 $1,250,000 $1,795,000 $1,244,000 $770,000 $980,000 $475,000 $1,480,000 $810,000 $980,000 $1,380,000 $1,352,000 $628,112 $571,926 $772,500 $1,685,000 $1,772,500 $795,000 $714,500
Co-Ops Brooklyn Bay Ridge
Bed Stuy
Bensonhurst
Bergen Beach
Boerum Hill
Brooklyn Heights
Bushwick
Carroll Gardens
Clinton Hill
Cobble Hill
Columbia St. Waterfront
Crown Heights
DUMBO / Vinegar Hill
Downtown Brooklyn
Dyker Heights
East Williamsburg
Flatbush
Fort Greene
Fort Hamilton
Gowanus
Greenpoint
Greenwood
Kensington/Ocean Pkwy
Manhattan Beach
Northeast Flatbush
Park Slope Prospect
$340,000 $475,000 $255,000 $263,640 $1,230,000 $812,500 $425,000 $1,055,000 $780,000 $1,125,000 $829,810 $455,000 $302,500 $799,000 $437,000$345,000 $755,000 $400,000 $700,000 $562,500 $1,310,000 $444,000
$239,000 $1,005,000 $952,000 $556,250 $724,750
Q3 2025 Summary • January 1 – September 30, 2025
11,359 +52%
Number of Sales
Q3 2025 vs Q3 2024
86 +9%
Average Days on Market
$635K +1%
Median Sales Price
$699K -2%
Average Sales Price
Q3 2025 vs Q3 2024 Q3 2025 vs Q3 2024 Q3 2025 vs Q3 2024
4,665 -11%
Listing Inventory
DAYS ON MARKET $840,000 $990,000 $745,000 $715,000 $800,000 $770,000 $850,000 $720,000 $999,000 $1,060,000 $810,000 $550,000 $711,024 $475,000 $1,073,000 $399,950 $840,000 $1,095,000 $760,000 $525,000 $1,059,500 $455,000 $665,000 $997,000 $860,000 $346,500 $750,000
Lindenwood
Little Neck
Long Island City Maspeth
Middle Village
North Corona
Oakland Gardens
Ozone Park Pomonok
Queens Village
Rego Park Ridgewood
$340,000 $425,000 $920,000 $899,500 $900,000 $1,024,000 $912,500 $760,000 $842,500 $740,000 $435,000 $1,100,000 $689,000 $720,000 $750,000 $698,221 $560,037 $1,369,000 $986,500 $439,500
Astoria
Auburndale
Bellerose Manor
Clearview
College Point Corona
Ditmars-Steinway
Fresh
NEIGHBORHOOD Lindenwood
Little Neck
Long Island City
Maspeth
Middle Village
North Corona
Oakland Gardens
Ozone Park
Pomonok
Queens Village
Rego Park
Ridgewood
Rosedale Saint
Town Homes Astoria
Auburndale Bay
Bellerose Manor
Clearview
Ditmars-Steinway
DAYS ON MARKET MEDIAN SELLING PRICE $1,357,500 $999,000 $1,595,000 $1,120,000 $820,000 $1,149,000 $886,500 $970,000 $1,275,000 $1,250,000 $875,000 $988,943 $1,150,000 $1,300,340 $1,154,000 $900,000 $850,000 $1,095,000 $775,000 $899,000 $2,032,500 $1,100,000 $697,000 $1,225,000 $887,500 $1,215,000 $975,000 $700,000
NEIGHBORHOOD Town Homes Lindenwood
Little Neck
Long Island City
Maspeth
Middle Village
North Corona
Oakland Gardens
Ozone Park
Pomonok
Queens Village
Rego Park
Ridgewood
Rosedale Saint
$995,000 $1,060,000 $1,175,000 $950,000 $920,000 $1,125,000 $1,100,000 $767,000 $888,000 $757,500 $1,017,500 $1,149,000 $692,500 $720,000 $755,000 $698,221 $1,397,500 $1,369,000 $1,130,000 $1,089,000
Condos/Co-ops/HOA Astoria
Auburndale
Bay Terrace
Bayside
Bellerose Manor
Clearview
College Point
Corona
Ditmars-Steinway
Douglaston
East Elmhurst
Elmhurst
Flushing
Forest Hills
Fresh Meadows
Glen Oaks
Glendale
Hillcrest
Hollis
Howard Beach
Hunters Point
Jackson Heights Jamaica
$640,000 $600,000 $366,000 $306,000 $322,500 $620,800 $270,000 $524,500 $358,000 $405,000 $415,000 $565,000 $375,000 $430,000 $373,750 $417,500
NEIGHBORHOOD Condos/Co-ops/HOA Q3 2025 Summary • January 1 – September 30, 2025
Lindenwood
Little Neck
Long Island City
Maspeth
Middle Village
North Corona
Oakland Gardens
Ozone Park
Pomonok
Queens Village
Rego Park
Ridgewood
$282,000 $365,000 $895,000 $476,580 $435,000 $531,500 $328,000 $350,000 $451,230 $285,000 $370,000 $695,000 $273,000
Nassau County 7,061 0%
Number of Sales
53 -4%
Average Days on Market
$800K +7%
Median Sales Price
$981K +6%
Average Sales Price
2,731 -28%
Listing Inventory
Q3 2025 Summary • January 1 – September 30, 2025 Q3 2025 vs Q3 2024 Q3 2025 vs Q3 2024 Q3 2025 vs Q3 2024 Q3 2025 vs Q3 2024 Q3 2025 vs Q3 2024
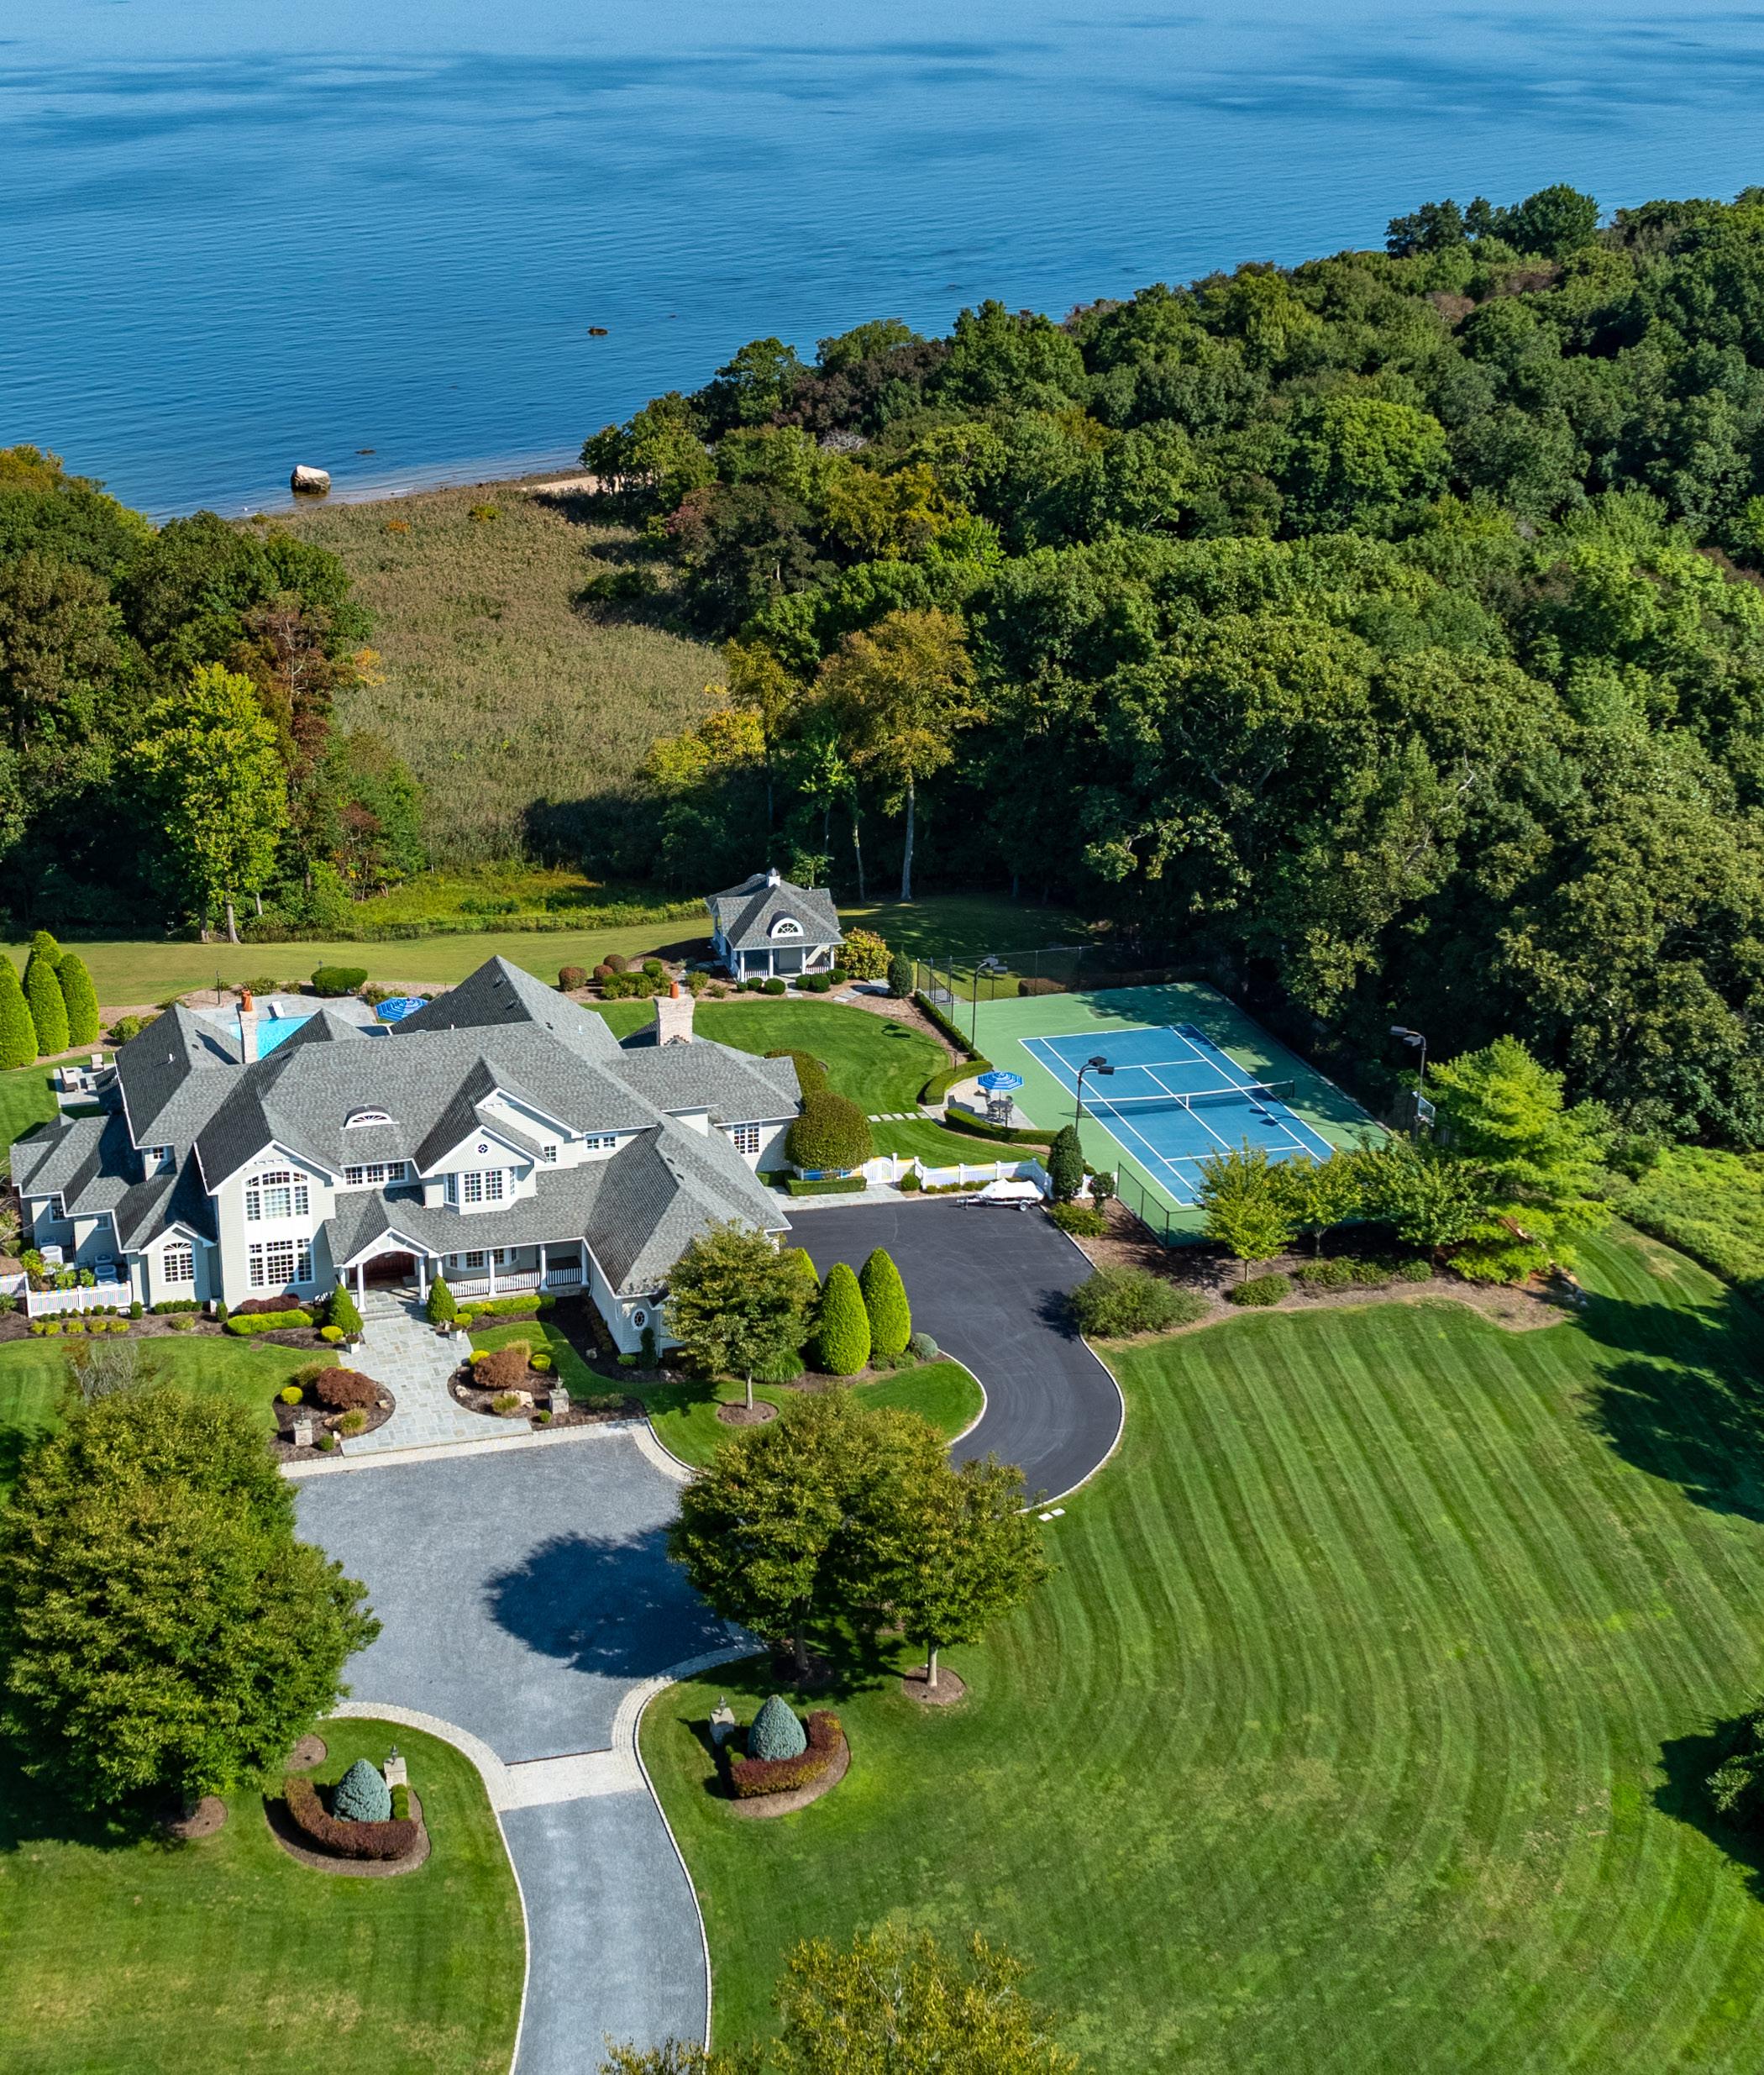
Laurel Hollow, NY • MLS# 849094
Residential Nassau County 5-Towns Albertson
Atlantic Beach
Baldwin/North Baldwin/Baldwin Harbor
Bayville
Bellerose
Bellerose Village
Bellmore/N. Bellmore/S. Bellmore
Brookville
Carle Place
Centre Island
Cove Neck
East Atlantic Beach
East Hills
East Meadow
East Norwich
East Rockaway
East Williston
Elmont
Floral Park
Franklin Square/Garden City South
Freeport
Garden City
Glen
$1,050,000 $945,000 $1,287,500 $700,000 $792,500 $740,000 $904,500 $788,000 $2,262,500 $780,000 $5,175,000$873,000 $1,900,000 $768,500 $975,000 $635,000 $1,456,000 $719,500 $705,500 $809,000 $610,000 $1,327,500 $795,000 $980,000 $1,050,000 $1,310,000 $625,000
Nassau County Merrick/North Merrick
UNIT SALES MEDIAN SELLING PRICE DAYS ON MARKET $950,000 $741,500 $642,500 $1,248,000 $2,200,000 $585,000 $1,150,000 $800,000 $652,500 $780,000 $2,200,000 $1,460,000 $769,000 $780,000 $3,067,500 $825,000 $770,000 $1,640,000 $700,000 $2,087,500 $899,000 $2,400,000 $798,000 $722,000 $2,550,000 $2,975,000 $850,000 $1,912,500
Residential Nassau County Plainview
Point Lookout
Port Washington
Rockville Centre
Roosevelt
Roslyn
Roslyn Estates
Roslyn Harbor
Roslyn Heights
Sands Point
Sea Cliff
Seaford
Stewart Manor
Syosset
Upper Brookville
Valley Stream
Wantagh
West Hempstead
Westbury
Williston Park
Woodbury
$1,312,500 $1,137,500 $799,450 $685,000 $1,300,000 $1,747,500 $2,050,000 $1,150,000 $3,300,000 $1,225,000 $800,000 $805,750 $1,155,000 $2,500,000 $714,000 $782,000 $752,500
Nassau County $490,000 $331,500 $934,500 $454,000 $1,100,000 $635,000 $1,745,000
8,156 -2%
Number of Sales
Q3 2025 Summary • January 1 – September 30, 2025 Q3 2025 vs Q3 2024
46 0%
Average Days on Market
$650K +7%
Median Sales Price
$706K +7%
Average Sales Price
2,738 -28%
Listing Inventory
Q3 2025 vs Q3 2024 Q3 2025 vs Q3 2024 Q3 2025 vs Q3 2024 Q3 2025 vs Q3 2024
County $1,200,000 $720,000 $625,000 $1,695,000 $500,000 $840,000 $615,000 $749,900 $637,500 $915,000 $545,000 $730,000 $1,675,000 $815,000 $580,000 $490,000 $970,000 $650,000 $1,200,000$680,000 $785,000 $570,000 $776,123 $816,500
Residential Suffolk County Fort Salonga
Gilgo Beach
Great River Greenlawn Halesite
Hauppauge
Head of the Harbor
Huntington
Huntington Bay
Huntington Station Islip
Kings Park Kismet
Lake Grove
Lake Ronkonkoma
Harbor
$1,047,563 $950,000 $1,100,000 $850,000 $906,750 $760,000 $2,600,000 $650,000 $582,500 $872,500 $1,685,000 $650,000 $650,000 $725,000$693,000 $631,000 $2,112,500 $2,200,000 $905,000 $517,500 $445,000 $910,000 $690,000 $762,500 $2,125,000 $630,000 $315,000
$999,000$642,500 $1,100,000 $1,699,000 $565,000 $1,177,500 $722,750 $579,000 $444,500 $512,500 $615,000 $748,500
$710,000 $580,000 $827,000 $538,495 $745,000 $800,000 $770,000 $702,500 $740,000
Q3 2025 Summary • January 1 – September 30, 2025
333 -3%
Number of Sales
Q3 2025 vs Q3 2024
82 +4%
Average Days on Market
Q3 2025 vs Q3 2024
$865K -1%
Median Sales Price
Q3 2025 vs Q3 2024
$1.09M +1%
Average Sales Price
259 -12%
Listing Inventory
Q3 2025 vs Q3 2024 Q3 2025 vs Q3 2024
$759,000 $650,000 $312,495 $1,367,500 $1,300,000 $560,000 $999,000 $1,020,000 $1,250,000 $1,080,000 $1,010,000 $1,726,470 $1,093,000 $507,500 $2,100,000 $990,000
Q3 2025 Summary • January 1 – September 30, 2025
813 +12%
Number of Sales
Q3 2025 vs Q3 2024
111 +11%
Average Days on Market
$1.30M +27%
Median Sales Price
$1.97M +15%
Average Sales Price
801 -13%
Listing Inventory
Q3 2025 vs Q3 2024 Q3 2025 vs Q3 2024 Q3 2025 vs Q3 2024 Q3 2025 vs Q3 2024
Residential Hamptons Amagansett
Bridgehampton
Center Moriches
East Hampton
East Moriches
East Quogue
Eastport
Hampton Bays
Manorville
Montauk
Moriches
North Haven
Quiogue
Quogue
Remsenburg
Sag
Sagaponack
$3,125,000 $2,787,500 $710,000 $1,855,000 $780,000 $1,100,000 $867,500 $880,000 $575,000 $1,500,000 $625,000 $1,400,000 $850,000 $3,950,000 $1,815,000 $1,947,563 $5,925,000 $1,340,000 $1,925,000 $565,000 $2,000,000 $2,500,000 $1,350,000 $1,640,000 $3,470,000
718.762.2268
631.754.3400
516.678.1510