BROOKLYN, LONG ISLAND & QUEENS 2025 MIDYEAR MARKET REPORT DEAR CLIENTS, FRIENDS, AND PARTNERS, The second quarter of 2025 brought a renewed opportunity to the housing market particularly for buyers. With increased inventory and a seasonal lift in activity, motivated buyers found themselves better positioned than they have been in recent quarters.
Transaction volume rose over 6% from Q1 as more homes came to market, and while the median sales price edged up slightly, the pace of price growth continued to moderate. Homes also spent less time on the market, creating windows of opportunity for prepared buyers to move decisively.
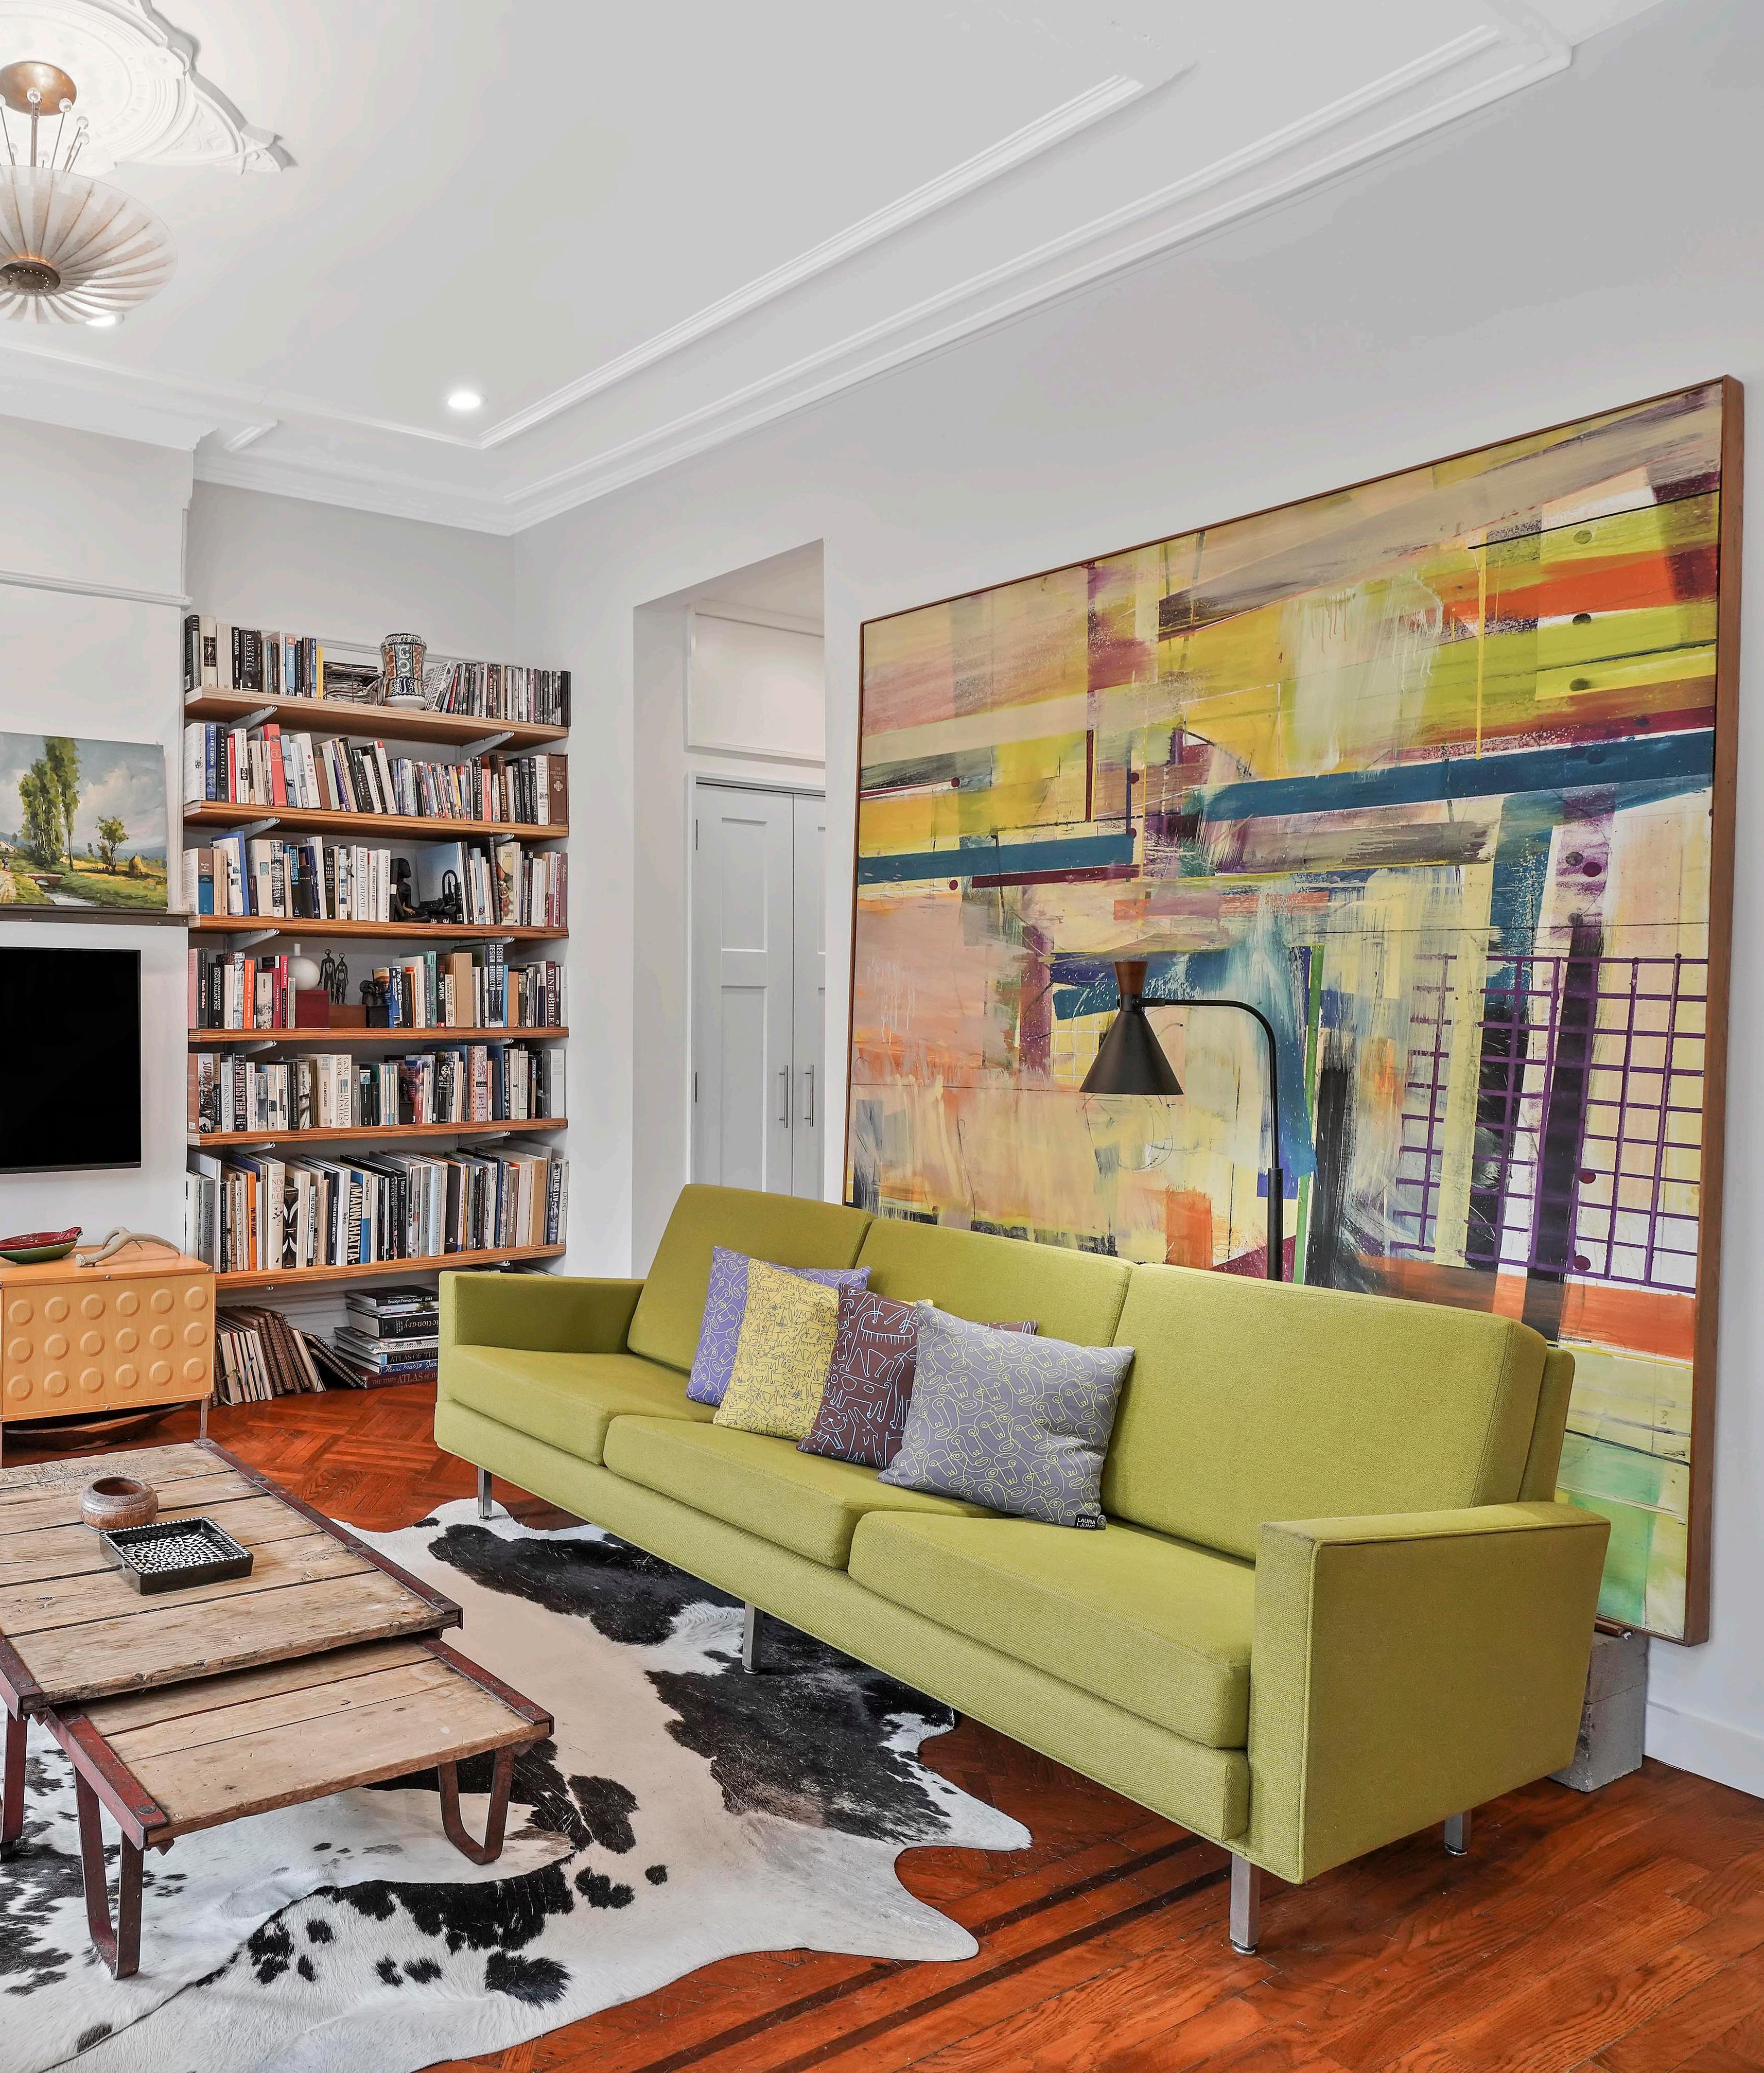
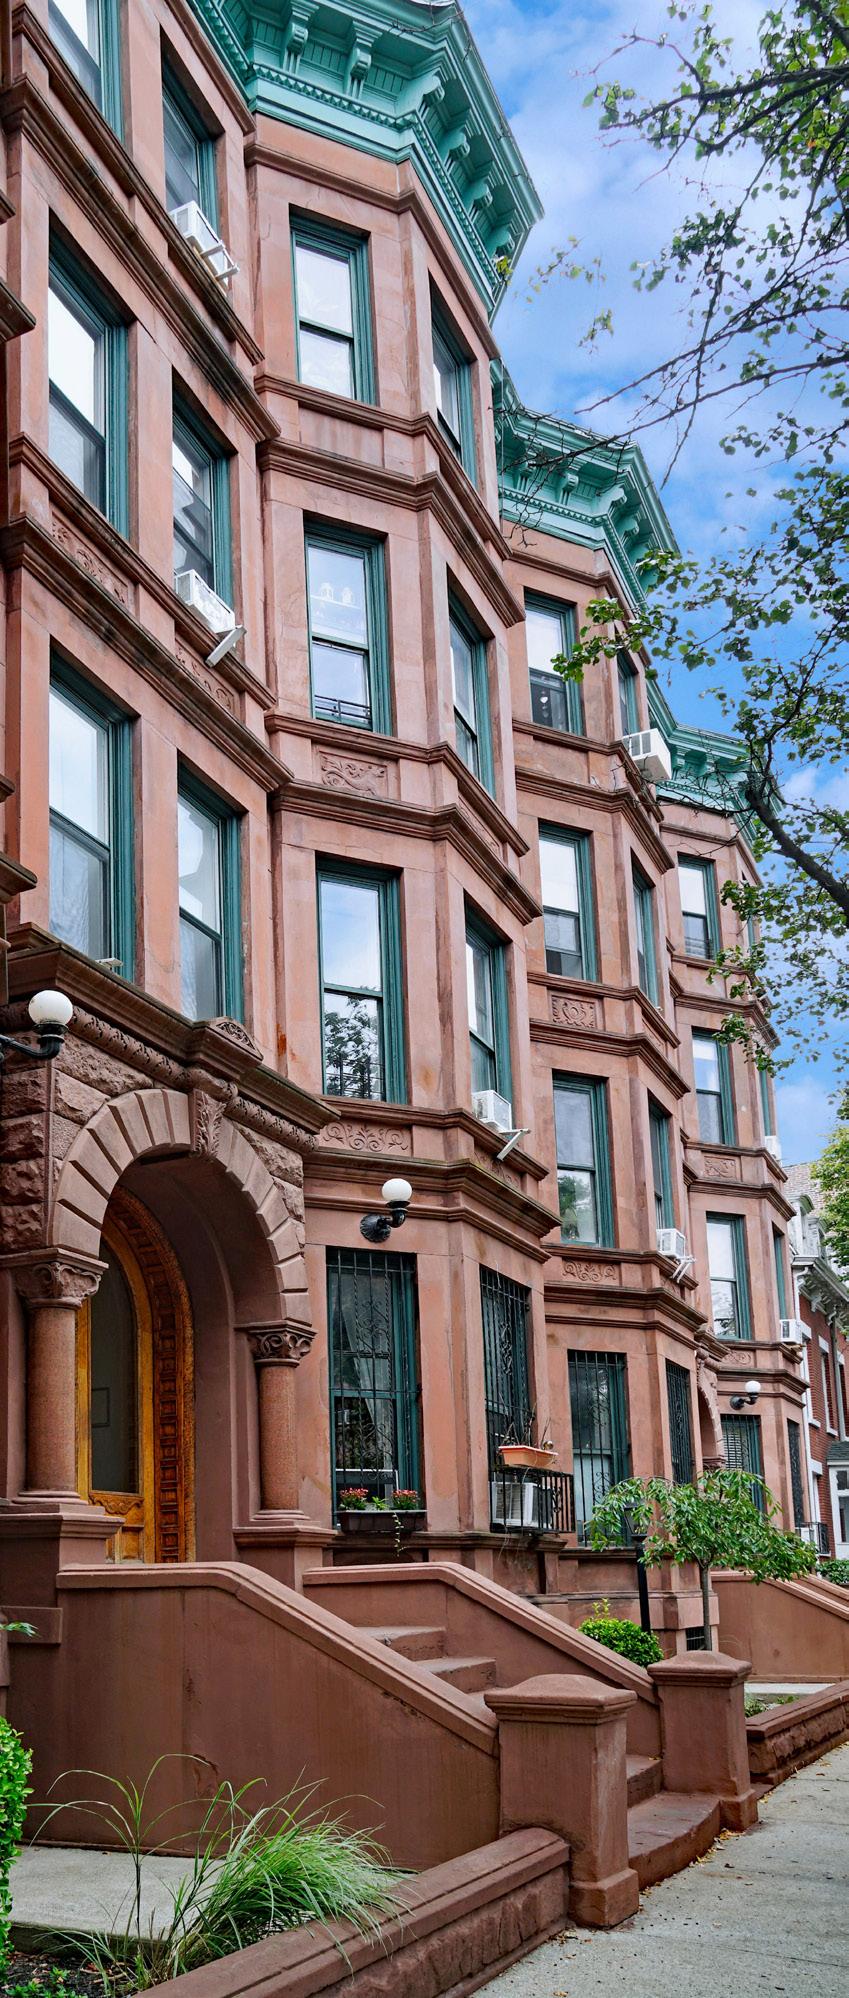
Regionally, Brooklyn and Queens saw a modest dip in prices and faster-moving deals—especially in high-demand areas like Prospect Heights and Cobble Hill. On Long Island, Nassau and Suffolk experienced a rise in buyer activity alongside steady price appreciation, signaling that demand continues to strengthen.
In the Hamptons and North Fork, a slight pullback in pricing created new entry points for buyers in luxury segments, even as competition quietly intensified.
Affordability remains a challenge in many areas, particularly with mortgage rates still hovering near 7%. But as rates began to ease slightly toward the end of June, and with consumer confidence cooling, serious buyers found themselves with more room to negotiate and less pressure to compete.
At Daniel Gale Sotheby’s International Realty, we know that shifting markets reveal real opportunity but only when paired with real expertise. Our advisors are deeply rooted in the communities we serve and trusted for their ability to translate insight into action. As we move into the second half of the year, we encourage you to stay informed, remain nimble, and lean on our guidance because while the market may change, our role as your advisor never does.
Warm Regards,
Deirdre O’Connell Chief Executive Officer
Brooklyn & Queens Number of Sales Vs. Median Sales Price
Nassau County & Suffolk County Number of Sales Vs. Median Sales Price
Number of Sales
Number of Sales
Bushwick, NY•
Brooklyn Queens
Nassau County
County
2025 Midyear Summary • January 1 – June 30, 2025
4,727 -4%
Number of Sales
Midyear 2025 vs 2024
92 -14%
Average Days on Market
Midyear 2025 vs 2024
$1.07M +8%
Median Sales Price
Midyear 2025 vs 2024
$1.37M +8%
Average Sales Price
Midyear 2025 vs 2024
2,665 +63%
Listing Inventory*
Midyear 2025 vs 2024
Brooklyn Residential
2025 Midyear Summary • January 1 – June 30, 2025
Bay Ridge
Bedford Stuyvesant
Boerum Hill
Brooklyn Heights
Bushwick
Carroll Gardens
Clinton Hill
Cobble Hill
Crown Heights
Ditmas Park
Dumbo
East Williamsburg
Flatbush
Fort Greene
Greenpoint
Greenwood
Gowanus
Kensington
Midwood
Ocean Hill
Park Slope
Prospect Heights
Prospect Lefferts
Prospect Park South
Red Hook
Stuyvesant Heights
Sunset Park
Williamsburg
$1,125,000 $1,345,000 $1,689,000 $1,855,000 $980,000 $2,425,000 $1,185,000 $1,865,000 $1,329,967 $955,000 $1,825,000 $1,045,000 $855,000 $1,689,000 $1,647,019 $1,355,000 $1,285,000 $580,000 $994,500 $974,950 $1,850,000 $1,650,000 $1,067,081 $775,000 $1,062,000 $1,270,000 $1,040,000 $1,622,500 $1,216,300
Bay Ridge
Bedford Stuyvesant
Hill
UNIT SALES MEDIAN RENTAL PRICE DAYS ON MARKET $3,150 $3,606 $2,550 $2,700 $3,200 $4,467 $4,350 $3,160 $2,600 $3,500
Bay Ridge
Bedford Stuyvesant
Boerum Hill
Brooklyn Heights
Bushwick
Carroll Gardens
Clinton Hill
Cobble Hill
Crown Heights
Ditmas Park
Dumbo
East Williamsburg
Flatbush
Fort Greene
Greenpoint
Greenwood
Gowanus
Kensington
Midwood
Ocean Hill
Park Slope
Prospect Heights
Prospect Lefferts
Prospect Park South
Red Hook
Stuyvesant Heights Sunset
DAYS ON MARKET $1,397,500 $1,900,000 $3,900,000 $6,960,000 $1,227,500 $3,140,000 $2,600,000 $3,900,000 $1,500,000 $1,923,500$1,650,000 $1,014,500 $3,600,000 $2,512,500 $1,314,500 $2,037,500 $1,600,000 $1,250,000 $1,030,000 $3,194,402 $3,065,066 $1,860,000 $2,372,000 $955,000 $1,500,000 $1,490,000 $2,775,000 $2,100,000
Condos Brooklyn Bay Ridge
Bedford Stuyvesant
Boerum Hill
Brooklyn Heights
Bushwick
Carroll Gardens
Clinton Hill
Cobble Hill
Crown Heights
Ditmas Park
Dumbo
East Williamsburg
Flatbush
Fort Greene
Greenpoint
Greenwood
Gowanus
Kensington
Midwood
Ocean Hill
Park Slope
Prospect Heights
Prospect Lefferts
Prospect Park South
Red Hook
Stuyvesant Heights
Sunset Park
Midyear 2025
$702,800 $983,851 $1,595,000 $3,315,000 $680,000 $1,550,000 $1,278,500 $1,712,500 $1,237,500$1,855,000 $955,000 $540,000 $1,415,000 $1,380,000 $1,390,000 $980,000 $609,000 $675,000 $587,500 $1,879,381 $1,950,000 $710,000 $714,500 $1,250,000 $1,067,500 $555,000 $1,535,000 $1,250,000
Co-Ops Brooklyn Bay Ridge
Bedford Stuyvesant
Boerum Hill
Brooklyn Heights
Bushwick
Carroll Gardens
Clinton Hill
Cobble Hill
Crown Heights
Ditmas Park
Dumbo
East Williamsburg
Flatbush
Fort Greene
Greenpoint
Greenwood
Gowanus
Kensington
Midwood
Ocean Hill
Park Slope
Prospect Heights
Prospect Lefferts
Prospect Park South
Red Hook
Stuyvesant Heights
$475,000 $1,210,000 $715,000 $455,000 $1,080,000 $775,000 $995,000 $455,000 $435,000 $280,000
2025 Midyear Summary • January 1 – June 30, 2025
6,015 -5%
Number of Sales
Midyear 2025 vs 2024
87 -7%
Average Days on Market
Midyear 2025 vs 2024
$700K +5%
Median Sales Price
Midyear 2025 vs 2024
$782K +7%
Average Sales Price
Midyear 2025 vs 2024
5,007 +22%
Listing Inventory
Midyear 2025 vs 2024
DAYS ON MARKET MEDIAN SELLING PRICE $578,000 $770,000 $885,000 $775,000 $768,000 $810,000 $650,000 $430,000 $957,500 $846,000 $445,000 $503,000 $339,000 $427,500 $920,000 $876,000 $906,675 $455,000 $780,000 $395,000 $820,000 $1,100,000 $688,500 $480,000 $991,500 $812,000
Astoria
Bayside
Bellerose
College Point
Corona
Douglaston
East Elmhurst
Flushing
Forest Hills
Fresh Meadows
Glendale
Jackson Heights
Jamaica Estates
Kew Gardens
Little Neck
Long Island City
Maspeth
Middle Village
Oakland Gardens
Ozone Park
Rego Park
Richmond Hill Ridgewood
UNIT SALES MEDIAN RENTAL PRICE DAYS ON MARKET Town Homes Midyear Summary • January 1 – June 30, 2025
Astoria
Bayside
Bellerose
College Point
Corona
Douglaston
East Elmhurst
Flushing
Forest Hills
Fresh Meadows
Glendale
Jackson Heights
Jamaica Estates
Kew Gardens
Little Neck
Long Island City
Maspeth
Middle Village
Oakland Gardens
Ozone Park
Rego Park
Richmond Hill
Ridgewood
St. Albans
UNIT SALES MEDIAN SELLING PRICE DAYS ON
MARKET Midyear 2025 Midyear 2025 Midyear 2024 Midyear 2025
$1,350,000 $1,150,000 $797,500 $925,000 $990,000 $1,275,000 $937,500 $1,178,000 $1,370,000 $1,170,000 $865,000 $1,075,000 $1,150,500 $1,055,000 $1,150,000 $1,261,000 $949,500 $952,500 $1,120,000 $780,000 $1,040,000 $822,500 $1,148,000 $690,000 $1,450,000 $1,157,500 $812,000 $1,225,000
Condos/Co-ops/HOA Astoria
Bayside
Bellerose
College Point
Corona
Douglaston
East Elmhurst
Flushing
Forest Hills
Fresh Meadows
Glendale
Jackson Heights
Jamaica Estates
Kew Gardens
Little Neck
Long Island City
Maspeth
Middle Village
Oakland Gardens
Ozone Park
Rego Park
Richmond Hill
Ridgewood
St. Albans Sunnyside
$372,000 $285,000 $742,000 $315,000 $349,000 $395,000 $545,140 $362,000 $305,000 $419,000 $390,000 $250,000 $315,000 $365,000 $895,000 $513,198 $450,000 $320,000 $340,000
Nassau County 2025 Midyear Summary • January 1 – June 30, 2025
4,304 -5%
Number of Sales
Midyear 2025 vs 2024
57 -5%
Average Days on Market
Midyear 2025 vs 2024
$777K +7%
Median Sales Price
Midyear 2025 vs 2024
$946K +5%
Average Sales Price
Midyear 2025 vs 2024
2,943 +17%
Listing Inventory
Midyear 2025 vs 2024
Residential Nassau County Albertson
Atlantic Beach
Baldwin / N. Baldwin / Baldwin Harbor
Bayville
Bellmore / N. Bellmore
Brookville
Carle Place
5-Towns
Centre Island
Cove Neck
East Rockaway
East Williston
East Hills
East Meadow
East Norwich
Floral Park
Franklin Square
Freeport
Garden City
Glen Cove
Glen Head / Glenwood Landing
Great Neck / Kings Point Greenvale
DAYS ON MARKET MEDIAN SELLING PRICE
$945,000 $1,287,500 $700,000 $807,500 $770,000 $2,306,250 $839,000 $909,500 $7,000,000$636,500 $1,350,000 $1,760,000 $775,000 $877,500 $651,000 $792,500 $614,000 $1,280,000 $800,000 $1,030,000 $1,100,000$744,000 $632,500 $1,188,000 $2,300,000 $700,000
Residential Nassau County Lido Beach
Locust Valley / Lattingtown
Manhasset
Manhasset Hills
Masspequa / Massapequa Park
Matinecock
Merrick / N. Merrick
Mill Neck
Mineola
Muttontown
New Hyde Park
North Hills
Oceanside
Old Brookville
Old Westbury
Oyster Bay
Oyster Bay Cove
Plainview
Point Lookout
Port Washington
Rockville
UNIT SALES MEDIAN SELLING PRICE DAYS ON MARKET
Midyear 2024 Midyear 2025
Midyear 2025 Midyear 2025
$617,500 $1,417,500 $735,838 $680,000 $760,500 $1,869,000 $1,369,000 $752,500 $1,900,000 $820,000 $2,680,000 $707,500 $2,000,000 $890,000 $2,555,000 $705,000 $2,425,000 $2,400,000 $900,000 $2,200,000 $889,000 $1,210,000 $1,131,250 $792,450 $1,275,000 $1,747,500 $2,100,000 $869,000
Residential Nassau County NEIGHBORHOOD South Hempstead
Sands Point
Sea Cliff
Seaford
Searingtown
Stewart Manor
Syosset
Upper Brookville
Valley Stream
West Hempstead
Wantagh
Westbury
Williston Park
Woodbury
$676,500 $3,500,000 $1,051,700 $780,000 $1,561,500 $740,750 $1,170,000
Nassau County $422,500 $330,000 $822,500 $404,500 $1,100,000 $625,000 $1,725,000
Suffolk County 2025 Midyear Summary • January 1 – June 30, 2025
5,415 -3%
Number of Sales
Midyear 2025 vs 2024
55 0%
Average Days on Market
Midyear 2025 vs 2024
$655K +7%
Median Sales Price
Midyear 2025 vs 2024
$828K +9%
Average Sales Price
Midyear 2025 vs 2024
3,689 +19%
Listing Inventory
Midyear 2025 vs 2024
Melville, NY
Residential Suffolk County Asharoken
Bellport
Centereach
Centerport
Cold Spring Harbor Commack
Dix Hills
East Northport East Islip
Greenlawn Hauppauge
Head
MARKET $499,500 $595,000 $994,500 $1,135,000 $785,500 $1,175,000 $762,500 $665,000 $850,000 $720,000 $1,200,000 $875,000 $1,917,500 $622,000 $662,000 $678,000 $1,850,000 $2,450,000 $910,000 $657,500 $735,000 $767,000 $1,300,000 $1,069,500
Suffolk County 2025 Midyear Summary • January 1 – June 30, 2025
308 -12%
Number of Sales
Midyear 2025 vs 2024
73 0%
Average Days on Market
Midyear 2025 vs 2024
$750K +3%
Median Sales Price
Midyear 2025 vs 2024
$944K +6%
Average Sales Price
Midyear 2025 vs 2024
408 +22%
Listing Inventory
Midyear 2025 vs 2024
Greenport, NY
$635,000 $526,000 $1,267,500 $1,053,000 $560,000 $967,500 $1,297,500 $1,250,000 $930,000
$1,080,000
2025 Midyear Summary • January 1 – June 30, 2025
494 +9%
Number of Sales
Midyear 2025 vs 2024
97 -9%
Average Days on Market
Midyear 2025 vs 2024
$940K -2%
Median Sales Price
Midyear 2025 vs 2024
$1.8M +12%
Average Sales Price
Midyear 2025 vs 2024
632 -49%
Listing Inventory
Midyear 2025 vs 2024
Residential Hamptons 2025 Midyear Summary • January 1 – June 30, 2025
Amagansett
Bridgehampton
Center Moriches
East Hampton
East Moriches
East Quogue
Eastport
Hampton Bays
Manorville
Montauk
Moriches
North Haven
Noyack
Quogue
Remsenburg
Sag Harbor
Sagaponack
Shinnecock
Southampton
Speonk
Springs
Wainscott
Water Mill
Westhampton
Westhampton Beach / Quiogue Westhampton Dunes
$2,995,000 $3,962,500 $750,000 $1,725,000 $790,000 $1,044,500 $890,000 $895,000 $560,000 $1,500,000 $622,500
$4,300,000 $1,807,500 $2,075,000 $6,050,000
718.762.2268
631.754.3400
516.678.1510