

MULTIPLE CHOICE. Choose the one alternative that best completes the statement or answers the question.
1) Which of the following does not need to be done when constructing a frequency distribution? 1)
A) select the number of classes desired
B) find the range
C) use classes that are mutually exclusive
D) make the class width an even number
Answer: D
2) The lower class limit represents the smallest data value that can be included in the class. 2)
A) False B) True
Answer: B
SHORT ANSWER. Write the word or phrase that best completes each statement or answers the question.
3) When data are collected in original form, they are called 3)
Answer: raw data
4) The of a specific class is the number of data values contained in it. 4)
Answer: frequency
5) If a frequency distribution had class boundaries of 132.5-147.5 , what would be the class width? 5)
Answer: 15
MULTIPLE CHOICE. Choose the one alternative that best completes the statement or answers the question.
6) The following frequency distribution presents the weights in pounds (lb) of a sample of visitors to a health clinic.
What is the class width?
7) For the class 5 -19, the upper class limit is
4.5 B) 5
Answer: D
8) What are the boundaries of the class 11 -18?
A) 11 and 18 B) 10.5 and 18.5
Answer: B
SHORT ANSWER. Write the word or phrase that best completes each statement or answers the question.
9) Find the class boundaries, midpoint, and width of the class 28-34?
Answer: boundaries: 27.5-34.5; midpoint: 31; width: 7
10) Find the class boundaries, midpoint, and width of the class 15.2-18.1?
Answer: boundaries: 15.15-18.15; midpoint: 16.65; width: 3
9)
10)
MULTIPLE CHOICE. Choose the one alternative that best completes the statement or answers the question.
11) State the reason why the following frequency distribution is incorrectly constructed.
11)
A) class limits overlap
C) class width is not uniform
B) there is no percent column
D) a class has been omitted
12) State the reason why the following frequency distribution is incorrectly constructed.
A) class limits overlap
C) there is no percent column
Answer: A
B) a class has been omitted
D) class width is not uniform
13) State the reason why the following frequency distribution is incorrectly constructed.
13)
A) a class has been omitted
C) there is no percent column
Answer: A
B) class width is not uniform
D) class limits overlap
14) In an ungrouped frequency distribution of the average age of high school graduates, what would be the boundaries for the class of graduates who were reported to be 18 years old?
A) 17.5-18.5 years old
C) 17.6-18.5 years old
Answer: A
14)
B) 17.6-19.5 years old
D) 17-19 years old
15) What is the midpoint of the class 6-10 ? 15)
16) Greg wants to construct a frequency distribution for the political affiliation of the employees at Owen's Hardware Store. What type of distribution would be best? 16)
A) cumulative B) ungrouped C) categorical D) grouped
Answer: C
17) What is the lower class limit of the class 13–17? 17)
A) 15 B) 17 C) 12.5
Answer: D
13
18) What is the midpoint of the class 17– 20 ? 18)
A) 1.5 B) 18 C) 18.5
Answer: C
3
19) What is the upper class boundary of the class 23-35 ? 19)
A) 7 B) 7.5
Answer: C
C) 35.5
35
20) If the limits for a class were 20-38, the boundaries would be 19.5-38.5 . 20)
A) False
Answer: B
B) True
SHORT ANSWER. Write the word or phrase that best completes each statement or answers the question.
21) For grouped frequency distributions, the is obtained by adding the lower and upper limits and dividing by 2. 21)
Answer: class midpoint
MULTIPLE CHOICE. Choose the one alternative that best completes the statement or answers the question.
22) What is the lower class limit in the class 8 -12 ?
A) 7.5 B) 8.5
Answer: D
C) 10
D) 8
22)
23) Which of the following pairs of class limits would be appropriate for grouping the numbers 11, 14 , 9, and 16 ? 23)
A) 9 -12 and 13 -16
C) 9 -11 and 12 -16
Answer: A
B) 9 -11 and 14 -16
D) 8 -12 and 12 -16
24) Thirty students recorded the colors of their eyes, choosing from the colors brown, blue, green, hazel, and black. This data can be appropriately summarized in a(n) .
A) open-ended distribution
C) categorical frequency distribution
Answer: C
24)
B) upper boundary
D) grouped frequency distribution
25) What are the boundaries of the class 1.87-3.43?
A) 1.879-3.439 B) 1.865-3.435
Answer: B
C) 1.82-3.48
D) 1.87-3.43
26) For the class 16.3-23.8, the width is 8.5. 26)
A) True B) False
Answer: B
SHORT ANSWER. Write the word or phrase that best completes each statement or answers the question.
27) When the range is large, and classes that are several units in width are needed, a frequency distribution is used. 27)
Answer: grouped
MULTIPLE CHOICE. Choose the one alternative that best completes the statement or answers the question.
28) The cumulative frequency for a class is the sum of the frequencies of the classes less than and equal to the upper boundary of the specific class. 28)
A) True B) False
Answer: A
29) A recent statistics exam yielded the following 25 scores. Construct a grouped frequency distribution with the class limits shown below.
30) The following frequency distribution presents the frequency of passenger vehicles that pass through a certain intersection from 8:00 AM to 9:00 AM on a particular day.
What is the relative frequency of the Motorcyle category?
31) The following frequency distribution presents the frequency of passenger vehicles that pass through a certain intersection from 8:00 AM to 9:00 AM on a particular day.
Construct a relative frequency distribution for the data.
32) A survey was taken on how much trust people place in the information they read on the Internet. Construct a categorical frequency distribution for the data. A trust in all that they read, M trust in most of what they read, H trust in about one-half of what they read, S trust in a small portion of what they read.
SHORT ANSWER. Write the word or phrase that best completes each statement or answers the question.
33) Construct a frequency polygon from the following frequency distribution.


MULTIPLE CHOICE. Choose the one alternative that best completes the statement or answers the question.
34) A recent statistics exam yielded the following 10 scores. Construct a frequency polygon distribution using the class limits shown below. 80, 99, 77, 67, 93, 71, 76, 86, 79, 71


35) Find the class with the least number of data values.

A) 55-65 B) 85-95 C) 65-75
Answer: B
36) Find the class with the greatest number of data values
75-85
Answer: C
75-85
85-95
37) One hundred students are shown an eight-digit number on a piece of cardboard for three seconds and are asked to then recite the number from memory. The process is repeated until the student accurately recites the entire number from memory. The following histogram presents the number of trials it took each student to memorize the number.
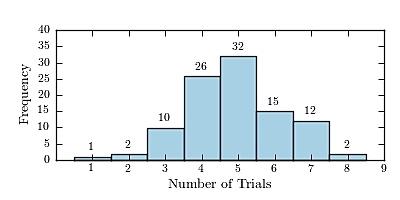
How many students memorized the number in three trials or less?
A) 3 B) 14 C) 87
Answer: D
38) An ogive is also called a cumulative frequency graph.
A) False B) True
Answer: B
D) 13
SHORT ANSWER. Write the word or phrase that best completes each statement or answers the question.
39) The three most commonly used graphs in research are the histogram, the , and the cumulative frequency graph (ogive).
Answer: frequency polygon
39)
MULTIPLE CHOICE. Choose the one alternative that best completes the statement or answers the question.
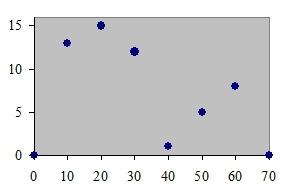
40) Which of the following could be a cumulative frequency graph?
38)

Answer: A
41) Which of the following could be an ogive? 41)


Answer: D
42) Which of the following is a histogram?

Answer: B
43) The frequency polygon and the histogram are two different ways to represent the same data set. 43)


A) True B) False
Answer: A
44) For a given data set, the ogive and the frequency polygon will have the same overall shape. 44)
A) False B) True
Answer: A
45) Using the ogive shown below, what is the cumulative frequency of data values less than or equal to 16 ?
A) 20 B) 30 C) 66 D) 60
Answer: B
46) Graphs that show distributions using proportions instead of raw data as frequencies are called 46)
A) ogive graphs.
C) frequency polygons.
Answer: B
B) relative frequency graphs.
D) histograms.
47) Which type of graph represents the data by using vertical bars of various heights to indicate frequencies? 47)

A) cumulative frequency
C) histogram
Answer: C
B) ogive
D) frequency polygon
48) The frequency polygon is a graph that displays the data by using lines that connect points plotted for the frequencies at the midpoints of the classes. 48)
A) True
Answer: A
B) False
49) A histogram is a graph that represents the cumulative frequencies for the classes in a frequency distribution. 49)
A) False B) True
Answer: A
50) Which of the following is a frequency polygon?


Answer: D
51) How many values are in the data set whose histogram is shown below ? 51)

A) 72 B) 76 C) 6
Answer: D
D) 22
52) Given the following frequency distribution, how many pieces of data were less than 28.5?
A) 13 B) 12
Answer: C
C) 25
D) 44
SHORT ANSWER. Write the word or phrase that best completes each statement or answers the question.
53) If the graph of a frequency distribution has a peak and the data tapers off more slowly to the right and more quickly to the left, the distribution is said to be
Answer: right-skewed
MULTIPLE CHOICE. Choose the one alternative that best completes the statement or answers the question.
54) Classify the histogram as skewed to the left, skewed to the right, or approximately symmetric.54)

A) skewed to the left
B) skewed to the right
C) approximately symmetric
Answer: A
55) Classify the histogram as unimodal or bimodal.

A) unimodal
Answer: B
B) bimodal
56) The following frequency distribution presents the weights in pounds (lb) of a sample of visitors to a health clinic.
Construct a frequency histogram.


Answer: A
57) The following frequency distribution presents the weights in pounds (lb) of a sample of visitors to a health clinic.


Construct a relative frequency histogram.

58) The following table presents the purchase totals (in dollars) of a random sample of gasoline purchases at a convenience store.


58)

Answer: A
59) The following table presents the purchase totals (in dollars) of a random sample of gasoline purchases at a convenience store.


Construct a relative frequency distribution using a class width of 10, and using 0 as the lower class limit for the first class.

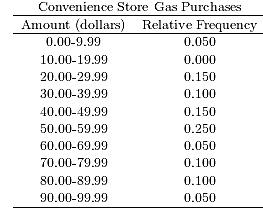


Answer: A
60) The following table presents the purchase totals (in dollars) of a random sample of gasoline purchases at a convenience store.


60)

Answer: D
61) The following table presents the purchase totals (in dollars) of a random sample of gasoline purchases at a convenience store.


Construct a relative frequency histogram using a class width of 10, and using 0 as the lower class limit for the first class.


 A)
B)
A)
B)
Answer: C

62) Thirty households were surveyed for the number of televisions in each home. Following are the results.


Construct
62)
Answer: D
63) Thirty households were surveyed for the number of televisions in each home. Following are the results.


63)


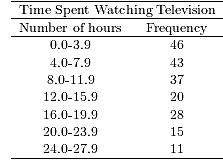
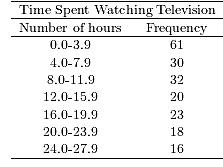
64) A sample of 200 high school students were asked how many hours per week they spend watching television.The following frequency distribution presents the results.


Construct a frequency polygon for the frequency distribution.
Answer: C
65) A sample of 200 high school students were asked how many hours per week they spend watching television.The following frequency distribution presents the results.


65)


Answer: B
66) A sample of 200 high school students were asked how many hours per week they spend watching television.The following frequency distribution presents the results.


Construct a frequency ogive for the frequency distribution.
Answer: A
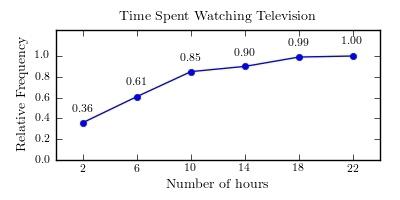
67) A sample of 200 high school students were asked how many hours per week they spend watching television.The following frequency distribution presents the results.


Construct a relative frequency ogive for the frequency distribution.


68) The following frequency distribution presents the frequency of passenger vehicles that pass through a certain intersection from 8:00 AM to 9:00 AM on a particular day.


Construct a frequency bar graph for the data.

Answer: D
69) The following bar graph presents the average amount a certain family spent, in dollars, on various food categories in a recent year.

On which food category was the most money spent?
A) Cereals and baked goods
C) Dairy products
Answer: C
B) Fruits and vegetables
D) Meat poultry, fish, eggs
70) The following frequency distribution presents the frequency of passenger vehicles that pass through a certain intersection from 8:00 AM to 9:00 AM on a particular day.
Construct a relative frequency bar graph for the data.


71) The following frequency distribution presents the frequency of passenger vehicles that pass through a certain intersection from 8:00 AM to 9:00 AM on a particular day.


72) The following pie chart presents the percentages of fish caught in each of four ratings categories.


Match this pie chart with its corresponding Parato chart.

Answer: A
SHORT ANSWER. Write the word or phrase that best completes each statement or answers the question.
73) Construct a Pareto chart for the following distribution:


74) Construct a Pareto chart for the following distribution:

MULTIPLE CHOICE. Choose the one alternative that best completes the statement or answers the question.
75) The following frequency distribution presents the frequency of passenger vehicles that pass through a certain intersection from 8:00 AM to 9:00 AM on a particular day.
Construct a relative frequency Parato chart for the data.