Business
7A • Daily Corinthian
Saturday, November 26, 2011
YOUR FUNDS
YOUR STOCKS Name
P/E Last
Chg
A-B-C-D ABB Ltd AES Corp AFLAC AK Steel AMR AT&T Inc AU Optron AbtLab Accenture ActivsBliz AdobeSy AMD Aeropostl Aetna Agilent AkamaiT AlcatelLuc Alcoa Allstate AlphaNRs AlteraCp lf Altria AmBev s Amarin Amazon AMovilL s ACapAgy AEagleOut AmExp AmIntlGrp AmTower AmeriBrgn Amgen Anadarko AnalogDev Annaly Apache Apple Inc ApldMatl ArcelorMit ArchCoal ArchDan Atmel Autodesk Avon BB&T Cp BHP BillLt BP PLC Baidu BakrHu BcoBrades BcoSantSA BcoSBrasil BkofAm BkNYMel Barclay Bar iPVix BarrickG BerkH B BestBuy Boeing BostonSci BrigExp BrMySq Broadcom BrcdeCm CA Inc CBRE Grp CBS B CSX s CVS Care CampSp CdnNRs gs CapOne Carlisle Carnival Caterpillar Celgene Cemex Cemig pf CntryLink CheniereEn ChesEng Chevron Chicos Chimera Chubb CienaCorp Cigna Cisco Citigrp rs Clearwire CliffsNRs CocaCola CollctvBrd Comcast Comc spcl CompSci ConAgra ConocPhil Corning CSVS2xVxS CSVelIVSt s CredSuiss Cree Inc DR Horton Deere Dell Inc DeltaAir DenburyR Dndreon DeutschBk DevonE DiamondF DirecTV A DxFnBull rs DrSCBr rs DirFnBr rs DrxEnBear DirEMBear DirxSCBull DirxEnBull Discover DishNetwk Disney DomRescs DowChm DryShips DuPont DukeEngy
... 13 8 ... ... 14 ... 18 16 21 14 4 8 8 12 26 ... 9 36 44 13 17 ... ... 96 10 4 15 11 1 81 14 14 ... 11 8 8 13 7 8 12 9 8 25 9 13 ... 15 56 13 ... ... ... ... 8 ... ... 11 16 9 12 15 23 15 18 28 12 18 13 12 15 13 ... 5 14 12 13 25 ... ... 16 ... 7 7 13 5 10 ... 9 15 6 ... 5 12 12 15 15 ... 14 9 7 ... ... ... 26 47 11 7 10 11 ... ... 5 12 14 ... ... ... ... ... ... ... 6 8 13 17 10 11 12 16
16.68 11.09 39.05 7.04 1.61 27.41 4.23 52.05 53.70 11.75 25.83 4.99 14.88 37.89 33.83 26.31 1.54 8.95 24.70 18.81 34.12 27.25 31.51 7.10 182.40 22.17 27.76 12.89 45.00 20.07 55.72 35.98 54.65 71.84 32.28 15.94 86.83 363.57 10.16 15.43 13.63 27.90 8.31 29.80 16.09 21.17 66.32 39.41 119.91 48.87 15.04 6.80 6.90 5.17 17.70 9.62 49.20 47.59 72.89 25.63 62.78 5.27 36.39 30.16 29.58 5.11 19.80 14.62 23.55 20.00 36.85 31.85 32.64 40.02 39.73 30.47 86.72 60.24 3.48 15.77 35.70 10.21 22.42 92.29 10.11 2.60 63.82 10.97 40.92 17.50 23.63 1.54 59.72 64.74 12.52 21.00 20.81 22.93 23.95 66.14 13.95 63.98 4.91 21.20 23.85 10.86 73.64 14.22 7.12 14.32 7.85 32.34 58.58 27.04 45.08 49.38 39.66 54.10 15.95 25.53 33.67 36.69 22.96 23.84 33.51 49.51 24.47 2.15 43.86 19.79
-.02 -.03 -.44 -.11 -.14 +.16 -.30 +.07 -.11 -.06 -.13 -.25 +.23 +.03 +.06 +.07 +.20 -.46 -.54 +.13 -.02 +.43 -6.59 -.61 -.02 -.04 -.10 -.03 +.30 -.39 -.29 -.11 -.23 +.26 -1.31 -3.42 -.05 +.23 -.30 +.11 -.13 -.24 -.27 +.13 -.61 -.27 +.36 -.11 +.03 -.05 +.03 -.10 +.38 +.60 -.37 +.14 -.08 +.42 -.05 +.01 -.85 +.15 +.14 +.11 -.23 -.19 +.60 -.67 +.17 -.20 -1.04 -.19 -.28 -.28 +.20 -.06 -.29 -1.46 -.04 +.03 +.18 -.06 +.14 +.10 +.12 -.24 -.13 +.01 -.07 -.08 -.07 +.09 -.79 -.10 +1.77 -.08 -.05 +.10 +.03 -1.08 -.08 -.11 +.06 -.12 -.94 -.76 +.29 +.69 +1.46 -.73 +.37 +.17 -1.32 -.93 +.05 +.57 +.11 +.20 -.13 -.03 -.22 +.16
E-F-G-H E-Trade eBay EMC Cp EKodak Eaton s Ecolab ElPasoCp EldorGld g ElectArts EmersonEl EmpDist EnCana g EricsnTel EvergEn h ExcoRes Exelon Expedia ExpScripts ExxonMbl FedExCp FifthThird FstSolar FocusMda FootLockr FordM ForestOil s FosterWhl FMCG s FrontierCm Frontline GATX Gafisa SA GameStop Gap GaylrdEnt GenDynam GenElec
34 21 22 ... 11 24 ... 31 ... 14 16 32 ... ... ... 11 15 16 9 16 9 7 15 13 5 12 13 6 36 4 19 ... 8 10 ... 9 12
8.14 +.10 28.23 -.32 21.88 -.18 1.10 -.05 40.55 -.32 53.51 +.83 24.84 +.30 16.36 -.39 20.83 -.11 47.11 +.05 19.69 -.20 17.80 -.23 9.17 -.34 .21 +.07 10.15 -.23 41.93 +.04 26.11 +.26 42.15 -.34 73.90 -.68 76.08 -.48 10.97 +.03 40.32 -1.26 17.70 +.09 21.12 -.23 9.75 -.08 13.30 -.53 17.50 -.37 33.82 -.56 5.39 +.04 2.76 -.06 37.19 -.13 5.65 21.51 -.60 17.62 -.18 19.10 -.11 61.13 +.49 14.70 -.03
GenMills GenMotors Genworth Gerdau GileadSci GlaxoSKln GoldFLtd Goldcrp g GoldStr g GoldmanS Goodyear Google GreenMtC Groupon n HSBC Hallibrtn HartfdFn HeclaM Hess HewlettP HomeDp HonwllIntl HopFedBc HostHotls HudsCity HumGen HuntBnk Huntsmn Hyperdyn
15 4 ... ... 11 ... 2 19 ... 14 27 18 38 ... ... 11 6 13 10 6 16 13 ... ... ... ... 9 7 ...
38.23 +.27 20.34 +.10 5.39 +.04 7.04 -.21 39.28 -.36 41.50 -.53 15.16 -.23 47.84 -.57 1.78 -.13 88.75 +.86 11.93 -.08 563.00 -7.11 49.66 -.47 16.75 -.21 35.92 +.09 31.80 -.40 15.46 -.20 5.30 -.07 54.33 -.68 25.39 -.39 36.47 -.05 49.14 -.05 5.95 12.81 +.18 5.13 +.04 7.03 -.05 4.72 +.03 9.43 -.13 2.85 -.19
I-J-K-L ING iShGold iSAstla iShBraz iSCan iShGer iSh HK iShJapn iSh Kor iShMex iSTaiwn iShSilver iShChina25 iSSP500 iShEMkts iShB20 T iS Eafe iShiBxHYB iShR2K iShREst ITW IngerRd IngrmM Intel IBM IntPap Interpublic Invesco ItauUnibH IvanhM g JDS Uniph JPMorgCh Jabil JanusCap Jefferies JetBlue JohnJn JohnsnCtl JnprNtwk KB Home Keycorp Kinross g KodiakO g Kohls Kraft Kroger LDK Solar LSI Corp LVSands LennarA LibtIntA h LillyEli Limited LincNat LloydBkg LockhdM Lowes LyonBas A
... ... ... ... ... ... ... ... ... ... ... ... ... ... ... ... ... ... ... ... 10 ... 11 10 14 9 10 9 ... ... 34 6 11 6 7 15 15 12 21 ... 7 17 37 12 19 12 1 10 25 34 14 8 14 5 ... 9 16 ...
6.26 -.05 16.39 -.15 20.70 -.12 54.30 -.69 24.96 -.30 18.14 -.14 15.01 8.84 49.52 -.25 49.64 -1.24 11.51 -.03 30.20 -.73 33.33 -.05 116.64 -.29 36.10 -.12 120.80 -1.78 46.45 -.24 82.75 66.62 -.86 51.60 +.18 42.58 +.08 29.17 -.16 17.12 -.09 22.73 +.03 177.06 -.89 25.89 +.31 8.41 +.09 17.91 +.11 15.74 -.10 18.21 +.31 9.56 -.32 28.48 +.10 18.34 -.02 5.86 +.01 10.65 +.14 3.48 +.08 61.27 -.15 27.59 -.18 20.17 -.38 6.71 +.02 6.67 +.03 12.74 -.21 7.74 -.01 51.81 -.33 34.32 +.09 22.16 +.34 3.12 -.04 5.10 -.08 42.40 -.13 16.44 15.16 -.05 35.58 -.07 38.33 -.41 17.58 -.05 1.40 +.06 75.39 +1.44 22.68 +.20 28.65 +.32
M-N-O-P MEMC MFA Fncl MGIC MGM Rsts Macys MagHRes Manitowoc Manulife g MarathnO s MarathP n MktVGold MktVRus MarIntA MartMM MarvellT Mattel McDnlds Mechel Medtrnic MelcoCrwn Merck MetLife MicronT Microsoft MobileTele Molycorp MonstrWw MorgStan Mosaic Mylan NRG Egy Nabors NBkGreece NOilVarco NetApp Netflix NwGold g NY CmtyB NewmtM NewsCpA Nexen g NobleCorp NokiaCp NorflkSo NorthropG Novartis NuanceCm Nucor Nvidia OCharleys OcciPet OfficeDpt OilSvHT OldRepub OmniVisn OnSmcnd Oracle PNC PPG Paccar PacEth rsh PatriotCoal PattUTI PeabdyE PennWst g PeopUtdF PepsiCo PerfectWld PetrbrsA Petrobras Pfizer Pharmsst s PhilipMor PiperJaf Popular Potash s Power-One PS USDBull PwShs QQQ Pozen PrinFncl
... 7 ... ... 11 ... ... ... 6 ... ... ... 55 40 11 14 18 ... 11 48 12 7 37 9 12 27 29 8 10 13 16 16 ... 15 20 15 ... 10 15 14 ... 24 ... 14 8 12 16 18 13 ... 12 ... ... ... 4 19 16 8 12 15 ... ... 10 10 ... 21 16 4 ... ... 12 ... 15 16 ... 12 4 ... ... ... 7
3.92 6.41 2.58 9.27 29.45 3.78 8.88 10.32 24.66 32.27 54.79 27.54 27.92 71.65 13.14 27.55 92.10 8.97 33.68 8.43 33.16 27.91 5.50 24.30 15.47 26.98 6.59 13.26 49.30 17.41 18.71 15.98 .43 64.52 34.25 63.86 9.57 11.38 63.77 15.97 14.33 32.46 5.29 70.44 53.42 51.65 22.26 35.57 14.04 5.52 86.69 1.96 112.85 7.29 10.41 6.92 28.74 49.07 79.45 37.28 1.26 8.11 19.11 32.78 16.05 11.82 62.49 9.87 22.64 24.41 18.45 133.17 71.31 18.43 1.43 40.67 4.26 22.42 52.88 3.62 21.43
-.04 +.16 +.18 -.03 -.11 -.30 -.26 +.04 -.18 -.56 -.70 +.14 +.04 +1.17 -.25 +.14 +.23 -.13 -.27 +.02 -.03 +.05 -.21 -.17 +.81 -.71 -.30 +.23 -.71 -.21 -.06 -.24 -.01 +.76 -.41 -4.64 -.23 +.06 -.44 -.06 -.49 -.24 -.18 +.09 +.45 -1.12 -.72 +.09 -.40 -.27 -1.08 -.07 -.39 +.11 -.50 -.15 -.26 +.19 -.12 +.23 +.05 +.01 +.15 -.48 -.12 +.24 +.09 +.65 -.71 -.58 +.17 +.29 -.04 +.03 -.98 -.24 +.13 -.41 +1.12 -.24
The Week Ahead
The first read on manufacturing The Institute for Supply Management issues its report on the manufacturing sector during November on Thursday. The ISM’s manufacturing index has fallen toward 50, a scary number because it’s the divider between manufacturing growth and contraction. Economists expect the index to rise to 52. A key number in the report will be new orders – if they rise, that indicates manufacturing will strengthen in the months ahead.
ProShtS&P ... PrUShS&P ... PrUlShDow ... ProUltQQQ ... PrUShQQQ rs ... ProUltSP ... ProUShL20 ... PrUPShQQQ ... PrUPShR2K ... ProShtR2K ... ProUSSP500 ... PrUltSP500 s ... ProUSSlv rs ... ProUShEuro ... ProctGam 15 ProgsvCp 11 ProUSR2K rs ... Prudentl 6 PulteGrp ...
Take stock in your business. Advertise in the Daily Corinthian. To advertise here, phone 662-287-6111
44.21 +.11 23.19 +.08 18.45 +.06 73.03 -1.07 51.59 +.74 39.53 -.20 18.66 +.51 24.25 +.55 19.66 +.74 33.44 +.39 17.50 +.13 47.61 -.50 13.76 +.62 19.50 +.28 61.00 -.06 17.58 -.14 49.64 +1.17 44.91 -.26 5.22 +.07
Q-R-S-T Qualcom RF MicD RadianGrp RegionsFn RschMotn RioTinto RiteAid RiverbedT RylCarb RoyaleEn SAIC SK Tlcm SpdrDJIA SpdrGold SP Mid S&P500ETF SpdrHome SpdrS&PBk SpdrLehHY SpdrRetl SpdrOGEx STMicro Safeway StJude Salesforce SanDisk SandRdge Sanofi SaraLee Schlmbrg Schwab SeagateT SemiHTr SvArts rsh SiderurNac SilvWhtn g Sina SiriusXM SkywksSol SonyCp SouthnCo SwstAirl SwstnEngy SpectraEn SprintNex SP Matls SP HlthC SP CnSt SP Consum SP Engy SPDR Fncl SP Inds SP Tech SP Util Staples Starbucks StarwdHtl StateStr Stryker Suncor gs Suntech SunTrst Supvalu Symantec Synovus TE Connect TJX TaiwSemi TalismE g Target TataMotors TeckRes g TelefEsp s Tellabs TempurP TenetHlth Terex Tesoro TevaPhrm TexInst ThermoFis 3M Co Tiffany TimeWarn TiVo Inc TollBros Total SA Transocn Travelers TrinaSolar TriQuint
21 19 ... 22 3 ... ... 68 9 ... 8 ... ... ... ... ... ... ... ... ... ... 5 11 12 ... 9 9 ... 13 20 16 14 ... ... ... 21 ... 44 12 ... 18 34 19 16 ... ... ... ... ... ... ... ... ... ... 10 25 14 11 14 9 2 16 59 18 ... 11 17 ... ... 12 ... ... ... ... 16 10 ... 5 12 12 13 13 22 12 ... 40 ... ... 14 2 8
51.86 -.17 5.63 -.13 2.19 +.06 3.69 +.01 16.00 -.20 46.34 +.02 1.10 -.02 23.90 +.27 23.19 -.47 4.64 +.78 11.41 +.15 14.41 +.23 112.14 -.19 163.40 -1.43 147.81 -.70 116.34 -.22 14.96 -.11 17.63 +.07 36.43 48.50 -.48 48.14 -.80 5.64 -.08 18.83 +.46 34.78 -.25 104.93 -.86 45.56 -.23 6.35 +.08 31.72 -.49 17.74 +.03 66.37 -.13 10.77 +.02 15.16 -.27 28.25 -.22 .34 -.04 7.55 -.21 30.91 -.19 63.15 -.36 1.75 +.01 14.13 -.41 16.96 +.69 42.47 +.27 7.50 +.10 35.03 -.60 28.23 +.19 2.38 -.09 31.41 -.16 31.71 -.12 30.37 +.11 36.33 -.20 63.83 -.46 11.78 +.03 31.16 -.05 24.01 -.13 33.43 +.17 13.68 -.17 40.84 -.41 43.41 -.73 36.24 -.09 45.52 +.05 27.06 -.61 2.29 -.14 16.53 +.09 7.03 -.20 15.33 -.21 1.41 -.03 30.11 -.22 58.75 -.05 12.07 -.13 12.01 -.18 51.21 -.32 16.04 +.51 31.31 -.24 17.00 -.33 3.85 -.03 48.93 -4.24 4.17 +.05 12.67 -.43 22.37 -.26 36.91 -.59 27.79 -.15 44.42 -.05 76.13 +.59 69.50 +.38 32.36 +.19 9.13 -.25 18.55 -.18 46.77 -.43 44.51 -.16 53.41 +.65 6.54 -.55 4.09 +.06
U-V-W-X-Y-Z UBS AG US Airwy UnilevNV UnionPac UtdContl UtdMicro UPS B US Bancrp US NGs rs US OilFd USSteel UtdTech UtdhlthGp UrbanOut Vale SA Vale SA pf ValeroE VangTotBd VangEmg VerizonCm ViacomB VimpelCm VirgnMda h Visa Vodafone VulcanM WalMart Walgrn WsteMInc WeathfIntl WellPoint WellsFargo Wendys Co WDigital WstnUnion Weyerh WmsCos Windstrm WT India XL Grp XcelEngy Xerox Xilinx YRC rsh Yahoo Yamana g YingliGrn Youku n YumBrnds
... 7 ... 15 10 6 16 11 ... ... ... 13 10 19 ... ... 7 ... ... 14 12 8 ... 18 ... ... 13 11 15 51 8 9 ... 8 11 18 19 21 ... 25 15 13 14 ... 18 16 2 ... 20
10.72 +.08 4.02 +.02 31.47 -.15 95.16 -.84 15.90 +.37 2.01 +.02 66.46 -.44 24.03 +.24 8.02 +.03 37.16 22.27 -.14 71.04 +.07 43.67 +.11 25.19 -.07 21.90 -.76 20.58 -.67 20.23 -.17 83.66 -.12 37.01 -.17 35.35 41.61 -.15 11.23 -.02 22.24 -.05 89.02 -.27 25.63 -.24 29.42 -.57 56.89 +.25 32.47 +.38 30.31 +.06 13.16 -.02 63.70 -.53 23.51 +.30 4.87 -.02 25.00 -.59 16.30 +.10 15.48 -.01 29.70 +.33 11.13 +.05 16.50 +.21 18.92 +.14 25.20 +.26 7.57 +.02 30.07 -.24 .04 15.10 +.16 14.65 -.36 3.81 -.15 15.72 +1.05 52.72 -.46
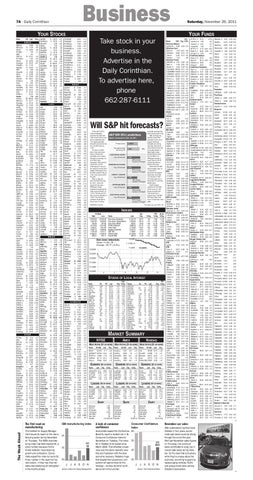
Will S&P hit forecasts? At the start of 2011, market strategists predicted the S&P 500 index would end the year with a substantial gain. The highest estimate forecast a 23 percent rise from its 2010 close of 1,257. It’s been a volatile year in the market and many of those early estimates were revised. Perhaps surprisingly, not all of them were downward. With just one month left, it will be challenging for many of the banks to hit their S&P targets. Particularly since the S&P closed Friday at 1158, down 8 percent for the year. Back on Aug. 30, when the S&P 500 was at 1,212 – down 3.6 percent for the year – JPMorgan Chase analysts forecast that the index would end 2011 at 1,475. That was up from their previous estimate of 1,425. They thought investors would start to focus more on strong
1,158.67
Friday’s close Average forecast as of Aug. 30
1,358
17%
DEUTSCHE BANK Aug. 30 forecast
1,425 23% change needed to hit target
JPMORGAN CHASE Aug. 30 forecast
1,475 27% change needed to hit target
CREDIT SUISSE Aug. 30 forecast
1,100 -5% change needed to hit target
OPPENHEIMER Aug. 30 forecast
1,325 14% change needed to hit target
DEUTSCHE BANK 1,400
Aug. 30 forecast
21% change needed to hit target
Francesca Levy, Jenni Sohn • AP
INDEXES 52-Week High
Low
12,876.00 5,627.85 459.94 8,718.25 2,490.51 2,887.75 1,370.58 14,562.01 868.57
10,404.49 3,950.66 381.99 6,414.89 1,941.99 2,298.89 1,074.77 11,208.42 601.71
Last
Net Chg
%Chg
11,231.78 4,533.44 426.01 6,898.18 2,105.33 2,441.51 1,158.67 12,158.94 666.16
-25.77 -30.76 +2.05 -21.74 -13.97 -18.57 -3.12 -41.54 -8.18
-.23 -.67 +.48 -.31 -.66 -.75 -.27 -.34 -1.21
Name
Dow Jones Industrials Dow Jones Transportation Dow Jones Utilities NYSE Composite Amex Index Nasdaq Composite S&P 500 Wilshire 5000 Russell 2000
Dow Jones industrials
12,240
Close: 11,231.78 Change: -25.77 (-0.2%)
1.172E+4 11,200
13,000
YTD %Chg
52-wk %Chg
-2.99 -11.23 +5.19 -13.38 -4.67 -7.97 -7.87 -8.99 -14.99
+1.26 -7.09 +8.50 -8.03 +1.47 -3.67 -2.58 -3.78 -9.09
10 DAYS
12,500 12,000 11,500 11,000 10,500
J
J
A
S
O
N
STOCKS OF LOCAL INTEREST Name AFLAC AT&T Inc AirProd AlliantEgy AEP AmeriBrgn ATMOS BB&T Cp BP PLC BcpSouth Caterpillar Chevron CocaCola Comcast CrackerB Deere Dell Inc Dillards Dover EnPro FordM FredsInc FullerHB
Div 1.32f 1.72 2.32 1.70 1.88f .52f 1.38f .64a 1.68 .04 1.84 3.12 1.88 .45 1.00f 1.64 ... .20 1.26 ... ... .20 .30
PE 8 14 13 14 10 14 14 13 15 18 13 7 12 15 12 11 7 13 12 14 5 15 12
Last 39.05 27.41 76.74 40.39 37.20 35.98 32.48 21.17 39.41 8.57 86.72 92.29 64.74 21.00 43.77 73.64 14.22 48.47 50.26 31.12 9.75 12.19 20.62
Chg -.44 -.14 -.20 +.08 +.10 -.39 -.06 +.13 -.27 -.08 -1.04 -1.46 -.13 -.07 -.48 -1.08 -.08 -.37 -.14 -.65 -.08 -.37 -.10
YTD %Chg -30.8 -6.7 -15.6 +9.8 +3.4 +5.5 +4.1 -19.5 -10.8 -46.3 -7.4 +1.1 -1.6 -4.0 -20.1 -11.3 +4.9 +27.8 -14.0 -25.1 -41.9 -11.4 +.5
Name GenCorp GenElec Goodrich Goodyear HonwllIntl Intel Jabil KimbClk Kroger Lowes McDnlds MeadWvco OldNBcp Penney PennyMac PepsiCo PilgrimsP RadioShk RegionsFn SbdCp SearsHldgs Sherwin SiriusXM
Div ... .60 1.16 ... 1.49f .84 .32f 2.80 .46f .56 2.80f 1.00 .28 .80 2.00 2.06 ... .50f .04 3.00a ... 1.46 ...
YTD %Chg -7.5 -19.6 +39.1 +.7 -7.6 +8.1 -8.7 +9.0 -.9 -9.6 +20.0 +4.1 -13.6 -8.4 -14.0 -4.3 -29.3 -42.3 -47.3 -5.8 -20.8 -.1 +7.4
PE Last Chg ... 4.78 +.04 12 14.70 -.03 26 122.50 -.05 27 11.93 -.08 13 49.14 -.05 10 22.73 +.03 11 18.34 -.02 16 68.69 +.17 12 22.16 +.34 16 22.68 +.20 18 92.10 +.23 15 27.22 +.16 16 10.27 -.05 18 29.61 -.26 7 15.60 -.05 16 62.49 +.09 ... 5.01 +.15 7 10.66 -.09 22 3.69 +.01 6 1875.25 +16.99 ... 58.40 -.75 18 83.64 +.50 44 1.75 +.01
MARKET SUMMARY NYSE
AMEX
NASDAQ
MOST ACTIVE ($1 OR MORE) MOST ACTIVE ($1 OR MORE) MOST ACTIVE ($1 OR MORE) Name
Vol (00)
Last
BkofAm 1344734 S&P500ETF 878749 SPDR Fncl 313065 iShEMkts 291114 Citigrp rs 275948
5.17 116.34 11.78 36.10 23.63
Chg +.03 -.22 +.03 -.12 +.12
GAINERS ($2 OR MORE) Name
Last
CSVs2xInPal ETracBDC SunTr wtA PhxNMda n MGIC
Chg %Chg
55.31 +6.63 +13.6 20.99 +1.74 +9.0 3.10 +.25 +8.8 5.44 +.43 +8.6 2.58 +.18 +7.5
LOSERS ($2 OR MORE) Name
Last
ETr2xSSD JinkoSolar ChinaMM Starret TempurP
Chg %Chg
23.97 -3.00 -11.1 5.22 -.54 -9.4 2.16 -.20 -8.5 11.45 -1.06 -8.5 48.93 -4.24 -8.0
Name
Vol (00)
NwGold g GoldStr g CheniereEn Rentech NovaGld g
Advanced Declined Unchanged Total issues New Highs New Lows Volume
est. 52
50
J A S O N
Source: Institute for Supply Management
1,277 1,656 120 3,053 43 128 1,614,925,440
Last
21291 9.57 20233 1.78 18581 10.21 10866 1.44 10837 9.67
Chg
Name
-.23 -.13 -.06 -.03 -.15
Name
Last
LucasEngy AvalonHld QuestRM g PyramidOil ATS Corp
2.20 2.89 2.70 3.90 3.38
Last
SagaComm InvCapHld AbdnChile NHltcre Augusta g
Chg %Chg
Name
+.35 +18.9 +.27 +10.3 +.19 +7.6 +.27 +7.4 +.20 +6.3
Chg
22.73 1.75 24.30 17.50 52.88
+.03 +.01 -.17 +.10 -.41
Last
Chg %Chg
Pozen 3.62 +1.12 +44.8 Amertns pf 3.99 +.79 +24.7 Gyrody 105.00 +19.40 +22.7 RoyaleEn 4.64 +.78 +20.2 PhysnsFm 3.34 +.45 +15.6
LOSERS ($2 OR MORE)
Chg %Chg
Name
29.25 -3.72 -11.3 3.80 -.23 -5.7 14.71 -.81 -5.2 35.31 -1.79 -4.8 2.92 -.14 -4.6
Last
CIFC Corp Sevcon BG Med n EssexRent AsiaPWire
DIARY Advanced Declined Unchanged Total issues New Highs New Lows Volume
Last
GAINERS ($2 OR MORE)
LOSERS ($2 OR MORE) Name
Vol (00)
Intel 261958 SiriusXM 247566 Microsoft 242515 Cisco 233715 PwShs QQQ 216637
GAINERS ($2 OR MORE)
DIARY
54
J
Banks’ forecasts for Dec. 30, 2011
SOURCES: the banks
ISM manufacturing index
52
corporate earnings than the European debt crisis. UBS and Citigroup had also raised their forecasts by the end of August. But those forecasts are looking optimistic. Worrisome news about Europe and the budget debate in Washington keeps sending stocks down. For the S&P to hit JPMorgan’s target, it would have to rise 27 percent the last four weeks of the year. Historically, the S&P 500 averages a gain of 1.5 percent in December. Its biggest December climb was 11.2 percent in 1991. The index has risen in December 61 out of the last 84 years. Credit Suisse’s prediction for the S&P 500 to close at 1,100 shows its pessimism. That would be a 5 percent drop. The S&P 500 hasn’t fallen that much in December since 2002.
S&P 500 2011 predictions
3.06 4.15 3.25 2.60 2.60
Chg %Chg -.90 -.90 -.50 -.34 -.28
-22.7 -17.8 -13.3 -11.6 -9.7
DIARY 183 216 36 435 7 20 35,385,315
Advanced Declined Unchanged Total issues New Highs New Lows Volume
693 1,651 150 2,494 5 164 704,813,940
A look at consumer confidence
Consumer Confidence Index
Economists expect the Conference Board to report a modest rise in its Consumer Confidence Index for November on Tuesday. The index fell in October to its lowest since March 2009. That reflected uneasiness over the stock market’s volatility and frustration with the slow economic recovery. Retailers hope that despite their pessimism, consumers will spend freely for the holidays – as they did when confidence fell in the summer.
60
50
est. 43.5
40
30
J
J A S O N Source: The Conference Board
YTD Name NAV Chg %Rtn American Beacon LgCpVlInv 16.49 -0.03 -11.0 American Cent EqIncInv 6.78 +0.01 -4.3 GrowthInv 23.98 -0.15 -7.2 UltraInv 21.63 -0.15 -4.5 ValueInv 5.15 -8.9 American Funds AMCAPA m 17.67 -0.06 -5.8 BalA m 17.24 -0.05 -2.2 BondA m 12.46 -0.04 +5.3 CapIncBuA m46.96 -0.15 -3.2 CapWldBdA m20.33 -0.16 +2.2 CpWldGrIA m30.24 -0.12 -13.6 EurPacGrA m33.90 -0.07 -18.1 FnInvA m 32.93 -0.10 -9.4 GrthAmA m 27.25 -0.12 -10.5 HiIncA m 10.44 -0.01 -1.0 IncAmerA m 15.80 -0.02 -1.7 IntBdAmA m 13.58 -0.02 +3.1 InvCoAmA m25.23 -0.07 -9.1 MutualA m 24.02 -0.04 -3.4 NewEconA m22.60 -0.10 -10.8 NewPerspA m24.95 -0.07 -12.8 NwWrldA m 44.88 -0.18 -17.8 SmCpWldA m31.67 -0.10 -18.5 TaxEBdAmA m12.34 +8.2 USGovSecA m14.64 -0.03 +7.0 WAMutInvA m26.11 -0.06 -2.4 Aquila ChTxFKYA m10.69 +7.7 Artisan Intl d 18.98 -12.5 MdCpVal 19.90 +0.03 -0.9 MidCap 31.92 -0.18 -5.1 Baron Growth b 48.27 -0.17 -5.8 Bernstein DiversMui 14.62 +5.4 IntDur 14.13 -0.04 +6.2 TxMIntl 11.95 -0.07 -24.0 BlackRock Engy&ResA m31.19 -0.39 -20.6 EqDivA m 16.74 -0.04 -3.2 EqDivI 16.77 -0.04 -3.0 GlobAlcA m 17.88 -0.08 -7.2 GlobAlcC m 16.64 -0.07 -7.8 GlobAlcI d 17.98 -0.08 -7.0 Calamos GrowA m 46.50 -0.41 -12.9 Columbia AcornIntZ 32.88 -0.14 -17.6 AcornZ 26.34 -0.14 -11.6 StLgCpGrZ 11.58 -0.06 -6.8 ValRestrZ 41.67 -0.26 -16.8 DFA 1YrFixInI 10.34 +0.6 2YrGlbFII 10.22 +0.8 5YrGlbFII 11.19 -0.03 +4.0 EmMkCrEqI 16.66 -0.05 -23.9 EmMktValI 25.48 -0.10 -28.6 IntSmCapI 13.17 -0.08 -22.3 USCorEq2I 9.71 -0.05 -10.7 USLgValI 17.58 -0.04 -11.7 USSmValI 21.08 -0.26 -17.3 USSmallI 18.54 -0.23 -12.8 DWS-Scudder GrIncS 15.01 -0.07 -7.3 Davis NYVentA m 30.33 -0.11 -11.7 NYVentY 30.72 -0.10 -11.4 Delaware Invest DiverIncA m 9.31 -0.04 +5.0 Dimensional Investme IntCorEqI 8.73 -0.05 -20.7 IntlSCoI 13.57 -0.09 -19.7 IntlValuI 13.82 -0.06 -22.8 Dodge & Cox Bal 63.07 -0.23 -8.6 Income 13.25 -0.03 +3.3 IntlStk 27.85 -0.23 -22.0 Stock 92.90 -0.38 -12.7 Dreyfus Apprecia 37.82 -0.15 -1.0 Eaton Vance LrgCpValA m 15.74 -0.02 -12.8 FMI LgCap 14.35 -0.03 -5.3 FPA Cres d 26.07 -0.06 -1.8 NewInc m 10.74 +2.1 Fairholme Funds Fairhome d 23.15 +0.01 -34.9 Federated ToRetIs 11.28 -0.03 +5.0 Fidelity AstMgr50 14.48 -0.05 -4.8 Bal 17.38 -0.06 -3.4 BlChGrow 39.90 -0.30 -8.6 Canada d 47.62 -0.49 -18.1 CapApr 22.88 -0.08 -9.7 CapInc d 8.54 -0.01 -4.8 Contra 63.73 -0.31 -5.8 DiscEq 20.04 -0.10 -11.1 DivGrow 23.83 -0.11 -15.9 DivrIntl d 24.59 -0.16 -18.4 EqInc 37.87 -0.06 -13.2 EqInc II 15.88 -0.03 -11.8 FF2015 10.84 -0.03 -4.1 FF2035 10.28 -0.05 -10.0 FF2040 7.17 -0.03 -10.1 Fidelity 29.16 -0.16 -9.1 FltRtHiIn d 9.61 +0.7 Free2010 13.00 -0.04 -4.0 Free2020 12.97 -0.05 -5.6 Free2025 10.63 -0.04 -7.4 Free2030 12.60 -0.05 -8.1 GNMA 11.84 -0.01 +7.0 GovtInc 10.85 -0.03 +7.2 GrowCo 78.96 -0.58 -5.0 GrowInc 16.64 -0.05 -8.0 HiInc d 8.45 -0.01 -0.1 IntBond 10.82 -0.02 +5.3 IntMuniInc d 10.33 +6.4 IntlDisc d 26.39 -0.14 -20.1 InvGrdBd 7.66 -0.02 +6.7 LatinAm d 46.27 -0.57 -21.6 LowPriStk d 33.51 -0.17 -6.6 Magellan 58.67 -0.32 -18.0 MidCap d 24.93 -0.15 -9.1 MuniInc d 12.87 +8.8 NewMktIn d 15.75 -0.01 +5.7 OTC 51.89 -0.49 -5.5 Puritan 16.88 -0.05 -4.5 Series100Idx 8.22 -0.02 -5.9 ShTmBond 8.48 +1.5 StratInc 10.91 -0.04 +2.6 Tel&Util 16.02 +0.03 +2.6 TotalBd 10.88 -0.03 +6.0 USBdIdxInv 11.72 -0.04 +6.7 Value 58.90 -0.14 -14.3 Fidelity Advisor NewInsA m 18.63 -0.10 -6.5 NewInsI 18.85 -0.10 -6.3 StratIncA m 12.20 -0.04 +2.5 Fidelity Select Gold d 45.00 -0.54 -11.9 Fidelity Spartan 500IdxAdvtg 41.14 -0.11 -6.2 500IdxInstl 41.14 -0.11 NA 500IdxInv 41.14 -0.10 -6.2 ExtMktIdI d 33.28 -0.21 -11.7 IntlIdxIn d 28.73 -0.13 -18.0 TotMktIdAg d 33.72 -0.11 -7.2 TotMktIdI d 33.71 -0.11 -7.2 First Eagle GlbA m 43.96 -0.30 -5.2 OverseasA m20.70 -0.26 -8.6 FrankTemp-Frank Fed TF A m 12.02 +10.2 FrankTemp-Franklin CA TF A m 7.02 +9.0
HY TF A m 10.15 +10.4 Income A m 1.99 -3.2 Income C m 2.01 -3.7 IncomeAdv 1.98 -3.1 NY TF A m 11.73 +0.01 +8.6 RisDv A m 32.44 -0.04 -1.2 US Gov A m 6.90 +5.9 FrankTemp-Mutual Discov A m 25.74 -9.6 Discov Z 26.13 +0.01 -9.3 Shares A m 18.63 -8.9 Shares Z 18.82 -8.7 FrankTemp-Templeton Fgn A m 5.74 -0.02 -17.8 GlBond A m 12.41 -0.08 -4.9 GlBond C m 12.43 -0.09 -5.3 GlBondAdv 12.37 -0.09 -4.8 Growth A m 15.43 -0.05 -13.3 World A m 13.02 -0.06 -12.3 Franklin Templeton FndAllA m 9.43 -0.01 -8.5 GMO EmgMktsVI 10.84 -0.08 -19.9 IntItVlIV 17.87 -0.11 -16.5 QuIII 20.51 -0.09 +3.6 QuVI 20.52 -0.09 +3.7 Goldman Sachs HiYieldIs d 6.73 -0.01 -1.2 Harbor Bond 12.03 -0.04 +1.3 CapApInst 35.09 -0.20 -4.4 IntlInstl d 49.93 -0.21 -17.5 Hartford CapAprA m 26.96 -0.13 -22.1 CpApHLSIA 34.70 -0.17 -18.1 DvGrHLSIA 17.91 -0.04 -8.1 Hussman StratGrth d 12.94 -0.03 +5.3 INVESCO CharterA m 15.24 -0.05 -5.8 ComstockA m13.89 -0.02 -10.8 EqIncomeA m 7.79 -0.01 -8.1 GrowIncA m 16.94 -0.01 -11.1 Ivy AssetStrA m 21.73 -0.11 -11.0 AssetStrC m 20.98 -0.11 -11.6 JPMorgan CoreBondA m11.85 -0.03 +6.4 CoreBondSelect11.84 -0.03 +6.6 HighYldSel 7.63 -0.6 ShDurBndSel 10.98 +1.5 USLCpCrPS 18.57 -0.06 -10.2 Janus GlbLfScT d 22.87 -0.17 -1.6 OverseasT d 32.70 +0.03 -35.4 PerkinsMCVT20.72 -0.03 -8.2 John Hancock LifBa1 b 11.90 -0.04 -6.6 LifGr1 b 11.53 -0.04 -10.2 Lazard EmgMkEqtI d17.19 -0.03 -20.7 Legg Mason/Western CrPlBdIns 11.00 -0.04 +5.3 Longleaf Partners LongPart 24.53 -0.09 -11.0 Loomis Sayles BondI 13.70 -0.08 +0.8 BondR b 13.65 -0.08 +0.5 Lord Abbett AffiliatA m 9.64 -0.01 -16.0 BondDebA m 7.45 -0.01 +0.8 ShDurIncA m 4.52 +2.3 ShDurIncC m 4.55 +1.6 MFS TotRetA m 13.42 -0.02 -3.0 ValueA m 20.82 -0.01 -7.7 ValueI 20.92 -0.01 -7.5 Manning & Napier WrldOppA 6.83 -0.03 -20.2 Matthews Asian China d 23.12 -0.08 -21.3 India d 14.64 +0.19 -31.9 Merger Merger m 15.89 +0.01 +0.7 Metropolitan West TotRetBdI 10.38 -0.03 +4.3 TotRtBd b 10.38 -0.03 +4.0 Morgan Stanley Instl MdCpGrI 33.66 -0.15 -9.9 Natixis InvBndY 11.98 -0.06 +3.0 StratIncA m 14.03 -0.08 -0.3 StratIncC m 14.11 -0.08 -1.0 Neuberger Berman GenesisIs 44.94 -0.30 -2.2 Northern HYFixInc d 6.88 +0.6 Oakmark EqIncI 26.46 -0.06 -4.6 Intl I d 15.44 -0.05 -20.5 Oakmark I 39.01 -0.07 -5.5 Oberweis ChinaOpp m 10.38 +0.01 -37.6 Old Westbury GlbSmMdCp 13.14 -0.04 -13.4 Oppenheimer DevMktA m 28.84 -0.14 -20.9 DevMktY 28.61 -0.14 -20.7 GlobA m 51.71 -0.32 -14.3 IntlBondA m 6.19 -0.05 -2.4 IntlBondY 6.19 -0.05 -2.1 MainStrA m 29.54 -0.13 -8.8 RocMuniA m 15.78 +9.6 RochNtlMu m 6.79 +9.8 StrIncA m 4.01 -0.02 -1.2 PIMCO AllAssetI 11.69 -0.7 AllAuthIn 10.22 -0.06 -0.5 ComRlRStI 7.56 -0.06 -7.5 DivIncInst 11.11 -0.04 +2.0 EMktCurI 9.83 -0.07 -5.9 HiYldIs 8.75 -0.02 +0.5 InvGrdIns 10.48 -0.06 +4.7 LowDrIs 10.25 -0.01 +0.6 RERRStgC m 4.19 -0.01+10.6 RealRet 12.17 -0.06+10.9 RealRtnA m 12.17 -0.06+10.5 ShtTermIs 9.75 TotRetA m 10.73 -0.04 +1.5 TotRetAdm b 10.73 -0.04 +1.6 TotRetC m 10.73 -0.04 +0.8 TotRetIs 10.73 -0.04 +1.9 TotRetrnD b 10.73 -0.04 +1.6 TotlRetnP 10.73 -0.04 +1.8 Permanent Portfolio 46.43 -0.27 +1.4 Pioneer PioneerA m 36.09 -0.08 -11.2 Putnam GrowIncA m 11.64 -0.02 -13.3 NewOpp 47.13 -0.22 -10.9 Royce PAMutInv d 10.26 -0.08 -11.9 PremierInv d 18.89 -0.13 -7.2 Schwab 1000Inv d 34.65 -0.09 -6.8 S&P500Sel d18.37 -0.05 -6.1 Scout Interntl d 26.42 -0.28 -18.0 Sequoia Sequoia 136.31 +0.18 +6.0 T Rowe Price BlChpGr 36.27 -0.24 -4.9 CapApprec 19.88 -0.03 -2.1 EmMktStk d 27.58 -0.15 -21.8 EqIndex d 31.31 -0.08 -6.3 EqtyInc 21.23 -0.02 -9.1 GrowStk 29.82 -0.20 -7.2 HiYield d 6.30 -0.01 -0.6 IntlBnd d 9.80 -0.10 +0.8 IntlGrInc d 11.02 -0.06 -17.2 IntlStk d 11.85 -0.05 -16.7 LatinAm d 40.23 -0.57 -29.1 MidCapVa 20.95 -0.02 -11.6 MidCpGr 54.21 -0.22 -7.4
November car sales After automakers had their best October in four years, economists said sales would be strong through the end of the year. We’ll get November sales figures on Thursday. Car and truck sales contributed to a big rise in overall retail sales during October. So it’s clear that consumers, while they’re uneasy about the economy, are willing to spend to replace aging vehicles. SUVs and pickup trucks were among October’s best sellers.
NewAsia d 16.33 -0.05 -14.9 NewEra
41.78 -0.36 -19.9
NewHoriz
32.99 -0.26 -1.5
NewIncome OrseaStk d
9.65 -0.03 +4.9 6.98 -0.05 -16.3
R2015
11.25 -0.04 -5.4
R2025
11.10 -0.05 -7.8
R2035
11.07 -0.05 -9.5
Rtmt2010
14.72 -0.06 -4.0
Rtmt2020
15.34 -0.06 -6.7
Rtmt2030
15.77 -0.07 -8.7
Rtmt2040
15.71 -0.07 -9.8
ShTmBond SmCpStk
4.81
+1.2
31.21 -0.34 -9.4
SmCpVal d 32.37 -0.38 -10.4 SpecInc
12.05 -0.04 +1.2
Value 20.96 -0.03 -10.2 Templeton InFEqSeS 16.69 -0.08 -16.5 Thornburg IntlValA m
22.85 -0.25 -17.7
IntlValI d 23.36 -0.26 -17.4 Tweedy Browne GlobVal d Vanguard
21.23 -0.06 -10.9
500Adml
107.08 -0.27 -6.2
500Inv
107.06 -0.27 -6.3
AssetA
22.94 -0.08 -5.6
BalIdxAdm
20.77 -0.06 -1.2
BalIdxIns
20.77 -0.06 -1.2
CAITAdml
11.19
+8.1
CapOpAdml d67.12 -0.46 -12.6 DivGr
14.33 -0.03 +0.7
EmMktIAdm d30.93 -0.16 -22.4 EnergyAdm d110.41 -1.07 -8.7 EnergyInv d 58.77 -0.58 -8.8 Explr
65.52 -0.61 -10.1
ExtdIdAdm
36.47 -0.25 -11.6
ExtdIdIst
36.47 -0.25 -11.6
FAWeUSIns d75.45 -0.51 -19.6 GNMA
11.13 -0.01 +6.7
GNMAAdml 11.13 -0.01 +6.8 GrthIdAdm
29.88 -0.11 -4.6
GrthIstId
29.87 -0.12 -4.6
HYCor d
5.55 -0.01 +3.8
HYCorAdml d 5.55 -0.01 +3.9 HltCrAdml d 52.42 -0.33 +2.3 HlthCare d 124.18 -0.79 +2.2 ITBondAdm 11.80 -0.06 +9.3 ITGradeAd
10.01 -0.04 +6.0
ITIGrade
10.01 -0.04 +5.9
ITrsyAdml
12.11 -0.04 +9.1
InfPrtAdm
28.09 -0.11+13.0
InfPrtI
11.44 -0.05+13.1
InflaPro
14.30 -0.06+12.9
InstIdxI
106.37 -0.27 -6.2
InstPlus
106.37 -0.28 -6.1
InstTStPl
26.17 -0.09 -7.1
IntlGr d
15.66 -0.11 -19.0
IntlGrAdm d 49.86 -0.37 -19.0 IntlStkIdxAdm d21.14-0.14 -19.8 IntlStkIdxI d 84.58 -0.59 -19.8 IntlStkIdxIPls d84.60 -0.59 -19.7 IntlVal d
25.81 -0.15 -19.7
LTGradeAd 10.25 -0.12+15.3 LTInvGr
10.25 -0.12+15.2
LifeCon
15.82 -0.05 -1.9
LifeGro
20.09 -0.08 -8.4
LifeMod
18.51 -0.07 -4.6
MidCp
18.46 -0.03 -9.1
MidCpAdml 83.90 -0.13 -9.0 MidCpIst
18.54 -0.03 -8.9
Morg
16.56 -0.09 -8.2
MuHYAdml 10.57
+9.1
MuInt
13.81
+7.5
MuIntAdml
13.81
+7.6
MuLTAdml
11.17
+8.8
MuLtdAdml 11.10
+3.0
MuShtAdml 15.90
+1.4
PrecMtls d 21.04 -0.33 -21.2 Prmcp d
60.22 -0.42 -8.5
PrmcpAdml d62.53 -0.43 -8.4 PrmcpCorI d 12.66 -0.06 -8.1 REITIdxAd d 74.13 +0.31 -3.1 STBond
10.64 -0.01 +2.6
STBondAdm 10.64 -0.01 +2.7 STBondSgl 10.64 -0.01 +2.7 STCor
10.62 -0.01 +1.5
STGradeAd 10.62 -0.01 +1.6 STsryAdml
10.82 -0.01 +2.0
SelValu d
17.47 -0.02 -6.9
SmCapIdx
30.66 -0.29 -11.8
SmCpIdAdm 30.72 -0.29 -11.7 SmCpIdIst
30.73 -0.28 -11.6
SmGthIdx
19.69 -0.22 -10.2
SmValIdx
13.86 -0.10 -13.4
Star
18.13 -0.08 -4.1
TgtRe2010
22.18 -0.08 -0.6
TgtRe2015
12.04 -0.05 -3.1
TgtRe2020
21.07 -0.08 -4.7
TgtRe2030
20.07 -0.08 -7.4
TgtRe2035
11.93 -0.05 -8.9
TgtRe2040
19.51 -0.09 -9.3
TgtRe2045
12.26 -0.05 -9.2
TgtRetInc
11.35 -0.04 +2.4
Tgtet2025
11.85 -0.05 -6.1
TotBdAdml
10.99 -0.04 +6.8
TotBdInst
10.99 -0.04 +6.8
TotBdMkInv 10.99 -0.04 +6.7 TotBdMkSig 10.99 -0.04 +6.8 TotIntl d
12.63 -0.09 -19.9
TotStIAdm
28.92 -0.10 -7.1
TotStIIns
28.93 -0.09 -7.1
TotStISig
27.92 -0.09 -7.1
TotStIdx
28.91 -0.10 -7.2
WellsI
22.09 -0.08 +4.6
WellsIAdm
53.52 -0.19 +4.7
Welltn
29.56 -0.10 -2.9
WelltnAdm
51.07 -0.17 -2.8
WndsIIAdm 42.37 -0.08 -6.0 Wndsr
11.81 -0.04 -12.0
WndsrAdml 39.86 -0.13 -11.9 WndsrII 23.87 -0.04 -6.0 Waddell & Reed Adv AccumA m
6.91 -0.03 -7.7
SciTechA m 9.04 -0.09 -13.0 Yacktman Focused d 17.73 -0.02 +0.3 Yacktman d 16.52 -0.03 -0.1