

TAG INDUSTRIAL WATCH


TABLE OF CONTENTS
SECTION I
PAGES 1-3: WHAT’S WRONG WITH RATES
SECTION II
PAGES 4-6: STATE OF THE INDUSTRIAL MARKET
SECTION III TIME IS OF
PAGES 7-11: REGIONAL MARKETS & OPPORTUNITIES
THE ESSENCE
Just as TAG Industrial anticipated, the long-awaited interest rate cuts on bankto-bank loans by the Federal Reserve did not reduce commercial real estate mortgage rates. America’s growing debt which TAG has closely researched and analyzed in recent years has become the roadblock preventing interest rates throughout the economy from falling. With demand and sales activity already at the lowest levels in over a decade, unforeseen higher interest rates will only add more pressure on the industrial market. Most industrial analysts remain optimistic about a rebound in 2025 predicated on lower rates and the reelection of Donald Trump. While the new administration hopes to increase manufacturing through an increase in tariffs (which would boost demand for industrial real estate), it’s important to review the current economic and market fundamentals to see the full picture. The good news is that there are ample opportunities to acquire specialized and small industrial assets that are poised to outperform the overall commercial real estate market this decade. However, time is of the essence for investors waiting on the sidelines to take advantage of the current lending environment before potential changes in market conditions.
WHAT’S WRONG WITH RATES
“Industrial investors sitting on the sidelines waiting for lower rates should consider that rates may not be significantly lower in the future and potentially even higher.”
TAG Industrial Watch Email, May 18, 2024
Source: FRED
Going into 2024, the financial community expected a steady decline in the Consumer Price Index (CPI), paving the way for the Federal Reserve to end its war against inflation and cut interest rates. The CPI would indeed slow down to a three-year low of 2.4 percent by September. With bond investors on Wall Street anticipating rate cuts, the 10-year Treasury rate fell from a monthly average of 4.5 percent in April to 3.7 percent on the day the Fed cut its benchmark rate on overnight bank-to-bank loans (Federal Funds Rate) by 50 basis points in September. In a classic “buy the rumor, sell the news” move, Treasuries sold off and rates responded with a bounce but unexpectedly continued to ascend and remain elevated even after another 25-basis-point rate cut by the Fed in November following the presidential election. By the end of November, when this publication was being written, the rate on the 10-year Treasury averaged about 4.4 percent, representing a 70-basis-point move in the wrong direction. The impact on industrial real estate loans was equally pronounced with the average mortgage rate jumping 70 basis points to 6.8 percent in November (Select Commercial Funding). While higher rates were the last thing most investors anticipated, such an occurrence was predictable based on recent history and the fundamentals of supply and demand as highlighted in previous TAG marketing materials.
CROWDING OUT EFFECT
A year before the Housing Crisis swept through the nation in 2008, the Fed began aggressively slashing interest rates (summer of 2007) in a failed attempt to stave off a recession. Residential mortgage rates initially pulled back 90 basis points but reversed course the following year starting in February through August, jumping 70 basis points before sliding during the second half of the year. This occurred even as the Fed effectively cut its benchmark rate by 330 basis points from the summer of 2007 to the summer of 2008 as rising delinquent mortgage rates prevented banks from fully passing on lower rates to borrowers (FRED, Federal Funds). History has repeated itself but the circumstances are different.
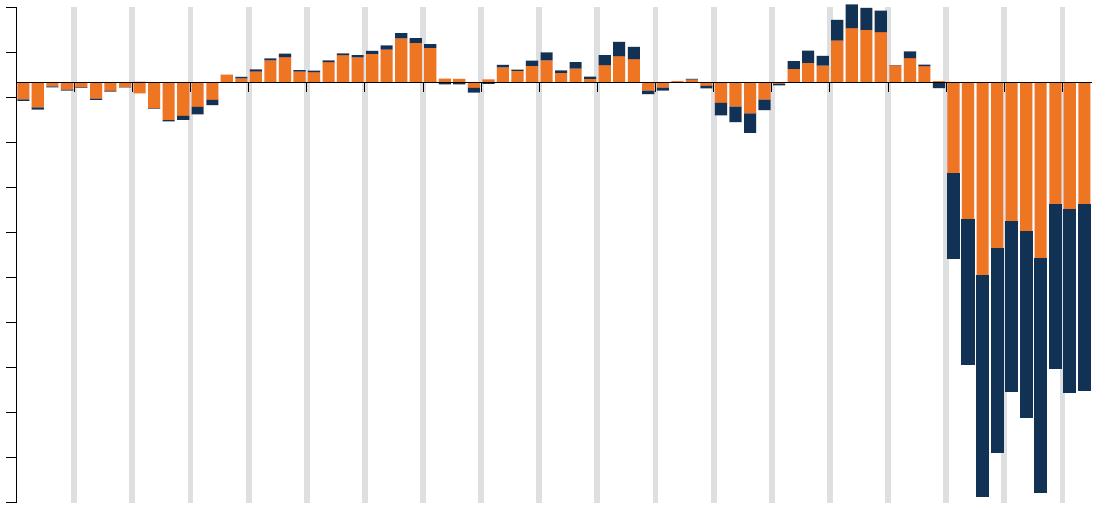
CHANGE IN PUBLIC HOLDINGS OF U.S. TREASURIES (Q2 2022 - Q2 2024)
Source: SIFMA
From the start of the Great Recession up until three years ago, the Federal Reserve served as the largest lender to the U.S. government, followed by foreign governments and investors. However, the outburst in inflation has since prompted the Fed to effectively become the largest seller of Treasuries as the nation’s monetary authority allowed nearly $1.6 trillion of U.S. debt to mature (reducing the money supply) from mid-2022 through mid-2024.
Still flush with cash from stimulus payments financed by the Fed during the pandemic, individual investors and the mutual funds they invest in have stepped up to the plate in the Fed’s absence. In the same two-year stretch, the newest top two lenders to Washington, D.C. accumulated just over $3 trillion worth of Treasuries as the national debt topped $36 trillion by the end of 2024. Unfortunately, their lending ability is not unlimited. For example, the capital used by mutual funds to purchase Treasuries primarily came from a form of bank account held at the Fed. Known as the Reverse Repo Facility, this bank account held as much as $2.6 trillion at the end of 2022 (92 percent of which was owned by mutual funds). By the beginning of December, when this publication was being finalized, the Reverse Repo Facility held less than $150 billion (FRED, Overnight Reverse).
America’s $2.5 trillion budget deficits are usurping a significant amount of capital in the financial system, leaving less capital for private industry, an economic phenomenon known as “crowding out.” Simply put, without the Fed inflating the money supply in order to lend to the U.S. government, there is too much borrowing and not enough lending, which means that interest rates fundamentally have to rise to encourage more lending. In the 2023 to 2024 fiscal year, government revenues rebounded 7.7 percent but in the first month of the new fiscal year, revenues dropped 19.0 percent annually as the labor market weakened (Treasury, Monthly Statement). The initial reports of the headline job numbers (that originate from the Business Survey) have been mostly positive over the last two years but also have been significantly revised lower in subsequent reports.
The Household Survey, which is free of the government estimations included in the Business Survey, gives a better indication of the health of the labor market. Year-over-year in November, there were -693,000 fewer people employed in total, which essentially means that any jobs created in the previous year went to those already employed. Also, the number of full-time employees dropped by -1.27 million, both indicative of a recession (FRED, Employment Level, Full Time). Fewer people working full-time jobs or not working at all equals less income taxes collected by the government, which only deepens the budget deficit and exacerbates the crowding-out effect.
INTEREST ON NATIONAL DEBT
Source: U.S. Treasury Dept.
Compounding the crowding-out effect are the skyrocketing interest payments on the national debt. When rates on U.S. Treasuries were low, net interest payments on the national debt stood at $345 billion for the fiscal year that concluded in Q3 2020. However, with Treasury rates touching 15-year highs, net interest payments leaped to $882 billion in the recent fiscal year, consuming 17.9 percent of total government revenues. At the current pace, net interest payments will blow past $1 trillion this fiscal year, consuming more than onefifth of all federal receipts. Given that the Fed’s recent rate cuts were ineffective in lowering borrowing costs and the central bank is concerned about inflation reaccelerating with the help of bigger rate cuts, the economy could be on a path toward a spike in interest rates (akin to the 2019 Repo Crisis) that could ignite a credit crunch in an already stressed banking system.
*Through September
COMMERCIAL LOAN EXTENSIONS
COMMERCIAL REAL ESTATE MORTGAGE DEBT HELD BY COMMERCIAL BANKS
Source: FRED
Of the $4.7 trillion in outstanding commercial real estate debt accumulated by 2024, 64 percent of the loans were held by commercial banks. The record $3.0 trillion worth of commercial real estate debt held by banks is double the level seen at the start of the Great Recession. While today’s banking industry in America is dominated by a handful of large institutions, two-thirds of CRE loans issued by banks are actually held by small and regional depositories that borrow from large institutions to support their lending activity (White, 2023). As indicative of their share of construction and deliveries, most of the new CRE debt has been concentrated in multifamily and industrial loans. When interest rates were low, CRE mortgages held by banks could be traded at a profit but with rates near 15-year highs, many of those mortgages have lost value, creating unrealized losses on the books for banks. The higher interest rates climb, the bigger these unrealized losses may become.
UNREALIZED GAINS (LOSSES) ON INVESTMENT SECURITIES
Source: FDIC.
As of Q2 2024, total bank loans (including credit cards, auto loans, residential mortgages, business loans, etc.) were officially underwater to the tune of $512.9 billion. Without a significant decline in rates, CRE borrowers who are unable to repay or profitably refinance their loans will face foreclosure if they cannot sell their properties at breakeven. To prevent experiencing realized losses, banks and other lenders have extended maturity dates on CRE debt, a loan modification that has come to be known as “extend and pretend.” Last year, $929 billion in CRE debt was set to mature, up from $729 billion in 2023 (Peters, 2024). Among all industrial loans, 27 percent were due in 2024, surpassing the office sector at 25 percent, retail at 17 percent, and multi-family at 12 percent (Taylor, 2024). If banks encounter a spike in interest rates or large deposit withdrawals like the kind that ignited the Regional Bank Crisis in March 2023, extend and pretend could quickly come to an end. If unrealized losses become realized, business and investment capital made to industrial owner-users and investors could quickly dry up at a time when the industrial market is already in recession.
STATE OF THE INDUSTRIAL MARKET
NATIONAL INDUSTRIAL MARKET
Millions of Square Feet
Source: CoStar
Two years ago, the narrative in industrial real estate was that the market was normalizing after a couple of years of unprecedented growth during the pandemic. In 2024, the narrative changed tune, acknowledging a significant decline in market conditions but forecasting a rebound in 2025. Unfortunately, based on all the key metrics, the industrial market probably has not reached the bottom yet. Just like the value of a diamond is based on the “four Cs” (cut, color, clarity, and carat), the health of the industrial real estate market is based on five metrics: net absorption, net deliveries, under construction, vacancy rate, and rent growth. Examining industrial properties (classes A, B, and C) of at least 10,000 square feet across the top 50 metros in the U.S. gives a good indication of the state of the national industrial market. Through the first 11 months of 2024, industrial demand or net absorption (amount of square feet moved into versus vacated) in the U.S. amounted to 93.5 million square feet. With net absorption flatlining in Q4, demand for the year was on pace for the lowest level since 2010. The -51.0 percent drop in demand in 2024, preceded by a -58.3 percent decline the year before, also debunks the narrative that the industrial market is generally plagued by a supply problem.
Known as net deliveries (amount of space constructed less demolished), supply in the top 50 metros continued to diminish in 2024 falling by roughly 341.8 million square feet through November. Although supply year-to-date was 36.0 percent lower than the 534.1 millionsquare-foot record set in 2023, levels were still higher than any year prior to the pandemic. More importantly, for every industrial square foot demanded by the market in 2024, about 3.7 square feet were supplied, representing the biggest gap between supply and demand on record. With demand coming to a halt and supply levels still elevated, vacancy rates (amount of vacant space as a share of the total inventory) touched a 10-year high at 7.0 percent in late 2024, up 130 basis points annually.
Due to a rise in industrial vacancies and a slowing economy, annual rent growth (the change in year-over-year asking rents) quickly decelerated by 490 basis points by late 2024 to 2.5 percent. The slowest pace of rent growth since 2012 inched up the average asking rent to $11.60 per square foot nationwide. Looking forward to the future, there were 329.8 million square feet of industrial space in the pipeline (under construction) during Q4. Given that demand is quickly trending into negative territory, the problem of excess supply will likely continue, putting more upward pressure on vacancies and downward pressure on rents. As TAG has documented closely over the last two years, the problems in industrial real estate are not equally distributed, revealing new opportunities that are now growing in popularity.
SMALL-INDUSTRIAL
NATIONAL SMALL INDUSTRIAL MARKET
Absorption Under Construction Net Deliveries Vacancy Rate Rent Growth
Source: CoStar
Previously overshadowed by their big-box counterpart, investments in small industrial properties have started to routinely make headlines as these properties continue to outperform the overall industrial market, despite the recent contraction in demand. After contracting by -13.8 million square feet in 2023, net absorption among properties between 10,000 and 50,000 square feet fell deeper into negative territory last year, losing another -17.0 million square feet through November. The back-to-back contraction in demand is the first time recorded since CoStar began full-market coverage in 2007. Though small industrial has not been impacted by overbuilding to the degree of big-box, new supply expanded the inventory by at least 13.6 million square feet last year. However, vacancy rates only increased by 60 basis points in the year to 4.2 percent, which is less than half of big-box vacancies. Regardless of vacancies among small industrial properties remaining low, rent growth decelerated by 400 basis points during the first 11 months of 2024 to 2.1 percent, nearly matching the level last seen in 2012. Annually, the pipeline receded by 17.5 percent to 13.7 million square feet in Q4, indicating modest supply pressures on vacancies and rents in 2025.
MIDSIZE
NATIONAL MIDSIZE INDUSTRIAL MARKET
Net Absorption Under Construction Net Deliveries Vacancy Rate Rent Growth
Source: CoStar
Demand for midsize industrial properties between 50,000 and 200,000 square feet essentially plateaued in 2024, absorbing about 1.1 million square feet on net through November. With net absorption trending well into negative territory during Q4, 2024 will likely mark the lowest level of annual demand since the depths of the Great Recession in 2009. Midsize properties followed a record supply year in 2023 with a sizeable 85.9 million square feet in 2024, down 22.1 percent annually. The result of low demand and high supply lifted the vacancy rate 130 basis points on the year to 6.8 percent, touching a 10-year high. Not surprisingly, annual rent growth slowed by 520 basis points to 2.5 percent by November, nearly matching the lowest level since 2012. With 79.0 million square feet of midsize properties under construction, vacancies and rents will likely continue to move in the wrong direction as demand looks to dip into negative territory in 2025.
BIG-BOX
The overbuilding in the big-box sector that TAG was among the first to observe two years ago continued in 2024. Warehouses over 200,000 square feet welcomed another 242.9 million square feet to the inventory in the first 11 months of 2024, representing a massive 39.8 percent annual decline. Despite the pullback from developers, supply far outpaced demand that slipped to 111.2 million square feet, down 40.5 percent on the year. Given that the demand for small industrial contracted and was essentially unchanged for midsize, virtually all of the demand for industrial space in 2024 was due to big-box. During Q4, big-box demand remained in positive territory but was on the weakest quarterly pace since Q1 2012. Positive demand did not prevent the vacancy rate from rising by 160 basis points to 8.9 percent. The biggest increase in vacancies out of the three property sizes left big-box at the highest level since 2010. In turn, rent growth decelerated by 520 basis points to 3.1 percent, representing the slowest pace since 2012. While big-box was the industrial market’s poster child for more than a decade, these properties are now underperforming small industrial and midsize.
SALES ACTIVITY
INDUSTRIAL SALES VS. PRICE
Although the industrial market’s key metrics deteriorated in 2024, investment sentiment remained largely positive while the office sector captured the bulk of negative headlines. Nonetheless, the impact of interest rates alone on sales activity was again noticeable. With 11 months in the book, sale transactions stood at about 8,200 across the top 50 metros. Without a December pickup, annual sales would decline further, matching 2023 for the lowest level since 2011. Sales activity may be at 13-year lows but sale prices continued to defy fundamentals and reset the record books. The median sales price per square foot gained 8.6 percent through Q4 to an estimated $126. While sellers had to contend with market cap rates rising by 30 basis points to average 7.6 percent, the slight increase in asking rents helped sale prices to ascend higher. However, rent growth is poised to decline next year for the first time since 2010, putting downward pressure on the underlying value of industrial properties.
If financial conditions tighten, banks will likely begin to account for the performance of the industrial market and the overall economy when issuing loans. Whether you are an owner-user considering a sale-leaseback to generate business capital, pay off debt, or finance retirement, or you are a leveraged investor interested in how to prepare for this new economic climate, the time is now to take action. The following section provides market updates for each major metro area TAG operates within and recent sales/listings that exemplify the type of properties and locations that are currently and likely to continue outperforming the overall industrial market in the years to come.
Source: CoStar
Source: CoStar
REGIONAL MARKETS & OPPORTUNITIES
Classes A, B, & C.
Minimum 10,000 SF
TEXAS VACANCIES
Source: CoStar
Classes A, B, & C.
Dallas-Fort Worth
Minimum 10,000 SF
Houston
San Antonio/Austin
TEXAS RENT GROWTH
Midland/Odessa Laredo
*Through November
Dallas-Fort Worth
Source: CoStar
TEXAS MARKETS
DALLAS-FORT WORTH
Houston
San Antonio/Austin
Midland/Odessa Laredo
*Through November
With 20.1 million square feet of net absorption through November, demand in Dallas-Fort Worth was down 42.6 percent from the annual total in 2023. While demand was on pace for the lowest level in 10 years, it remained in earshot of the years leading up to the pandemic that ranged from 22 to 26 million square feet. The fastest-growing market in the U.S. continued to experience overbuilding in 2024 with net deliveries doubling net absorption with the addition of 40.4 million square feet. Consequently, the vacancy rate rose 160 basis points to 9.9 percent, representing the most availability since 2010. Rent growth remained higher than the CPI yet decelerated 350 basis points to a 10-year low of 4.9 percent. Looking forward, under-construction space was reduced by roughly half to 22.6 million square feet as developers and lenders began to respond to market conditions. Even with the reduction in the pipeline, 94.8 percent of the space under construction is still concentrated among midsize and big-box warehouses, creating opportunities for small industrial properties that are in relatively short supply.
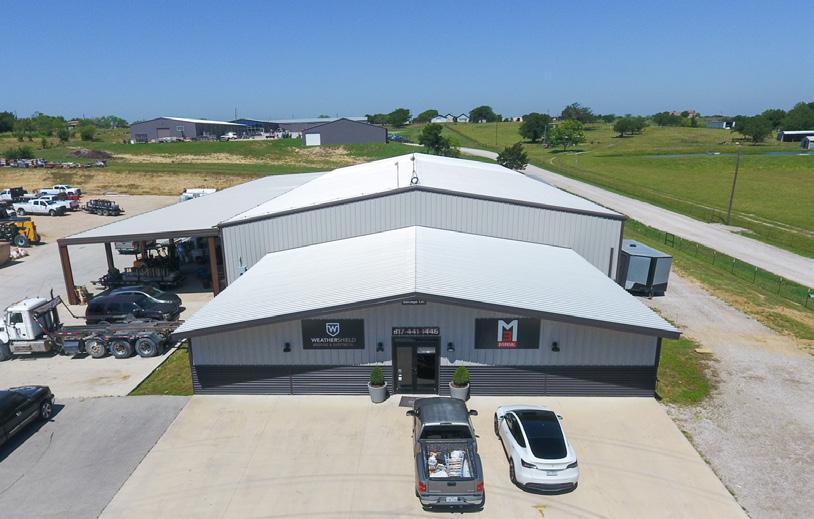
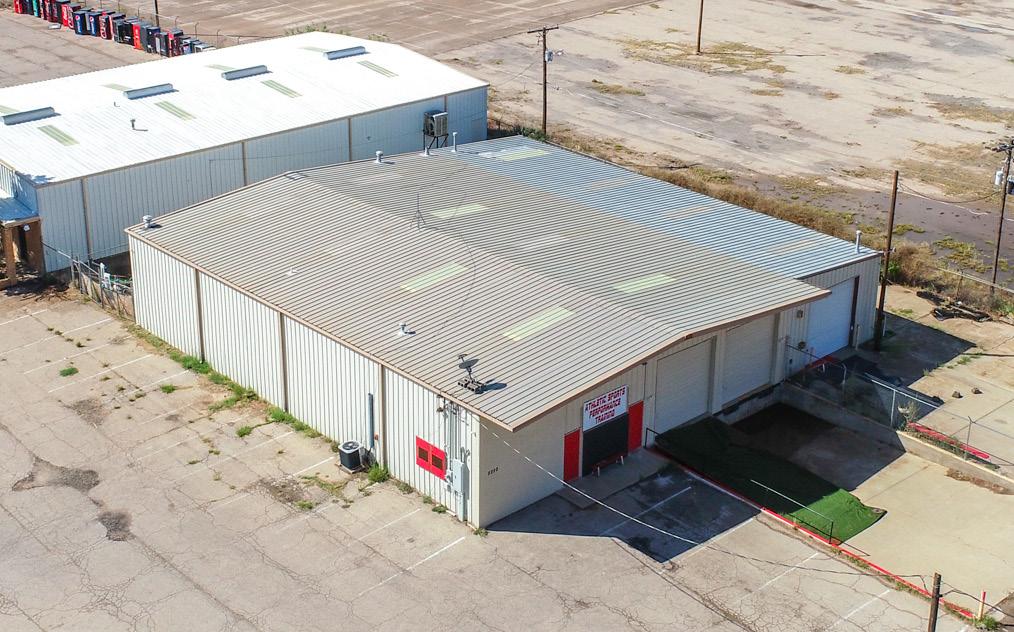
CASE STUDY & OPPORTUNITIES
In September of 2024, TAG closed on a 19,000-square-foot multi-tenant manufacturing facility located just west of Fort Worth in Aledo with 3.3 acres of industrial outdoor storage space and eight grade-level doors. Anchored by roofing manufacturer WeatherShield Roofing & Sheetmetal, the property features high-cost tenant improvements and the lease contains attractive 3.0 percent rent escalations. As a specialized small facility, the landlord is in a better position to aggressively raise rents to keep pace with the CPI when the lease expires in 2027, with little fear of losing the tenant. Furthermore, the tenant will continue to benefit from the great migration into Texas, which could heighten if high inflation hampers economic growth in most states but supports the Lone Star state thanks to higher oil prices.
HOUSTON
Compared to 2023, industrial demand in metro Houston was down 14.1 percent through November to 17.6 million square feet. On the flip side, net absorption surpassed every year on record before 2021 as average oil prices were stagnant but held up. Due to a 47.2 percent decline in new supply to 18.9 million square feet, the vacancy rate was able to stabilize at 6.9 percent. Despite no increase in availability, rent growth slowed 320 basis points from a record-high level down to 1.7 percent. At the close of 2024, there were 13.3 million square feet of industrial space under construction in Houston. Given that the pipeline trailed annual demand by about 4.3 million square feet, vacancy rates may recede in 2025, especially if oil prices experience a significant rebound.
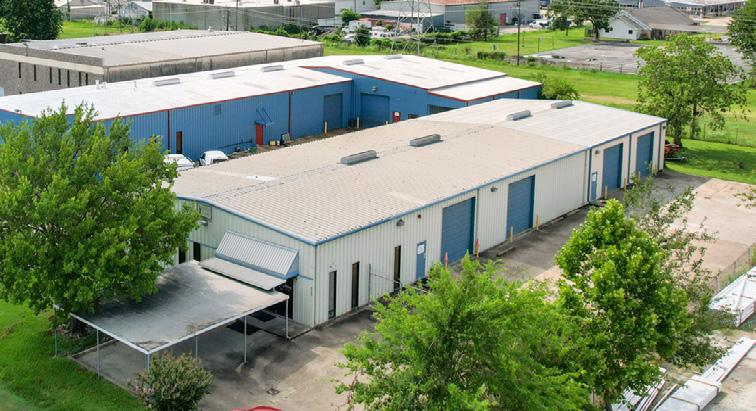
CASE STUDY & OPPORTUNITIES
TAG Industrial successfully sold a 7,500-square-foot single-tenant flex asset in northwest Houston in October 2024. Featuring four grade-level doors, the property is occupied by Texas Access Controls on a triple-net lease through December 2028. Traded at a competitive cap rate of 7.4 percent, the highlight of this deal was the above-market 5.0 percent annual rent escalations. Such an escalation is rarely available to investors in the industrial market but if inflation reignites, the new landlord will be able to market the asset as an inflation hedge, helping to maintain and even enhance the property’s underlying value.
SAN ANTONIO/AUSTIN
Located only 79 miles apart from each other, San Antonio and Austin experienced a combined net absorption of 5.5 million square feet through November, falling 29.5 percent from the level set in 2023. While net absorption was higher than in the 12 years previous to the pandemic, demand was well short of the 30 million-square-foot record posted in 2022 that spawned historic increases in supply. At 12.2 million square feet, year-to-date net deliveries (down 45.0 percent on the year) drove the vacancy rate up to 10.2 percent, marking the highest level since CoStar began full market coverage between San Antonio and Austin in 2005. High vacancies resulted in a fast deceleration in rent growth, slowing 570 basis points to 0.8 percent. Unlike most markets in the U.S. (including Texas), developers in San Antonio and Austin have ignored the drop-off in demand with the pipeline sitting near record highs at 23.9 million square feet at the end of 2024, 95.0 percent of which was concentrated in midsize and big-box warehouses. The excessive overbuilding portends much higher vacancy rates in 2025 and underscores the importance of investing in small industrial properties in San Antonio and Austin.
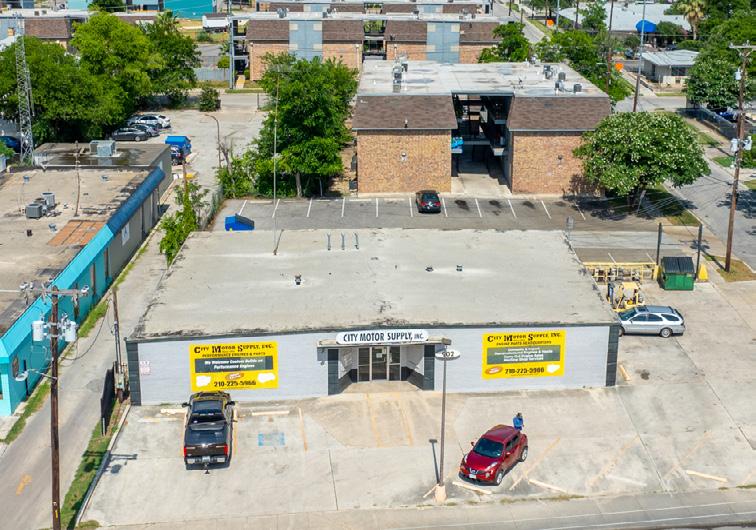
CASE STUDY & OPPORTUNITIES
In October 2024, TAG Industrial sold a vacant 4,992-square-foot single-tenant flex warehouse in the heart of San Antonio. By securing a local pawn shop seeking a business expansion, TAG was able to sell the property above the asking price at all cash. The property is primely situated in North Central, a midsized submarket containing 17.2 million square feet of industrial space. Given its proximity to downtown San Antonio, North Central’s industrial inventory witnessed little growth over the last decade until the delivery of the 689,000-square-foot Interpark Logistics Center in Q1 2024. The largest development in North Central increased the vacancy rate by 410 basis points to 7.5 percent in Q1. However, among comparable properties less than 10,000 square feet, the vacancy rate remained low at only 3.7 percent at the time of listing.
MIDLAND/ODESSA
Due to stagnant oil and gas prices and consolidation among exploration and production companies, Midland and Odessa were some of the few markets in Texas to experience negative net absorption in 2024. For the third time since records began in 2007, demand contracted as -183,000 square feet were vacated by the end of November between the two markets. While supply levels remained low at about 242,000 square feet, this was only 13.9 percent lower than the previous year when demand was twice the level of supply. Not surprisingly, vacancy rates jumped 160 basis points to 7.9 percent with one month to go in the year. As one of the most volatile industrial markets in the nation, developers were quick to respond to the contraction in demand in 2024 as indicative of the 145,000 square feet under construction in Q4, representing just 0.6 percent of inventory levels. Despite the current state of industrial demand in Midland and Odessa, the outlook remains very promising. As detailed in the January 2024 publication of the Industrial Watch magazine, the nation’s deficit problems and the growing BRICS coalition are tremendously positive for oil prices in the future. Additionally, President Trump has promised that America, “will drill, baby, drill” under his new administration, which is a positive sign for Midland and Odessa (Davidson, 2024).
CASE STUDY & OPPORTUNITIES
In April 2024, TAG Industrial represented a repeat buyer in acquiring a vacant 4,930-square-foot single-tenant warehouse in Odessa with seller financing at a subprime interest rate. Equipped with a rare dock-high door along with two grade-level doors, the 1031-Exchange buyer was able to quickly lease up the property to Guidant Measurement, a leading provider of automated solutions that measure the flow, release, and detection of leaks of oil and gas products through transportation methods such as pipelines. In doing so, TAG was able to represent the client again as a seller in listing the asset by year’s end. By taking advantage of the market’s volatility and consolidation that left many properties vacant, TAG’s client seeks to perform a successful property flip in a market with solid long-term fundamentals.
LAREDO
As the primary beneficiary of the nearshoring movement, Laredo topped many headlines in the industrial real estate world throughout 2024. To avoid tariffs, firms imported a record amount of Chinese goods into Mexico for slight modifications to re-export to the U.S. With Mexico becoming the top importer to the U.S. in the process, investment demand has poured into port cities along the border, creating new opportunities for local landlords. Despite a historic amount of Mexican imports funneling primarily through the nation’s largest port, industrial demand in Laredo stalled out, sliding -75.0 percent to 736,000 square feet by November. Meanwhile, supply hit the second-highest level on record at 2.4 million square feet, although pulling back 31.4 percent on the year. As a result, the vacancy rate rose by 360 basis points to 5.8 percent, reaching a record high. Strong sentiment along the border in 2024 failed to prevent rent growth from decelerating by 470 basis points to 1.7 percent, dipping to the lowest level since 2011. Nonetheless, speculative developers expanded the pipeline by 59.5 percent to an all-time high of 5.9 million square feet, 76.3 percent of which was concentrated in big-box warehouses.
CASE STUDY & OPPORTUNITIES
In May 2024, TAG Industrial closed on a three-building 73,469-square-foot warehouse on 17.5 acres along the Texas-Mexican border in Harlingen. The property is leased by Central Air & Heating Services (CAHS), a leading provider of HVAC, mechanical, and plumbing services in southern Texas. Producing a 9.0 percent return (well above the going mortgage rate), the asset was an attractive trade, generating multiple offers from in-state and out-of-state investors. By procuring a small private equity firm seeking positive leverage and to capitalize on the nearshoring movement, TAG was able to assist the former owner-user of the property in liquidating the asset to facilitate a reverse 1031 Exchange, finance retirement, and fund a new business venture. Following Laredo and El Paso, the Brownsville-Harlingen metroplex is a key inland port into Texas.

MIDWEST & WEST MARKETS
MIDWEST & WEST VACANCIES
Source: CoStar
MIDWEST & WEST RENT GROWTH
Source: CoStar
CHICAGO
The nation’s largest industrial real estate market with 1.4 billion square feet continued to outperform the national market in 2024. However, demand for industrial space in the Windy City noticeably declined by 71.9 percent by November to just 5.6 million square feet. Unless December tops expectations, demand will finish the year at the lowest level since the depths of the Great Recession in 2009. After posting a record high in 2023, supply quickly responded to demand, falling by 63.1 percent to 13.9 million square feet. With supply outpacing demand by a factor of 2.5 square feet, the vacancy rate in Chicago ticked up to 5.6 percent but only by 60 basis points. Unfortunately, rent growth still decelerated by 380 basis points to 3.2 percent, setting a new 10-year low. With 20.2 million square feet under construction at the end of 2024, supply will weigh on demand again in 2025, suggesting more pressure on vacancies and rents.
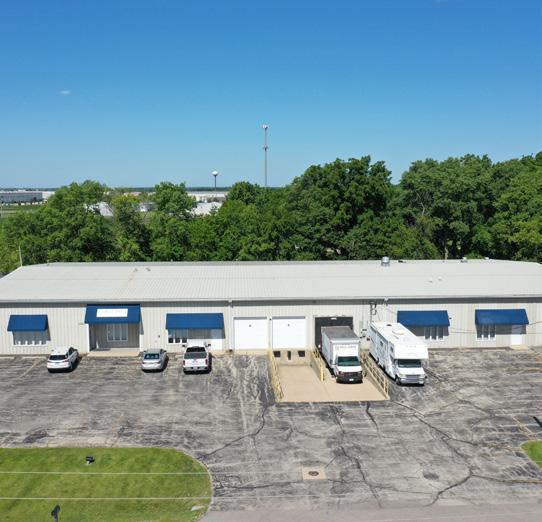
CASE STUDY & OPPORTUNITIES
During October 2024, TAG Industrial sold a vacant 17,000-square-foot single-tenant warehouse featuring two dock-high doors and two grade-level doors just East of Rockford in Belvidere. By procuring a crematory that was renting another space at the time, TAG was able to liquidate the seller’s asset at full asking price to dissolve a business partnership and finance retirement. Although the purchase was for owner use, the property also represents an ideal investment opportunity given current market trends. In an area known for its low availability, Boone County which houses the subject property is a unique high-growth but tight barrier-to-entry submarket. The 1.3-million-square-foot General Mills Distribution facility delivered in 2023 was the largest development in Boone County in more than 50 years. Additionally, Walmart plans to become the submarket’s third-largest property with the construction of its 1.2-million-square-foot cold storage warehouse. Yet, when the property was listed in Q2 2024, the vacancy rate stood at 2.8 percent, representing half the 5.5 percent Chicago market average at that time.
KANSAS CITY/SAINT LOUIS
During the height of the industrial boom in 2021 and 2022, America’s Heartland was largely left out of the party yet has arguably held up the best since the national market began its decline at the start of 2023. Bucking the national trend, Kansas City and Saint Louis saw net absorption expand by 7.0 percent to 6.1 million square feet with one month to go in the year. Supply levels leveled off in 2024, receding by 47.1 percent to 7.2 million square feet. Given that net deliveries marginally exceeded demand, the vacancy rate was relatively stable at 4.9 percent. Unfortunately, annual rent growth followed the national trend in slowing by 180 basis points but at 4.0 percent in Q4, rents were still rising at a faster pace in Kansas City and Saint Louis than at any point in time before the pandemic. With 16.6 million square feet under construction, representing only 2.5 percent of inventory, supply pressures on vacancies and rents should remain relatively tamed even if demand plateaus.
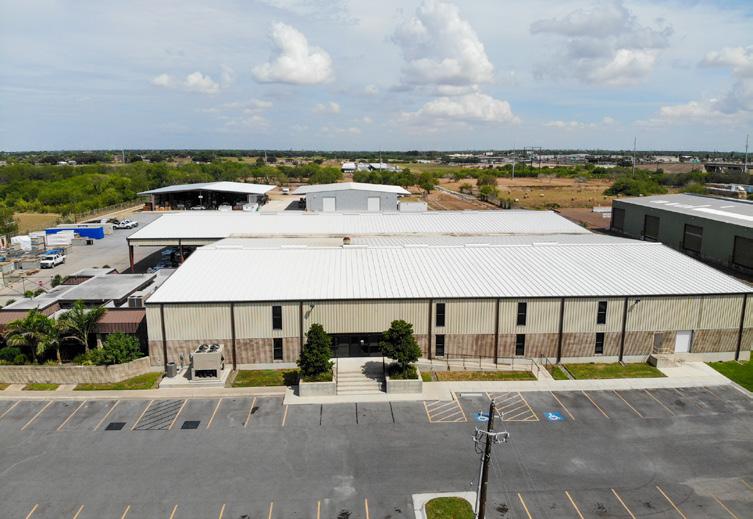
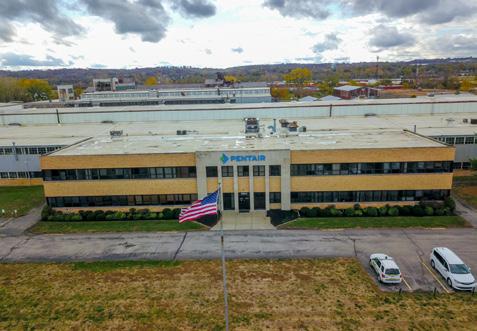
CASE STUDY & OPPORTUNITIES
During the fourth quarter, TAG Industrial began listing a five-building 364,510-square-foot manufacturing and warehouse facility in Kansas City, Kansas, leased by Pentair. Although big-box properties are underperforming, this asset is not your typical collection of “four walls and a ceiling.” The property is used by the publicly-traded Pentair company to test, repair, refurbish, and manufacture pumps for a multitude of applications, including water filtration systems that are sold around the world. With costly tenant improvements, specialized manufacturing space, several heavy overhead cranes, and ample industrial outdoor storage space, the Pentair property provides an institutional hedge against rising vacancy rates and declining rent growth.
DENVER
The Mile High City was one of the few major industrial markets in the U.S. to not only see a rise in demand but also a decline in vacancies in 2024. Net absorption rose by 5.9 percent to 3.6 million square feet through the first 11 months of the year. Thanks to supply receding by 61.6 percent to fall short of demand at 3.3 million square feet, the vacancy rate in Denver dipped 60 basis points below its 20-year high to 7.9 percent. Still, rent growth continued to be squeezed by the weight of high vacancies, decelerating 420 basis points to 1.2 percent and marking the lowest level since 2010. At the close of 2024, Denver’s pipeline declined to 4.6 million square feet, permitting vacancies to trend lower in the new year if demand holds steady.
CASE STUDY & OPPORTUNITIES
During the fourth quarter of 2024, TAG Industrial began listing a 42,392-square-foot single-tenant cultivation asset in Denver. In recent years, the Denver market has been heavily impacted by the sudden decline in the cannabis industry after years of unprecedented demand was met by excess supply from an influx of new growers. While sentiment is negative, investors have an opportunity to acquire viable assets with above-market returns such as the subject property that generates a 10.1 percent cap rate. Leased through September 2033 to Bonsai Cultivation, which has been in business since 2015, the state-of-the-art manufacturing facility features $1.35 million in tenant improvements, including an automated pre-roll machine and the capacity to process up to 250 pounds of flowers each week. The costly tenant improvements boost the probability that the tenant will not only serve out its full lease term but increase the likelihood of renewal.
LOS ANGELES
In the midst of the industrial boom that brought an unprecedented amount of imports into the nation, Los Angeles was one of the topperforming markets. In 2021, availability was nearly non-existent with the vacancy rate below 2 percent, allowing landlords to push rent growth above 11 percent. Since then, the City of Angeles has dealt with a historic decline in demand due to a variety of factors including higher interest rates, nearshoring that redirected Chinese imports into Mexico, and an overall decline in California’s economy highlighted by a flight of businesses and a reduction in population. At -13.0 million square feet through November, net absorption was on pace to decline for a third straight year, posting the largest contraction on record. The decline in demand has done little to discourage developers who added another 5.2 million square feet to the inventory, helping to push vacancy rates up an all-time high of 6.3 percent. The sudden loss of tenants has changed a landlord’s market into a tenant’s market with rent growth contracting by a record -5.0 percent. In Q4, the pipeline stood at 5.5 million square feet, emphasizing the importance of investing in small industrial properties in a market with negative rent growth and rapidly rising vacancies.
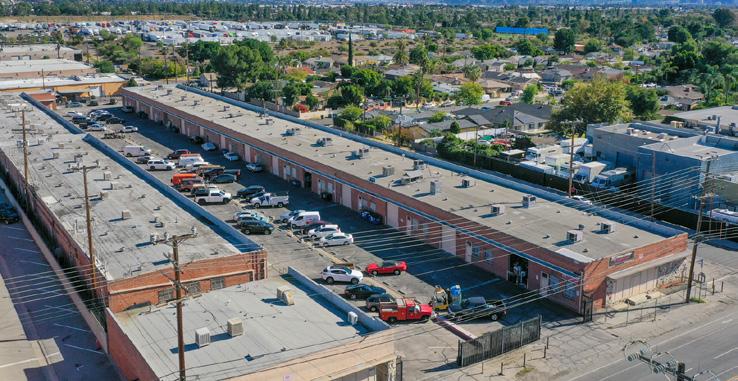
CASE STUDY & OPPORTUNITIES
In May of 2024, TAG Industrial sold a three-building 65,102-square-foot multi-tenant warehouse featuring 41 shallow-bay suites. The 95 percent occupied asset, anchored by below-market short-term leases, generated 11 total offers and was acquired by an institutional buyer with all cash at a sub 4.0 percent cap rate. At the time of the sale, vacancy rates among comparable properties under 75,000 square feet in Los Angeles were at 4.4 percent, sitting 270 basis points lower than the availability of big-box warehouses. Los Angeles may be leading the way for the industrial market’s decline but also has the opportunity to showcase the growing institutional demand for smaller industrial properties.
CITATIONS

Federal Reserve Economic Data. Money Market Funds; Security Repurchase Agreements (Federal Reserve Reverse Repurchase Agreement Operations); Asset, Level, Retrieved November 2024, from https://fred.stlouisfed.org/series/BOGZ1FL632051103Q#0.
U.S. Department of Treasury. Monthly Treasury Statement, Retrieved December 2024, from https://fiscaldata.treasury.gov/datasets/ monthly-treasury-statement/receipts-of-the-u-s-government.
Federal Reserve Economic Data. Employment Level, Retrieved December 2024, from https://fred.stlouisfed.org/series/LNU02000000.
Federal Reserve Economic Data. Employed, Usually Work Full Time, Retrieved December 2024, from https://fred.stlouisfed.org/ series/LNS12500000.
White, Carl. (2023, July, 6). Commercial Real Estate Market Stress Poses a Challenge to Banks, Retrieved December 2024, from https://www.stlouisfed.org/on-the-economy/2023/jul/commercial-real-estate-stress-poses-challenge-banks#:~:text=Effect%20 on%20Banks,of%20landlords%20when%20amortization%20begins.
Peters, Andy. (2024, May, 7). Federal Reserve’s Delay in Cutting Rates Seen Posing Risks for Commercial Property Lenders, Retrieved November 2024, from https://www.costar.com/article/181523383/federal-reserves-delay-in-cutting-rates-seenposing-risks-for-commercial-property-lenders.
Taylor, Falen. (2024, February, 12). 20 Percent of Commercial and Multifamily Mortgage Balances Mature in 2024, Retrieved December 2024, from https://www.mba.org/news-and-research/newsroom/news/2024/02/12/20-percent-of-commercialand-multifamily-mortgage-balances-mature-in-2024#:~:text=SAN%20DIEGO%20(February%2012%2C%202024,2023%20Commercial%20Real%20Estate%20Survey.
Davidson, Paul. (2024, December, 15). Why Trump’s plan to ‘drill, baby, drill’ is unlikely to cut gas prices and fix inflation, Retrieved December 2024, from https://www.usatoday.com/story/money/2024/12/15/trump-drilling-gas-prices/76931654007/.
11


Despite the optimism for the new year, all of the key metrics in industrial real estate, including vacancy rates and rent growth show that the market is headed for the lowest levels since the Great Recession. Compounding this problem is the threat of rising interest rates throughout the economy that have defied the Federal Reserve’s efforts. But the bigger the challenges, the bigger the opportunities. Industrial owner users and investors have a great opportunity to reposition themselves for long-term success if they take advantage of the current lending environment.