Worked example 2.17 A brick of weight 50 N rests on a horizontal surface. The coefficient of static friction between the brick and the surface is 0.60 and the coefficient of dynamic friction is 0.20. A horizontal force F is applied to the brick, its magnitude increasing uniformly from zero. Once the brick starts moving the pulling force no longer increases. Estimate the net force on the moving brick. The maximum frictional force that can develop between the brick and the surface is: fs = sR which evaluates to: 0.60 Ă— 50 = 30 N So motion takes place when the pulling force is just barely larger than 30 N. Once motion starts the frictional force will be equal to
dR, i.e.
0.20 Ă— 50 = 10 N The net force on the brick in that case will be just larger than 30 − 10 = 20 N.
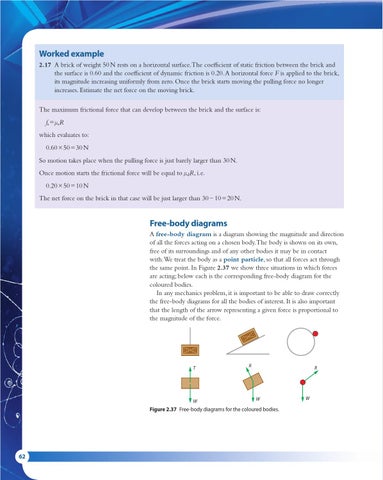
Free-body diagrams A free-body diagram is a diagram showing the magnitude and direction of all the forces acting on a chosen body. The body is shown on its own, free of its surroundings and of any other bodies it may be in contact with. We treat the body as a point particle, so that all forces act through the same point. In Figure 2.37 we show three situations in which forces are acting; below each is the corresponding free-body diagram for the coloured bodies. In any mechanics problem, it is important to be able to draw correctly the free-body diagrams for all the bodies of interest. It is also important that the length of the arrow representing a given force is proportional to the magnitude of the force.
T
W
R
R
W
Figure 2.37 Free-body diagrams for the coloured bodies.
62
W