© Cambridge University Press 2014
3 Draw a line graph. Choose between: ● ●
● ●
a line graph converting Japanese Yen to Euros,
Remember to choose the scale of the graph carefully. Work out the lowest and greatest values first.
a line graph converting Japanese Yen to US Dollars, or a line graph converting Euros to US Dollars two currencies of your choice (you will need to look this up on the Internet!)
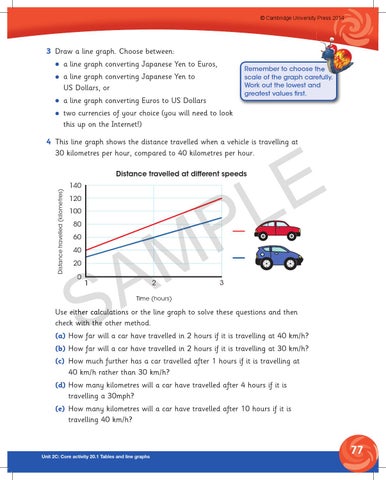
4 This line graph shows the distance travelled when a vehicle is travelling at 30 kilometres per hour, compared to 40 kilometres per hour.
E L
Distance travelled (kilometres)
Distance travelled at different speeds 140
P M
120 100 80 60
A S
40 20 0
2
1
3
Time (hours)
Use either calculations or the line graph to solve these questions and then check with the other method. (a) How far will a car have travelled in 2 hours if it is travelling at 40 km/h? (b) How far will a car have travelled in 2 hours if it is travelling at 30 km/h? (c) How much further has a car travelled after 1 hours if it is travelling at 40 km/h rather than 30 km/h? (d) How many kilometres will a car have travelled after 4 hours if it is travelling a 30mph? (e) How many kilometres will a car have travelled after 10 hours if it is travelling 40 km/h?
Unit 2C: Core activity 20.1 Tables and line graphs
77