S
Worked example 2.7 A train travels slowly as it climbs up a long hill. Then it speeds up as it travels down the other side. The table below shows how its speed changes. Draw a speed–time graph to show this data. Use the graph to calculate the train’s acceleration during the second half of its journey. Time / s
Speed / m/s
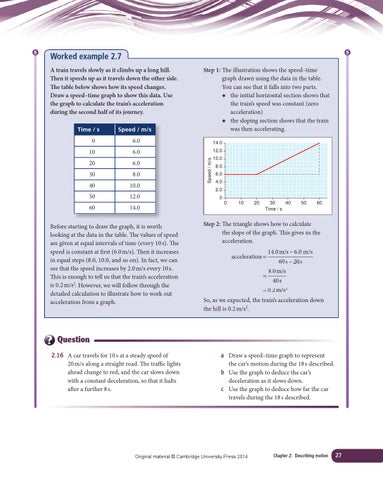
Step 1: The illustration shows the speed–time graph drawn using the data in the table. You can see that it falls into two parts. ◆ the initial horizontal section shows that the train’s speed was constant (zero acceleration) ◆ the sloping section shows that the train was then accelerating.
0
6.0
14.0
10
6.0
12.0
20
6.0
30
8.0
40
10.0
50
12.0
60
14.0
Before starting to draw the graph, it is worth looking at the data in the table. The values of speed are given at equal intervals of time (every 10 s). The speed is constant at first (6.0 m/s). Then it increases in equal steps (8.0, 10.0, and so on). In fact, we can see that the speed increases by 2.0 m/s every 10 s. This is enough to tell us that the train’s acceleration is 0.2 m/s2. However, we will follow through the detailed calculation to illustrate how to work out acceleration from a graph.
Speed / m/s
S
10.0 8.0 6.0 4.0 2.0 0 0
10
20
30 40 Time / s
50
60
Step 2: The triangle shows how to calculate the slope of the graph. This gives us the acceleration. acceleration = =
14.0 m/s − 6.0 m/s 60 s 20 s 8 0 m/s
40 s = 0 2 m/s2 So, as we expected, the train’s acceleration down the hill is 0.2 m/s2.
Question 2.16 A car travels for 10 s at a steady speed of 20 m/s along a straight road. The traffic lights ahead change to red, and the car slows down with a constant deceleration, so that it halts after a further 8 s.
a Draw a speed–time graph to represent the car’s motion during the 18 s described. b Use the graph to deduce the car’s deceleration as it slows down. c Use the graph to deduce how far the car travels during the 18 s described.
Original material © Cambridge University Press 2014
Chapter 2: Describing motion
27