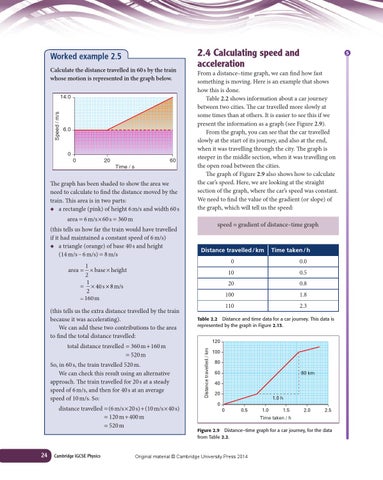
Worked example 2.5 Calculate the distance travelled in 60 s by the train whose motion is represented in the graph below.
Speed / m/s
14.0
6.0
0 0
20
60 Time / s
The graph has been shaded to show the area we need to calculate to find the distance moved by the train. This area is in two parts: ◆ a rectangle (pink) of height 6 m/s and width 60 s
2.4 Calculating speed and acceleration From a distance–time graph, we can find how fast something is moving. Here is an example that shows how this is done. Table 2.2 shows information about a car journey between two cities. The car travelled more slowly at some times than at others. It is easier to see this if we present the information as a graph (see Figure 2.9). From the graph, you can see that the car travelled slowly at the start of its journey, and also at the end, when it was travelling through the city. The graph is steeper in the middle section, when it was travelling on the open road between the cities. The graph of Figure 2.9 also shows how to calculate the car’s speed. Here, we are looking at the straight section of the graph, where the car’s speed was constant. We need to find the value of the gradient (or slope) of the graph, which will tell us the speed:
area = 6 m/s × 60 s = 360 m (this tells us how far the train would have travelled if it had maintained a constant speed of 6 m/s) ◆ a triangle (orange) of base 40 s and height (14 m/s − 6 m/s) = 8 m/s
speed = gradient of distance–time graph
Distance travelled / km
1 area = × base × height 2 1 = × 40 s × 8 m/s 2 = 160 m
total distance travelled = 360 m + 160 m = 520 m So, in 60 s, the train travelled 520 m. We can check this result using an alternative approach. The train travelled for 20 s at a steady speed of 6 m/s, and then for 40 s at an average speed of 10 m/s. So: distance travelled = (6 m/s × 20 s) + (10 m/s × 40 s) = 120 m + 400 m = 520 m
24
Cambridge IGCSE Physics
Time taken / h
0
0.0
10
0.5
20
0.8
100
1.8
110
2.3
Table 2.2 Distance and time data for a car journey. This data is represented by the graph in Figure 2.13. 120 Distance travelled / km
(this tells us the extra distance travelled by the train because it was accelerating). We can add these two contributions to the area to find the total distance travelled:
S
100 80 60
80 km
40 20
1.0 h
0 0
0.5
1.0
1.5
2.0
2.5
Time taken / h Figure 2.9 Distance–time graph for a car journey, for the data from Table 2.2.
Original material © Cambridge University Press 2014