Poverty and health
17
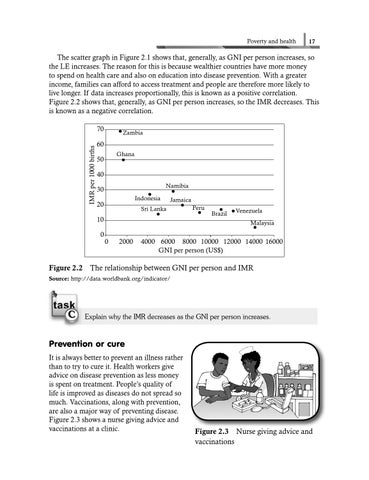
The scatter graph in Figure 2.1 shows that, generally, as GNI per person increases, so the LE increases. The reason for this is because wealthier countries have more money to spend on health care and also on education into disease prevention. With a greater income, families can afford to access treatment and people are therefore more likely to live longer. If data increases proportionally, this is known as a positive correlation. Figure 2.2 shows that, generally, as GNI per person increases, so the IMR decreases. This is known as a negative correlation.
IMR per 1000 births
70
Zambia
60 Ghana
50 40
Namibia
30 Indonesia
20
Jamaica
Sri Lanka
10
Peru Brazil
Venezuela Malaysia
0 0
2000
4000 6000 8000 10000 12000 14000 16000 GNI per person (US$)
Figure 2.2 The relationship between GNI per person and IMR Source: http://data.worldbank.org/indicator/
C
Explain why the IMR decreases as the GNI per person increases.
Prevention or cure It is always better to prevent an illness rather than to try to cure it. Health workers give advice on disease prevention as less money is spent on treatment. People’s quality of life is improved as diseases do not spread so much. Vaccinations, along with prevention, are also a major way of preventing disease. Figure 2.3 shows a nurse giving advice and vaccinations at a clinic.
Figure 2.3 Nurse giving advice and vaccinations