The table below gives data for a third sample, C, of ammonium hydroxide that was investigated. Distance of red litmus paper along tube / cm
Time for red litmus paper to go blue / s
2 4 6 8 10 12 14 16
6 10 15 21 25 29 35 41
i Plot the data in the table on a copy of the graph. ii Suggest what has caused the litmus paper to go blue. iii State which sample of ammonium hydroxide took longest to travel 10 cm along the tube. iv What can you suggest about the concentration of sample C? Explain your answer. [Cambridge IGCSE• Biology 0610/2, Question 8, October/November 2004]
[3] [1] [1] [2]
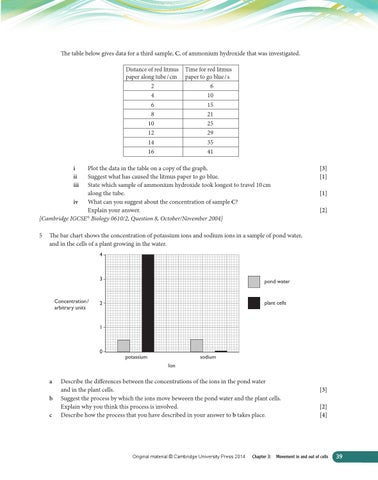
5 The bar chart shows the concentration of potassium ions and sodium ions in a sample of pond water, and in the cells of a plant growing in the water. 4
Concentration / arbitrary units
3
pond water
2
plant cells
1
0
potassium
sodium Ion
a b c
Describe the differences between the concentrations of the ions in the pond water and in the plant cells. Suggest the process by which the ions move beweeen the pond water and the plant cells. Explain why you think this process is involved. Describe how the process that you have described in your answer to b takes place.
Original material © Cambridge University Press 2014
[3] [2] [4]
Chapter 3: Movement in and out of cells
39